Article

A Quantitative Analysis Method of Regional Rainfall-Induced Landslide Deformation Response Variation Based on a Time-Domain Correlation Model

1
Faculty of Geomatics, Lanzhou Jiaotong University, Lanzhou 730070, China
2
National-Local Joint Engineering Research Center of Technologies and Applications for National Geographic State Monitoring, Lanzhou 730070, China
3
Gansu Provincial Engineering Laboratory for National Geographic State Monitoring, Lanzhou 730070, China
4
Faculty of Geosciences and Environmental Engineering, Southwest Jiaotong University, Chengdu 611756, China
5
Key Laboratory for Environmental Computation and Sustainability of Liaoning Province, Institute of Applied Ecology, Chinese Academy of Sciences, Shenyang 110016, China
6
Weifang Institute of Modern Agriculture and Ecological Environment, Weifang 261041, China
7
Geotechnical Engineering & Surveying Research Institute Co., Ltd., Hangzhou 310012, China
*
Author to whom correspondence should be addressed.
Submission received: 24 March 2022 / Revised: 30 April 2022 / Accepted: 4 May 2022 / Published: 7 May 2022
(This article belongs to the Topic Climate Change and Environmental Sustainability)

Abstract

:
Landslide deformation is the most intuitive and effective characterization of the evolution of landslides and reveals the inherent risk of landslides. Considering the inadequacy of existing deformation monitoring data for early warnings regarding landslide hazards, resulting in insufficient disaster response times, this paper proposes a time-domain correlation model. Based on the process of rainfall-induced landslide deformation, the time-domain correlation between regional rainfall and landslide deformation is proposed, which can reflect the temporal characteristics of landslide responses to rainfall, and the calculation method of the impulse response function is designed to quantitatively model and calculate the correlation. Furthermore, rainfall monitoring data are used to optimize the landslide deformation monitoring indicator system for early warnings regarding landslide instability. The feasibility of the method proposed in this paper is verified by analyzing the historical monitoring data of rainfall and landslide deformation at nine typical locations in five landslide hazard areas in Fengjie County, Chongqing city. (1) The correlation models for the XP landslide involve a delayed rainfall response time of 5 for deformation, respectively, as well as the existence of a cycle of 55–56 days, which means that the above area can advance the landslide warning by one lag time based on the cycle; (2) The correlation models for the OT landslide show consistent correlations under a 48–50-day cycle, which means that the deformation in the above areas can be predicted based on rainfall accumulation. (3) The HJWC landslide presents a turbulence correlation, which means that other monitoring data need to be supplemented and analyzed.

1. Introduction

In recent years, with climate change, global weather extremes have become frequent, which in turn affects the human living environment. For example, rising global temperatures have accelerated, leading to regional changes in rainfall processes and frequency effects. Therefore, the extent to which changes in rainfall processes and frequency affect natural hazards such as landslides has been increasingly studied [1,2,3].
Rainfall-induced landslides, which are characterized by large masses, instantaneous sliding, and as violent, are one of the main types of geological disasters in the world [4,5,6]. For instance, Wasowski [7] indicates that the expansion of Caramanico Terme in this century has led to the urbanization of marginally stable valley slopes, and recent landslides were caused by heavy precipitation (antecedent moisture was a more critical factor than the amount of storm rainfall). Later, Kristo [8] predicted the effects of rainfall process changes on landslides in Singapore and found that climate change would result in increased rainfall intensity and duration. Recently, Lukić [9] studied the erosivity classes of rainfall-triggered landslides, especially for 2010 and 2011 on the northern outskirts of Belgrade. In this area, surface water runoff was directed into the porous loess, thereby endangering slope stability. He [10] defines four groups of rainfall thresholds at different quantile levels based on 771 landslide events that occurred in China during 1998–2017. It was found that extreme rainfall events caused by climate change would increase the probability of landslides in China. Statistically, most of the main landslides that have occurred in southwest China over the past 40 years were caused by rainfall [11]. Hence, landslide deformation monitoring data provide important information for early warnings regarding various landslide risks and for uncovering the key moments of landslide events for their prevention and control [12,13,14]. However, because landslides characteristically accumulate deformation slowly and occur instantaneously, it is difficult to achieve a forward-looking landslide risk warning system through only deformation monitoring data; accordingly, the development of additional early warning methods is urgent.
The existing landslide early warning analysis models mainly include dynamic analysis models and logistic regression models. Dynamic analysis models are calculation schemes based on the physical mechanisms of events [15,16]; hence, these models are limited to data from the test site or to the research and exploration of a single landslide area and thus cannot meet the requirements for investigating landslide groups in different geological environments [17,18]. In contrast, logistic regression models employ mathematical statistics to perform logistic regression and determine the critical value of landslide rainfall and the probability of landslide occurrence [19,20]; however, it is almost suitable for quantitative studies of small-scale landslides and cannot be used for landslide areas in different geological environments while the data accuracy requirements are too high and the calculations are too complicated to meet the warning requirements. In view of these studies, the combined use of landslide geotechnical and morphological parameters to evaluate the stability of landslides during rainfall events can help recognize the statue of landslides, but the corresponding workload is often large, leading to delays in warnings. As an alternative method, real-time monitoring data on regional rainfall and landslide deformation has great advantages: highly detailed monitoring data can clearly reflect the minor deformation of landslides; easily accessible and predictable rainfall data can help to predict landslide deformation in advance [21,22,23]. Therefore, it is feasible to predict the risk of landslides by using widely available rainfall monitoring data.
In response to the above problems, this paper proposes a time-domain method for the quantitative analysis of the regional rainfall-induced landslide deformation response. First, using easily accessible rainfall and landslide deformation monitoring data, this paper proposes the concept of correlation measures between the two in the time domain for the time characteristics of landslide deformation during the rainfall process [24]; on this basis, the correlation is computed by using the impulse response functions of different characteristics in the signal processing algorithm; finally, the landslide deformation response to rainfall is quantitatively analyzed. The time-domain correlation model includes a consistency mode, a hysteresis mode, and a disorder mode. The proposed model can be applied to historical monitoring data from different areas characterized by landslide hazards; then, the modes can be quantitatively analyzed and summarized by the time-domain correlation of a hidden landslide hazard point as a reference to predict the future deformation of the landslide affected by rainfall. This method provides a scientific basis for pre-warning systems by effectively extending the time allowed in the early warning of landslides.

2. Study Area and Landslide Data

2.1. Study Area

The experimental area adopted in this paper is within Fengjie County in eastern Chongqing (between 109°1′17″ and 109°45′58″ east longitudes and 30°29′19″ and 31°22′23″ north latitude). Fengjie County, located on the eastern edge of the Sichuan Basin (Figure 1), represents the central hinterland of the Three Gorges Reservoir. The study area is in the city of Chongqing and the Yangtze River Three Gorges Project, and the rainfall and environment are closely related [25,26].
The environmental characteristics of the study area (Figure 2) can be summarized as follows: ① The river flowing through Fengjie County is the Yangtze River, and the county has abundant rainfall with a heavy rainstorm intensity and is characterized by large accumulations of rainfall in a short time and a high erosion intensity. In addition, the distributions of landslides and cumulative rainfall (or strong triggering rainfall) is consistent. ② The geological environment in the study area is relatively fragile. The terrain provides good conditions for surface water infiltration, surface water migration, and the occurrence of landslides. ③ The regional landforms are mainly moderately eroded mountain and middle-low mountain landforms and eroded hilly landforms with high hills, large undulations, and steep slopes; developed landslides are also prominent. The sensitive slope is 20~30°, and the landslides tend to occur at elevations of 400~1000 m.

2.2. Data Used for Modeling

This paper selects five rainfall-induced landslides, including the OT landslide, XP landslide, and HJWC landslide, and a total of 15 representative monitoring points for experiments. Table 1 lists the various monitoring points, which will verify that the method proposed in this paper is suitable with adaptable applicability for different landslide scenarios under diverse conditions [27,28,29,30,31].
The landslide deformation data and regional rainfall data were obtained from 2017 to 2020 at the Fengjie monitoring network, provided by the Chongqing Planning and Natural Resources Bureau. The landslide deformation is monitored by GNSS (monitoring instruments are installed at the monitoring points described in Table 1) instruments on an hourly time scale, and consists of vertical and horizontal deformation. The time interval is an hour, the rainfall is recorded in an hourly increment by a tipping bucket, and the data are unified in time sequences with a unit of days during data preprocessing.

3. Time-Domain Correlation Modeling of Regional Rainfall-Induced Landslide Deformation Monitoring Data

The properties of the soil and rock comprising the landslide body in different regional environments will greatly affect the movement mechanism of rainfall-induced landslides and the surface deformation of the landslide body. Hence, it is difficult to obtain an accurate relationship between regional rainfall and landslide deformation in time through conventional statistical analysis. Accordingly, this article proposes the concept of a time-domain correlation measurement to describe the response characteristics of deformation in conjunction with a full understanding of the underlying geological mechanism, and a time-domain correlation model suitable for evaluating various response models is constructed. The principle of this approach is to use landslide deformation monitoring data as the time sequence signal in the usual sense [32], to apply a signal waveform extraction method to identify and quantify the change in the response process, and to introduce an impulse response function to calculate the time-domain correlation measurement and divide the response correlation model [33]. This method can provide a universal prior model of landslide deformation for a given rainfall-induced landslide area.

3.1. The Concept of Time-Domain Correlation Measurement

Rainfall-induced landslides represent sliding deformation phenomena caused by the infiltration of rainfall and exhibit different deformation mechanisms [34]; among them, periodic changes in the surface morphology caused by long-term rainfall-induced surface runoff is particularly important. Rainfall first enters the dry soil, increasing the weight of the sliding body, and when the soil becomes saturated, it affects the stability of the slope; as a result, landslide deformation is lagged [35,36]. In summary, rainfall and deformation appear to be consistent or hysteresis in time.
To quantify the time-correlation characteristics between regional rainfall and landslide deformation, the time-domain correlation measurements are proposed for the above phenomenon, including the correlation period and deformation time shift. The monitoring data characteristics are estimated to obtain the quantitative description of the above correlation measurements: the rainfall threshold R t , the mutation point in deformation process D m . The conceptual model is illustrated in Figure 3.

3.1.1. Time-Domain correlation measurement

1. Correlation period ( T ). Because the occurrence of a landslide requires a certain preliminary accumulation of rainfall and stimulation by a given rain intensity, under a periodic cycle of rainfall, the landslide mass is repeatedly subjected to a “push–pull” effect [37]; as a result, the time-domain curve of the landslide deformation time series exhibits a step-like characteristic.
Thus, the time curve of rainfall and landslide cumulative deformation will have a regular correlation cycle, which represents the consistent correlation between the rainfall in the landslide area and the corresponding cumulative deformation. With the correlation period T , the conditions under which a landslide occurs can be quantitatively expressed as the Formula (1), based on the time series of monitoring data in landslides:
T = T s i n ( T R t i + 1 T R t i ) n
where T S is the sampling time, T R t is the time when the regional rainfall reaches the threshold value R t .
2. Deformation time shift ( t d ). Because landslides occur in areas with heterogeneous geological conditions, the deformation lags behind the precipitation due to the infiltration of rainfall [38]. According to research on the complicated mechanism responsible for level water flow within a landslide body, the nature of this delay behind the rainfall is essentially determined by the time when the water enters the sliding body.
The time shift t d in Figure 3 is used as a time-domain measure to quantitatively summarize the response (when T is considered) of landslide deformation to rainfall events and is quantitatively expressed as the Formula (2):
t d = T s T i n ( t D m i T R t i ) n
Combining t D m . under the threshold time T R t , it is possible to obtain the time shift t d , and the future deformation of the landslide can be estimated based on t d with the real-time rainfall.

3.1.2. Parameter Estimation of Correlation Measures

The abovementioned critical value R t of rainfall-induced deformation is extracted by quantitatively partitioning the regional rainfall history curve to extract the time-domain characteristics of the triggering event at different stages. Formula (3) represents the rainfall interval curve partitioned by determining the average rainfall R ¯ of each rainfall event. Then, considering the objective environmental factors such as the regional rock composition, surface shape, and soil quality, the effective rainfall coefficient k [39] is established to calculate R t as the key parameter of the correlation period T , as shown in Figure 3.
R t = k R ¯
Considering the mutation point D m of landslide deformation, a large number of landslide examples confirm that landslides, especially gravity-driven landslides, can basically meet the three-stage deformation law proposed by Saito [40], namely, initial deformation, followed by constant-velocity deformation, and ultimately accelerated deformation. On this basis, the variation in the curve through the deformation analysis is shown in Figure 3. The long time sequence of the landslide deformation response process can be discerned on the basis of whether the signal curve is initially steady before experiencing a sudden increase, reaches its peak, and then becomes stable again. Combined with this principle of signal mutation, the abnormal deformation response point D m is calculated as the key parameter of the signal time shift t d , and the corresponding formula is expressed as Formula (4).
D m = M a x { D m n D m n 1 D m n + 1 D m n }
By describing the parameters of time-domain correlation measures between deformation and rainfall of rainfall-induced landslides, it can provide quantitative references for studying the correlation characteristics of deformation responses.

3.2. The Measures Calculation Based on Impulse Response Functions

To obtain a credible time-domain correlation measure, it is necessary to extract the signal waveform characteristics of the landslide deformation response process, further calculate the constituent parameters of the correlation measure to obtain the value interval, and introduce the impulse response function during the signal processing phase to calculate the specific measured value, as depicted in Figure 4.

3.2.1. Parameter Estimation of Correlation Measures

However, it is quite difficult to calculate the abovementioned rainfall critical value and landslide mutation point by partitioning the rainfall history curve into multiple processes. At the same time, the monitoring data of a complex sequence cannot be satisfied due to signal noise, a delay in the response, and other problems. To accurately fit the correlation measurement of landslides affected by a long time sequence of rainfall in reality, the impulse response function is introduced during signal processing to calculate the correlation function between the two signal sequences and measure the similarity between the two signals, thereby realizing inversion from geometric distance to the actual time interval [41,42].
The impulse response function is a cross-correlation function that describes the characteristics of the time-domain system and is widely used in radar, sonar, digital communication, and geology [43]. The advantage of the impulse response function is that the algorithm’s parameters and convolution operation are suitable for signals mixed with additive noise or delayed samples [44]. For a given time series, this function can solve for the distance of a real target submerged in noise. In the landslide deformation signal processing continuously affected by regional rainfall, the rainfall monitoring signal without random noise is represented by the continuous impulse signal h t . Similarly, when the input signal is the impulse signal δ t of the landslide deformation fitted waveform, the output response function φ t of the system is the convolution integral between the input rainfall sequence and the deformation sequence [45]. According to the specific change in the signal under the correlation measurement, the response function is divided into an impulse period function φ T and delay response function.
1. Impulse period function φ T . In the definition of the relevant time parameters of the response function, the signals h t and δ t are assumed to start at the same time due to the obvious existence of persistent precipitation. When the input rainfall signal shows a periodically repeating waveform, the nonlinear subsystem impulse response function is calculated by the periodic input signal with different amplitudes as the response function for measuring the rainfall-induced landslide deformation correlation period.
2. Delay response function φ td . When the rainfall impulse signal pair and the deformation pulse signal have a relative offset (lag) on the time axis, their related time parameters will also change. This dependence is described by a shift function based on the signal with zero padding while considering the pulse period, as shown in Formula (5):
ϕ T = δ T h T Δ T d Δ T ϕ t d = δ T h T t d Δ T d Δ t d + T

3.2.2. Measures Calculation

Based on the correlation model of the response function, Formula (6) calculates the correlation C o r and degree of fit F i t (labeled Degree Fit) [46], which are used to quantitatively analyze the complex correlation model between landslide deformation and rainfall.
C o r t | T , t d = i = 0 N 1 δ i ( t ) h i + t ( t ) F i t t | T , t d = j = 0 N ϕ i ( t ) δ i ( t ) 2 j = 0 N ϕ i ( t ) h i ( t ) 2

3.3. The Construction of the Time-Domain Correlation Model

Integrating the abovementioned regional rainfall with the landslide deformation correlation measurement analysis and calculation method, the deformation mechanism and correlation properties of rainfall-induced landslides can be broadly classified based on the regional monitoring data as shown in Table 2.
1. Rainfall-induced landslide deformation consistency model ( M 1 ): Under the action of rainfall and infiltration, the landslide surface balance is easily damaged and sliding occurs. The effect is expressed as a slow and long-term surface deformation process, as a rainfall process, and as a deformation process. There is good temporal consistency between the correlation period T and the pulse period function φ T , and the cross-correlation and the goodness of fit under the correlation period are the largest. This type of model can determine the real-time landslide deformation and future deformation based on the predicted accumulation of rainfall.
2. Rainfall-induced landslide deformation hysteresis model ( M 2 ): Affected by factors such as the composition of the geological body, the thickness of the landslide body, etc., rainfall-induced landslide deformation occurs mostly during the middle and late periods of rainfall or several days later, and the lag times of different types of landslides differ; that is, there is a lag time td and a delay response function φ td . Generally, the lag times of landslides that occur in accumulated soil, landfills, loess, clay, and bedrock range from short to long, and the thickness of the same type of landslide ranges from shallow to deep.
3. Rainfall-induced landslide deformation turbulence model ( M 3 ): Because landslide deformation in a slope is caused by the coupling of multiple factors, some landslide areas may exhibit little rainfall or weak deformation responses to rainfall; that is, the correlation between the landslide response and rainfall is weak, using the weak correlation criterion 0.4 as the judgment indicator. Such situations cannot be accurately forecasted, and early warning systems based on rainfall will fail to predict these landslides.

4. Algorithm Descriptions
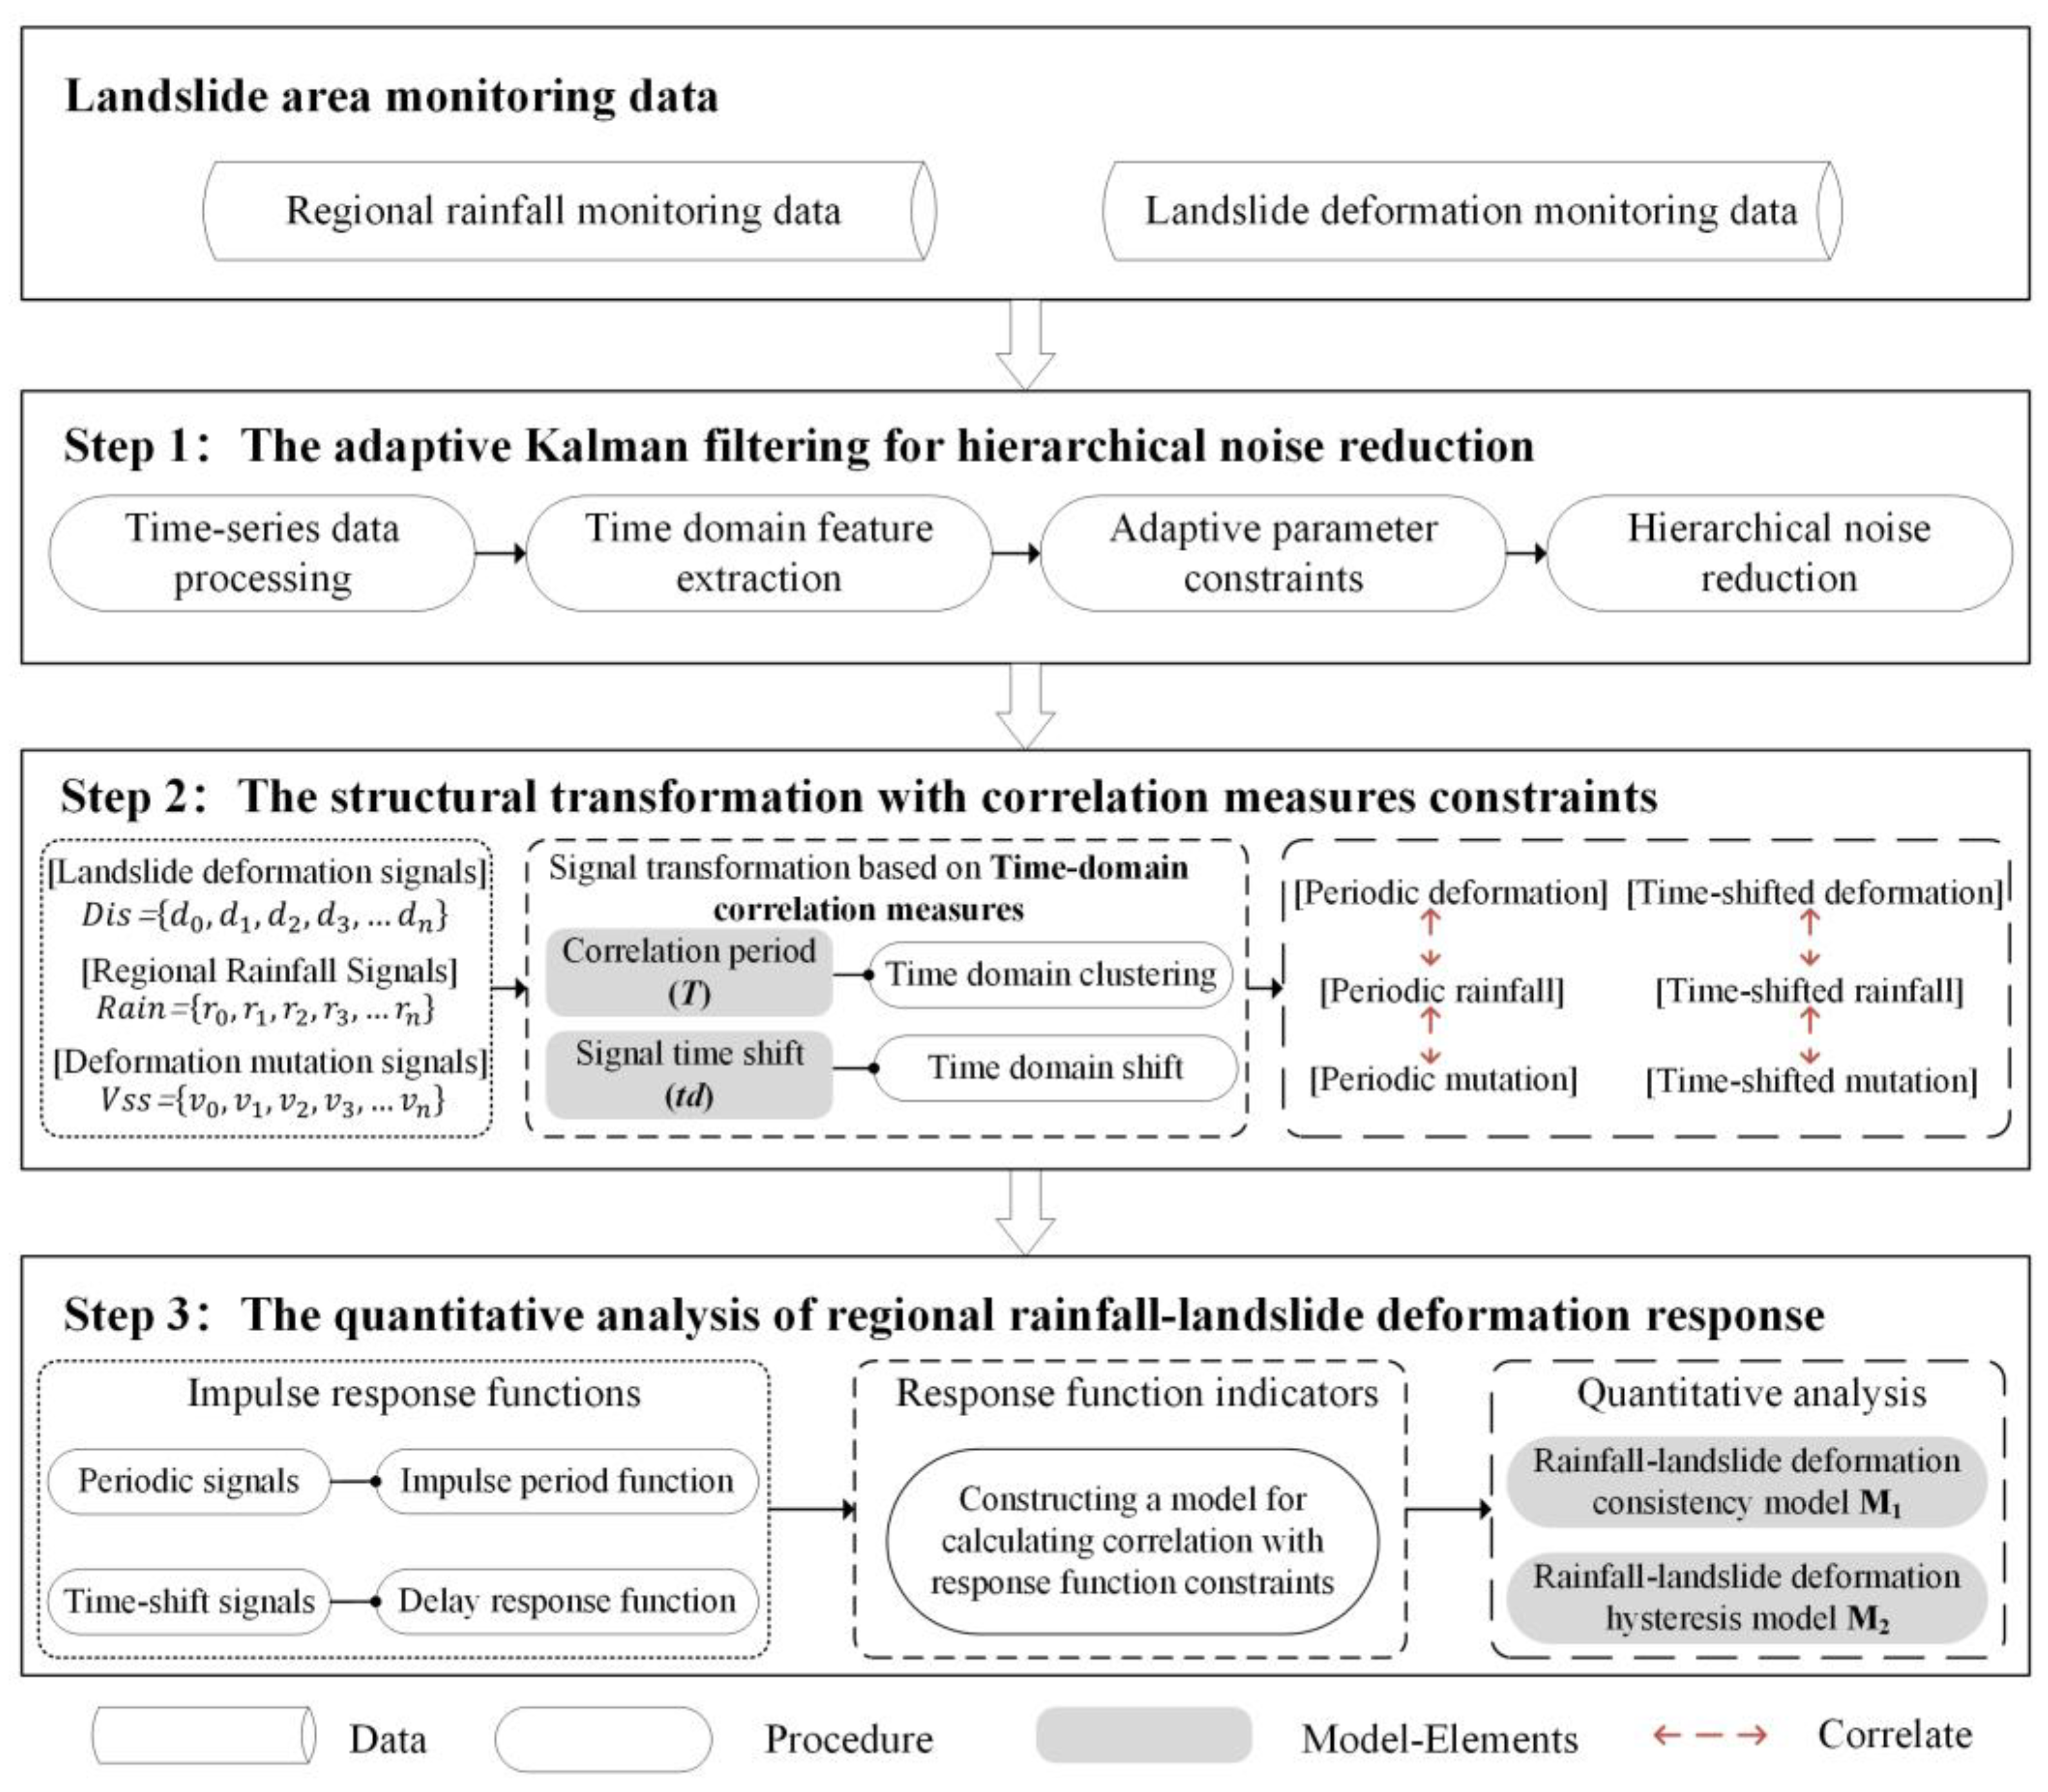
4.1. Overview

This paper uses signal processing technology to quantitatively measure the correlation between regional rainfall and landslide deformation. The flow chart of the method is illustrated in the Figure 5. The core steps are as follows: ① Considering the presence of noise in landslide deformation monitoring data, the proposed method is based on the described time-domain correlation measurement and parameter extraction of the change characteristics of rainfall data and deformation data; this approach adopts an adaptive variable-parameter constrained time-domain classification method for Kalman filtering. ② Due to the unsynchronized time-domain correlation characteristics between rainfall and deformation in landslide disasters, combined with the abovementioned correlation measure, the correlation between the period and time shift of the monitoring signal transformation structure is realized after noise reduction. ③ An impulse response function that can fuse two or more signal time-domain change characteristics is constructed, and the deformation time series variable is calculated in response to the consistent correlation and goodness of fit of the rainfall variables. ④ The correlation model of the rainfall-induced landslide deformation response in combination with the above quantitative factors is analyzed, and then the nature of the internal factors is verified; finally, the correlation period between regional rainfall and landslide deformation (the lag time) is quantitatively measured.

4.2. The Adaptive Kalman Filtering for Hierarchical Noise Reduction

For landslide disasters in different regions, when using monitoring data to analyze, process, and predict landslide disasters, there is often a certain error between the observed value and the actual value [47]. How to effectively eliminate this error while retaining the local characteristics is very important in analyzing the deformation characteristics of the landslide. In this paper, the Kalman filtering method is used to predict the subsequent time-domain state characteristics through the preliminary time-domain state characteristics and then to combine the observed values to solve for the optimal value, thereby reducing noise while retaining local feature values [48].
First, the regional rainfall data and landslide deformation monitoring data are processed in a unified time series; that is, the time series quantity t n o r m , rainfall r n o r m , and deformation variable d n o r m (unit: days) are obtained. For the geological environment, the rainfall coefficient k is computed, and then the interval threshold and the mutation signal v n o r m are calculated according to the rainfall critical value R t and the mutation point D m described in Formula (3). Finally, the interval is used to perform adaptive Kalman filtering for hierarchical noise reduction on the mutation signal according to the Formula (7).
F t = 1 Δ t 0 1 R t 1 t n o r m t n o r m 1 R t 0 1 B t = Δ t 2 2 Δ t R t t n o r m t n o r m 1 R t 2 2 t n o r m t n o r m 1 R t v ^ n o r m = F t × v n o r m + B t × v ^ n o r m 1
In the above formula, F t and B t are the state change matrices in the Kalman filter, Δ t is the sampling time, v ^ n o r m is the current estimate, v n o r m is the measured value, and v ^ n o r m 1 is the previous estimate.

4.3. The Structural Transformation with Correlation Measure Constraints

Because of the seasonal cyclic characteristics of regional rainfall and the asynchronous time-domain correlation between rainfall and deformation in landslide hazards, the combined time-domain waveforms cannot be judged directly, and this paper uses the time-domain correlation measure as a dynamic parameter to transform the monitoring signals into a characteristic structure for the quantitative analysis of regional rainfall-induced landslide deformation responses. Equation (7) clusters the noise-reduced deformation signals, sudden change signals, and rainfall signals based on the correlation period T [49]. The monitoring signals are divided into several effective time regions by expanding the time series quantity t n o r m , while the following signal shifts are further applied to the rainfall signals that have been clustered in the time domain according to the time shift quantity td , with the aim of further investigating whether there is a lag between rainfall and deformation in the region.
f T : t i T = t 0 n o r m + i × T d i T = f T d ^ n o r m r i T = f T r n o r m v ^ i T = f T v ^ n o r m g T _ t d : t i T _ t d = f T t n o r m t d d i T _ t d = g T _ t d d ^ n o r m r i T _ t d = g T _ t d r n o r m v ^ i T _ t d = g T _ t d v ^ n o r m

4.4. The Quantitative Analysis of Regional Rainfall-Induced Landslide Deformation Response

To calculate the time-domain correlation measure of regional rainfall-induced landslide deformation, the following formula combines the signals with the transformed structure to construct a periodic impulse function and a time-delayed impulse function. According to the model judgment table, a consistent correlation model judgment does not need to consider the time-domain shift. The signal is expanded and contracted on the basis of the overall correspondence, the response function index between the two curves is solved with the expanded data, and the correspondence is adjusted simultaneously to reconstruct the signal.
As shown in Formula (9), multiple sets of correlations are solved in this manner, and the best set is taken for further analysis. In contrast, the determination of the lag correlation is different from that of the consistent correlation in that the time-domain shift needs to be considered. When the signal is expanded and contracted, the time-domain shift is applied to solve for the correlation, and the degree of fit is compared corresponding to the time-domain response correlation model. The quantitative values of the correlation period T and signal time shift td are then calculated backward.
ϕ T = v i T r i T d Δ T C o r T = C o r v i T , r i T F i t T = F i t ϕ T , v i T ϕ t d = v i T r i T _ t d d Δ t d + T C o r t d = C o r v i T , r i T _ t d F i t t d = F i t ϕ t d , v i T

5. Experimental Analysis

5.1. Dataset Analysis

The landslide deformation and rainfall data at the monitoring points were plotted as time curves (Figure 6). A significant correlation can be found between landslide deformation and regional rainfall. However, it is difficult to accurately determine the relevant magnitudes and durations at minor time scales. At the same time, there is some noise in the landslide deformation data. Therefore, the monitoring data are modeled according to the method of this paper to realize the quantitative calculation of the time correlation.

5.2. Experimental Results

This paper selects all the GDA10068 monitoring points in the XP landslide area for a quantitative analysis using the proposed time-domain correlation model, and simultaneously calculates the analysis results at all the monitoring points in the landslide area. First, for the original monitoring data of rainfall and landslide deformation with an hourly sampling interval, the cumulative amount of which is less than one day due to missing data, interpolation is applied to standardize the units to days to obtain continuous deformation cumulative signals and rainfall signals. The parameters D m and R s of the time-domain correlation measurement described according to Formulas (3) and (4), respectively, are then calculated, and the rainfall coefficient k is obtained based on previous research experience in conjunction with the geological environment of the landslide area (Table 1); the results are shown in Table 3. The gain parameter of the Kalman filter is further updated according to Formula (6) to realize adaptive hierarchical noise reduction for the landslide deformation signal. The experimental effect of this filter is shown in Figure 7.
Table 3. Time domain measurement parameters of monitoring points in landslide areas.
Monitoring Sites D m R ¯ k R s
12201.762818.2836.67121.94
12351.3285
12430.9477
MJ012.655215.3919.74149.90
MJ142.9282
FA352.1681
GDA100682.137115.39812.48192.16
GDA100772.3757
GDA103571.5635
FJ022.361113.76411.89163.65
FJ032.7911
FJ041.3659
FJ0210.26124.4047.7634.17
FJ059.3689
FJ0910.2251
Figure 7. Map of monitoring data at landslide site GDA10068. Used to calculate rainfall-induced deformation value, mutation signals, and the corresponding Kalman filter results.
Land 11 00703 g007
In the signal feature structure transformation stage, the time-domain correlation measures T and td are used as variable parameters in Formula (7), and the ranges are specified here as 0~60 days and 0~30 days, respectively. The example diagram in Figure 8a is the feature map of signal clusters at 5, 20, and 40 days. At the same time, a certain clustering parameter is fixed, and td is 1, 2, and 3 for the signal time shift. It is obvious that most of the monitoring points in each area record the amount of rainfall, and the deformation signals gradually show the same trend. The correlation degree C o r in Formula (8) is used to accurately quantify the accurate value or effective range of the time-domain correlation measure, and the results are shown in Figure 8b.
In the quantitative analysis of the regional rainfall-induced landslide deformation response, the correlation function between the rainfall and deformation is constructed according to Formula (5) using the rainfall-deformation correlation signal after a series of processing steps. The function performance is shown in example Figure 8c, and the described impulse response function type corresponds and divides the correlation function of the research point into a pulse period function, a delay response function, and a disorder function without changing the properties. Using Formula (9), the degree of fit F i t can then be calculated to determine the accurate value or effective range of the time-domain correlation measure. Corresponding to the proposed time-domain correlation model according to the calculated results, there is a delayed response between the rainfall and landslide deformation in the study area, and there is a 5-day lag time under a 56-day cycle. In summary, this area can be simulated by a rainfall-induced landslide deformation hysteresis correlation model.
Figure 8. Map of the results of the test using the time-domain correlation quantitative analysis model at landslide site GDA10068. (a) This figure illustrates the process of monitoring signals for period clustering using the time domain correlation measure described and the signal time shifting. The correlation measure Cor is also measured quantitatively. (b) This figure shows the quantitative calculation of the signal after the clustering and time-shifting operations. The value of Cor tells us the optimal T and td (dark blue). (c) Response function construction and quantitative calculation results for correlated signals. The value of Fit tells us the optimal T and td (dark blue).
Land 11 00703 g008

5.3. Analysis and Discussion

Table 4 shows all the model indicators summarized by the above calculation process for all monitoring sites, which can meet the requirements for judging the rainfall-induced landslide correlation modes. We also compared the results with existing studies to demonstrate the validity of the method [50,51,52].
1. According to the calculation results for the TMS landslide and the OT landslide model, there is a periodic correlation between the rainfall at the monitoring points and the landslide deformation, and the response function constructed by the above signals is expressed as a pulse period function φ T ; at the same time period T , the signal correlation and function fitting degree under clustering are both greater than the correlation degree and fitting degree of the time shift td involved in the calculation and correspond to the consistent correlation model; therefore, such areas can be separately measured to determine the historical landslide deformation and deformation based on the amount of rainfall. Periodic accumulations of 48–50 days and 58 days can be used to predict consistent changes in future landslide motion.
2. According to the model calculation results for the XP landslide and the XSP landslide, there is a periodic correlation between the rainfall at the monitoring points and the landslide deformation, there is a certain signal time shift, and the response function shows a delayed response function φ td . The signal correlation degree and function degree involved in the calculation of the time shift td are greater than the correlation degree and the degree of fit under the clustering at period T , which corresponds to the hysteresis correlation model; therefore, there is a certain lag between the rainfall and landslide deformation in the above areas. Periodic changes in duration need to be analyzed in advance by a time shift when predicting future changes to obtain more adequate warning times.
3. The model calculation results between the rainfall and landslide deformation at the HJWC landslide monitoring point all correspond to the turbulent correlation model. Therefore, it is not possible to provide a preliminary warning of landslide deformation based on rainfall alone in this area; rather, the additional analysis of other monitoring information is required.
4. Comparing the results of this paper with recent studies, the common rainfall-induced landslides exhibit mostly lagging phenomena. For instance, Pukar [53] indicated that there are landslides in the Lower Mekong Region in which deformation lags 12 days behind rainfall. Meanwhile, Japanese researcher Tsunetaka [54] found that when the rainfall is greater than 200 mm, the lag time of landslide deformation can be as low as 3d. Salee [55] also proves that a 20-day cumulative rainfall depth event was the most suitable duration of cumulative rainfall depth. Therefore, the required duration of landslide deformation induced by rainfall varies in different regions of the world, and the reasons for this are an important direction for continued in-depth research.
Rainfall data are easy to obtain and constitute relatively stable monitoring data, and only surface deformation data are needed to study the significant changes in landslide disasters to achieve effective early warnings. The method proposed in this paper involves a calculation model for the signal correlation in the time domain. The proposed model can not only quantitatively describe the motion of landslide deformation affected by rainfall but also determine different correlation models based on the rainfall and landslide deformation and calculate the differences between the two under different models. Compared with the existing methods, this time-domain correlation feature also possesses a certain degree of universality and scalability when there is no ultra-long time sequence and high-precision monitoring data. In particular, the time-domain correlation model proposed herein is universal and can be used as a general judgment index for all rainfall-induced landslide disasters; moreover, the complexity of the response calculation method is low. Hence, this model is suitable for supporting the parallel computing of short-term data from multiple monitoring points on large-scale landslides, which is useful for periodic monitoring.
However, for the uncertain landslides, other predisposing factors need to be considered to obtain regular correlated changes between regional rainfall and landslide deformation. Therefore, further research can focus on strengthening the correlation analysis of monitoring data with a relationship between the reservoir water level and landslide deformation to improve the model indicators of rainfall-induced landslides and other types of landslides and more accurately establish multifactor constrained time-domain correlation models. Nevertheless, this study provides a scientific and accurate basis for faster and more accurate landslide warnings.

6. Conclusions

This paper proposes a method for the quantitative analysis of regional rainfall-induced landslide deformation responses based on a time-domain correlation model. Considering the difficulty of quantifying landslide deformation trends under rainfall through short-term data by existing methods, a new research framework is proposed including the time-domain correlation model using signal processing techniques. Mining potential and deep-seated correlations between rainfall and landslide deformation from long time series of landslide monitoring data. Furthermore, through a quantitative correlation measure, the consistent correlation period and the hysteresis time shift caused by regional rainfall affecting landslide deformation can be obtained, and finally, an effective prediction of the time period of landslide deformation can be achieved. Experiments were conducted on rainfall and landslide deformation monitoring data at five landslide locations in Fengjie County, Chongqing. The results showed that the rainfall-induced landslide deformation of the XP landslide and XSP landslide in hidden hazard areas exhibits a delayed correlation. In contrast, the correlation model for the hidden hazard areas of the TMS landslide and OT landslide shows a consistent correlation, verifying the feasibility of this method in studying the deformation of rainfall-induced landslides.
This model is universal and largely independent of the landslide environment; at the same time, it is scalable and portable, and can be extended to the analysis of landslides caused by external natural factors such as earthquakes. Therefore, the model is suitable for supporting the calculation of multiple sites for multi-scale landslides, which is useful for regular monitoring and early warning.
We also summarized the current limitations of our proposed methods and outlined promising future work.
1. Lack of utilizing monitoring data: When this model is used for risk management of landslides with disorderly correlations, it is difficult to analyze with rainfall monitoring data only because the external hazards affecting it are not equally important. Therefore, different influencing factors, such as reservoir level or groundwater level, should be included.
2. Uncertainty of landslide deformation trend: In reality, landslide deformation does not necessarily lead to instability, so the model lacks the discrimination regarding the degree of deformation when applied to risk management. We will be able to classify the susceptibility to landslides from the quantitative calculation results.

Author Contributions

Conceptualization, X.X.; methodology, X.X. and T.W.; software, T.W. and H.W.; validation, T.W. and X.X.; formal analysis, X.X., T.W. and X.Z.; investigation, T.W. and H.Z.; resources, X.X.; data curation, X.X.; writing—original draft preparation, T.W. and X.X.; writing—review and editing, X.X. and T.W.; visualization, T.W.; supervision, X.X.; project administration, X.X.; funding acquisition, X.X. All authors have read and agreed to the published version of the manuscript.

Funding

The National the Shenyang Young and Middle-aged Scientific and Technological Talents Program (RC210502); The Weifang Science and Technology Project (2021ZJ1134); The LZJTU EP 201806 and the National Key Research and Development Program of China (No. 2018YFB0505404).

Institutional Review Board Statement

Ethical review and approval were waived because necessary permissions were obtained from the local governments to which the schools are affiliated for this study. Informed Consent Statement: Informed consent was obtained from all subjects involved in the study.

Informed Consent Statement

Studies not involving human (Not applicable).

Data Availability Statement

Data available on request due to ethical restrictions. The data presented in this study are available on request from the corresponding author. The data are not publicly available due to not having participants consent to share their anonymized data with a third party.

Acknowledgments

We are grateful to Qing Zhu (Southwest Jiaotong University) for his guidance on this study. Zhu provided valuable professional advice both at the start of the study and during the refinement process.

Conflicts of Interest

The authors declare no conflict of interest. The funders had no role in the design of the study; in the collection, analyses, or interpretation of data; in the writing of the manuscript, or in the decision to publish the results.

References

  1. Miccadei, E.; Carabella, C.; Paglia, G. Landslide Hazard and Environment Risk Assessment. Land 2022, 11, 428. [Google Scholar] [CrossRef]
  2. Nagy, G. Shaping Sustainable Urban Environments by Addressing the Hydro-Meteorological Factors in Landslide Occurrence: Ciuperca Hill (Oradea, Romania). Int. J. Environ. Res. Public Health 2021, 18, 5022. [Google Scholar]
  3. Chen, C.W.; Tung, Y.S.; Liou, J.J.; Li, H.C.; Cheng, C.T.; Chen, Y.M.; Oguchi, T. Assessing landslide characteristics in a changing climate in northern Taiwan. Catena 2019, 175, 263–277. [Google Scholar] [CrossRef]
  4. Paswan, A.P.; Shrivastava, A.K. Modelling of rainfall-induced landslide: A threshold-based approach. Arab. J. Geosci. 2022, 15, 795. [Google Scholar] [CrossRef]
  5. Guzzetti, F.; Peruccacci, S.; Rossi, M.; Stark, C.P. The rainfall intensity–duration control of shallow landslides and debris flows: An update. Landslides 2008, 5, 3–17. [Google Scholar] [CrossRef]
  6. Guzzetti, F.; Peruccacci, S.M.; Rossi, M.; Stark, C.P. Rainfall thresholds for the initiation of landslides in Central and Southern Europe. Meteorol. Atmos. Phys. 2007, 98, 239–267. [Google Scholar] [CrossRef]
  7. Wasowski, J. Understanding rainfall-landslide relationships in man-modified environments: A case-history from Caramanico Terme, Italy. Environ. Geol. 1998, 35, 197–209. [Google Scholar] [CrossRef]
  8. Kristo, C.; Rahardjo, H.; Satyanaga, A. Effect of variations in rainfall intensity on slope stability in Singapore. Int. Soil Water Conserv. Res. 2017, 5, 258–264. [Google Scholar] [CrossRef]
  9. Luki, T.; Bjelajac, D.; Fitzsimmons, K.E.; Marković, S.B.; Basarin, B.; Mlađan, D.; Micić, T.; Schaetzl, R.J.; Gavrilov, M.B.; Milanović, M.; et al. Factors triggering landslide occurrence on the Zemun loess plateau, Belgrade area, Serbia. Environ. Earth Sci. 2018, 77, 519. [Google Scholar] [CrossRef]
  10. He, S.; Wang, J.; Liu, S. Rainfall Event–Duration Thresholds for Landslide Occurrences in China. Water 2020, 12, 494. [Google Scholar] [CrossRef] [Green Version]
  11. Huang, Q.X.; Xiang-Tao, X.U.; Kulatilake, P.; Feng, L.I.N. Formation mechanism of a rainfall triggered complex landslide in southwest China. J. Mt. Sci. 2020, 17, 15. [Google Scholar] [CrossRef]
  12. Peng, Q.; Zhang, Z.Y.; Qin, Z.H.; WANG, W.H. IVDF-ANN Prediction Model for Monitoring Data of Landslide Deformation. J. Yangtze River Sci. Res. Inst. 2012, 29, 29. [Google Scholar]
  13. Floris, M.; Bozzano, F. Evaluation of landslide reactivation: A modified rainfall threshold model based on historical records of rainfall and landslides. Geomorphology 2008, 94, 40–57. [Google Scholar] [CrossRef]
  14. Rosone, M.; Ziccarelli, M.; Ferrari, A.; Farulla, C.A. On the reactivation of a large landslide induced by rainfall in highly fissured clays. Eng. Geol. 2018, 235, 20–38. [Google Scholar] [CrossRef]
  15. Thiebes, B.; Bell, R.; Glade, T.; Jäger, S.; Mayer, J.; Anderson, M.; Holcombe, L. Integration of a limit-equilibrium model into a landslide early warning system. Landslides 2014, 11, 859–875. [Google Scholar] [CrossRef]
  16. Montrasio, L.; Valentino, R.; Losi, G.L. Towards a real-time susceptibility assessment of rainfall-induced shallow landslides on a regional scale. Nat. Hazards Earth Syst. Sci. 2011, 11, 1927–1947. [Google Scholar] [CrossRef] [Green Version]
  17. Ng, C.; Choi, C.E.; Song, D.; Kwan, J.H.S.; Koo, R.C.H.; Shiu, H.Y.K.; Ho, K.K.S. Physical modeling of baffles influence on landslide debris mobility. Landslides 2015, 12, 627. [Google Scholar] [CrossRef] [Green Version]
  18. Lukic, T.; Lescesen, I.; Sakulski, D.; Basarin, B.; Jordaan, A. Rainfall erosivity as an indicator of sliding occurrence along the southern slopes of the baka loess plateau: A case study of the kula settlement, vojvodina (North Serbia). Carpathian J. Earth Environ. Sci. 2016, 11, 303–318. [Google Scholar]
  19. Yilmaz, I. Landslide susceptibility mapping using frequency ratio, logistic regression, artificial neural networks and their comparison: A case study from Kat landslides (Tokat—Turkey). Comput. Geosci. 2009, 35, 1125–1138. [Google Scholar] [CrossRef]
  20. Pradhan, B.; Lee, S. Delineation of landslide hazard areas on Penang Island, Malaysia, by using frequency ratio, logistic regression, and artificial neural network models. Environ. Earth Sci. 2010, 60, 1037–1054. [Google Scholar] [CrossRef]
  21. Yang, Z.; Cai, H.; Shao, W.; Huang, D.; Uchimura, T.; Lei, X.; Tian, H.; Qiao, J. Clarifying the hydrological mechanisms and thresholds for rainfall-induced landslide: In situ monitoring of big data to unsaturated slope stability analysis. Bull. Eng. Geol. Environ. 2019, 78, 2139–2150. [Google Scholar] [CrossRef]
  22. Tang, H.M.; Wei, L.; Tang, Y.H.; Gao, Y. Correlation analysis and prediction model for rainfall-induced landslide in Chongqing area. Chin. J. Geol. Hazard Control. 2013, 4, 16–22. [Google Scholar]
  23. Pfeiffer, J.; Zieher, T.; Schmieder, J.; Rutzinger, M.; Strasser, U. Spatio-temporal assessment of the hydrological drivers of an active deep-seated gravitational slope deformation: The Vgelsberg landslide in Tyrol (Austria). Earth Surf. Processes Landf. 2021, 46, 1865–1881. [Google Scholar] [CrossRef]
  24. Kostic, S.; Vasovic, N.; Franovic, I.; Jevremović, D.; Mitrinovic, D.; Todorović, K. Dynamics of landslide model with time delay and periodic parameter perturbations. Commun. Nonlinear Sci. Numer. Simul. 2014, 19, 3346–3361. [Google Scholar] [CrossRef]
  25. Yan, Y.; Yang, D.S.; Geng, D.X.; Hu, S.; Wang, Z.A.; Hu, W.; Yin, S.Y. Disaster reduction stick equipment: A method for monitoring and early warning of pipeline-landslide hazards. J. Mt. Sci. 2019, 16, 4–17. [Google Scholar] [CrossRef]
  26. Wang, W.; Li, Y. Hazard degree assessment of landslide using set pair analysis method. Nat. Hazards 2012, 60, 367–379. [Google Scholar]
  27. Xu, Q.; Huang, R.; Yin, Y. The Jiweishan landslide of June 5, 2009 in Wulong, Chongqing: Characteristics and failure mechanism. J. Eng. Geol. 2009, 17, 433–444. [Google Scholar]
  28. Kwong, A.; Wang, M.; Lee, C.F.; Law, K.T. A review of landslide problems and mitigation measures in Chongqing and Hong Kong: Similarities and differences. Eng. Geol. 2004, 76, 27–39. [Google Scholar] [CrossRef] [Green Version]
  29. Wang, Y.; Sun, D.; Wen, H.; Zhang, H.; Zhang, F. Comparison of Random Forest Model and Frequency Ratio Model for Landslide Susceptibility Mapping (LSM) in Yunyang County (Chongqing, China). Int. J. Environ. Res. Public Health 2020, 17, 4206. [Google Scholar] [CrossRef]
  30. Deng, H.; Zhong, C.Y.; Wu, L.; Tu, G.X. Process analysis of causes of Luanshigang landslide in the Dadu River, China. Environ. Earth Sci. 2021, 80, 737. [Google Scholar] [CrossRef]
  31. Bao, Y.; Sun, X.; Zhou, X.; Zhang, Y.; Liu, Y. Some numerical approaches for landslide river blocking: Introduction, simulation, and discussion. Landslides 2021, 18, 3907–3922. [Google Scholar] [CrossRef]
  32. Yan, E.; Song, K.; Li, H. Applicability of time domain reflectometry for Yuhuangge landslide monitoring. J. Earth Sci. 2010, 21, 856–860. [Google Scholar] [CrossRef]
  33. Hunter, I.W.; Kearney, R.E.; Jones, L.A. Estimation of the conduction velocity of muscle action potentials using phase and impulse response function techniques. Med. Biol. Eng. Comput. 1987, 25, 121–126. [Google Scholar] [CrossRef] [PubMed]
  34. Riaz, S.; Kikumoto, M.; Basharat, M.; Putra, A.D. Wetting Induced Deformation of Soils Triggering Landslides in Pakistan. Geotech. Geol. Eng. 2021, 39, 5633–5649. [Google Scholar] [CrossRef]
  35. Sammori, T.; Ohkura, Y.; Ochiai, H.; Kitahara, H. Effects of Soil Depth on Rain-induced Landslide. Sabo Gakkaish. 1995, 48, 12–23. [Google Scholar]
  36. Segoni, S.; Leoni, L.; Benedetti, A.I.; Catani, F.; Righini, G.; Falorni, G.; Gabellani, S.; Rudari, R.; Silvestro, F.; Rebora, N. Towards a definition of a real-time forecasting network for rainfall induced shallow landslides. Nat. Hazards Earth Syst. Sci. 2009, 9, 2119–2133. [Google Scholar] [CrossRef] [Green Version]
  37. Li, L.; Yao, X.; Yao, J.; Zhou, Z.; Feng, X.; Liu, X. Analysis of deformation characteristics for a reservoir landslide before and after impoundment by multiple D-InSAR observations at Jinshajiang River, China. Nat. Hazards 2019, 98, 719–733. [Google Scholar] [CrossRef]
  38. Vallet, A.; Charlier, J.B.; Fabbri, O.; Bertrand, C.; Carry, N.; Mudry, J. Functioning and precipitation-displacement modelling of rainfall-induced deep-seated landslides subject to creep deformation. Landslides 2016, 13, 653–670. [Google Scholar] [CrossRef]
  39. Banihabib, M.E.; Tanhapour, M. An empirical equation to determine the threshold for rainfall-induced landslides developing to debris flows. Landslides 2020, 17, 2055–2065. [Google Scholar] [CrossRef]
  40. Saito, H.; Nakayama, D.; Matsuyama, H. Relationship between the initiation of a shallow landslide and rainfall intensity-Duration thresholds in Japan. Geomorphology 2010, 118, 167–175. [Google Scholar] [CrossRef]
  41. Mucchi, L.; Morosi, S.; Re, E.D.; Fantacci, R. A new algorithm for blind adaptive multiuser detection in frequency selective multipath fading channel. IEEE Trans. Wirel. Commun. 2004, 3, 235–247. [Google Scholar] [CrossRef] [Green Version]
  42. Mbachu, C.B. Height Adjustable Triangular (HAT) Window Function for Impulse Response Modification of Signal Processing Systems. Eur. J. Eng. Res. Sci. 2020, 5, 358–366. [Google Scholar] [CrossRef]
  43. Ewing, B.T.; Kruse, J.B.; Schroeder, J.L.; Smith, D.A. Time series analysis of wind speed using VAR and the generalized impulse response technique. J. Wind. Eng. Ind. Aerodyn. 2007, 95, 209–219. [Google Scholar] [CrossRef]
  44. Kurosu, A.; Miyase, S.; Tomiyama, S.; Takebe, T. A Technique to Truncate IIR Filter Impulse Response and Its Application to Real-Time Implementation of Linear-Phase IIR Filters. IEEE Trans. Signal Process. 2003, 51, 1284–1292. [Google Scholar] [CrossRef]
  45. Dong, J.; Lu, Z.G.; Sun, Z.H.; Peng, Z.T.; Xia, Y.W.; Su, J.Q.; Jing, F.; Yuan, H.Y.; Liu, H.; Tang, J. Transforming characteristic of phase-shift from frequency-domain to time-domain in frequency-domain holography. Opt. Laser Technol. 2012, 44, 594–599. [Google Scholar] [CrossRef]
  46. Matsumoto, T.; Otsuki, M.; Ooshida, T.; Goto, S. Correlation function and linear response function of homogeneous isotropic turbulence in the Eulerian and Lagrangian coordinates. J. Fluid Mech. 2021, 919, 357. [Google Scholar] [CrossRef]
  47. Nakashima, S.; Furuyama, Y.; Hayashi, Y.; Nguyen, T.K.; Shimizu, N.; Hirokawa, S. Accuracy enhancement of GPS displacements measured on a large steep slope and results of long-term continuous monitoring. J. Jpn. Landslide Soc. 2018, 55, 13–24. [Google Scholar] [CrossRef] [Green Version]
  48. Zhang, N.; Zhang, W.; Liao, K.; Zhu, H.H.; Li, Q.; Wang, J. Deformation prediction of reservoir landslides based on a Bayesian optimized random forest-combined Kalman filter. Environ. Earth Sci. 2022, 81, 197. [Google Scholar] [CrossRef]
  49. Ski, J.M.; Owczarek, A.J. A time-domain-constrained fuzzy clustering method and its application to signal analysis. Fuzzy Sets Syst. 2005, 155, 165–190. [Google Scholar]
  50. Sun, D.; Xu, J.; Wen, H.; Wang, D. Assessment of landslide susceptibility mapping based on Bayesian hyperparameter optimization: A comparison between logistic regression and random forest. Eng. Geol. 2020, 281, 105972. [Google Scholar] [CrossRef]
  51. Han, G.; Yang, Y.; Yan, S. Vegetation Activity Trend and Its Relationship with Climate Change in the Three Gorges Area, China. Adv. Meteorol. 2020, 2013, 235378. [Google Scholar] [CrossRef]
  52. Wang, K.; Zhang, S. Rainfall-induced landslides assessment in the Fengjie County, Three-Gorge reservoir area, China. Nat. Hazards 2021, 108, 451–478. [Google Scholar] [CrossRef]
  53. Amatya, P.; Kirschbaum, D.; Stanley, T. Rainfall-induced landslide inventories for Lower Mekong based on Planet imagery and a semi-automatic mapping method. Geosci. Data J. 2022, 1–13. [Google Scholar] [CrossRef]
  54. Tsunetaka, H. Comparison of the return period for landslide-triggering rainfall events in Japan based on standardization of the rainfall period. Earth Surf. Processes Landf. 2021, 46, 2984–2998. [Google Scholar] [CrossRef]
  55. Salee, R.; Chinkulkijniwat, A.; Yubonchit, S.; Horpibulsuk, S.; Wangfaoklang, C.; Soisompong, S. New threshold for landslide warning in the southern part of Thailand integrates cumulative rainfall with event rainfall depth-duration. Nat Hazards, 2022; accepted. [Google Scholar] [CrossRef]
Figure 1. Location of the study area. (a) General map of China; (b) Location of the study area; (c) The XP landslide, briefly showing the monitoring instruments placed and the associated monitoring data.
Land 11 00703 g001
Figure 2. Thematic maps in Fengjie of physical properties about landslides. (a) Stratum. (b) Hill shade. (c) Slope. (d) NDVI.
Land 11 00703 g002
Figure 3. Conceptual diagram of regional rainfall-induced landslide deformation time-domain correlation measurement. The figure clearly shows the landslide monitoring data, including the periodic deformation curve (yellow), the hysteresis deformation curve (red), and the regional rainfall curve (blue).
Land 11 00703 g003
Figure 4. Schematic diagram for calculating time-domain correlation measures based on impulse response functions.
Land 11 00703 g004
Figure 5. Flow chart of the regional rainfall-induced landslide deformation quantitative response analysis algorithm.
Land 11 00703 g005
Figure 6. Partly map of monitoring data of the regional rainfall-induced landslide.
Land 11 00703 g006
Table 1. A qualitative description of the landslide area and monitoring points in the study (partly collected from the literature) will be used for the quantitative analysis in this paper.
LandslideType of
Landslide
Monitoring SitesLocation of
Monitoring Sites
Landslide Environment
(➀ Rock Formations
➁ Hydrogeology
➂ Human)
TMS landslideShallow wading landslides1220Leading edge of slide blocking section
Mainly composed of gravelly clay and gravelly soil rocks;
Poor groundwater storage conditions, direct infiltration to recharge the bedrock fracture water;
Shear outlet near the water system, no surrounding houses, roads, etc.
1235Index segment antecedents
1243Leading and trailing edges of lower sliding section
OT
landslide
Giant cis-laminated rocky paleo landslideMJ01Leading edge of slide blocking section
Mainly composed of powder clay sandwiched between crushed boulders, etc., the physical and mechanical properties of the stratum are highly variable;
The material permeability of the landslide body is good, and a large amount of precipitation permeates through the surface to increase the self-weight and sliding force of the landslide body;
Located in Anping Town on the right bank of the Yangtze River, near the Three Gorges Reservoir.
MJ14Leading edge of slide blocking section
FA35Landslide shear outlet
XP landslideGrade I Very Large Earth SlideGDA10068Leading edge of slide blocking section
Moderately weathered—strongly weathered marl and tuff dominate;
The front edge is continuously washed by the water of the Yangtze River and the mechanical properties of the whole slope are reduced;
The landslide is located on the left bank of the Yangtze River, near the densely populated market town of Anping Township.
GDA10077Index segment antecedents
GDA10057Leading and trailing edges of lower sliding section
XSP landslideThick layer traction-push downhill slidesFJ02Leading edge of slide blocking section
The slope is mainly composed of sandstone chalky clay and gravelly soil rocks;
The sudden cracking of the back edge of the slope soil caused by rainfall-induced landslides;
There are a few houses and roads around.
FJ03Index segment antecedents
FJ04Landslide shear outlet
HJWC landslideMedium cascading bedrock landslideFJ1002Leading edge of slide blocking section
Mainly composed of laminated mudstone, muddy siltstone, and sandy tuff;
Groundwater within the landslide area is mainly overburden pore water, influenced by atmospheric precipitation, with large seasonal variations;
Near the Three Gorges Reservoir, the main part of the new site of Shuanglong Town is located on this landslide body.
FJ1005
FJ1009
Table 2. Time-domain correlation model of regional rainfall and landslide deformation.
t φ t C o r t | T , t d F i t t | T , t d
M 1 T φ T C o r T > C o r t d F i t T > F i t t d
M 2 t d φ td C o r t d > C o r T F i t t d > F i t T
M 3 t d / C o r t < 0.4 F i t t < 0.4
Table 4. Table of quantitative analysis results of monitoring points in the landslide area.
Landslide AreaMonitoring Sites T t d   C o r T C o r t d   F i t T   F i t t d   M
TMS landslide12204800.67750.11620.75210.2236Consistency model
M 1
12354800.72170.21580.79560.2665
12435000.60220.35470.71420.2737
OT landslideMJ015800.69310.24220.80150.2483
MJ145800.78390.22160.86570.1157
FA355800.62360.31880.69340.2685
XP landslideGDA100685650.25740.64410.27480.7582Hysteresis model
M 2
GDA100775650.20310.71050.17780.7938
GDA103575650.18520.71900.18620.8114
XSP landslideFJ0249180.22760.72270.14210.8624
FJ0350210.21850.71950.14880.8473
FJ0452200.29390.61680.31620.7025
HJWC landslideFJ10022300.19130.18980.24830.2737Turbulence model M 3
FJ10051260.33950.31880.29260.1974
FJ100910100.06740.24830.17370.2454
Publisher’s Note: MDPI stays neutral with regard to jurisdictional claims in published maps and institutional affiliations.

