
Effects of Low-Carbon Visualizations in Landscape Design Based on Virtual Eye-Movement Behavior Preference


1
Virtual Landscape Design Laboratory, School of Art and Design, Wuhan Institute of Technology, Wuhan 430205, China
2
Urban Data Science Laboratory, Department of Landscape Architecture and Urban Planning, Texas A&M University, College Station, TX 77840, USA
3
School of Art, Hubei University, Wuhan 430062, China
4
Department of Earth Science and Geography, California State University, Dominguez Hills, Carson, CA 90747, USA
*
Author to whom correspondence should be addressed.
Land 2022, 11(6), 782; https://0-doi-org.brum.beds.ac.uk/10.3390/land11060782
Submission received: 18 March 2022
/
Revised: 18 May 2022
/
Accepted: 20 May 2022
/
Published: 25 May 2022
(This article belongs to the Special Issue 3D Geovisualization in Landscape Design)
Abstract
:Three-dimensional geovisualization in landscape design can be used to evaluate the efforts of mitigating CO2 emissions. This study evaluated subjects’ emotional preferences for 3D landscape design through an eye movement tracking experiment. In the case that the color of the building materials was positively correlated with low carbon emissions, green, blue, and gray were typical representatives of low carbon emissions. Through the eye movement tracking experiment, subjects’ emotional preferences for different building colors were obtained. The results show that the fixation trajectory is consistent with the preset green and energy saving parameters, and the design effect of the architectural landscape can be evaluated by detecting virtual eye movement tracking. There is a coupling relationship between virtual eye movement tracking, expert interviews, and evaluation results, so that it presents a logical relationship between virtual eye movement, the color of low-carbon materials, and carbon emissions. In addition, the affective preference analysis and entropy weight method confirmed their effectiveness in the evaluation of the 3D landscape design effect, which had a positive impact on the CO2 emission reduction of the construction industry. These results will contribute to the development of 3D landscape design in the architecture industry and provide new ideas and methods for the carbon peak project.
1. Introduction
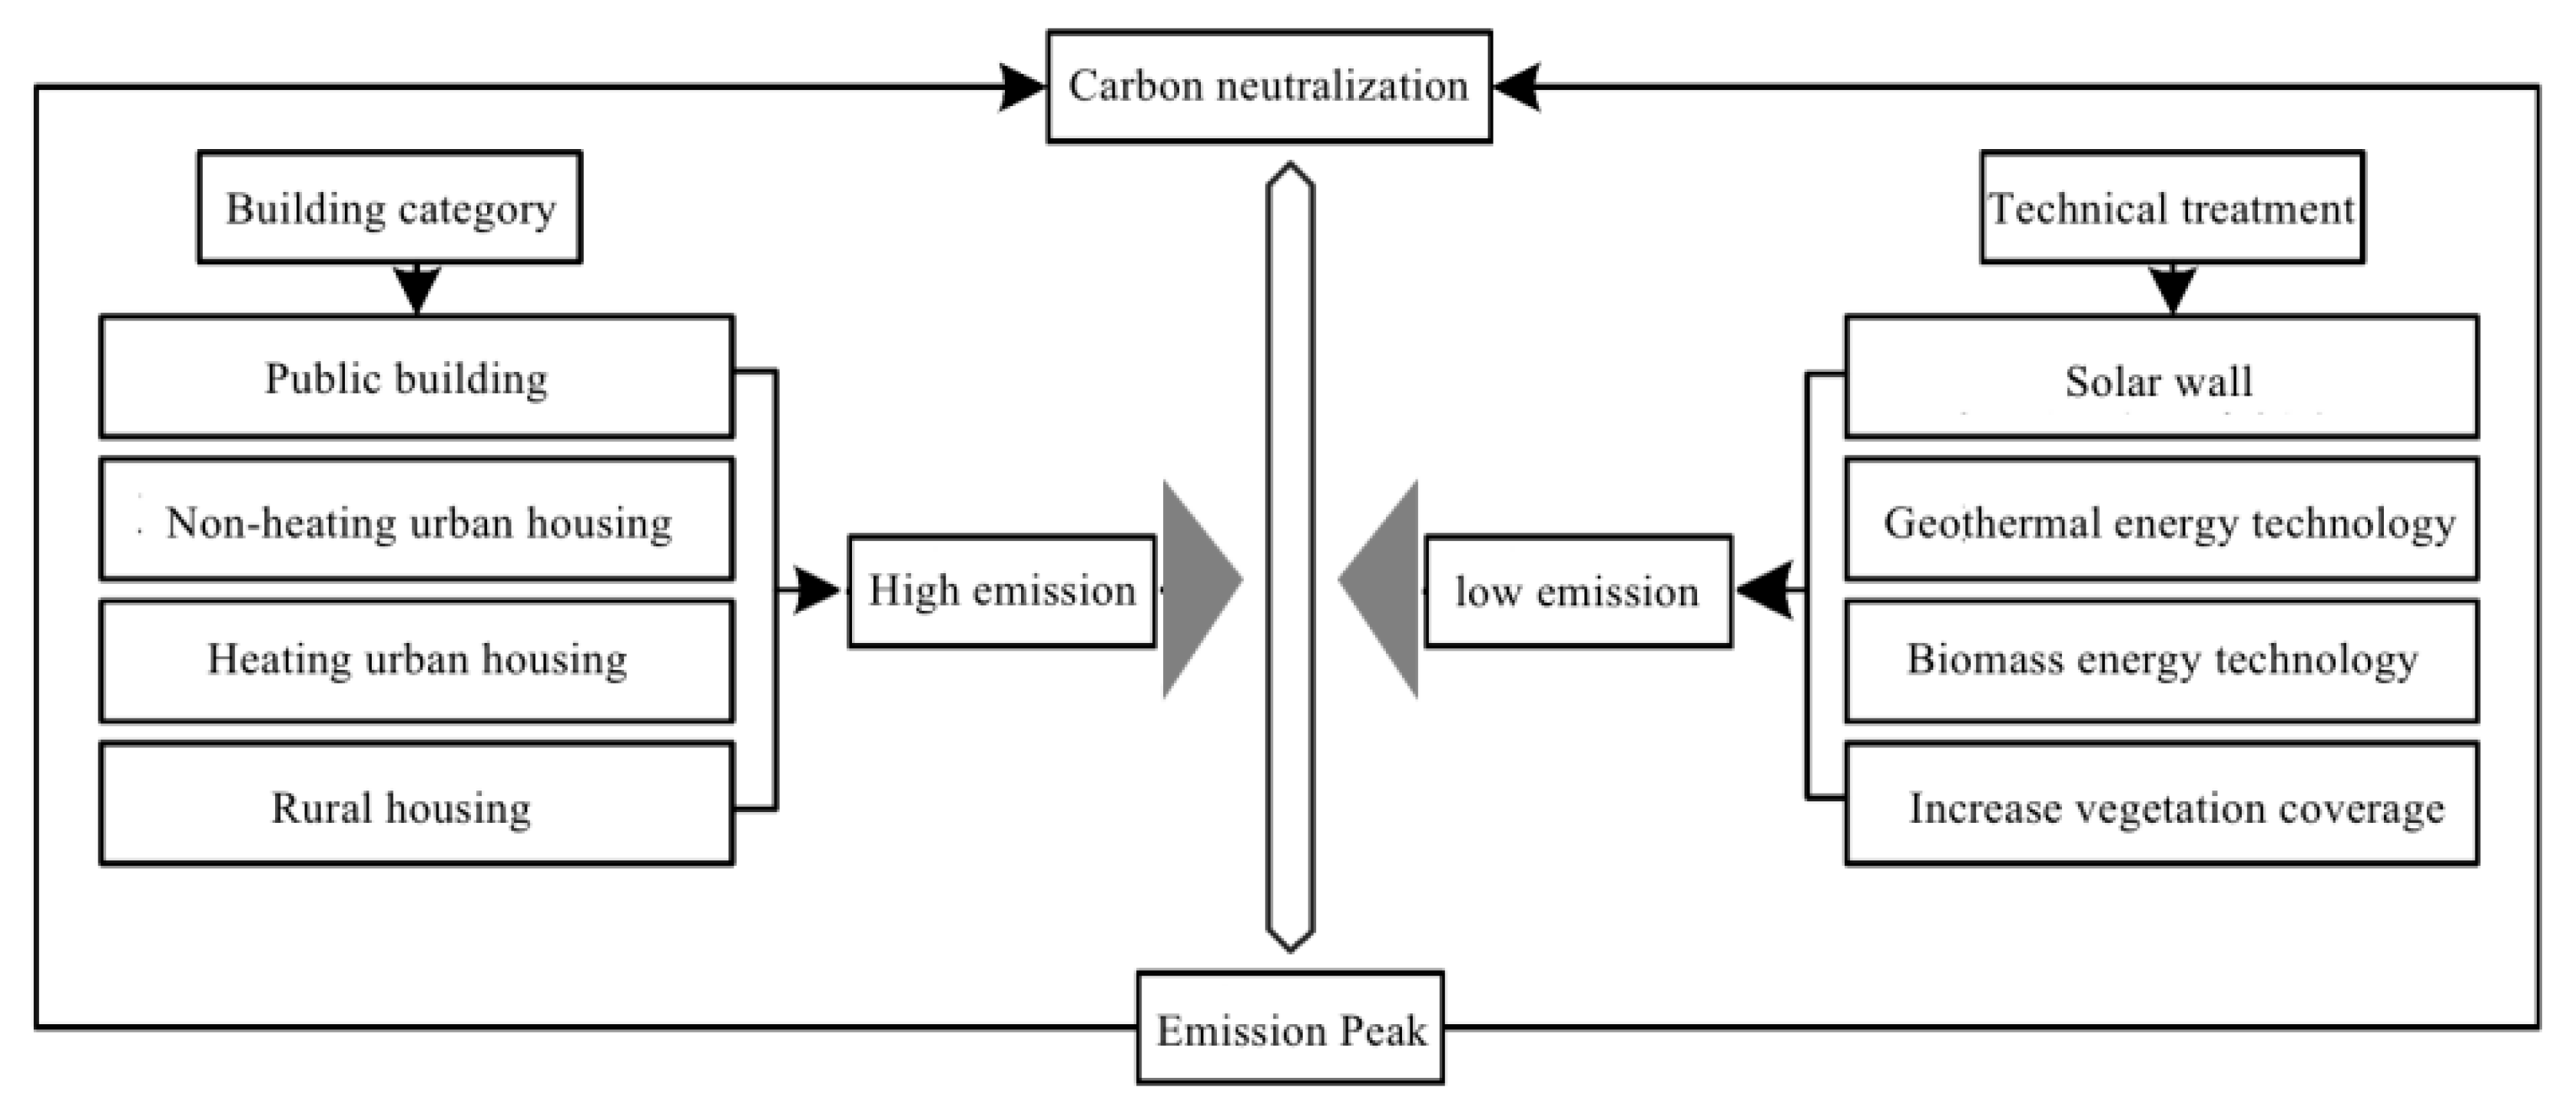
During the general debate of the 75th session of the United Nations General Assembly, China announced an ambitious plan to peak carbon dioxide emissions by 2030 and become carbon neutral by 2060. China aims to form collective actions for sustainable development and green lifestyles, as well as aiming to promote the construction of “ecological civilization” and “beautiful China” [1,2,3,4]. Excessive emissions of carbon dioxide are a serious and urgent problem. The key to addressing climate change is to “control carbon emissions”, and the path must be to achieve peak CO2 emissions and then carbon neutrality [5,6,7,8]. The construction industry, which takes up about 36% and 39% of annual global energy consumption and carbon emissions, respectively, is a key area for carbon emission reduction [9]. China tops the world in terms of CO2 emission peaks, accounting for about 30%, whereas the construction industry sits second among its three other major sector counterparts (i.e., energy, transport, and life) in terms of carbon emissions [10,11]. The progress toward completing the CO2 emissions peaking task by 2030 looks grim. According to statistics, CO2 emissions peaking in 2018 reached approx. 2.1 billion tons, taking up about 20% of total emissions nationwide [12,13,14,15]. The primary task of green building design is to ensure the effective application of 3D landscape technology [16,17,18]. Firstly, the application of 3D landscape design can avoid the problems caused by the lack of energy and eliminate the impact of landscape design on the natural environment. For engineering and construction design, it should provide the air needed, control carbon dioxide emissions, protect the natural environment, and avoid environmental pollution [19,20]. Secondly, 3D landscape design can apply solar walls to enhance the insulation of engineering construction and reduce energy losses, thus, geothermal energy technology and biomass energy technology should be proactively introduced [21,22]. Moreover, establishing a resource recycling system through geothermal energy in 3D landscape design can meet the basic needs of energy use and avoid the waste of energy resources [23]. Finally, bio-intelligence technology can be used to design an energy and material recycle and reuse system and transform all the waste produced in the 3D landscape design process into recyclable resources, so as to achieve the goal of carbon peaking and ultimately achieve the great vision of carbon neutrality [24,25], as shown in Figure 1.
The implementation of dual carbon planning is a complex system, and in addition to the guidance of traditional methods, it is necessary to introduce new technical means to update the system [28,29,30,31]. VR technology can be applied to the field of building design and community planning [32]. Some scholars use VR technology to build a prototype framework for carbon emissions prediction, simulate the carbon emissions of each construction operation, and explore strategies to reduce carbon emissions of the construction industry [33]. Virtual eye-tracking tracks eye movements by locating eye fixation points or eye movements relative to the head using the principle of the infrared reflective [34]. Through the synchronous recording of the 3D spatial location of eyes/head, fixation duration, pupil size, blinking count, eyelid twitching, eyelid closure, and various other data, the eye-tracking technology identifies factors that attract people’s attention, investigates the visual means through which people perceive their surroundings, and analyzes the driving factors of people’s decision-making. These allow the natural reactions unaffected by the awareness of either the subjects or the examiners to be captured before eventually being recorded and feedback is given in real time [35,36].
The evaluation methods for the visual preferences for design schemes include the entropy method, the analytic hierarchy process, and the principal component analysis method [37,38,39,40]. The analytic hierarchy process involves qualitative and quantitative analysis, and can tackle numerous practical problems that cannot be solved with traditional optimization techniques. It allows the decision makers and decision analysts to communicate with each other, thus improving the decision-making process. The principal component analysis method obtains the relationship between the factor variable and the original variable by rotating the factor matrix. A comprehensive evaluation value is offered, with the variance contribution rate of principal components as the weight.
The research of applying virtual eye-tracking to achieve the carbon summit target is still in the early stages, which is mainly reflected in the following aspects: (1) Theoretical research is still in its infancy. Since 2020, this is a landmark announcement as China has set out an ultimate end-point emissions target, and only a few researchers have engaged in the theoretical exploration of VR technology and emission peak plan. Nevertheless, there is still a long way in terms of moving on from the implementation of practical cases [41]. (2) The research method has not yet formed a complete evaluation system. Virtual eye-tracking and the concept of carbon peak are still emerging fields in recent years. Until now there has not yet been a consensus among scholars about the national assessment standards and conceptual framework, which leads to the demonstration period of carbon peak building design based on virtual eye-tracking [42,43]. (3) Endogenous opportunity and macro policy support are insufficient. Three-dimensional landscape design will take more vigorous and effective approaches when pursuing an interdisciplinary integrated system, which is made up of ecology, naturalization, design, and building theories. A lot of research and demonstration are needed to form a complete endogenous opportunity and macro policy [44].
In the conclusion, we suggest that: (1) virtual eye-tracking experiments are utilized throughout the 3D landscape stage to determine the optimal design schemes, so as to facilitate the achievement of the low carbon emissions effect in the green building; (2) that virtual eye-tracking is utilized to evaluate the visual preferences of the 3D landscape design effect, and verifies the feasibility and timeliness of the evaluation method; therefore, this paper intends to use the eye-movement tracking data in VR technology to evaluate the design effect of low-carbon buildings, and introduce the stress color emotion characteristic experiment that represents the concept of low-carbon to test the feasibility of the design effect of low-carbon buildings, so as to provide a new concept and method for carbon peak action plan.
2. Materials and Methods
2.1. Study Area
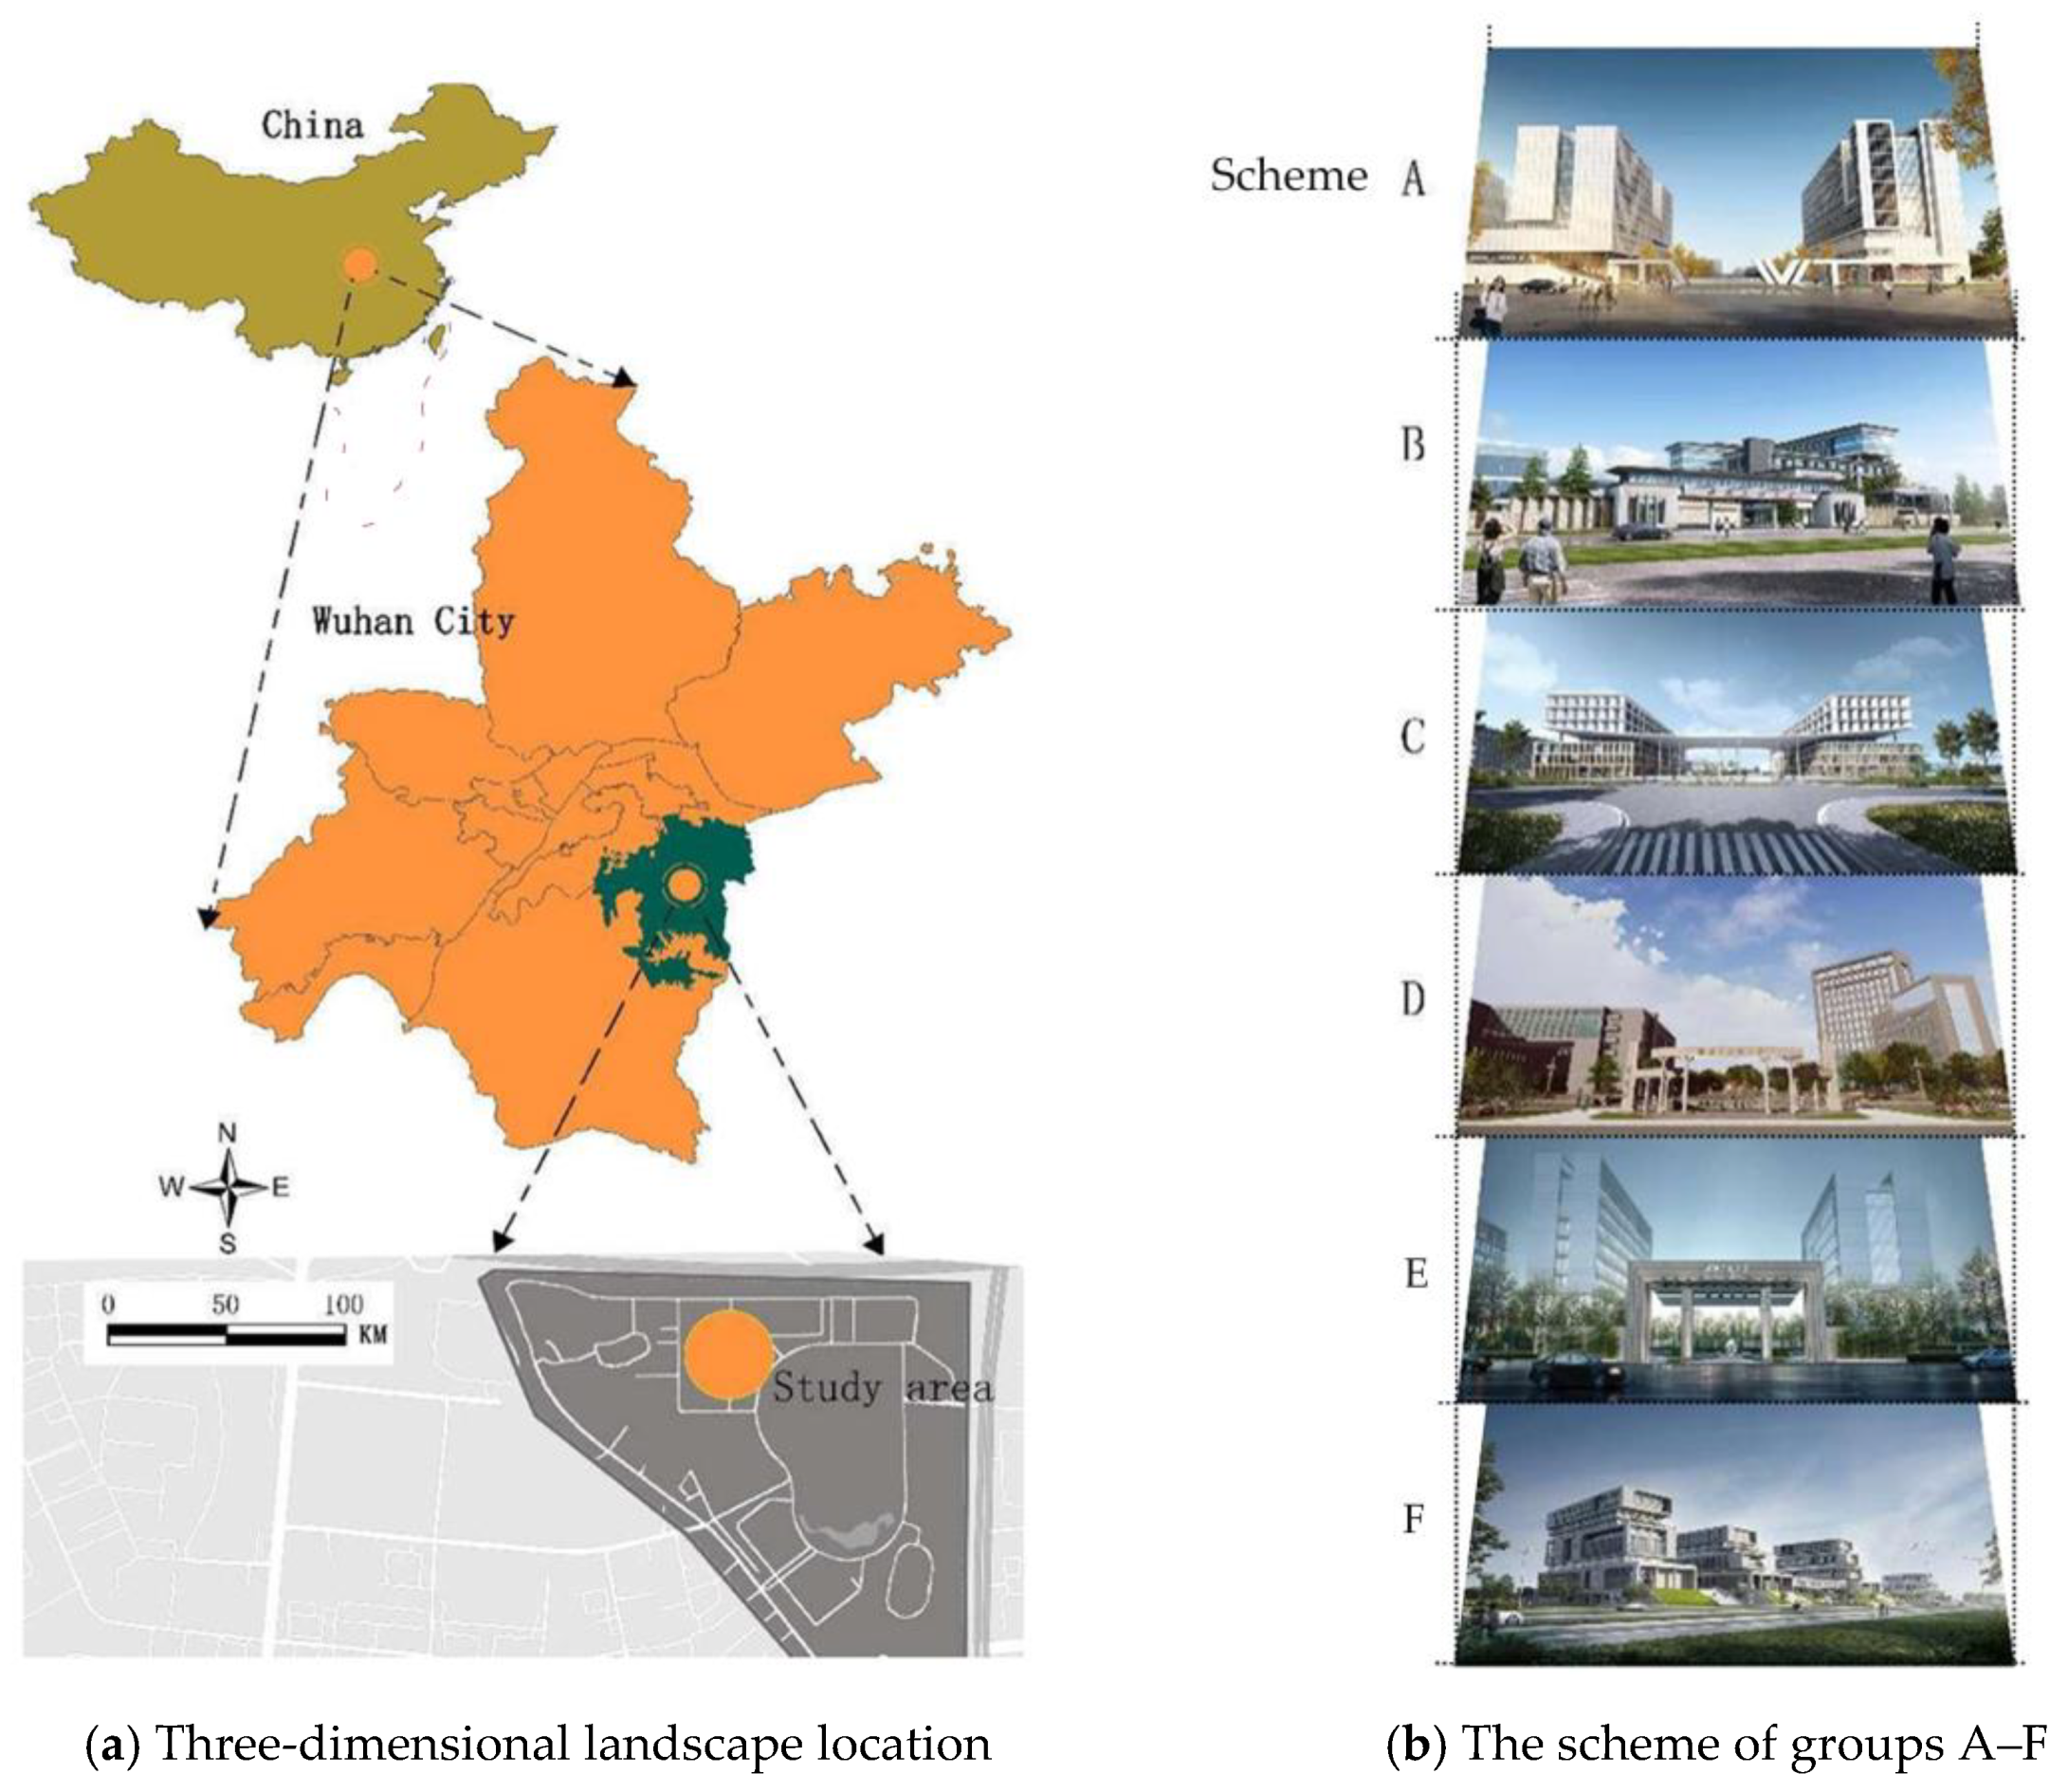
This research selected the design of a museum in Wuhan, Hubei Province of China as the case study. The preliminary field survey found that the design of this museum advocates the principles of green, environmental protection and sustainability, and it invited bids for the design for the museum worldwide. A total of 15 design firms signed up for the bidding. Experts in the field of 3D landscape design reviewed the conceptual design schemes and determined that the top six candidates submitted six design schemes as candidate schemes, as shown in Figure 2.
The thermal conductivity coefficient, building density, and green space ratio mentioned in this paper are provided by the bidding design company. Thermal conductivity refers to the thermal conductivity of a 1 m cross-sectional area within 1 h in a stable thermal conductivity state when the thickness of the material is 1 m, the temperature difference between the two surfaces is 1 C, the main indicator is the thermal conductivity of the material, and another important parameter is also the measurement of the thermal insulation performance—the smaller the value, the better the thermal insulation effect [45]. Building density refers to the coverage rate of buildings, specifically the ratio between the total base area of all buildings within the scope of project land and the area of planned construction land [46]. Green land ratio refers to the ratio between the green space area within the scope of planned construction land and the area of planned construction land [47].
According to the different properties of the internal functions of the 3D landscape, the floor area ratio, thermal conductivity coefficient, and green area ratio of the 3D landscape project in scheme A are controlled at 2.20, 0.93, and 38.30, respectively, which takes green, ecological, and energy-saving concepts into full consideration to achieve the harmony and integration between people, and between humans and nature. The 3D landscape style of scheme B adheres to the basic principle of integration with the overall style of the old Wuhan, retaining the red brick walls of the original landscape to maintain the spirit of the place. The floor area ratio, thermal conductivity coefficient, and green area ratio of the landscape project are controlled at 0.92, 11.32, 34.19, respectively. In scheme C, the 3D landscape adopts an enclosed layout, which fits into the texture of the site. The space is enclosed, yet not blocked. The interior and exterior are interwoven. The floor area ratio, thermal conductivity coefficient, and green area ratio of the landscape project are controlled at 10.07, 29, 1.60, respectively. The illusory space set inside scheme D makes people feel as if they were in a scene of steep canyon and ravine. The floor area ratio, thermal conductivity coefficient, and green area ratio of the landscape project are controlled at 0.81, 13.5, 35, respectively. Scheme E reflects the overall 3D landscape style in a simple, pragmatic, harmonious, solemn, and comfortable manner, and it pursues a kind of modern rhyme. The floor area ratio, thermal conductivity coefficient, and green area ratio of the landscape project are controlled at 10.2, 21.6, 1.23, respectively. In scheme F, multiple 3D landscape courtyards are formed through enclosed spaces and semi-enclosed spaces. The floor area ratio, thermal conductivity coefficient, and green area ratio of the landscape project are controlled at 0.23, 9.37, 35.50, respectively, as shown in Table 1.
According to the selection procedures for these design schemes, although opinions and suggestions from experts in building planning at home and abroad were extensively solicited, and taking cost reduction into consideration, experts were also invited to have a virtual immersion experience so as to choose the optimal scheme from the perspective of VR technology.
2.2. Data Sources
- (1)
- Experimental Study on Behavior Preference: According to the literature retrieval, the combination of VR and the ErgoLAB human–machine environment synchronized (ErgoLAB) the platform for test experiments that can visualize the subjects’ eye-movement tracking data. It is conducive for monitoring the green and 3D landscape effects of different schemes, so as to improve the 3D landscape monitoring efficiency of the whole process from design to construction to operation [48,49,50,51].
- (2)
- Experiment Hypotheses: In order to explore the positive impact of virtual eye-movement behavior, a preference experiment on the green and 3D landscape effects of design schemes was conducted. This paper conducts research on these schemes, and the following hypotheses are proposed.
Hypothesis 1 (H1).
The subjects with different job roles have a psychological preference for the 3D landscape design effects of different schemes. According to the parameters, such as the thermal conductivity coefficient, specific heat capacity, and volume ratio, obvious instructions were set to obtain the psychological response of the subjects to the variables of design schemes, thereby obtaining their motivation to select the optimal scheme.
Hypothesis 2 (H2).
The saccadic trajectory distribution of the subjects is basically consistent with the advantages and disadvantages of the preset green and 3D landscape control parameter values of the design schemes, reflecting that the degree of visual behavioral preference of the subjects is positively correlated with the green and 3D landscape effect of the schemes.
Hypothesis 3 (H3).
The evaluation method based on the degree of visual behavior preference of virtual eye movement can be used to monitor the schemes and enrich the implementation of theCO2 emissions peaking plan in the 3D landscape sector.
- (3)
- Experimental Design. This paper explores whether a virtual eye-tracking experiment has a positive impact on the selection of schemes. The experiment adopted a single-factor and two-level (high interest and low interest) design between the subjects. The subjects referred to the green and 3D landscape parameter values set in the design schemes. The subjects were divided into an experimental group and control group for an independent reading of the design schemes, respectively, and the virtual eye-movement tracking data with high interest or low interest were obtained. The experimental group included the subjects in the virtual eye-movement tracking experiment. The control group included the expert interviewers after the experiment. The goal of this experimental design is to use the virtual eye-movement behavior preference degree to evaluate design schemes. In addition, the experimental group aims to obtain participants’ emotional preferences for low-carbon building colors by detecting eye movement data. Expert interviews in the control group were conducted to assist the experimental group in the study of the carbon emission effect. According to evidence in the literature, it was found that the color of building materials was correlated with low-carbon building emissions [52,53], so as to present a logical relationship between virtual eye movement, the color of low-carbon materials, and carbon emissions.
- (4)
- Subjects and Materials. Design of the Subjects: Based on the preliminary interviews, 40 3D landscape design experts, scholars, and workers were randomly invited from the research area as the subjects, with an average age of 35 ± 2, and a male/female ratio of 1:1. All subjects had an uncorrected or corrected visual acuity of 5.0 or above, and no symptoms of color blindness or weakness. All were right-handed. Twenty subjects were randomly assigned to the experimental group, and twenty to the control group, and they had not previously participated in any virtual eye-movement related experiments. To avoid the impact of familiarity on experimental accuracy, all subjects were required to have practical experience in design scheme, construction, post maintenance, and so on. Before the experiment, the subjects were informed that they might experience dizziness and they signed the informed consent form.
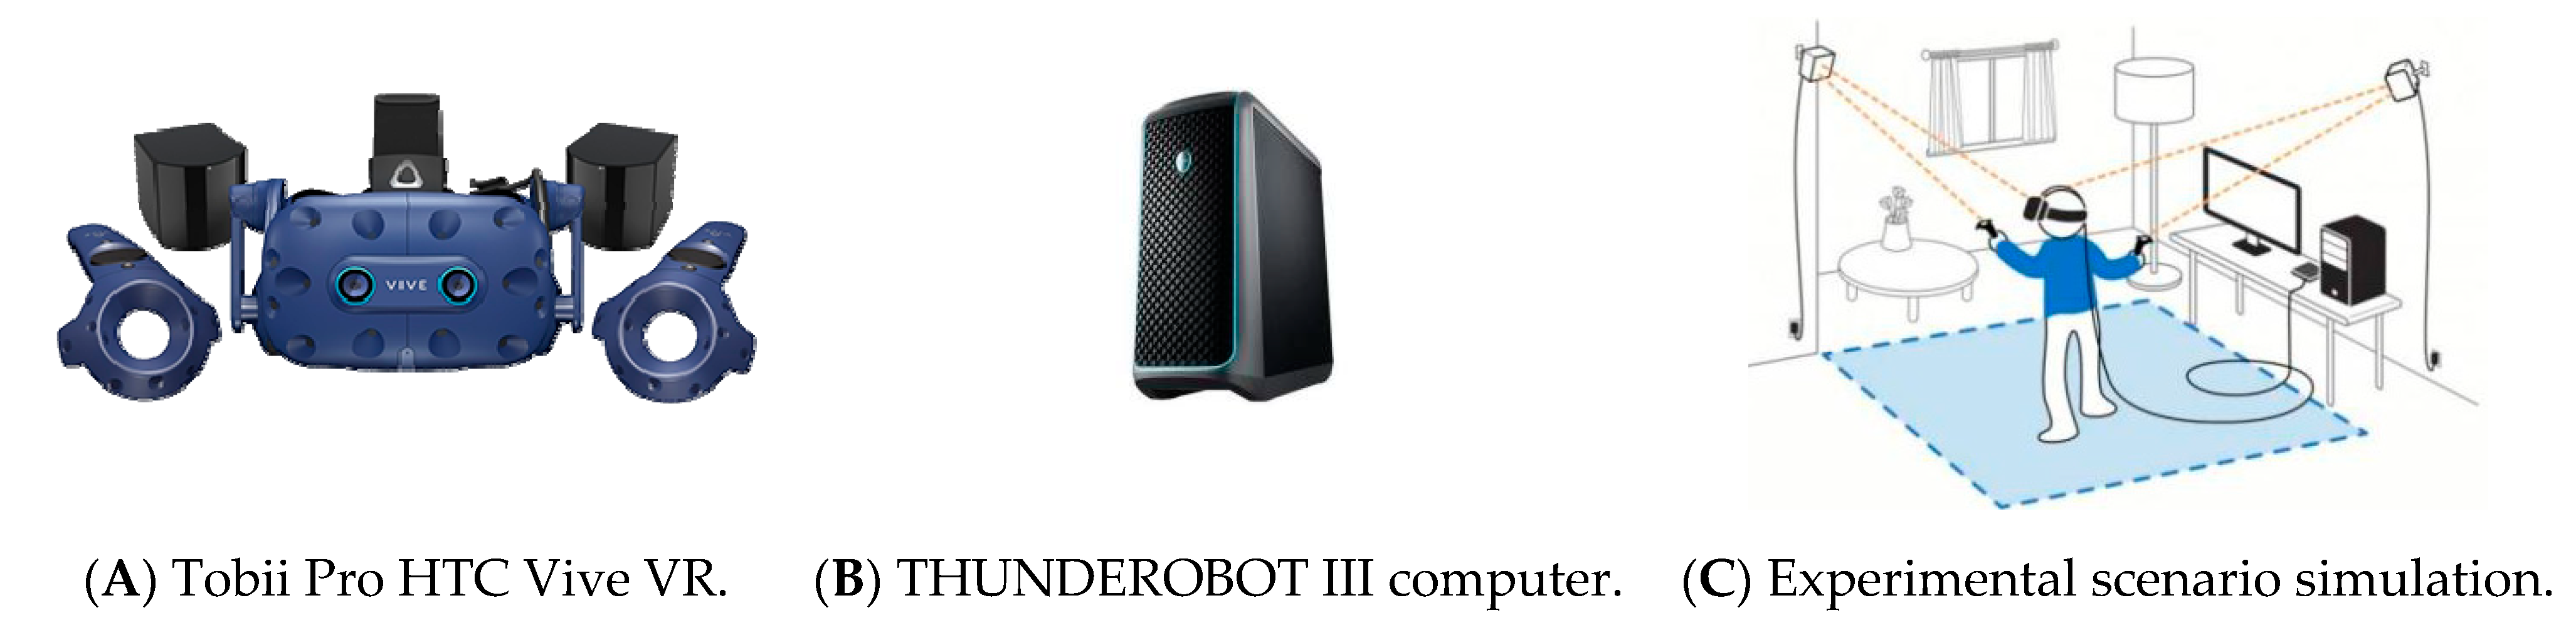
Experimental Equipment: The experimental instruments were a Tobii X2-30 virtual eye-tracker from Sweden, which contained two 120 Hz eye-tracking lenses with a viewing angle of 110° and an accuracy of 0.5–1.1°, and a HUNDEROBOT III computer operating platform. The experimental platform was the ErgoLAB developed by Beijing KINGFAR Technology Co., Ltd., which is the experiment shown in Figure 3. The hardware and software operated coordinately to ensure the scientific assessment of the 3D landscape effect evaluation in the schemes [33].
Stimulus Material: In accordance with the implementation of the standards of the National Emissions Peaking Initiative, 3D Max software and BIM modeling were employed to extract the virtual renderings of 3D landscapes and junctions, and output a total of 120 pieces of image data in 20 groups with 1920x1200 pixels and 300 dpi, in order to guarantee a comfortable gaze distance for the subjects when answering questions on visual behavioral preference and spatial perception.
Questionnaire Material: The experimental questionnaire was set as a post-experiment questionnaire to ensure that the subjects had the memory of design schemes A–F. The content of the questionnaire was derived from the green and 3D landscape parameter control goal. The five-grade marking system using a Likert scale (the numerical value from high to low respectively corresponding to: like very much, like, do not like very much, dislike, and so on.) was adopted to analyze the subjects’ different degrees of appreciation of the 3D landscape design schemes on the ErgoLAB platform, and the content validity proved the scientific nature of the questionnaire survey data. The questionnaire basically reflected the tested content while containing good content validity.
- (5)
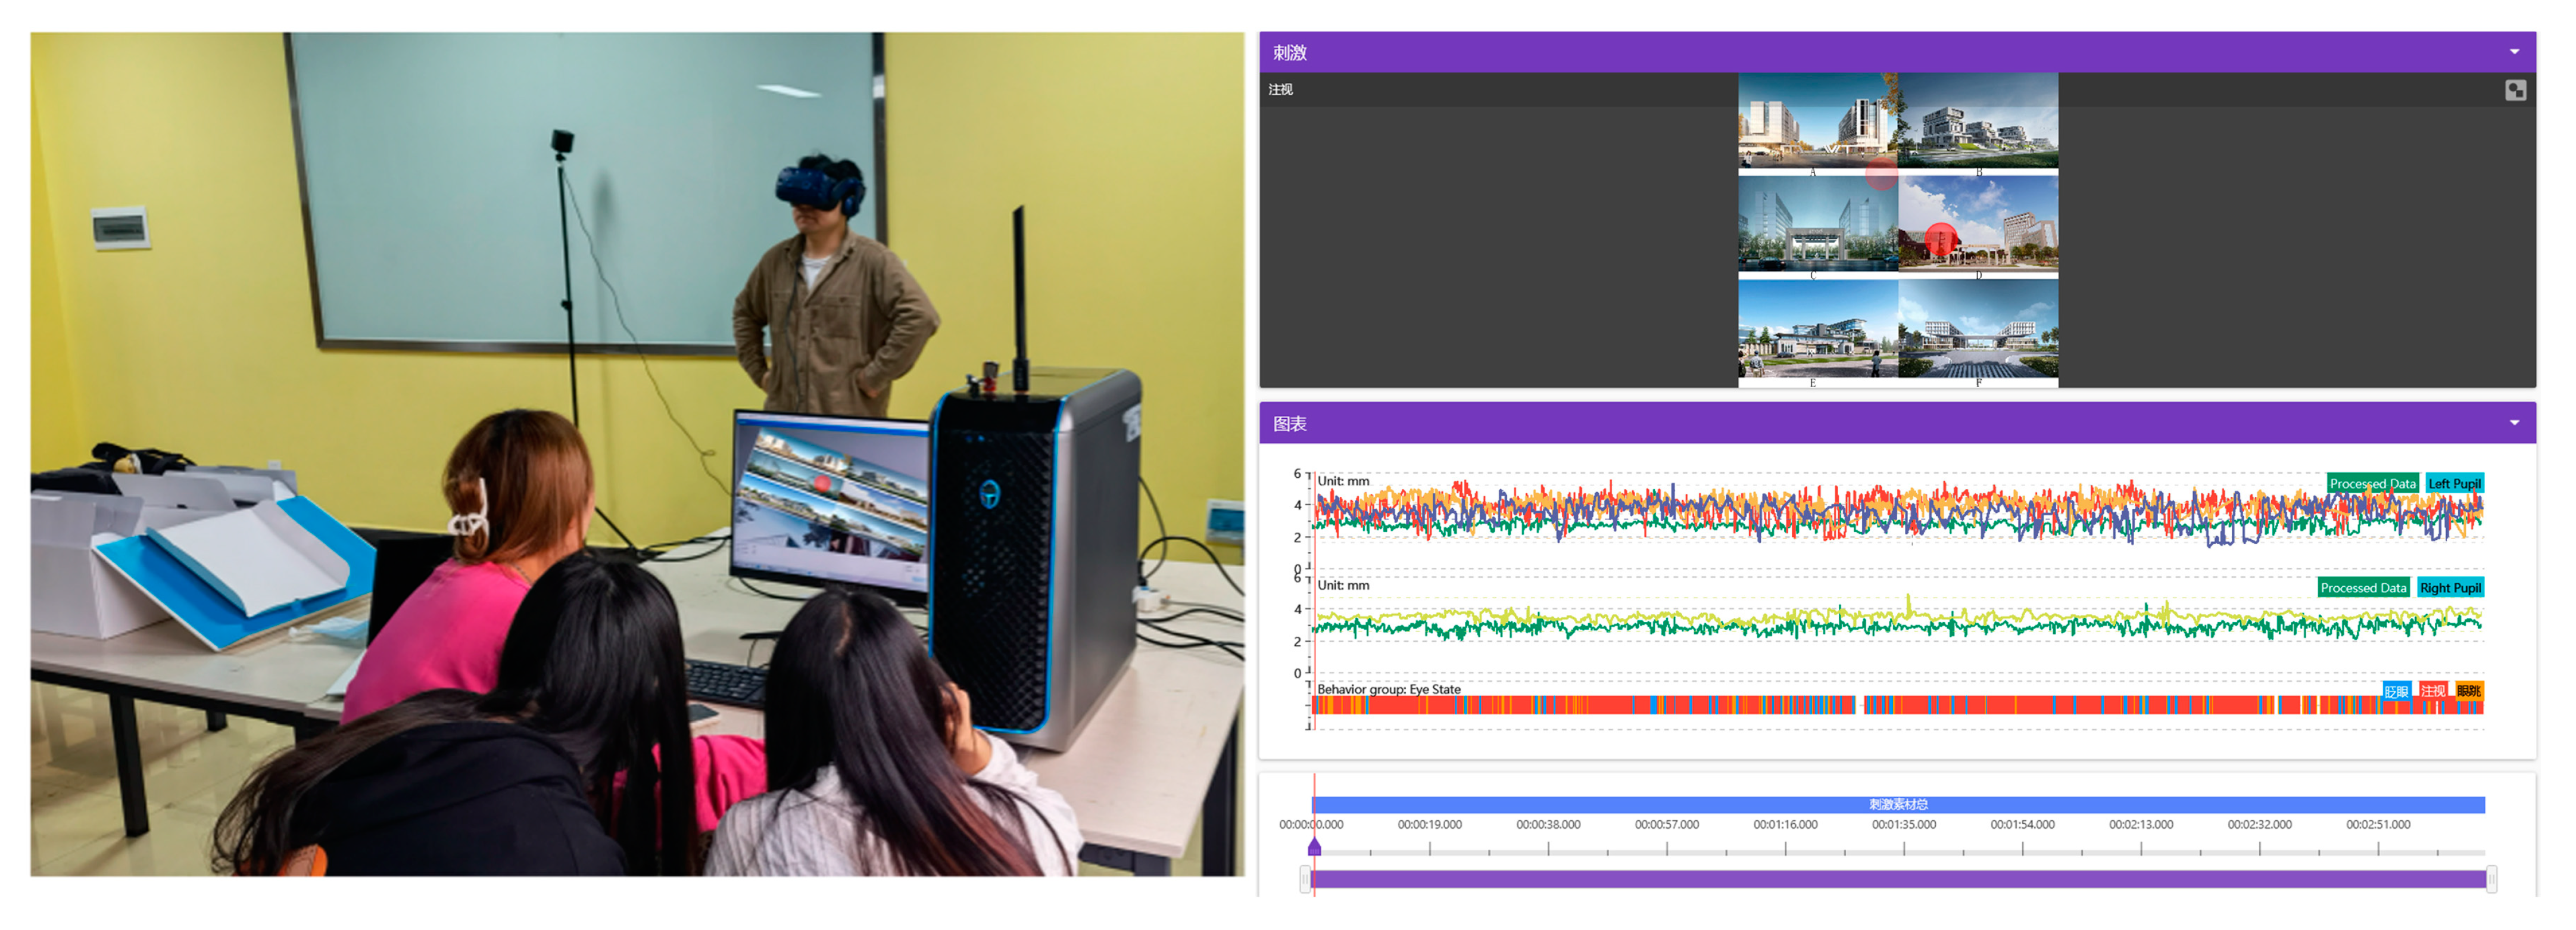
- Experimental Process and Settings. All subjects were invited to the site by the head of the experiment to familiarize themselves with the experimental environment, process, instructions, and so on, to ensure the accuracy and reliability of the experimental process and to eliminate possible interferences. Before the experiment, the instructions (technical parameters of the design schemes) were practiced repeatedly so that the subjects could be immersed in the experiment within a shorter period of time, and their anxiety, excitement and other emotions could be alleviated. The experimental scene was shown in Figure 4. The whole experimental process was divided into three stages: the pre-experiment stage, the experiment stage, and the post-experiment stage.
Pre-experiment Stage: First, all subjects filled in the demographic information (including gender and age) and were divided into different groups by their job attributes. Then, all the devices were calibrated on the ErgoLAB platform to ensure that the error margin of 5 viewpoints was within 20 pixels. Once the mapping function generated by the eye-movement parameters had been determined, the test could be started. The test time was set to 1 min to guarantee the integrity of the experimental procedure.
Experiment Stage: During the experiment, the head of the experiment asked the subjects to recognize and read the stimulus material (video) for 3 min independently in accordance with the instructions, and then they recorded their virtual eye-movement parameters in real time and mapped the faze points. The above steps were repeated until all 20 subjects completed the experiment.
Post-experiment Stage: The head of the experiment imported the experimental data into Excel and eliminated one piece of data with a larger error to obtain 19 saccades tracking data. Subsequently, SPSS 21 was used to analyze the reliability of the experimental data and the control data. The experimental results showed the Kronbach coefficient (α) = 0.882, KMO = 0.767, confirming that the subjective questionnaire results were statistically significant.
- (6)
- Analysis of Experimental Results: Comparison of behavioral preference degree of the subjects. It aims to investigate whether there is a significant psychological difference in the degree of behavioral preference for green and 3D landscape effects. The score of behavioral preference for green and 3D landscape design was taken as the dependent variable, and saccades tracking times were taken as the independent variable to conduct the independent sample T test. The results showed that the scores of the two groups were different in the degree of behavioral preference (p = 0.171 > 0.05). This finding indicates that the scores of the two groups of subjects in the degree of behavioral preference are not statistically significant and are comparable.
A comparison of the behavioral preference degree on the 3D landscape design effect took place. In order to determine the influence of the behavioral preference degree of the subjects with regard to the design schemes, the behavioral preference degree of the two groups of subjects was calculated, and the results showed that there was no statistical significance in the average saccades’ tracking times in the experimental group (p = 0.141 > 0.05). In the control group, the average level of behavioral preference with a behavioral preference was higher than that without a behavioral preference (p = 0.037 < 0.05), as shown in Table 2. The experimental results showed that the behavioral preferences of the subjects in the virtual eye-movement situation could increase the awareness and understanding of the 3D landscape design effect, verifying the positive impact of the virtual eye-movement behavioral preference experiment on the 3D landscape design effect. Thus, the hypotheses are valid; however, the influence of virtual eye-movement behavior preference on different design schemes is still unknown, and needs further analysis and verification for future exploration.
2.3. Data Analysis
2.3.1. Evaluation Indicators
In the research ranking the 3D landscape design schemes, the visual preferences are most related to the subjects and the design schemes. This research selects 21 virtual eye-tracking indicators, among which, 8 are virtual eye-tracking fixation indicators, 8 are virtual eye-tracking gaze indicators, 3 are pupil diameter indicators, and 2 are virtual eye-tracking experiment indicators, as shown in Table 3.
2.3.2. Evaluation Method Selection and Weight Analysis
The entropy method determines the discrete degree of an indicator based on the entropy value [54,55]. The smaller the entropy value, the greater the discrete degree and impact on the evaluation results of the indicator; therefore, in order to ensure the objectivity and impartiality of the evaluation index calculation, this study combines the entropy method and analytic hierarchy process to form a more comprehensive entropy weight analysis method to calculate the index weight value [56,57].
In the analytical process of index weight, m (the number of evaluation schemes) = 6, n (the number of evaluation indicators) = 21, and Xij represents the experimental result data for a specific scheme and evaluation indicator. As the indicators vary in dimensions and quantities, it is necessary to standardize the initial data of the indicators. The method to standardize Yij is shown as below:
The smaller the result of Formula (1), the better the effect. The greater the result of Formula (2), the better the effect. The ratio fij of the indicator value of the i-th indicator for the j-th design scheme.
Define the entropy value of the i-th indicator and calculate the entropy weight wi of the i-th indicator with the entropy weight method. The formula is shown as below:
By combining the objective weight evaluation results of the entropy weight method and the evaluation results Wi of the analytic hierarchy process method, the comprehensive weighting ui is obtained, thus enhancing the accuracy of the weight.
2.3.3. The Ranking of the 3D Landscape Design Schemes
By combining the objective weight evaluation results of the entropy weight method and the evaluation results Wi of the analytic hierarchy process method, the accuracy of the weight is enhanced [48]. The operation steps are shown below:
3. Results
3.1. Tracked Saccade Trajectories Are Consistent with the Green Energy-Saving Control Parameters Preset
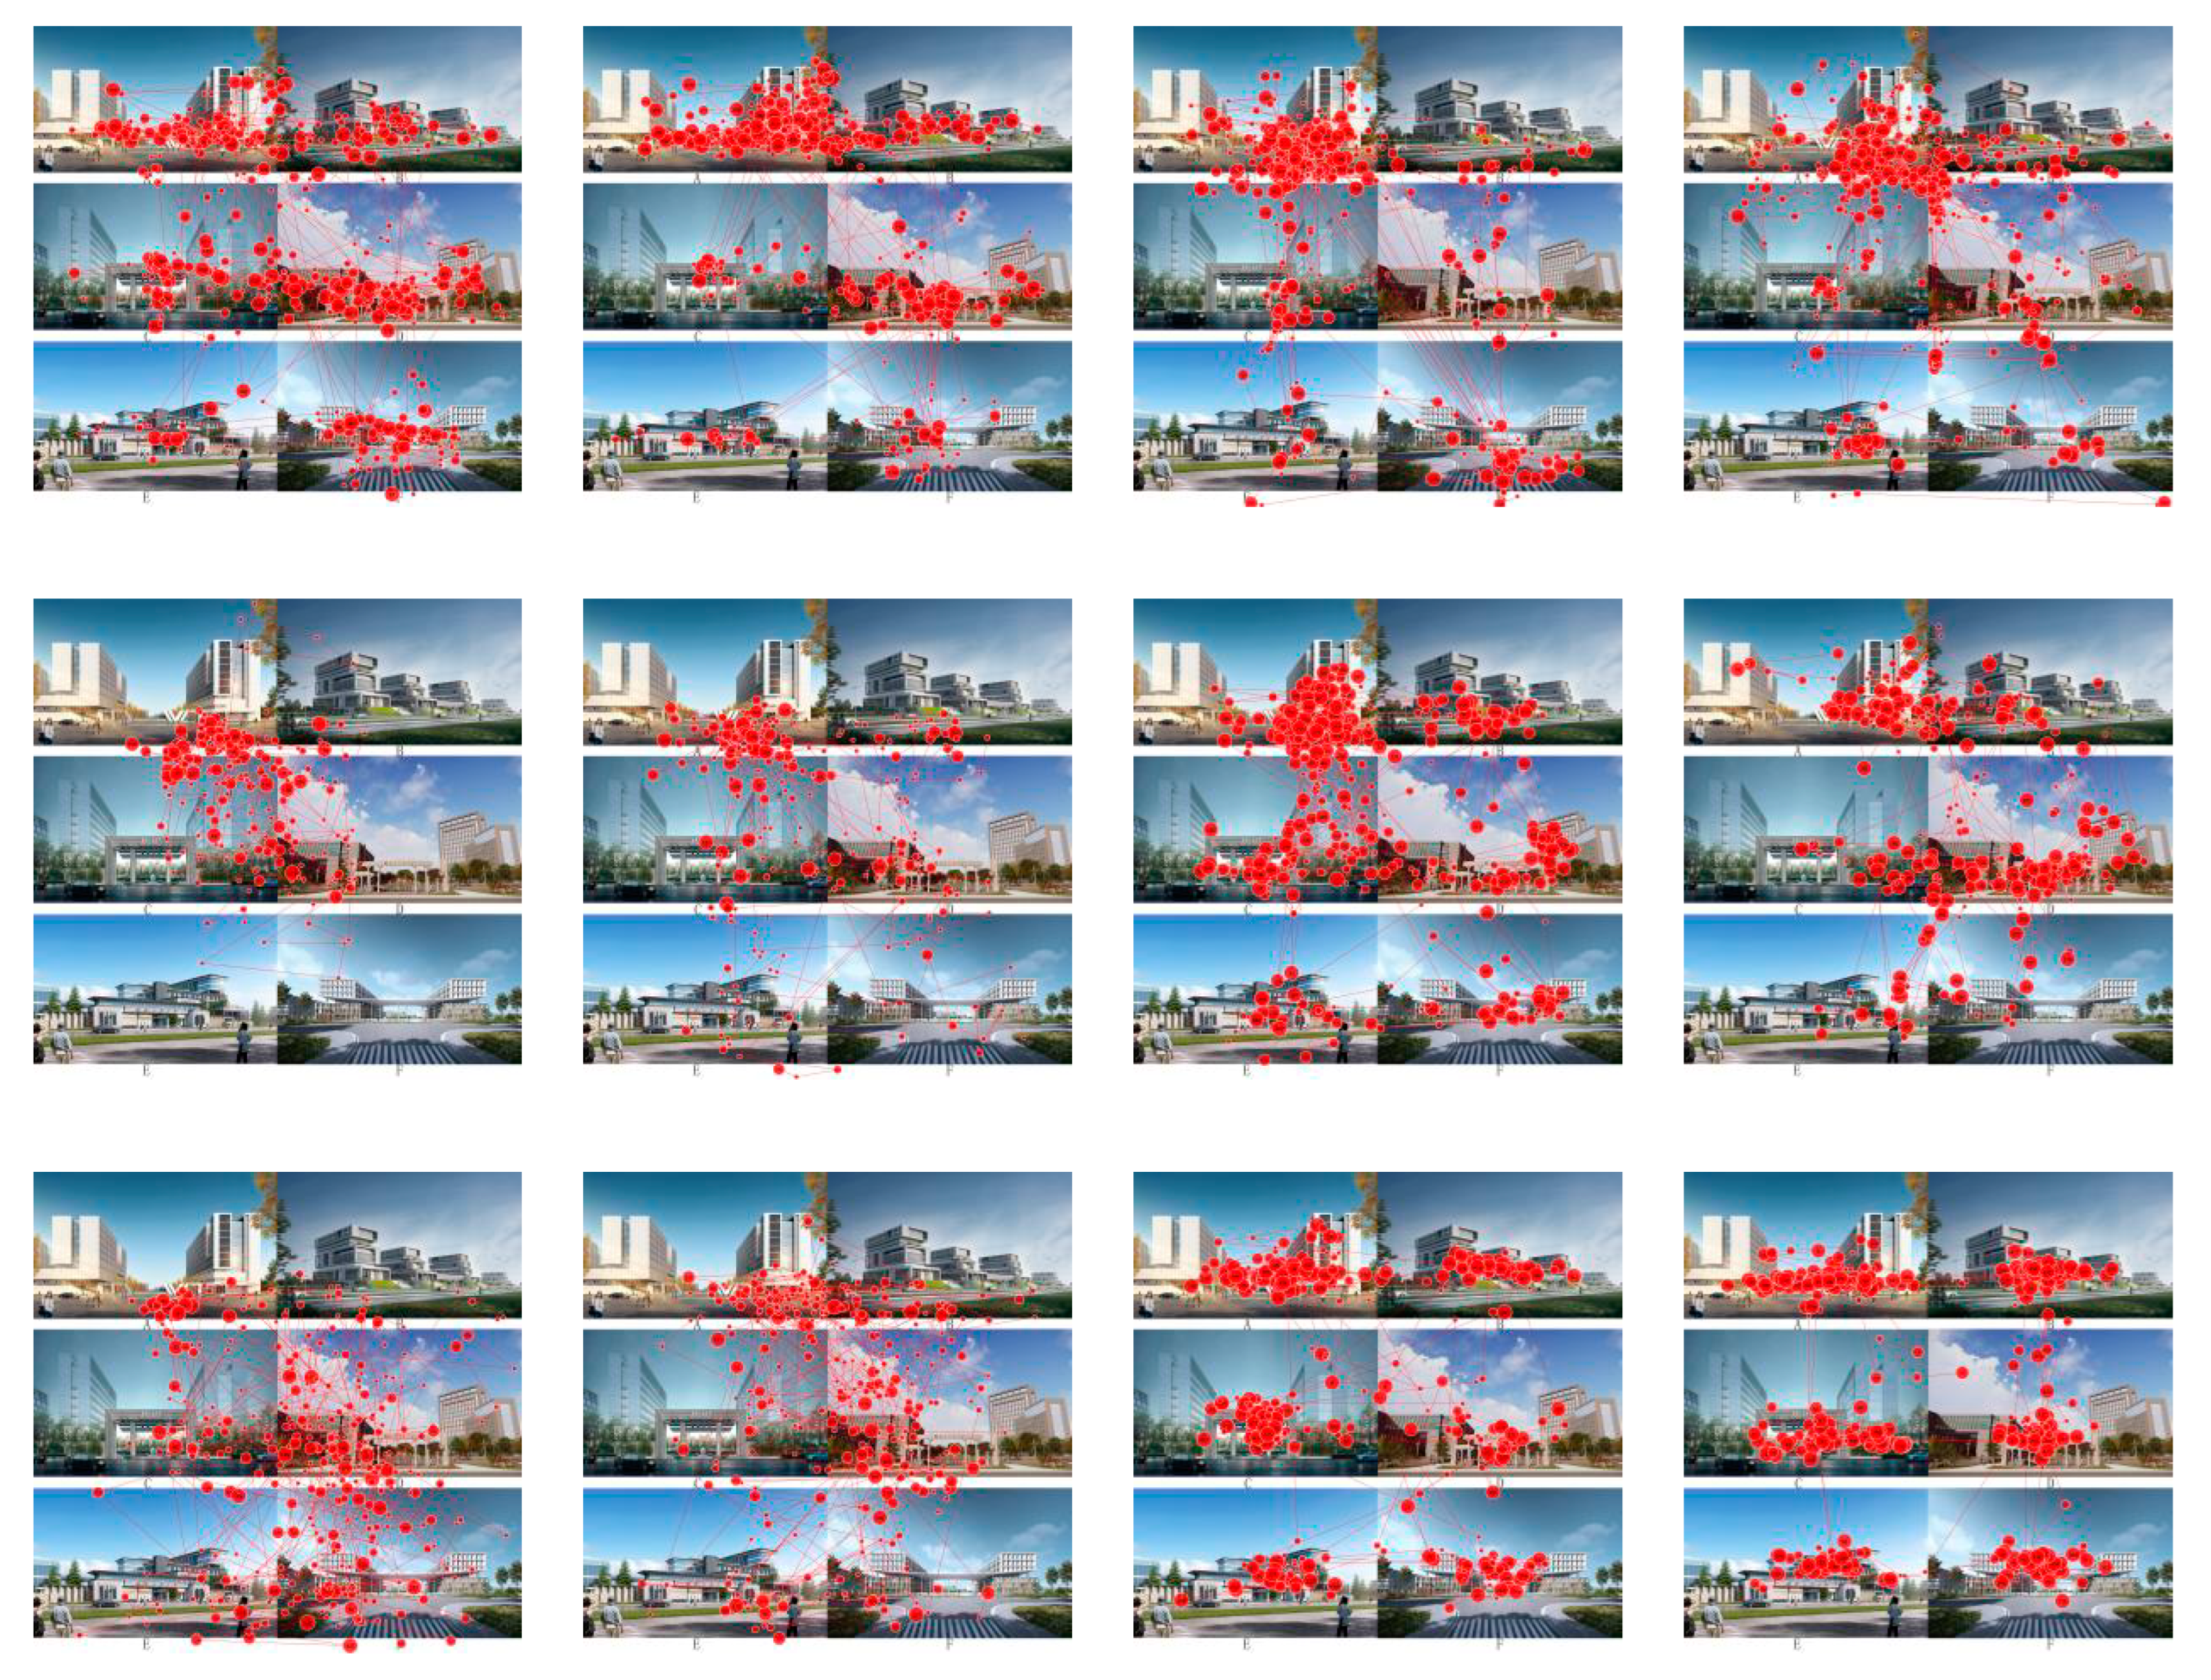
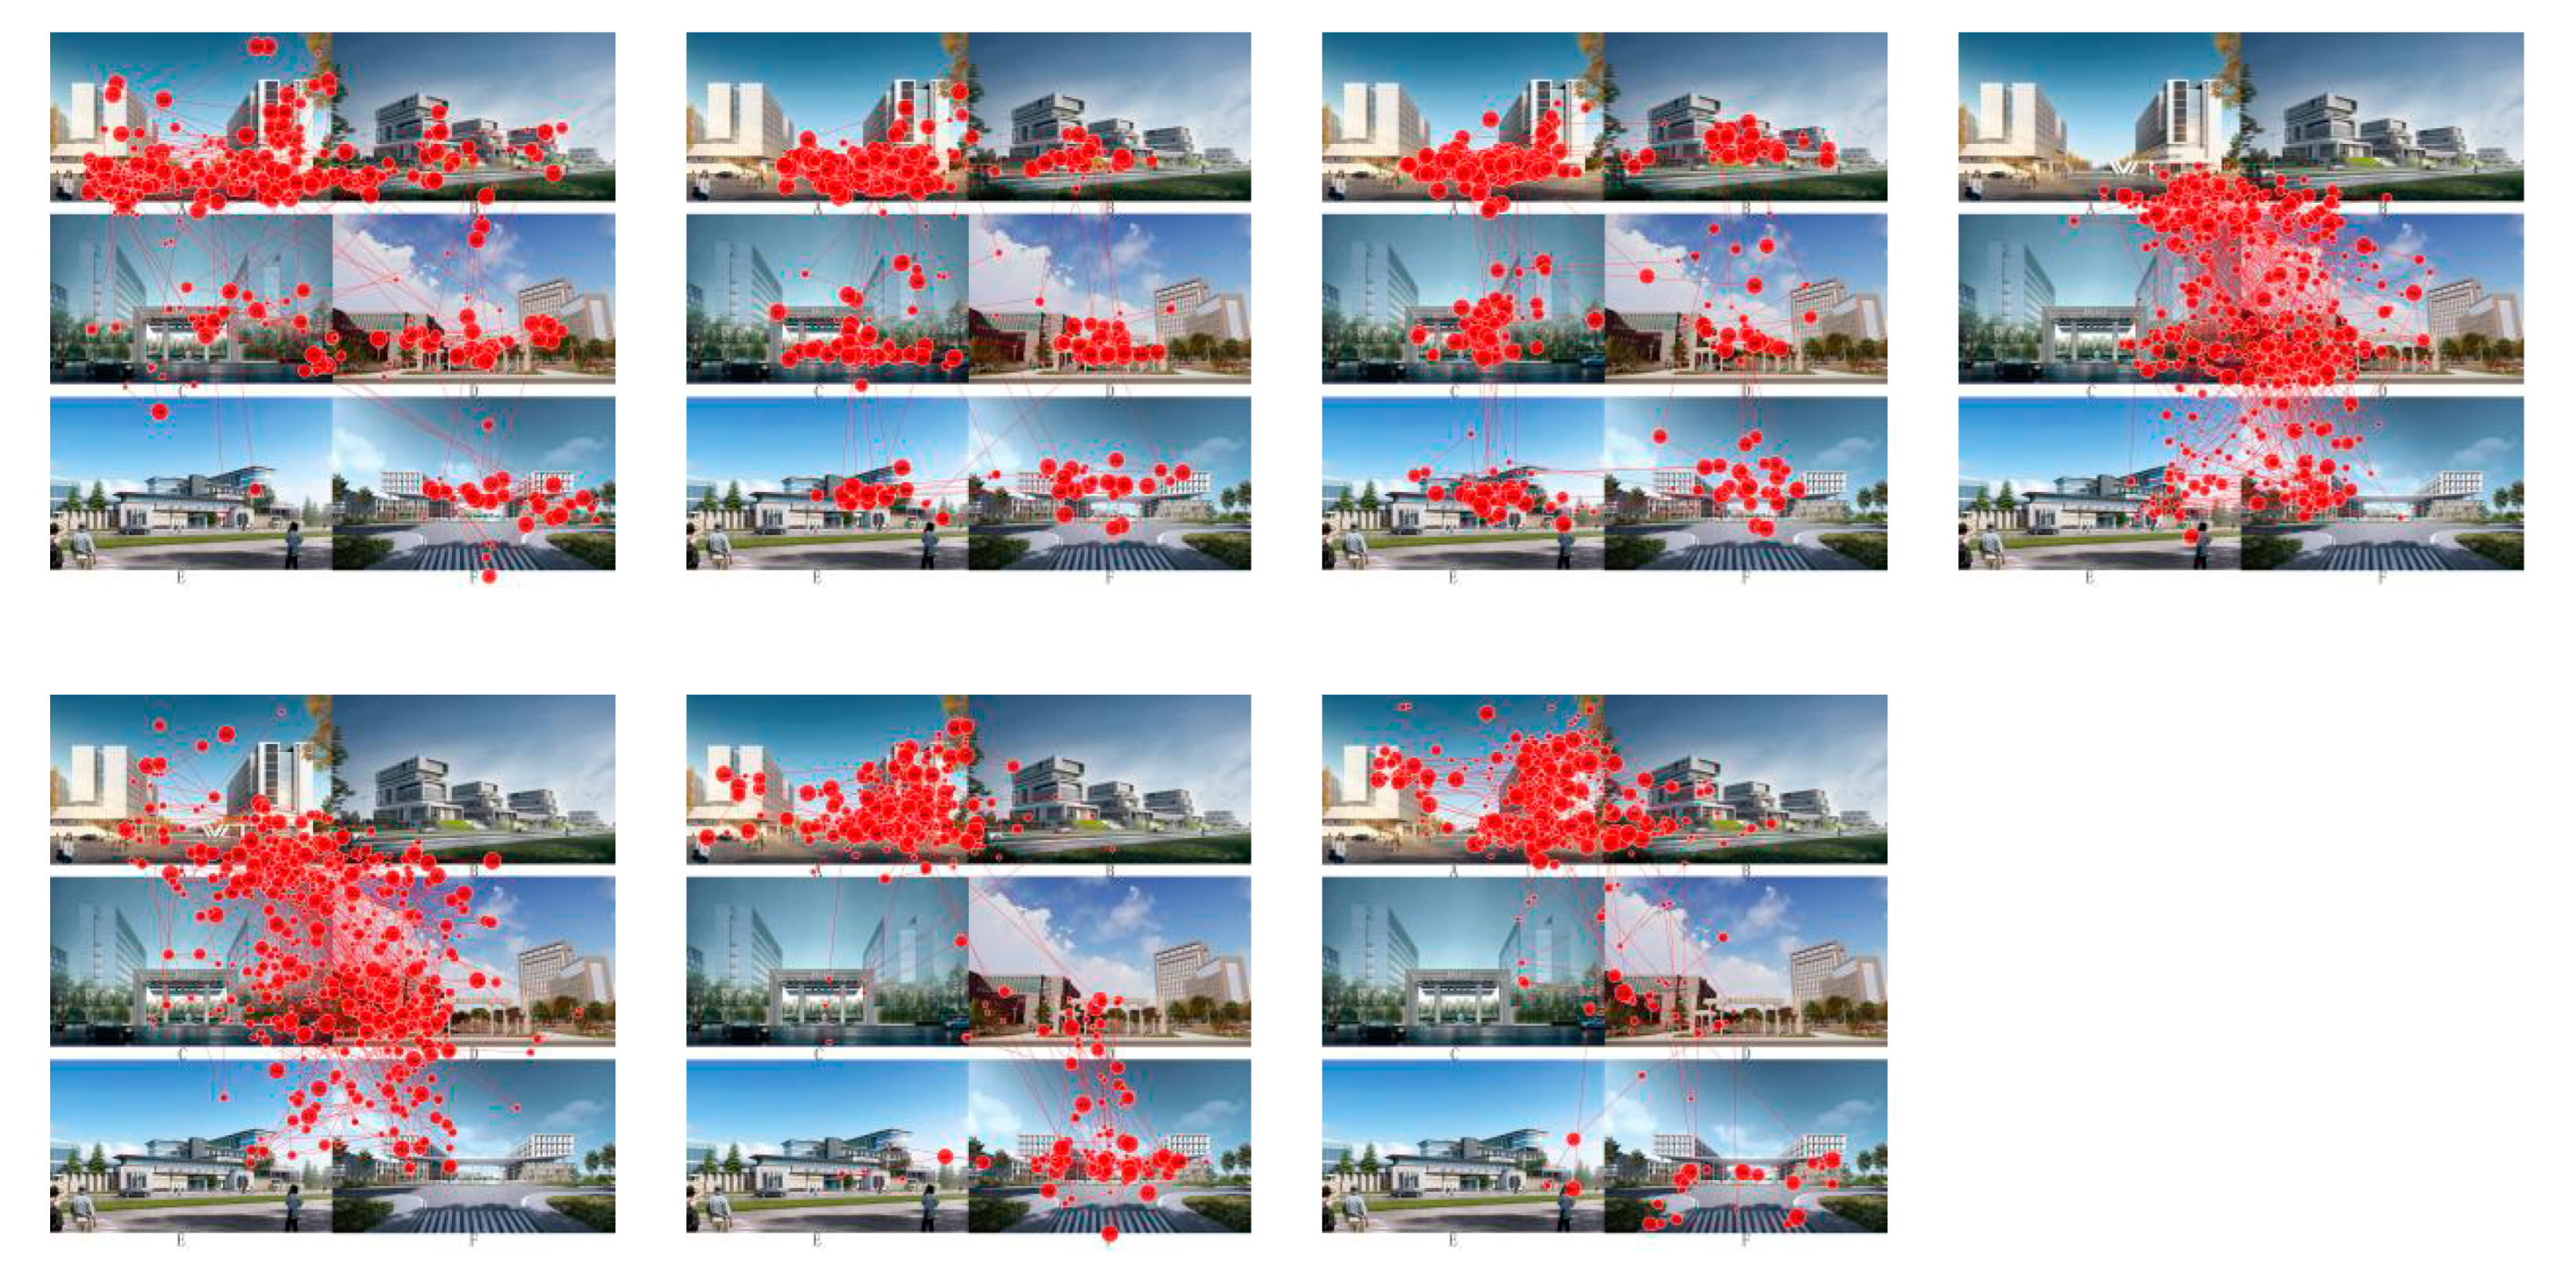
This study conducted a virtual eye-tracking experiment of the 6 schemes, obtained the saccades’ tracking data on 19 subjects (Table 4), and also exported the diagrams of tracked saccade trajectories from the ErgoLAB platform, as shown in Figure 5.
According to the visualization results shown in Figure 5, among the tracked saccade trajectories of the 19 subjects when seeing 6 groups of 120 pieces of stimulus material in three minutes, schemes A and C have the largest number of saccades, which is 3036 and 2640, respectively; the total number of saccades for schemes D, E, and F is 2252, 2149, and 2242, respectively; scheme B has the lowest total of saccades, which is 2075. The experimental results found that the characteristics of the tracked saccade trajectories are highly consistent with the green energy-saving control parameters preset in the six design schemes, and these schemes are in the sequence of Scheme A > Scheme C > Scheme D > Scheme F > Scheme E > Scheme B, according to the trends of tracked saccade trajectories from schemes A to F.
3.2. Confirmation of Significant Effect of the Eye-Movement Emotion Preference Experiment on Low-Carbon Architectural Design
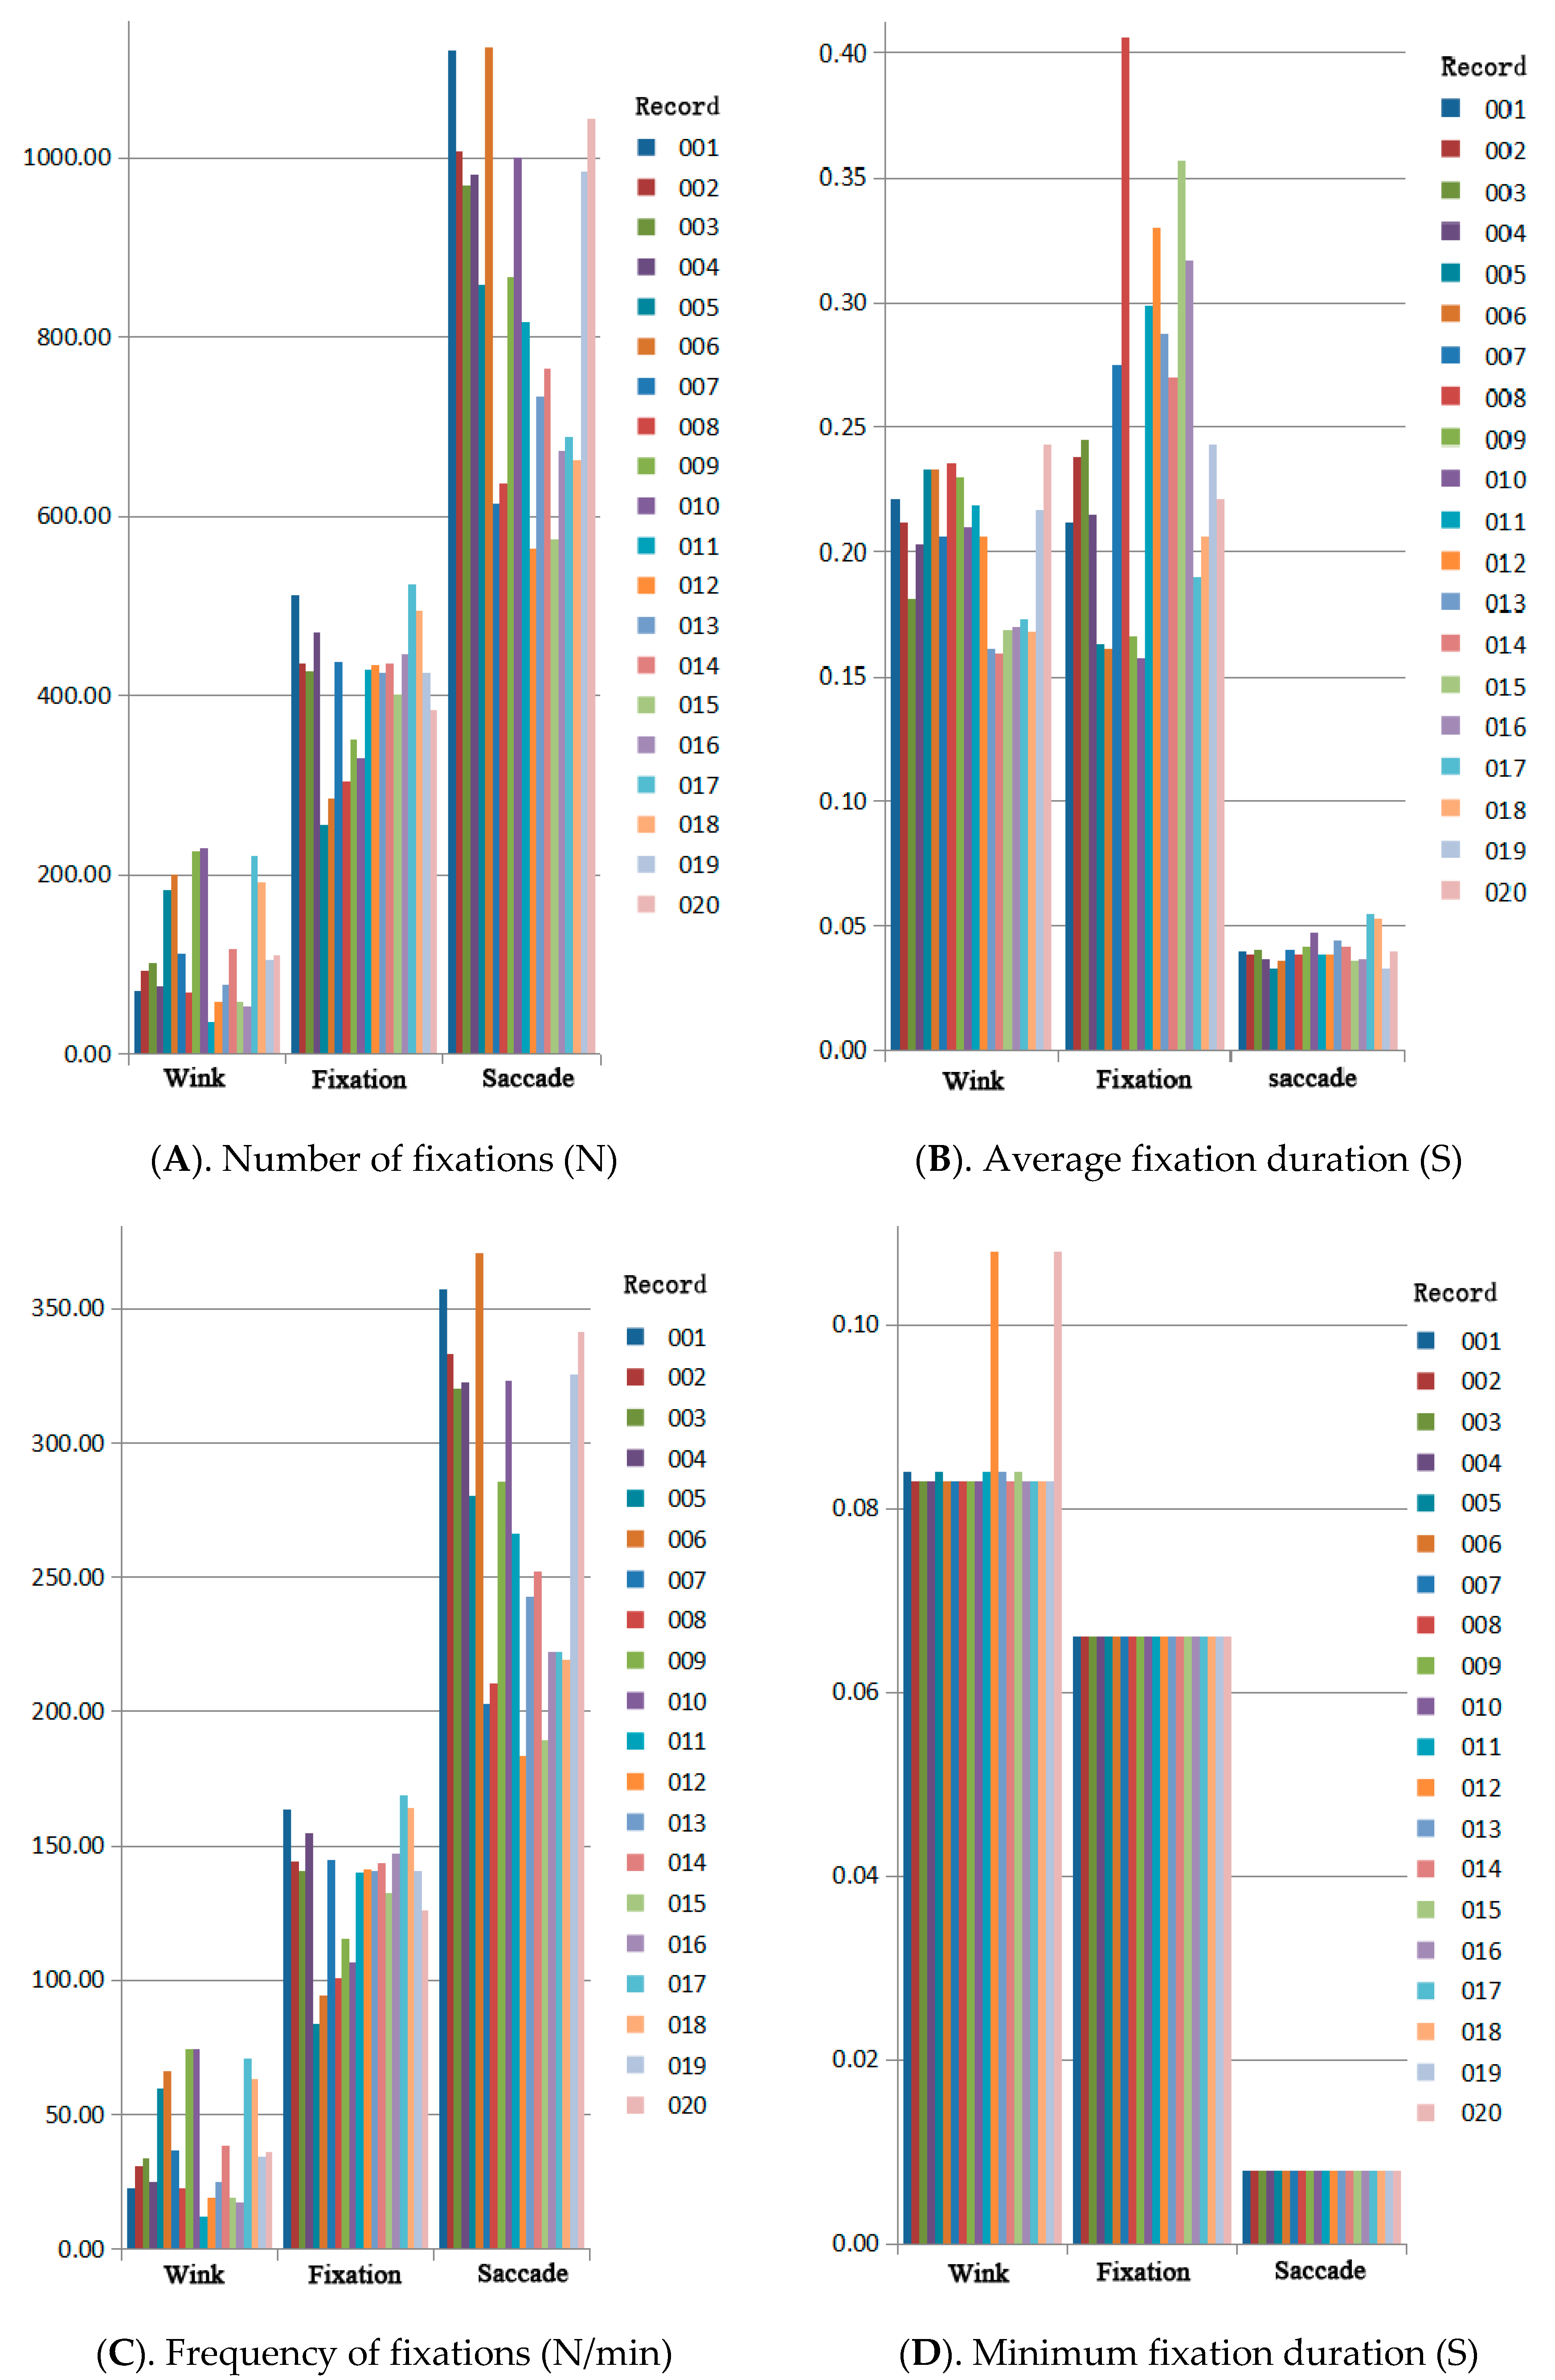
Through an analysis of complete data on visual behavioral preferences, it was found that the selection of the 3D landscape design scheme is closely related to the degree of virtual eye-tracking visual behavioral preference. Furthermore, the paired-samples T test showed that there are significant differences between the 6 design schemes through a virtual eye-tracking visual behavioral preference indicator (F = 1.23, p = 0.11 > 0.05), but the differences between them in minimum fixation duration are not significant F(1, 149) = 9.20, (p < 0.01). As for the indicator for the number of fixations, there are significant differences between the six design schemes in the number of blinks, fixation duration, and the number of saccades F(1, 149) = 70.23, (p < 0.01). Regarding the indicator for average fixation duration, there are insignificant differences between the number of blinks, fixation duration, and the number of saccades F(1, 149) = 6.89, (p < 0.01). For the indicator for the frequency of fixations, there are significant differences between them in the number of blinks, fixation duration, and the number of saccades F(1, 149) = 55.62, (p < 0.01), as shown in Figure 6.
According to the analysis shown in Figure 6, there are significant differences between the 6 groups of design schemes in eye-tracking emotional preference indicators for the following reasons. Firstly, in the saccades’ tracking behavior of the subjects, the average number of fixations and frequency of fixations are 823 N and 149 N/min, respectively, indicating that the eye-tracking emotional preference for different design schemes is in direct proportion to average number of fixations and frequency of fixations, as the larger the number of fixations and the higher the frequency of fixations, the stronger the preference of the subjects. Moreover, the number of blinks and frequency of blinks in Figure 6A are inversely proportional to the saccade number and saccade frequency in Figure 6C, indicating that under the influence of instructions, the subjects can clearly distinguish between the advantages and disadvantages of the carbon emission effects of different schemes through the frequency of fixations. Secondly, when the saccades track the emotional behavior of the subjects, the average lasting duration and maximum fixation duration times are 0.81 s and 0.16 s, respectively, indicating that the virtual eye-tracking emotional preference for different design schemes is directly proportional to the lasting duration and fixation duration, as the longer lasting duration and fixation duration, correlates with the stronger emotional preference of the subjects. In addition, in Figure 6B, blink duration is inversely proportional to maximum saccade duration, indicating that under the influence of the instructions, the subjects can clearly reflect the advantages and disadvantages of the carbon emission effects of the green schemes through fixation duration. In general, the subjects’ virtual eye-tracking emotional preference degree can track the green design effect of schemes effectively, which could promote the benefits to the government to improve the carbon emission efficiency of 3D landscape.
3.3. Virtual Eye-Tracking Vision and Expert Interviews Have a Fitting Relationship with the Evaluation
In the evaluation of the degree of visual preference of the subjects in the virtual eye movement experiment, the entropy weight method was used to calculate through Formulas (1) and (2), to obtain the weight of 21 indicators wi = [0.021, 0.071, 0.047, 0.135, 0.023, 0.061, 0.022, 0.041, 0.003, 0.042, 0.032, 0.025, 0.012, 0.004, 0.027, 0.042, 0.023, 0.054, 0.031, 0.003, 0.001]. The analytic hierarchy process was employed to calculate through Formulas (3) and (4), to obtain the weight of 4 criterion layers (virtual eye movement fixation, virtual eye movement gaze, pupil diameter, virtual eye movement experiment) W = [0.386, 0.302, 0.230, 0.082], and the consistency test was passed. C.R. (Consistency Ratio) was calculated as 0.014, and C.R. < 0.10, which indicates that the consistency test was in line with expectations. According to Formula (5), the entropy weight method and the analytic hierarchy process were combined, after weighting the visual preference-based comprehensive evaluation value of the 3D landscape design scheme, which was calculated as ui = [0.613, 0.322, 0.585, 0.504, 0.495, 0.501]. The evaluation results are ranked by value as Scheme A > Scheme C > Scheme D > Scheme F > Scheme E > Scheme B, and the evaluation results have a fitting relationship with the evaluation results of the virtual eye-tracking visual behavioral preference. The results show that the evaluation based on virtual eye-tracking or expert interviews can both be applied to the selection of 3D landscape design, and can both interact with each other, providing a scientific and reasonable basis for the field of landscaping to achieve CO2 emissions peaking as early as possible.
4. Discussion and Conclusions
This paper conducts an experimental study on the 3D landscape effect by using the virtual eye-movement emotional preference degree, which is more objective than the traditional expert review and questionnaire interview, and also enriches the technical means of implementing the CO2 emissions peaking initiative in the construction industry. This is consistent with the feasibility assessment of the implementation of CO2 emissions peaking initiative in China’s construction industry [58,59]. It is proven that in the monitoring of the 3D landscape design effect, the emotional preference evaluation, which is based on the virtual eye-movement experiment, has a significant impact on data visualization, data disclosure and cost saving, compared with peer review, and can also promote the scientific rationality for 3D landscape design.
Studies show that there is no unified technical evaluation system in the identification of landscape designs. In this paper, virtual eye-tracking is introduced in design identification. Computer visualization helps enhance the optimization efficiency of the design schemes. To improve the identification and evaluation system of 3D landscape design schemes, it is suggested that electroencephalogram technology is leveraged [60], as it tends to facilitate the integration of these technologies into the system from the perspective of the five senses, it improves the identification quality of design schemes, and it builds a sound evaluation system of green ecological landscape design.
Stress color change plays a boosting role in the evaluation of the 3D landscape design effect. The results show that color stress emotional change will play an increasingly important role in bridging the emotional preference experiment and carbon emission peak program. We tried to use the emotional preference experiment to evaluate the design effect of the 3D landscape, and introduced the color stress emotional change to verify the evaluation results, which has an important reference value for verifying the research results. Although the evaluation of the 3D landscape design effect not only includes concentrated areas of green and blue, but gray in the glass curtain wall, with a strong sense of science and technology, the above three colors are typical representatives of low carbon emission and play a boosting role in the quantitative and qualitative research of green and low carbon. This is consistent with the research results of Kim et al. (2019), Ammann et al. (2020) and Latini et al. (2021) who used VR technology for the visualized analysis of human and animal sensory recognition in the fields of environment, color, and carbon emission [61,62,63]. Moreover, this research also has some limitations. Firstly, the proficiency of the handle operation was used as the control variable and the spinning sensation and movement sensitivity would affect the accuracy of experimental data to a certain extent. A pre-experiment could be carried out in the front-end stage of the experiment and the subjects could perceive the experimental environment and handle the operation mode in advance to improve the accuracy of experimental data. Secondly, only 20 subjects were randomly invited during the experiment and the overall sample size was still slightly insufficient.
In 2020, China promulgated the criterion documents including the General Code for Building Energy Conservation and Renewable Energy Utilization, General Code for the Built Environment, General Code for Building Energy Conservation and the Renewable Energy Utilization that clarify the mandatory indicators and basic requirements for the design, construction, commissioning, acceptance, and operation management of three aspects: energy-saving design of new constructions, energy-saving design of existing buildings, and utilization of renewable energy. The General Code for the Built Environment stipulates the mandatory indicators and basic requirements for the design, and testing and acceptance from four aspects, namely, building an acoustic environment, building a light environment, and building thermal engineering. Different documents all cover the detection and evaluation of building and landscape design efficiency [64]; therefore, the application of VR technology in 3D landscape design not only helps improve the application evaluation system and related laws and regulations, but also facilitates the construction industry to achieve CO2 emissions peaking as early as possible.
Author Contributions
Z.L. designed the research and wrote the paper; Y.W. (Yuting Wang) and Y.W. (Yuxi Wan) performed the research and analyzed the data; X.Y. co-designed the research and extensively updated the paper; T.L. and Y.H. extensively updated the paper. All authors have read and agreed to the published version of the manuscript.
Funding
This research was supported by the Major Project of the National Social Science Fund 2021(NSSF) of China “Theoretical and Practical Innovations for Evaluation Systems of Art Theory” (No. 21ZD11), and the Culture and Tourism IP Design was based on AR/VR technology (No. 202002064005).
Institutional Review Board Statement
Not applicable.
Informed Consent Statement
All participants in the study gave informed consent.
Data Availability Statement
All data in this paper are from this experiment.
Conflicts of Interest
The authors declare no conflict of interest.
References
- Mi, Z.; Wei, Y.; Wang, B.; Meng, J.; Liu, Z.; Shan, Y.; Liu, J.; Guan, D. Socioeconomic impact assessment of China’s CO2 emissions peak prior to 2030. J. Clean. Prod. 2017, 142, 2227–2236. [Google Scholar] [CrossRef] [Green Version]
- Liu, Q.; Wang, Q.; Hong, Q. Choice and Route of the Energy Transition under the Scenario of Carbon Neutrality. Energy China 2021, 4, 19–26. [Google Scholar]
- Li, Y.; Lan, S.; Ryberg, M.; Pérez-Ramírez, J.; Wang, X. A quantitative roadmap for China towards carbon neutrality in 2060 using methanol and ammonia as energy carriers. iScience 2021, 24, 102513. [Google Scholar] [CrossRef]
- Hammad, M.; Ebaid, M.; Al-Hyari, L. Green building design solution for a kindergarten in Amman. Energy Build. 2014, 76, 524–537. [Google Scholar] [CrossRef]
- Zhang, X.; Chen, Y.; Jiang, P.; Liu, L.; Xu, X.; Xu, Y. Sectoral peak CO2 emission measurements and a long-term alternative CO2 mitigation roadmap: A case study of Yunnan, China. J. Clean. Prod. 2019, 247, 119171. [Google Scholar] [CrossRef]
- Kim, C.S. Effectiveness of 3D visual access exposure model for urban landscape analysis. J. Urban Des. Inst. Korea Urban Des. 2014, 15, 121–134. [Google Scholar]
- Wang, C.; Zhang, Y. Implementation Pathway and Policy System of Carbon Neutrality Vision. Chin. J. Environ. Manag. 2020, 6, 58–64. [Google Scholar] [CrossRef]
- Zhuang, G.; Dou, X. Policy Connotation and Implementation Path of Peaking Carbon Emissions in the New Development Landscape. J. Xinjiang Norm. Univ. (Ed. Philos. Soc. Sci.) 2021, 6, 1–10. [Google Scholar]
- Jia-Zhong, L.I.; Cheng, X.Y.; Guo, Y.; Liang, C.; Chen, L. Application exploration of real-time 3D model in landscape design——A case study of jinta park. Chin. Landsc. Archit. 2017, 33, 24–28. [Google Scholar]
- Zhu, Z.; Zhang, Y.; Cui, L.; Cao, H. Design and implementation of large-scale building landscape 3D simulation system based on bim technology. Mod. Electron. Tech. 2017, 40, 111–114. [Google Scholar]
- Li, A.; Zhang, A.; Zhou, Y.; Yao, X. Decomposition analysis of factors affecting carbon dioxide emissions across provinces in china. J. Clean. Prod. 2017, 141, 1428–1444. [Google Scholar] [CrossRef]
- Chao, Q. Scientific connotation of “carbon peak and carbon neutrality” and the policy measures of our country. Environ. Sustain. Dev. 2021, 2, 14–19. [Google Scholar]
- Huo, T.; Cao, R.; Du, H.; Zhang, J.; Liu, B. Nonlinear influence of urbanization on china’s urban residential building carbon emissions: New evidence from panel threshold model. Sci. Total Environ. 2021, 772, 145058. [Google Scholar] [CrossRef]
- Liu, B.; Zhao, X.; Zhang, Y.; Tang, T.; Jiang, M. Application and implementation of quest 3D technology in garden landscape design. Landsc. Res. 2010, 38, 7134–7136. [Google Scholar]
- Zhang, G.; Wei, M. The Transformation of Chinese Cites Urban the Carrbon Neutral Target. China Econ. Trade Her. 2021, 5, 12–15. [Google Scholar]
- Chen, Z.; Xu, B. Enhancing urban landscape configurations by integrating 3D landscape pattern analysis with people’s landscape preferences. Environ. Earth Sci. 2016, 75, 1018. [Google Scholar] [CrossRef]
- Simpson, W. A facilities manager’s guide to green building design. Facil. Manag. 2001, 17, 17–24. [Google Scholar]
- Jiaqiang, H.; Feng, W. Research on indoor landscape virtual design method based on 3D vision. Mod. Electron. Tech. 2018, 41, 40–43. [Google Scholar]
- Chen, X.; Huang, J.; Yang, H.; Peng, J. Approaching low-energy high-rise building by integrating passive architectural design with photovoltaic application. J. Clean. Prod. 2019, 220, 313–330. [Google Scholar] [CrossRef]
- Can, L.; Wei, L.; Gao, S. Driving determinants and prospective prediction simulations on carbon emissions peak for China’s heavy chemical industry. J. Clean. Prod. 2020, 251, 1–13. [Google Scholar]
- Shan, P.; Sun, W. Research on 3D urban landscape design and evaluation based on geographic information system. Environ. Earth Sci. 2021, 80, 1–15. [Google Scholar] [CrossRef]
- Hui, G.; Yan, L.; Lin, Y.; Zhiqiang, G. Present Situation and Development Potential of Renewable Energy Heating in China. Agric. Eng. 2017, 7, 79–81. [Google Scholar]
- Wissen, U.; Schroth, O.; Lange, E.; Schmid, W. Approaches to integrating indicators into 3D landscape visualisations and their benefits for participative planning situations. J. Environ. Manag. 2008, 89, 184–196. [Google Scholar] [CrossRef] [PubMed]
- Guizzo, A.; Paiva, T.; Barbosa, F. Effects of 3D contemplative landscape videos on brain activity in a passive exposure eeg experiment. Front. Psychiatry 2018, 9, 317. [Google Scholar] [CrossRef] [Green Version]
- Koma, S.; Yamabe, Y.; Tani, A. Research on urban landscape design using the interactive genetic algorithm and 3D images. Vis. Eng. 2018, 5, 2–10. [Google Scholar] [CrossRef] [Green Version]
- Tang, Z.P.; Yu, H.J.; Chen, M.X.; Cheng, J.F. The scenario analysis of China’s carbon emission peak and carbon neutrality based on extremum condition of function. J. Nat. Resour. 2022, 37, 1247–1260. [Google Scholar] [CrossRef]
- Klingenberg, K.; Kernagis, M.; Knezovich, M. Zero energy and carbon buildings based on climate-specific passive building standards for North America. J. Build. Phys. 2016, 39, 503–521. [Google Scholar] [CrossRef]
- Qin, A.; Sun, Y.; Wang, Y.; Teng, F. Analysis on the Development Trend of International Green Technology under the Background of Carbon Neutrality. World Sci.-Tech. R&D 2021, 43, 385–402. [Google Scholar]
- Pauliuk, S.; Heeren, N. Material efficiency and its contribution to climate change mitigation in germany: A deep decarbonization scenario analysis until 2060. J. Ind. Ecol. 2020, 11, 457–462. [Google Scholar] [CrossRef]
- Chang, M.; Tian, X.; Yang, L. Learn from Japan’s Policy System for Low Carbon Development Based on Comparison of Carbon Emissions Pattern between Japan and China. Jpn. Energy Conserv. Cent. 2009, 1, 1560–1567. [Google Scholar]
- Sonja, H. Linking carbon markets: South Korea’s upcoming ets and the potential for linkage with the eu ets. Aust. Environ. Rev. 2014, 2, 34–41. [Google Scholar]
- Song, Q.; Duan, J.; Liu, P. Application of Virtual Reality Technique in Architecture Designing and District Planning and Design. J. Donghua Univ. 2006, 32, 4. [Google Scholar]
- Wong, J.; Li, H.; Wang, H.; Huang, T.; Luo, E.; Li, V. Toward low-carbon construction processes: The visualisation of predicted emission via virtual prototyping technology. Autom. Constr. 2013, 33, 72–78. [Google Scholar] [CrossRef]
- Lin, Z.; Zhang, L.; Tang, S.; Song, Y.; Ye, X. Evaluating Cultural Landscape Remediation Design Based on VR Technology. ISPRS Int. J. Geo-Inf. 2021, 10, 423. [Google Scholar] [CrossRef]
- Wiltz, C. Analytics Tool Uses VR Eye Tracking for Product Design. Design News. 2018, 12, 1–8. [Google Scholar]
- Fan, X.; Zhang, L. Assessing the Influence of Landmarks and Paths on the Navigational Efficiency and the Cognitive Load of Indoor Maps. Int. J. Geo-Inf. 2020, 9, 82. [Google Scholar]
- Liu, S.; Tian, X.; Xiong, Y.; Zhang, Y.; Tanikawa, H. Challenges towards carbon dioxide emissions peak under in-depth socioeconomic transition in china: Insights from shanghai. J. Clean. Prod. 2019, 247, 1–10. [Google Scholar] [CrossRef]
- Zhao, J.; Wang, Y.; Wang, D. Research on the Obstacles of BIM Application in Construction Engineering Based on AHP Entropy Method. Constr. Econmy 2020, 41, 182–187. [Google Scholar]
- Gong, I.; Wang, Z.; University, Y. Study on 3D landscape virtual design system by means of big data analysis. Mod. Electron. Tech. 2018, 41, 46–49. [Google Scholar]
- Lin, Y.; Xu, Q.; Dong, C. A prediction model for energy consumption of building based on pca-elman. Electr. Technol. Intell. Build. 2016, 11, 2314–2319. [Google Scholar]
- Zhong, J.; Zhong, X. Waste Management in Japan: Policy Evolution, Influencing Factors and Successful Experience. Contemp. Econ. Jpn. 2020, 1, 68–80. [Google Scholar]
- Tan, X.C.; Guo, W.; Fan, J.; Guo, J.X.; Wang, M.Y.; Zeng, A.; Su, L.Y.; Sun, Y. Policy Framework and Technology Innovation Policy of Carbon Peak and Carbon Neutrality. Bull. Chin. Acad. Sci. 2022, 37, 435–443. [Google Scholar]
- Xu, L.; Meng, R.; Huang, S.; Chen, Z. Healing Oriented Street Design: Experimental Explorations via Virtual Reality. Int. Urban Plan. 2019, 34, 38–45. [Google Scholar] [CrossRef]
- Margolin, L. On the convergence of the cross-entropy method. Ann. Oper. Res. 2005, 134, 201–214. [Google Scholar] [CrossRef]
- Tao, X.; Liang, S.Q.; Fu, F. Heat transfer enhancement mechanism and preparation technology of wood-based thermal conductive composite. J. Funct. Mater. 2022, 53, 2057–2065. [Google Scholar]
- Zilai, T.; Fu, L. A rational approach to urban density zoning: The case of shenzhen special economic zone. Urban Plan. Forum 2003, 4, 1–9. [Google Scholar]
- Cheng, P.; Xi, S. Comparison and Enlightenment between Singapore and China on Space Control Measures of Technical Regulations for Urban Attached Green Space. Chin. Landsc. Archit. 2021, 37 (Suppl. 1), 85–89. [Google Scholar]
- Qiao, J.J. Application of improved entropy method in henan sustainable development evaluation. Resour. Sci. 2004, 12, 123–127. [Google Scholar]
- Li, C.; Zhang, F.; Zhu, T.; Feng, T.; An, P. Evaluation and correlation analysis of land use performance based on entropy-weight topsis method. Trans. Chin. Soc. Agric. Eng. 2013, 29, 217–227. [Google Scholar]
- Delgado, A.; Romero, I. Environmental conflict analysis using an integrated grey clustering and entropy-weight method: A case study of a mining project in Peru. Environ. Model. Softw. 2016, 77, 108–121. [Google Scholar] [CrossRef]
- Spinks, J.; Mortimer, D. Lost in the crowd? Using eye-tracking to investigate the effect of complexity on attribute non-attendance in discrete choice experiments. BMC Med. Inform. Decis. Mak. 2015, 16, 1–13. [Google Scholar] [CrossRef] [PubMed] [Green Version]
- Wang, H.; Sun, C.; Chen, X.; Zhang, Y.; Colvin, V.L.; Rice, Q. Excitation wavelength independent visible color emission of carbon dots. Nanoscale 2017, 9, 1909–1915. [Google Scholar] [CrossRef] [PubMed]
- Qu, J.; Zhang, X.; Zhang, S.; Wang, Z.; Yu, Y.; Ding, H.; Tang, Z.; Heng, X.; Wang, R.; Jing, S. A facile co-crystallization approach to fabricate two-component carbon dot composites showing time-dependent evolutive room temperature phosphorescence colors. Nanoscale Adv. 2021, 3, 5053–5061. [Google Scholar] [CrossRef]
- Lin, B.; Zhu, X.; Li, X. Analysis of Green Building Plan and Design with Simulation Technology. Build. Sci. 2006, 4, 8–11. [Google Scholar]
- Fang, H.; Song, Z.; Yang, L.; Ma, Y.; Qin, Q. Spatial Cognitive Elements of VR Mobile City Navigation Map. Geomat. Inf. Sci. Wuhan Univ. 2019, 44, 1124–1130. [Google Scholar]
- Pan, Y.; Ding, Y.; Chen, L. Difference of Eyemovement Characteristics of Drivers in the Environment of Scienic Area and Urban Road. J. Chongqing Jiaotong Univ. (Nat. Sci.) 2019, 38, 84–89. [Google Scholar]
- Liu, B.; Lian, Z.; Brown, R.D. Effect of landscape microclimates on thermal comfort and physiological wellbeing. Sustainability 2019, 11, 5387. [Google Scholar] [CrossRef] [Green Version]
- Maffei, L.; Masullo, M.; Pascale, A.; Ruggiero, G. Immersive VR in community planning: Acoustic and visual congruence of simulated vs real world. Sustain. Cities Soc. 2016, 12, 4330. [Google Scholar]
- Chen, J.; Wang, J.; Huang, C.; Wang, C.; Wu, T. Risk division of agro-meteorological disasters in Fujian province based on ahp-ewm method. J. Nat. Disasters 2016, 9, 126–133. [Google Scholar]
- Liu, Y.; Hu, M.; Zhao, B. Interactions between forest landscape elements and eye movement behavior under audio-visual integrated conditions. J. For. Res. 2020, 25, 21–30. [Google Scholar] [CrossRef]
- Kim, R.W.; Kim, J.G.; Lee, I.B.; Yeo, U.H.; Lee, S.Y. Development of a VR simulator for educating CFD-computed internal environment of piglet house. Biosyst. Eng. 2019, 188, 243–264. [Google Scholar] [CrossRef]
- Ammann, J.; Stucki, M.; Siegrist, M. True colours: Advantages and challenges of virtual reality in a sensory science experiment on the influence of colour on flavour identification. Food Qual. Prefer. 2020, 86, 103998. [Google Scholar] [CrossRef]
- Latini, A.; Di Giuseppe, E.; D’Orazio, M.; Di Perna, C. Exploring the use of immersive virtual reality to assess occupants’ productivity and comfort in workplaces: An experimental study on the role of walls colour. Energy Build. 2021, 253, 111508. [Google Scholar] [CrossRef]
- Hasanzadeh, S.; Dao, B.; Esmaeili, B.; Dodd, M.D. Role of personality in construction safety: Investigating the relationships between personality, attentional failure, and hazard identification under fall-hazard conditions. J. Constr. Eng. Manag. 2019, 145, 04019052. [Google Scholar] [CrossRef] [Green Version]
Figure 1.
The three-dimensional landscape emission peak working principle. (Source: Dual carbon planning system based on Tang et al. (2022) and Klingenberg et al. (2016)) [26,27].

Figure 2.
Three-dimensional landscape location identification and overview.

Figure 3.
The virtual eye tracker experiment (Source: The groups (A–C) come from Beijing KINGFAR Technology Co., Ltd., Beijing, China).
Figure 3.
The virtual eye tracker experiment (Source: The groups (A–C) come from Beijing KINGFAR Technology Co., Ltd., Beijing, China).

Figure 4.
Experimental Environment and Data Monitoring Interface.

Figure 5.
Tracked saccades trajectories of 19 different subjects.


Figure 6.
The chart of the differences in changes in eye movement visual behavioral statistics result. (Source: The groups (A–D) come from the statistical results of the subjects’ degree of eye-tracking behavior).
Figure 6.
The chart of the differences in changes in eye movement visual behavioral statistics result. (Source: The groups (A–D) come from the statistical results of the subjects’ degree of eye-tracking behavior).


Table 1.
Green parameter control objectives for design schemes.
| Classify | Thermal Conductivity (λ) | Coefficient of Heat Accumulation (s) | Specific Heat Capacity (Cp) | Building Density (ρ) | Greening Rate (%) | Floor Area Ratio (%) |
|---|---|---|---|---|---|---|
| Scheme A | 0.93 | 11.37 | 1050 | 19.80 | 38.30 | 2.20 |
| Scheme B | 0.92 | 11.32 | 1050 | 28.97 | 34.19 | 1.23 |
| Scheme C | 0.81 | 10.07 | 1050 | 29 | 35 | 1.60 |
| Scheme D | 0.81 | 10.07 | 1050 | 13.50 | 35 | 1.17 |
| Scheme E | 0.45 | 10.20 | 920 | 21.60 | 35 | 1.23 |
| Scheme F | 0.23 | 9.37 | 1620 | 27 | 35.50 | 1.23 |
(Source: The green parameter control target values are from the standard limits in the Thermal Design Code for Civil Building (GB50189-2015), the Unified Standard for Green building (GBT/50378-2019), and the Curtain Wall for Building (GB/T 21086-2007)).
Table 2.
Comparison of behavioral preference between the experimental group and control group.
| Group | Category | N | M | SD | p |
|---|---|---|---|---|---|
| Experimental group | With behavioral preference | 19 | 7.01 | 1.79 | >0.05 |
| Without behavioral preference | 6.91 | 1.76 | |||
| Control group | With behavioral preference | 20 | 6.54 | 3.54 | <0.05 |
| Without behavioral preference | 6.11 | 3.32 |
Table 3.
Evaluation indicator system and indicator interpretation (the number of the subjects’ fixation points in one experiment).
Table 3.
Evaluation indicator system and indicator interpretation (the number of the subjects’ fixation points in one experiment).
| Target Layer | Criterion Layer | Eye Movement Tracking Index | Interpretation |
|---|---|---|---|
| Evaluation of the design scheme based on VR technology | Virtual Eye Movement Fixation | Number of Fixations | Number of subjects’ fixation points in an experimental project. |
| Duration of Fixation | Total fixation time of subjects in an experimental project. | ||
| Average Fixation Duration | The average fixation time of subjects in an experimental project. | ||
| Fixation Standard Deviation | Standard deviation of subjects’ fixation time in an experimental project. | ||
| Maximum Fixation Time | The longest fixation time of subjects in an experimental project. | ||
| Fixation Ratio | The number of subjects’ fixations per unit time in an experimental project. | ||
| Fixation’s Sum of Deviation | The sum of the difference between the subjects’ single fixation time and the average fixation time in an experimental project. | ||
| Fixation’s Maximum Deviation | The maximum value of the difference between the single fixation time and the average fixation time of subjects in an experimental project. | ||
| Virtual Eye Movement Gaze | Number of Gazes | Number of gaze points of subjects in an experimental project. | |
| Duration of Gaze | Total gaze time of subjects in an experimental project. | ||
| Average Gaze Duration | The average gaze time of subjects in an experimental project. | ||
| Gaze Standard Deviation | Standard deviation of subjects’ gaze time in an experimental project. | ||
| Maximum Gaze Time | The longest gaze time of subjects in an experimental project. | ||
| Gaze Ratio | The number of subjects’ gazes per unit time in an experimental project. | ||
| Gaze’s Sum of Deviation | The sum of the difference between the subjects’ single gaze time and the average fixation time in an experimental project. | ||
| Gaze’s Maximum Deviation | The maximum value of the difference between the single gaze time and the average fixation time of subjects in an experimental project. | ||
| Pupil Diameter | Average Pupil Diameter | Average pupil diameter of subjects in an experimental project. | |
| Minimum Pupil Diameter | Minimum pupil diameter of subjects in an experimental project. | ||
| Maximum Pupil Diameter | Maximum pupil diameter of subjects in an experimental project. | ||
| Virtual eye Movement Experiment | Total Time | Total time of subjects in an experimental project. | |
| Subjects Condition | Basic conditions of subjects in an experimental project. |
Table 4.
Statistics on the number of saccades of the subjects during virtual eye tracking.
| Classify | A | B | C | D | E | F |
|---|---|---|---|---|---|---|
| 1 | 199 | 118 | 145 | 111 | 136 | 135 |
| 2 | 221 | 170 | 100 | 136 | 123 | 165 |
| 3 | 203 | 105 | 142 | 157 | 147 | 136 |
| 4 | 138 | 91 | 105 | 161 | 130 | 125 |
| 5 | 257 | 165 | 192 | 175 | 218 | 122 |
| 6 | 210 | 136 | 191 | 245 | 253 | 222 |
| 7 | 161 | 160 | 146 | 97 | 33 | 55 |
| 8 | 193 | 66 | 57 | 91 | 84 | 155 |
| 9 | 123 | 158 | 134 | 168 | 193 | 59 |
| 10 | 174 | 170 | 320 | 116 | 69 | 70 |
| 11 | 111 | 57 | 76 | 69 | 59 | 71 |
| 12 | 74 | 64 | 89 | 93 | 74 | 104 |
| 13 | 120 | 98 | 87 | 8 | 107 | 95 |
| 14 | 123 | 112 | 214 | 119 | 19 | 24 |
| 15 | 87 | 45 | 69 | 68 | 67 | 69 |
| 16 | 101 | 32 | 60 | 84 | 83 | 55 |
| 17 | 119 | 138 | 146 | 94 | 87 | 230 |
| 18 | 234 | 86 | 155 | 176 | 153 | 154 |
| 19 | 188 | 104 | 212 | 84 | 114 | 196 |
| Total | 3036 | 2075 | 2640 | 2252 | 2149 | 2242 |
(Source: Groups A–F come from Scheme A, Scheme B, Scheme C, Scheme D, Scheme E, and Scheme F; Groups 1–19 come from 19 subjects).
Publisher’s Note: MDPI stays neutral with regard to jurisdictional claims in published maps and institutional affiliations. |
© 2022 by the authors. Licensee MDPI, Basel, Switzerland. This article is an open access article distributed under the terms and conditions of the Creative Commons Attribution (CC BY) license (https://creativecommons.org/licenses/by/4.0/).
Share and Cite
MDPI and ACS Style
Lin, Z.; Wang, Y.; Ye, X.; Wan, Y.; Lu, T.; Han, Y. Effects of Low-Carbon Visualizations in Landscape Design Based on Virtual Eye-Movement Behavior Preference. Land 2022, 11, 782. https://0-doi-org.brum.beds.ac.uk/10.3390/land11060782
AMA Style
Lin Z, Wang Y, Ye X, Wan Y, Lu T, Han Y. Effects of Low-Carbon Visualizations in Landscape Design Based on Virtual Eye-Movement Behavior Preference. Land. 2022; 11(6):782. https://0-doi-org.brum.beds.ac.uk/10.3390/land11060782
Chicago/Turabian StyleLin, Zhengsong, Yuting Wang, Xinyue Ye, Yuxi Wan, Tianjun Lu, and Yu Han. 2022. "Effects of Low-Carbon Visualizations in Landscape Design Based on Virtual Eye-Movement Behavior Preference" Land 11, no. 6: 782. https://0-doi-org.brum.beds.ac.uk/10.3390/land11060782
Note that from the first issue of 2016, this journal uses article numbers instead of page numbers. See further details here.