
Green Public Areas and Urban Open Spaces Management: New GreenCAL Tool Algorithms and Circular Economy Implications


1
National Agency for New Technologies Energy and Sustainable Development (ENEA), Via Anguillarese 301, 00123 Rome, Italy
2
Independent Researcher, Via Andorra n. 9, 04100 Latina, Italy
3
Department of Chemical Engineering, Materials, Environment Sapienza University of Rome, Via Eudossiana 18, 00184 Rome, Italy
*
Author to whom correspondence should be addressed.
Land 2022, 11(6), 886; https://0-doi-org.brum.beds.ac.uk/10.3390/land11060886
Submission received: 1 May 2022
/
Revised: 2 June 2022
/
Accepted: 5 June 2022
/
Published: 10 June 2022
(This article belongs to the Special Issue Geomatics and Sustainability: Examples and Application in Urban and Landscape Management)
Abstract
:Urban Open Spaces (UOS) are green infrastructures that provide social and ecosystem services. Green public areas contribute to mitigation and adaptation strategies for addressing climate changes, but their maintenance has a significant cost. Frequent grass cutting operations must be carried out during growing periods to ensure the safe livability of UOS to citizens. In the present paper, a geo database was developed to map green public areas of the city of Latina (Lazio Region, Central Italy) by using a multisource dataset according to the European INSPIRE Directive. The GreenCAL Tool was implemented. Two algorithms to determine UOS extension and the necessary budget for grass cutting operations are used, considering the contribution of different mowing (i.e., mulcher, lawnmower, or brush cutter) and UOS extension itself (~160 ha). The implemented processing chain allowed us to simulate forestation of abandoned areas and potential CO2 sequestration values. Two different scenarios of maintenance programs were also implemented to reduce more than 60% of operational cost according to: (1) different use of UOS; (2) their position within the urban area; (3) guidelines of Italian working group on public green management; and (4) management of vegetal residues. The management of the latter, derived by mowing, contribute to more than 23% of the budget allocated to maintain UOS. Besides the long-term environmental and health perspective, the short-term impact of the present applied research is relevant for a geomatic approach, green public procurements, as well as land use and climate interactions. The alternative management of UOS discussed in the present paper can also reduce organic waste production if the mowing within the UOS is managed as a resource for agriculture rather than urban waste.
1. Introduction
Urban areas are continuously expanding, causing land and soil consumption at a global scale [1,2]. Urban Open Space (UOS) within the cities increase the quality of life of multiple users since green infrastructures favor livability and can help preserve biodiversity [3]. At the same time, public green spaces provide a valuable contribution to adaptation and mitigation strategies against climate changes [4] as well as other social and ecosystem services like inclusion, reduction of flood hazard, water quality improvements, soil remediation, food production, etc. Green infrastructures are considered an important ecological element and their abundance is an indicator of sustainability and a high quality standard of life [5,6]. Many authors investigate the importance of brownfields greening from the perspective of urban restoration [7,8] and the capability of plants to reduce the concentration of contaminants within soil, sediment, and water bodies [9,10]. The importance of trees and vertical greenery has also been investigated to contrast heat waves within cities and to increase biodiversity [11]. In many countries, reforestation is taking place as a key strategy for mitigation and adaptation to climate changes [12,13]. In this extent, decarbonization can even be achieved by planting trees, as they contribute to CO2 absorption and oxygen production [13]; in urban areas they contribute with many benefits as ecosystem services, providing habitat to migratory and forest-breeding birds [14,15].
Urban greenery requires periodic maintenance and the cost of managing gardens and parks increases in relation to their extension [16]. In this regard, we are witnessing a paradox: many reforestation programs are carried out to mitigate climate change but, at the same time, local authorities do not have sufficient budgets to guarantee the maintenance of the UOS at adequate levels for aesthetic and recreational uses. The economic crisis of recent years has generated, at the level of many local authorities, a contraction of budgets, with the consequent reduction of allocations for public services, thus including the maintenance of urban green spaces. In this perspective, a correct assessment of the costs of public greenery maintenance appears as a key element. The rapid growth of greenery during the spring and the summer seasons is a natural phenomenon, the occurrence of which causes many critical issues to local authorities due to the high biomass production, affecting both the economic side and the ability to dispose of vegetable waste [17,18]. During the period of maximum plant growth, the management of UOS becomes costly and more complex: the collected residues rapidly degrade, thus complicating subsequent treatment operations [19]. As a result, high-level maintenance services are very rare and the cutting operations of public green increasingly subtract resources from other services (assistance, maintenance of roads and schools, civil protection, etc.).
The composition of lignocellulose material has a high variability: we find trunks and branches, leaves, and cortex [20]. These materials can be destined to several and competing supply chains, such as biological treatment and/or energy production. Lignocellulosic residues represent a category of plant biomasses mainly made up of materials such as lignin, cellulose, hemicellulose, and saccharides of simpler composition; to produce good quality silage the dry material content of the grass should be between 25 and 35% and the grass length should be less than 2 cm [21]. Lignocellulose waste is the most relevant fraction of the urban waste chain from both a technical and an economical point of view [22,23,24]. Mowing residues show further significant differences in composition compared to lignocellulosic materials, both in terms of lignin content, humidity, and C/N ratio [25]. These residues are particularly suitable for recovery through biological treatments [26] and the chemical–physical characterization of the main lignocellulosic biomasses can suggest the best uses to which each specific biomass can be sent [27,28,29]. Mowing production depends on climate conditions and variability of the growth rate of the different species [30], but its determination is far beyond the purpose of the present paper.
In recent years, one of the most relevant problems of public administrations related to the management of green areas is the knowledge of the natural capital of public properties, the census of their position, and their extension and use by the population; these factors directly influence the costs necessary to provide maintenance and services for different age groups of users [31]. Clean and safe parks and public gardens are the main objective of all administrations, but the impact of injustices due to increasing or decreasing quality of life and housing cost in some parts of cities compared to others is underestimated [32]; for this reason, the maintenance of public parks has relevant urban and socio-environmental implications [33,34,35,36]. Poor maintenance or abandonment of UOS can lead to the development of unhealthy and dangerous environments for users, generating processes of degradation and accumulation of waste that induce a strongly negative sentiment in the population. On the contrary, periodic maintenance can guarantee the extensive use of UOS and positive feedback linked to their attendance and conservation, also through the participation of citizens in the care and maintenance processes [34,35,36]. Municipalities should foresee the realization of a minimum census of UOS before proceeding to the entrusting of their management and maintenance. The computerized census of green areas with survey methodologies that integrate multisource database (photogrammetric, topographic, cartographic, etc.) and GIS survey techniques for map positioning of the surveyed elements on which maintenance interventions are foreseen (grassy carpets, playgrounds, play equipment, street furniture, trees, hedges, flowerbeds, roadside verges) are fundamentals. Waste management is one of the main issues influencing the capability to guarantee the livability of sustainable green public areas that need high frequency collection of waste from a high number of small bins distributed along walking paths within UOS.
The lack of economic resources may have consequences on the use of UOS and trigger social and environmental problems. Even a small quantity of waste within UOS can generate many fragments—including microplastics—when the grass is periodically cut. According to a World Bank report, this process will be worse in the future because, without urgent action, global waste will increase by 70% from current levels by 2050 [23]. More than two billion tons of waste were generated worldwide in 2016; with the growth of the global population and the increase in urbanization, 3.4 × 10⁹ tons of annual global waste generation is expected by 2050. To this extent, the impact of the sustainable maintenance of UOS will become relevant. According to ISPRA (Italian Institute for Environmental Protection and Research, the management and the maintenance of Italian urban and green areas produces approximately two million tons of lignocellulosic material [24]. It corresponds to approximately 28% (by weight) of the organic fraction of separately collected municipal waste.
Geographical Information Systems (GIS) are commonly used to support the development of analysis in different environments, including urban and landscape management, which is a critical issue in our current “Anthropocene” age, where human activities contribute many impacts on a global scale [31]. Geomatics methodologies can provide several tools for monitoring spatial data analysis, supporting stakeholders and authorities to understand and to quantify anthropogenic impacts such as urban development, soil consumption, and land cover changes [17,36,37,38]. The new Italian legislation related to environmental criteria for the management of public green areas introduced the green census as a fundamental tool for the correct planning of green areas (Italian Decree n. 63/2020). Geomatics is used to estimate the economic investments necessary to maintain and to enhance functionality and requalification of UOS heritage.
Waste is defined by Directive 2008/98/EC (Article 3 par 1) as “any substance or object which the holder disposes or intends or is required to dispose”, and its management and disposal can have major environmental impacts. The main EU directives and Italian laws on waste management are not always congruent, and they essentially focus on waste definition, collection, and treatment options, approval procedures, and application of the recovered products as soil conditioners. The Waste Framework Directive (2008/98/EC) defines the term organic waste as “biodegradable waste from garden and park area, from household’s food and kitchen, from restaurants, caterers and retailers and similar waste from food processing”. Biowaste, in general, should be collected separately “if technically, environmentally and economically practicable”. European legislation still allows incineration and landfilling of biowaste under certain conditions but facilitates separation, biowaste collection, and biological treatment in order to produce environmentally safe compost and other materials. As a residue, grass is considered under the biomass definition (biodegradable fraction of municipal waste) and hence eligible and accountable in the national renewable energy share calculation used to quantify country specific climate targets.
For many years the Italian environmental legislation has excluded mowing and pruning from waste regulation, allowing the direct use of maintenance residues of urban green areas in agriculture and forestry without the need for further treatments.
Only in very recent times, with legislative decree n. 116 of 3rd September 2020, has the Italian legislator transposed the indications of the 2008/98/EC Directive (and of the recent “European Law” on the Circular Economy n. 851/2018), including “the mowing and pruning arising from the maintenance of public green areas in the municipalities” into the category of organic waste. The long-term goals of these policies are to reduce the amount of waste generated or to promote waste as a resource as well as to achieve higher levels of recycling and safe waste disposal. In Italy, the waste coming from the management of UOS is a significant fraction that deserves to be treated with attention, considering the increasing constraints imposed by EU regulations. The possibility to recover this fraction has a significant economic impact that local administrations are not always able to manage to ensure the periodic maintenance of parks, gardens, and green areas along the roads.
The objective of the present article is to map the green public areas subject to periodic maintenance by a municipality and to develop a specific tool, called GreenCAL, appositely designed to improve their management. Maintenance of UOS is necessary to avoid uncontrolled grass growth, reduce fire risks, and ensure the usability and the healthiness of public spaces [7,37,38]. A scientific based approach was used to implement a geodatabase in order to determine the location and the extension of all green areas within a specific urban context as well as to estimate the required budget for cutting grass over the entire green heritage of the municipality. A land management tool based on geo-computational techniques is presented. Geomatic spatial analysis contribute to determine the cost and the time for grass cutting processes, and the different type of mowing operations over green areas together with the eventual disposal of vegetal residues are both considered.
2. Study Area
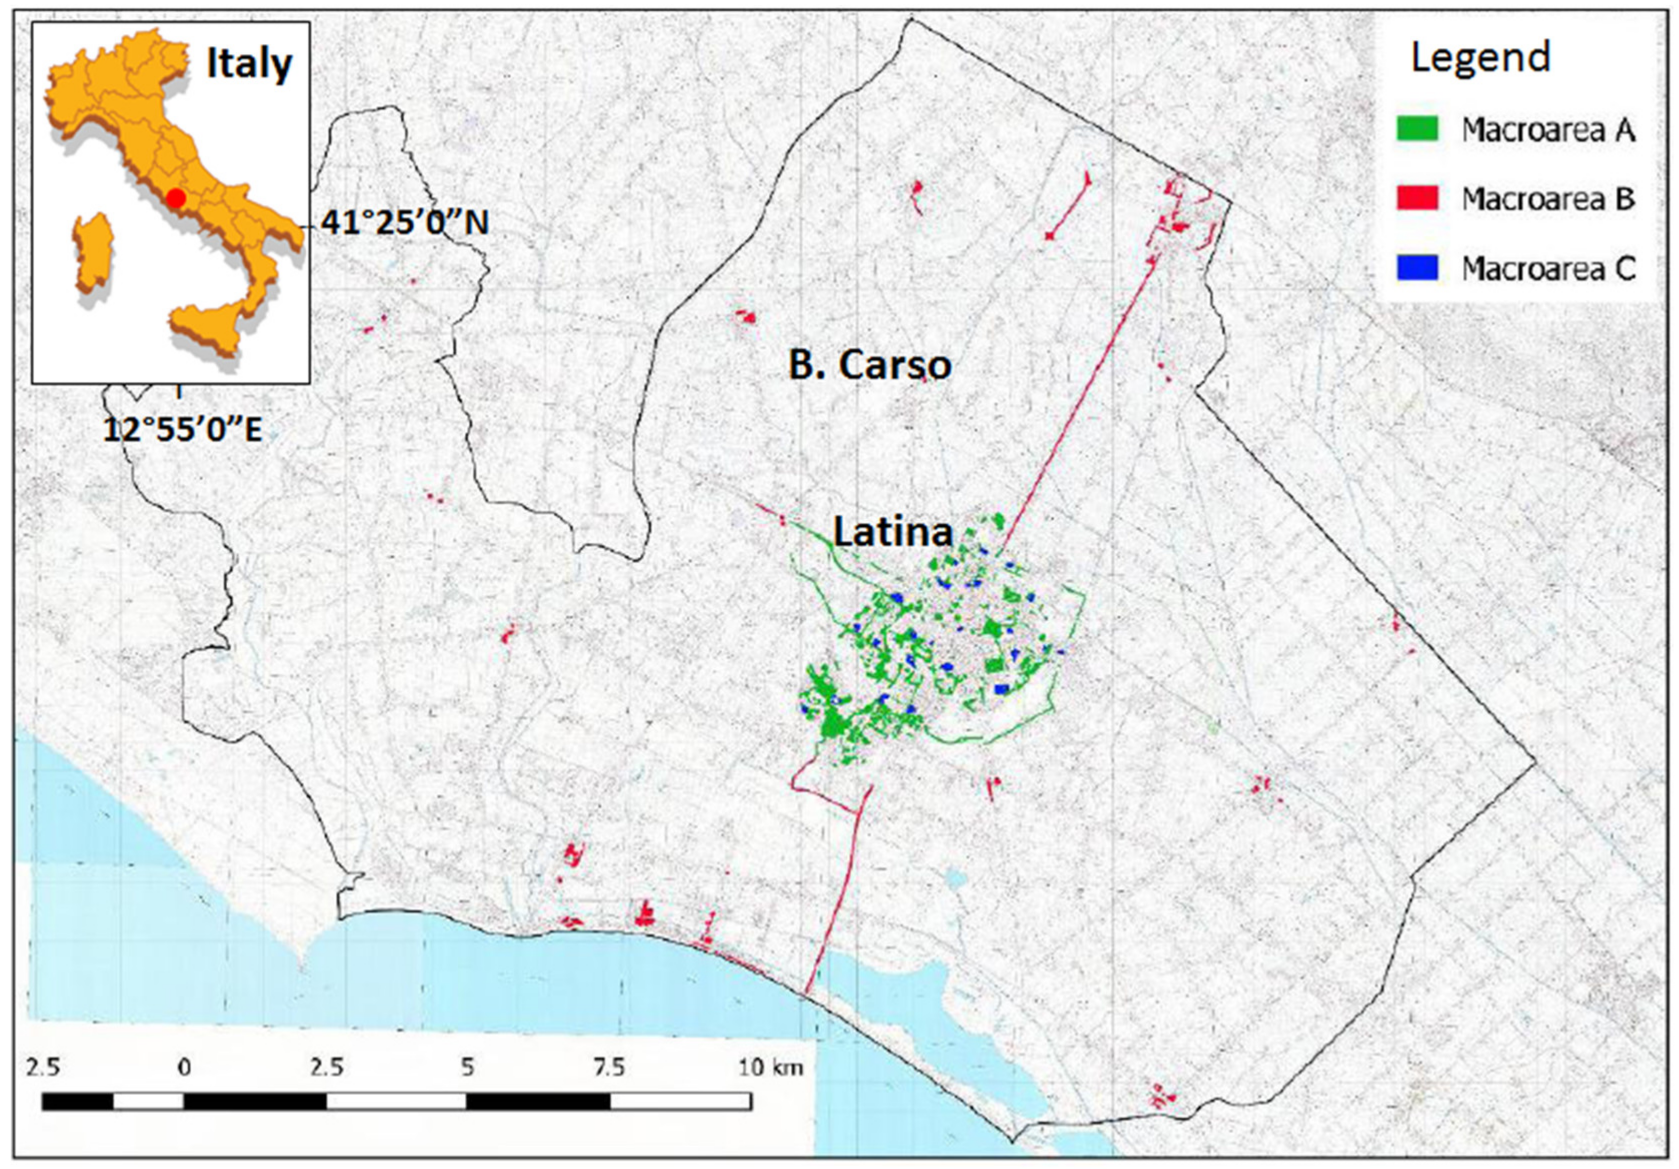
The city of Latina is in central Italy, approximately 60 km south of Rome. It is the capital of the Province of Latina, part of the southern Lazio Region, and it has a population of approximately 130,000 people, covering an area of 278 km2. It is in the center of Agro Pontino, an alluvial plain characterized by flat orographic conformation and by the presence of a coastal stretch that extends for approximately 30 km (Figure 1). The beach–dune system of the Circeo National Park is what remains of a barrier island that separated the Pontina coastal plain from the open sea during the Holocene Sea level rise [39,40,41]. The study area falls within the Mediterranean Region, in the thermotype of the Phytoclimatic Unit 12, as identified in the Phytoclimatic Map drawn up by the Department of Plant Biology of Sapienza University of Rome [42]. Evergreen plants represent approximately 66% of the woodland, and the rest consists of deciduous trees.
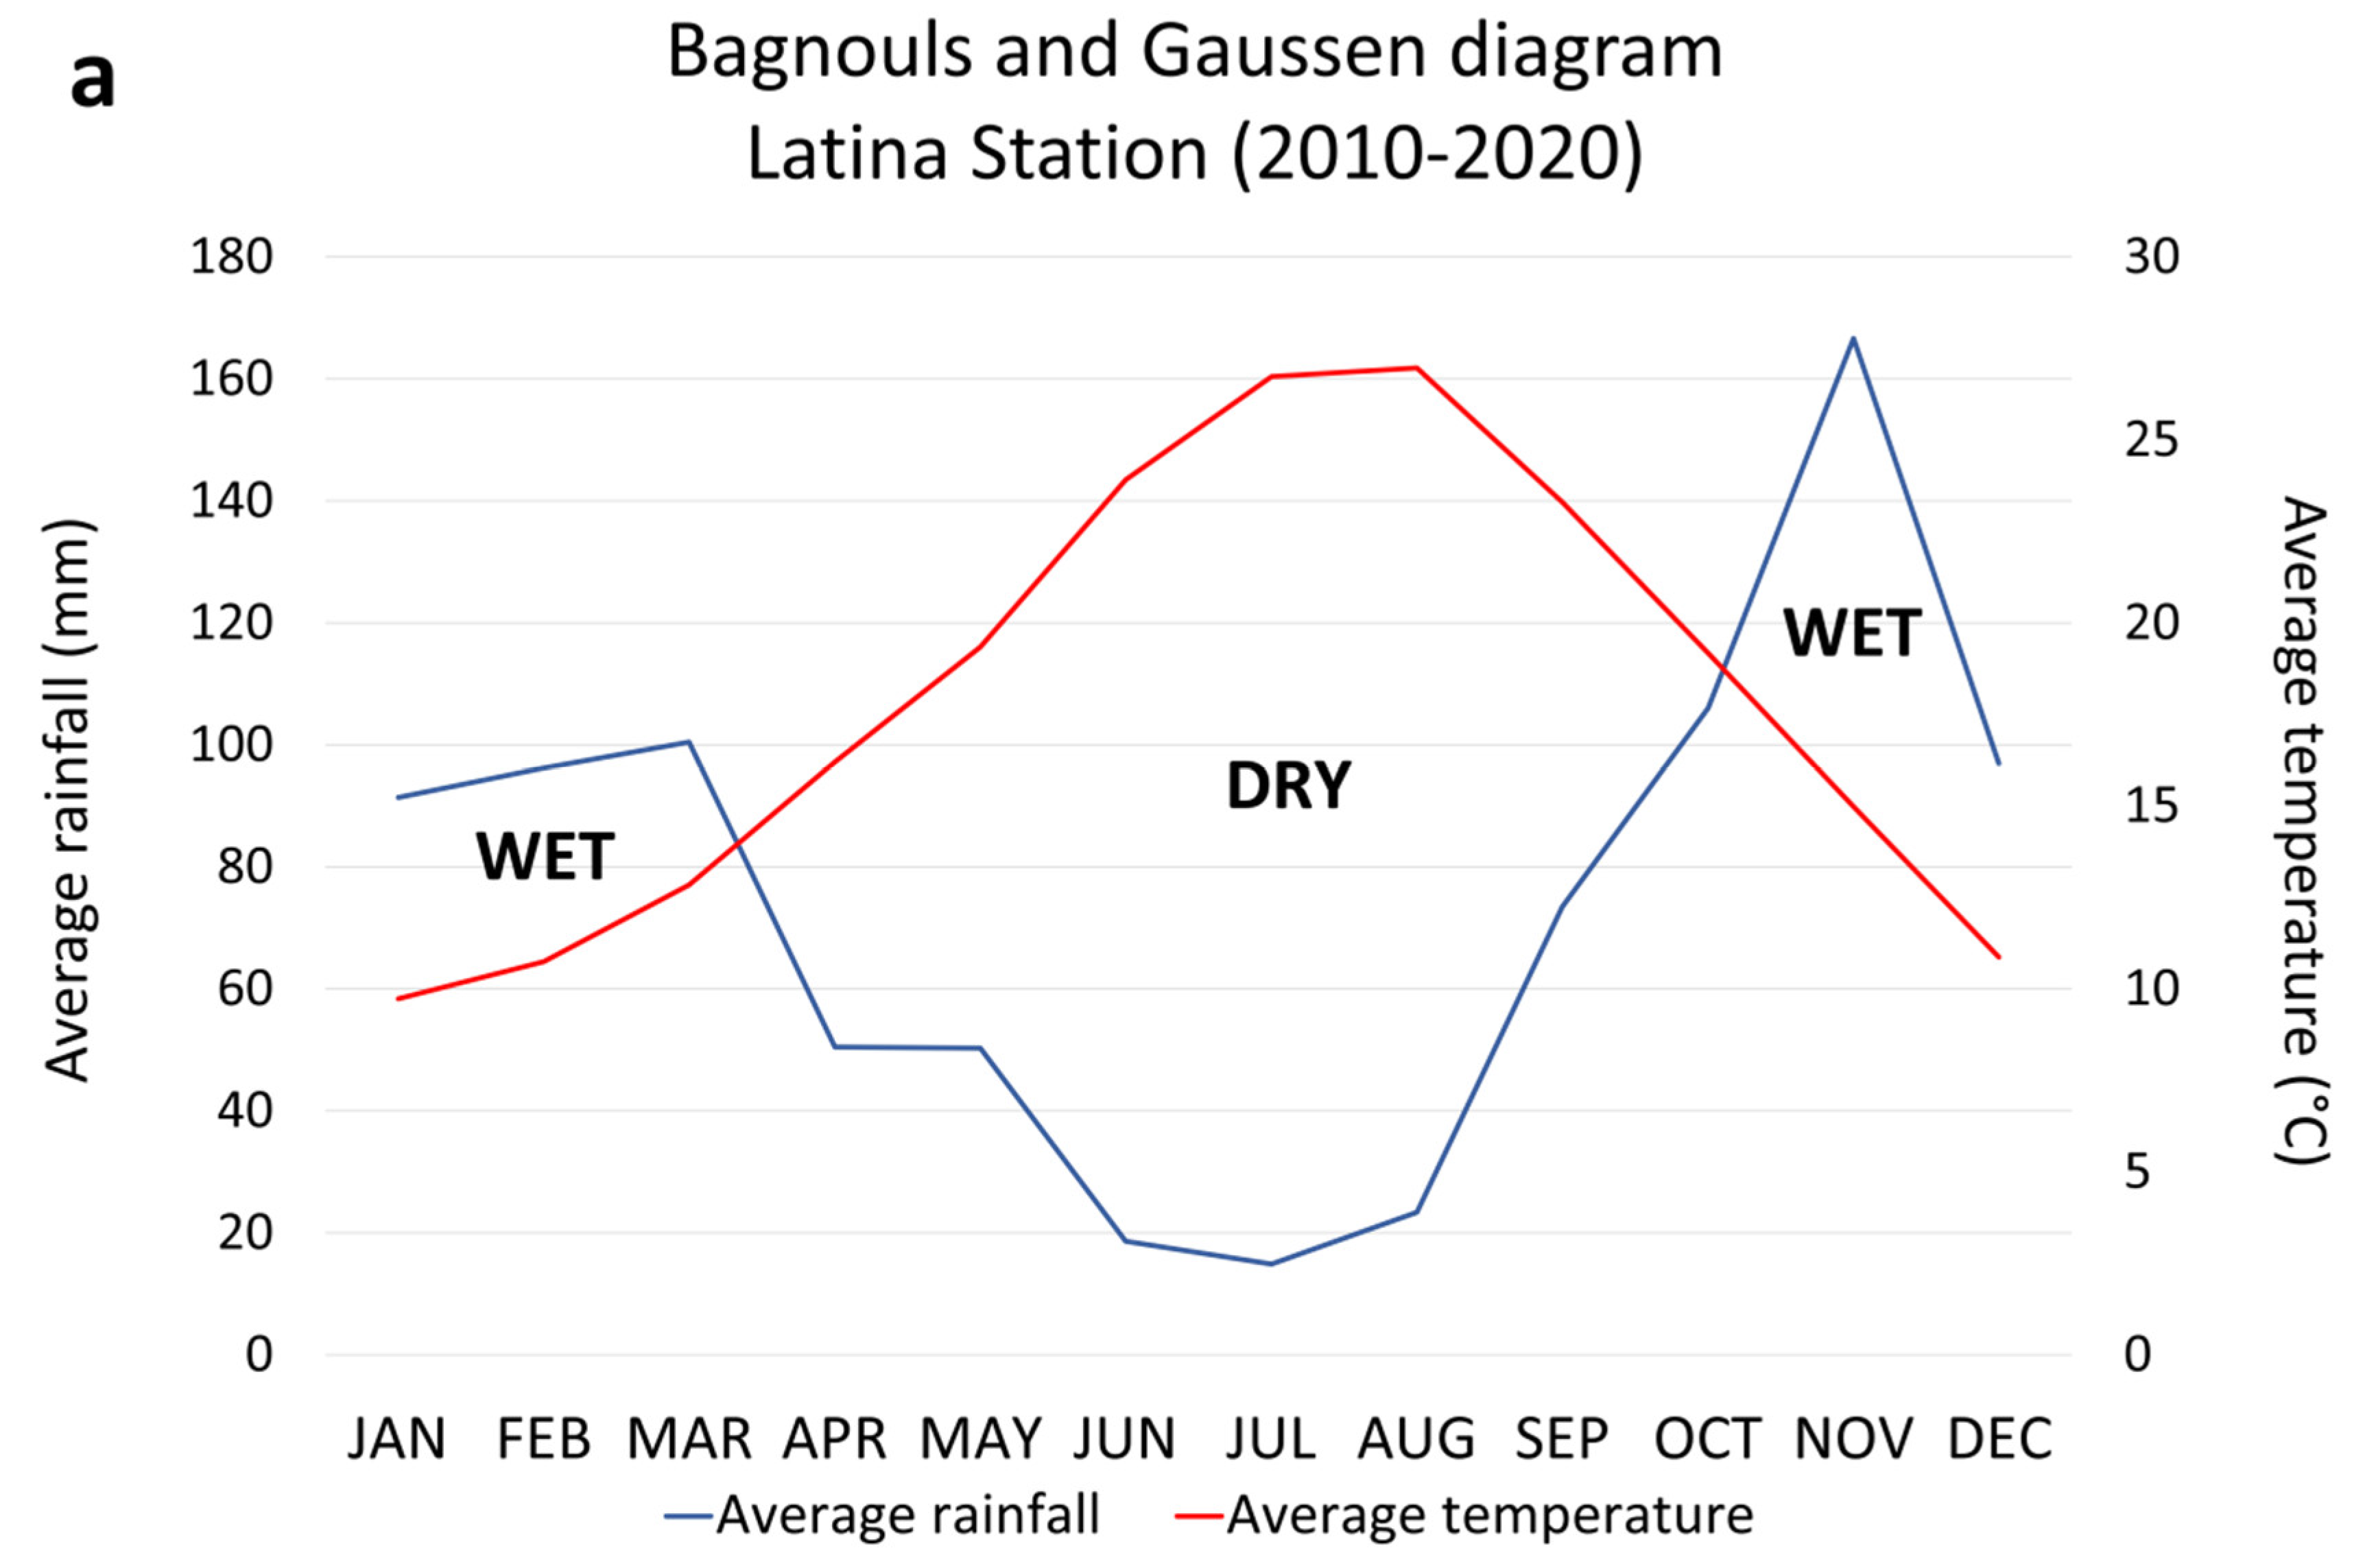
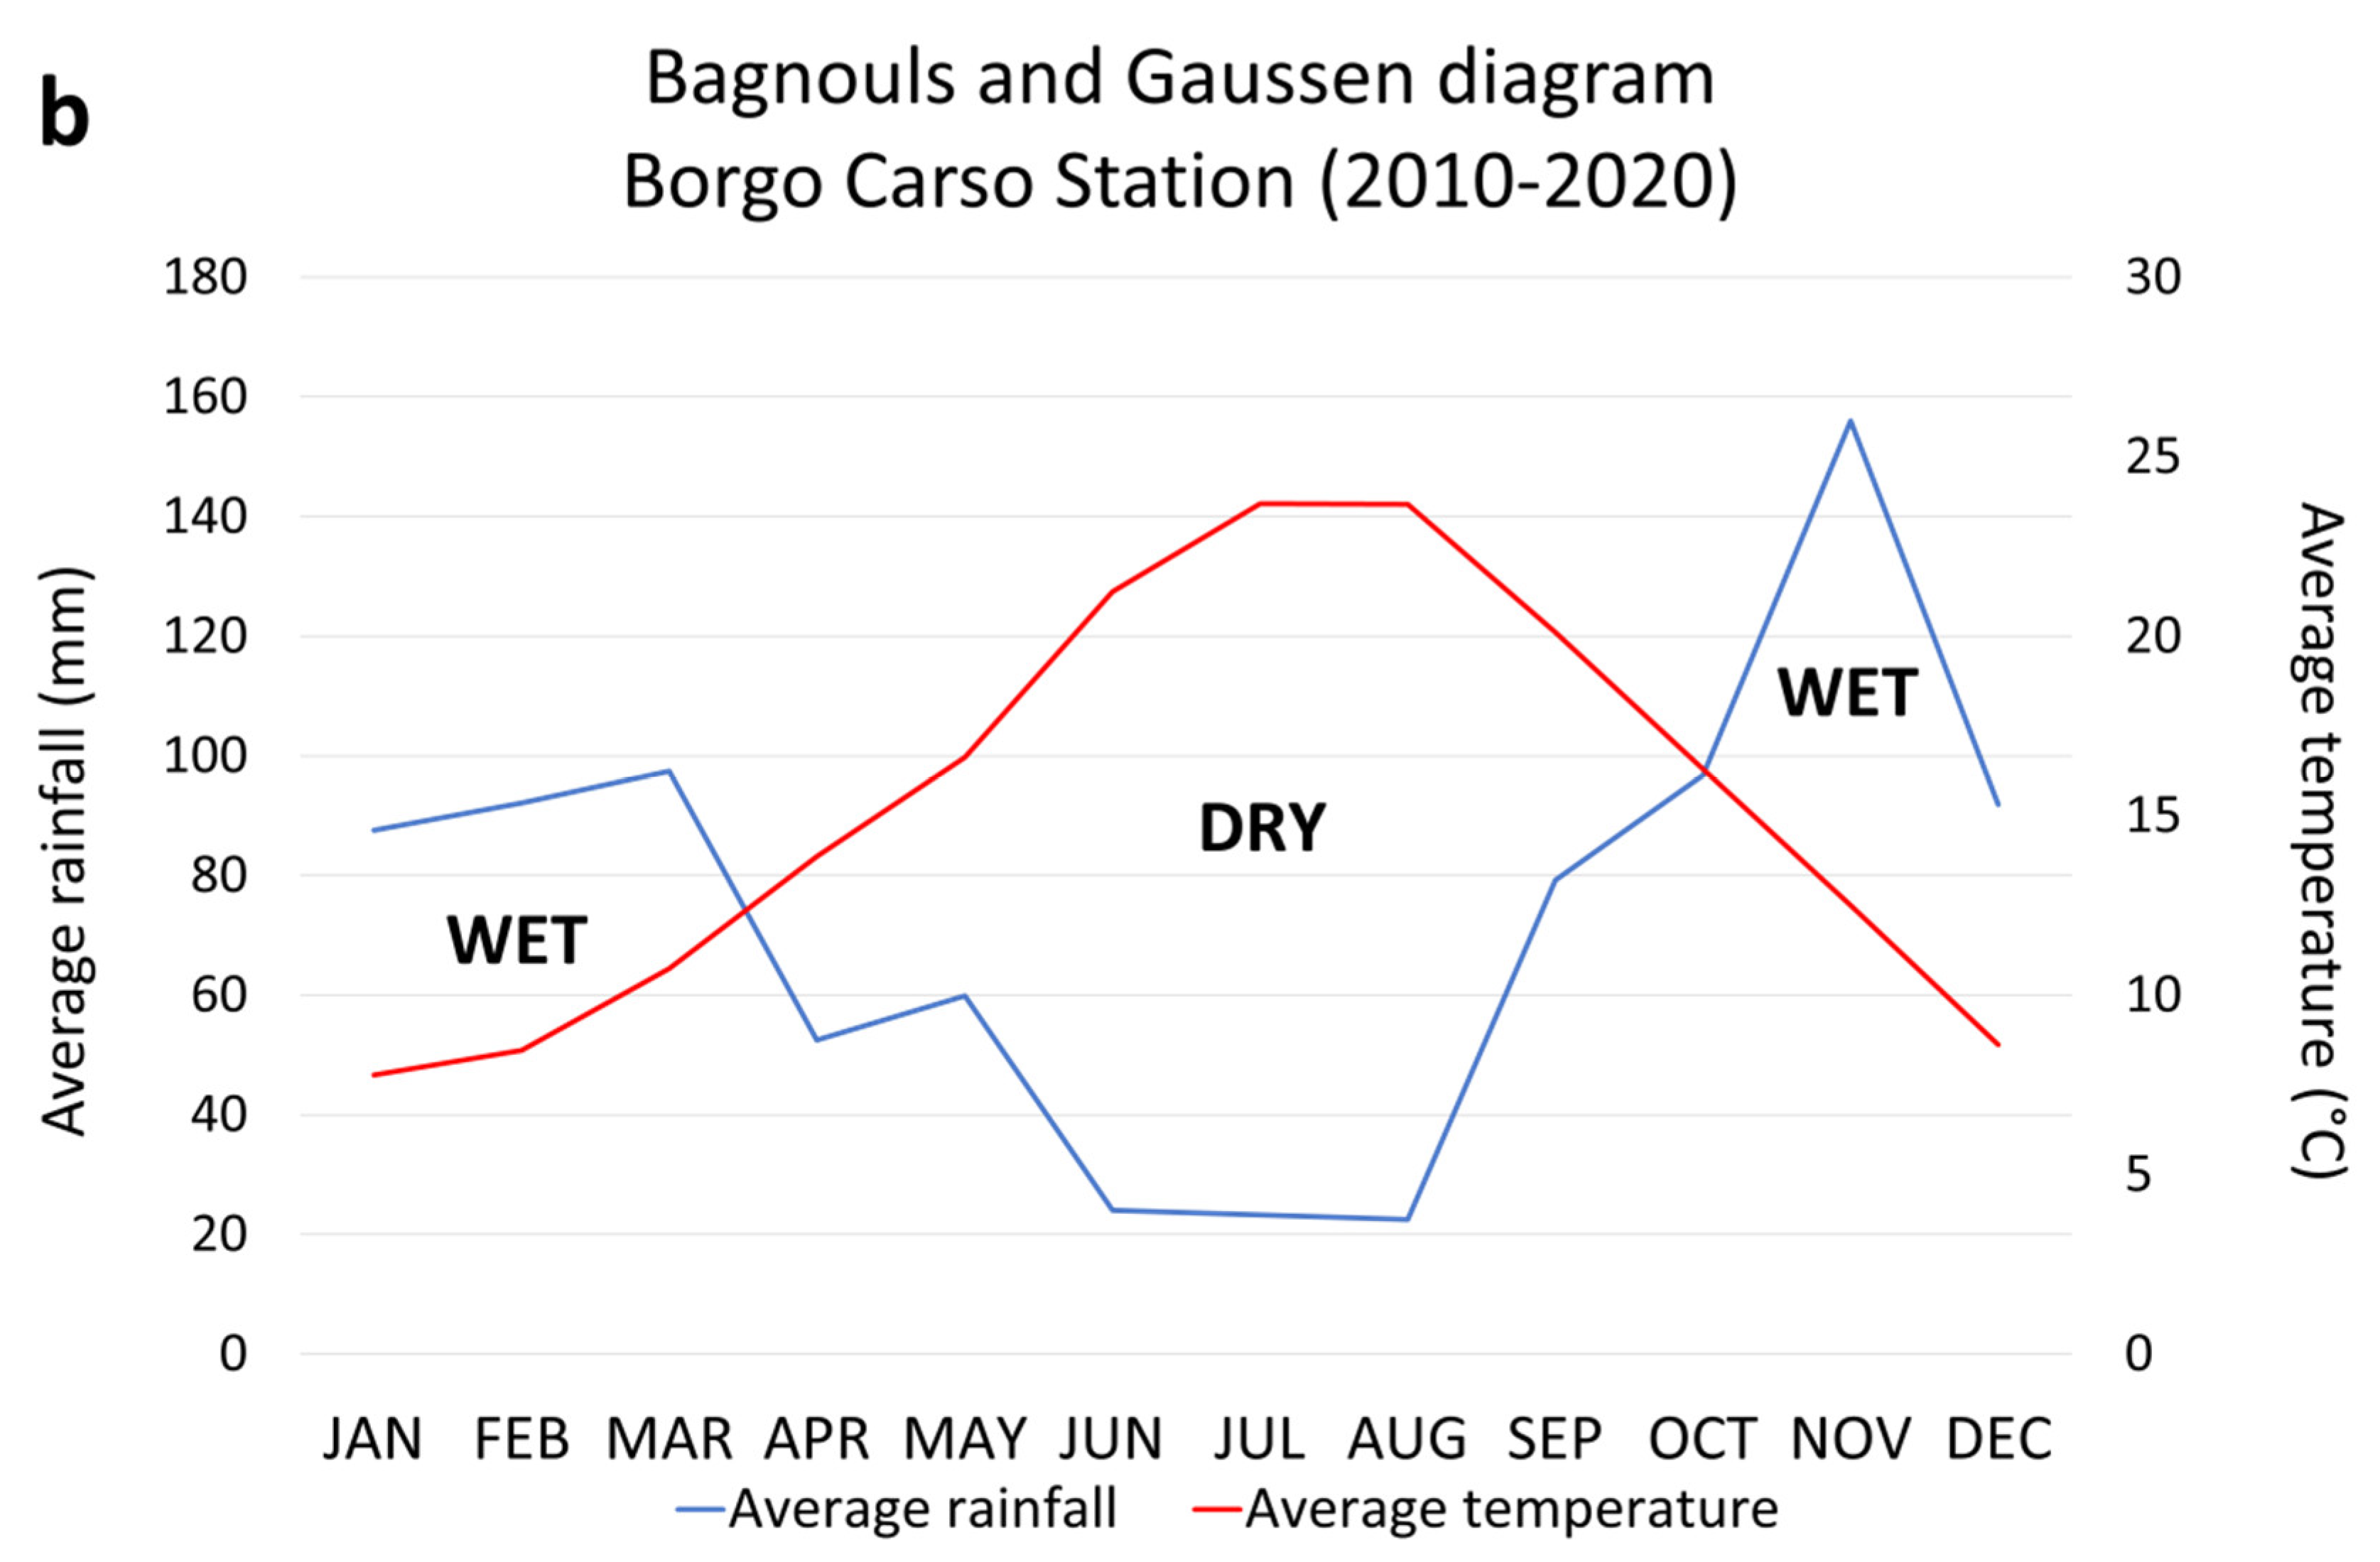
The climatic conditions were evaluated through the elaboration of precipitation and temperature measurements, using a time series of two meteorological stations: Latina and Borgo Carso (the latter in the suburbs, approximately 5 km away from the city center; Table 1). Bagnouls–Gaussen diagrams were obtained using data recorded in the time interval 2010–2020 (Figure 2). The average rainfall recorded a value of 883 mm for the Latina weather station and 882 mm for the Borgo Carso station. Average annual temperatures are: 17.9 °C for the city and 15.4 °C for rural surrounding areas. Drought periods occur between April and September, while rainfall is most significant between October and March. For the purposes of this study, the differences found between the values recorded by the two meteorological stations are considered insignificant and, therefore, any different growth rates of the horizontal green are also assumed to be negligible.
3. Materials and Methods
3.1. Green Areas Mapping
Much data and information were provided by the Municipality of Latina (Environmental and Civil Protection Service), the competent authority for the maintenance of Green Areas and Urban Open Spaces. A geodatabase was implemented to organize the multisource data and the material supplied. Thus, GIS elaborations were carried out. Cartographic products, orthophotos, and digital charts were integrated with other Open Data inputs according to the INSPIRE Directive [43] by using the open source QGIS software.
The complete list of data and materials is reported in Table 2. Data were processed according to the flow chart reported in Figure 3. The processing chain was divided into two phases: (a) database organization and (b) conversion of shapefiles into the Reference System (RS) of the geomatic project. The official national system, ETRF 2000, was used as RS; the shapefiles were created using the “Verto on Line” free software of the Geodetic Directorate of the Italian Military Geographic Institute (IGM).
The database thus generated was organized according to types and characteristics of the green areas considered in the present study; six different types of Urban Open Spaces (UOS) were described and used to discriminate different typologies of green infrastructures subject to periodic maintenance (Table 3). Citizens’ complaints were particularly helpful because during the most intensive grass growth period (April–June) many certified and conventional e-mails are usually sent to the administration to report problems related to the lack of cleaning and cutting of green areas. From their examination, the technical service found that a few UOS were not subject to green mowing because those areas were not included in the maintenance contracts or were not in the authority’s assets.
For the first time, all UOS of the city were mapped by using a GIS and represented in an updated DB of 2020. The type of maintenance to be carried out and, consequently, the different maintenance costs were estimated. Operational costs are affected by UOS characteristics and density of tree vegetation. To support maintenance and periodic intervention on both vertical and horizontal green infrastructures, three macro areas were identified (Figure 1): (A) green public areas of the city; (B) green public and school areas in the suburbs, and (C) green areas adjacent to schools within the city. The adopted criteria to distinguish these three areas has a dual function: to facilitate the management of public procurement contracts in different lots (at the same time supporting companies entrusted with the maintenance task) and to consider the different needs and expectations of students (that attend the schools every day) and citizens living in central and peripheral areas.
For all identified green areas, the following assumptions were made:
- Meteorology does not influence the planning of interventions;
- An average grass production of approximately 1.2–2 kg/m2/year has been considered;
- Variation of temperature and precipitation rate are not considered over the year.
The implemented procedure allowed us to census and survey all green public areas. The computerized census of green areas consists of a precise survey based on a multisource dataset [44]. The surveyed and geo-referenced elements were organized in excel files containing the classification, dimensional data, and indications of the main routine maintenance operations to be scheduled (see Supplementary Material). All the collected and surveyed data can be uploaded onto a webGIS green management platform that makes it possible to rationalize ordinary and extraordinary maintenance work on green areas. The green database can be integrated into the Municipality’s Territorial Information System [45,46]. Sport fields, green roofs or other green infrastructures that are part of the public asset but not under competence of green public maintenance services were not considered.
The reforestation of the city, according to a masterplan realized by Budoni et al. [47] should take place within green areas that are located around the city center. In this way, blue and green infrastructures will be able to create a green belt similar to those already created in other international contexts [48]. The first green belt proposal was made by the Greater London Regional Planning Committee in 1935 in order “to provide a reserve supply of public open spaces and of recreational areas”. Today, green belts cover a significant part of England and protect the countryside from urban sprawl [49,50].
As part of the aforementioned masterplan, the forestation plan of the study area is based on the following objectives:
- Use of plant species with similar pedoclimatic needs that are compatible with the soil properties and the territorial characteristics;
- Enhancing urban biodiversity and connections within networks of green areas;
- Increasing the number of plant species;
- Using endemic species with well-established performance;
- Reducing water requirements and maintenance.
3.2. Estimate of the Economic Needs by Using GreenCAL Tool
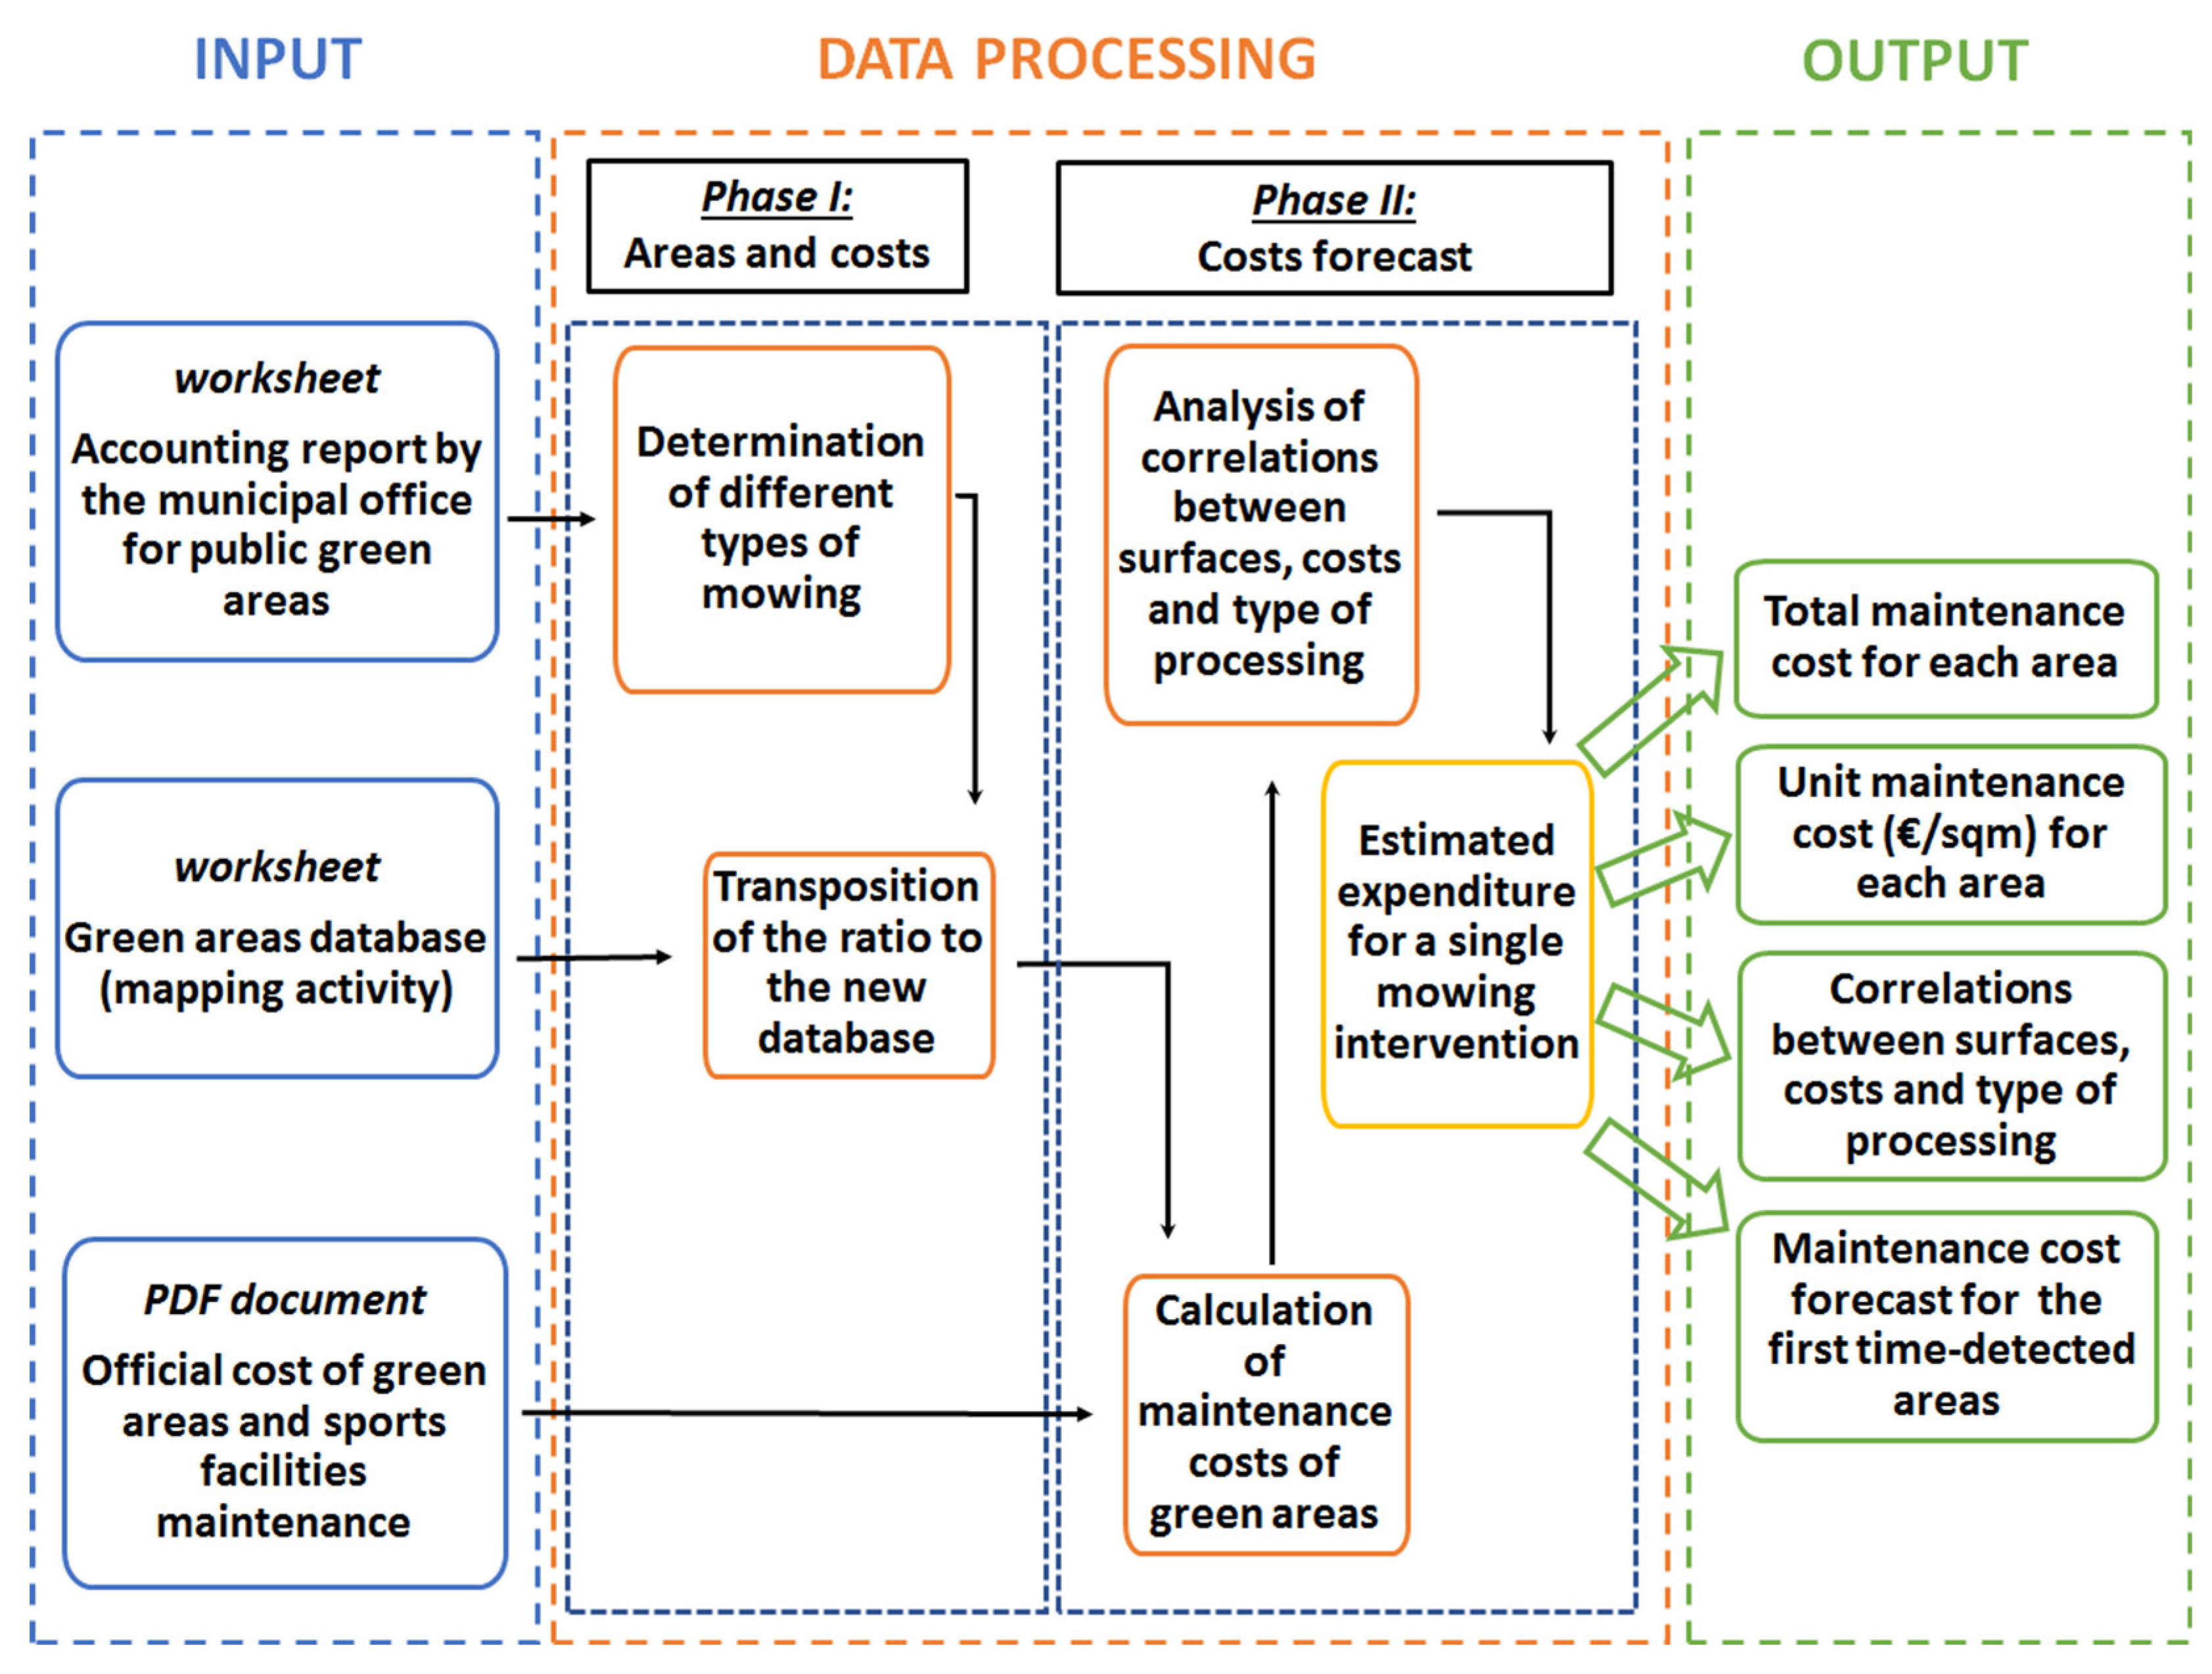
The GreenCAL Tool is Supplementary Material of the present manuscript. It allow to determine the necessary budget to ensure the maintenance of all the mapped green areas, the relationships between the area extension, the types of mowing, and the related costs were examined by using the data sources listed in Table 4.
Within a specific polygon (green area), the type of mowing was considered by selecting among mulcher, lawnmower, or brush cutter in order to determine the cost of a single area to be maintained. Thus, each area (m2) was associated with the unit cost (€/m2) indicated by the price list edited by the competent authority (Lazio Region, in the present case study). Within the same polygon, it is fundamental to know the percentages of the different types of mowing necessary to perform a cutting operation.
Available information related to the previous operational cost for each area was also considered in order to predict the budget needed for a single cutting operation of new mapped green public areas by correlating their extension with unit cost indicated by regional guidelines and protocols. Such correlation allowed for the forecasting of the cost for areas never treated before census or surveyed for the first time in the present study. The flow diagram of the implemented procedure is shown in Figure 4.
The GreenCAL tool allows for the determination of costs for each area and single processing was carried out considering two different options: with or without collection of the organic residues derived from the cutting. Therefore, for each area recorded in the database, a unit cost was determined by Equations (1) and (2), reported as follow:
where:
- : progressive number associated with each area;
- j: type of processing (j = 1 mowing with brush cutter, j = 2 mowing with lawnmower, j = 3 mowing with mulcher, and j = 4 for vegetation clean up—removal of bushes);
- : i-surface i- [m2];
- : part of surface i-th subject to j-th type of mowing [m2];
- unit price of the j-th processing without collection of the resulting material [€/m2];
- : unit price of the j-th work with collection of the resulting material [€/m2];
- : final unit cost of the i-th surface without collection of the resulting material [€/m2];
- : final unit cost of the i-th surface with collection of the resulting material [€/m2];
- n: number of UOS and green areas (n= 458 in the first census of the present study).
The following assumptions were made:
- The economic requirement for the maintenance of the surveyed areas is limited to grass mowing operations;
- The trees and their spatial distribution are not represented; therefore, the real working time and the actual quality of the material on the ground (purity of mowing) are neglected;
- The predicted cost for the areas mapped for the first time or for those for which no budget was available before data processing, was obtained from statistical correlations. Therefore, the cost indicated by competent authorities was used as a “high-cut filter” on the maximum unit costs obtainable for the specific area;
- Obstacles within the UOS, such as urban furnishing items, trees, pedestrian walkways, monuments, cycle paths, escarpments, etc., may somehow affect the processing time and the type of machinery used to cut the grass, nevertheless they are not taken into consideration.
3.3. Forestation of Abandoned Urban Open Space
Forestation actions on four outlying areas of the city were planned by the Municipality. Sites eligible for reforestation were chosen considering the use and destination of UOS, their compatibility with the urban masterplan, and social needs. The Strategic Plan, recently published by Professor Budoni et al. [47] of Sapienza University of Rome points out the need for a “green belt” of infrastructures to be developed in the future around the city of Latina. Within those four abandoned UOS, the maximum number of trees that could potentially be planted was determined by using the QGIS.
A random distribution was carried out by using the QGIS geostatistical research tool; the distance between each individual was not less than the distance between the plants required by the types of admissible trees considered, following INSPIRE’s Directive Principles [43]. The distance between plants varied from a minimum of 5 m (bushes and shrubs) to a maximum of 15 m (trees). Two species of trees and one of shrubs were chosen as examples for the evaluation of the potential CO2 absorption (carbon sink): Ulmus minor and Quercus cerris. Ulmus minor can reach a height of approximately 25 m and Quercus cerris 25–30 m. Laurus nobilis, a shrub species that can reach a height of approximately 6 m, was also taken into consideration, despite its low carbon absorption potential [48,49,50,51].
4. Results
4.1. Green Areas Mapping
The mapping of municipal green areas in a GIS environment was carried out for the Municipality of Latina for the first time. The ETRF2000 Geodetic Reference System ver. 2008.0 by the National Dynamic Network (RDN) was used with projection RDN2008/TM33 (EPSG code: 6708). Results were reproduced on cartographic support by using seven tables. In Figure 5, an example of the cartographic output of Macro Area A (city center) is shown.
A total of 458 green areas was surveyed, covering an area of 159.64 hectares (0.57% of the entire municipal territory). The minimum extension was ~14 m2 and the maximum was equal to ~13.5 hectares (137,584 m2). The present research updates and completes the previous database of the Municipality that covered a similar extension but was not corresponding to the present asset of the city, due to massive urban sprawl over the last twenty years. Four management approaches [52,53] for green infrastructures were adopted in the study area:
- Public procurements (private companies engaged through public selection);
- Internal gardener’s staff (daily engaged for high quality services);
- Sponsorships (carried out by third parties on a few highly visible spot);
- Collaboration agreements (spontaneous activity of citizens and volunteers).
They were divided among the macro-areas indicated in Table 5. Each area was associated with the attributes related to the type of cover in order to establish the appropriate cutting grass operation for each specific area.
The dataset of the present research can be implemented also by adding aerial photogrammetric and remote sensing techniques, allowing positioning on the maps of other census objects such as: trees, hedges, flowerbeds, roadside verges, lawns, playgrounds, details of playground equipment, and street furniture, on which other maintenance work can be planned.
The census to be carried out can have different levels of detail, depending on requirements [54]. GreenCAL can be supported by the creation of a database of knowledge and information that supports and plans interventions for urban green areas. Other information can be added to document, for example, tree safety by scheduling stability, pruning, planting and cut down; maintenance of playground equipment; planning financial resources; and documenting expenditure. In the future, the GreenCAL tool will be able to integrate the elements surveyed and georeferenced within each UOS, when these can be organized in tables and worksheets containing other information such as the botanical classification, dimensional data, conservation status, and indications of the main ordinary maintenance operations to be scheduled.
4.2. Estimate of Economic Needs
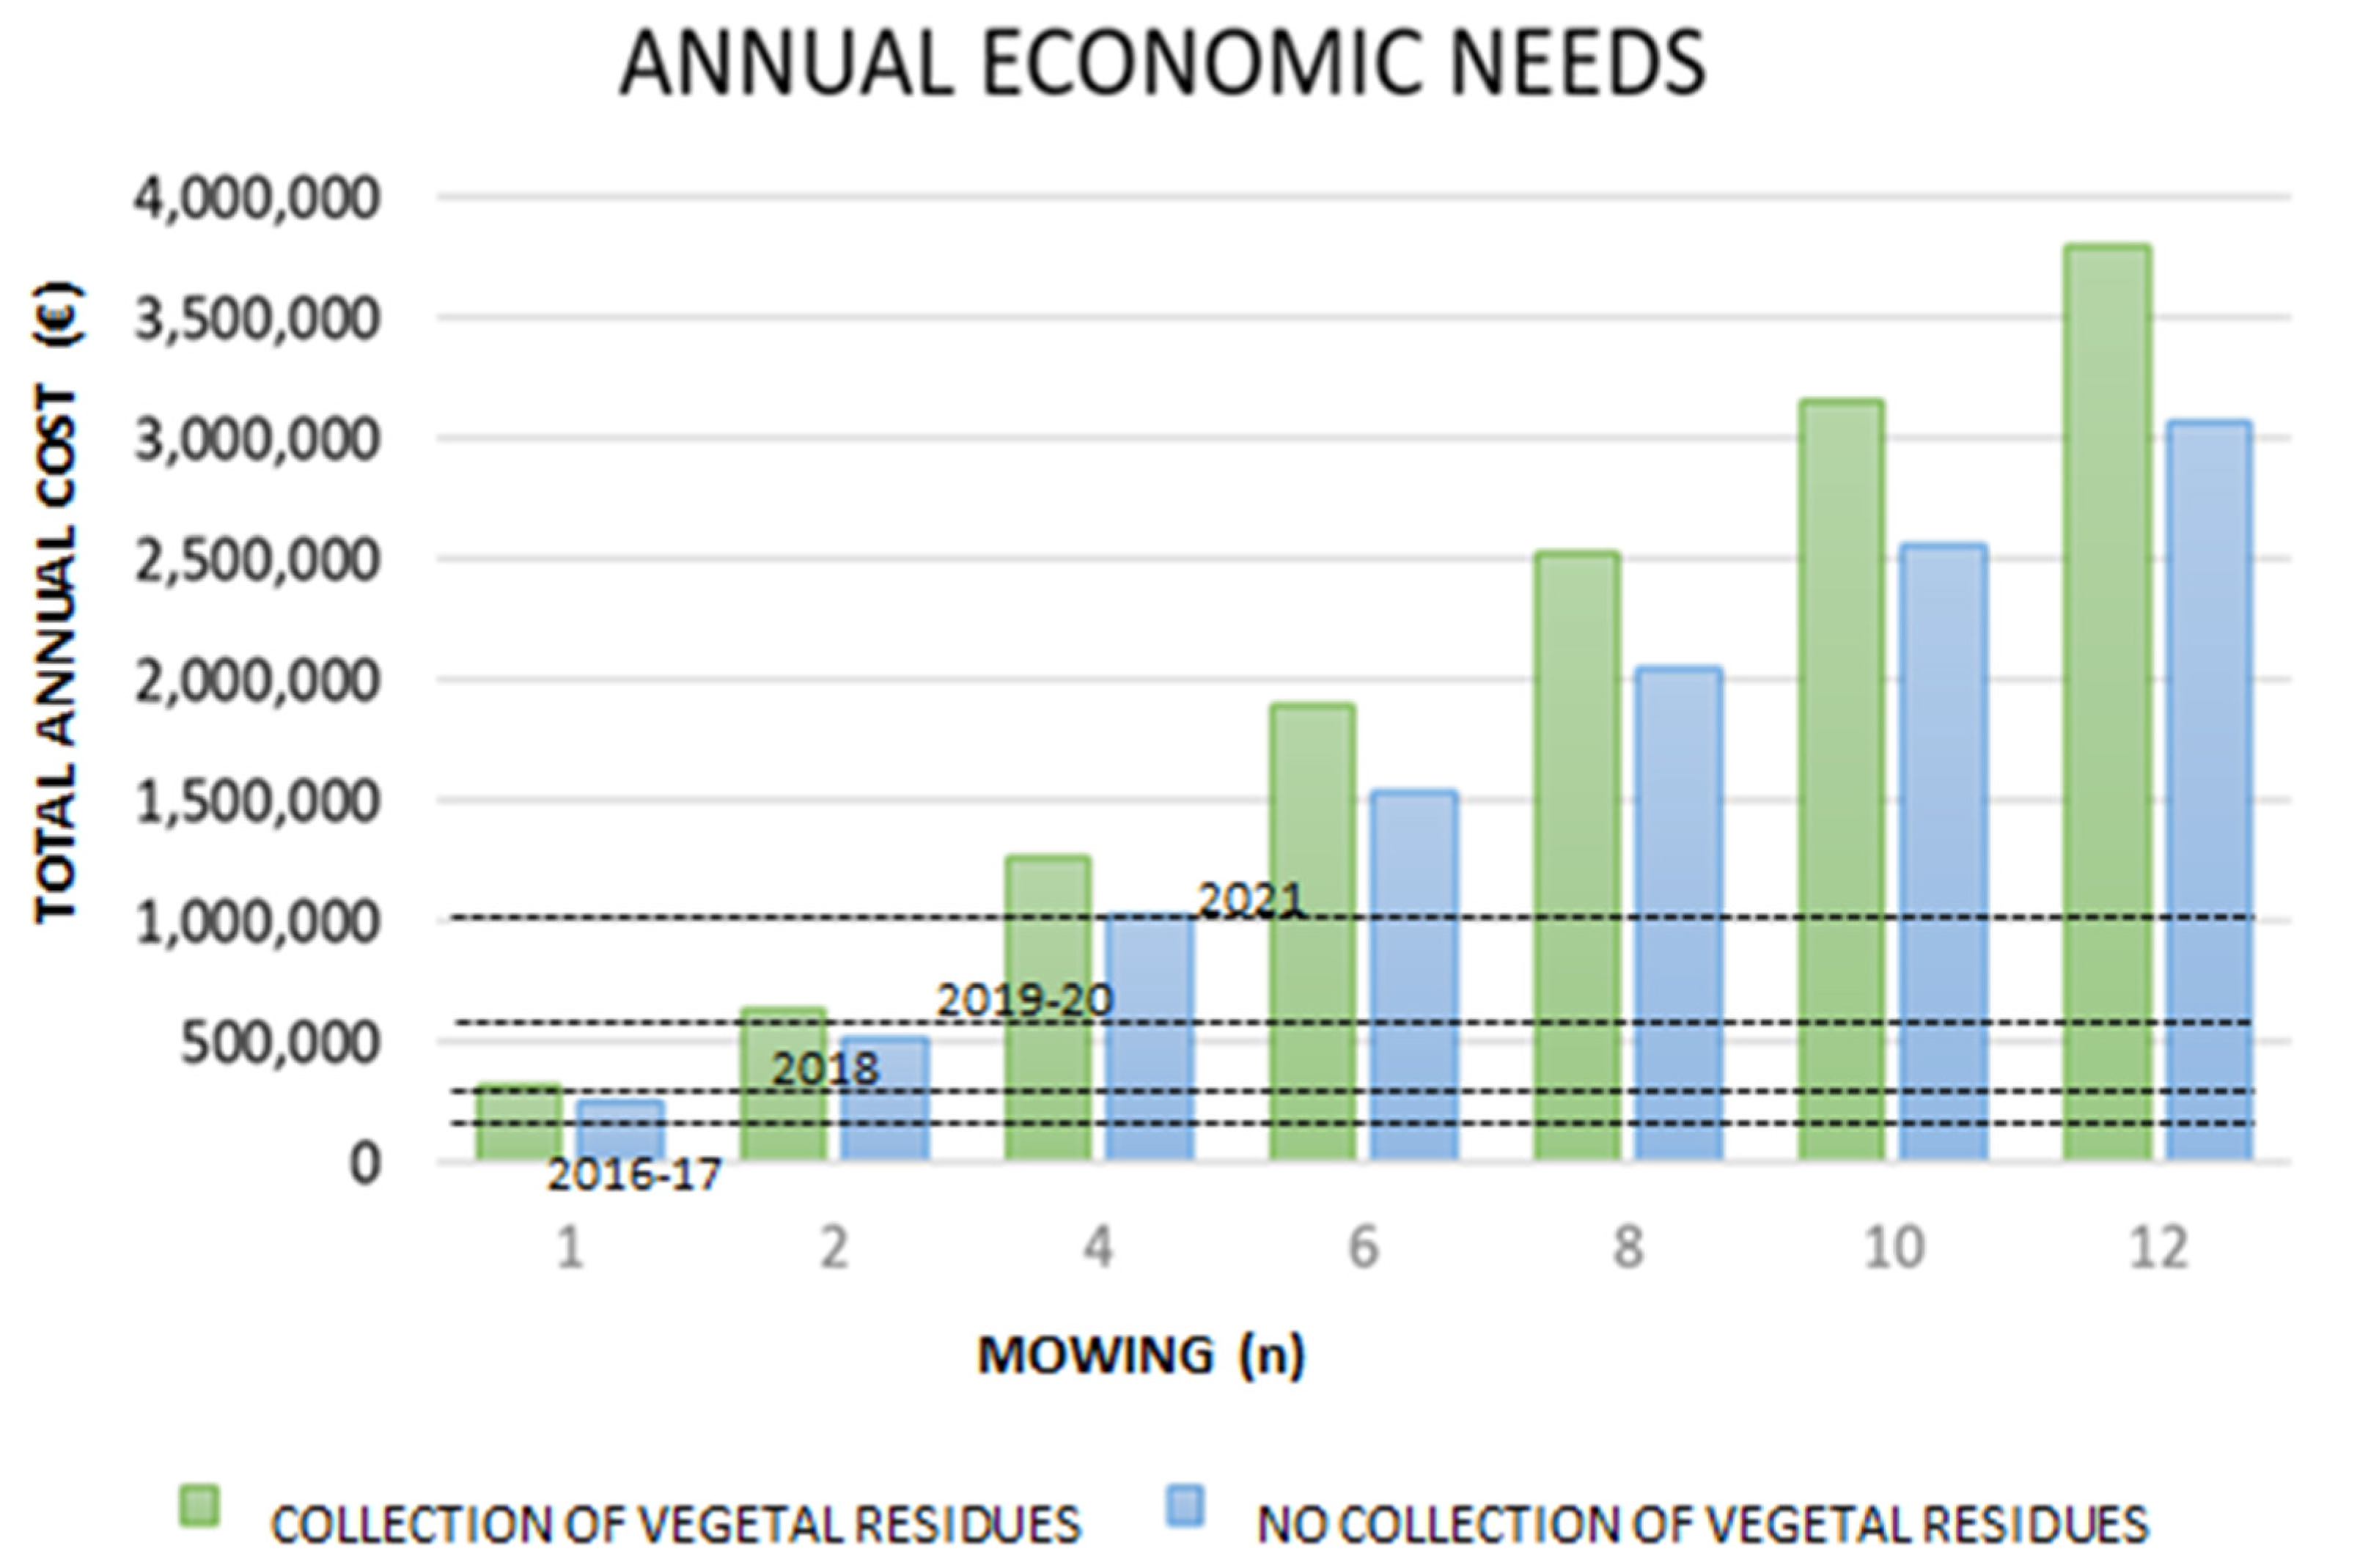
The expected costs were evaluated as a function of the number of cutting operations (with or without collection of the resulting material). The maintenance costs may vary from a minimum of 255,464 €/year for 1 cutting without collection of residues, to a maximum of 3,791,556 €/year in case of 12 mowings carried out with collection of vegetal residues (Table 6 and Figure 6).
The implemented procedure can be used to support all the administrative procedures of private companies and public administrations during the execution of the contracts. The cost of grass cutting within gardens and parks is rapidly estimated, and it can be mitigated by adopting automatic procedures to discriminate frequencies and the typology of intervention within different urban areas or other spatial analyses that consider the needs of the end users. The best standard of maintenance is obtained by carrying out 12 cutting operation every year, with the collection of vegetal residues, but the high operational costs represent an obstacle for many local authorities.
4.3. Implementation of Sustainable Cutting Grass Scenarios
The economic constraints of the municipalities do not allow this scenario to be adopted with high frequency. Within high maintenance level areas (for example parks, schools) mowing can be planned on regular basis (for example every two months during growing periods); within marginal and low frequented areas maintenance level can be minimized (2–3 times/year).
The characterization and the mapping of UOS improve their management and allow a differentiated frequency of maintenance operation. In this way, the UOS can be more accessible, easily frequented by citizens, and a reference for developing a more sustainable organic waste management. A production of vegetable biomass of approximately 1–2 kg/m2/y represents a significant cost in the hypothesis of a subsequent treatment in dedicated plants. Leaving cut grass on green areas after mowing contributes to fertilization and faster growth; mowing removal also increases running costs by nearly 24% (~23.7%).
Considering the meteoclimatic context of the study area, two scenarios were implemented to operate from March to October (spring–summer) when the growth rate of grass and the fruition of UOS are more intense. As suggested by the Italian National Committee for Public Green Spaces, UOS can be classified according to three different levels of maintenance: high, medium, and low ([55]; Table 7).
In Figure 7 and Table 8, an example of differentiated management scenarios is reported. These simulations demonstrate the potential of the DB implemented and the advantages of zonation of green areas. Having different frequencies of grass cutting operations within UOS, it is possible to conjugate the economic constraint of public administration with the expectation of the population and the different uses of UOS [56,57]. The adoption of a differentiated management of the areas was evaluated and the results indicate that the budget can be reduced from ~3.8 × 10⁶ €/y to ~1.5–1.3 × 10⁶ €/y (respectively −60% and −69%).
The first scenario envisages up to seven cuts each year for areas where a high level of maintenance is deemed necessary, and it involves an economic need of approximately 1.5 million €/y; the second scenario limits the maximum number of interventions to five and the costs decrease to approximately 1.2 million €/year (Table 8).
4.4. Estimate of the Carbon Sink through Reforestation
Four different areas were considered eligible for reforestation activities. Over 20 hectares of uncultivated areas were identified in four outlying parts of the study area. Transforming abandoned public green areas into woods or forested UOS can contribute to the creation of a green belt, favor multifunctional peri-urban areas, and mitigate the effects of climate change [58]. The number of shrubs and trees that could be planted ranges from a minimum of almost 700 plants to a maximum of approximately 6,000 shrubs (Table 9).
Preliminary plans of reforestation are supported by geomatics. Particular attention was taken to avoid a dense plantation scheme [48]. The prescribed number of living plants per m2 must be clearly indicated as well as their typology [59]. Specific climatic and soil conditions should be also taken into account, as the reforestation model must consider the different regions where it is applied and carefully select the autochthonous vegetation [60].
Distribution of plants, simulated by using a random arrangement, is reported in Figure 8. According to sequestration values indicated by Abbate et al. [12] and several authors ([61,62,63] and included references), this activity can contribute to mitigate climate changes with a potential carbon sink estimated between 97.6 and 133 t/y of CO2.
The first Italian Forest Atlas surveyed 120 forestation macro-projects carried out by private companies between 2019 and 2021 in synergy with non-governmental organizations dedicated to monitoring and reducing CO2 emissions [64]. The results of reforestation initiatives in Italy are very promising: 450,000 trees planted over 585 hectares generated an eco-systemic value of 2.6 mln/€ year [64]. In recent years, many companies have chosen to invest in the creation of shared value with local communities and territories world-wide, often involving employees, stakeholders, and their own customer base in virtuous paths [54]. Following this trend, the reforestation project discussed in the present study can contribute to a more sustainable landscape management and mitigation of climate change, thanks to the reduction of urban heat shield [64,65]; potential private investors could execute reforestation under authorization and supervision of the Municipality.
5. Discussion
The implemented methodology allowed us to monitor and to map Urban Open Spaces and green public areas. An efficient and a rational management of public green spaces requires knowledge and identification of the municipal heritage by means of a computerized census of UOS; in this regard, the use of a GIS can best support planning interventions. The tool described in the present manuscript can be exported to other contexts at the international level.
Cost variations are mainly related to labor and fuel price. Therefore, the tariffs that many developed countries adopt to regulate public procurements can be significant. A comparison with other case studies and among different continents is not possible yet due to both the innovative topic of the present research and the large cost variability, but the GreenCAL Tool, which is provided in the Supplementary Material of the present manuscript, allows the calculation of the cost maintenance for each single mowing operation. Thanks to the results of the present research, it will be possible to calculate the cost of maintenance for each green area, based on extension and grass cutting typology (mulcher, lawnmower, or brush cutter).
Beside the many ecological prerogatives that are internationally recognized for green public areas (from social environmental and economic points of view [13] and referenced therein), in the present paragraph we discuss the various fallouts of the present research from a technical-administrative point of view.
We believe that by considering a regulatory framework that could improve organic waste management, it will be possible to influence a better and a more sustainable management of UOS, changing the current widespread paradigm of many municipalities that often associate green areas to cost instead of opportunities for the social and the economic growth of local communities.
5.1. Management Approach for UOS’s Maintenance
The four management approaches [52,53] of land use and green infrastructure management adopted in the study area have a different impact on the overall management of public green areas. From the economical point of view, most of the mowing activities are carried out by external procurements (90.2%), followed by internal gardener’s staff (7.6%), sponsorships (1.1%), and collaboration agreements (1.1%). The distribution of participation [65,66,67,68] within the study area and a user-oriented management approach to support social inclusion (sponsorships and collaboration agreements) is represented in Figure 9.
The multisource geodatabase can be easily adapted to new urban areas. The integration of different data sources is fundamental; the census of not surveyed or mapped UOS is always a critical issue that requires a constant update of datasets and mapping. If a local administration does not have an updated database or census of green areas, the information provided by citizens about abandoned UOS is relevant to complete the necessary monitoring of public space heritage. In the present research, all abandoned areas were included. New green areas can be periodically added thanks to the contribution of citizen participation, which provides a constant and a reliable contribution to update the heritage of public spaces. This kind of participation is an example of “citizen science” [68].
5.2. Contribution of Mowing to a Virtuous Organic Waste Management
Mowing and pruning cuttings from urban areas can be considered both as a waste and as a resource. According to European Directive 2008/98, mowing and pruning can have two distinct origins: from agricultural and forestry environments or from the maintenance of urban green areas (whether public or private). In the first case they are not to be considered waste and can be used directly in agriculture and in forestry, or transferred to biomass treatment plants. In the second case, they must be considered as organic waste and, before being reused, they require various treatments, including sanitation, sterilization, and separation from other types of materials that may be present within collected vegetal biomasses.
European Recommendation n 35/2008 clearly highlighted the need to “facilitate the separate collection and proper treatment of organic waste in order to produce compost and other materials based on organic waste that do not pose a risk to the environment”. The objective of the legislator was to identify the composting supply chain as a prior destination for vegetal biomasses from urban green maintenance. Mowing is the structuring element to produce organic soil conditioners that can be used in agriculture after treatment. In this context, mowing and pruning from public green UOS are urban waste identified and managed by using the EER code “20 02 01” better known as “biodegradable waste” (Table 10).
At the European level, 70% of mowing is disposed of and 30% is recovered [66,67]. In Italy, the products resulting from the maintenance of public green areas are approximately 1.9 × 10⁶ t/y, more than 27% of the produced organic waste [22]. To enhance the value of organic waste in terms of the circular economy, the hierarchical waste management principles (prevention, reuse, recycling, energy production, disposal) should be considered. However, in many countries, landfilling of bio-waste is still a common practice, but the European Directive 2009/28/EC and subsequent amendments tried to reverse such trends following the principle of sustainable development [35,69].
Mulching is a cutting technique that consists of finely chopping the grass and distributing it uniformly over the ground without necessarily removing it [70]. Mulching is becoming a widespread methodology used to maintain UOS, because loading and hauling of mowing is avoided and it can contribute to cost-savings. In addition, the induced fertilization reduces the amount of nitrogen (N), phosphorous (P), and organic carbon (C) [70,71,72]. Phosphorus is included in the list of critical raw materials by the European Commission since 2017 and its concentration within turf mowing is approximately 1% by weight [69,71]. Such concentration could return between two and three t/year of phosphorus in the study area, considering that approximately 160 hectares of public green could yield 1.9–3.2 × 10² t/year of mowing products.
Two foremost destinations of mowing and pruning were recently considered at the European level. One possibility is the production of compost, to be used as a soil conditioner in agriculture (reuse and recycling principle). A large part of organic waste is sent to the composting chain, and it has a significant cost in Italy ranging from 45 €/ton (for large suppliers) up to 60 €/ton [55]. Another option is energy production, which in the past years has been hindered by the alternate classification of this material as waste or by-product [19,20,21,27,65,73].
Several research projects have focused on social acceptance of biogas and biomethane [74]. It was estimated that the benefit for the Italian Public Administration varies between 240 and 360 × 106 €/year of revenue since the potentially available amount of urban pruning is around 3–4 × 10⁶ t/y. The authors are carrying out an independent market research on disposal costs of vegetal residues, identifying an economic commitment of disposal cost of approximately 180–240 × 106 € against a possible revenue, in case of use for energy production, of 80–120 × 106 €. This research is still in progress as the variability of cost and revenues is also influenced by annual government incentives.
5.3. Alternative Options to Improve Management of UOS and Reduce Organic Waste Production
Urban green waste represents an input for the two phases of the biogas production process: upstream of digestion but also downstream of it, used together to the solid fraction of the so-called “digestate”, with which it would be sent to composting. Each technology offers different possibilities: from energy recovery through combustion to biological treatments. Italy is the second European biogas producer after Germany; in Europe, central and southern countries still have a great potential for both compost and biogas production [74]. An obstacle to the enhancement of urban green cuttings is the presence of waste, often observed and disposed around road routes and litter bins. Plastics, paper, bottles, and cans accidentally dispersed on the ground can be removed by the operators before cutting operations are carried out (Figure 10).
The quality of the vegetal residues represents the main obstacle to the use of these materials also in biomass plants [54]. Pollution by plastics and other types of waste, the most common cases of contamination, could make the incoming material unsuitable and also lead to a reduction in volume useful for fermentation due to a progressive accumulation of inert material. For this reason, the collection of bio-waste should be organized in order to reduce impurities. Composting is considered as recycling, if the compost is used as a soil enhancer/fertilizer. Anaerobic digestion is categorized as an energy recovery technique. The advantages and the disadvantages of the closing of cycles and of contributing to the supply of organic carbon, fertilizers, and critical raw material are still debated [75,76], nevertheless uncollected clippings can contribute to reducing the production of waste, and they can represent a source of organic matter when incorporated into the soil.
Differentiated residue management would also have an important impact on the maintenance costs borne by local authorities. It would be reasonable to treat the clippings coming from urban areas (with major impurities) as organic waste, while those coming from marginal green areas and outlying UOS as by-products. In this way, mowing from large, scarcely frequented, and “unpolluted” UOS can be treated as it is done in agriculture and part of the UOS maintenance could provide fertilizers and locally support the circular economy. An interesting alternative to reduce waste production could be to encourage “community composting” in such a way affecting social, environmental, and economic indicators, as it can contribute to reduce CO2 emissions and costs, including the environmental.
Self-production of compost or “community/proximity composting” has great potential for the treatment of organic waste, despite the current legislative limitations related to the absence of economic incentives. With reforestation and the management of green public areas, both municipalities and local communities would find the woodland areas in which to use part or all the self-produced compost and also use the material coming from the mowing of lawns.
Defining and measuring the impact of alternative management options described above is very complex. Many researchers are involved in the determination of indicators for the circular economy (CE; [77]) that include quantitative studies such as Life Cycle Assessment (LCA), the role of recycling, optimization of a material’s value as a benchmark of efficiency, reduction of ambiguity, and definitions of CE (at least 114 in 2017 for Kirchherr et al. [78]).
5.4. Limitation and Perspective of the Present Research
The assumptions made in the present research involve minor limitations that may change forecasts of grass cutting duration and operational costs. Climate changes can vary precipitation rate and temperature values at different time scales [79]. So, biomass production may change year to year, modifying the cost of mowing in case of removal of vegetal residues.
Authorities that will adopt results of the present research and GreenCAL Tool will be able to calibrate the data over time. Local administrations should consider the initial extension values of mapped green areas as a starting point. Modification may occur over time and geomatics can allow updating of GIS and DB, if necessary. For instance, it will be possible to carry out the census of all trees within UOS; their density will influence the machinery to be used for mowing, i.e., the cost of cutting grass operations. Within a certain polygon/UOS, it should be necessary to eliminate some portions of the green areas that will not be subject to periodic mowing operations when improvements (such as pedestrian walkways, monuments, fountains, cycle paths, etc.) are carried out in the future.
Another factor that can significantly influence landscape design is the tendency to use or to increase natural lawns and perennial plants which have many advantages: a more natural appearance and lower maintenance levels are the most significant. Beauty, aesthetics, perception of space, including public green space, are subjective. Individual perceptions does not always fit with the natural landscape and the low maintenance level of UOS. Green open spaces and new landscape design are becoming very important for architecture and landscape management of modern urbanization plans [80].
Education of the population to a new landscape aesthetic is an important issue; the choice of natural, autochthonous, low water consumption species should be explained and supported at all levels to improve the sustainability of management of green wilder areas [81]. An urban linear park like the New York High Line can be considered as an important example of a green infrastructure obtained by reclamation of an abandoned rail. It attracts more than five million visitors every year, and it increases the values of nearby real estate, offering a view of the city, the Hudson River, and natural planting or gardening typologies.
Many other cities are considering and following this example. Conversion of brownfield into greenfield within urban areas is beyond the purpose of the present study, but it is worth mentioning that 3% of the soil in Italy is contaminated and new tendencies in the architecture and the design of UOS may contribute to modifying our approach to managing and, consequently, to maintaining our green public areas in the future.
6. Conclusions
The several conclusions reached in the present study, concerning the sustainable management of green areas, can be summarized as follows:
- The UOS and their maintenance play a major role in managing the urban ecosystem in order to guarantee full and safe enjoyment by citizens. Constant and effective management of UOS influences the ecology, landscape, health, hygiene, and recreational aspects of society;
- Geoinformation technology can provide a useful and a flexible tool for mapping UOS. In the future, new technologies such as Copernicus services and, in general, the processing of high-resolution satellite images, with the increase of specific competences of the public administrations’ technical services, may open new horizons for environmental characterization and the development of more exhaustive analysis, supporting an increasingly effective and comprehensive urban and landscape management;
- The computational modules implemented in this work can be adopted as a standard to support correct management and to reduce the production of lignocellulosic organic waste. Specific algorithms, calibrated by using the costs of public procurements, allowed us to support investments for differentiated maintenance of public green areas in relation to their destination, also to reduce fire risks during dry season;
- The methodology implemented in the present paper allows the management of public green areas, taking into account the frequency of maintenance and foreseeing the cost for new areas. The developed model, which can be easily updated and applied to other contexts by means of variable cost units, helps to determine the number of mowing operations required and the related budget allocations necessary for cutting operations within public green areas. The option of managing plant residues is a relevant factor that strongly affects operating costs. The obtained scenarios can contribute to decreasing the budget necessary to carry out periodic maintenance of the UOS: in the study area, a 60–70% cost cut was highlighted by operating in this way.
- The maintenance of mowing within UOS influences their usability and healthiness. UOS management must be carefully defined within the framework of urban planning in order to prevent budget disruptions due to high management costs and increasing waste production: suffice it to say that mowing removal increases running costs by nearly 24%.
- European legislation defines biodegradable waste from gardens and parks as organic waste, and waste from public green maintenance (leaves, grass cuttings, and tree pruning) are classified as urban waste. The reluctant attitude of the Italian legislator to adapting national legislation similar to the European seems influenced by the objectives of the circular economy, which consider prevention of the production of waste as a priority action. It is not the first time that some natural resource is subject to an oscillatory classification, which considers it as a waste and a resource at the same time [81]. Such contradiction could be considered through differentiated management options, following the principles of the circular economy. Future perspectives for the exploitation of cuttings need to be considered, since large, sparsely frequented and “unpolluted” UOS offer the opportunity to contribute to the production of community or proximity compost, as well as their use in agriculture.
- Reforestation activities within uncultivated green areas can also be easily simulated using the geospatial analyst tool of QGIS from which CO2 adsorption can be estimated and mitigation and adaptation strategies against climate changes at a local scale can be sustained.
Supplementary Materials
The “GreenCalTool2022” is available online at https://0-www-mdpi-com.brum.beds.ac.uk/article/10.3390/land11060886/s1. The Excel file has been implemented in order to determine the maintenance costs of grass cutting operation within Urban Open Spaces (UOS) and Green Areas.
Author Contributions
Conceptualization, S.C. and A.C.; methodology, S.C. and S.N.; software, S.N.; validation, S.C., S.N. and A.C.; formal analysis, S.C. and S.N.; investigation, S.N.; resources, S.C. and S.N.; data curation, S.C. and S.N.; writing—original draft preparation, S.C., S.N. and A.C.; writing—review and editing, S.C. and A.C.; visualization, S.N., S.C.; supervision, S.C.; project administration, S.C.; funding acquisition, S.C. All authors have read and agreed to the published version of the manuscript.
Funding
This research received financial support from the Italian Phosphorous Platform (https://www.piattaformaitalianafosforo.it/ accessed on 25 May 2022) managed by ENEA and funded by Ministry of Ecological Transition (Law n 205 of 27 December 2017, art. 1, c 122 and Decree RIN-DEC-2018-0000155 del 13/11/2018, art. 2, c. 2).
Institutional Review Board Statement
Not applicable.
Informed Consent Statement
Not applicable.
Data Availability Statement
Dataset can be found c/o Authors.
Acknowledgments
Special thanks is addressed to Maria Rita Damiani, Maura Nascimben, Raffaele Feliciello (Municipality of Latina), Mihaela Mircea and Nicola Colonna (ENEA), Giovanni Gigliotti (University of Perugia; CIRS-Waste and Healt Committee) for their interest, support and fruitful discussion on scientific, technical and management issues.
Conflicts of Interest
The authors declare no conflict of interest.
References
- Jansson, M.; Vogel, N.; Fors, H.; Randrup, T.B. The governance of landscape management: New approaches to urban open space development. Landsc. Res. 2019, 44, 952–965. [Google Scholar] [CrossRef]
- Von der Leyen, U. A Union That Strives for More. My Agenda for Europe. 2019. Available online: https://ec.europa.eu/commission/sites/beta-political/files/political-guidelines-nextcommission_en.pdf (accessed on 10 January 2022).
- Reynolds, H.L.; Brandt, L.; Fischer, B.C.; Hardiman, B.S.; Moxley, D.J.; Sandweiss, E.; Speer, J.H.; Fei, S. Implications of climate change for managing urban green infrastructure: An Indiana, US case study. Clim. Change 2020, 163, 1967–1984. [Google Scholar] [CrossRef]
- Wen, C.; Albert, C.; Von Haaren, C. The elderly in green spaces: Exploring requirements and preferences concerning nature-based recreation. Sustain. Cities Soc. 2018, 38, 582–593. [Google Scholar] [CrossRef]
- Rouse, D.C.; Bunsterossa, I.F. Green infrastructure: A landscape approach. Apa Plan. Advis. Serv. Rep. 2013, 571, 1–164. [Google Scholar]
- Montyanarella, L.; Panagos, P. The relevance of sustainable soil management within the European Green. Land Use Policy 2021, 100, 104950. [Google Scholar] [CrossRef]
- Simmons, M.; Bertelsen, M.; Windhager, S.; Zafian, H. The performance of native and non-native turfgrass monocultures and native turfgrass polycultures: An ecological approach to sustainable lawns. Ecol. Eng. 2011, 37, 1095–1103. [Google Scholar] [CrossRef]
- Smetana, S.; Crittenden, J. Sustainable plants in urban parks: A life cycle analysis of traditional and alternative lawns in Georgia, USA. Landsc. Urban Plan. 2014, 122, 140–151. [Google Scholar] [CrossRef]
- Tong, J.; Sun, X.; Li, S.; Qu, B.; Wan, L. Reutilization of Green Waste as Compost for Soil Improvement in the Afforested Land of the Beijing Plain. Sustainability 2018, 10, 2376. [Google Scholar] [CrossRef]
- Velasco, E.; Roth, M.; Norford, L.; Molina, L.T. Does urban vegetation enhance carbon sequestration? Landsc. Urban Plan. 2016, 148, 99–107. [Google Scholar] [CrossRef]
- Mell, I.; Allin, S.; Reimer, M.; Wilker, J. Strategic green infrastructure planning in Germany and the UK: A transnational evaluation of the evolution of urban greening policy and practice. Int. Plan. Stud. 2017, 22, 333–349. [Google Scholar] [CrossRef]
- Abbate, S.; Di Paolo, L.; Carapellucci, R.; Cipollone, R. Carbon uptake dynamics associated to the management of unused lands for urban CO2 planning. Renew. Energy 2021, 178, 946–959. [Google Scholar] [CrossRef]
- Sundevall, E.P.; Jansson, M. Inclusive Parks across Ages: Multifunction and Urban Open Space Management for Children, Adolescents, and the Elderly. Environ. Res. Pubblic Health 2020, 17, 9357. [Google Scholar] [CrossRef]
- Rodewald, P.G.; Matthews, S.N. Landbird use of riparian and upland forest stopover habitats in an urban landscape. Condor 2005, 107, 259–268. [Google Scholar] [CrossRef]
- Mason, J.; Moorman, C.; Hess, G.; Sinclair, K. Designing suburban greenways to provide habitat for forestbreeding birds. Landsc Urban Plan. 2007, 80, 153–164. [Google Scholar] [CrossRef]
- Kemperman, A.; Timmermans, H. Green spaces in the direct living environment and social contacts of the aging population. Landsc. Urban Plan. 2014, 129, 44–54. [Google Scholar] [CrossRef]
- Ballard, W.B.; Wilson, S.; Udale-Clarke, H.; Illman, S.; Scott, T.; Ashley, R.; Kellagher, R. The SuDS Manual; CIRIA: London, UK, 2015; 937p. [Google Scholar]
- Barnes, M.R.; Nelson, K.C.; Meyer, A.J.; Watkins, E.; Bonos, S.A.; Horgan, B.P.; Meyer, W.A.; Murphy, J.; Yue, C. Public land managers and sustainable urban vegetation: The case of low-input turfgrasses. Urban For. Urban Green. 2018, 29, 284–292. [Google Scholar] [CrossRef]
- Sobol, Ł.; Dyjakon, A.; Suardi, A.; Preißmann, R. Analysis of the possibility of energetic utilization of biomass obtained from grass mowing of a large-area golf course—a case study of Tuscany. Energies 2021, 14, 5520. [Google Scholar] [CrossRef]
- Shukla, P.; Giri, B.S.; Mishra, R.K.; Pandey, A.; Chaturvedi, P. Lignocellulosic biomass-based engineered biochar composites: A facile strategy for abatement of emerging pollutants and utilization in industrial applications. Renew. Sustain. Energy Rev. 2021, 152, 111643. [Google Scholar] [CrossRef]
- Boscaro, D.; Pezzuolo, A.; Grigolato, S.; Cavalli, R.; Marinello, F.; Sartori, L. Preliminary analysis on mowing and harvesting grass along riverbanks for the supply of anaerobic digestion plants in north-eastern Italy. J. Agric. Eng. 2015, 46, 100–104. [Google Scholar] [CrossRef]
- Giacetti, W.; Venturi, R.; Lepore, P. Le raccolte differenziate dei rifiuti organici: Considerazioni sui sistemi di raccolta. Tratto da Sito web Consorzio Italiano Compostatori; Cavenago Brianza, Italy, 2007. Available online: https://www.compost.it/biblio/2007_giornata_monotematica/Etra_Giacetti.pdf (accessed on 20 April 2019).
- Kaza, S.; Yao, L.C.; Bhada-Tata, P.; Van Woerden, F. What a Waste 2.0: A Global Snapshot of Solid Waste Management to 2050; Urban Development; World Bank: Washington, DC, USA, 2018; 295p, Available online: https://openknowledge.worldbank.org/handle/10986/30317 (accessed on 10 May 2022).
- ISPRA. Rapporto Rifiuti Urbano, 1st ed.; Istituto Superiore Protezione Ambientale: Rome, Italy, 2022; p. 255.
- Tursi, A. A review on biomass: Importance, chemistry, classification, and conversion. Biofuel Res. J. 2019, 6, 962–979. [Google Scholar] [CrossRef]
- Wang, S.; Meng, Q.; Zhu, Q.; Niu, Q.; Yan, H.; Li, K.; Li, G.; Li, X.; Liu, H.; Liu, H.; et al. Efficient decomposition of lignocellulose and improved composting performances driven by thermally activated persulfate based on metagenomics analysis. Sci. Total Environ. 2021, 794, 148530. [Google Scholar] [CrossRef] [PubMed]
- Cucina, M.; Pezzolla, D.; Tacconi, C.; Gigliotti, G. Anaerobic co-digestion of a lignocellulosic residue with different organic wastes: Relationship between biomethane yield, soluble organic matter and process stability. Biomass Bioenergy 2021, 153, 106209. [Google Scholar] [CrossRef]
- Fonseca, F.G.; Soares Dias, A.P. Almond shells: Catalytic fixed-bed pyrolysis and volatilization kinetics. Renew. Energy 2021, 180, 1380–1390. [Google Scholar] [CrossRef]
- Hubble, A.H.; Ryan, E.M.; Goldfarb, J.L. Enhancing pyrolysis gas and bio-oil formation through transition metals as in situ catalysts. Fuel 2022, 308, 121900. [Google Scholar] [CrossRef]
- Blüthgen, N.; Dormann, C.F.; Prati, D.; Klaus, V.H.; Kleinebecker, T.; Hölzel, N.; Alt, F.; Boch, S.; Gockel, S.; Hemp, A.; et al. A quantitative index of land-use intensity in grasslands: Integrating mowing, grazing and fertilization. Basic Appl. Ecol. 2012, 13, 207–220. [Google Scholar] [CrossRef]
- Lee, H.-Y.; Tseng, H.; Zheng, M.C.; Li, P.Y. Decision support for the maintenance management of green areas. Expert Syst. Appl. 2010, 37, 4479–4487. [Google Scholar] [CrossRef]
- Dobson, J.; Dempsey, N. Working out What Works: The Role of Tacit Knowledge Where Urban Greenspace Research Policy and Practice Intersect. Sustainability 2019, 11, 5029. [Google Scholar] [CrossRef]
- Yung, E.H.K.; Ho, W.K.O.; Chan, E.H.W. Elderly satisfaction with planning and design of public parks in high density old districts: An ordered logit model. Landsc. Urban Plan. 2017, 165, 39–53. [Google Scholar]
- Laatikainen, T.E.; Broberg, A.; Kyttä, M. The physical environment of positive places: Exploring differences between age groups. Prev. Med. 2017, 95, 85–91. [Google Scholar] [CrossRef]
- Rutt, R.L.; Gulsrud, N.M. Green justice in the city: A new agenda for urban green space research in Europe. Urban For. Urban Green. 2016, 19, 123–127. [Google Scholar] [CrossRef]
- Wolch, J.R.; Byrne, J.; Newell, J.P. Urban green space, public health, and environmental justice: The challenge of making cities ‘just green enough’. Landsc. Urban Plan. 2014, 125, 234–244. [Google Scholar] [CrossRef]
- Breuste, J.; Artmann, M.; Li, J.; Xie, M. Special Issue on Green Infrastructure for Urban Sustainability. J. Urban Plann. Dev. 2015, 141, A2015001. [Google Scholar] [CrossRef]
- Lindberg, M.; Schipperijn, J. Active use of urban park facilities—Expectations versus reality. Urban For. Urban Green. 2015, 14, 909–918. [Google Scholar] [CrossRef]
- Pallottini, E.; Cappucci, S. Beach-dune system interaction and evolution. Rend. Online Soc. Geol. Ital. 2009, 8, 87–97. [Google Scholar]
- Valentini, E.; Taramelli, A.; Cappucci, S.; Filipponi, F.; Nguyen Xuan, A. Exploring the dunes: The correlations between vegetation cover pattern and morphology for sediment retention assessment using airborne multisensor acquisition. Remote Sens. 2020, 12, 1229. [Google Scholar] [CrossRef]
- Taramelli, A.; Cappucci, S.; Valentini, E.; Rossi, L.; Lisi, I. Nearshore Sandbar Classification of Sabaudia (Italy) with LiDAR Data: The FHyL Approach. Remote Sens. 2020, 12, 1053. [Google Scholar] [CrossRef]
- Bosco, A. Caratteri fitoclimatici dei bacini della Pianura Pontina. E-book. In: Azione 8.2—Linee guida interventi Canali di Bonifica. Relazione tecnico-illustrativa finale. Progetto Life Rewetland (LIFE 08 ENV/IT/000406). 2013, pp. 24–27. Available online: https://pdc.minambiente.it/sites/default/files/progetti/immagini/linee_guida_canali_bonifica.pdf (accessed on 20 February 2022).
- Directive 2007/2/EC of the European Parliament and of the Council, transposed by Legislative Decree n° 32 of 27 January 2010. Available online: https://eur-lex.europa.eu/legal-content/EN/ALL/?uri=CELEX%3A32007D1578 (accessed on 20 February 2022).
- Cappucci, S.; Buffarini, G.; Giordano, L.; Hailemikael, S.; Martini, G.; Pollino, M. Local geology and seismic-induced damages: The case of Amatrice (Central Italy). In Lecture Notes in Computer Science, Proceedings of the ICCSA 2020, Cagliari, Italy, 1–July 2020; Springer: Cham, Switzerland, 2020; Volume 12250, pp. 950–962. [Google Scholar]
- Cappucci, S.; De Cecco, L.; Geremei, F.; Giordano, L.; Moretti, L.; Peloso, A.; Pollino, M. Earthquake’s rubble heaps volume evaluation: Expeditious approach through earth observation and geomatics techniques. Lect. Notes Comput. Sci. 2017, 10405, 261–277. [Google Scholar]
- Cappucci, S.; De Cassan, M.; Grillini, M.; Proposito, M.; Screpanti, A. Multisource water characterisation for water supply and management strategies on a small Mediterranean Island. Hydrogeol. J. 2020, 1, 1–17. [Google Scholar] [CrossRef]
- Budoni, A. Studi per il Piano Strategico per la Città di Latina, 1st ed.; Aracne: Genzano di Rome, Italy, 2021; 512p, ISBN 979-12-5994-852-6. [Google Scholar]
- Marinoni, F.; Agostoni, C.M. Manuale di Progettazione degli Spazi Verdi; Zanichelli: Bologna, Italy, 1987; p. 178. [Google Scholar]
- Chunyang, Z.; Peng, J.; Shuhua, L. Effects of Urban Green Belts on the Air Temperature, Humidity and Air Quality. J. Environ. Eng. Landsc. Manag. 2017, 25, 39–55. [Google Scholar] [CrossRef]
- Bauduceau, N.; Berry, P.; Cecchi, C.; Elmqvist, T.; Fernandez, M.; Hartig, T.; Raskin-Delisie, K. Towards an EU Research and Innovation Policy Agenda for Nature-based Solutions & Re-naturing Cities: Final Report of the Horizon 2020 Expert Group on ’Nature-Based Solutions and Re-naturing Cities’; Publications Office of the European Union: Bruxelles, Belgium, 2015; 74p. [Google Scholar]
- Shadmana, S.; Khalid, P.A.; Hanafiah, M.M.; Koyande, A.K.; Islam, M.A.; Bhuiyan, S.A.; Kok, S.W.; Pau-Loke, S. The carbon sequestration potential of urban public parks of densely populated cities to improve environmental sustainability. Sustain. Energy Technol. Assess. 2022, 52 (Part A), 102064. [Google Scholar] [CrossRef]
- Allin, S. A new understanding of formal land use plans in Germany. Int. J. Sustain. Soc. 2011, 3, 385–396. [Google Scholar] [CrossRef]
- Benedict, M.A.; McMahon, E.T. Green Infrastructure: Smart Conservation for the 21st Century. Renew. Resour. J. 2002, 20, 12–17. [Google Scholar]
- Gutierrez, V.; Keijzer, M.-N. Funding forest landscape restoration using a business-centred approach: An NGO’s perspective. Unasylva 2015, 66, 99–106. [Google Scholar]
- Comitato per lo Sviluppo del Verde Pubblico. Linee Guida per il Governo Sostenibile del Verde Urbano; Ministero dell’Ambiente e della Tutela del Territorio e del Mare: Rome, Italy, 2017; pp. 1–60. Available online: http://www.pubblicigiardini.it/linee-guida-la-gestione-del-verde-urbano/ (accessed on 20 April 2022).
- Enssle, F.; Kabisch, N. Urban green spaces for the social interaction, health and well-being of older—An integrated view of urban ecosystem services and socio-environmental justice. Environ. Sci. Policy 2020, 109, 36–44. [Google Scholar] [CrossRef]
- Chiesura, A. Per una Gestione Differenziata e Inclusiva del Verde Urbano e Periurbano, 1st ed.; E-book; Comitato per lo Sviluppo del Verde Pubblico, Strategia per il Verde Urbano, Ministero dell’Ambiente e della Tutela del Territorio e del Mare: Rome, Italy, 2018; 20p, pp. 81–82. Available online: https://www.minambiente.it/sites/default/files/archivio/allegati/comitato%20verde%20pubblico/strategia_verde_urbano.pdf (accessed on 20 April 2022).
- Zasada, I. Multifunctional peri-urban agriculture—A review of societal demands and the provision of goods and services by farming. Land Use Policy 2011, 28, 639–648. [Google Scholar] [CrossRef]
- Chen, C.-Y.; Ko, S.-H.; Lam, T.Y. Modeling biomass allocation strategy of young planted Zelkova serrata trees in Taiwan with component ratio method and seemingly unrelated regressions. Sci. Rep. 2021, 11, 7536. [Google Scholar] [CrossRef]
- Powell, J.L. Revegetation options. In Reclamation of Surface Mined Lands; Hossner, L.R., Ed.; CRC Press: Boca Raton, FL, USA, 1992; Volume II, pp. 49–91. [Google Scholar]
- Montgomery, B. Efficient and economical mowing. SportsField Manag. 2019, 35, 34–37. [Google Scholar]
- Mngadi, M.; Odindi, J.; Mutanga, O.; Sibanda, M. Estimating aboveground net primary productivity of reforested trees in an urban landscape using biophysical variables and remotely sensed data. Sci. Total Environ. 2022, 802, 149958. [Google Scholar] [CrossRef]
- Ťupek, B.; Lehtonen, A.; Mäkipää, R.; Peltonen-Sainioa, P.; Huuskonena, S.; Palosuo, T.; Heikkinen, J.; Regina, K. Extensification and afforestation of cultivated mineral soil for climate change mitigation in Finland. For. Ecol. Manag. 2021, 501, 119672. [Google Scholar] [CrossRef]
- AzzeroCO2; Legambiente. Albero dopo Albero: 3 Anni di Progetti per Riforestare l’Italia con Mosaico Verde; AzzeroCO2: Rome, Italy, 2021; pp. 1–122. Available online: https://www.mosaicoverde.it/ (accessed on 20 May 2022).
- Gruwetz, R.; Michels, E.; De Keulenaere, B.; Van Poucke, R.; Boeve, W.; Duarte, L.; Depuydt, T.; Laub, K.; Trapp, M.; Bolzonella, D.; et al. Good Practice Guide for Grass Valorization: Reccomandations for Terrain Managers; IEE Project: IEE/12/046/SI2.645700; GR3; University of Ghent: Ghent, Belgium, 2016; 36p. [Google Scholar]
- Molin, J.F.; Konijnendijk van den Bosch, C.C. Between Big Ideas and Daily Realities—The roles and perspectives of Danish municipal green space managers on public involvement in green space maintenance. Urban For. Urban Green. 2014, 13, 553–561. [Google Scholar] [CrossRef]
- Cambria, V.E.; Campagnaro, T.; Trentanovi, G.; Testolin, R.; Attorre, F.; Sitzia, T. Citizen Science Data to MeasureHuman Use of Green Areas and Forests in European Cities. Forests 2021, 12, 779. [Google Scholar] [CrossRef]
- Cappucci, S.; Vaccari, M.; Falconi, M.; Tudor, T. The sustainable management of sedimentary resources. “The case study of Egadi Project”. Environ. Eng. Manag. J. 2019, 18, 317–328. [Google Scholar]
- Stihl. Consigli per il mulching. 2021. Available online: https://www.stihl.it/consigli-per-il-mulching.aspx (accessed on 10 June 2021).
- Knot, P.; Hrabe, F.; Hejduk, S.; Skladanka, J.; Kvasnovsky, M.; Hodulikova, L.; Caslavova, I.; Horky, P. The impacts of different management practices on botanical composition, quality, colour and growth of urban lawns. Urban For. Urban Green. 2017, 26, 178–183. [Google Scholar] [CrossRef]
- Alt, F.; Oelmann, Y.; Herold, N.; Schrumpf, M.; Wilcke, W. Phosphorus partitioning in grassland and forest soils of Germany as related to land-use type, management intensity, and land use-related pH. J. Plant Nutr. Soil Sci. 2011, 174, 195–209. [Google Scholar] [CrossRef]
- Laub, K.; De Keulenaere, B.; Michels, E.; Van Poucke, R.; Boeve, W.; Depuydt, T.; Trapp, M.; Bolzonella, D.; Ryckaert, B.; Bamelis, L.; et al. Good Practice Guide for Grass Valorization: Reccomandations for Local Authorities; IEE Project: IEE/12/046/SI2.645700; GR3; University of Ghent: Ghent, Belgium, 2016; 36p. [Google Scholar]
- ISAAC. Increasing Social Awareness and Acceptance of Biogas and Biomethane. 2021. Available online: http://www.isaac-project.it/en (accessed on 20 May 2022).
- Loan, L.T.T.; Takahashi, Y.; Nomura, H.; Yabe, M. Modeling home composting behavior toward sustainable municipal organic waste management at the source in developing countries. Resour. Conserv. Recycl. 2019, 140, 65–71. [Google Scholar] [CrossRef]
- Winter, M. Who will mow the grass? Bringing farmers into the sustainability framework. J. R. Agric. Soc. Engl. 2004, 165. [Google Scholar]
- García-Barragán, J.; Eyckmans, J.; Rousseau, S. Defining and Measuring the Circular Economy: A Mathematical Approach. Ecol. Econ. 2019, 157, 369–372. [Google Scholar] [CrossRef]
- Kirchherr, J.; Reike, D.; Hekkert, M. Conceptualizing the circular economy: An analysis of 114 definitions. Resour. Conserv. Recycl. 2017, 127, 221–232. [Google Scholar] [CrossRef]
- D’Elia, I.; Briganti, G.; Vitali, L.; Piersanti, A.; Righini, G.; D’Isidoro, M.; Cappelletti, A.; Mircea, M.; Adani, M.; Zanini, G.; et al. Measured and modelled air quality trends in Italy over the period 2003–2010. Atmos. Chem. Phys. 2021, 21, 10825–10849. [Google Scholar] [CrossRef]
- Howley, P. Landscape aesthetics: Assessing the general publics’ preferences towards rural landscapes. Ecol. Econ. 2011, 72, 161–169. [Google Scholar] [CrossRef]
- Qi, J.; Zhou, Y.; Zeng, L.; Tang, X. Aesthetic heterogeneity on rural landscape: Pathway discrepancy between perception and cognition. J. Rural. Stud. 2022, 92, 383–394. [Google Scholar] [CrossRef]
- Rotini, A.; Chiesa, S.; Manfra, L.; Borrello, P.; Piermarini, R.; Silvestri, C.; Cappucci, S.; Parlagreco, L.; Devoti, S.; Pisapia, M.; et al. Effectiveness of the ‘Ecological Beach’ model: A beneficial management of posidonia beach cast and banquette. Water 2020, 12, 3238. [Google Scholar] [CrossRef]
Figure 1.
Study area and Green Macroareas in the Municipality of Latina.

Figure 2.
Bagnouls and Gaussen diagram for (a) Latina meteorological station (owned by the Regional Functional Center of the Civil Protection of Lazio and representative for the urban area climate condition) and (b) Borgo Carso Station (owned by Integrated Agrometeorological Desk of the Lazio Region—SIARL—and representative of the outlying rural suburbs).


Figure 3.
Flow chart of the operations for green areas mapping.

Figure 4.
Flowsheet of operations for the evaluation of maintenance costs of green areas managed by the Municipality of Latina.
Figure 4.
Flowsheet of operations for the evaluation of maintenance costs of green areas managed by the Municipality of Latina.

Figure 5.
Example of cartographic output of Macro Area A. The present map shows a suburban area of the city and extensive parks subject to regular green maintenance.
Figure 5.
Example of cartographic output of Macro Area A. The present map shows a suburban area of the city and extensive parks subject to regular green maintenance.

Figure 6.
Comparison between the economic requirements for grass mowing with and without the collection of vegetal residues as a function of the number of interventions performed over a year. Horizontal dashed lines indicate the annual budget allocated by the Municipality for the maintenance of green public areas: ~255,000 € in 2016–17, ~377,000 € in 2018, ~600,000 € in 2019–20, and ~1 Ml€ in 2021.

Figure 7.
Classification of Urban Open Spaces according to the high (red), medium (yellow), and low (green) maintenance level in the city center of Latina.
Figure 7.
Classification of Urban Open Spaces according to the high (red), medium (yellow), and low (green) maintenance level in the city center of Latina.

Figure 8.
Reforestation project of four abandoned areas. Green points represent shrubs (Laurus nobilis) and red points represent trees (Ulmus minor and Quercus cerris).
Figure 8.
Reforestation project of four abandoned areas. Green points represent shrubs (Laurus nobilis) and red points represent trees (Ulmus minor and Quercus cerris).

Figure 9.
Average incidence in % of the different management option.

Figure 10.
UOS with high, medium and low levels of maintenance (HLM, MLM, LLM). Other details of waste bins, playgrounds, monumental trees, and flower beds are reported (Source: own photos).
Figure 10.
UOS with high, medium and low levels of maintenance (HLM, MLM, LLM). Other details of waste bins, playgrounds, monumental trees, and flower beds are reported (Source: own photos).


Table 1.
The monthly cumulative precipitation (P) and the monthly temperature (T) in Latina and B. Carso (2010–2020).
Table 1.
The monthly cumulative precipitation (P) and the monthly temperature (T) in Latina and B. Carso (2010–2020).
| Parameters | Monthly Mean (Latina) | Annual Mean | |||||||||||
| J | F | M | A | M | J | J | A | S | O | N | D | ||
| T (°C) | 9.7 | 10.7 | 12.8 | 16.2 | 19.3 | 23.9 | 26.7 | 27.0 | 23.3 | 19.2 | 15.0 | 10.9 | 17.90 |
| P (mm) | 91.4 | 96.2 | 100.5 | 50.4 | 50.3 | 18.6 | 14.9 | 23.4 | 73.5 | 106.0 | 166.6 | 97.0 | 74.05 |
| Monthly Mean (Borgo Carso) | Annual Mean | ||||||||||||
| T (°C) | 7.77 | 8.46 | 10.73 | 13.86 | 16.62 | 21.23 | 23.68 | 23.67 | 20.10 | 16.29 | 12.50 | 8.62 | 15.29 |
| P (mm) | 87.50 | 92.06 | 97.45 | 52.45 | 59.85 | 24.02 | 23.25 | 22.44 | 79.21 | 96.74 | 155.99 | 91.83 | 91.83 |
Table 2.
Source data for GIS mapping.
| Data | Source | Description | Technical Specifications |
|---|---|---|---|
| CAD Planimetry of green areas | Public Green Territorial Cadastre 2005 DWG files | DWG green areas bounding polygons (last update: 2005) | Scale 1:5000 |
| Green areas list | Special Tender Specifications 2018—Microsoft Word files | List of areas | Name of areas and relative surfaces (m2) |
| Topographic dataset | Lazio Region Technical Chart Shapefile and WMS Service | Polygons and lines defining the essential topographic elements | Scale 1:5000 SR: Gauss Boaga-Roma40 Eastern zone (EPSG 3004) |
| Municipal green areas dataset | OpenStreetMap (OSM) Shapefile | Urban green areas polygons mapped by the OSM community | Scale 1:5000 SR: WGS84 (EPSG:4326) |
| Cadastral map | Italian Revenue Agency WMS Service | Cadastral parcels delimitation polygons | Scale 1:2000 SR: ETRS89/UTM zone 33N (EPSG: 25833) |
| Digital Orthophotos | Italian Agency for Payments in Agriculture WMS Service | Orthophotos acquired with digital camera with flights between 15 May 2012 and 27 July 2012 | Scale 1:10,000 SR: WGS84-UTM33 (EPSG: 32633) |
Table 3.
List of the types of UOS within the Municipality of Latina.
| Type and Description |
|---|
| Green areas of the city and suburbs (parks, gardens, areas with and without playgrounds) |
| Green traffic dividers (green traffic islands) |
| Green areas adjacent to parking lots (public car parks only) |
| Marginal green areas (green areas with spontaneous vegetation) |
| Green areas adjacent to roads (road relevant green) |
| Green areas of school complexes of the city and the suburbs |
Table 4.
Source data for the estimation of the maintenance costs. GreenCAL tool determines maintenance costs in relation to the extension of the green areas.
Table 4.
Source data for the estimation of the maintenance costs. GreenCAL tool determines maintenance costs in relation to the extension of the green areas.
| Data | Source | Description | Technical Specifications |
|---|---|---|---|
| Maintenance costs | Accounting report of the Office (year 2018) Microsoft Excel files | Table containing surface data by type of processing in each area (63.75% of the areas surveyed thanks to this study) | Areas in m2 and total costs in € |
| GIS surface database | Calculation derived from mapping .dbf files | Table containing updated metric information based on this study | Areas in m2 |
| Unit prices of processing | Lazio Region Fares Regional Council Resolution n.412 of 06/08/2012 | List of unit prices associated with the four types of mowing used in the Municipality of Latina | Unit prices in €/m2 |
Table 5.
Extension of the green heritage of the Municipality of Latina.
| Macro Area | Description | (m2) |
|---|---|---|
| A | Green public areas of the city | 1,196,074 |
| B | Green public and school areas in the suburbs | 272,193 |
| C | Green areas adjacent to schools within the city | 128,116 |
| TOTAL | 1,596,393 |
Table 6.
Range of variation of the annual economic requirements based on the number of mowing on all mapped green areas with and without grass collection. The ideal number of cutting grass operation is marked with (*), and it is equal to 6 mowing/year.
Table 6.
Range of variation of the annual economic requirements based on the number of mowing on all mapped green areas with and without grass collection. The ideal number of cutting grass operation is marked with (*), and it is equal to 6 mowing/year.
| Mowing (n) | Without Collection (€) | With Collection (€) |
|---|---|---|
| 1 | 255,464 | 315,963 |
| 2 | 510,928 | 631,926 |
| 4 | 1,021,856 | 1,263,852 |
| * 6 | * 1,532,784 | * 1,895,778 |
| 8 | 2,043,712 | 2,527,704 |
| 10 | 2,554,640 | 3,159,630 |
| 12 | 3,065,568 | 3,791,556 |
Table 7.
Maintenance Levels (ML) for a differentiated management of the areas as reported by the National Committee of Green Public Areas [46].
Table 7.
Maintenance Levels (ML) for a differentiated management of the areas as reported by the National Committee of Green Public Areas [46].
| Maintenance Level | Description | Surface |
|---|---|---|
| High | Areas with wider users than the district in which they are located, generally of urban and functional interest (including parks); school gardens for which mowing is planned on a regular basis. | 38.08% 607,889 m2 |
| Medium | Green spaces at district level (generally not equipped and not having a particularly strong aesthetic value, but falling in areas with a significant presence of housing); cycle paths in a naturalistic peri-urban context; road roundabouts with urban furnishing items, for which interventions are concentrated in the spring-summer months. | 32.61% 520,563 m2 |
| Low | Marginal green areas larger than 500 m2 where alternative practices could be envisaged (e.g., haymaking); traffic divider beds and roadside green areas with a predominantly linear extension at the edge of the carriageways, for which maintenance interventions are foreseen to a minimum. | 29.31% 467,930 m2 |
Table 8.
Scenarios 1 and 2 provide cost estimation in case of a differ number of cutting operations within UOS having high and medium maintenance levels. Costs of single grass cutting operations are indicated with (*) and without (**) mowing removal for High (102,209 € **; 117,384 € *), Medium (90,092 € **; 106,807 € *) and Low (63,353 € **; 90,908 € *) maintenance levels. Last column shows the general costs for each hypothesized maintenance level.
| ML | SCENARIO 1 (1,511,063 €) | Cost (€) | |||||||||||
| J | F | M | A | M | J | J | A | S | O | N | D | ||
| High | X | X | X | X | X | X | 704,304 | ||||||
| Medium | X | X | X | X | X | 534,035 | |||||||
| Low | X | X | X | 272,724 | |||||||||
| SCENARIO 2 (1,286,872 €) | |||||||||||||
| High | X | X | X | X | X | 586,920 | |||||||
| Medium | X | X | X | X | 427,228 | ||||||||
| Low | X | X | X | 272,228 | |||||||||
Table 9.
Calculation of number and distribution of trees for the four areas of municipal property suitable for reforestation. Identification codes describe a reference system (number of sheet and parcel) on the base of which the entire national land register is organized, and they allow for the tracing of owners of the areas (the Municipality in this case) and their destination of use.
| Area Code | Localization | Identification Code | Surface m2 | Number of Threes | |
|---|---|---|---|---|---|
| Min Density 5 × 5 m | Max Density 15 × 15 m | ||||
| LT129 | Via Copenhagen/Via Vienna | Sheet 136 | 13,722 | 411 | 55 |
| Parcels 922-271-272 | |||||
| LT208 | Via Scipione l’Africano | Sheet 137 | 19,617 | 571 | 64 |
| Parcels 39 | |||||
| LT_Q18 (part) | Oasi Verde “Susetta Guerrini” | Sheet 200 | 7635 | 231 | 32 |
| Parcels 1158 | |||||
| - | Strada Cieca–Borgo S. Michele | Sheet 121 | 167,037 | 4700 | 546 |
| Parcels 59-103-61-62 | |||||
| - | TOTAL | - | 208,011 | 5913 | 697 |
Table 10.
EER codes for waste from park and garden maintenance.
| EER Codes | Description |
|---|---|
| 20 | Municipal waste (domestic and similar waste produced by commercial and industrial activities as well as by institutions), including waste from separate collection. |
| 20 02 | Garden and park waste (including cemetery waste). |
| 20 02 01 | Biodegradable waste. |
| Mowing and pruning | Mowing and pruning resulting from the maintenance of private green areas and UOS were excluded from the category of by-products according to Italian Law n. 37, 05/03/2019, Art. 20, referred to as “the European Law” of year 2018. In the current regulatory framework, recently updated by EU 851/2020 Directive (adopted by Italian D.lgs. 116/2020), mowing and pruning are classified as organic waste. |
Publisher’s Note: MDPI stays neutral with regard to jurisdictional claims in published maps and institutional affiliations. |
© 2022 by the authors. Licensee MDPI, Basel, Switzerland. This article is an open access article distributed under the terms and conditions of the Creative Commons Attribution (CC BY) license (https://creativecommons.org/licenses/by/4.0/).
Share and Cite
MDPI and ACS Style
Cappucci, S.; Nappi, S.; Cappelli, A. Green Public Areas and Urban Open Spaces Management: New GreenCAL Tool Algorithms and Circular Economy Implications. Land 2022, 11, 886. https://0-doi-org.brum.beds.ac.uk/10.3390/land11060886
AMA Style
Cappucci S, Nappi S, Cappelli A. Green Public Areas and Urban Open Spaces Management: New GreenCAL Tool Algorithms and Circular Economy Implications. Land. 2022; 11(6):886. https://0-doi-org.brum.beds.ac.uk/10.3390/land11060886
Chicago/Turabian StyleCappucci, Sergio, Serena Nappi, and Andrea Cappelli. 2022. "Green Public Areas and Urban Open Spaces Management: New GreenCAL Tool Algorithms and Circular Economy Implications" Land 11, no. 6: 886. https://0-doi-org.brum.beds.ac.uk/10.3390/land11060886
Note that from the first issue of 2016, this journal uses article numbers instead of page numbers. See further details here.