
Mapping the Optimal Rural Areas to Invest in through the LEADER Approach: Case Study—Extremadura (SW Spain)


Department of Art and Territorial Sciences, University of Extremadura, 10003 Cáceres, Spain
*
Author to whom correspondence should be addressed.
Land 2022, 11(8), 1191; https://0-doi-org.brum.beds.ac.uk/10.3390/land11081191
Submission received: 6 July 2022
/
Revised: 25 July 2022
/
Accepted: 28 July 2022
/
Published: 29 July 2022
(This article belongs to the Special Issue Sustainable Rural Development: Strategies, Good Practices, and Opportunities Ⅱ)
Abstract
:For more than 30 years, the LEADER approach has been a key tool in the endogenous, local, participatory, and sustainable development of the most disadvantaged European rural areas in demographic and socioeconomic terms. However, despite the unquestionable labor of the rural development policy and the local action groups, various authors, both at a European level and at a national level, in Spain, have concluded that the majority of investments and the greater number of projects through LEADER have been concentrated in the most populated and most developed rural areas. For this reason, there is positive discrimination toward them in the management of aid for rural development. Knowing this and according to the objectives pursued by LEADER, the aim of this work is to analyze the situation in Extremadura (Spain), which has been a beneficiary from the beginning, building an optimal location model for rural development aid. Thus, it will be possible to determine the most convenient, optimal, or priority municipalities to receive aid for rural development due to characteristics such as a smaller population, low demographic growth, low birth rate, high mortality rate, high aging population, low productivity index, high unemployment rates, low accessibility to urban centers, and low LEADER investments in recent years.
1. Introduction
In 1991, the European LEADER Initiative emerged, executed under a model of integrated, endogenous, and innovative rural development [1,2]. This initiative sought to develop European rural areas through their economic diversification, according to the characteristics and needs of the territory of action, the population that inhabits it, and the exploitation of its endogenous resources [3]. The LEADER approach began as the basis of a pilot project and became an axis of action of the Rural Development Policy 15 years later, continuing its operation today through the management of the local action groups (LAGs) [4], which design the development strategies and manage the financial resources to subsidize the projects. Therefore, for more than 30 years, European rural regions, such as the one covered by this work, Extremadura (Spain), have been beneficiaries of an innovative and alternative development model to the traditional one of public aid management by incorporating the local population in decision making and strategy design [5,6]. As Staic and Vladu state [7], the LEADER approach supports the European objectives for rural development taking into account the territorial dimension and encompassing the principles of bottom-up endogenous development and community empowerment [8]. LEADER is a working methodology based on three parts: strategy, territory, and partnership meant to revitalize and enhance the rural environment through the prominence, autonomy, and responsibility of the rural population [9]. Exactly, the principles of the LEADER approach, which help to understand its operation, are [10]: local development strategies by areas, designed for clearly delimited rural and subregional territories; local partnerships between the public and private sectors or local action groups; a bottom-up approach that gives LAGs decisive power in developing and implementing a local development strategy (bottom-up strategy); cooperation and multisectorial application of the strategy, based on the interaction between agents and projects in different sectors of the local economy; implementing innovative approaches; the execution of cooperation projects; creating a network of local partnerships. Since the creation of LEADER, this approach has worked, with changes attending to the political and territorial needs of the European rural environments, during the following programming periods [4]: 1991–1993 (LEADER I); 1994–1999 (LEADER II); 2000–2006 (LEADER+); 2007–2013 (Axis 4 of the European Agricultural Fund for Rural Development (EAFRD)—LEADER approach); 2014–2020 (LEADER as a participatory local development strategy (PLDS)). In Spain, the country to which the study area of this work belongs, PRODER (Programa Operativo de Desarrollo y Diversificación Económica de Zonas rurales) was created in 1996 to cover all Spanish rural territories, operating under the same parameters as LEADER.
LEADER has generated innumerable benefits [11,12,13,14,15]. However, there are regions, such as Extremadura, which, despite its long history as a recipient of rural development aid, has rural areas that are among the oldest and most depopulated parts of Spain. Its gross domestic product (GDP) is still less than 75% of the European average, and it exhibits lower socioeconomic data than the most dynamic Spanish regions [16]. Since the 1980s, the population of Extremadura has been stabilizing in its places of origin; however, demographic and economic growth is limited to the population centers located in urban and irrigated areas, in their areas of influence, and in places where a productive non-irrigated crop of vines and olive trees is exploited. In contrast, the municipalities with the lowest and aging populations, which are located in the mountain areas, peneplain, non-irrigated areas, and pasture lands in the south of the province of Badajoz, continue to experience demographic losses. Given this, several authors [17,18,19,20,21] have affirmed that, in this region, there are still areas in which LEADER has not generated expected results. These areas have a scarce industrial and business fabric; are far from the main centers of population, leisure, and consumption; and, above all, still have the regressive demographic and social conditions with which they started. Since the beginning of LEADER, the largest number of projects and those with the biggest investments are concentrated in rural areas with more population and development, with a self-sufficient business fabric and with actors capable of co-financing projects. These areas are, mainly, the county seats of the region. Thus, as stated by Nieto and Cárdenas [15], in Extremadura, there is a clear positive discrimination of aid for rural development toward the most demographically and socioeconomically dynamic rural areas. This statement is supported by the results obtained in research on the regions of Andalusia [22,23] and Galicia [24], in the case of Spain, or on other European regions [25,26], highlighting the study of Olar and Jitea [27]. Given the conclusions of these works, as Pérez and Guzmán affirm [28], the good results expected with the implementation of LEADER in various European rural areas seem more of a wish than a reality.
Most of the works cited show, from a quantitative perspective, where the funds are located and concentrated and where the greatest number of projects are launched, leaving in the background those municipalities or regions in which less is invested via LEADER. In the case of Extremadura, this work contributes by identifying the municipalities to which the aid for rural development should go. In other words, this work explains, from a geographical perspective, where the municipalities should be located according to the objective pursued by the EAFRD: to improve the socioeconomic conditions of European rural areas to reduce the processes of aging and depopulation.
Therefore, LEADER investments must be made after analyzing different variables that guarantee an adequate social and economic impact for the protection and development of the rural population that most needs such funds and aid. For this, the implementation of multicriteria analysis methods and GIS tools that facilitate the geographical analysis of a series of selected variables is proposed. These tools and methods will enable making the best decision in accordance with established criteria to assess which Extremaduran municipalities need LEADER and provide them the greatest economic and spatial efficiency; economic, social, and territorial equity; environmental justice; sustainability; competitiveness; quality of life; welfare; and social and territorial cohesion [29,30,31]. In short, the objective of this work is to determine which areas are the most convenient, optimal, or priority municipalities for receiving aid for rural development because they have regressive characteristics, such as a smaller population, low demographic growth, a low birth rate, a high mortality rate, high population aging, a low productivity index, high unemployment rates, low accessibility to urban centers, and few investments and projects executed under the LEADER approach. This will be achieved by creating an optimal location model as a result of an analytic hierarchy process (AHP) and, subsequently, a weighted overlay multicriteria analysis (WOMA) in a GIS. Information and tools will be generated to direct the scarce financial resources from the EAFRD through LEADER to promote a planning process for rural development in Extremadura.
Multicriteria evaluation (MCE) is a set of techniques used in multidimensional decision and evaluation models [32]. One of the techniques is the AHP, which is used in this research. Saaty, whose objective was to support a reduction in the number of nuclear weapons of the Soviet Union and the USA [33], developed the AHP in the late 1970s. To structure and organize the processes, this method develops a hierarchical structure for decision-making, allows choosing the best alternative from a set of alternatives based on given criteria [34], and helps to mitigate the possible conflicts of subjectivity. Thus, the AHP is considered an internationally accepted weighting method given the advantage it offers by allowing quantitative and qualitative elements to be mixed, enriching the decision-making process [35].
Traditionally, MCE has been applied to the environmental field [36,37,38,39,40,41], since many factors influence it, but it has also been applied in areas of a social nature [42], such as rural development. Most social problems do not have unique answers but are linked to each other and to what the researcher wants to study. Hence, works that identify optimal sites for locating activities such as tourism [43], public facilities [30,42,44,45], or even social services for certain groups [30,42,44,45,46] stand out. Extremadura being the study area, MCE has been used for the location of second homes in its rural environment [47]. In addition, there is the work of González-Ramiro et al. [48], in which, through the AHP, they determined the potential of rural tourism in the region. Guillén, Hernández, and Sánchez [49] carried out an interesting application of the process in order to analyze the tourist destinations of Extremadura.
In the preceding decades, the development of the multicriteria evaluation methodology, applied in creating optimal location models in the 1970s [50], and of geographic information technologies (GIT) has led to the search for a combination of both. There are interesting GIS tools of great utility [51] to address, for example, environmental, economic, social, and health issues, such as the WOMA, in a raster environment. In this combination of multicriteria evaluation and the GIS, studies dedicated to decision-making in the territory acquire relevance, especially in solving problems in urban areas [52,53,54]. Although the use of multicriteria evaluations and their application through the GIS in the social field or human geography has been consolidated over the years, in the case of rural development, it can be considered novel since it has been analyzed, generally, from a quantitative but descriptive perspective and not statistically.
The rest of the article is arranged as follows: Section 2 presents the materials and methods, which encompass the study area, the methodological process, and the location model developed. Section 3 presents the results obtained. Section 4 presents a discussion, and finally, Section 5 presents the conclusions.
2. Materials and Methods
2.1. Study Area
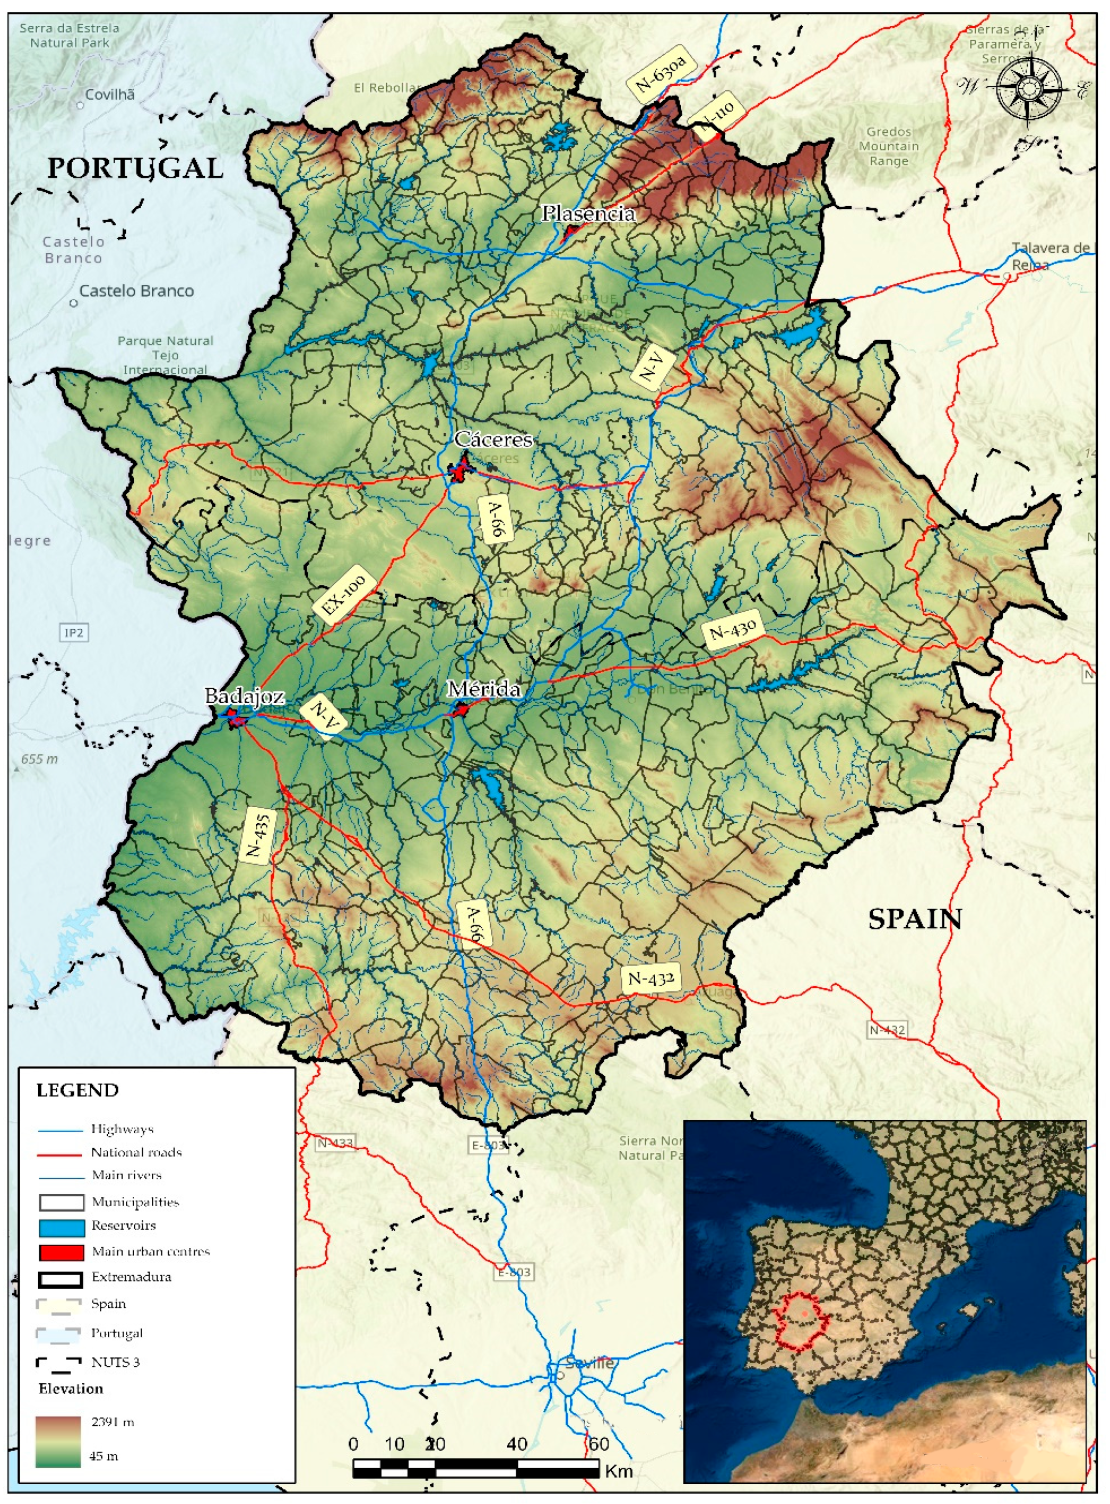
In this work, the study area is Extremadura, a Spanish region located in southwestern Spain (Figure 1). The region is a demographically dispersed territory despite its strategic location on the axis created by the three large metropolitan areas of the Iberian Peninsula [55]. In Spain as a whole, Extremadura is one of the regions with the least diversified and active economies, along with Castilla–La Mancha, Castilla y León, Aragón, and Galicia. These regions are considered “depopulated Spain”. With an area of 40,000 km2, Extremadura has a population of just over 1,000,000 inhabitants, distributed across 388 municipalities. Therefore, its population density is around 27 inhabitants/km2. Most of the population of Extremadura is concentrated in the main cities: Badajoz, Cáceres, Mérida, and Plasencia. The intense migratory movement after the 60s undoubtedly conditioned the demography of the region, and its consequences are still palpable today, aggravated by the various economic crises suffered in recent decades. Extremadura also has a serious problem of aging in its most rural municipalities, which mainly occupy the spaces located in the mountain and the border areas of the region and which are more disconnected from the main axes of communication with the rest of Spain.
From an economic point of view, according to the 2000–2020 series of the regional accounts of Spain from the National Institute of Statistics (NIS), the per capita GDP of Extremadura was 63.5% of the national average in the year 2000, reaching 71.5% in 2010. Afterward, there was a slow increase, and the GDP reached 73.1% in 2018. In 2020, this was the Spanish region that registered the smallest decrease in GDP (−5.2%) compared to the previous year (73.1% in 2019), with EUR 19,304 per inhabitant. Thus, Extremadura is one of the regions whose income has been least affected by the COVID-19 crisis, because it generates the least capital and because it depends less on the most affected sectors, such as tourism or industry. The region converges with the rest of the Spanish autonomous communities in economic terms, but at a slow pace and facing continuous risk due to the danger of depopulation in the most rural areas.
The main socioeconomic characteristics of Extremadura are as follows: the still-high representation of the agricultural sector in the regional GDP (although the tertiary sector, with commerce, tourism, and transport, is the one that generates the most employment), high rates of unemployment, reduction in purchasing power in recent years, low productivity, and high public-sector dependence.
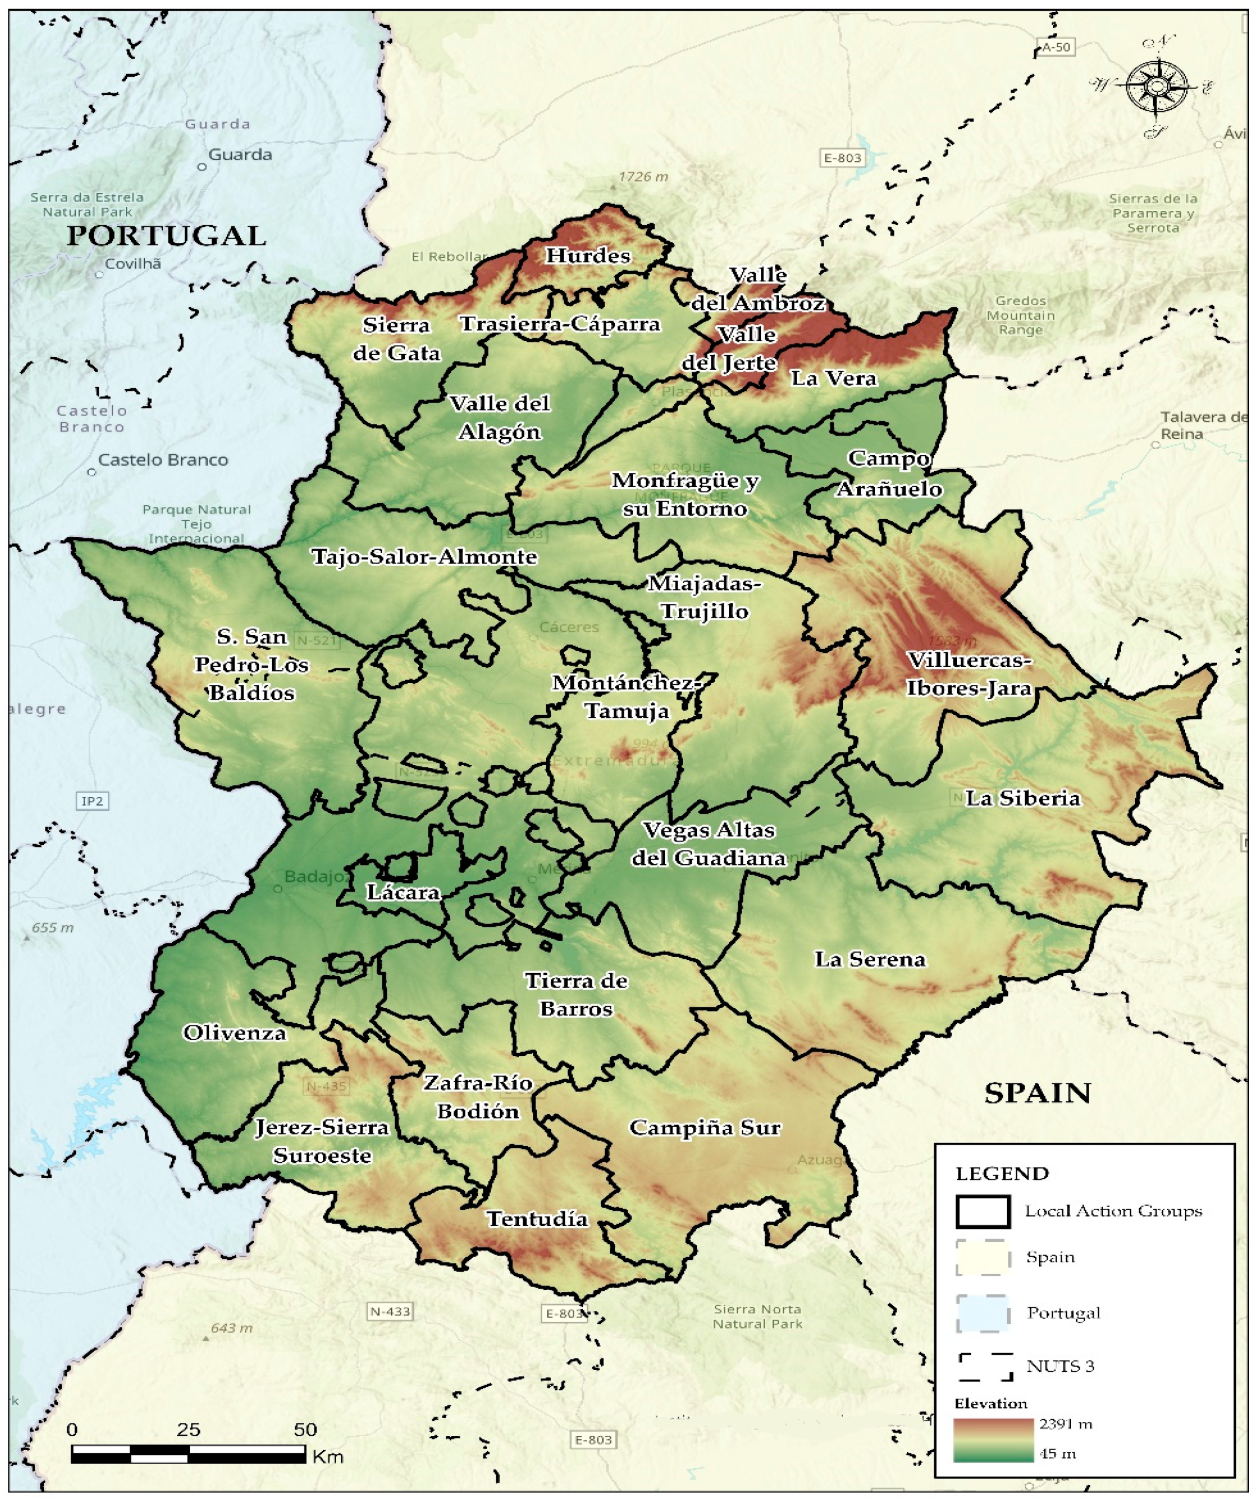
Extremadura presents diverse territories in terms of physical, economic, social, and demographic characteristics. On the one hand, there are areas with a good level of development and with adequate facilities, services, and infrastructures. These areas have a fairly modern and competitive agro-industrial sector and are located in Las Vegas del Guadiana, Valle del Alagón (both with irrigated crops), Campo Arañuelo, and Tierra de Barros (Figure 2). On the other hand, there are areas farthest from the main urban centers, which have a small and aging population and deficiencies in terms of equipment and infrastructure. In these areas, it is difficult for the primary sector to be competitive, and it does not generate sufficient income for its population. These areas are located in the mountainous areas of northern Extremadura and in the peneplain, in the province of Cáceres, as well as on the limits of the province of Badajoz, especially in the south and southeast. Various authors, such as Risco and De la Macorra [56] and Cayetano [57], consider that the low socioeconomic development of Extremadura is mainly due to the inadequate exploitation of its lands, the little transformation of its raw material, the underdevelopment of its infrastructures, the low population, and the low demographic density. Given this situation, it is evident that Extremadura has been a beneficiary of LEADER from the beginning, with 24 LAGs working for its development (Figure 2).
2.2. Methodological Process
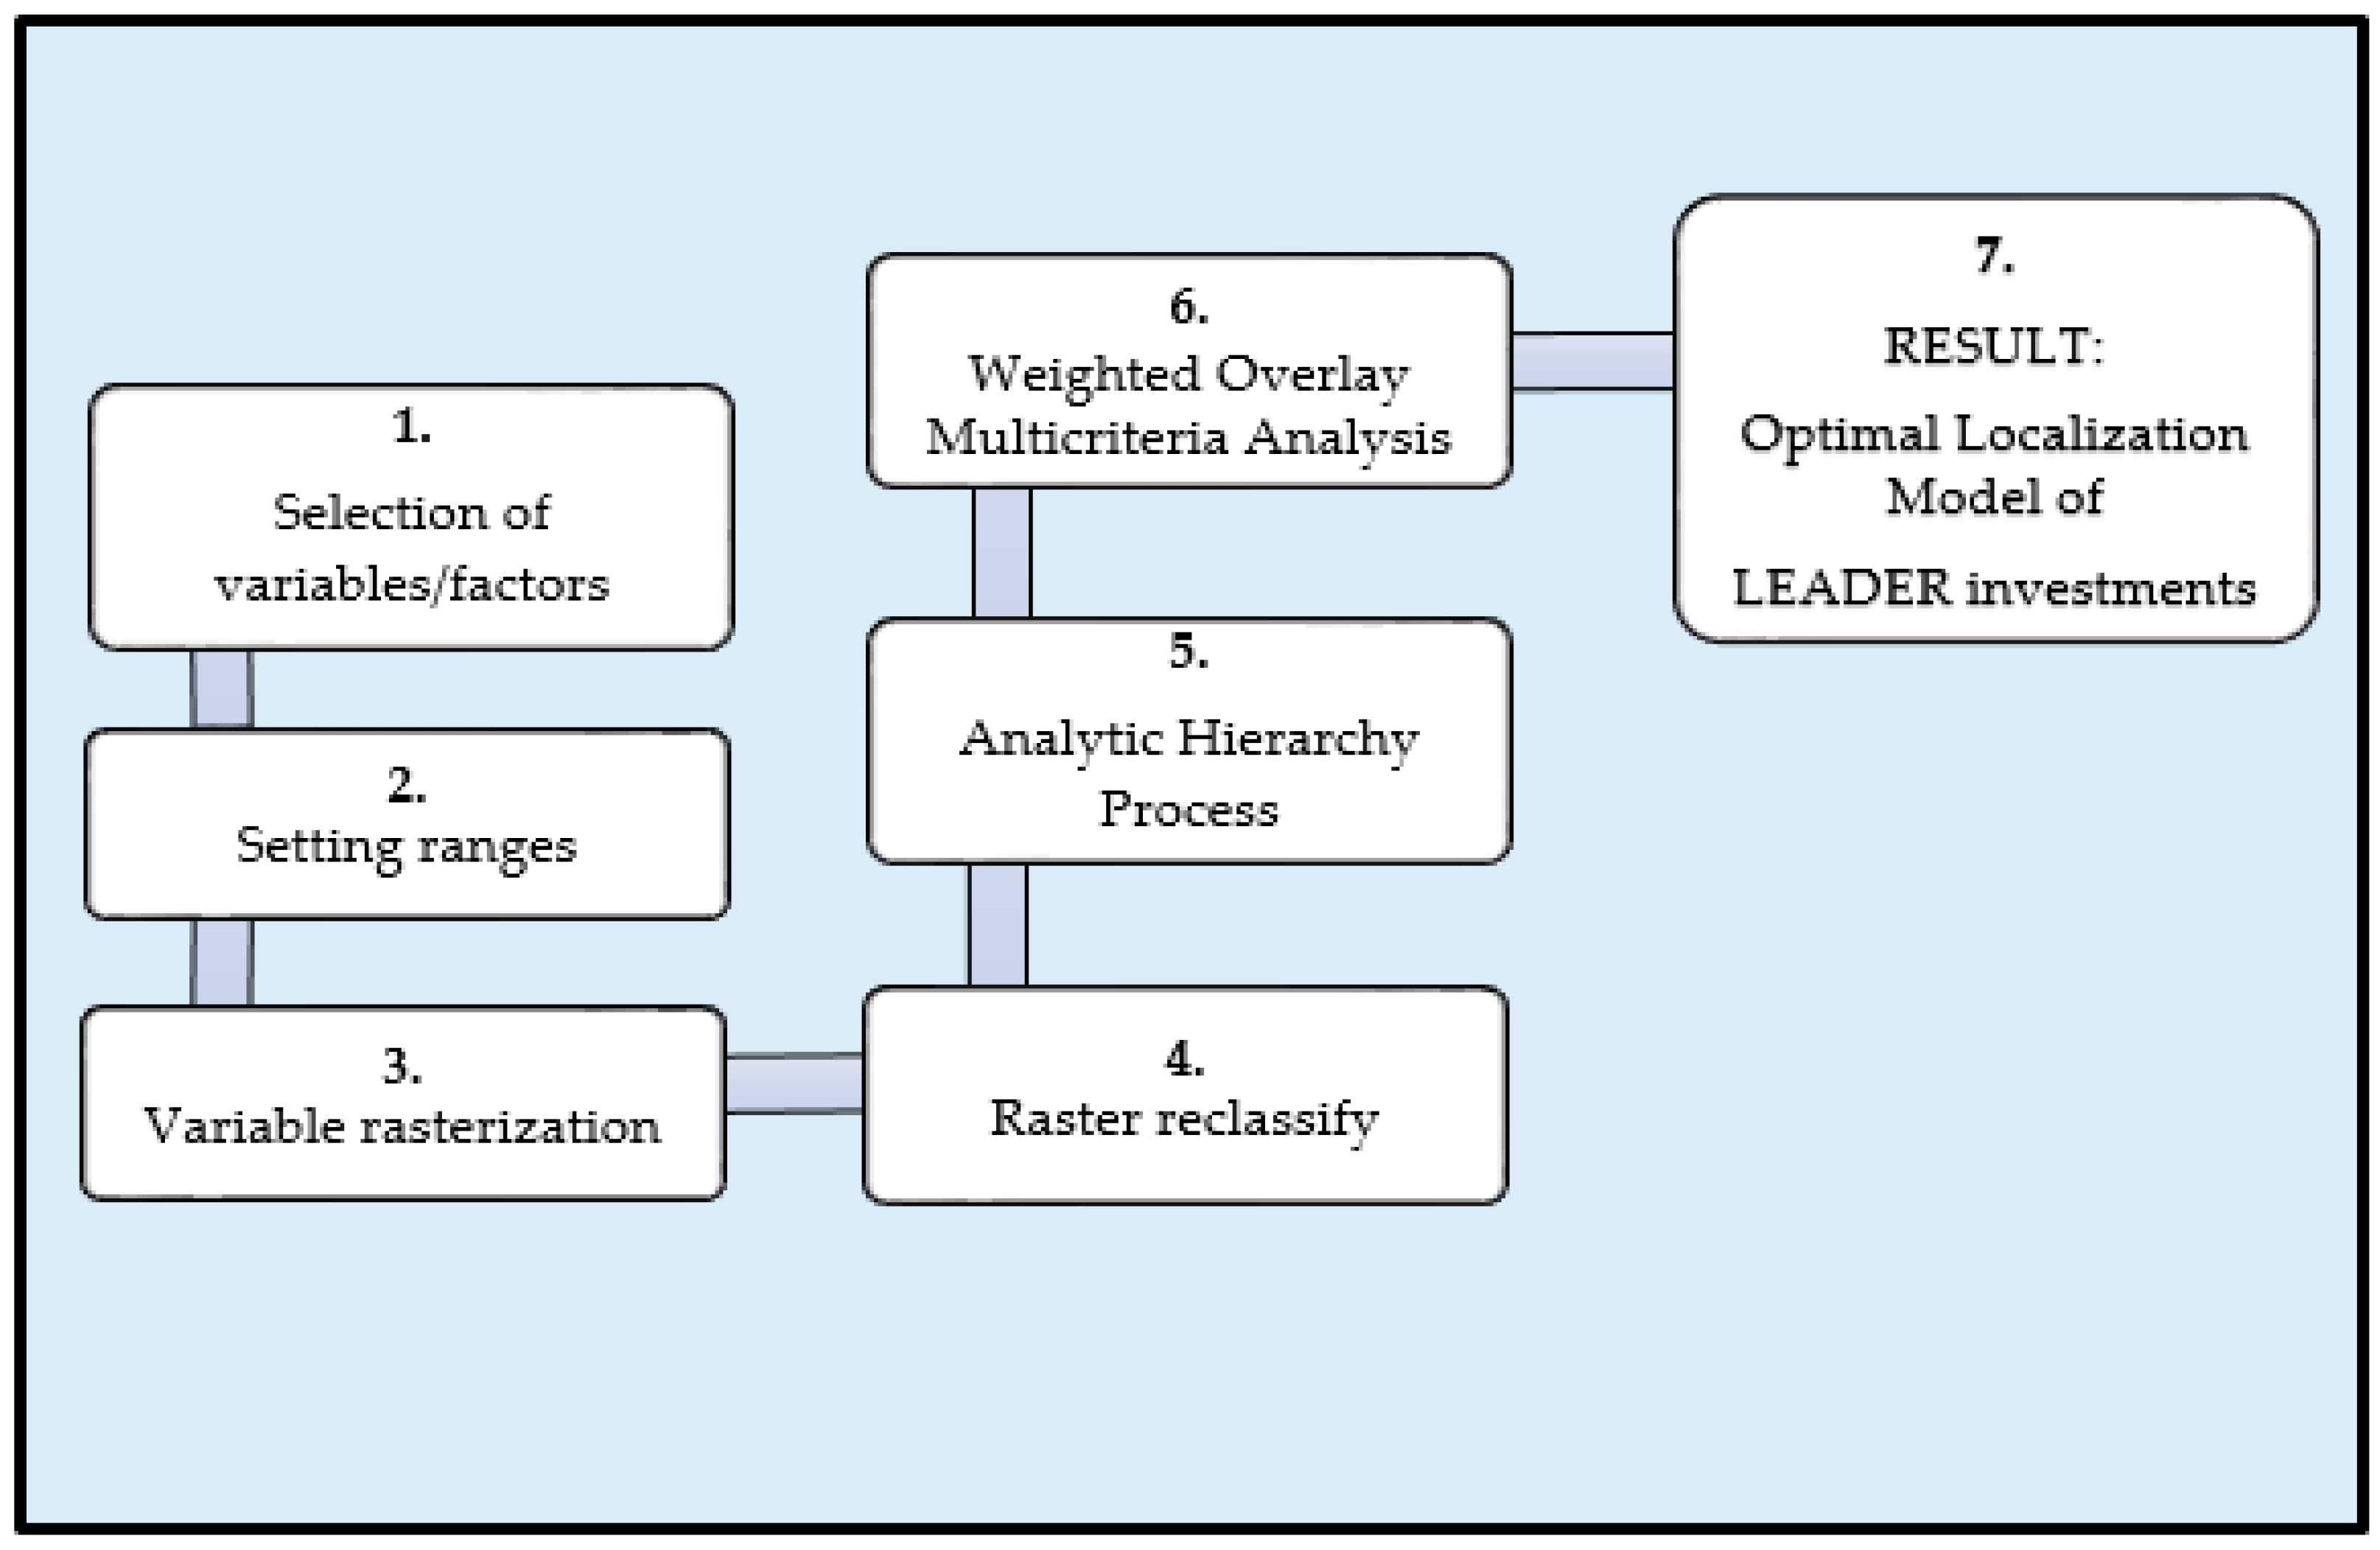
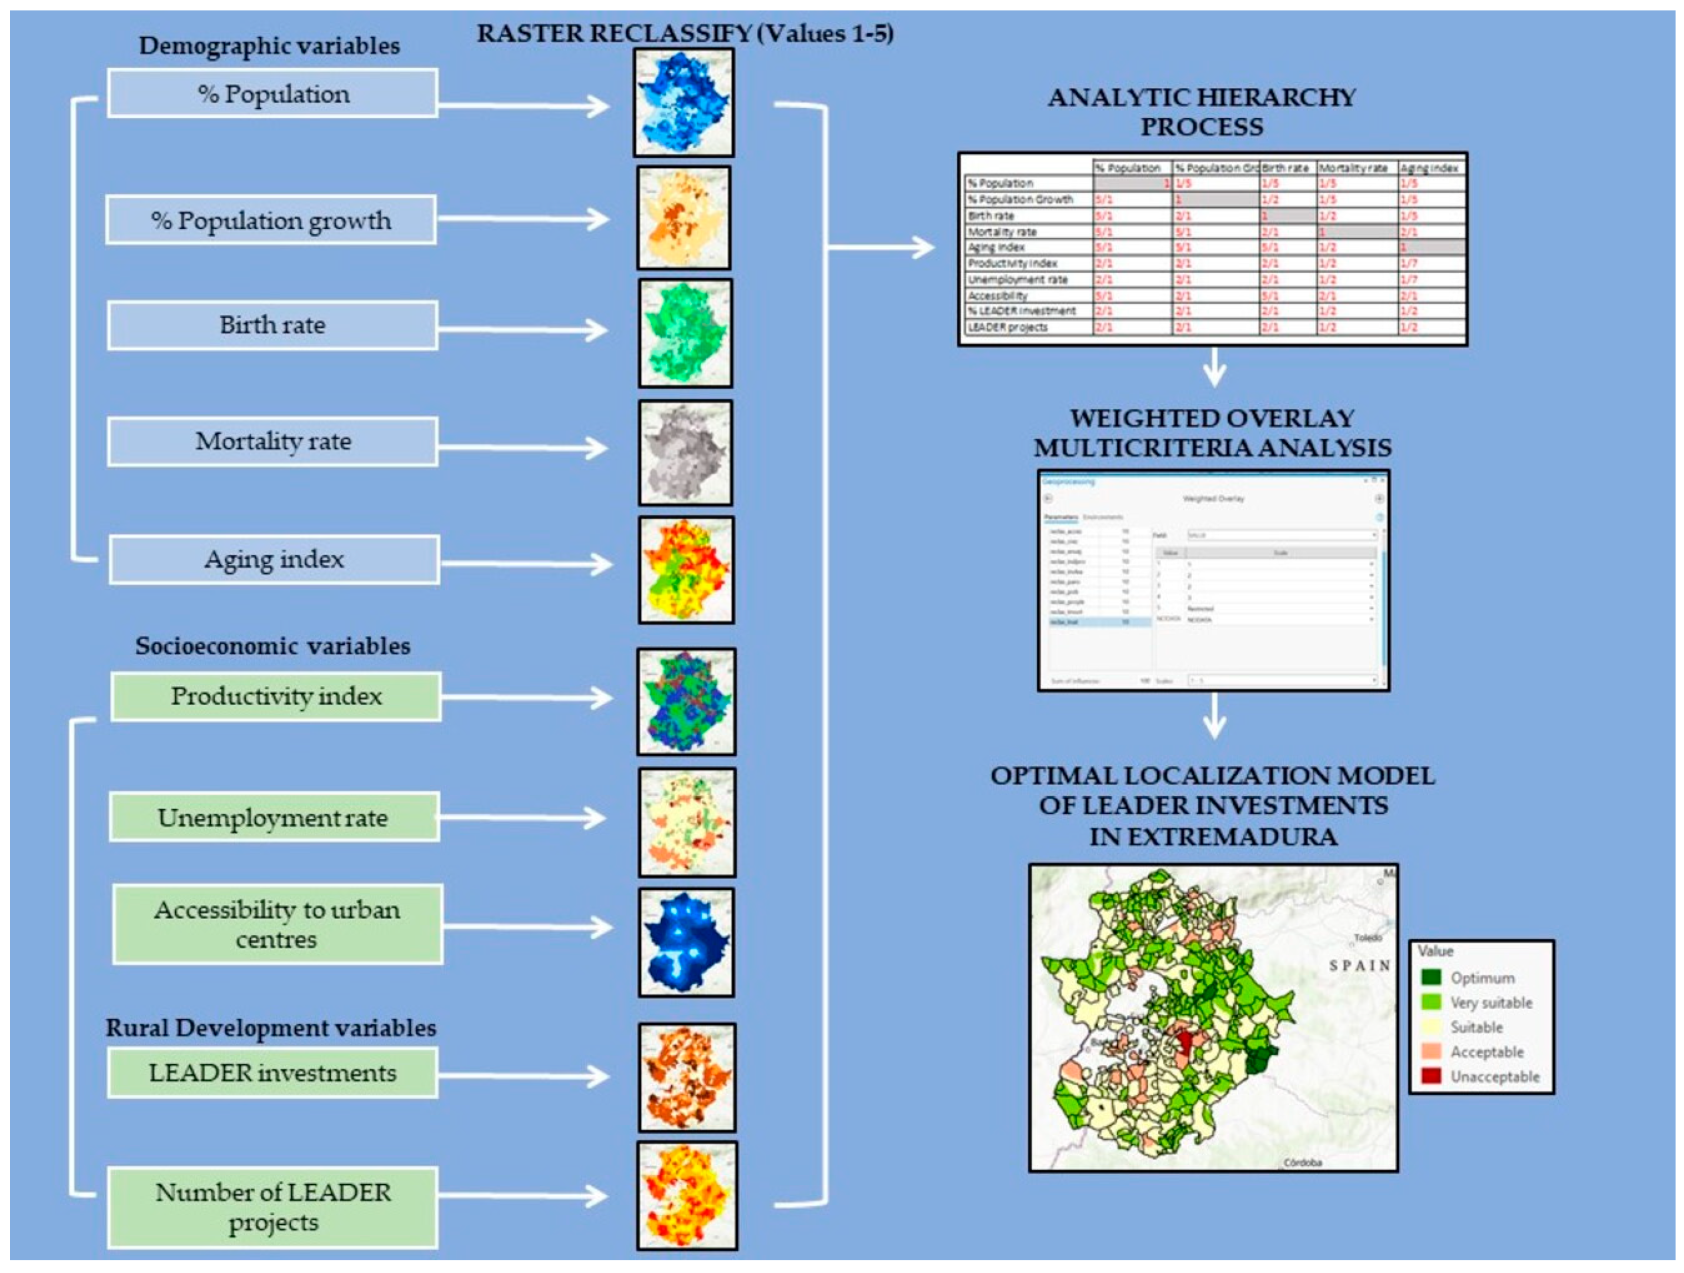
This research is characterized by the methodological course proposed and followed, which requires adequate organization. Figure 3 presents the process. First, 10 variables were selected, for which 5 ranges were established. Then, the variables, in vector format at the municipal level, were rasterized and reclassified in a GIS based on the 5 stipulated ranges and that correspond to optimum zones (value 1), very suitable zones (value 2), suitable zones (value 3), acceptable zones (value 4), and unacceptable zones (value 5). It is necessary to take into account that (1) the less population a municipality has, the more optimal it will be for locating LEADER investments and that (2) the higher the birth rate, the more unacceptably valued it will be. Subsequently, before carrying out the WOMA through the GIS, the peer comparison matrix (PCM) and the priority vector (PV) were calculated within the framework of the Saaty AHP to eliminate subjectivities and allocate the appropriate weights to each of the variables/factors. Hence, the optimal location model for LEADER investments in Extremadura was obtained.
2.2.1. Selection of Variables/Criteria and Establishment of Ranges
On the basis of previous studies [17,21,23,58,59,60,61] and knowing the geographical characteristics of Extremadura [14,20,57,62,63,64,65] related to rural development and LEADER and the objectives pursued by the EAFRD [61,66,67], the variables selected to calculate the optimal location model of LEADER aid and the characteristics to be optimally assessed in the construction of the model are presented in Table 1.
As can be seen from Table 1, from the perspective of rural development, the period 1994–2013 was analyzed, that is, from LEADER II to the European programming period 2007–2013. Prior to 1994, LEADER I was implemented as a pilot and innovative experience in the most disadvantaged European rural areas, such as Extremadura, but in only 4 LAGs, which is why the data were excluded from the analysis. The reason for ending the analysis in 2013 is that it is the last “official” year for which data on projects and investments are available in detail at the municipal level for Extremadura, although in Extremadura, subsidies were managed until the 2015 annuity (due to n + 2) [3]. These data are available thanks to the collaboration of the General Secretariat of Population and Rural Development of the Council of Agriculture, Rural Development, Population and Territory of the Government of Extremadura. For the demographic variables (source: the NSI), the average value was calculated from 2010 to 2020 in order to analyze the influence of the actions of LEADER 1994–2013 beyond its operation. The same method was applied for variables of an economic nature, such as the unemployment rate and the productivity index (source: the Socioeconomic Atlas of Extremadura). Accessibility data were obtained by calculating the minimum access times, through the GIS, for all of the population centers of the rural municipalities of Extremadura and those with more than 10,000 inhabitants, that is, those considered urban according to the NSI [68].
All the variables were then assigned to a municipal-based map of Extremadura (source: National Cartographic Base, scale 1:200,000, National Download Center of the National Geographic Institute of Spain) to be processed later in a GIS, specifically ArcGIS Pro. This processing consisted of the rasterization and reclassification of the variables according to the 5 stipulated ranges, detailed in Table 2.
2.2.2. Analytic Hierarchy Process
Saaty, who formulated a simple tool on the basis of his military research and teaching experience to help decision-makers, developed the AHP in the late 1970s. It is a simple but effective tool, something evidenced in the multitude of applications in which important results have been obtained [69,70], and was designed to structure, measure, and synthesize. Despite the fact that it was created so long ago, it still has a significant impact both theoretically and in application. Saaty proposed to develop a hierarchical structure of the decision problem to structure and order the entire decision process. Thus, he designed it to quantify judgments or opinions about the relative importance of all conflicting criteria used in decision-making [71]. As per the methodology, first, the decision problem was broken down into a hierarchy of interrelated elements, identifying (1) the general objective, (2) the criteria, and (3) the possible alternatives. In this paper, the decision problem is defined by the following hierarchical structure:
- (1)
- General objective: To identify the optimal municipalities for locating LEADER investments.
- (2)
- Criteria: The demographic and socioeconomic characteristics of Extremadura and the results obtained to date from LEADER in the municipalities of the region.Subcriteria: Percentage of population, population growth, birth rate, mortality rate, aging index, productivity index, unemployment rate, accessibility of rural municipalities to urban ones, total investment of LEADER, and total number of LEADER projects.
- (3)
- Alternatives: Optimal location, very suitable location, suitable location, acceptable location, and unacceptable location.
Once the hierarchical structure of the decision problem was established, the PCM was built, which allowed analyzing the degree of importance of each subcriterion with respect to the others. This degree of importance was identified by quantifying or rating the relative importance of the subcriteria on the basis of Saaty’s own AHP methodology and according to our subjectivity as researchers of rural development in Extremadura, although in favor of the search for the most reasonable solutions [71,72]. Thus, the importance rating was constructed by the authors of this work based on the empirically accepted Saaty’s fundamental scale [73,74]. In this way, the PCM with the 10 subcriteria was built on the basis of the scale of importance shown in Table 3.
Once the numerical values of the PCM (Table 4) was calculated, according to the AHP, the PV of the matrix was measured, which provides the weighting of each subcriterion. In other words, the components of the PV of the PCM represent the weights that correspond to each variable in the final decision-making and with which the GIS-weighted superposition will be carried out with map algebra. However, prior to calculating the PV of a matrix, it is necessary to generate the normalized pairwise comparison matrix (NPCM) (Table 5).
After calculating the NPCM, the PV of each subcriterion or variable was generated. This was determined from the weighted sum of each row of the matrix and its average. The result is displayed in Table 6:
Once the weighting of each subcriterion was calculated, the results obtained were evaluated. For this, Saaty, within the AHP methodology, proposes calculating the consistency ratio (CR) of the matrix from its consistency index (CI) and the random consistency index (RCI) [75]. The CR determines whether the matrix is consistent or inconsistent and whether the values obtained in the PV are adequate or whether adjustments must be made in the comparison matrix to optimize the results. According to the AHP methodology, CR values that exceed 0.10 are a sign of inconsistent judgments, and if they are ≤0.10 (for matrixes greater than 5 × 5), the judgment is acceptable. For the PMC built in this work, the CR was 0.072, so it is very acceptable, considering that it is a matrix of size 10 × 10. In this way, the results of the matrix analysis and the PV can be validated.
2.2.3. Weighted Overlay Multicriteria Analysis
After reclassifying the variables in raster format according to the numerical scale that represents the 5 ranges or alternatives and after calculating the weighting of each one, the map algebra was carried out in the GIS through the weighted overlay tool.
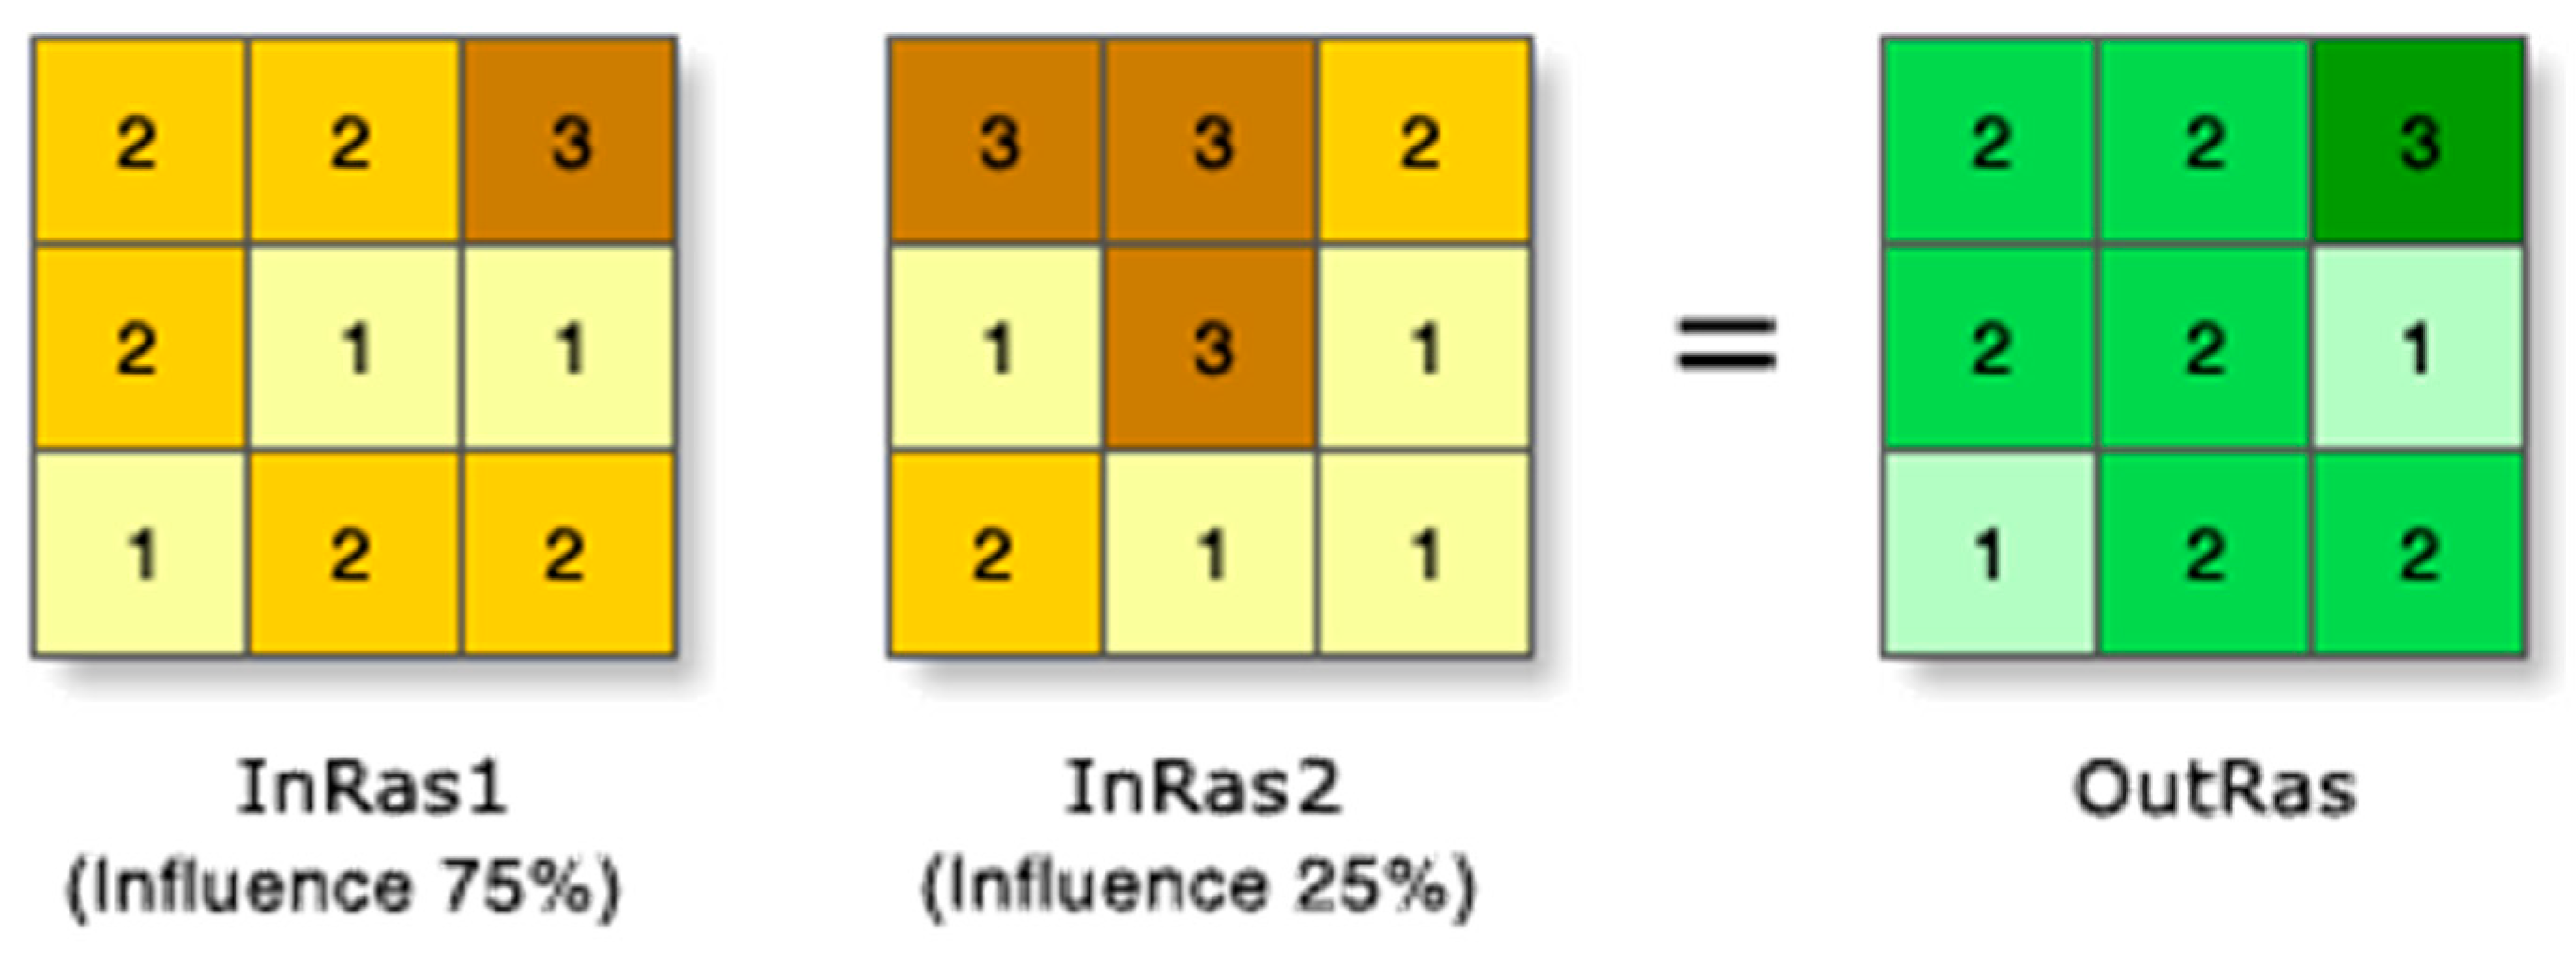
As intended in this research, the weighted superposition allows multicriteria evaluations to solve decision problems in which several factors, with different evaluations, intervene. This tool combines the following steps: (1) reclassifying the values in the input rasters into a common preference rating scale, (2) multiplying the cell values of each input raster by their importance weight (weights after PV calculation), and (3) summing up the resulting cell values to produce the output raster (Figure 4). Regarding the output values, in this case, high values (on a scale of 1 to 5) indicate that the location is inadequate and low values indicate that the location is very suitable or optimum.
3. Results
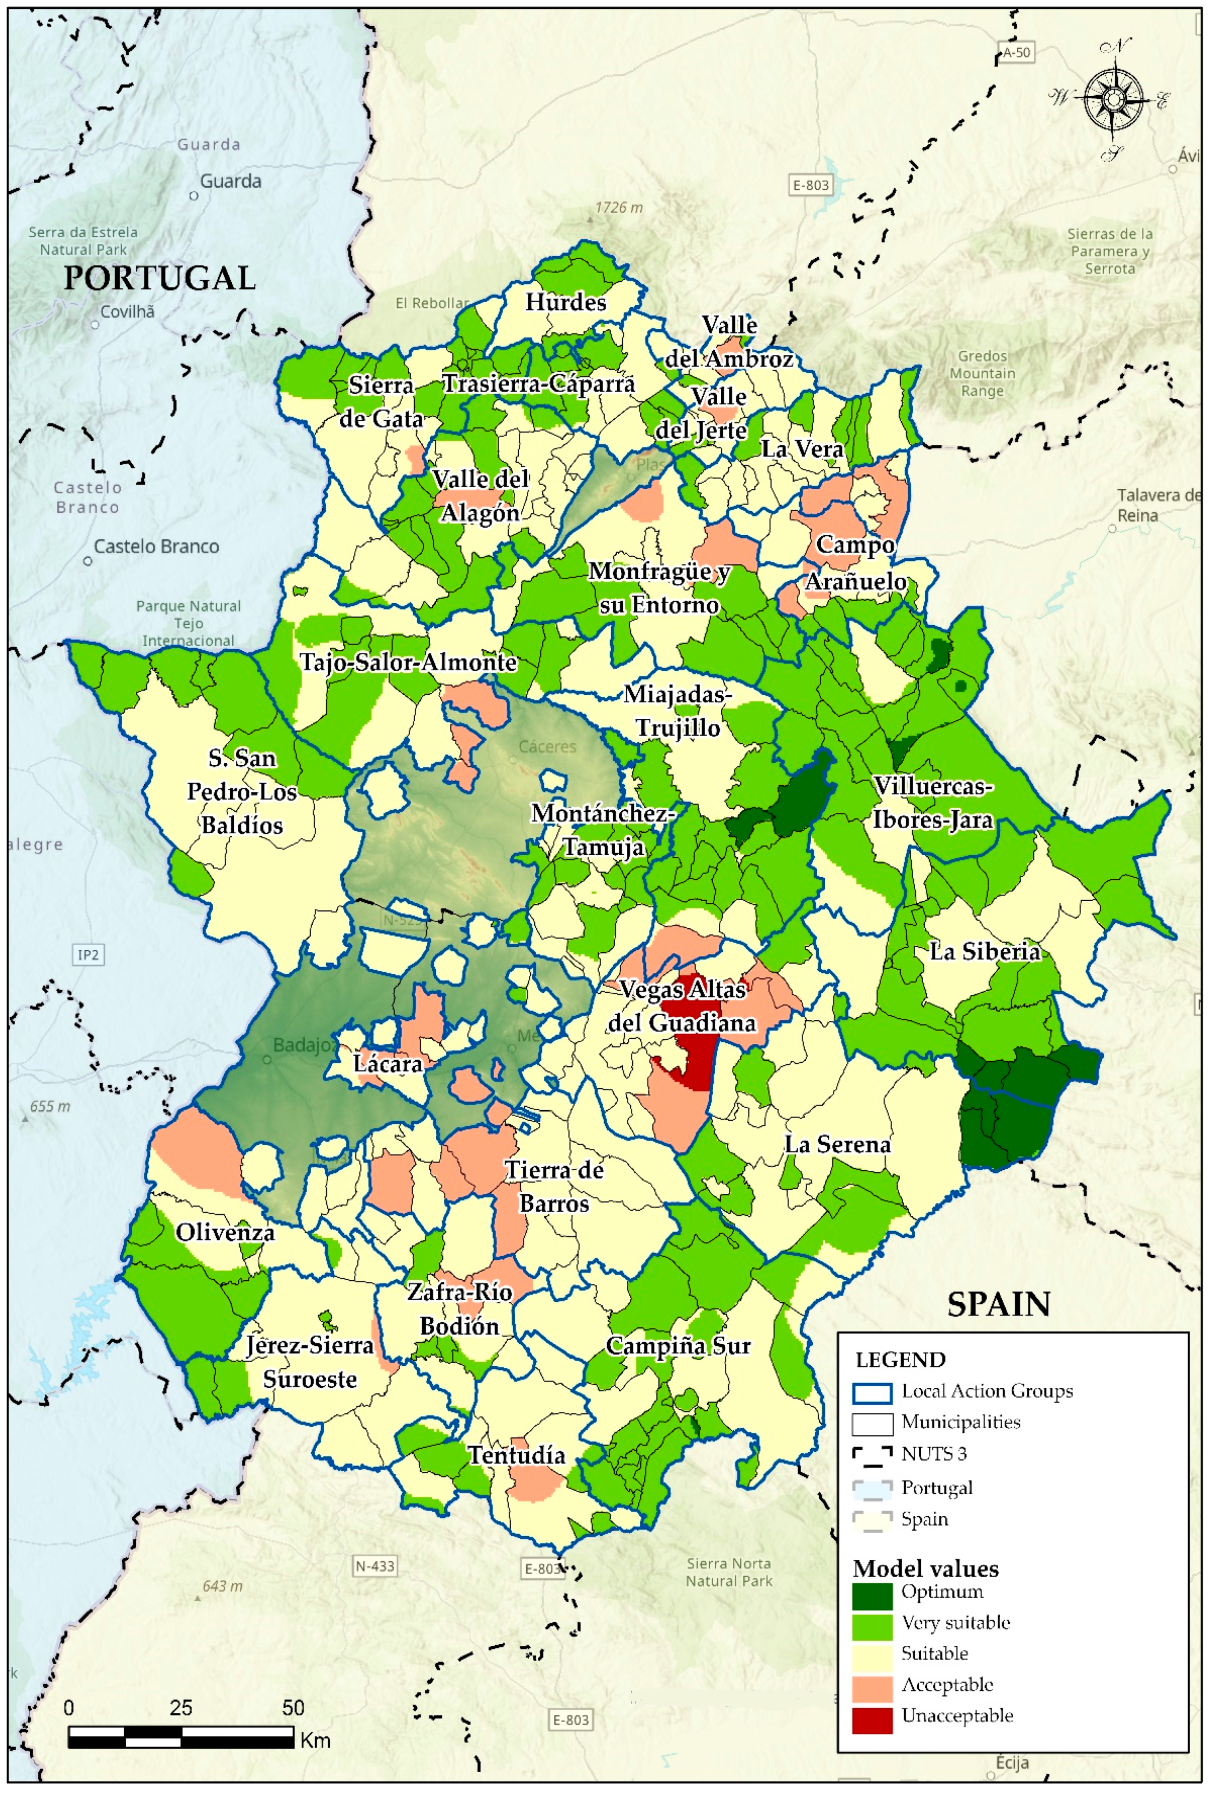
After the previous methodological process, the optimal location model of LEADER investments in Extremadura was obtained (Figure 5). In the model, the municipalities of the region appear according to their value as optimum, very suitable, acceptable, or unacceptable (Figure 6), i.e., which municipalities have the worst data in terms of population, population growth, birth and mortality rates, aging and productivity rates, unemployment rate, accessibility to urban centers, and investments and LEADER projects, and vice versa.
Table 7 shows the number of municipalities in each category or an alternative to the model.
There are 12 Extremaduran municipalities that are optimal for receiving aid for rural development due to their regressive demographic and socioeconomic situations and for being the ones that received the least investment from LEADER in the period 1994–2013. These represent 3.09% of the municipalities of the region and are located in Miajadas–Trujillo (2 municipalities), Villuercas–Ibores–Jara (3 municipalities), La Serena (3 municipalities), and La Siberia (4 municipalities). These 12 municipalities are located in bordering territories in the southeast of the region, as can be seen in the location maps displayed in the Section 2.1 (Figure 1 and Figure 2) and in Figure 5. In addition, they are far from the main regional communication routes and those of the main Extremaduran cities and are traditionally the least developed demographically and socioeconomically at the regional and state levels. Along with them, it is necessary to highlight 168 very suitable municipalities (43.30%), which also have unfavorable characteristics, without forgetting the 46.13% that appear to be suitable. In total, there are 359 municipalities for which it would be convenient to bet on the rural development strategy of Extremadura but we are emphasizing those with the worst situation. The 12 optimal ones have had, during the analyzed period, an average population of less than 1000 inhabitants (some of them have less than 200 inhabitants), negative population growth (around −20%), birth rates below 4%, and mortality rates between 20 and 50%. Moreover, they have had aging rates over 500, productivity rates below 70 (the highest value in the region is 9,453, in Belvís de Monroy, in Cáceres), and unemployment rates around 15–20%; require more than 40 min of travel to reach urban centers (due to their border nature within the region and due to the poor conditions of the transport system); and have had an average of four subsidized projects throughout the period 1994–2013, with a total average investment of EUR 169,000. It is necessary to point out that Risco (La Siberia) has not been a beneficiary of any aid in the 20 years analyzed, while Olivenza (protected by the LAG Olivenza), Azuaga (Campiña Sur), and Miajadas (Miajadas–Trujllo) have received more than EUR 13,000,000 million, with 219, 399, and 468 projects, respectively. Furthermore, it is necessary to know that the average number of projects has been 30 and the average investment EUR 1,500,000.
Contrarily, there is one municipality valued as unacceptable. It is located in Las Vegas del Guadiana, and, although it does not have such a high number of projects and amounts invested as in the cases described above, it does have good statistics regarding the demographic and socioeconomic variables introduced in the model. This LAG is located in the most productive irrigated areas of Extremadura and in which, for decades, an important agribusiness has been installed and exploited, which explains why so much is being invested in the area. In this LAG, there is one city, Don Benito, that is, with respect to the number of inhabitants, the fifth city in the urban system of Extremadura, and in the coming years, it will join the neighboring town of Villanueva de la Serena, and they will become the third region city. This will reinforce its character as a focus of economic and demographic attraction at the regional level.
Hence, through the model obtained, it is possible to identify specific municipalities that should be beneficiaries of greater aid for rural development, given that, over the past years, the subsidies have been destined for those municipalities that needed it least because of their demographic and socioeconomic characteristics. In addition, the conclusion can be reached that most of the projects subsidized through the LEADER approach in Extremadura and that large amounts of money have been concentrated in a few municipalities that have the most favorable demographic and socioeconomic characteristics of Extremadura.
4. Discussion
Throughout the years it has been a beneficiary of European aid for rural development, Extremadura has experienced an unequal distribution of aid, even after changing the regulations in the successive programming periods in search of better strategies and fund management. This has been confirmed in various investigations that analyze the functioning of rural development policy in European territory, such as [76,77,78], and through the results obtained in this study. On the basis of the optimum location model developed, the objective set has been achieved satisfactorily, that is, locating territories that do not receive aid for rural development. From a more economic approach to development, it can be considered logical and sustainable that more development is generated from businessmen and entrepreneurs already settled in each territory [79,80]. However, this causes investments to be grouped in already developed areas, leaving aside the municipalities that most need the implementation of new activities and the diversification of their economies. This same problem occurs, specifically, in the tourism sector. There are studies that reach the conclusion that a large part of the aid for rural development is aimed at rural tourism and that it is significantly concentrated in a few areas [18,81]. For example, it is a problem in coastal areas in Spain [82], where the establishments with better advice and a higher level of infrastructure tend to receive most of the aid at the expense of small rural accommodation, most of which is managed by families, with little training and whose income is complemented by other activities.
Finally, despite the great effort of the LAGs in designing their strategies, the “most powerful” groups and the most solvent businesspeople with prior experience, influence, and power are shaping their ideas. For this reason, studies such as this one are necessary to find out not only where and how the aid is directed but also where it is not. Taking into account the objective pursued by LEADER, it is contradictory that, in Extremadura, the more rural and disadvantages municipalities are the ones that receive the least support from the EAFRD. In order to identify these municipalities, it is necessary to take into account the multiple geographic variables on which decision-making must depend in the design of development strategies. Furthermore, it is essential to choose the most appropriate methods of analysis, such as the ones used in this work: the multicriteria evaluation analysis through the hierarchical analysis process and weighted overlay and the advantages of a GIS for spatial and location analysis.
In this way, applied geography is practiced in the study and analysis of rural development in Extremadura, until now done from a more descriptive perspective [3,14,83,84]. In addition, we approach the purposes of territorial planning and management pursued by the Structural Funds and European Investment Funds (ESI Funds) through “a set of concerted actions to guide the transformation, occupation and use of geographic spaces seeking their economic development taking into account the needs and interests of the population, the potential of the territory and the harmony of the environment” [85]. The multicriteria methods chosen in this study are an excellent tool that can be integrated with GIS instruments since they allow standardizing different types of geographic variables and greater integration that, otherwise, could not be taken into account in decision-making with spatial analysis. Although the methods applied are adequate, it is necessary to take into account that, on occasion, doubts may arise about the type of criteria/factors chosen in the multicriteria evaluation analysis and about the importance given to each one [86]. In this context, the multicriteria evaluation analysis, specifically the AHP, was used as a methodological tool to help decision-making in the fill of rural development in Extremadura to be more consistent, transparent, and legitimate and to avoid variability.
In the field of rural development, and more specifically in the distribution and allocation of public aid, it is vital to have adequate information to make the best decision, and it is a complex and delicate process in which the subjectivity and dependence of the information play a preponderant role. This and the results obtained justify applying true rural development in Europe, and specially in Extremadura, based on the design of strategies that have a multitude of geographical variables that characterize each territory, in order to achieve the desired sustainable rural development that leads to better demographic and socioeconomic conditions for the most ruralized.
Regarding the methodology used, the results of this research show that multicriteria analysis methods together with spatial analysis GIS tools allow obtaining good and adequate results and are versatile and adaptable to various fields of knowledge [87], not only the traditional ones, such as environmental or economic, but also the social and humanities ones, which also encompass problems in which multiple variables intervene, such as rural development. The implementation of rural development policy in Extremadura has been extensively analyzed, but using different methods to the one used in the present research, i.e., Nieto and Cárdenas applied principal component analysis [21] and Local Moran’s I and Getis Ord cluster analysis [15], obtaining different groups of municipalities according to LEADER aid and projects. After an extensive search, no studies have been found that analyze rural development through an AHP, which revalues the present one.
According to the objectives proposed by LEADER, it is clear that the results need to be evaluated from a quantitative perspective, for example, in terms of the number of projects. In fact, in Spain, as stated in the Section 1, various regions have been the object of analysis, such as Cantabria [88] and Castilla–La Mancha [89,90]. In these studies, LEADER is analyzed mainly through the basic territorial distribution of aid, the measures to which they are directed, the types of promoters, jobs created, etc., and the results are enlightening, but it is considered essential to relate them statistically with the demographic and socioeconomic context of the territories on which LEADER acts, as is done in this research. On the other hand, others authors, such as Navarro, Woods, and Cejudo [91], study the social aspect of LEADER, as well as Márquez et al. [92].
5. Conclusions
During the last 30 years, an interesting, innovative, and alternative development model to the traditional management of public aid has been applied in European rural areas, involving the transformation and reconstitution of public action through the incorporation of the local population in decision-making processes. Together with it, LAGs have been in charge of the design and start-up of the development strategies of their territories of action and the benefits generated are unquestionable. However, these have not been enough to prevent an unequal distribution of aid for rural development or the fact that some municipalities benefit more than others that have worse demographic and socioeconomic conditions, such as the case of the Spanish region of Extremadura. Nonetheless, in this work, we want to prove that LEADER is more than adequate for the management of rural development aid for its bottom-up approach and for its struggle to involve the population in development processes. Perhaps the rest of the European funds and policies should take LEADER as an example and apply its actions taking into account the needs of the population to feel safe and supported in their regions, as well as working together, since the objectives are the same, speaking then of territorial rather than rural development. For this, the work of the LAGs is essential. They faithfully know the weaknesses, threats, strengths, and opportunities of their territories, so they deserve greater freedom to design strategies and to reduce their bureaucratic burdens. In addition, more EAFRD action measures should be managed under the LEADER approach, so that the entire population, whether farmers, artisans, ranchers, or owners of a restaurant, is economically backed. If the population is aware and participates in the development processes, it will be feasible to bet on their place of origin, keeping the rural environment alive.
It is difficult to find a way to solve the fact that there is an unequal distribution of European funds for rural development in regions such as Extremadura due to the difficult situation of rural areas and the great complexity of the development processes. However, in this paper, a tool is presented that can serve in decision-making and in the supply of aid in an optimal way, so that a demographic and socioeconomic evaluation of the territory of action is necessary before distributing and weighing the projects to be subsidized.
Finally, as a future line of research, one aim is to continue investigating the demographic and socioeconomic variables that characterize rural areas in Extremadura and whether they influence the perception of aid for rural development. The model developed in this research will continue to evolve, since it is also intended to analyze the European programming period 2021–2027 and whether the same trends will continue in terms of aid through the LEADER approach. Thus, it will be possible to provide a tool with which the final distribution of aid is the most logical, fair, and sustainable possible for the benefit of the European rural environment.
Author Contributions
Conceptualization, G.C.A. and A.N.M.; methodology, G.C.A.; software, G.C.A.; validation, G.C.A., and A.N.M.; formal analysis, G.C.A.; investigation, G.C.A.; resources, G.C.A. and A.N.M.; writing—original draft preparation, G.C.A.; writing—review and editing, G.C.A. and A.N.M.; visualization, G.C.A.; funding acquisition, G.C.A. and A.N.M. All authors have read and agreed to the published version of the manuscript.
Funding
This research was funded by the European Regional Development Fund (ERDF) and by the Junta de Extremadura, grant number GR21164.
Institutional Review Board Statement
Not applicable.
Informed Consent Statement
Not applicable.
Data Availability Statement
Not applicable.
Conflicts of Interest
The authors declare no conflict of interest.
References
- Olvera Hernández, J.I.; Cazorla Montero, A.; Ramírez Valverde, B. La política de desarrollo rural en la Unión Europea y la iniciativa LEADER, una experiencia de éxito. Región Soc. 2009, 21, 3–25. [Google Scholar] [CrossRef]
- Tolón Becerra, A.; Lastra Bravo, X. Evolución del Desarrollo Rural en Europa y en España. Las Áreas rurales de metodología LEADER. Rev. Electrónica Medioambiente 2007, 4, 35–62. [Google Scholar]
- Nieto, A.; Cárdenas, G. El Método Leader como política de desarrollo rural en Extremadura en los último 20 años (1991–2013). Boletín Asoc. Geógrafos Españoles 2015, 23, 139–162. [Google Scholar]
- Cárdenas Alonso, G.; Nieto Masot, A. El Enfoque LEADER en el nuevo FEADER 2014–2020 en Extremadura Cuad. Geográficos 2020, 59, 5–26. [Google Scholar] [CrossRef]
- Alario Trigueros, M.; Baraja Rodríguez, E. Políticas públicas de desarrollo rural en Castilla y León, ¿Sostenibilidad consciente o falta de opciones?: Leader II. Boletín Asoc. Geógrafos Españoles 2006, 26, 267–293. [Google Scholar]
- Serrano Andres, A.; Hernández Navarro, M.L.; Barthe, L. La gobernanza multinivel como elemento clave dentro del programa LEADER para el desarrollo territorial y el empoderamiento de los actores locales: Los casos de Aragón y Midi-Pyrénées. Cuad. Geográficos Univ. Granada 2021, 60, 192–211. [Google Scholar] [CrossRef]
- Staic, L.G.; Vladu, M. Studies concerning the evolution of the LEADER Approach, part of the Common Agricultural Policy, as a support for sustainable development of the rural area. Studies 2020, 20, 495–500. [Google Scholar]
- Cañete, J.A.; Navarro, F.; Cejudo, E. Territorially unequal rural development: The cases of the LEADER Initiative and the PRODER Programme in Andalusia (Spain). Eur. Plan. Stud. 2018, 26, 726–744. [Google Scholar] [CrossRef]
- Esparcia, J.; Abbasi, F. Territorial governance and rural development: Challenge or reality? In Neoendogenous Development in European Rural Areas; Springer: Berlin/Heidelberg, Germany, 2020; pp. 33–60. [Google Scholar]
- Unión Europea. Reglamento (CE) nº 1698/2005 del Consejo de 20 de Septiembre de 2005 Relativo a la Ayuda al Desarrollo Rural a Través del Fondo Europeo Agrícola de Desarrollo Rural (FEADER). 2005, p. 40. Available online: https://www.boe.es/buscar/doc.php?id=DOUE-L-2005-82014 (accessed on 21 July 2022).
- Dax, T.; Fischer, M. An alternative policy approach to rural development in regions facing population decline. Eur. Plan. Stud. 2018, 26, 297–315. [Google Scholar] [CrossRef]
- Esparcia Pérez, J.; Noguera Tur, J.; Pitarch Garrido, M.D. LEADER in Spain: Rural development, power, legitimation, learning and new structures. Doc. D’analisi Geogr. 2000, 37, 95–113. [Google Scholar]
- Navarro Valverde, F.A.; Cejudo García, E.; Maroto Martos, J.C. Reflexiones en torno a la participación en el desarrollo rural. ¿Reparto social o reforzamiento del poder? LEADER y PRODER en el sur de España. EURE 2014, 40, 21. [Google Scholar]
- Nieto Masot, A.; Cárdenas Alonso, G. 25 Years of the Leader Initiative as European Rural Development Policy: The Case of Extremadura (SW Spain). Eur. Countrys. 2017, 9, 302–316. [Google Scholar] [CrossRef] [Green Version]
- Nieto Masot, A.; Cárdenas Alonso, G. The Rural Development Policy in Extremadura (SW Spain): Spatial Location Analysis of Leader Projects. ISPRS Int. J. Geo-Inf. 2018, 7, 76. [Google Scholar] [CrossRef] [Green Version]
- Brezzi, M.; Dijkstra, L.; Ruiz, V. OECD Extended Regional Typology: The Economic Performance of Remote Rural Regions; OECD Publishing: Paris, France, 2011. [Google Scholar]
- Cárdenas Alonso, G.; Nieto Masot, A. Towards Rural Sustainable Development? Contributions of the EAFRD 2007–2013 in Low Demographic Density Territories: The Case of Extremadura (SW Spain). Sustainability 2017, 9, 1173. [Google Scholar] [CrossRef] [Green Version]
- Engelmo Moriche, Á.; Nieto Masot, A.; Mora Aliseda, J. Economic sustainability of touristic offer funded by public initiatives in Spanish rural areas. Sustainability 2021, 13, 4922. [Google Scholar] [CrossRef]
- Engelmo Moriche, Á.; Nieto Masot, A.; Mora Aliseda, J. Territorial Analysis of the Survival of European Aid to Rural Tourism (Leader Method in SW Spain). Land 2021, 10, 1030. [Google Scholar] [CrossRef]
- Leco Berrocal, F.; Pérez Díaz, A.; Mateos Rodríguez, A.B. Crisis demográfica en la Extremadura rural: Valoración a través de los Grupos de Acción Local (2007–2014). Cuad. Geográficos Univ. Granada 2017, 56, 76–100. [Google Scholar]
- Nieto Masot, A.; Cárdenas Alonso, G.; Costa Moreno, L.M. Principal Component Analysis of the LEADER Approach (2007–2013) in South Western Europe (Extremadura and Alentejo). Sustainability 2019, 11, 4034. [Google Scholar] [CrossRef] [Green Version]
- Cejudo García, E.; Cañete Pérez, J.A.; Navarro Valverde, F.A.; Capote, A. Fracaso en la implementación de los proyectos Leader en el rural profundo de Andalucía (España): Juventud y mujer. J. Depopulation Rural. Dev. Stud. 2021, 33, 249–278. [Google Scholar]
- Cejudo García, E.; Navarro Valverde, F.A.; Cañete Pérez, J.A. Who Decides and Who Invests? The Role of the Public, Private and Third Sectors in Rural Development according to Geographical Contexts: The LEADER Approach in Andalusia, 2007–2015. Sustainability 2022, 14, 3853. [Google Scholar] [CrossRef]
- Paül i Carril, V.; Lazovski, O.; Lois González, R.C. Más de veinte años de LEADER en Galicia: Un análisis de su desarrollo en las Comarcas de a Limia ya Baixa Limia. In Treinta años de Política Agraria Común en España: Agricultura y Multifuncionalidad en el Contexto de la Nueva Ruralidad; Asociación de Geógrafos Españoles: Madrid, Spain, 2016; pp. 413–428. [Google Scholar]
- Black, S.; Conway, E. The European Community’s LEADER programme in the Highlands and Islands. Scott. Geogr. Mag. 1996, 112, 101–106. [Google Scholar] [CrossRef]
- Lukic, A.; Obad, O. New Actors in Rural Development—The LEADER Approach and Projectification in Rural Croatia. Sociol. Space 2016, 54, 71–90. [Google Scholar]
- Olar, A.; Jitea, M.I. Counterbalancing the Development Territorial Disparities in the Implementation of the Community-Led Local Development EU Approach in Romania. Land 2021, 10, 970. [Google Scholar] [CrossRef]
- Pérez Yruela, M.; Guzmán Guerrero, M. Reducción de las Desigualdades en el Desarrollo de los Territorios Rurales. Entre la Realidad y el Deseo. La España Rural: Retos y Oportunidades de Futuro. 2022, pp. 317–332. Available online: https://publicacionescajamar.es/publicacionescajamar/public/pdf/publicaciones-periodicas/mediterraneo-economico/35/me-35-reduccion-de-las-desigualdades-en-el-desarrollo-de-los-territorios-rurales.pdf (accessed on 21 July 2022).
- Bosque Sendra, J.; Díaz Castillo, C.; Díaz Muñoz, M.Á. De la justicia espacial a la justicia ambiental en la política de localización de instalaciones para la gestión de residuos en la comunidad de Madrid. Boletín Real Soc. Geográfica Dep. Geogr. Univ. Alcalá 2002, 137, 89–114. [Google Scholar]
- Bosque Sendra, J.; García, R.C. El uso de los sistemas de información geografica en la planificación territorial. An. Geogr. Univ. complut. 2000, 20, 49. [Google Scholar]
- Bosque Sendra, J.; Moreno Jiménez, A. Sistemas de Información Geográfica y Localización Óptima de Instalacines y Equipamientos; Ra-Ma: Madrid, Spain, 2012. [Google Scholar]
- Barredo, J.I.; Lavalle, C.; Kasanko, M. Urban scenario modeling and forecast for sustainable urban and regional planning. In GIS for Sustainable Development; CRC Press: Boca Raton, FL, USA, 2005; pp. 349–366. [Google Scholar]
- Wind, Y.; Saaty, T.L. Marketing applications of the analytic hierarchy process. Manag. Sci. 1980, 26, 641–658. [Google Scholar] [CrossRef]
- Laffeuillade, L.M.; Barragán, F.G.; Geraldi, A.M.; Arias, J. Modelo de localización óptima de balnearios mediante análisis espacial en la provincia de Buenos Aires. República Argentina. Cuad. Geográficos 2020, 59, 330–348. [Google Scholar] [CrossRef]
- Ochoa Urrego, R.L.; Peña Reyes, J.I. Proceso de Análisis Jerárquico (AHP): Revisión de los Desarrollos Recientes. Departamento de Ingeniería de Sistemas e Industrial. Available online: https://repositorio.unal.edu.co/handle/unal/56297?show=full (accessed on 21 July 2022).
- França, L.C.d.J.; Lopes, L.F.; Morais, M.S.d.; Lisboa, G.d.S.; Rocha, S.J.S.S.d.; Morais, V.T.M.d., Jr.; Santana, R.C.; Mucida, D.P. Environmental Fragility Zoning Using GIS and AHP Modeling: Perspectives for the Conservation of Natural Ecosystems in Brazil. Conservation 2022, 2, 349–366. [Google Scholar] [CrossRef]
- García Leyton, L.A. Aplicación del Análisis Multicriterio en la Evaluación de Impactos Ambientales; Universitat Politècnica de Catalunya: Barcelona, Spain, 2004. [Google Scholar]
- Hernández-Zaragoza, P.; Valdez-Lazalde, J.R.; Aldrete, A.; Martínez-Trinidad, T. Evaluación multicriterio y multiobjetivo para optimizar la selección de áreas para establecer plantaciones forestales. Madera Bosques 2019, 25, e2521819. [Google Scholar] [CrossRef]
- Iturralde Mota, O. Análisis Espacial Multicriterio enfocado a la gestón de proyectos de agua potable en el municipio de Huimanguillo, Tasbasco. Kuxulkab 2017, 23, 46. [Google Scholar]
- Izquierdo, J.M. Energía Eólica y Territorio; Universidad de Sevilla: Seville, Spain, 2008. [Google Scholar]
- Lamelas García, M.T. Aplicación de técnicas de análisis multicriterio a la localización óptima de extracciones de arenas y gravas en el entorno de Zaragoza. Boletín Asoc. Geógrafos Españoles 2014, 66, 25–48. [Google Scholar] [CrossRef] [Green Version]
- Buzai, G.D. Evaluación Multicriterio y Análisis Espacial de los Servicios de Salud: Conceptos Centrales y Aplicaciones Realizadas a la Ciudad de Luján (Provincia de Buenos Aires, Argentina), Anuario de la División Geografía. 2014. Available online: https://ri.conicet.gov.ar/handle/11336/99213 (accessed on 21 July 2022).
- Luque Gil, A.M. La evaluación del medio para la práctica de actividades turístico-deportivas en la naturaleza. Cuad. Tur. 2003, 12, 131–150. [Google Scholar]
- Bosque Sendra, J.; Díaz Muñoz, M.Á.; Rodríguez Durán, A.E.; Salado García, M.J. La componente geográfica en la percepción pública de las actividades no deseadas: Las instalaciones para el tratamiento de residuos en el área metropolitana de Madrid. Lect. Geográficas 2000, 2, 1015–1028. [Google Scholar]
- Galacho Jiménez, F.B.; Arrebola Castaño, J.A. Modelo de evaluación de la capacidad de acogida del territorio con SIG y técnicas de decisión multicriterio respecto a la implantación de edificaciones en espacios rurales. Investig. Geográficas 2013, 60, 69–85. [Google Scholar] [CrossRef] [Green Version]
- Źróbek-Różańska, A.; Ogryzek, M.; Źróbek-Sokolnik, A. Creating a Healthy Environment for Children: GIS Tools for Improving the Quality of the Social Welfare Management System. Int. J. Environ. Res. Public Health 2022, 19, 7128. [Google Scholar] [CrossRef]
- Jeong, J.S.; García Moruno, L.; Hernández Blanco, J.; Jaraíz Cabanillas, F.J. Modelización sostenible del emplazamiento de nuevas segundas residencias en el medio rural. El caso de La Vera (Extremadura). Estud. Geográficos 2016, 77, 191–216. [Google Scholar] [CrossRef] [Green Version]
- González-Ramiro, A.; Gonçalves, G.; Sánchez-Ríos, A.; Jeong, J.S. Using a VGI and GIS-based multicriteria approach for assessing the potential of rural tourism in Extremadura (Spain). Sustainability 2016, 8, 1144. [Google Scholar] [CrossRef] [Green Version]
- Guillén Peñafiel, R.; Hernández Carretero, A.M.; Sánchez Martín, J.M. Claves para mejorar la valoración en destinos turísticos de Extremadura. Una aportación del Proceso de Análisis Jerárquico (PAJ). Investig. Geográficas 2020, 74, 139–163. [Google Scholar]
- Ramírez, M.L. Modelos de localización óptima para evaluar el grado de justicia territorial en equipamientos colectivos. In Sistemas de Información Geográfica en la Investigación Científica Actual; Editorial Universidad General Sarmiento: Buenos Aires, Argentina, 2015. [Google Scholar]
- Buzai, G.D.; Fuenzalida, M.; Buzai, G.D.; Moreno Jiménez, A.; García de León Loza, A. Potencialidad de la metodología de evaluación multicriterio aplicada con sistemas de información geográfica. Geogr. Geotecnol. Análisis Espac. 2015, 99, 99–111. [Google Scholar]
- De Cos Guerra, O. SIG y evaluación multicriterio: Propuesta metodológica para cuantificar el grado de metropolización en el territorio. Mapping 2007, 116, 6–12. [Google Scholar]
- Palma Herrera, J.L. Sistemas de Información Geográfica (SIG) y Metodologías de Evaluación Multicriterio (EMC) en la búsqueda de escenarios alternativos para el mejoramiento socio-espacial de las áreas urbanas populares de la Ciudad de Comayagua. Cienc. Espac. 2015, 8, 452–468. [Google Scholar] [CrossRef] [Green Version]
- Vázquez Arenas, G.; García-León, J.; Silvente Martínez, M.J.; Ros-Torres, J. Modelo de Aplicación de Evaluación Multicriterio al Análisis del Territorio; Universidad Politécnica de Cartagena: Cartagena, Spain, 2015. [Google Scholar]
- Cárdenas Alonso, G.; Nieto Masot, A. Rural Space Governance in Extremadura (SW Spain). Analysis of the Leader Approach. Eur. Countrys. 2020, 12, 448–468. [Google Scholar] [CrossRef]
- Risco Rosales, I.; De la Macorra Cano, L.F. Área transfronteriza Alentejo, Extremadura y Centro: Situación socioeconómina y perspectivas. Rev. Estud. Extrem. 2006, 62, 1145–1166. [Google Scholar]
- Cayetano Rosado, M. Extremadura y Alentejo: Del subdesarrollo heredado a los retos del futuro. Rev. Estud. Extrem. 2006, 62, 1167–1188. [Google Scholar]
- Cañete Pérez, J.A.; Labianca, M.; Cejudo García, E.; De Rubertis, S.; Valverde Navarro, F.A.; Belliggiano, A. ¿ La práctica del desarrollo rural genera desequilibrio territorial? El caso de LEADER en el sur de Europa: Andalucía (España) y Puglia (Italia. 2007–2013). In Proceedings of the Naturaleza, Territorio y Ciudad en un Mundo Global, Madrid, Spain, 25–27 October 2017; pp. 2404–2413. [Google Scholar]
- Cejudo Garcǐa, E. Territorial unbalances of the agrarian community policy. Cuad. Geogr. 2000, 30, 143–163. [Google Scholar]
- Marsden, T.; Sonnino, R. Rural development and the regional state: Denying multifunctional agriculture in the UK. J. Rural. Stud. 2008, 24, 422–431. [Google Scholar] [CrossRef]
- Sáenz Lorite, M.; Cejudo García, E. La política de desarrollo rural de la Unión Europea para 2007–2013. Investig. Geográficas 2008, 46, 5–30. [Google Scholar] [CrossRef] [Green Version]
- Barrientos Alfageme, G. Geografía de Extremadura. Universitas. Badajoz. 1990. Available online: https://dialnet.unirioja.es/servlet/libro?codigo=92942 (accessed on 21 July 2022).
- García Paredes, M.C.; Nieto Masot, A. La organización de la atención sociosanitaria a las personas mayores en Extremadura. Investig. Geográficas 2015, 161–178. [Google Scholar] [CrossRef] [Green Version]
- González Regidor, J. Desarrollo Rural de Base Territorial: Extremadura (España); Junta de Extremadura; Consejería de Desarrollo Rural; Ministerio de Agricultura, Pesca y Alimentación (MAPA): Madrid, Spain, 2006; p. 283. [Google Scholar]
- Gurría, J.L. El sistema urbano en Extremadura y su influencia en el desarrollo rural. Ciudad Territ. Estud. Territ. 2007, 115, 29. [Google Scholar]
- Maier, D.; Remete, A.-N.; Corda, A.-M.; Nastasoiu, I.-A.; Lazăr, P.-S.; Pop, I.-A.; Luca, T.-I. Territorial Distribution of EU Funds Allocation for Developments of Rural Romania during 2014–2020. Sustainability 2022, 14, 506. [Google Scholar] [CrossRef]
- Pîrvu, R.; Dragomir, L.; Budică, B.; Bratu, R.-Ș.; Dinulescu, S.; Țenea, L. The Impact of RDP Measures on the Rural Development: The Case of Romania. Sustainability 2022, 14, 4857. [Google Scholar] [CrossRef]
- Nieto Masot, A.; Cárdenas Alonso, G.; Engelmo Moriche, Á. Design of a development index for Spanish municipalities. Sustainability 2020, 12, 8910. [Google Scholar] [CrossRef]
- Bermudez Irreño, C.A. Aplicación practica del proceso de análisis jerárquico (AHP), para la toma de decisiones. Rev. Ing. Matemáticas Cienc. Inf. 2018, 5, 91–100. [Google Scholar] [CrossRef]
- Pinzón Ospina, E. Determinación de Zonas Aptas Para la Construcción de Colegios Distritales en la Localidad de Suba, Partiendo de Métodos de Análisis Multicriterio y Herramientas SIG. 2015. Available online: http://hdl.handle.net/10654/6305 (accessed on 21 July 2022).
- Peña Florez, L.A.; Rodríguez-Rojas, Y.L. Procedimiento de evaluación y selección de proveedores basado en el proceso de análisis jerárquico y en un modelo de programación lineal entera mixta. Ingeniería 2018, 23, 230–251. [Google Scholar] [CrossRef]
- Wang, T.-Y.; Yang, Y.-H. A fuzzy model for supplier selection in quantity discount environments. Expert Syst. Appl. 2009, 36, 12179–12187. [Google Scholar] [CrossRef]
- Navarro, I.J.; Yepes, V.; Martí, J.V. Comparación pareada como método de evaluación de competencias transversales en materia de sostenibilidad. In Proceedings of the IN-RED 2020: VI Congreso de Innovación Educativa y Docencia en Red, Valencia, Spain, 16–17 July 2020; pp. 670–679. [Google Scholar]
- Souza, J.C.F.; de Moraes Souza, J.G.; Neumann, C.; Rodrigues Santos, M.; Mendes Porto, M.; Ribeiro, I. Modelo de análise multicritério de apoio à decisão aplicado as eleições para presidência de 2018. Rev. Ibérica Sist. Tecnol. Inf. 2020, 3, 423–432. [Google Scholar]
- Saaty, T.L. Decision making with the analytic hierarchy process. Int. J. Serv. Sci. 2008, 1, 83–98. [Google Scholar] [CrossRef] [Green Version]
- Cejudo, E. Quince años de aplicación de los programas de desarrollo rural. Desigualdades sociales y territoriales en la provincia de Granada. Scr. Nova. Rev. Electónica Geogr. Cienc. Soc. 2012, 16. [Google Scholar]
- Chevalier, P.; Mačiulyté, J.; Razafimahefa, L.; Dedeire, M. The Leader Programme as a Model of Institutional Transfer: Learning from Its Local Implementation in France and Lithuania. Eur. Countrys. 2017, 9, 317–341. [Google Scholar] [CrossRef] [Green Version]
- Rizzo, F. LEADER policy practices and landscapes in the light of the agency-structure debate: Evidence from LEADER local action groups in Italy and in Finland. Eur. Countrys. 2013, 5, 232–250. [Google Scholar] [CrossRef] [Green Version]
- Cebrián Abellán, A. La alternativa para Iberoamérica del desarrollo rural con enfoque local. Altern. Para Iberoamérica Del Desarro. Rural Con. Enfoque Local 2006, 1000–1006. [Google Scholar]
- Lutz, B.; Riella, A. El desarrollo rural: Discursos oficiales y prácticas normativas en México. Pampa Rev. Interuniv. Estud. Territ. 2006, 1, 11–25. [Google Scholar] [CrossRef] [Green Version]
- Nieto, A.; Engelmo, A.; Cárdenas, G. Análisis espacial de la división comarcal en áreas rurales de baja densidad demográfica: El caso de Extremadura. Pap. Geogr. 2017, 63, 113–132. [Google Scholar] [CrossRef] [Green Version]
- García Marín, R. Turismo y desarrollo rural en la comarca del noroeste de la región de Murcia: Los programas europeos LEADER. Cuad. Tur. 2011, 27, 419–435. [Google Scholar]
- Castellano-Álvarez, F.J.; del Río, M.d.l.C.; Durán-Sánchez, A. Eficacia de la Iniciativa Leader Como Instrumento de Desarrollo Rural. Estudio de Caso de Extremadura (España). RPER 2020, 55, 61–78. [Google Scholar]
- Crosta, N. Placed-Based Policies for Rural Development-Extremadura, Spain (Case Study); Organisation for Economic Co-Operation and Development (OECD): Paris, France, 2004. [Google Scholar]
- Jordán, R.; Sabatini, F. Economía política de los desastres naturales: Prevención y capacitación. Rev. EURE-Rev. Estud. Urbano Reg. 1988, 14. [Google Scholar]
- González Valencia, J.E. Propuesta metodológica basada en un análisis multicriterio para la identificación de zonas de amenaza por deslizamientos e inundaciones. Rev. Ing. Univ. Medellín 2006, 5, 59–70. [Google Scholar]
- Osorio Gómez, J.C.; Orejuela Cabrera, J.P. El proceso de Análisis Jerárquico (AHP) y la Toma de Decisiones Multicriterio. Ejemplo de Aplicación. Sci. Tech. 2008, 2. [Google Scholar]
- Delgado Viñas, C. Los Programas de Desarrollo Rural en Cantabria. Libro Blanco de la Agricultura y el Desarrollo Rural. 2002. Available online: https://www.mapa.gob.es/es/ministerio/servicios/informacion/plataforma-de-conocimiento-para-el-medio-rural-y-pesquero/biblioteca-virtual/libros-blancos/agricultura-t3.aspx (accessed on 21 July 2022).
- Alfaro, J.; Mondéjar, J.; Vargas, M. Análisis del impacto de los programas LEADEr y PRODER en Castilla-La Mancha: Medidas de apoyo a pequeñas empresas, artesanía y servicios. Rev. Desarro. Rural. Coop. Agrar. 2004, 8, 63–75. [Google Scholar]
- Carmona García, F.J. Analisis Territorial de los Efectos de los Programas de Desarrollo Rural LEADER + y PRODER II en Castilla-La Mancha. Ph.D. Thesis, Universidad de Castilla-La Mancha, Ciudad Real, Spain, 2013. [Google Scholar]
- Navarro, F.; Woods, M.; Cejudo, E. The LEADER Initiative has been a Victim of Its Own Success. The Decline of the Bottom-Up Approach in Rural Development Programmes. The Cases of Wales and Andalusia. Sociol. Rural. 2016, 56, 270–288. [Google Scholar] [CrossRef]
- Márquez Fernández, D.; Foronda Robles, C.; Galindo Pérez de Azpillaga, L.; García López, A. Eficacia y eficiencia de Leader II en Andalucía. Aproximación a un índice-resultado en materia de turismo rural. Geographicalia 2005, 47, 137–152. [Google Scholar]
Figure 1.
Study area: Extremadura (Spain). Source: Authors.

Figure 2.
Study area: Extremadura (Spain) and the territorial scope of the LAGs. Source: Authors.

Figure 3.
Methodological process. Source: Authors.

Figure 4.
Example of the weighted overlay tool process in ArcGIS Pro. Source: ArcGIS Pro Help.

Figure 5.
Optimal localization model of LEADER investments in Extremadura. Source: Authors.

Figure 6.
Results of the optimal localization model of LEADER investments in Extremadura. Source: Authors.
Figure 6.
Results of the optimal localization model of LEADER investments in Extremadura. Source: Authors.


Table 1.
Selected variables and characteristic to be optimally assessed.
| Variable | Characteristics to Be Optimally Assessed |
|---|---|
| % Population with respect to the total population of Extremadura (average 2010–2020) | Low population |
| % Population growth (average 2010–2020) | Low population growth |
| Birth rate (average 2010–2020) | Low birth rate |
| Mortality rate (average 2010–2020) | High mortality rate |
| Aging index (average 2010–2020) | High aging index |
| Productivity index (average 2010–2020) | Low productivity index |
| Unemployment rate (average 2010–2020) | High unemployment rate |
| Accessibility to urban centers | Long access times to urban centers |
| Total LEADER investment in Extremadura (1994–2013) | Low LEADER investments |
| No. of LEADER projects in Extremadura (1994–2013) | Few projects |
Table 2.
Reclassified variables.
| % Population (inhab) | % Population Growth (%) | Birth Rate (‰) | Mortality Rate (‰) | Aging Index (%) | Productivity Index | Unemployment Rate (%) | Accessibility (minutes) | LEADER Investments (EUR) | LEADER Projects (Number) | Location Type | Standardized Value |
|---|---|---|---|---|---|---|---|---|---|---|---|
| <500 | −41–−20 | 0–4 | 20.1–93 | 500.1–4900 | 0–40 | 20.1–25.2 | >40 | 0–300,000 | 0–10 | Optimum | 1 |
| 501–1000 | −19.9–0 | 4.1–6 | 15.1–20 | 250.1–500 | 41–70 | 15.1–20 | 30.1–40 | 300,001–500,000 | 11–30 | Very suitable | 2 |
| 1001–2000 | 0.1–5 | 6.1–8 | 10.1–15 | 150.1–250 | 71–100 | 10.1–15 | 20.1–30 | 500,001–1,000,000 | 31–50 | Suitable | 3 |
| 2001–10,000 | 5.1–20 | 8.1–10 | 5.1–10 | 100–150 | 101–500 | 5.1–10 | 10.1–20 | 1,000,001–6,500,000 | 51–70 | Acceptable | 4 |
| >10,000 | >20 | >10 | 0–5 | <100 | 501–4900 | 0–5 | 0–10 | >6,500,000 | >70 | Unacceptable | 5 |
Table 3.
Importance rating for the construction of the PCM.
| 1= | If criterion “x” is equal in importance to criterion “y” |
| 2= | If criterion “x” is slightly more important than criterion “y” |
| 5= | If criterion “x” is significantly more important than criterion “y” |
| 7= | If criterion “x” is much more important than criterion “y” |
| 9= | If criterion “x” is absolutely more important than criterion “y” |
Table 4.
Pairwise comparison matrix (PCM).
| % Population | % Population Growth | Birth Rate | Mortality Rate | Aging Index | Productivity Index | Unemployment Rate | Accessibility | LEADER Investment | LEADER Projects | |
|---|---|---|---|---|---|---|---|---|---|---|
| % Population | 1 | 1/5 | 1/5 | 1/5 | 1/5 | 1/2 | 1/2 | 1/5 | 1/2 | 1/2 |
| % Population growth | 5/1 | 1 | 1/2 | 1/5 | 1/5 | 1/2 | 1/2 | 1/2 | 1/2 | 1/2 |
| Birth rate | 5/1 | 2/1 | 1 | 1/2 | 1/5 | 1/2 | 1/2 | 1/5 | 1/2 | 1/2 |
| Mortality rate | 5/1 | 5/1 | 2/1 | 1 | 2/1 | 2/1 | 2/1 | 1/2 | 2/1 | 2/1 |
| Aging index | 5/1 | 5/1 | 5/1 | 1/2 | 1 | 7/1 | 7/1 | 1/2 | 2/1 | 2/1 |
| Productivity index | 2/1 | 2/1 | 2/1 | 1/2 | 1/7 | 1 | 2/1 | 1/2 | 1/5 | 1/5 |
| Unemployment rate | 2/1 | 2/1 | 2/1 | 1/2 | 1/7 | 1/2 | 1 | 1/5 | 1/5 | 1/5 |
| Accessibility | 5/1 | 2/1 | 5/1 | 2/1 | 2/1 | 2/1 | 5/1 | 1 | 5/1 | 5/1 |
| LEADER investment | 2/1 | 2/1 | 2/1 | 1/2 | 1/2 | 5/1 | 5/1 | 1/5 | 1 | 1/2 |
| LEADER projects | 2/1 | 2/1 | 2/1 | 1/2 | 1/2 | 5/1 | 5/1 | 1/5 | 2/1 | 1 |
Table 5.
Normalized pairwise comparison matrix (NPCM).
| % Population | % Population Growth | Birth Rate | Mortality Rate | Aging Index | Productivity Index | Unemployment Rate | Accessibility | LEADER Investment | LEADER Projects | |
|---|---|---|---|---|---|---|---|---|---|---|
| % Population | 1 | 0.20 | 0.20 | 0.20 | 0.20 | 0.50 | 0.50 | 0.20 | 0.50 | 0.50 |
| % Population growth | 5 | 1 | 0.50 | 0.20 | 0.20 | 0.50 | 0.50 | 0.50 | 0.50 | 0.50 |
| Birth rate | 5 | 2 | 1 | 0.50 | 0.20 | 0.50 | 0.50 | 0.20 | 0.50 | 0.50 |
| Mortality rate | 5 | 5 | 2 | 1 | 2 | 2 | 2 | 0.50 | 2 | 2 |
| Aging index | 5 | 5 | 5 | 0.50 | 1 | 7 | 7 | 0.50 | 2 | 2 |
| Productivity index | 2 | 2 | 2 | 0.50 | 0.14 | 1 | 2 | 0.50 | 0 | 0.20 |
| Unemployment rate | 2 | 2 | 2 | 0.50 | 0.14 | 0.50 | 1 | 0.20 | 0 | 0.20 |
| Accessibility | 5 | 2 | 5 | 2 | 2 | 2 | 5 | 1 | 5 | 5 |
| LEADER investment | 2 | 2 | 2 | 0.50 | 0.50 | 5 | 5 | 0.20 | 1 | 0.50 |
| LEADER projects | 2 | 2 | 2 | 0.50 | 0.50 | 5 | 5 | 0.20 | 2 | 1 |
Table 6.
Priority vector for subcriteria.
| Subcriterion | Weighting | Percentage |
|---|---|---|
| % Population | 0.03 | 3 |
| % Population growth | 0.05 | 5 |
| Birthrate | 0.06 | 6 |
| Mortality rate | 0.15 | 15 |
| Aging index | 0.18 | 18 |
| Productivity index | 0.06 | 6 |
| Unemployment rate | 0.05 | 5 |
| Accessibility | 0.23 | 23 |
| LEADER investment | 0.09 | 9 |
| LEADER projects | 0.10 | 10 |
Table 7.
Number of municipalities by category of the optimal location model.
| Zones | No. of Municipalities | % of Municipalities |
|---|---|---|
| Optimum | 12 | 3.09 |
| Very suitable | 168 | 43.30 |
| Suitable | 179 | 46.13 |
| Acceptable | 28 | 7.22 |
| Unacceptable | 1 | 0.26 |
Publisher’s Note: MDPI stays neutral with regard to jurisdictional claims in published maps and institutional affiliations. |
© 2022 by the authors. Licensee MDPI, Basel, Switzerland. This article is an open access article distributed under the terms and conditions of the Creative Commons Attribution (CC BY) license (https://creativecommons.org/licenses/by/4.0/).
Share and Cite
MDPI and ACS Style
Cárdenas Alonso, G.; Nieto Masot, A. Mapping the Optimal Rural Areas to Invest in through the LEADER Approach: Case Study—Extremadura (SW Spain). Land 2022, 11, 1191. https://0-doi-org.brum.beds.ac.uk/10.3390/land11081191
AMA Style
Cárdenas Alonso G, Nieto Masot A. Mapping the Optimal Rural Areas to Invest in through the LEADER Approach: Case Study—Extremadura (SW Spain). Land. 2022; 11(8):1191. https://0-doi-org.brum.beds.ac.uk/10.3390/land11081191
Chicago/Turabian StyleCárdenas Alonso, Gema, and Ana Nieto Masot. 2022. "Mapping the Optimal Rural Areas to Invest in through the LEADER Approach: Case Study—Extremadura (SW Spain)" Land 11, no. 8: 1191. https://0-doi-org.brum.beds.ac.uk/10.3390/land11081191
Note that from the first issue of 2016, this journal uses article numbers instead of page numbers. See further details here.