Article

Estimating the Effect of Tidal Marsh Restoration on Housing Prices: A Hedonic Analysis in the Nisqually National Wildlife Refuge, Washington, USA

1
Economist, Formerly U.S. Geological Survey, Science and Decisions Center, Reston, VA 20192, USA
2
Economist, U.S. Geological Survey, Science and Decisions Center, Reston, VA 20192, USA
*
Author to whom correspondence should be addressed.
Submission received: 1 July 2022 / Revised: 29 July 2022 / Accepted: 1 August 2022 / Published: 30 August 2022
(This article belongs to the Special Issue Protection, Management and Restoration of Coastal Ecosystems)

Abstract

:
This study employs the hedonic pricing method and a rich spatial and temporal dataset from two counties in Washington, USA to determine the effect of the 2009 Nisqually Restoration project (NRP) on housing prices in adjacent communities. The NRP restored 308 hectares of wetlands via dike removal in the Billy Frank Jr. Nisqually National Wildlife Refuge (NNWR), leading to improvements in salmon and bird abundance and recreational opportunities. We find that the ecological improvements made by the NRP increased the value of homes within 0.5 mile of the refuge by $37,631; homes 0.5 to 1 mile by $10,489; and homes 1 to 1.5 miles by $31,186. Our findings are consistent with previous wetland hedonic price analyses and may be useful inputs in natural resource management and policy decision-making.

1. Introduction

The United States Fish & Wildlife Service (US FWS) manages 95 million acres of land in 567 National Wildlife Refuges (NWRs) and 38 wetland management districts across the continental United States [1]. With substantial increases in refuge visitation [2], growing pressure of urban development and looming climate change, the US FWS’s NWR System’s mission to conserve, manage, and restore fish, wildlife and plant resources and their habitats for the benefit of U.S. citizens has become increasingly challenging to attain. As one of the most popular NWRs in Washington, USA, the Billy Frank Junior Nisqually National Wildlife Refuge (NNWR), attracts nearly 300,000 visitors annually by providing opportunities for wildlife watching, environmental education, photography, and hiking. Located along the southern end of the Puget Sound, the refuge’s unique tidal marsh habitat offers a nursery habitat for juvenile salmon and migratory birds and is a valuable buffer against storm surges and sea level rise. The Nisqually River Delta is also rich in Native American history, making the NNWR a significant source of spiritual and tribal heritage.
The Nisqually Indian Tribe (Tribe) has lived-in present-day Olympia, Tenino and Dupont, Washington for thousands of years. Due largely to the loss of wetlands in the 1990s, the Tribe and surrounding communities risked losing their accumulated stock of cultural and environmental capital tied to salmon populations. Salmon populations in Puget Sound plummeted in the 1990s [3,4], and Chinook salmon were deemed threatened under the Endangered Species Act (1973). To combat this loss, the Tribe created a host of natural resource programs including the Nisqually Restoration project (NRP) which began in 2009 with the removal of the Brown Farm Dike (Figure 1) and inundated 308 ha of the Billy Frank Jr. Nisqually National Wildlife Refuge (NNWR) [5]. In conjunction with the restoration of tribal lands by the Tribe in 1996, the Brown Farm Dike removal constitutes the single largest estuary restoration project in the Pacific Northwest [5].
The dike removal was intended to enhance wetland functions by altering the refuge’s landscape, topology, soil characteristics, and soil moisture. While only a portion of the total impacted area has seen a revitalization of natural vegetation, restoration has increased major channel area by 42 percent delta-wide and 580 percent in restored areas from 2005 to 2011 [6]. Additionally, important factors in salmon bioenergetics, i.e., salinity and water temperature, have improved among restored and non-restored sites. We extend the analyses of ecological benefits of the restoration project using a hedonic pricing model to determine if the ecological improvements were capitalized in the value of nearby homes.
Coastal wetlands, like the Nisqually River Delta, are valuable buffers against storm surges and support rich biodiversity. The global economic value of wetlands has been estimated to exceed $3.4 billion [7] but has fallen in recent years as wetlands continue to be destroyed across the globe [8]. Wetland restoration projects have been undertaken to restore principal habitats [9]; however, wetlands remain vulnerable to sea level rise. Supporting adaptation to changing conditions, protecting, and enhancing these valuable ecosystems has been a major impetus for the construction of man-made wetlands and for restoring degraded wetlands [10].
Restoration and conservation projects lead to greater ecosystem functionality, which directly impacts the value of ecosystem services and the total economic value of restored sites. Although restored wetlands provide less supporting and regulating ecosystem services when compared to natural wetlands, restored wetlands provide 36% more provisioning, regulating, and supporting ecosystem services than degraded wetlands [11]. Because maximizing net benefits is typically not the main concern of restoration, pre- and post-restoration costs and benefits are not always estimated, leaving the impact of restoration on total economic value unknown. Additionally, methods for estimating total economic value (e.g., cost-benefit analysis) can be expensive and may not be economical to perform.
Wetlands are one of the most widely studied ecosystems in the ecosystem services (ES) literature [12,13] due to their extremely productive ecological functions (e.g., primary productivity, nutrient cycling, floodwater storage) that support biodiversity and other indispensable ecosystem services. Several methods have been employed to value wetland ecosystems services, including contingent valuation surveys [14], choice experiments [15], production function [16], travel-cost [17], hedonic price [18], and replacement cost [19]. Specifically, the hedonic pricing method is a valuation technique commonly used to estimate the value of environmental goods and services [20,21,22]. Previous research has demonstrated the influence of wetlands on residential property values [23]. Some studies show properties are more valuable, all else equal, the closer they are to wetlands [18,24,25,26,27] while others find that wetland size and proximity are negatively related to sales price [28,29].
The complex intermingling of ecological systems, socio-economic factors, and management decisions further influence the quantity and quality of ecosystem services individual wetland ecosystems provide. Therefore, ecological and economic outcomes of wetland restoration projects can best be understood when individually assessed while taking local factors into account. We add to the wetland valuation and restoration literature by employing the hedonic pricing method to estimate the effects of the NRP on the change in the marginal implicit price (MIP) to live near the NNWR pre-restoration (2005–2008) and post-restoration (2009–2015). This is the first hedonic price study that we are aware of to estimate the impact of a large-scale wetland restoration project in the Pacific Northwest on housing prices.

2. Materials and Methods
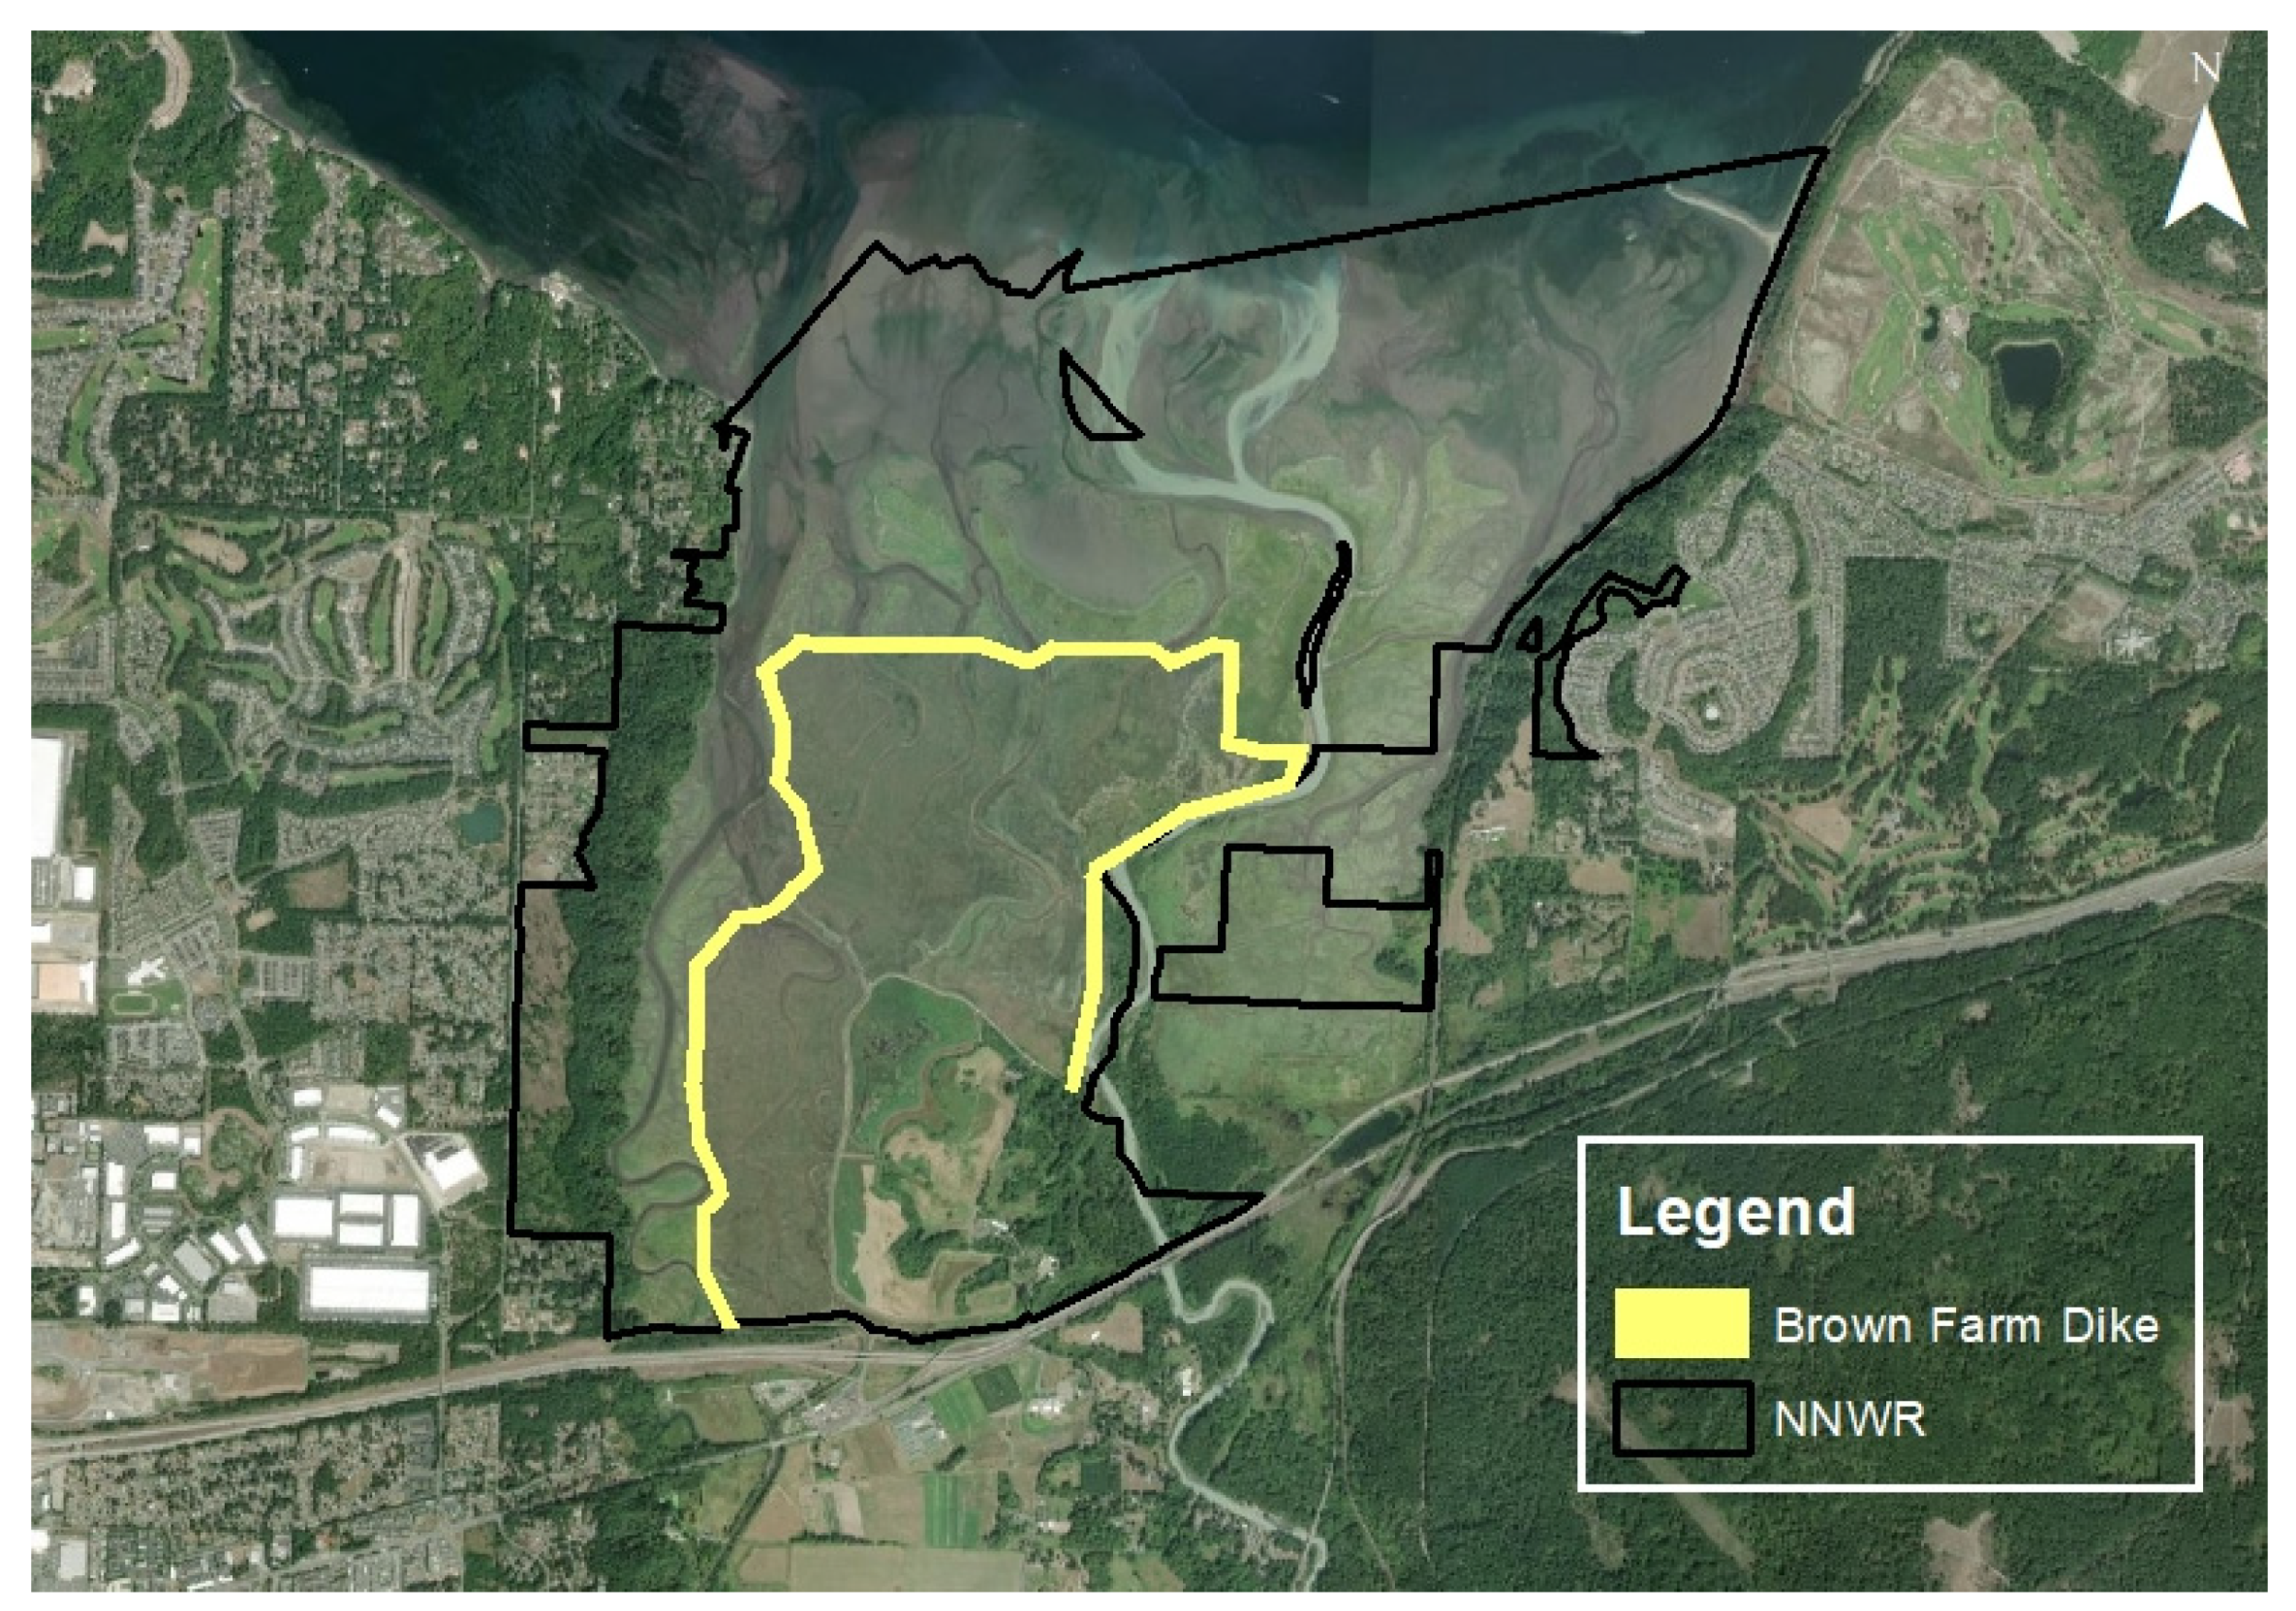
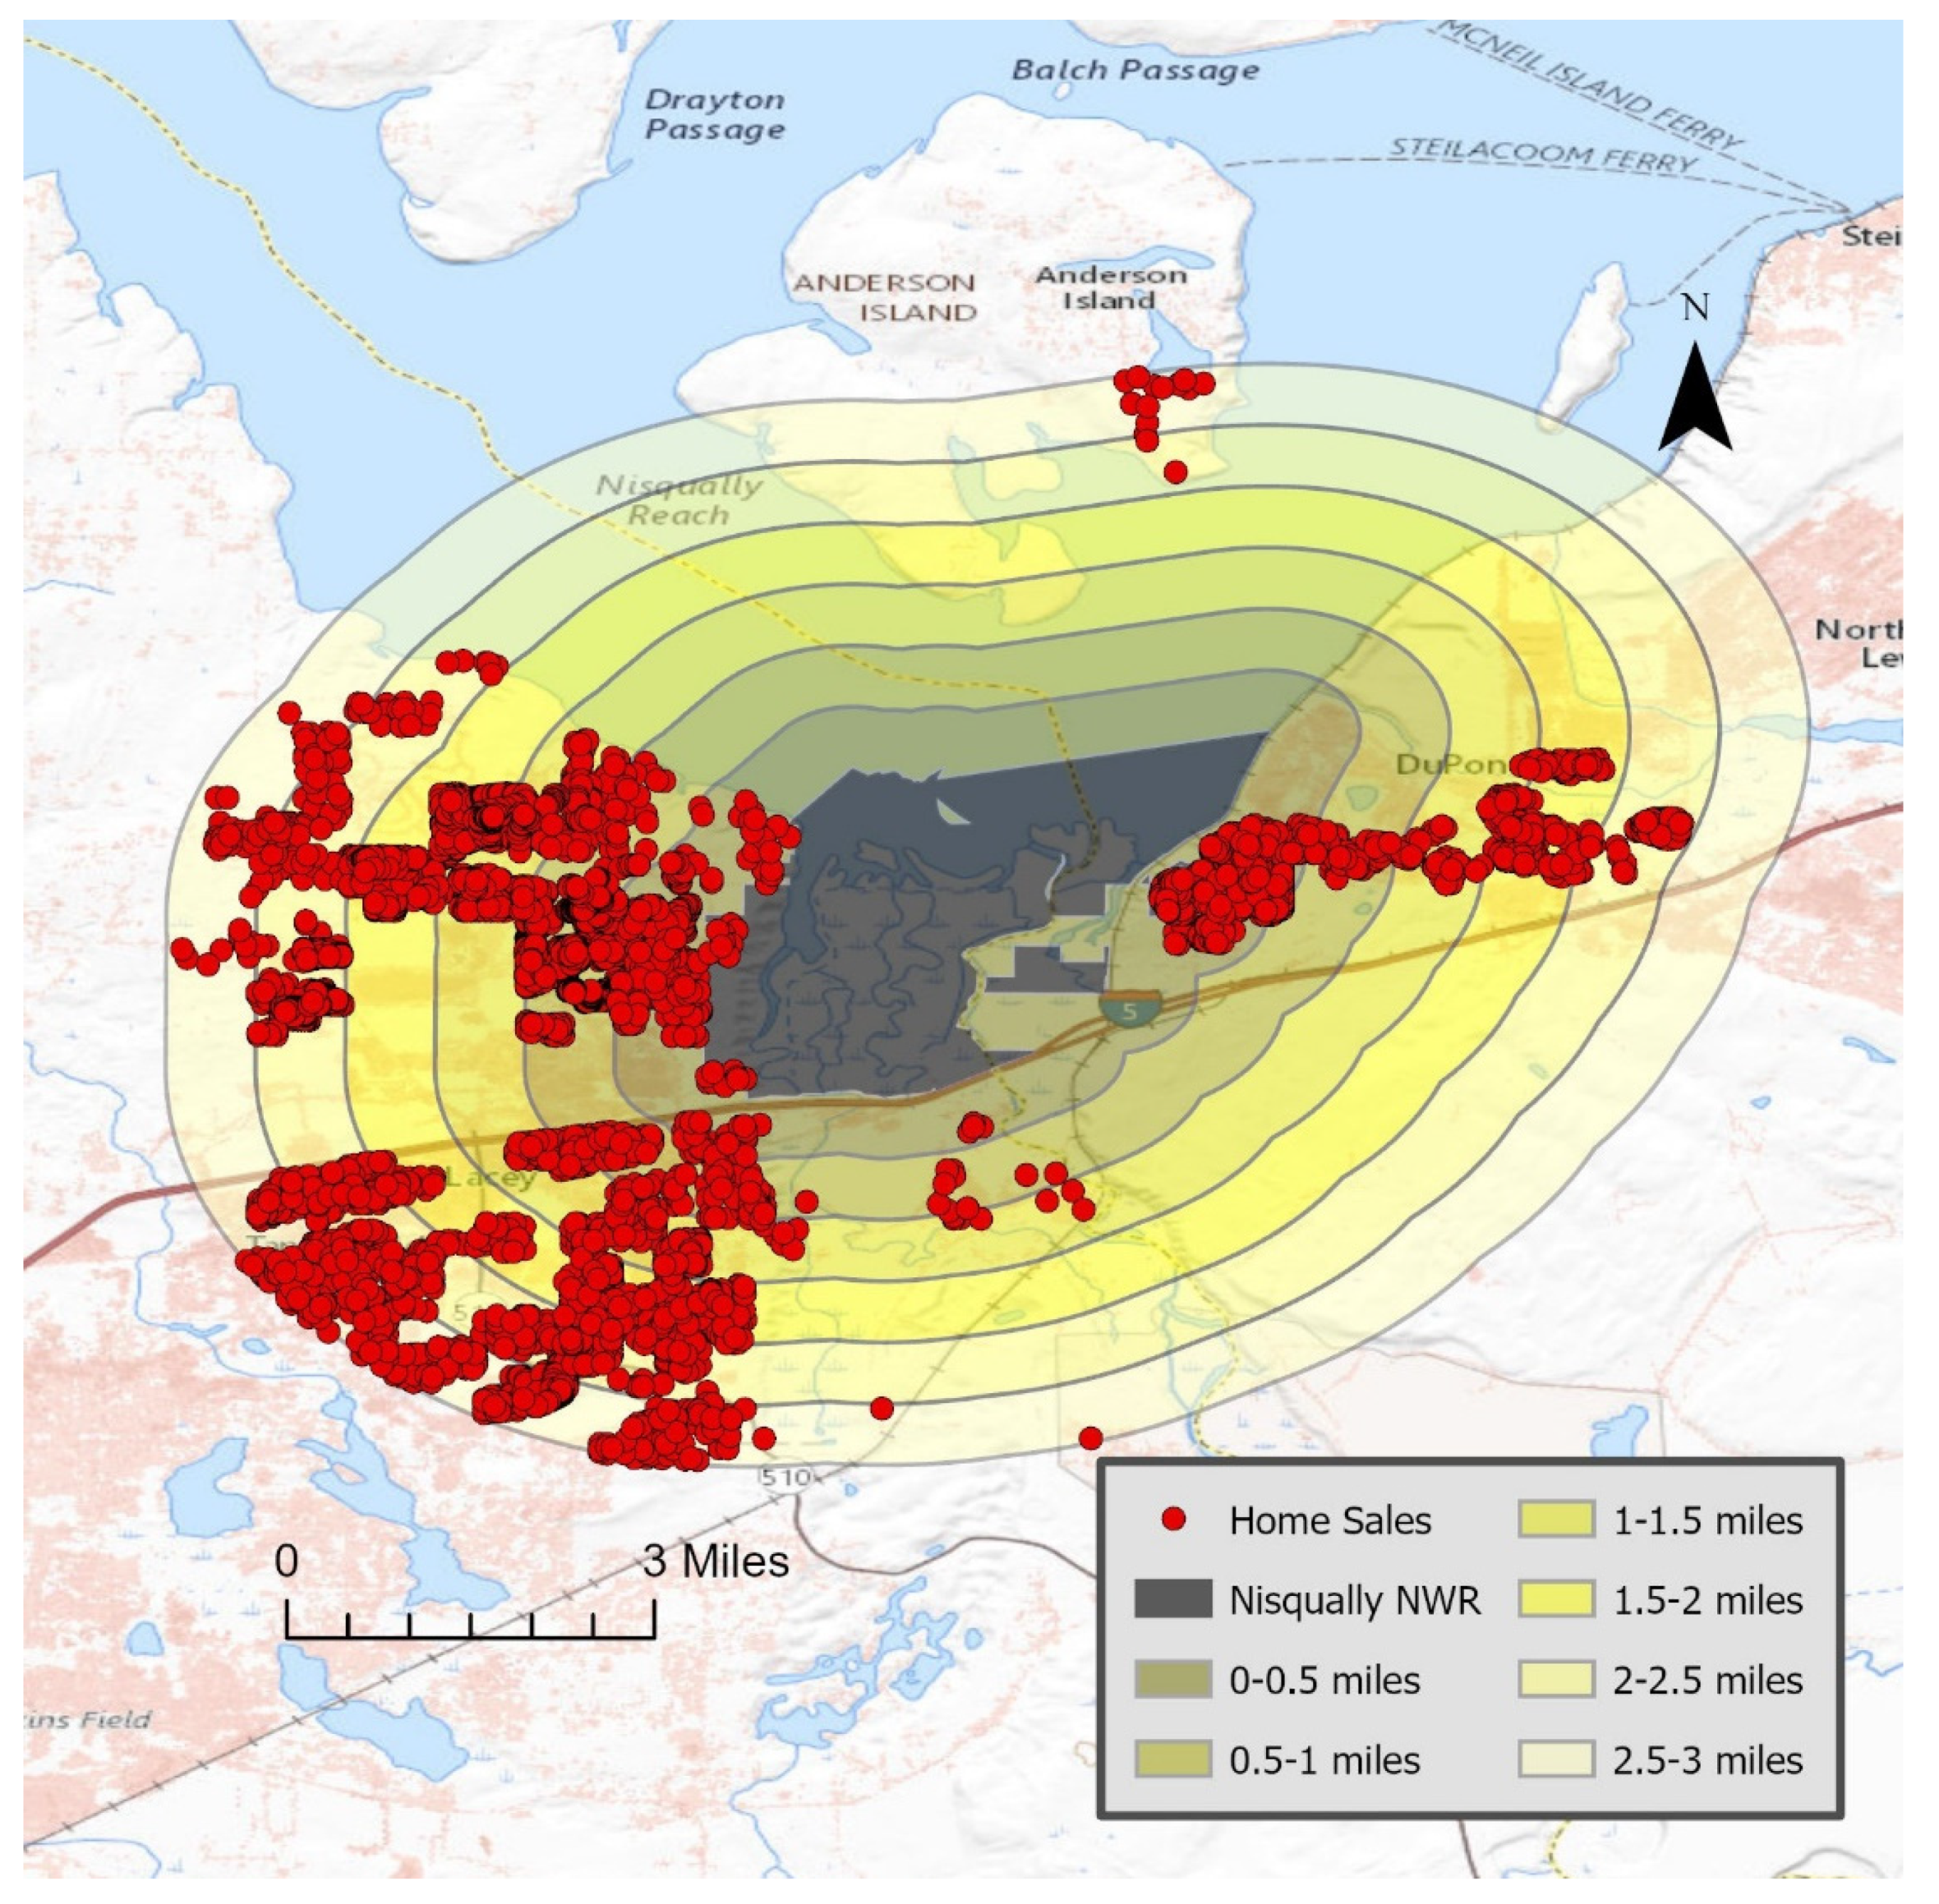
2.1. Study Area

This hedonic analysis includes property sales from Pierce and Thurston Counties, Washington, USA—counties that are adjacent to NNWR. Thurston County has a total area of 2000 square kilometers (km) and is home to 252,264 residents with an average income of $33,901 (2018 U.S. dollars, USD) per capita [30]. Olympia (the capital of Washington) is the largest of the six major cities in Thurston County. Pierce County has a total area of 4680 square km and has a population of 795,225 with an average income of $32,874 (2018 USD) per capita [31]. The largest city in Pierce County is Tacoma, which sits in the Seattle Metropolitan area and is home to Mt. Rainer, the highest point in the state of Washington.

2.2. Data

We compiled property sales data from Pierce and Thurston counties from 2005 to 2015. Following Taylor et al. [18], we restricted our dataset to a 3-mile radius from the border of NNWR and created 6 categorical variables for each 0.5-mile segment (Figure 2).
The dataset includes 6528 property sales, 5387 of which occur in Thurston County and 1141 of which occur in Pierce County. Each sale is comprised of a property’s structural characteristics, neighborhood characteristics, and nearby environmental amenities. Table 1 summarizes the variables considered in this hedonic analysis. Sales data for Pierce County were accessed and downloaded from the Pierce County Open Data Portal (Available online: https://gisdata-piercecowa.opendata.arcgis.com (accessed on 5 January 2021)) [32], and sales data for Thurston County were provided by the Thurston County Assessor’s Office [33]. Each sale has a unique identifier and parcel ID. Each parcel ID corresponds to a specific tax parcel number, which we used in conjunction with tax parcel GIS files to geocode each sale. Geocoding each sale is necessary to examine the spatial effects of surrounding environmental and neighborhood characteristics.
We included all single-family dwellings in the analysis; all other building types (such as commercial, townhomes, apartments) were removed. Additionally, sales without property structural information or valid parcel numbers were removed from the dataset. The centroid of each valid property was calculated, and Thurston and Pierce County shapefiles of waterbodies, parks, and roads were merged to determine near distances. Near distances were calculated using ArcGIS’s Generate Near Table (Analysis) tool with the GEODESIC method to ensure all distance estimates are spatially and geodetically accurate [34].
The average home in our dataset sits on 0.21 acres of land, is 2,019 square feet, has three bedrooms and two bathrooms, and an average sale price of $342,443; Table 2 provides summary statistics for all the property amenities (Property values were indexed to 2018 USD using the U.S. Census Bureau of Labor Statistic’s CPI Inflation Calculator. This tool is available at: https://www.bls.gov/data/inflation_calculator.htm, accessed on 5 January 2021). Homes within 0.5 mile of the refuge have the highest sales price on average, compared to homes within each of the other five 0.5-mile segments. From 2005 through 2015, the greatest number of sales occurred within 1.5 and 2 miles of the refuge (1431), followed by 0 to 0.5 miles (1313) and 0.5 to 1 mile (1008).
Model
Rosen [35] first built a theoretical hedonic pricing model based on Lancaster’s [36] consumer theory that the utility gained from consuming a good can be derived by the attributes of the good itself. In Rosen’s model, the price of a differentiated good (e.g., house) can be described by a vector of its characteristics (e.g., structural characteristics, neighborhood attributes, and environmental amenities). Using Rosen’s approach, we employ a semilogarithmic hedonic pricing model with an interactive term to estimate the hedonic price function to value marginal changes in structural characteristics, neighborhood characteristics, and environmental amenities.
Our hedonic pricing model (Equation (1)) assumes that the price p i t of property i at time t is a function of the structural attributes of the property, characteristics of the neighborhood in which the property is located, and environmental amenities near the property.
ln p i t = β 0 + j = 1 j β j S i j t   + k = 1 k β k E i k t + n = 1 n β i N i n t + δ 1 D 0 _ 0.5 i + δ 2 D 0 _ 0.5 i D i t + δ 3 D 0.5 _ 1 i + δ 4 D 0.5 _ 1 i D i t + δ 5 D 1 _ 1.5 i + δ 6 D 1 _ 1.5 i D i t + δ 7 D 1.5 _ 2 i + δ 8 D 1.5 _ 2 i D i t + δ 9 D 2 _ 2.5 i + δ 10 D 2 _ 2.5 i D i t + l = 1 10 β l t i m e i l t + ε i t
where β 0 is the intercept, S i j t is the jth structural attribute of property i at time t, E i k t is the kth environmental amenity near property i at time t, N i n t is the nth neighborhood characteristic of property i at time t, D 0 _ 0.5 i is equal to 1 if a property is located within 0 to 0.5 miles from the NNWR and 0 otherwise. Each of the other four categorical variables have similar interpretations and are described in Table 2. D i t (Dike09) is a dummy variable equal to one for years after dike removal (post 2009) and zero for years prior to dike removal (pre 2009). When D i t = 0 , the term ( D 0 _ 0.5 ) is equal to the MIP to live within 0.5 mile from the refuge pre-restoration, and when D i t = 1 , the interactive term ( D 0 _ 0.5 D i t ) is equal to the change in MIP to live within 0.5 mile from the refuge post-restoration. Finally, t i m e i l t are time fixed effects indicating the year in which a property was sold and ε i t is the random error term. We include time fixed effects to account for otherwise unobserved effects of the 2007–2008 financial crisis.
We estimate MIP at the mean for a subset of structural attributes, neighborhood characteristics, and environmental amenities and use MIP to proxy MWTP. For example, the MIP to live within 0.5 mile of the NNWR pre-restoration is:
p i t D 0 _ 0.5 i = δ 1   p i t
where p i t is mean sale price of homes sold within 0.5 mile of the refuge. The MIP to live within 0.5 mile of the NNWR post-restoration is:
p i t D 0 _ 0.5 i = δ 1 + δ 2   p i t

3. Results

Our empirical model includes all variables listed in Table 3 with time-fixed effects. The model explains 83 percent of the variance in price around its mean (Adjusted R2 = 0.8296). The time fixed effects demonstrate that years during the housing market boom had a positive impact on sale prices while subsequent years had a negative impact. As expected, Acres and Square feet are statistically significant and exhibit diminishing marginal value. Homes tend to lose value with age and number of stories, implying homebuyers prefer newer ranch style houses in the study area. Homebuyers are willing to pay a positive sum for additional bathrooms; however, they are not willing to pay more for additional bedrooms.
Homes in Pierce County have lower values in our dataset while homes closer to Seattle exhibit a price premium. The negative coefficient on Parks suggest that individuals prefer to live near parks, public preserves, natural areas, and public trails. Additionally, homes tend to be valued higher the closer they are to bodies of water (lakes, streams, and rivers).
Our results indicate that the change in home values following the NRP were positive for all homes within 2.5 miles of the NNWR. Homes within 0.5 mile of the refuge experienced the largest price increase. Homes within 1 to 2.5 miles of the refuge also experienced a dramatic change in price following the NRP, but results are statistically insignificant. We derived MIP for a specific property characteristic by multiplying the coefficient of a variable in the log-linear hedonic price regression by the average sales price of properties in the dataset (Table 4).
Properties in this dataset are, on average, 1.42 miles from the Refuge, and the average sales price of properties is $335,443. Thurston and Pierce counties homebuyers are willing to pay $6.34 to live one foot closer to streams, rivers, or lakes and $4.70 to live one foot closer to Seattle. Our results indicate that they are willing to pay nearly $92,000 for an additional acre of land.
Based on our analysis, Thurston and Pierce counties residents reveal a preference for the NRP through an increase in home prices. Following the completion of the NRP, homes within 0.5 mile of the refuge experienced an increase in value of $37,631. Similarly, the value of homes within 0.5 to 1 mile of the refuge increased in price by $10,489, and the value of homes within 1 mile to 1.5 miles increased in price by $31,186. Housing prices increased within 1.5 to 2 miles and 2 miles to 2.5 miles from the refuge, but results are statistically insignificant.

4. Discussion

Our results suggest that the NRP improved the value of homes near the NNWR, and to the extent that we have controlled for property attributes, neighborhood characteristics, and environmental amenities during this time period, we argue that home prices increased due to ecological improvements made by the NRP. The NRP has led to fewer non-native invasive species, greater abundance of migratory birds, and improved salmon prey resources [37]. The reduction in non-native plants plays an important role in improving the restored wetland’s ecological productivity, thereby contributing to the improvement in wildlife abundance. Improved salmon prey resources directly contribute to improving the population of Chinook, coho, and pink salmon in the Nisqually River Delta. Salmon are economically and culturally valuable to residents in Thurston and Pierce counties. Greater abundances of salmon may lead to more recreational fishing, commercial fishing, and enhance cultural associations.
Not only did the NRP improve wetland ecosystem health, but it also resulted in the construction of the $2.8 million Nisqually Estuary Boardwalk trail [38]. The trail includes a 1-mile-long boardwalk that offers views of the restoring tidal marsh and ample opportunities to birdwatch. The boardwalk trail may have influenced the price of homes post-restoration, contributing to the positive change in home values. Another recreational improvement came in 2010 when NNWR management permitted waterfowl hunting in designated areas in fall and winter hunting seasons for the first time in the history of the refuge [39]. Waterfowl hunting provides an additional recreational opportunity for refuge visitors but also comes at a cost. For example, in 2010 a section of the boardwalk trail was closed to visitors during the hunting season to ensure the safety of NNWR patrons.
While our results suggest that the NRP improved the supply of ecosystem benefits in the refuge, as shown by the positive change in home prices post-restoration, it is important to note that homes closer to the refuge were sold at a price discount prior to the NRP. Price discounts for homes near wetlands is common in the broader wetland valuation literature which suggests homebuyers prefer small, open spaced wetlands to large, forested wetlands [28,29]. Furthermore, researchers have identified national wildlife refuges in the Pacific Northwest that have a negative impact on nearby housing prices, but results are inconclusive [18]. Studies that employ the hedonic pricing method to determine the benefits of wetland restoration are less common [40,41] and the idiosyncrasies of each project makes comparisons of results impractical. We add to the literature by assessing the change in MIP related to the NRP after controlling for a myriad of factors in the hedonic pricing regression.
Properties located in floodplains, all else equal, tend to be less valuable than properties outside of floodplains [42,43,44]. Homes in the lower Nisqually River Delta experience extreme flooding events [45], but homes located in the Nisqually River Watershed near the NNWR are protected from severe flooding by water flow restrictions at the LaGrande Dam. Flood risks are unlikely to play a large role in the negative pre-restoration MIPs to live near the refuge, but they may play a role in the average differences between post-restoration MIPs. For example, the value of homes within 1 to 1.5 miles experienced a price premium after the completion of the NRP. The difference in price compared to homes within 1 mile of the refuge may be due to the proximity of the properties to the Nisqually River floodplain. While properties near the NNWR have lower flood risks compared to other properties in the Nisqually River Watershed outside of our study area, they also have limited access to water resources. Nearly 125 beach access points are located in Pierce and Thurston Counties, two of which are stationed on the northwest and southern sides of the refuge. It is plausible that better water access outside of the NNWR is an important factor contributing to the comparatively low WTP to live near the refuge.
Aesthetic value, especially for homes with a view of a wetland or other natural area, can have a strong influence on property value. It is unclear if the 120-ha increase in wetland area improved the aesthetic value of the NNWR following dike removal [46]. We conducted a visual inspection using Google Earth to consider how significant the aesthetics is likely to be for property values and found that no more than 100 properties in our dataset have views of NNWR water. In most cases, views of wetlands are obstructed by large trees, which are considerably less valuable compared to open water views [47].
The housing boom in 2006 accompanied a substantial movement from rural and small-town Washington to the Seattle metropolitan area, likely lowering the value of many properties in our dataset. The financial collapse in 2007 and 2008 could have receded the migration to Seattle, which may influence the observed positive change in MIP. While we control for time fixed effects and the proximity to Seattle, there may be changes unaccounted for in the housing market that shift housing demand and cause estimates of MIP to be smaller in recessionary periods and larger in expansionary periods. For this reason, we interpret the change in the MIP to live near the NNWR as a lower bound for a change in the MWTP to live near the NNWR. Additionally, these estimations do not prove causation but do demonstrate a very strong and statistically significant positive relationship between the restoration project and home values in Thurston and Pierce Counties.

5. Conclusions

Wetlands provide food, water, water filtration, timber, cultural resources, and many other services. Unfortunately, these valuable ecosystem services have not been protected; over half of the global area of wetlands has been lost in recent decades from human activity and natural processes [13]. To further exacerbate the loss of coastal habitats, climate change is expected to increase flood risks and reduce global biodiversity [48,49]. Wetland restoration can provide a powerful tool for enhancing wetland productivity and mitigating climate change. The Nisqually Delta restoration project, the largest tidal marsh restoration project in the Pacific Northwest, has undergone extensive post-restoration monitoring by the U.S. Geological Survey, US FWS, and Nisqually Indian Tribe [5,6,45]. From 1980 to 2015, the NNWR experienced a 54% net increase in emergent marsh, resulting in an increase of 120 ha of total wetland area. The revitalized tidal marsh has improved salmon and migratory bird populations [6] and the refuge has experienced increases in recreational visitation following the Brown Farm Dike removal in 2009.
In this study, we estimate the benefits of the NRP by evaluating pre- and post-restoration housing prices in Thurston and Pierce counties, Washington, using the hedonic pricing method. Our results suggests that homeowners within 1.5 miles of the NNWR capitalized on the improvement in ecosystem services created by the NRP. However, this analysis does not capture all the ecosystem services benefits of wetlands; for example, cultural associations may have benefited from ecological improvements made by the NRP and may not be reflected in property values. The results of this analysis provide evidence that the NRP reflects positively on property values in surrounding communities.
This hedonic price analysis may inform refuge management, policymakers, and other stakeholders considering the costs and benefits of large-scale wetland restoration projects in the Pacific Northwest. However, because of the heterogeneity in ownership structures, ecosystem types, and causes of degradation, the benefits of restoration cannot be easily transferred from one restored site to another, and more research would help to determine the best methods for restoring degraded habitats and assessing the economic implications of restoration [11].

Author Contributions

Conceptualization, A.G.; methodology, A.G.; validation, A.G.; formal analysis, A.G.; investigation, A.G.; data curation, A.G.; writing—original draft preparation, A.G.; writing—review and editing, E.P.; visualization, A.G.; supervision, E.P. All authors have read and agreed to the published version of the manuscript.

Funding

This research was funded by the U.S. Geological Survey Northwest Climate Adaptation Science Center.

Institutional Review Board Statement

Not applicable.

Informed Consent Statement

Not applicable.

Data Availability Statement

Not applicable.

Acknowledgments

The work by Anthony Good was done while serving as an economist with the U.S. Geological Survey. We would like to thank Erin Carver (US FWS), Peter Grigelis (US FWS), and Glynnis Nakai (US FWS) for their helpful reviews. Any use of trade, firm, or product names is for descriptive purposes only and does not imply endorsement by the U.S. Government.

Conflicts of Interest

The authors declare no conflict of interest.

References

  1. U.S. Fish and Wildlife Service (US FWS). Public Lands and Waters: 2021. Available online: https://www.fws.gov/refuges/about/public-lands-waters/ (accessed on 5 January 2021).
  2. Carver, E.; Caudill, J. Banking on Nature: The Economic Benefits to Local Communities of National Wildlife Refuge Visitation; U.S. Fish and Wildlife Service: Falls Church, VA, USA, 2013. Available online: https://www.fws.gov/refuges/about/refugereports/pdfs/BankingOnNature2013.pdf (accessed on 5 January 2021).
  3. Lane, R.; Taylor, W. National Water Summary—Wetland Resources; United States Geological Survey: Washington, DC, USA, 1996. [Google Scholar]
  4. White, J. The Loss of Habitat in Puget Sound; People for Puget Sound: Seattle, WA, USA, 1997. [Google Scholar]
  5. Woo, I.; Turner, K.; Takekawa, J.Y. Monitoring and Evaluation of the Nisqually Delta Restoration Project; Project progress report to Nisqually National Wildlife Refuge, Olympia, WA, USA; Geological Survey, San Francisco Bay Estuary Field Station: Vallejo, CA, USA, 2011; Available online: http://www.tidalmarshmonitoring.net/pdf/Woo%20et%20al%202011MonitoringEvaluationNisquallyDeltaRestorationProject.pdf (accessed on 5 January 2021).
  6. Ellings, C.; Davis, M.; Grossman, E.; Woo, I.; Hodgson, S.; Turner, K.; Nakai, G.; Takekawa, J.E.; Takekawa, J.Y. Changes in habitat availability for outmigrating juvenile salmon (Oncorhynchus spp.) following estuary restoration. Restor. Ecol. 2016, 24, 415–427. [Google Scholar] [CrossRef]
  7. Schuyt, K.; Brander, L. The economic values of the world’s wetlands. Living Waters-Conserv. Source Life 2004. Available online: https://www.researchgate.net/publication/288267725_The_economic_values_of_the_world’s_wetlands (accessed on 29 June 2022).
  8. Costanza, R.; De Groot, R.; Sutton, P.; Van der Ploeg, S.; Anderson, S.; Kubiszewski, I.; Farber, S.; Kerry Turner, R. Changes in the global value of ecosystem services. Glob. Environ. Chang. 2014, 26, 152–158. [Google Scholar] [CrossRef]
  9. Erwin, K. Wetlands and global climate change: The role of wetland restoration in a changing world. Wetl. Ecol. Manag. 2009, 17, 71–84. [Google Scholar] [CrossRef]
  10. Krauss, K.W.; Cormier, N.; Osland, M.J.; Kirwan, M.L.; Stagg, C.; Nestlerode, J.A.; Russell, M.J.; From, A.S.; Spivak, A.; Dantin, D.; et al. Created mangrove wetlands store belowground carbon and surface elevation change enables them to adjust to sea-level rise. Sci. Rep. 2017, 7, 1030. [Google Scholar] [CrossRef]
  11. Meli, P.; Rey Benayas, J.; Balvanera, P.; Martínez, R. Restoration Enhances Wetland Biodiversity and Ecosystem Service Supply, but Results Are Context-Dependent: A Meta-Analysis. PLoS ONE 2014, 9, e93507. [Google Scholar] [CrossRef]
  12. Mitsch, W.; Blanca, B.; Hernandez, M. Ecosystem services of wetlands. Int. J. Biodivers. Sci. Ecosyst. Serv. Manag. 2015, 11, 1–4. [Google Scholar] [CrossRef]
  13. Zedler, J.; Kercher, S. Wetland resources: Status, trends, ecosystem services, and restorability. Annu. Rev. Environ. Resour. 2005, 30, 39–74. [Google Scholar] [CrossRef]
  14. Brouwer, R.; Langford, I.; Bateman, I.; Turner, K. A meta-analysis of wetland contingent valuation studies. Reg. Environ. Chang. 1999, 1, 47–57. [Google Scholar] [CrossRef]
  15. Carlsson, F.; Frykblom, P.; Liljenstolpe, C. Valuing Wetland Attributes: An Application of Choice Experiments. Ecol. Econ. 2003, 47, 95–103. [Google Scholar] [CrossRef]
  16. Bell, F. The economic valuation of saltwater marsh supporting marine recreational fishing in the southeastern United States. Ecol. Econ. 1997, 21, 243–254. [Google Scholar] [CrossRef]
  17. Lamsal, P.; Atreya, K.; Pant, K.; Kumar, L. Tourism and wetland conservation: Application of travel cost and willingness to pay an entry fee at Ghodaghodi Lake Complex, Nepal. Nat. Resour. Forum 2016, 40, 51–61. [Google Scholar] [CrossRef]
  18. Taylor, L.; Liu, X.; Hamilton, T. Amenity Values of Proximity to National Wildlife Refuges; Report to US Fish and Wildlife Service and the Department of Interior, Office of Policy Analysis; PPA: Annapolis, MA, USA, 2012; pp. 1–82. Available online: https://www.doi.gov/sites/doi.gov/files/uploads/NWRSAmenityReportApril2012withCovers8.pdf (accessed on 29 June 2022).
  19. Gupta, T.; Foster, J. Economic Criteria for Freshwater Wetland Policy in Massachusetts. Am. J. Agric. Econ. 1975, 57, 40–45. [Google Scholar] [CrossRef]
  20. Chay, K.; Greenstone, M. Does Air Quality Matter? Evidence from the Housing Market. J. Political Econ. 2005, 113, 376–424. [Google Scholar] [CrossRef]
  21. Lewis, L.; Bohen, C.; Wilson, S. Dams, Dam Removal, and River Restoration: A Hedonic Property Value Analysis. Contemp. Econ. Policy 2008, 26, 175–186. [Google Scholar] [CrossRef]
  22. Walsh, P.; Milon, J.; Scrogin, D. The Spatial Extent of Water Quality Benefits in Urban Housing Markets. Land Econ. 2011, 87, 628–644. [Google Scholar] [CrossRef]
  23. Boyer, T.; Polasky, S. Valuing urban wetlands: A review of non-market valuation studies. Wetlands 2004, 24, 744–755. [Google Scholar] [CrossRef]
  24. Frey, F.; Palin, M.; Walsh, P.; Whitcraft, C. Spatial Hedonic Valuation of a Multi-use Urban Wetland in Southern California. Agric. Resour. Econ. Rev. 2013, 42, 387–402. [Google Scholar] [CrossRef]
  25. Lupi, F.; Graham-Tomasi, T.; Taff, S. A Hedonic Approach to Urban Wetland Valuation; Staff Papers 13284; University of Minnesota, Department of Applied Economics: Minneapolis, MN, USA, 1991. [Google Scholar]
  26. Mahan, B.; Polasky, S.; Adams, R. Valuing urban wetlands: A property price Approach. Land Econ. 2000, 76, 100–113. [Google Scholar] [CrossRef]
  27. Tapsuwan, S.; Ingram, G.; Burton, M.; Brennan, D. Capitalized amenity value of urban wetlands: A hedonic property price approach to urban wetlands in Perth, Western Australia. Aust. J. Agric. Resour. Econ. 2009, 53, 527–545. [Google Scholar] [CrossRef]
  28. Bin, O.; Polasky, S. Evidence on the Amenity Value of Wetlands in a Rural Setting. J. Agric. Appl. Econ. 2005, 37, 589–602. [Google Scholar] [CrossRef]
  29. Cho, S.-H.; Lambert, D.; Kim, G.; Park, W.; Roberts, R. Identifying the range of distance over which open space affects housing values. In Southern Agricultural Economics Association, Proceedings of the 2010 Annual Meeting, Orlando, FL, USA, 6–9 February 2010; Cambridge University: Cambridge, UK, 2010. [Google Scholar]
  30. U.S. Census Bureau. QuickFacts: Thurston County, Washington. 2010. Available online: https://www.census.gov/quickfacts/fact/table/thurstoncountywashington,WA/PST045218 (accessed on 5 January 2022).
  31. U.S. Census Bureau. QuickFacts: Pierce County, Washington; 2010. Available online: https://www.census.gov/quickfacts/fact/table/piercecountywashington,piercecountygeorgia,thurstoncountywashington,WA/PST045218 (accessed on 5 January 2022).
  32. Pierce County, Washington. Pierce County Open Data Portal. 2019. Available online: https://gisdata-piercecowa.opendata.arcgis.com/ (accessed on 29 June 2022).
  33. Thurston County Assessor’s Office Records Request Center. Message to Anthony Good; Records Request Center: San Luis Obispo, CA, USA, 2019. [Google Scholar]
  34. Environmental Systems Research Institute (ESRI). ArcGIS Release 10.5.1; ESRI: Redlands, CA, USA, 2016. [Google Scholar]
  35. Rosen, S. Hedonic Prices and Implicit Markets: Product Differentiation in Pure Competition. J. Political Econ. 1974, 82, 34–55. [Google Scholar] [CrossRef]
  36. Lancaster, K. A New Approach to Consumer Theory. J. Political Econ. 1966, 74, 132–157. [Google Scholar] [CrossRef]
  37. Nisquallydeltarestoration Organization. About the Nisqually Delta Restoration Project. 2019. Available online: http://www.nisquallydeltarestoration.org/about.php (accessed on 5 January 2022).
  38. Elderkin, S. New Boardwalk at Nisqually. Washington Trail Association. Available online: https://www.wta.org/news/signpost/new-boardwalk-at-nisqually (accessed on 11 February 2011).
  39. U.S. Fish and Wildlife Service (US FWS). Nisqually National Wildlife Refuge: Waterfowl Hunting. 2014. Available online: https://www.fws.gov/uploadedFiles/Region_1/NWRS/Zone_2/Nisqually_Complex/Nisqually/Documents/Nisqually%20Hunt%20Brochure%202014.pdf (accessed on 5 January 2021).
  40. Kaza, N.; BenDor, T. The land value impacts of wetland restoration. J. Environ. Manag. 2013, 127, 289–299. [Google Scholar] [CrossRef] [PubMed]
  41. Mei, Y.; Sohngen, B.; Babb, T. Valuing urban wetland quality with hedonic price model. Ecol. Indic. 2018, 84, 535–545. [Google Scholar] [CrossRef]
  42. Donnelly, W. Hedonic Price Analysis of the Effect of a Floodplain on Property Values. J. Am. Water Resour. Assoc. 1989, 25, 581–586. [Google Scholar] [CrossRef]
  43. Netusil, N.; Moeltner, K.; Maya, J. Floodplain designation and property sale prices in an urban watershed. Land Use Policy 2019, 88, 104112. [Google Scholar] [CrossRef]
  44. Zhang, L.; Leonard, T. Flood Hazards Impact on Neighborhood House Prices. J. Real Estate Financ. Econ. 2018, 58, 656–674. [Google Scholar] [CrossRef]
  45. Rosane, E.; Tacoma Power Officials Say Dams Likely Prevented More Severe Nisqually Flooding. Nisqually Valley News. Available online: http://www.yelmonline.com/news/article_a0ef9524-58f8-11ea-85d1-cbc4d683b6bc.html (accessed on 26 February 2020).
  46. Ballanti, L.; Byrd, K.; Woo, I.; Ellings, C. Remote Sensing for Wetland Mapping and Historical Change Detection at the Nisqually River Delta. Sustainability 2017, 9, 1919. [Google Scholar] [CrossRef]
  47. Doss, C.; Taff, S. The influence of wetland type and wetland proximity on residential property values. J. Agric. Resour. Econ. 1996, 21, 120–129. [Google Scholar] [CrossRef]
  48. Hirabayashi, Y.; Mahendran, R.; Koirala, S. Global flood risk under climate change. Nat. Clim. Chang. 2003, 3, 816–821. [Google Scholar] [CrossRef]
  49. Lovejoy, T.; Hannah, L. Climate Change and Biodiversity; Yale University Press: New Haven, CT, USA, 2005. [Google Scholar]
Figure 1. Spatial overview of the Brown Farm Dike and boundary of the Billy Frank Jr. Nisqually National Wildlife Refuge (NNWR).
Land 11 01432 g001
Figure 2. Study area in Pierce and Thurston Counties in Washington state in the United States. Includes 6528 property sales from 2005–2015 and the area of the Billy Frank Jr. Nisqually National Wildlife Refuge (NNWR).
Land 11 01432 g002
Table 1. Description of hedonic pricing model variables.
Variable (Label)UnitsDescriptionSource
Dependent Variable
Sale price
(Price)
2018 USDSale price of single-family homesPODP, TODP, Thurston County Assessor’s Office
Structural characteristics
Lot size
(Acres)
AcresSize of parcel in acresPODP, TODP
House size
(Square feet)
Square feetSize of house in square feetPODP, TODP
Number of bedrooms
(Bedrooms)
Number of bedroomsNumber of bedrooms in house on parcelPODP, TODP
Number of bathrooms (Bathrooms)Number of bathroomsNumber of bathrooms in house on parcelPODP, TODP
Number of stories
(Stories)
Number of StoriesNumber of stories in house on parcelPODP, TODP
Age
(Age)
YearsAge of housePODP, TODP
Neighborhood characteristics
County
(Thurston)
Dummy variable1 = Thurston County, 0 = Pierce CountyPODP, TODP
Distance to Seattle
(Seattle)
FeetDistance from centroid of parcel to Seattle, WA in feetPODP, TODP
Income
(Income)
2018 USDHousehold income in 2018 USDU.S. Census Bureau
Environmental Variables
Distance to water
(Water)
FeetDistance from centroid of parcel to nearest body of water in feetPODP, TODP
Distance to roads
(Roads)
FeetDistance from centroid of parcel to nearest major road in feetPODP, TODP
Distance to parks
(Parks)
FeetDistance from centroid of parcel to nearest park in feetPODP, TODP
D0_0.5Categorical variable 1 = house between [0, 0.5] miles of NNWR, 0 = otherwiseCreated for this project
D0.5_1Categorical variable1 = house between (0.5, 1] miles of NNWR, 0 = otherwiseCreated for this project
D1_1.5Categorical variable1 = house between (1, 1.5] miles of NNWR, 0 = otherwiseCreated for this project
D1.5_2Categorical variable1 = house between (1.5, 2] miles of NNWR, 0 = otherwiseCreated for this project
D2_2.5Categorical variable1 = house between (2, 2.5] miles of NNWR, 0 = otherwiseCreated for this project
Restoration project
(Dike09)
Dummy variable1 = post-restoration, 0 = pre-restorationCreated for this project
Notes: (1) PODP, Pierce County Open Data Portal; (2) TODP, Thurston County Open Data Portal; (3) NNWR, Billy Frank Jr. Nisqually National Wildlife Refuge; (4) Price is the sales price (2018 USD) of single-family dwellings sold between 2005 and 2015 in Thurston County and Pierce County, Washington, USA; (5) Distance to an environmental amenity is calculated by measuring the distance from the nearest body of water, park, trail, or road to the centroid of each property parcel sold; (6) Water includes all ponds, lakes, rivers and streams; (7) Parks includes all local, state, and federally owned parks; (8) Thurston is a dummy variable used to control for county level fixed effects; (9) Time-fixed effects are included in the analysis but are not listed in this table.
Table 2. Summary statistics for hedonic pricing model variables.
Variable (Label)MeanMinimumMaximumStd.Dev.
Dependent Variable
Price342,443.47 32,811.11 1,992,993.76 123,767.90
Structural characteristics
Acres0.21 0.05 9.96 0.31
Square feet2019.10 325.00 7145.00 643.67
Bedrooms3.18 0.007.00 0.82
Bathrooms2.040.004.500.61
Stories1.581.002.000.49
Age9.600.00106.0013.61
Neighborhood characteristics
Thurston0.830.001.000.38
Seattle31.82 25.77 35.04 1.87
Income69,399.81 61,697.43 73,489.28 3106.49
Environmental variables
Water0.910.001.920.49
Roads0.330.011.270.27
Parks0.500.011.550.39
Dike090.510.001.000.50
Notes: Std.Dev, Standard Deviation; distance in miles.
Table 3. Hedonic Pricing Model Regression Results.
VariableCoefficientStandard Errort-Value
Intercept13.550.3242.81
Structural characteristics
Acres0.28 ***0.01223.12
Acres2−0.03172 ***2.10 × 10³−15.08
Square feet6.34 × 104 ***1.52 × 10541.85
Square feet2−5.61 × 10⁸ ***3.11 × 10⁹−18.07
Bedrooms−0.038 ***2.99 × 10³−12.59
Bathrooms0.028 ***4.59 × 1036.21
Stories−0.17 ***5.18 × 10³−33.01
Age−5.52 × 10³ ***1.96 × 10⁴−28.16
Neighborhood characteristics
Thurston0.29 ***0.0309.47
Seattle−1.37 × 10⁵ ***4.02 × 10⁷−34.17
Income9.10 × 1065.05 × 1061.80
Environmental variables
Water−1.85 × 10⁵ ***1.18 × 10⁶−15.66
Roads1.36 × 105 ***2.17 × 1066.27
Parks−1.01 × 10⁵ ***1.10 × 10⁶−9.25
D0_0.5−0.18 ***0.011−16.04
D0.5_1−0.12 ***0.011−10.67
D1_1.5−0.08 ***0.012−7.16
D1.5_2−0.08 ***0.010−7.72
D2_2.5−0.04 ***0.011−3.36
D0_0.5 × Dike090.10 ***0.0137.97
D0.5_1 × Dike090.031 *0.0132.33
D1_1.5 × Dike090.089 ***0.0146.56
D1.5_2 × Dike090.0160.0131.30
D2_2.5 × Dike090.0150.0131.15
Time fixed-effects
YR20050.10 ***0.0293.48
YR20060.19 ***0.0385.12
YR20070.16 ***0.0423.85
YR20080.10 *0.0422.30
YR20095.07 × 10−30.0320.16
YR2010−0.0190.022−0.90
YR2011−0.086 ***0.015−5.72
YR2012−0.16 ***0.015−10.41
YR2013−0.097 ***0.016−5.99
YR2014−0.090 ***0.021−4.20
Notes: * p < 0.1, *** p < 0.01.
Table 4. Marginal Implicit Price (MIP) of Select Characteristics.
VariableLL CI (95%)MIP at the MeanUL CI (95%)
Acres82,788.9891,531.98100,286.53
Square Feet120.94139.54158.13
Water−7.13−6.34−5.54
Seattle−4.97−4.70−4.43
Parks−4.2−3.47−2.73
D0_0.5 × Dike0928,381.70 37,630.8546,907.56
D0.5_1 × Dike091649.61 10,488.8319,329.45
D1_1.5 × Dike0921,858.95 31,186.1040,512.00
Note: MIP in 2018 USD; CC, Confidence Interval; LL, lower limit; UL, upper limit; D0_0.5: 1 = house between [0, 0.5] miles of NNWR, 0 = otherwise; D0.5_1: 1 = house between [0.5,.1] miles of NNWR, 0 = otherwise; D1_1.5: 1 = house between [1,1.5] miles of NNWR, 0 = otherwise; Dike09: 1 = post-restoration, 0 = pre-restoration.
Publisher’s Note: MDPI stays neutral with regard to jurisdictional claims in published maps and institutional affiliations.

