

Wetland Restoration through Excavation: Sediment Removal Results in Dramatic Water Quality Improvement

Annis Water Resources Institute, Grand Valley State University, 740 W. Shoreline Dr., Muskegon, MI 49441, USA
*
Author to whom correspondence should be addressed.
Land 2022, 11(9), 1559; https://0-doi-org.brum.beds.ac.uk/10.3390/land11091559
Submission received: 1 August 2022
/
Revised: 2 September 2022
/
Accepted: 8 September 2022
/
Published: 14 September 2022
(This article belongs to the Special Issue Wetland Construction and Restoration: Design and Performance)
Abstract
:We evaluated whether sediment excavation improved water quality in a former (pre-European settlement) wetland complex that was a farm in the early 1900s and then later in the 1990s/early 2000s was allowed to naturally refill with water and became nutrient-rich ponds plagued by legacy phosphorus issues. Two ponds were recently restored via dewatering, excavation of the surface sediment, and hydrologic reconnection to an adjacent creek to re-establish a flow-through marsh. The removal of ~103,000 m3 of phosphorus-laden sediment and reconnection to the adjacent stream resulted in improved water quality, with a reduction in total phosphorus concentration from ~1000 μg/L to ~20 μg/L and a 40% reduction in specific conductivity in both former ponds. Soluble reactive phosphorus concentrations declined substantially in one pond, from ~720 μg/L to 3 μg/L, but not in another pond, which was partially dredged by the landowner prior to restoration. Additionally, phosphorus concentration in the downstream receiving water body also declined but to a much more modest degree. Sediment excavation was an effective restoration tool in this former agricultural system, but given the expense and potential impact on pre-existing biota, a full-system diagnosis, including cost, sediment characterization, and control of external nutrient loading, is recommended before its implementation elsewhere.
1. Introduction
The Great Lakes, like many large-scale ecosystems, are facing no shortage of stressors [1]. Among that list, two of the more common ones are eutrophication and habitat loss. These two stressors are commonly found as beneficial use impairments in designated Great Lakes Areas of Concern (AOC). Muskegon Lake, MI, USA, was designated as an AOC because of the legacies associated with its history of lumber, industry, and direct discharge of effluent, which resulted in the hardening of the shoreline, sediment contamination, and the development of nuisance algae, among other impairments [2]. Habitat loss was significant and resulted from the filling of open water and coastal wetlands in the form of historic sawmill debris, foundry sand, and slag. Collectively, these activities resulted in ~65% of the shoreline becoming hardened with wood pilings, sheet metal, and concrete [2]. The direct discharge of effluent to the lake prior to the passage of the Clean Water Act resulted in excessive nutrient concentrations and algal blooms [2,3], the loss and degradation of the benthic community [4,5], and the associated degradation of water quality and fish and wildlife populations [2,6,7].
The loss of wetlands is of particular concern given the numerous ecosystem services they provide, including nutrient retention, fish and wildlife habitats, and flood control [8,9]. Over 50% of wetland area has been lost in the United States since European settlement [10,11,12]. These losses have been amplified in the coastal regions of the Great Lakes, where land is highly valued, and wetland habitat must compete against development pressures. Where wetlands are attached to flowing water, adjacent floodplains can be important sites for nutrient retention and cycling, especially in restored agricultural areas [13,14] via sorption to sediments and biotic uptake by periphyton, macrophytes, and microbial communities [15], and provide critical habitat for fish and wildlife [16,17,18].
The rich, mucky soils of Great Lakes coastal wetlands led to many of them being converted to agricultural production in the 20th century. Economic pressures later that century forced many producers to abandon these fields, which has led current land managers to consider restoration to transform former agricultural fields back into functional wetlands. However, these past land uses could lead to future ecological consequences, as these converted post-restoration wetlands could become short- to mid-term sources of P to hydrologically reconnected water bodies [14,19,20,21]. Legacy P in sediments also can lead to long-term water quality impairments [22,23,24]; this is particularly acute in agricultural land uses, as the mobilization of these P-rich soils can occur via overland flow or tile drain effluent.
The degradation of fish and wildlife habitats was one of the original beneficial use impairments (BUIs) identified for the Muskegon Lake AOC. The restoration of a former celery farm, upstream of Bear Lake, that had been disconnected from adjacent Bear Creek since the 1930s was identified as a strategy that would move the AOC closer to meeting the habitat restoration target goal (Figure 1). Farming activity historically involved the pumping of water off the fields, but after the cessation of farming, the pumps were turned off, and the fields refilled naturally via groundwater, forming two ponds. The current restoration project involved removing an earthen berm to hydrologically reconnect both ponds to the Creek. However, the pre-restoration sampling of the ponds’ water quality and sediments indicated extremely high P concentrations [25]. Given that the immediate downstream receiving water body, Bear Lake, is subject to a total maximum daily load (TMDL) for P [26,27], there was concern that reconnection without consideration of water quality would result in further water quality deterioration of Bear Lake. As a consequence, restoration involved first dewatering the flooded former celery fields, sending P-rich pond water to the Muskegon County Wastewater Management Facility, and excavating ~103,000 m3 of P-laden sediment to an average depth of 0.5–1 m (the entire west pond was excavated as well as a portion of the east pond, which had been partially dredged by the landowner before restoration; see below). Thereafter, the berm was removed, which allowed Bear Creek to refill the excavated ponds.
Sediment dredging as a restoration tool has a long history (cf. [28,29,30,31]), with variable results. Van der Does et al. [32] noted that both the hydrologic and sediment characteristics of a system need to be considered before dredging, especially if the sediment consists of a mobile, fluid mud layer that easily migrates. Lürling and Faassen [33] found that the combination of dredging and Phoslock® application was more effective than either single application in controlling cyanobacteria. In contrast, Yin et al. [34] found that Phoslock® was more effective than dredging in the long-term control of internal P loading. However, Kleeberg and Kohl [35], based on their simulated dredging of the P-rich surface sediment in lab-based sediment cores, found that the P release from the deeper layers offsets the benefits of surface sediment removal. Lab experiments simulating dredging prior to restoration at these flooded celery sites, as well as those immediately following dredging, provided strong evidence to move forward with excavation and that sediment removal would have a positive impact on water quality [36,37].
Studies conducted on this site prior to restoration indicated that the sediment was a significant source of P to the overlying water column in the ponds [25,36] and that simulated dredging would result in a substantial reduction in P release [37]. Although the primary goal of this restoration project was to restore fish and wildlife habitats, these studies revealed the potential for water quality impairment from the flooded ponds to the downstream lake and that dredging was a reasonable approach for restoration. These results helped inform a construction design that minimized water quality impacts on the downstream-receiving water body. In this paper, we examine the changes in water quality over a time period that incorporates pre-restoration, the construction period, the refill period, and post-construction. We expected some short-term water quality impacts during construction but also that following the completion of the project, water quality in the former ponds would be improved.
2. Materials and Methods
2.1. Study Area
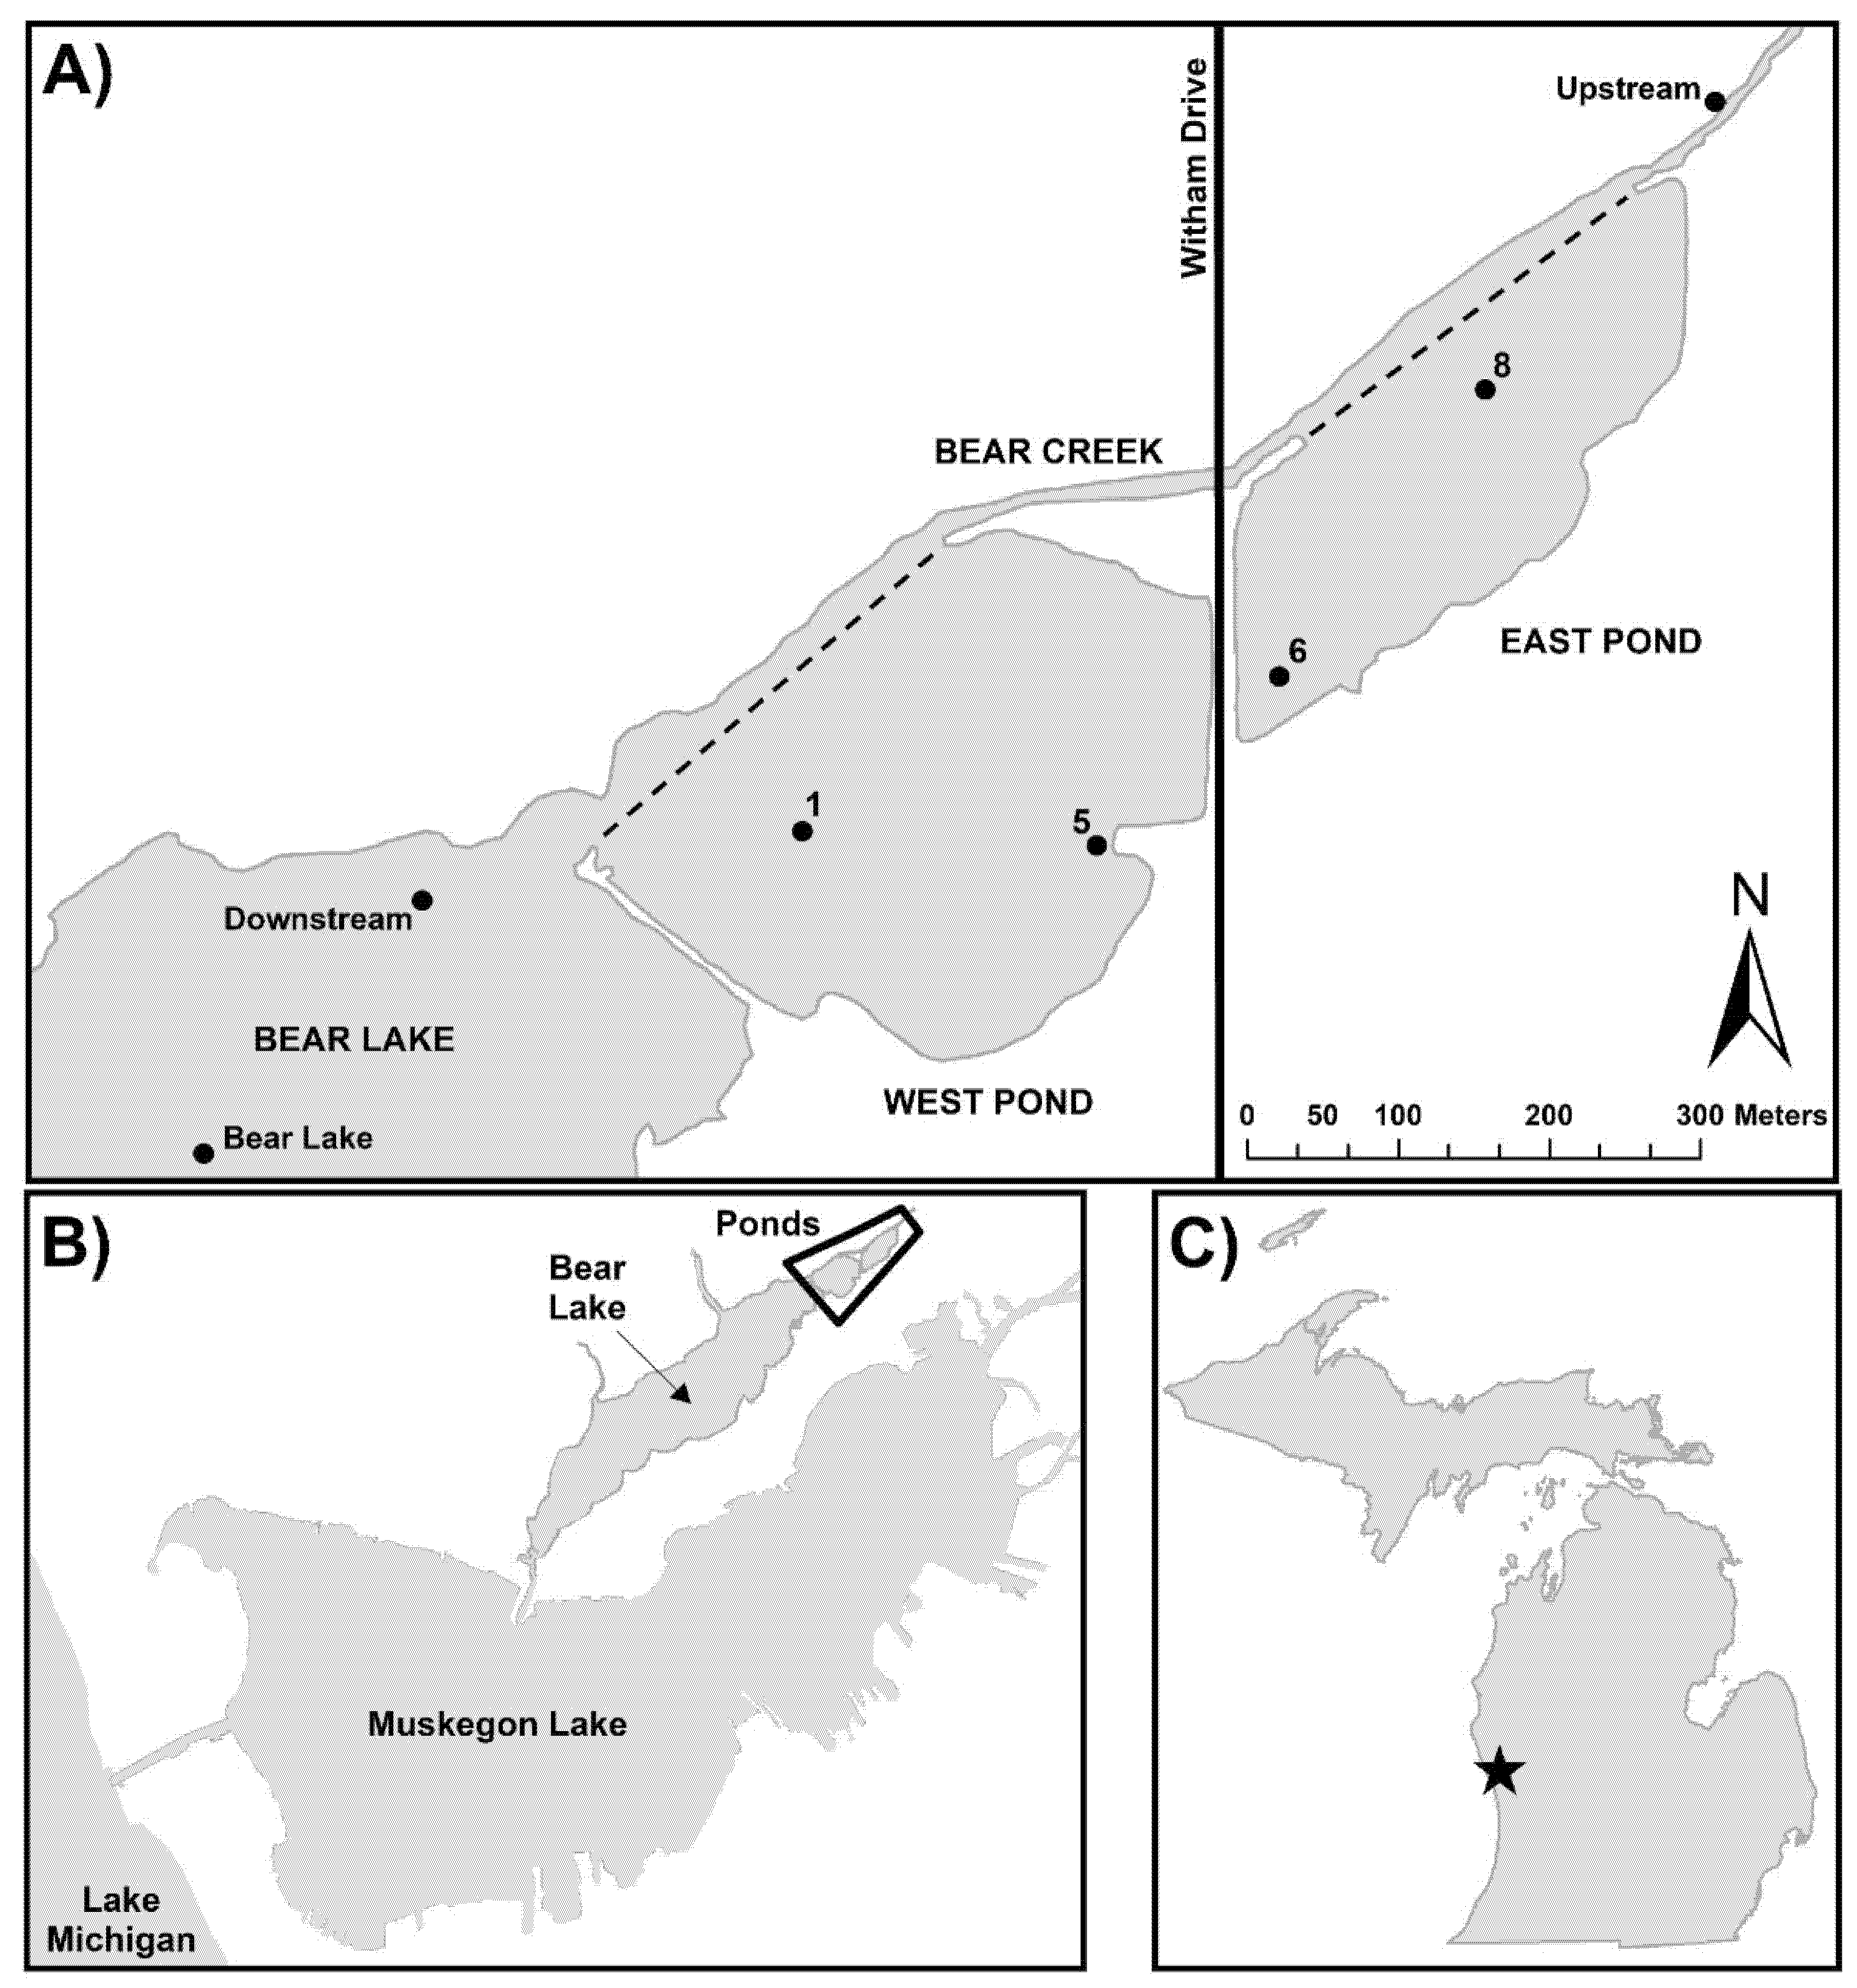
The location of the restoration project is within the boundaries of the Bear Lake watershed (area = ~77 km2), which is part of the Muskegon Lake Area of Concern in West Michigan. This study area is immediately upstream of Bear Lake, which drains into Muskegon Lake and eventually into Lake Michigan (Figure 1). Based on the aggregated information from the 2016 National Land Cover Database, the land use in the Bear Lake watershed is 47% forest; 24% developed; 15% agriculture; 9% wetland; and 5% other.
The 14.6 ha restoration footprint includes two former celery fields and an earthen berm separating Bear Creek from the celery fields (Figure 1 and Figure 2). Celery farming began in this area in the 1930s, when water was pumped from natural wetland areas to create muck fields. Farming stopped in 1995 and 2002 in the east and west fields, respectively, although the landowner continued pumping water off the fields until 2004. The landowner dredged topsoil in the east field from ~1995 to 2002, varying 1–5 m in depth down to sand; however, the west field was left undredged [25]. After pumping stopped in 2004, groundwater naturally refilled the fields and formed two ponds with surface areas of 4.9 ha (east) and 8.9 ha (west) that remained hydrologically isolated from each other by a road and from adjacent Bear Creek by the earthen berm (Figure 1 and Figure 2). The pre-restoration soil classification was Kerston Muck, which is a very poorly drained organic soil that is interbedded by layers of sandy or loamy mineral soil from 0.4 to 0.8 m below the surface.
Prior studies from 2014 to 2017 indicated that the water quality in the ponds was problematic [25,36,37]. Rather than remove the berm and allow the P-enriched water to enter Bear Lake, the overlying water in each pond was pumped to the Muskegon County Wastewater Management facility to be treated, and approximately ~103,000 m3 of sediment was excavated by mechanical means (using the terminology of Lürling et al. 2020 [38], excavation refers to the removal of material after dewatering, whereas dredging involves material removal while overlying water is present) and trucked to a landfill outside the watershed. Following the dewatering, ~15,500 m3 of the clean sand fill and ~50 m3 of the temporary fill were added to the dewatered bottom of the ponds to create shallow water wetland regions. At that point, the earthen berm separating the dewatered ponds and Bear Creek was removed to hydrologically reconnect each pond to the Creek, although the two former ponds remained isolated from each other by the road. The ponds were then refilled with both groundwater and surface flow from Bear Creek.
2.2. Field and Laboratory Work
The current field and lab methods were designed to be consistent with pre-restoration research in this wetland complex [25]. Sampling occurred monthly in Bear Creek (upstream and downstream reference sites) and at two sites in each of the two restored ponds. The Bear Lake sampling occurred 3× seasonally in July and October 2020, and in April 2021. The sites were sampled via kayak in the following order: Bear Lake, downstream creek, west pond sites, east pond sites, and upstream creek (Figure 1). Surface water was collected at all the sites via 250 mL and 1 L grab samples. At Bear Lake, a bottom sample was collected after the initial surface sample using a Van Dorn water sampler. During those months with sufficient ice cover, an ice auger was used to create a hole and sample through the ice. Sampling did not occur when the ice was too thin to navigate on foot or impenetrable by kayak.
The physicochemical parameters of water quality, including the temperature, dissolved oxygen (DO), pH, specific conductivity (SpCond), total dissolved solids (TDS), and turbidity, were measured using a YSI 6600 sonde (Yellow Springs Instruments, Yellow Springs, OH, USA). At least 250 mL of site water was collected for total phosphorus (TP) analysis, from which a 20 mL subsample was collected and syringe-filtered through acid-washed 0.45 μm nylon membrane filters into scintillation vials for soluble reactive phosphorus (SRP) analysis. A separate 1 L water sample was collected in an amber bottle for chlorophyll a (chl-a) analysis via spectrophotometry [39].
All the samples were stored on ice during transport to the laboratory. TP and SRP samples were refrigerated until measured on a SEAL AQ2 discrete auto-analyzer (SEAL Analytical Inc., Mequon, WI, USA) [40]. P concentrations below the 5 μg/L detection limit (DL) were calculated as 1/2 the detection limit, and negative turbidity values were changed to 0 for data analysis. Chl-a samples were vacuum-filtered on a GF/F membrane and frozen until extracted and analyzed on a Shimadzu UV-1601 spectrophotometer (Shimadzu Scientific Instruments, Columbia, MD, USA) [41]. The particulate P (partP) fraction was calculated as the difference between TP and SRP.
2.3. Data Analysis
Data were analyzed to characterize water quality differences between (1) upstream and downstream creek sites; and (2) pre-restoration and post-restoration ponds using either 2-tailed paired t-tests (normally distributed data) or Wilcoxon signed-rank tests (non-normally distributed data), using Hedge’s g-statistic to provide a corrected effect size. We present the data separately for the two sites in each pond because of the differences in their sediment chemistry and vegetation type prior to restoration [25]. Nonlinear regression analysis and either 1-way analysis of variance (ANOVA; normal) or Kruskal–Wallis 1-way ANOVA on ranks (non-normal) were applied to four restoration monitoring periods (2014: pre-restoration; 2017: construction; 2018–2019: pond refill; 2020–2021: post-restoration). The differences detected by ANOVA were further analyzed using post hoc multiple comparison Tukey tests. Hedge’s g-values are somewhat arbitrary; we interpreted the values of 0–0.2 to have a negligible effect; 0.2–0.5 to have a small effect; 0.5–0.8 to have a medium effect; and >0.8 to have a large effect, with positive g-values indicating an increase from control to experimental groups, while negative g-values indicating a corresponding decrease between the groups.
For all 4 monitoring periods (see above), multiyear statistical testing for Bear Creek and the ponds used the same 7 months (April–October) that were sampled in all our monitoring years to avoid any bias associated with seasonal differences. Statistical analyses (ANOVA) were conducted in SigmaPlot v.14.0 (Systat Software, Inc., San Jose, CA, USA) and Microsoft Excel 2019 (Hedge’s g-statistic; Microsoft Corporation, Redmond, WA, USA).
3. Results
3.1. West Pond Water Quality
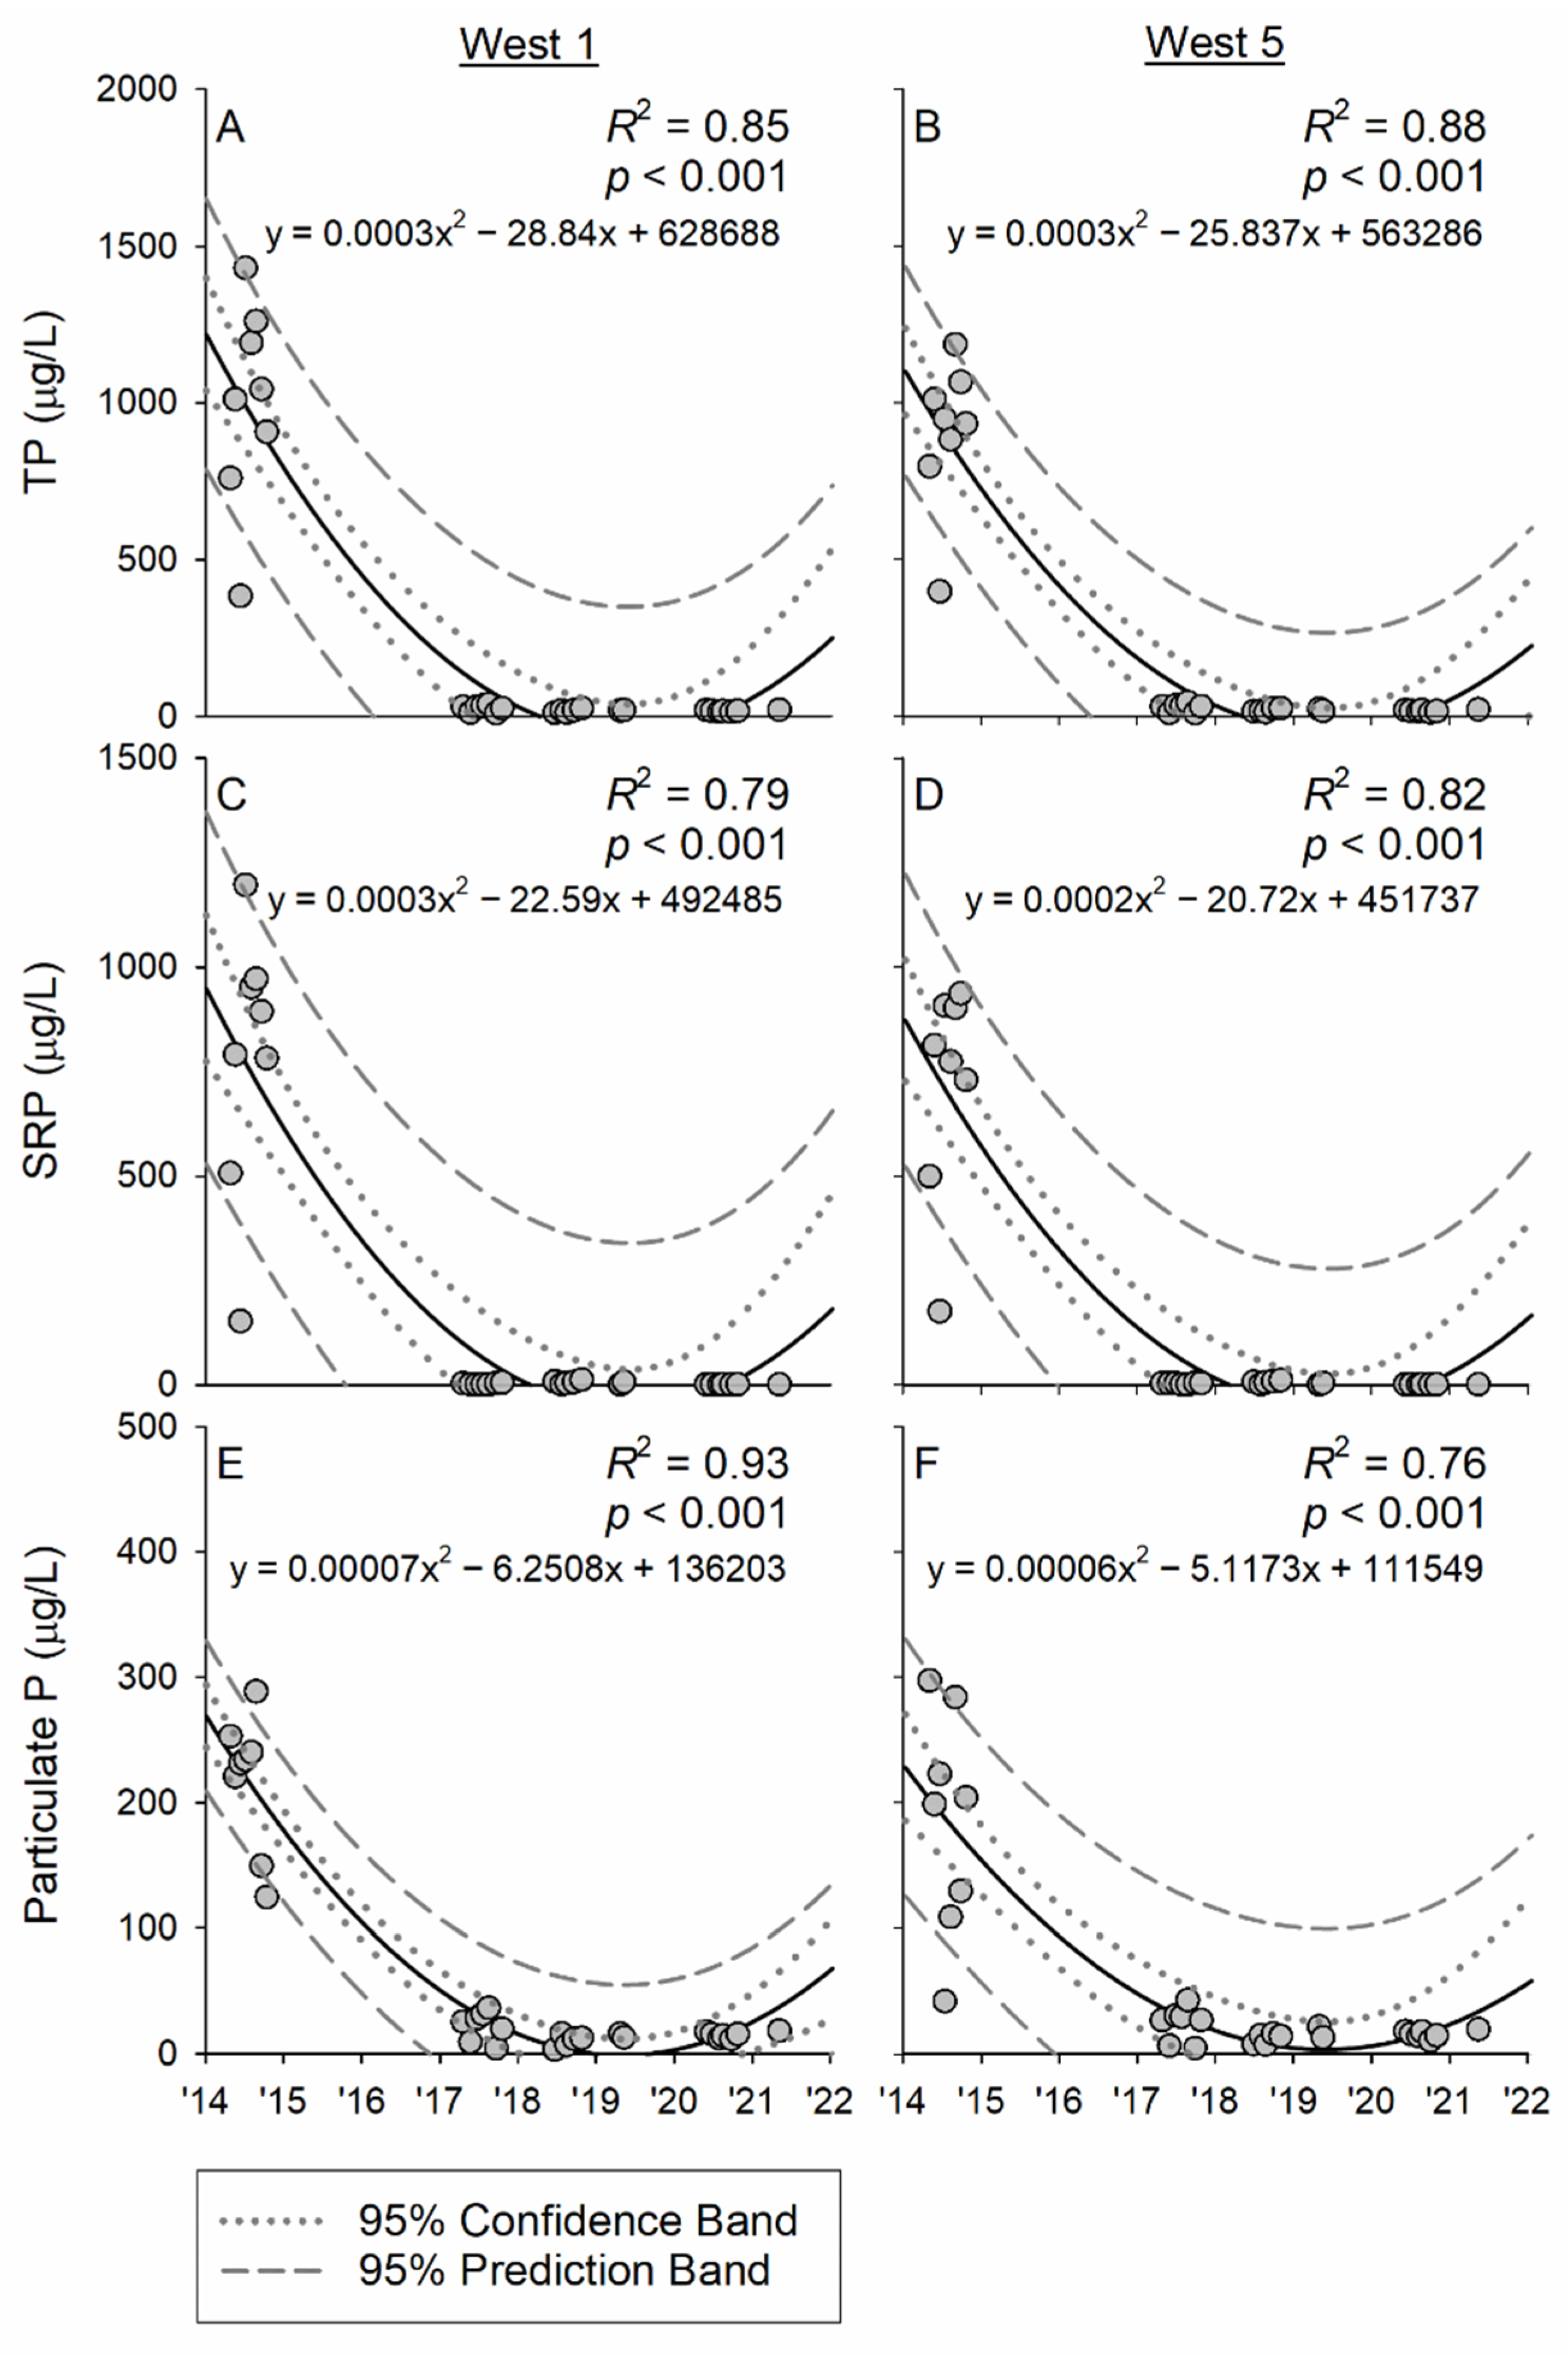
Pre-restoration TP concentrations in the west pond frequently exceeded 1000 μg/L, with little difference between the two sampling sites in the pond (Figure 3). Following excavation and pond refilling, TP concentrations plummeted below the 30 μg/L TMDL goal for Bear Lake [26], ranging between 13 and 29 μg/L (Figure 3A). West pond’s mean SRP concentrations made up a significant fraction of TP prior to restoration (~77%), indicating very high absolute and relative amounts of bioavailable P in this pond. Following restoration, SRP concentrations were frequently below detection (5 μg/L) and nominally accounted for only ~≤17% of TP (Figure 3B). The regressions of west pond TP and SRP concentrations across the sampling time revealed substantial declines (p < 0.001) with R2 values ranging from 0.75 to 0.93 (Table 1, Figure 4A–D).
When comparing the 2020–2021 west pond water quality to the 2014 pre-restoration conditions at the two sites, 16 of the 24 analytes showed declines (p < 0.10), while 15 of the 24 analytes had moderate or large effect sizes (g > −0.5), again reflecting declines over time (Table 1). The three forms of the measured P all showed the most dramatic declines following restoration, sometimes up to two orders of magnitude (Table 1; Figure 4). Indeed, the mean TP concentrations declined 98% in both ponds as a function of restoration. Chl-a concentrations also showed mean decreases from 20 to 8 μg/L and 11 to 7 μg/L at the two west pond sites, although there was high variance around those means (p > 0.05; Table 1). Other indications of improved water quality following restoration in the west pond included a marginal increase in DO and declines in specific conductivity and TDS (by 50–60%; Table 1).
3.2. East Pond Water Quality
The pre-restoration TP and SRP concentrations were much lower in the east pond than in the west pond, presumably because the dredging conducted by the farmer in this pond (but not the west pond) removed some of the P-laden sediment that would otherwise be a source of P to the water column (Figure 5). As a consequence, P reductions were less dramatic in the east pond than in the west pond, although TP and partP declines still notably declined by a degree of magnitude (Figure 5; Table 2). SRP concentrations were < 5 µg/L even before the current restoration project and remained low afterward (Table 2). The regressions of east pond TP and partP across our sampling timeline had similar p-values across the restoration periods as those observed in the west pond, although the east pond R2 values were lower and ranged from 0.59 to 0.62 (Figure 6, Table 2). SRP regressions showed increases at both east pond sites during the 2017–2019 post-restoration sampling, although the absolute concentrations were still relatively low (Figure 6). In 2021, concentrations had decreased to levels that were similar to, or lower than, those observed in 2014.
Of the 24 reported analytes, 19 declined in the east pond (p < 0.10; g > −0.5) across the restoration period (Table 2). In addition to the significant declines in the mean TP and particulate P, chl-a concentrations declined to an even greater degree than those measured in the west pond (Table 2). The physical and chemical parameters in the east pond generally showed improvement in water quality, as its mean specific conductivity, TDS, and turbidity all decreased; although DO significantly decreased in both east pond sites, the absolute concentrations remained relatively high during 2020–2021 (9.8–9.2 mg/L; Table 2).
3.3. Assessment of Bear Creek Water Quality
Across all the years of restoration monitoring, the mean upstream TP concentrations changed relatively little, while the downstream concentrations showed a marginal change; the concentration range varied from ~10 to 50 µg/L (Figure 7 and Figure 8). The mean SRP concentrations, on the other hand, significantly increased at the upstream site and significantly decreased at the downstream site (Figure 7 and Figure 8). The absolute differences were small (Figure 7), and R2 values were low (Figure 8). Interestingly, the downstream TP concentration doubled from ~30 µg/L to ~60 µg/L during the refill period (Figure 7), likely due to the resuspension of materials. The particulate P concentrations followed similar upstream and downstream trends as those exhibited for TP (Figure 8).
A comparison of upstream vs. downstream conditions in the most recent post-restoration period allowed us to assess if the flow-through marsh is currently impacting water quality (Table 3). The mean concentrations of all three P species were lower at the downstream than at the upstream sampling site, with SRP changes being the most distinct (p < 0.05; Table 3). A small effect size was indicated for partP, a medium effect for TP, and a large effect size for SRP (Table 3). Both chl-a and temperature were greater at the downstream than at the upstream site (Table 3), which is consistent with longer residence time in the marshes allowing the water to warm (Table 1 and Table 2) and phytoplankton to grow, before being released back into Bear Creek and Bear Lake.
3.4. Assessment of Bear Lake Water Quality
In March 2016, prior to the celery field restoration effort, the surface TP concentration in Bear Lake was 67.4 µg/L, more than double the TMDL threshold; in April 2020, following restoration, the TP concentration had declined to 23.7 µg/L (Table 4). The SRP concentration also declined from 9.6 µg/L to 2.5 µg/L, as did turbidity (Table 4). However, chl-a and specific conductance increased following restoration (Table 4). The annual differences in climatic and environmental factors, such as temperature, wind velocity and direction, and water levels may also account for these changes in water quality, so data over longer time periods are needed before lake water quality improvements can be attributed with confidence to this restoration project (cf. [42]).
4. Discussion
The primary objective of this restoration effort was to create additional high-quality habitat and move the Muskegon Lake Area of Concern closer to the delisting status. To restore this habitat, flooded ponds that formerly were celery fields were hydrologically reconnected to an adjacent creek to re-establish the floodplain and create a flow-through marsh. Floodplain habitat provides an excellent habitat for fish and wildlife and can help retain nutrients, serving as a natural filter on the landscape [16,43]. We did not measure the actual water exchange rates between Bear Creek and the restored marsh areas, as that was beyond the scope of the project. However, it is apparent that substantial exchange is occurring, as evidenced by the water quality changes observed between the upstream and downstream sampling sites on Bear Creek; reductions in P concentration and a 4 °C increase in the Bear Creek mean temperature from upstream to downstream (Table 3) indicate that the Bear Creek water is entering the marshes, which have longer hydrologic residence times than the Creek, resulting in an opportunity for the water to warm and P to be taken up or adsorbed, before it returns to Bear Creek.
Sediment excavation had a clear beneficial impact on P concentrations in these ponds. The degree of benefit differed between the ponds because of their prior management histories. Despite their close geographic proximity to each another, the prior dredging in part of the east pond removed a considerable amount of muck soil and its associated P [37] (Figure 2). Hence, the effect of sediment excavation on water column P concentrations was less dramatic in the east pond than in the west pond. The water column P reductions are a function, in part, of dilution from the hydrologic connection of the lower-P Bear Creek water and, based on the results from prior studies [37], the exposure of sediments with high P binding capacity following the removal of the P-laden overburden.
The effectiveness of sediment dredging to control internal P loading is not absolute. Studies have shown this management option to be both effective [37,44,45,46] and ineffective [47,48] at controlling the internal P loading. Several reasons appear to account for this lack of a consistent effect. First, sediment characteristics can play a critical role, including (1) the sediment composition (fluid mud layer vs. sand grains; [32]) and the mobility of the P fractions with depth [34]; (2) dredging season [49]; (3) dredging method [50]; and (4) whether the external P loading to the water body is also controlled [30,51,52,53].
While sediment removal successfully eliminated the legacy P in our restoration wetland, we acknowledge there are drawbacks to this management option. First, excavation removes the benthic community [38]. In our study, the macrophyte, algal, and macroinvertebrate communities were first desiccated and then excavated, and although the planting and seeding of natural vegetation were undertaken, it takes time for these communities to re-establish. Indeed, while some wetland macroinvertebrate communities re-establish within a decade [54], other wetlands have not regained their original structural and functional status even after a century [55]. Second, the lower water column P concentrations entering the restored areas from Bear Creek, especially in the west pond, may help drive the P release from the sediments into the water column due to concentration gradients, at least until an equilibrium is established; this likely occurred in our system based on the results from simulated experiments in the laboratory [36], but based on our water column analyses, it appears the effect was short-lived. Third, sediment removal is expensive. The costs of dredging sediments in prior projects ranged from ~USD 3000 to ~USD 48,000/ha [56]. For this project, if only the cost of excavation is included in the analysis (~USD 4,350,000), then the cost/ha is ~USD 297,945/ha; this cost is at least one order of magnitude greater than other projects, but it also includes disposal at a landfill located ~35 km away from the project site. Additional costs of the project included land acquisition (USD 204,373), dewatering and treatment (~USD 880,000), and planting/seeding native vegetation (USD 98,175), resulting in a cost/ha of ~USD 378,950/ha.
Restoration efforts involving excavation must consider prior land use, as legacy nutrients and contaminants are important factors in project cost and logistics. In addition, for excavation to have long-term benefits (i.e., >20 years), it is critical that the new and prior sources of the stressors be controlled. It makes no sense to treat the symptom and not the disease when it comes to restoration efforts.
Although excavation successfully reduced the P concentrations, we anticipate that the full benefits of the flow-through marsh have not yet been realized because record-high water levels in Lake Michigan, Muskegon Lake, and Bear Lake have prevented the complete re-establishment of vegetation in the created floodplain area. Water levels in Muskegon Lake, which connects directly to Bear Lake, were almost 1 m higher in 2018 than in 2012 [57], forcing the water back into the connecting water bodies. We anticipate that as water levels continue to decline in the region, not only will this vegetation fully establish, but any backflow from Bear Lake will also recede, allowing the flow-through marshes to realize their full potential in nutrient reduction and retention, as has been observed in other created wetlands throughout the world (cf. [58]). Even at the current TP concentrations in these ponds (18–22 μg/L), the inflow into Bear Lake will reduce the current concentrations of 44 μg/L, thereby narrowing the gap to the TMDL restoration target of 30 μg/L [26].
5. Conclusions
Wetland restoration in agricultural areas presents challenges due to the legacy nutrients that can be a threat to downstream water quality after restoration. The results from this study show that sediment excavation can be an effective option to reduce the water column P concentrations. However, given the influence of site-specific characteristics, we recommend a full diagnostic analysis of the site, including sediment composition, site hydrology, and cost, as part of the restoration decision-making process. These results should assist wetland managers in impaired systems who are addressing legacy P concerns to maximize restoration benefits for their specific site needs.
Author Contributions
Conceptualization, M.C.H. and A.D.S.; data curation, M.C.H.; formal analysis, M.C.H. and A.D.S.; funding acquisition, A.D.S.; investigation, M.C.H.; methodology, M.C.H. and A.D.S.; project administration, M.C.H. and A.D.S.; resources, A.D.S.; supervision, M.C.H. and A.D.S.; validation, M.C.H.; visualization, M.C.H. and A.D.S.; writing—original draft preparation, M.C.H. and A.D.S.; writing—review and editing, M.C.H. and A.D.S. All authors have read and agreed to the published version of the manuscript.
Funding
Grand Valley State University Annis Water Resources Institute was a subrecipient of Michigan Areas of Concern Program for Public Advisory Council Support funding (grant number GL00E02481) held by West Michigan Shoreline Regional Development Commission from the Great Lakes Restoration Initiative through the Michigan Department of Environment, Great Lakes & Energy.
Data Availability Statement
Data from this study are available upon request to the authors.
Acknowledgments
We thank Kathy Evans (West Michigan Shoreline Regional Development Commission) and the Great Lakes Commission for their support. Field and laboratory support were provided by Maggie Oudsema, Emily Kindervater, Kim Oldenborg, Ellen Foley, Nicole Hahn, Eli Jacobson, Paige Kleindl, Rachel Orzechowski, and Brooke Ridenour. We additionally thank Brian Scull (AWRI) for performing laboratory analyses, Kurt Thompson (AWRI) for GIS support, and Brian Majka (GEI) for logistical help and site information. We thank the Willbrandt family for graciously providing us access to their property and for providing helpful background information. This project would not have been completed without the collaborative support of NOAA, GEI Consultants, and WMSRDC. We are grateful for the reviewers’ comments, which improved the manuscript.
Conflicts of Interest
The authors declare no conflict of interest. The funders had no role in the design of the study; in the collection, analyses, or interpretation of data; in the writing of the manuscript; or in the decision to publish the results.
References
- Allan, J.D.; McIntyre, P.B.; Smith, S.D.P.; Halpern, B.S.; Boyer, G.L.; Buchsbaum, A.; Burton, G.A.; Campbell, L.M.; Chadderton, W.L.; Ciborowski, J.J.H.; et al. Joint analysis of stressors and ecosystem services to enhance restoration effectiveness. Proc. Natl. Acad. Sci. USA 2012, 110, 372–377. [Google Scholar] [CrossRef] [PubMed]
- Steinman, A.D.; Ogdahl, M.; Rediske, R.; Ruetz, C.R.; Biddanda, B.A.; Nemeth, L. Current Status and Trends in Muskegon Lake, Michigan. J. Great Lakes Res. 2008, 34, 169–188. [Google Scholar] [CrossRef]
- Xie, L.; Hagar, J.; Rediske, R.R.; O’Keefe, J.; Dyble, J.; Hong, Y.; Steinman, A.D. The influence of environmental conditions and hydrologic connectivity on cyanobacteria assemblages in two drowned river mouth lakes. J. Great Lakes Res. 2011, 37, 470–479. [Google Scholar] [CrossRef]
- Carter, G.S.; Nalepa, T.F.; Rediske, R.R. Status and Trends of Benthic Populations in a Coastal Drowned River Mouth Lake of Lake Michigan. J. Great Lakes Res. 2006, 32, 578–595. [Google Scholar] [CrossRef]
- Nelson, W.A.; Steinman, A.D. Changes in the benthic communities of Muskegon Lake, a Great Lakes Area of Concern. J. Great Lakes Res. 2013, 39, 7–18. [Google Scholar] [CrossRef]
- Bhagat, Y.; Ruetz, C.R. Temporal and Fine-Scale Spatial Variation in Fish Assemblage Structure in a Drowned River Mouth System of Lake Michigan. Trans. Am. Fish. Soc. 2011, 140, 1429–1440. [Google Scholar] [CrossRef]
- Mader, M.M. Effects of Shoreline and Watershed Development on Eastern Lake Michigan Drowned River Mouth Ecology. Ph.D. Thesis, Grand Valley State University, Allendale, MI, USA, 2021. [Google Scholar]
- Sierszen, M.E.; Morrice, J.A.; Trebitz, A.S.; Hoffman, J.C. A review of selected ecosystem services provided by coastal wetlands of the Laurentian Great Lakes. Aquat. Ecosyst. Health Manag. 2012, 15, 92–106. [Google Scholar] [CrossRef]
- Larson, J.H.; Trebitz, A.S.; Steinman, A.D.; Wiley, M.J.; Mazur, M.C.; Pebbles, V.; Braun, H.A.; Seelbach, P.W. Great Lakes rivermouth ecosystems: Scientific synthesis and management implications. J. Great Lakes Res. 2013, 39, 513–524. [Google Scholar] [CrossRef]
- Gibbs, J.P. Wetland Loss and Biodiversity Conservation. Conserv. Biol. 2000, 14, 314–317. [Google Scholar] [CrossRef]
- USDA (United States Department of Agriculture). Restoring America’s Wetlands: A Private Lands Conservation Success Story; Wetlands Reserve Program; Natural Resources Conservation Service: Washington, DC, USA, 2012. [Google Scholar]
- Uzarski, D.G.; Brady, V.J.; Cooper, M.J.; Wilcox, D.A.; Albert, D.A.; Axler, R.P.; Bostwick, P.; Brown, T.N.; Ciborowski, J.J.H.; Danz, N.P.; et al. Standardized measures of coastal wetland condition: Implementation at a Laurentian Great Lakes basin-wide scale. Wetlands 2017, 37, 15–32. [Google Scholar] [CrossRef] [Green Version]
- Zedler, J.B. Wetlands at your service: Reducing impacts of agriculture at the watershed scale. Front. Ecol. Environ. 2003, 1, 65–72. [Google Scholar] [CrossRef]
- Steinman, A.D.; Ogdahl, M.E. Does converting agricultural fields to wetlands retain or release phosphorus? J. N. Am. Benthol. Soc. 2011, 30, 820–830. [Google Scholar] [CrossRef]
- Reddy, K.R.; Kadlec, R.H.; Flaig, E.; Gale, P.M. Phosphorus retention in streams and wetlands: A review. Crit. Rev. Environ. Sci. Technol. 1999, 29, 83–146. [Google Scholar] [CrossRef]
- Trexler, J.C. Restoration of the Kissimmee River: A Conceptual Model of Past and Present Fish Communities and Its Consequences for Evaluating Restoration Success. Restor. Ecol. 1995, 3, 195–210. [Google Scholar] [CrossRef]
- Tockner, K.; Stanford, J.A. Riverine flood plains: Present state and future trends. Environ. Conserv. 2002, 29, 308–330. [Google Scholar] [CrossRef]
- Uzarski, D.G.; Burton, T.M.; Cooper, M.J.; Ingram, J.W.; Timmermans, S.T. Fish Habitat Use Within and Across Wetland Classes in Coastal Wetlands of the Five Great Lakes: Development of a Fish-based Index of Biotic Integrity. J. Great Lakes Res. 2005, 31, 171–187. [Google Scholar] [CrossRef]
- Newman, S.; Pietro, K. Phosphorus storage and release in response to flooding: Implications for Everglades stormwater treatment areas. Ecol. Eng. 2001, 18, 23–38. [Google Scholar] [CrossRef]
- Aldous, A.; McCormick, P.; Ferguson, C.; Graham, S.; Craft, C. Hydrologic Regime Controls Soil Phosphorus Fluxes in Restoration and Undisturbed Wetlands. Restor. Ecol. 2005, 13, 341–347. [Google Scholar] [CrossRef]
- Montgomery, J.A.; Eames, J.M.; Klimas, C. A 16-year investigation of legacy phosphorus discharge from Prairie Wolf Slough: A wetland restored on a former farmed field. Restor. Ecol. 2021, 29, e13340. [Google Scholar] [CrossRef]
- Carpenter, S.R. Phosphorus control is critical to mitigating eutrophication. Proc. Natl. Acad. Sci. USA 2008, 105, 11039–11040. [Google Scholar] [CrossRef] [Green Version]
- Jarvie, H.P.; Sharpley, A.N.; Spears, B.; Buda, A.R.; May, L.; Kleinman, P.J. Water quality remediation faces unprecedented challenges from “legacy phosphorus”. Environ. Sci. Technol. 2013, 47, 8997–8998. [Google Scholar] [CrossRef] [PubMed]
- Sharpley, A.; Jarvie, H.P.; Buda, A.; May, L.; Spears, B.; Kleinman, P. Phosphorus Legacy: Overcoming the Effects of Past Management Practices to Mitigate Future Water Quality Impairment. J. Environ. Qual. 2013, 42, 1308–1326. [Google Scholar] [CrossRef] [PubMed]
- Steinman, A.D.; Ogdahl, M.E. From wetland to farm and back again: Phosphorus dynamics of a proposed restoration project. Environ. Sci. Pollut. Res. 2016, 23, 22596–22605. [Google Scholar] [CrossRef]
- MDEQ (Michigan Department of Environmental Quality). Total Maximum Daily Load for Phosphorus for Bear Lake; Michigan Department of Environmental Quality, Water Bureau: Lansing, MI, USA, 2008. [Google Scholar]
- Steinman, A.D.; Ogdahl, M.E. TMDL reevaluation: Reconciling internal phosphorus load reductions in a eutrophic lake. Lake Reserv. Manag. 2015, 31, 115–126. [Google Scholar] [CrossRef]
- Cronberg, G. Changes in the phytoplankton of Lake Trummen induced by restoration. Hydrobiologia 1982, 86, 185–193. [Google Scholar] [CrossRef]
- Beas, B.J.; Smith, L.M.; LaGrange, T.G.; Stutheit, R. Effects of sediment removal on vegetation communities in Rainwater Basin playa wetlands. J. Environ. Manag. 2013, 128, 371–379. [Google Scholar] [CrossRef]
- Kiani, M.; Tammeorg, P.; Niemistö, J.; Simojoki, A.; Tammeorg, O. Internal phosphorus loading in a small shallow Lake: Response after sediment removal. Sci. Total Environ. 2020, 725, 138279. [Google Scholar] [CrossRef]
- Larson, D.M.; Riens, J.; Myerchin, S.; Papon, S.; Knutson, M.G.; Vacek, S.C.; Winikoff, S.G.; Phillips, M.L.; Giudice, J.H. Sediment excavation as a wetland restoration technique had early effects on the developing vegetation community. Wetl. Ecol. Manag. 2019, 28, 1–18. [Google Scholar] [CrossRef]
- Van Der Does, J.; Verstraelen, P.; Boers, P.; Van Roestel, J.; Roijackers, R.; Moser, G. Lake restoration with and without dredging of phosphorus-enriched upper sediment layers. Hydrobiologia 1992, 233, 197–210. [Google Scholar] [CrossRef]
- Lürling, M.; Faassen, E.J. Controlling toxic cyanobacteria: Effects of dredging and phosphorus-binding clay on cyanobacteria and microcystins. Water Res. 2012, 46, 1447–1459. [Google Scholar] [CrossRef]
- Yin, H.; Yang, C.; Yang, P.; Kaksonen, A.H.; Douglas, G.B. Contrasting effects and mode of dredging and in situ adsorbent amendment for the control of sediment internal phosphorus loading in eutrophic lakes. Water Res. 2020, 189, 116644. [Google Scholar] [CrossRef] [PubMed]
- Kleeberg, A.; Kohl, J.-G. Assessment of the long-term effectiveness of sediment dredging to reduce benthic phosphorus release in shallow Lake Müggelsee (Germany). Hydrobiologia 1999, 394, 153–161. [Google Scholar] [CrossRef]
- Smit, J.T.; Steinman, A.D. Wetland Sediment Phosphorus Flux in Response to Proposed Hydrologic Reconnection and Warming. Wetlands 2015, 35, 655–665. [Google Scholar] [CrossRef]
- Oldenborg, K.A.; Steinman, A.D. Impact of sediment dredging on sediment phosphorus flux in a restored riparian wetland. Sci. Total Environ. 2018, 650, 1969–1979. [Google Scholar] [CrossRef]
- Lürling, M.; Smolders, A.J.P.; Douglas, G.D. Methods for the management of internal phosphorus loading in lakes. In Internal Phosphorus Loading of Lakes: Causes, Case Studies, and Management; Steinman, A.D., Spears, B.M., Eds.; J. Ross Publishing: Plantation, FL, USA, 2020; pp. 77–107. [Google Scholar]
- Steinman, A.D.; Lamberti, G.A.; Leavitt, P.; Uzarski, D.G. Biomass and pigments of benthic algae. In Methods in Stream Ecology, 3rd ed.; Hauer, F.R., Lamberti, G.A., Eds.; Elsevier Press: Cambridge, MA, USA, 2017; pp. 223–241. [Google Scholar]
- USEPA (United States Environmental Protection Agency). Methods for Chemical Analysis of Inorganic Substances in Environmental Samples; EPA-600/4-79R-93-020/100; USEPA: Cincinnati, OH, USA, 1993. [Google Scholar]
- APHA (American Public Health Association). Standard Methods for the Examination of Water and Wastewater, 18th ed.; American Public Health Association: Washington, DC, USA, 1992. [Google Scholar]
- Kao, N.; Mohamed, M.; Sorichetti, R.; Niederkorn, A.; Van Cappellen, P.; Parsons, C. Phosphorus retention and transformation in a dammed reservoir of the Thames River, Ontario: Impacts on phosphorus load and speciation. J. Great Lakes Res. 2021, 48, 84–96. [Google Scholar] [CrossRef]
- Tockner, K.; Schiemer, F.; Baumgartner, C.; Kum, G.; Weigand, E.; Zweimüller, I.; Ward, J. The Danube restoration project: Species diversity patterns across connectivity gradients in the floodplain system. Regul. Rivers Res. Manag. 1999, 15, 245–258. [Google Scholar] [CrossRef]
- Björk, S.; Pokorný, J.; Hauser, V. Restoration of lakes through sediment removal, with case studies from lakes Trummen, Sweden and Vajgar, Czech Republic. In Restoration of Lakes, Streams, Floodplains, and Bogs in Europe: Principles and Case Studies; Eiseltova, M., Ed.; Springer Publishing: Berlin/Heidelberg, Germany, 2010; pp. 101–122. [Google Scholar]
- Gu, X.-Z.; Chen, K.-N.; Zhang, L.; Fan, C.-X. Preliminary evidence of nutrients release from sediment in response to oxygen across benthic oxidation layer by a long-term field trial. Environ. Pollut. 2016, 219, 656–662. [Google Scholar] [CrossRef]
- Chen, M.; Cui, J.; Lin, J.; Ding, S.; Gong, M.; Ren, M.; Tsang, D.C. Successful control of internal phosphorus loading after sediment dredging for 6 years: A field assessment using high-resolution sampling techniques. Sci. Total Environ. 2018, 616-617, 927–936. [Google Scholar] [CrossRef]
- Wang, Y.; Ding, S.; Wang, D.; Sun, Q.; Lin, J.; Shi, L.; Chen, M.; Zhang, C. Static layer: A key to immobilization of phosphorus in sediments amended with lanthanum modified bentonite (Phoslock®). Chem. Eng. J. 2017, 325, 49–58. [Google Scholar] [CrossRef]
- Weng, J.-X. Post-dredging effect assessment based on sediment chemical quality in urban rivers of Yangzhou. Environ. Monit. Assess. 2017, 189, 96. [Google Scholar] [CrossRef]
- Zhong, J.-C.; Yu, J.-H.; Zheng, X.-L.; Wen, S.-L.; Liu, D.-H.; Fan, C.-X. Effects of Dredging Season on Sediment Properties and Nutrient Fluxes across the Sediment–Water Interface in Meiliang Bay of Lake Taihu, China. Water 2018, 10, 1606. [Google Scholar] [CrossRef]
- Chen, C.; Kong, M.; Wang, Y.-Y.; Shen, Q.-S.; Zhong, J.-C.; Fan, C.-X. Dredging method effects on sediment resuspension and nutrient release across the sediment-water interface in Lake Taihu, China. Environ. Sci. Pollut. Res. 2019, 27, 25861–25869. [Google Scholar] [CrossRef] [PubMed]
- Liu, C.; Zhong, J.; Wang, J.; Zhang, L.; Fan, C. Fifteen-year study of environmental dredging effect on variation of nitrogen and phosphorus exchange across the sediment-water interface of an urban lake. Environ. Pollut. 2016, 219, 639–648. [Google Scholar] [CrossRef]
- Steinman, A.D.; Spears, B.M. What is internal phosphorus loading and why does it occur? In Internal Phosphorus Loading of Lakes: Causes, Case Studies, and Management; Steinman, A.D., Spears, B.M., Eds.; J. Ross Publishing: Plantation, FL, USA, 2020; pp. 3–13. [Google Scholar]
- Wen, S.; Zhong, J.; Li, X.; Liu, C.; Yin, H.; Li, D.; Ding, S.; Fan, C. Does external phosphorus loading diminish the effect of sediment dredging on internal phosphorus loading? An in-situ simulation study. J. Hazard. Mater. 2020, 394, 122548. [Google Scholar] [CrossRef]
- Bortolotti, L.E.; Vinebrooke, R.D.; Louis, V.L.S. Prairie wetland communities recover at different rates following hydrological restoration. Freshw. Biol. 2016, 61, 1874–1890. [Google Scholar] [CrossRef]
- Moreno-Mateos, D.; Power, M.E.; Comín, F.A.; Yockteng, R. Structural and Functional Loss in Restored Wetland Ecosystems. PLOS Biol. 2012, 10, e1001247. [Google Scholar] [CrossRef]
- Cooke, G.D.; Welch, E.B.; Peterson, S.; Nichols, S.A. Restoration and Management of Lakes and Reservoirs, 3rd ed.; CRC Press: Boca Raton, FL, USA, 2016. [Google Scholar]
- Kleindl, P.M.; Steinman, A.D. Contrasting trajectories in macrophyte community development after shoreline restoration: Water level obscures trends. Aquat. Bot. 2020, 169, 103327. [Google Scholar] [CrossRef]
- Fink, D.F.; Mitsch, W.J. Seasonal and storm event nutrient removal by a created wetland in an agricultural watershed. Ecol. Eng. 2004, 23, 313–325. [Google Scholar] [CrossRef]
Figure 1.
Map of study area: (A) magnified view of restoration site, including the reconnected ponds and Bear Creek following berm removal (former berm locations indicated by black dashed lines and water quality monitoring locations indicated by round symbols); see Figure 2 for view of berm; (B) location of restoration area (outlined in thick black lines) within the Muskegon Lake Area of Concern; and (C) location of Muskegon (star) in map of Michigan.

Figure 2.
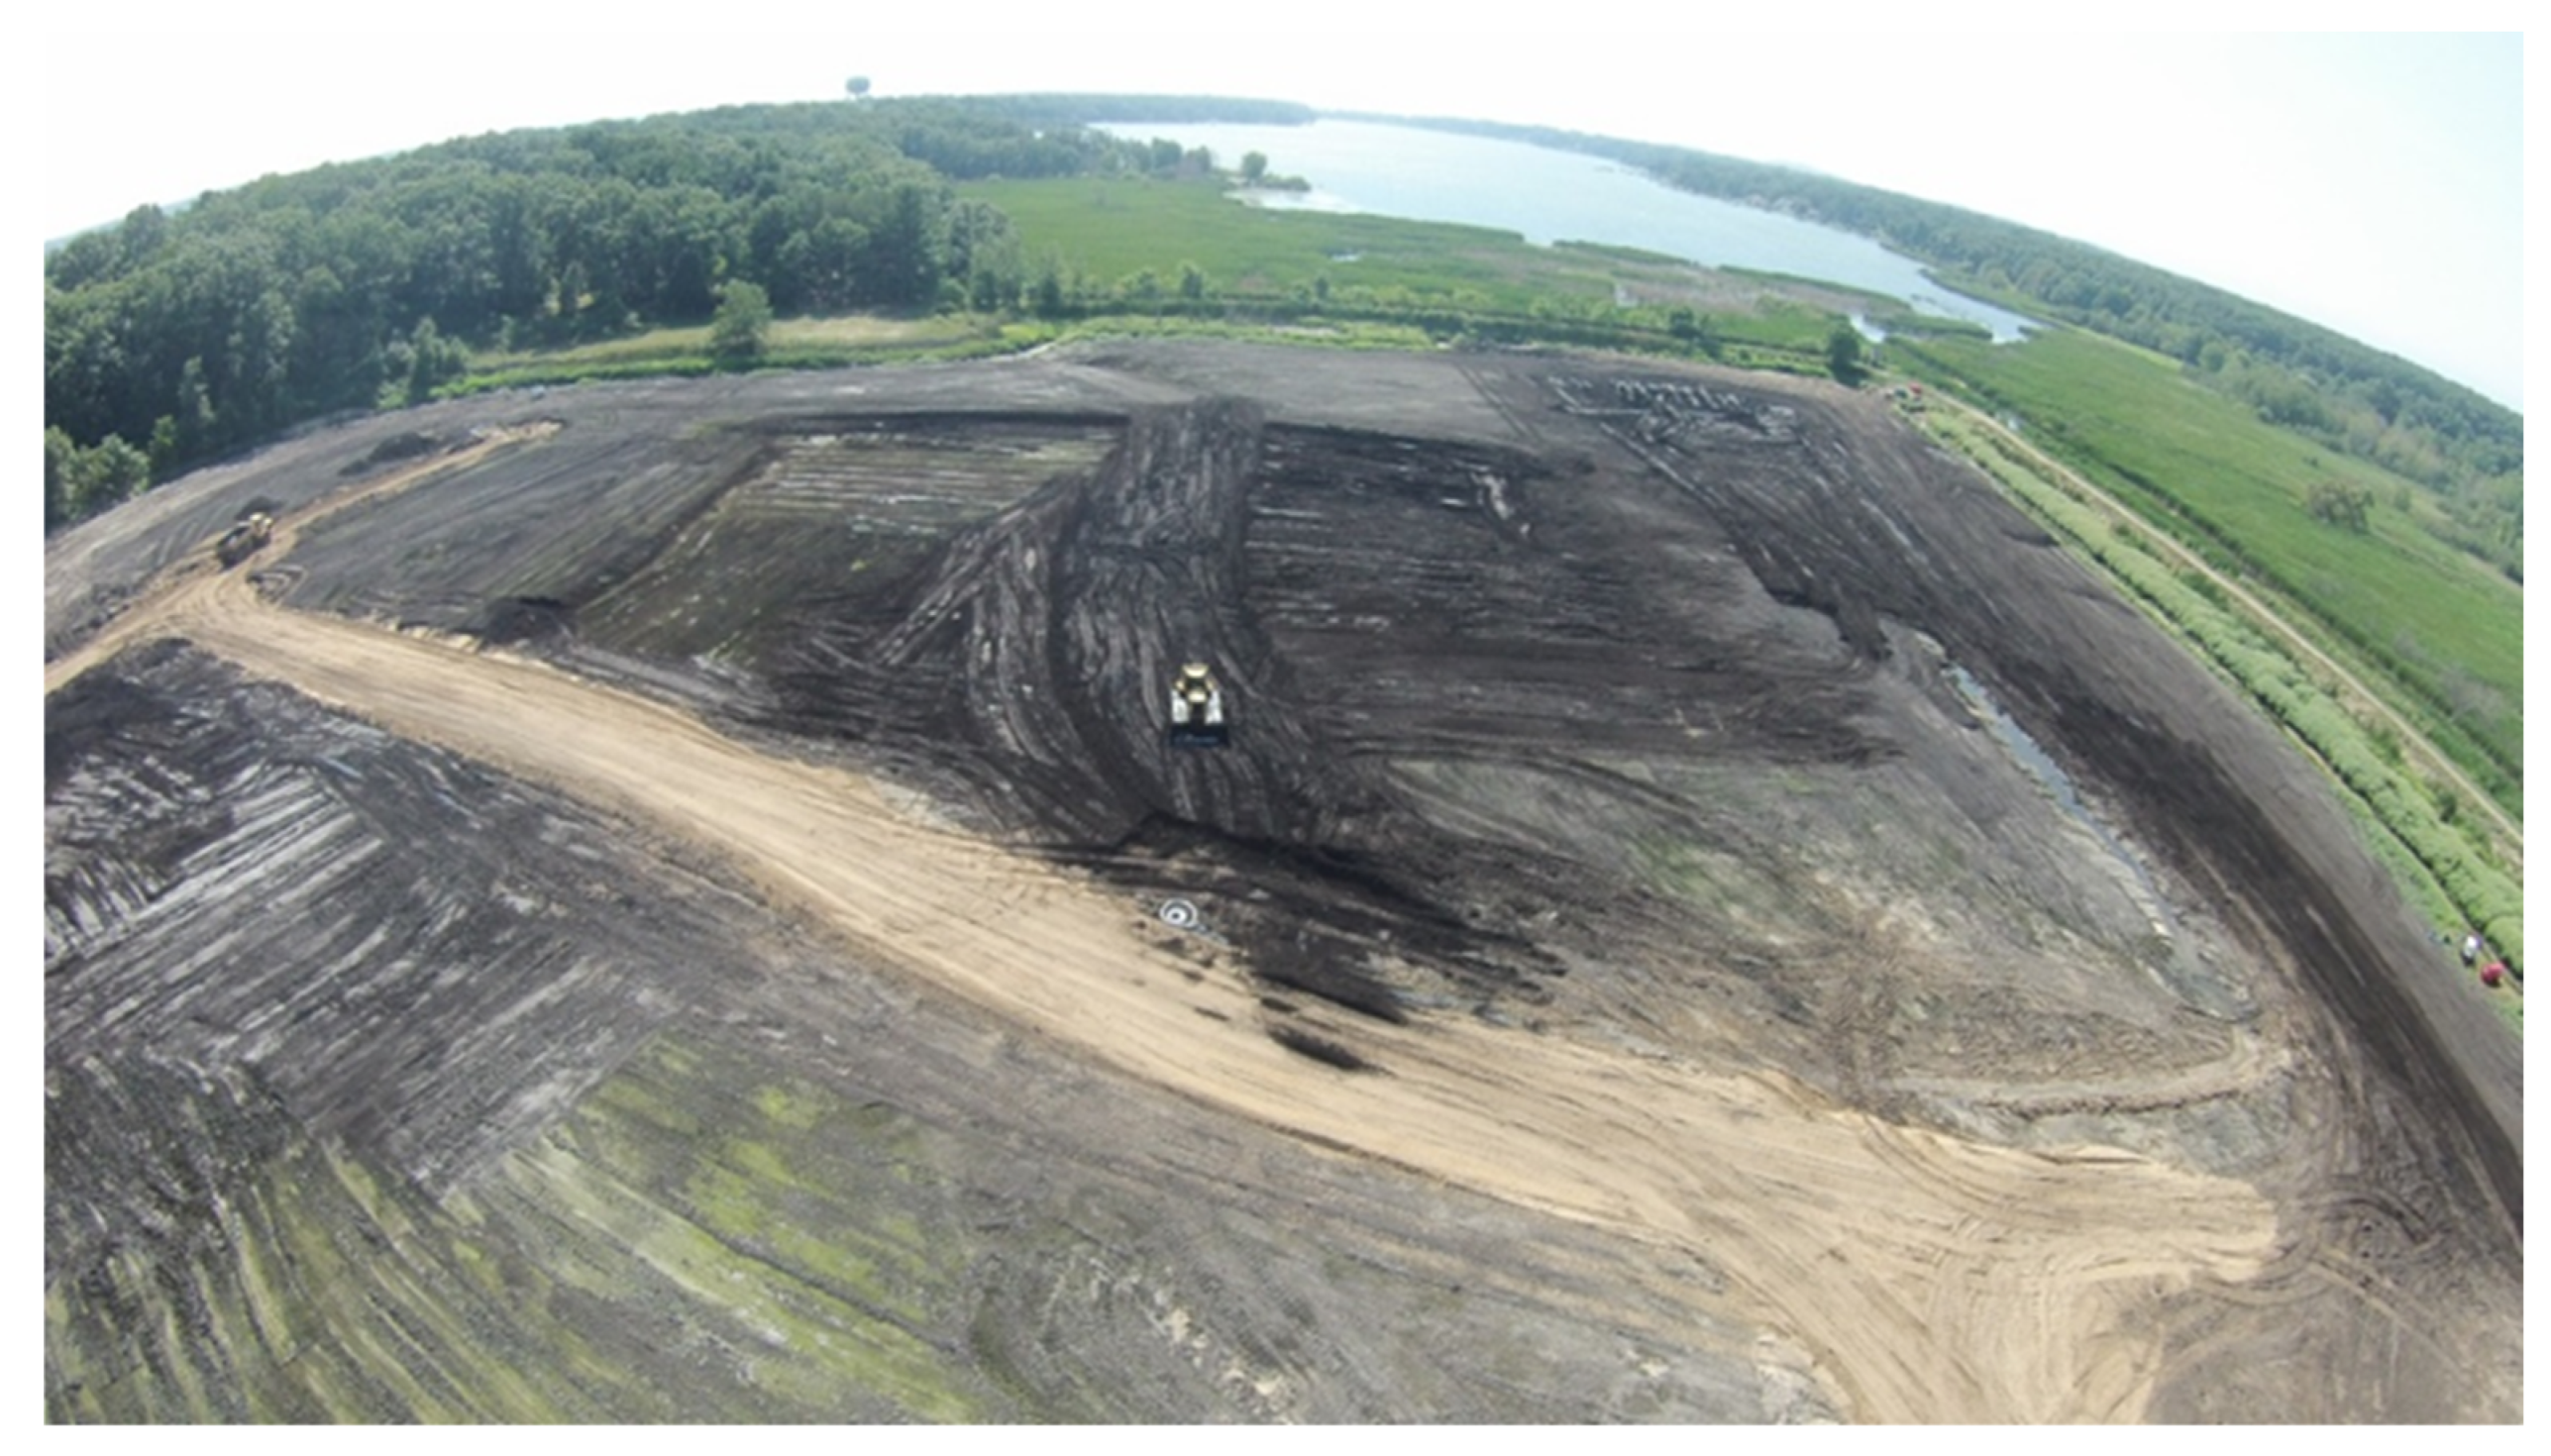
Aerial view of the de-watered west pond. Note Bear Lake in the background. Witham Road, which separates the west and east ponds, is located just out of the frame at the bottom of the photo. Bear Creek is located to the right, which can be traced by starting at Bear Lake and following it upstream and out of the frame halfway up the right side of the photo. Immediately to the left of Bear Creek is the grassy berm, which was removed for hydrologic connection Photo courtesy of Brian Majka, GEI Consultants.
Figure 2.
Aerial view of the de-watered west pond. Note Bear Lake in the background. Witham Road, which separates the west and east ponds, is located just out of the frame at the bottom of the photo. Bear Creek is located to the right, which can be traced by starting at Bear Lake and following it upstream and out of the frame halfway up the right side of the photo. Immediately to the left of Bear Creek is the grassy berm, which was removed for hydrologic connection Photo courtesy of Brian Majka, GEI Consultants.

Figure 3.
West pond TP (A) and SRP (B) site concentrations over 2014–2021 monitoring period, divided into restoration phases. Reference line at 30 μg/L represents TP target goal set by the Bear Lake TMDL [26]. Note the log scale y-axis.
Figure 3.
West pond TP (A) and SRP (B) site concentrations over 2014–2021 monitoring period, divided into restoration phases. Reference line at 30 μg/L represents TP target goal set by the Bear Lake TMDL [26]. Note the log scale y-axis.

Figure 4.
West pond phosphorus regressions of TP (A,B), SRP (C,D), and particulate P (E,F) at sites West 1 (A,C,E) and West 5 (B,D,F). Legend below E applies to all panels.
Figure 4.
West pond phosphorus regressions of TP (A,B), SRP (C,D), and particulate P (E,F) at sites West 1 (A,C,E) and West 5 (B,D,F). Legend below E applies to all panels.

Figure 5.
East pond TP (A) and SRP (B) site concentrations over 2014–2021 monitoring period, divided into restoration phases. Reference line at 30 μg/L represents TP target goal set by the Bear Lake TMDL [26]. Note the log scale y-axis.
Figure 5.
East pond TP (A) and SRP (B) site concentrations over 2014–2021 monitoring period, divided into restoration phases. Reference line at 30 μg/L represents TP target goal set by the Bear Lake TMDL [26]. Note the log scale y-axis.

Figure 6.
East pond phosphorus regressions of TP (A,B), SRP (C,D), and particulate P (E,F) at sites East 6 (A,C,E) and East 8 (B,D,F). Legend below E applies to all panels.
Figure 6.
East pond phosphorus regressions of TP (A,B), SRP (C,D), and particulate P (E,F) at sites East 6 (A,C,E) and East 8 (B,D,F). Legend below E applies to all panels.

Figure 7.
Bear Creek TP (A) and SRP (B) site concentrations over 2014–2021 monitoring period, divided into restoration phases. Reference line at 30 μg/L represents TP target goal set by the Bear Lake TMDL [26]. Note the log scale y-axis.
Figure 7.
Bear Creek TP (A) and SRP (B) site concentrations over 2014–2021 monitoring period, divided into restoration phases. Reference line at 30 μg/L represents TP target goal set by the Bear Lake TMDL [26]. Note the log scale y-axis.

Figure 8.
Bear Creek phosphorus regressions of TP (A,B), SRP (C,D), and particulate P (E,F) at upstream (A,C,E) and downstream (B,D,F) sites. Legend below E applies to all panels.
Figure 8.
Bear Creek phosphorus regressions of TP (A,B), SRP (C,D), and particulate P (E,F) at upstream (A,C,E) and downstream (B,D,F) sites. Legend below E applies to all panels.


Table 1.
West pond sites (1 and 5) pre- vs. post-restoration mean (±SD) general water quality statistical analysis results using paired t-tests (t) or Wilcoxon signed rank test (r), and Hedge’s g-value. For each comparison, n = 7 months (May–October 2020, April 2021). Positive g-values correspond to an increase in the water quality parameter when comparing pre-restoration to post-restoration; negative g-values correspond with decreases in the same manner. TP = total phosphorus; SRP = soluble reactive phosphorus; PartP = particulate P; Chl-a = lab-extracted chlorophyll a; DO = dissolved oxygen; SpCond = specific conductivity; ORP = oxidation–reduction potential; TDS = total dissolved solids.
| Variable | West 1 | West 5 | ||||||||
|---|---|---|---|---|---|---|---|---|---|---|
| 2014 Pre | 2021 Post | p | Test | g | 2014 Pre | 2021 Post | p | Test | g | |
| TP (µg/L) | 955 (316) | 18 (3) | <0.001 | t | −2.98 | 902 (254) | 19 (3) | <0.001 | t | −3.50 |
| SRP (µg/L) | 740 (314) | 3 (0) | <0.001 | t | −2.36 | 701 (273) | 3 (0) | <0.001 | t | −2.57 |
| PartP (µg/L) | 215 (58) | 15 (3) | <0.001 | t | −3.47 | 202 (79) | 16 (3) | <0.001 | t | −2.37 |
| Chl-a (µg/L) | 19.5 (15.5) | 8.2 (1.9) | 0.090 | t | −0.73 | 10.8 (13.1) | 6.8 (1.8) | 0.933 | r | −0.30 |
| Temp (°C) | 17.7 (5.3) | 18.0 (4.9) | 0.792 | t | 0.04 | 17.3 (5.4) | 18.0 (4.9) | 0.392 | t | 0.10 |
| DO (mg/L) | 8.6 (2.7) | 9.5 (1.2) | 0.247 | t | 0.31 | 7.5 (3.6) | 9.6 (1.3) | 0.089 | t | 0.55 |
| DO % sat | 90 (27) | 100 (11) | 0.255 | t | 0.35 | 77 (34) | 101 (12) | 0.067 | t | 0.67 |
| pH | 8.3 (0.8) | 7.8 (0.5) | 0.085 | t | −0.53 | 8.1 (0.8) | 7.9 (0.3) | 0.322 | t | −0.24 |
| SpCond (µS/cm) | 679 (81) | 359 (75) | <0.001 | t | −2.92 | 684 (78) | 359 (75) | <0.001 | t | −3.02 |
| ORP (mV) | 385 (27) | 345 (46) | <0.001 | t | −0.75 | 387 (25) | 344 (44) | 0.003 | t | −0.86 |
| TDS (g/L) | 0.442 (0.053) | 0.233 (0.049) | <0.001 | t | −2.91 | 0.445 (0.051) | 0.234 (0.049) | <0.001 | t | −3.00 |
| Turbidity (NTU) | 3 (3) | 2 (1) | 0.360 | t | −0.32 | 4 (3) | 2 (1) | 0.293 | t | −0.64 |
Table 2.
East pond sites’ (6 and 8) means (±SD) and pre- vs. post-restoration general water quality statistical analysis. For each comparison, n = 7 months (May–October 2020, April 2021). Positive g-values correspond to an increase in the water quality parameter when comparing pre-restoration to post-restoration; negative g-values correspond with decreases in the same manner. TP = total phosphorus; SRP = soluble reactive phosphorus; PartP = particulate P; Chl-a = lab-extracted chlorophyll a; DO = dissolved oxygen; SpCond = specific conductivity; ORP = oxidation–reduction potential; TDS = total dissolved solids.
| Variable | East 6 | East 8 | ||||||||
|---|---|---|---|---|---|---|---|---|---|---|
| 2014 Pre | 2021 Post | p | Test | g | 2014 Pre | 2021 Post | p | Test | g | |
| TP (µg/L) | 137 (74) | 22 (4) | 0.006 | t | −1.56 | 131 (72) | 18 (4) | 0.005 | t | −1.58 |
| SRP (µg/L) | 4 (3) | 3 (0) | 0.250 | t | −0.34 | 3 (0) | 4 (2) | 0.500 | r | 0.50 |
| PartP (µg/L) | 132 (72) | 19 (4) | 0.006 | t | −1.58 | 128 (72) | 15 (4) | 0.005 | t | −1.58 |
| Chl-a (µg/L) | 67.5 (60.6) | 6.7 (3.3) | 0.038 | t | −1.01 | 47.4 (28.4) | 3.9 (1.9) | 0.006 | t | −1.54 |
| Temp (°C) | 17.7 (5.5) | 16.7 (4.4) | 0.813 | r | −0.14 | 18.4 (5.2) | 16.7 (4.4) | 0.048 | t | −0.25 |
| DO (mg/L) | 11.1 (1.5) | 9.8 (1.2) | 0.050 | t | −0.68 | 11.4 (1.4) | 9.2 (1.0) | 0.001 | t | −1.29 |
| DO % sat | 116 (13) | 102 (17) | 0.008 | t | −0.66 | 121 (14) | 94 (11) | <0.001 | t | −1.53 |
| pH | 8.7 (0.4) | 7.8 (0.5) | 0.004 | t | −1.41 | 8.8 (0.3) | 7.6 (0.3) | <0.001 | t | −2.85 |
| SpCond (µS/cm) | 561 (40) | 365 (71) | <0.001 | t | −2.42 | 560 (41) | 366 (71) | 0.016 | r | −2.38 |
| ORP (mV) | 357 (31) | 358 (56) | 0.976 | t | 0.02 | 343 (48) | 363 (49) | 0.123 | t | 0.29 |
| TDS (g/L) | 0.365 (0.026) | 0.237 (0.047) | 0.016 | r | −2.40 | 0.364 (0.027) | 0.238 (0.046) | <0.001 | t | −2.38 |
| Turbidity (NTU) | 27 (27) | 2 (1) | 0.055 | t | −0.93 | 25 (20) | 3 (1) | 0.026 | t | −1.11 |
Table 3.
Post-restoration (n = 7 months; May–October 2020, April 2021) upstream vs. downstream mean (±SD) water quality values. Statistical analyses used paired t-tests and Hedge’s g-value. Positive g-values correspond to an increase in the water quality parameter when moving from upstream to downstream. TP = total phosphorus; SRP = soluble reactive phosphorus; PartP = particulate P; Chl-a = lab-extracted chlorophyll a; DO = dissolved oxygen; SpCond = specific conductivity; ORP = oxidation–reduction potential; TDS = total dissolved solids.
| Variable | Upstream | Downstream | p | g |
|---|---|---|---|---|
| TP (µg/L) | 29 (14) | 18 (6) | 0.109 | −0.73 |
| SRP (µg/L) | 9 (3) | 3 (0) | 0.003 | −2.01 |
| PartP (µg/L) | 21 (13) | 16 (6) | 0.392 | −0.35 |
| Chl-a (µg/L) | 2.5 (1.6) | 7.2 (2.6) | 0.007 | 1.55 |
| Temp (°C) | 13.7 (3.1) | 18.1 (5.2) | 0.003 | 0.73 |
| DO (mg/L) | 8.6 (1.5) | 8.5 (1.2) | 0.711 | −0.05 |
| DO % sat | 83 (11) | 89 (12) | 0.252 | 0.37 |
| pH | 7.5 (0.2) | 7.7 (0.5) | 0.227 | 0.37 |
| SpCond (µS/cm) | 370 (52) | 363 (74) | 0.462 | −0.08 |
| ORP (mV) | 362 (49) | 351 (50) | 0.167 | −0.16 |
| TDS (g/L) | 0.241 (0.034) | 0.236 (0.048) | 0.472 | −0.09 |
| Turbidity (NTU) | 6 (4) | 2 (2) | 0.081 | −0.90 |
Table 4.
Pre- vs. post-restoration surface water quality values for Bear Lake. Data are from spring sampling events (March 2016 vs. April 2020). TP = total phosphorus; SRP = soluble reactive phosphorus; Chl-a = lab-extracted chlorophyll a; DO = dissolved oxygen; SpCond = specific conductivity.
Table 4.
Pre- vs. post-restoration surface water quality values for Bear Lake. Data are from spring sampling events (March 2016 vs. April 2020). TP = total phosphorus; SRP = soluble reactive phosphorus; Chl-a = lab-extracted chlorophyll a; DO = dissolved oxygen; SpCond = specific conductivity.
| Variable | Pre-Restoration | Post-Restoration |
|---|---|---|
| TP (µg/L) | 67.4 | 23.7 |
| SRP (µg/L) | 9.6 | 2.5 |
| Chl-a (µg/L) | 4.3 | 10.1 |
| Temp (°C) | 9.1 | 12.0 |
| DO (mg/L) | 8.9 | 10.9 |
| SpCond (µS/cm) | 310 | 409 |
| Turbidity (NTU) | 16.1 | 12.8 |
Publisher’s Note: MDPI stays neutral with regard to jurisdictional claims in published maps and institutional affiliations. |
© 2022 by the authors. Licensee MDPI, Basel, Switzerland. This article is an open access article distributed under the terms and conditions of the Creative Commons Attribution (CC BY) license (https://creativecommons.org/licenses/by/4.0/).
Share and Cite
MDPI and ACS Style
Hassett, M.C.; Steinman, A.D. Wetland Restoration through Excavation: Sediment Removal Results in Dramatic Water Quality Improvement. Land 2022, 11, 1559. https://0-doi-org.brum.beds.ac.uk/10.3390/land11091559
AMA Style
Hassett MC, Steinman AD. Wetland Restoration through Excavation: Sediment Removal Results in Dramatic Water Quality Improvement. Land. 2022; 11(9):1559. https://0-doi-org.brum.beds.ac.uk/10.3390/land11091559
Chicago/Turabian StyleHassett, Michael C., and Alan D. Steinman. 2022. "Wetland Restoration through Excavation: Sediment Removal Results in Dramatic Water Quality Improvement" Land 11, no. 9: 1559. https://0-doi-org.brum.beds.ac.uk/10.3390/land11091559
Note that from the first issue of 2016, this journal uses article numbers instead of page numbers. See further details here.