Article

Effects of Grassland Afforestation on Water Yield in Basins of Uruguay: A Spatio-Temporal Analysis of Historical Trends Using Remote Sensing and Field Measurements

1
Programa Académico de Ingeniería Ambiental, Universidad de Huánuco, Huánuco, Peru
2
Civil Works and Geology Department, Catholic University of Temuco, Temuco 4780000, Chile
3
Centro de Investigación de Medicina en Altura y Medio Ambiente, Facultad de Medicina Humana, Universidad Nacional del Centro del Perú, Huancayo 12006, Peru
4
Grupo de Estudios Ambientales, Instituto de Matemática Aplicada San Luis (IMASL), Universidad Nacional de San Luis (UNSL) y Consejo Nacional de Investigaciones Científicas y Técnicas (CONICET), San Luis 5700, Argentina
5
Cátedra de Climatología, Facultad de Ciencias Agropecuarias, Universidad Nacional de Entre Ríos (UNER), Oro Verde 3100, Argentina
*
Author to whom correspondence should be addressed.
Submission received: 13 December 2022 / Revised: 26 December 2022 / Accepted: 28 December 2022 / Published: 6 January 2023
(This article belongs to the Special Issue Impacts of Land Use and Land Cover Change on Hydrological Systems)

Abstract

:
The afforestation of grasslands can alter different ecosystems’ functional processes; it affects the water balance due to the high water demand, caused by the increased productivity of the plantations, increase evapotranspiration, and reduces base flow of the basins. In Uruguay, there are two scenarios; the headwaters of the Tacuarembó River, where the area of plantations has increased for more than 30 years, and the headwaters of the Río Negro, where mainly grasslands are preserved without significant changes. This article evaluates the dynamics of grassland afforestation in the two basins, through the spatial and temporal analysis of historical trends with the use of remote sensors and considering the effect on water yield through field measurements, in the period 1984–2014. The spatial analysis shows an increase in the area of the forested basin, and the temporal analysis shows a reduction in the runoff coefficient due to the effect of the afforestation of pastures. Therefore, the movement from grassland to forest plantations reduces water flow considerably; this was identified through base flow measurements in the field with the integration of remote sensors. This allowed the observation of the relevant changes in the two basins studied, which may be related to climate change and human activities.

1. Introduction

1.1. General Context

Changes in vegetation cover, such as the afforestation of grasslands, can alter different functional ecosystem processes. [1]. These alterations can influence climatic and hydrological stability and alter the connection between the atmosphere, soil, and humidity, with direct repercussions on productivity and evapotranspiration [2]. Evapotranspiration (ET) is expected to increase with higher plant productivity, due to the stomatal connection between the flow of CO2 and water vapor [3]. Forestations with fast-growing species (e.g., Pinus sp., Eucalyptus sp.) are generally more productive than grasslands [4]; therefore, an increase in ET would be expected, with a consequent reduction in runoff and drainage, which is the main source of water flow in the basins [5,6,7].
Occasionally, the afforestation of pastures advances in territories that are limited for agricultural production, due to problems regarding soil quality and drainage [8]. Forest systems present high water consumption, largely due to the development of the deep root system in the first years of development and high levels of leaf area [9]. It is also important to highlight the lower stomatal controls on water loss through transpiration [10], the generation of lower albedo due to the high photosynthetic activity, and the efficient use of light [11]. These effects are more frequent in Eucalyptus than in Pinus, as they are fast-growing species and the most used in the forestry industry [12], observing an increase in the primary productivity of the ecosystem that they replace. The loss of water, due to transpiration and an increase in temperature and humidity, is also of consideration, directly transferring precipitation water to the atmosphere, and restricting the arrival of water towards the base flow of the basin [13].
Forest plantations could have a consequence on the water balance, affecting the two main paths of the normal flow of precipitation, evapotranspiration (ET) and liquid flow from the surface; this was studied, for example, by Wang et al. [14], and Shen et al. [15]. Since precipitation water is the main source of water for ecosystems, some of the other components of this balance can also be altered. Within the ET flow, we can mention the interception (I), which is the water that remains on the surface until it evaporates, soil evaporation (E), and stomatal transpiration of vegetation (T). In the liquid flow group, we can mention surface runoff (R), which is the water that moves laterally through the soil, deep drainage water (D) for aquifer recharge, and soil water variation (∆S). All of them are great on the vegetal cover, being able to significantly modify the water patterns of the ecosystems [16].
The water yield of a basin is defined as the amount of water discharged in a given time (base flow), subject to the type of soil, topography, and the type of vegetation cover [17]. Many studies report that afforestation in grasslands has a direct impact on annual water yield [6,18], reporting that, in the first years, the reduction is 15%, with variations according to species; here, Pinus and Eucalyptus present a greater reduction: a total of 30% to 50%, respectively [19,20]. Likewise, afforestation can favor salinization, by intensifying the groundwater discharge with groundwater that is not necessarily salty [21,22]. Eutrophication by cyanobacteria can also occur in limbic waters, due to the accumulation of phosphorus and nitrogen [23,24]. Soil acidification can even occur, especially in plantations of Eucalyptus sp., via the excessive absorption of calcium from trees [25,26]. In addition, afforestation can increase the dangers of fires, invasion of nearby ecosystems, and alteration of biodiversity [27,28]. Native forest species obey the size of the occupied space and have a positive impact on ecosystems [29]. In research carried out in southern Chile, by increasing the cover of a native species by 10%, the runoff flow is reduced in a range of 3% to 14%, with less impact on water and a positive impact on soil recovery degraded [30,31]. In the same way, native and deciduous species contribute to infiltration, aquifer recharge, flood, and flood regulation, decrease the probability of soil erosion; although the base flow decreases, over time it stabilizes and increases [32].
Remote sensing is making it possible to study the spatial and temporal dynamics of vegetation in different geographies and periods. The normalized vegetation index, for example, NDVI, makes it easier to observe seasonal changes in phenology, productivity, and the degradation of vegetation cover in the long term [33]. Likewise, it makes it easier to observe the relationship with the hydro-climatic changes that have been happening, associated with precipitation, evapotranspiration, temperature, and water yield; these are key elements of the water balance of different ecosystems and plant covers [34,35,36]. The study of the vegetation–hydrology relationship, through the NDVI index and water yield, via the runoff flow, is making it possible to observe the effects of afforestation and deforestation upon the reduction in water in many basins of different ecosystems [37,38,39,40]. This vegetation–hydrology relationship has been little addressed in the realities of the southern hemisphere from the perspective of spatial and temporal dynamics, and studies using remote sensing are very scarce.

1.2. Aim of Article

In the Oriental Republic of Uruguay, forestry has been developing for more than 30 years [8]. This economic impulse, promoted by the government, has increased forest plantations on pastures, reaching more than 1 million ha. in 2013 and with a projection of reaching 2 million ha. by 2030. All of this is to produce pulp for the paper industry [27]. The sub-basin of the Tacuarembó River, precisely the headwaters of the basin, is one of the areas that have the most forested grasslands; meanwhile, the upper part of the Río Negro basin still maintains its grasslands, with very few forest plantations and modifications in their cover. This situation poses a propitious scenario to evaluate the effects of afforestation on the hydrological dynamics of the basins of the region. The differences in the effects of afforestation in these two sub-basins are widely perceived by local people and are controversial in the scientific community; this is especially the case when it comes to reducing water yield and its negative effects, having profound and notorious social repercussions [41,42]. Afforestation is expected to decrease water yield, and the mean annual flow in the forested basin is expected to be lower than in the basin with pastures for livestock use.
Under these circumstances, and to clarify the doubts generated by the problem, this article proposes, as its main objective, to carry out an analysis of the spatial and temporal dynamics of two basins located in the Oriental Republic of Uruguay (Tacuarembó and Río Negro); this study uses baseflow measurements from over 31 years and remote observations. Both basins differ in their varying percentages of forested areas with fast-growing exotic species (mainly Eucalyptus). The specific objectives of this study are the following:
  i.
To analyze the effect of changes in vegetation cover (natural grassland vs. afforestation) on the temporal dynamics of water yield and the NDVI index.
 ii.
To characterize the water yield (through daily flow measurements), its seasonal and inter-annual dynamics, and its trends in response to rain in the two basins under study.
iii.
To analyze the spatial dynamics of the forested area through the supervised classification of Landsat satellite images.
To address these objectives, an approach will be used by combining field hydrological data and long-term remote sensing data from two watersheds with marked differences, particularly in their degree of forestation over the grassland.

2. Methodology

2.1. Study Zone

The study area is located in the northeast of the Oriental Republic of Uruguay, specifically in two basin headspaces. The first is the upper part of the Tacuarembó River Basin and the second is the upper part of the Río Negro Basin (See Figure 1).
The head of the Tacuarembó River basin is located between the departments of Rivera and Tacuarembó (Figure 1). It has a temperate subtropical climate, average annual rainfall of 1484 mm, with high peaks from October to May. The average annual temperature is 18.2 °C with a considerable increase in December, January, and February [43]. It presents an elevation that is from 88 to 391 masl, with a slope of 7.6% on average. It presents a relatively rugged relief, with flat spaces and slightly pronounced slopes predominating, with protruding rocky mounds of basalt and sandstone, with Luvisol and Acrisol soils, with a sandy loam texture, with the soil of low fertility [44], with the risk of erosion and with infiltration properties that help in the recharge of the aquifer [45]. The predominant vegetation cover is natural grasslands subjected to extensive cattle grazing; and for several decades, forest plantations have been increasing, with a predominance of Eucalyptus grandis, Pinus elliottii, and Pinus taeda, located mainly in the northeast of the upper part of Basin.
The upper Río Negro basin begins in the state of Río Grande do Sul in Brazil, running from northeast to southeast in the interior of Uruguay and through the departments of Cerro Largo, Tacuarembó, and Rivera (Figure 1). It is one of the main contributors to the water network of all of Uruguay. The average annual precipitation is 1330 mm with high peaks in October–May. The average annual temperature is 19 °C, with a considerable increase in December, January, and February [46]. It presents an elevation that is from 98 to 397 masl, with a slope of 4.7% (Table 1). It is characterized by the predominance of soils and natural grasslands used for extensive livestock, followed by the planting of rice, wheat, soybeans, and some forest plantations, on mostly sedimentary soils.
The delimitation of the study areas was carried out with the help of the Digital Elevation Model (DEM), with a spatial resolution of 30 m obtained from the Advanced Spaceborne Thermal Emission and Reflection Radiometer (ASTER) of the Global Digital Elevation Model. Version 3 (GDEM 003) is available at: https://asterweb.jpl.nasa.gov/gdem.asp (Accessed on 14 March 2022). The upper basin of the Tacuarembó River starts from the base flow monitoring station at Villa Ansina–Paso del Borracho (Lat. 31.87583; Long. −55.47111), with a total delimited area of 6605 km2. The upper Río Negro Basin starts from the Paso Aguiar station (Lat. −32.28611; Long. −54.83111), with a total delimited area of 8002 km2 (See Figure 1).
The specific characteristics of each basin are mentioned in Table 1.
The climatic data and characteristics of the evaluated basins in Table 1 were obtained from the Informe del Plan de Monitoreo del Río Tacuarembó carried out by Dirección Nacional de Medio Ambiente [47] and the Informe de Monitoreo de Calidad del Agua Río Negro, executed by the Ministerio de Vivienda Ordenamiento Territorial y Medio Ambiente [48].

2.2. Data Collection

DEM was used to delimit the hydrographic basins under study. Data collection was carried out, taking into account two environmental elements under study. The first contains vegetation data using the NDVI index, and the second group contains data for water analysis, base flow monitoring, precipitation, runoff flow calculation, and runoff coefficient: precipitation (See Figure 2).

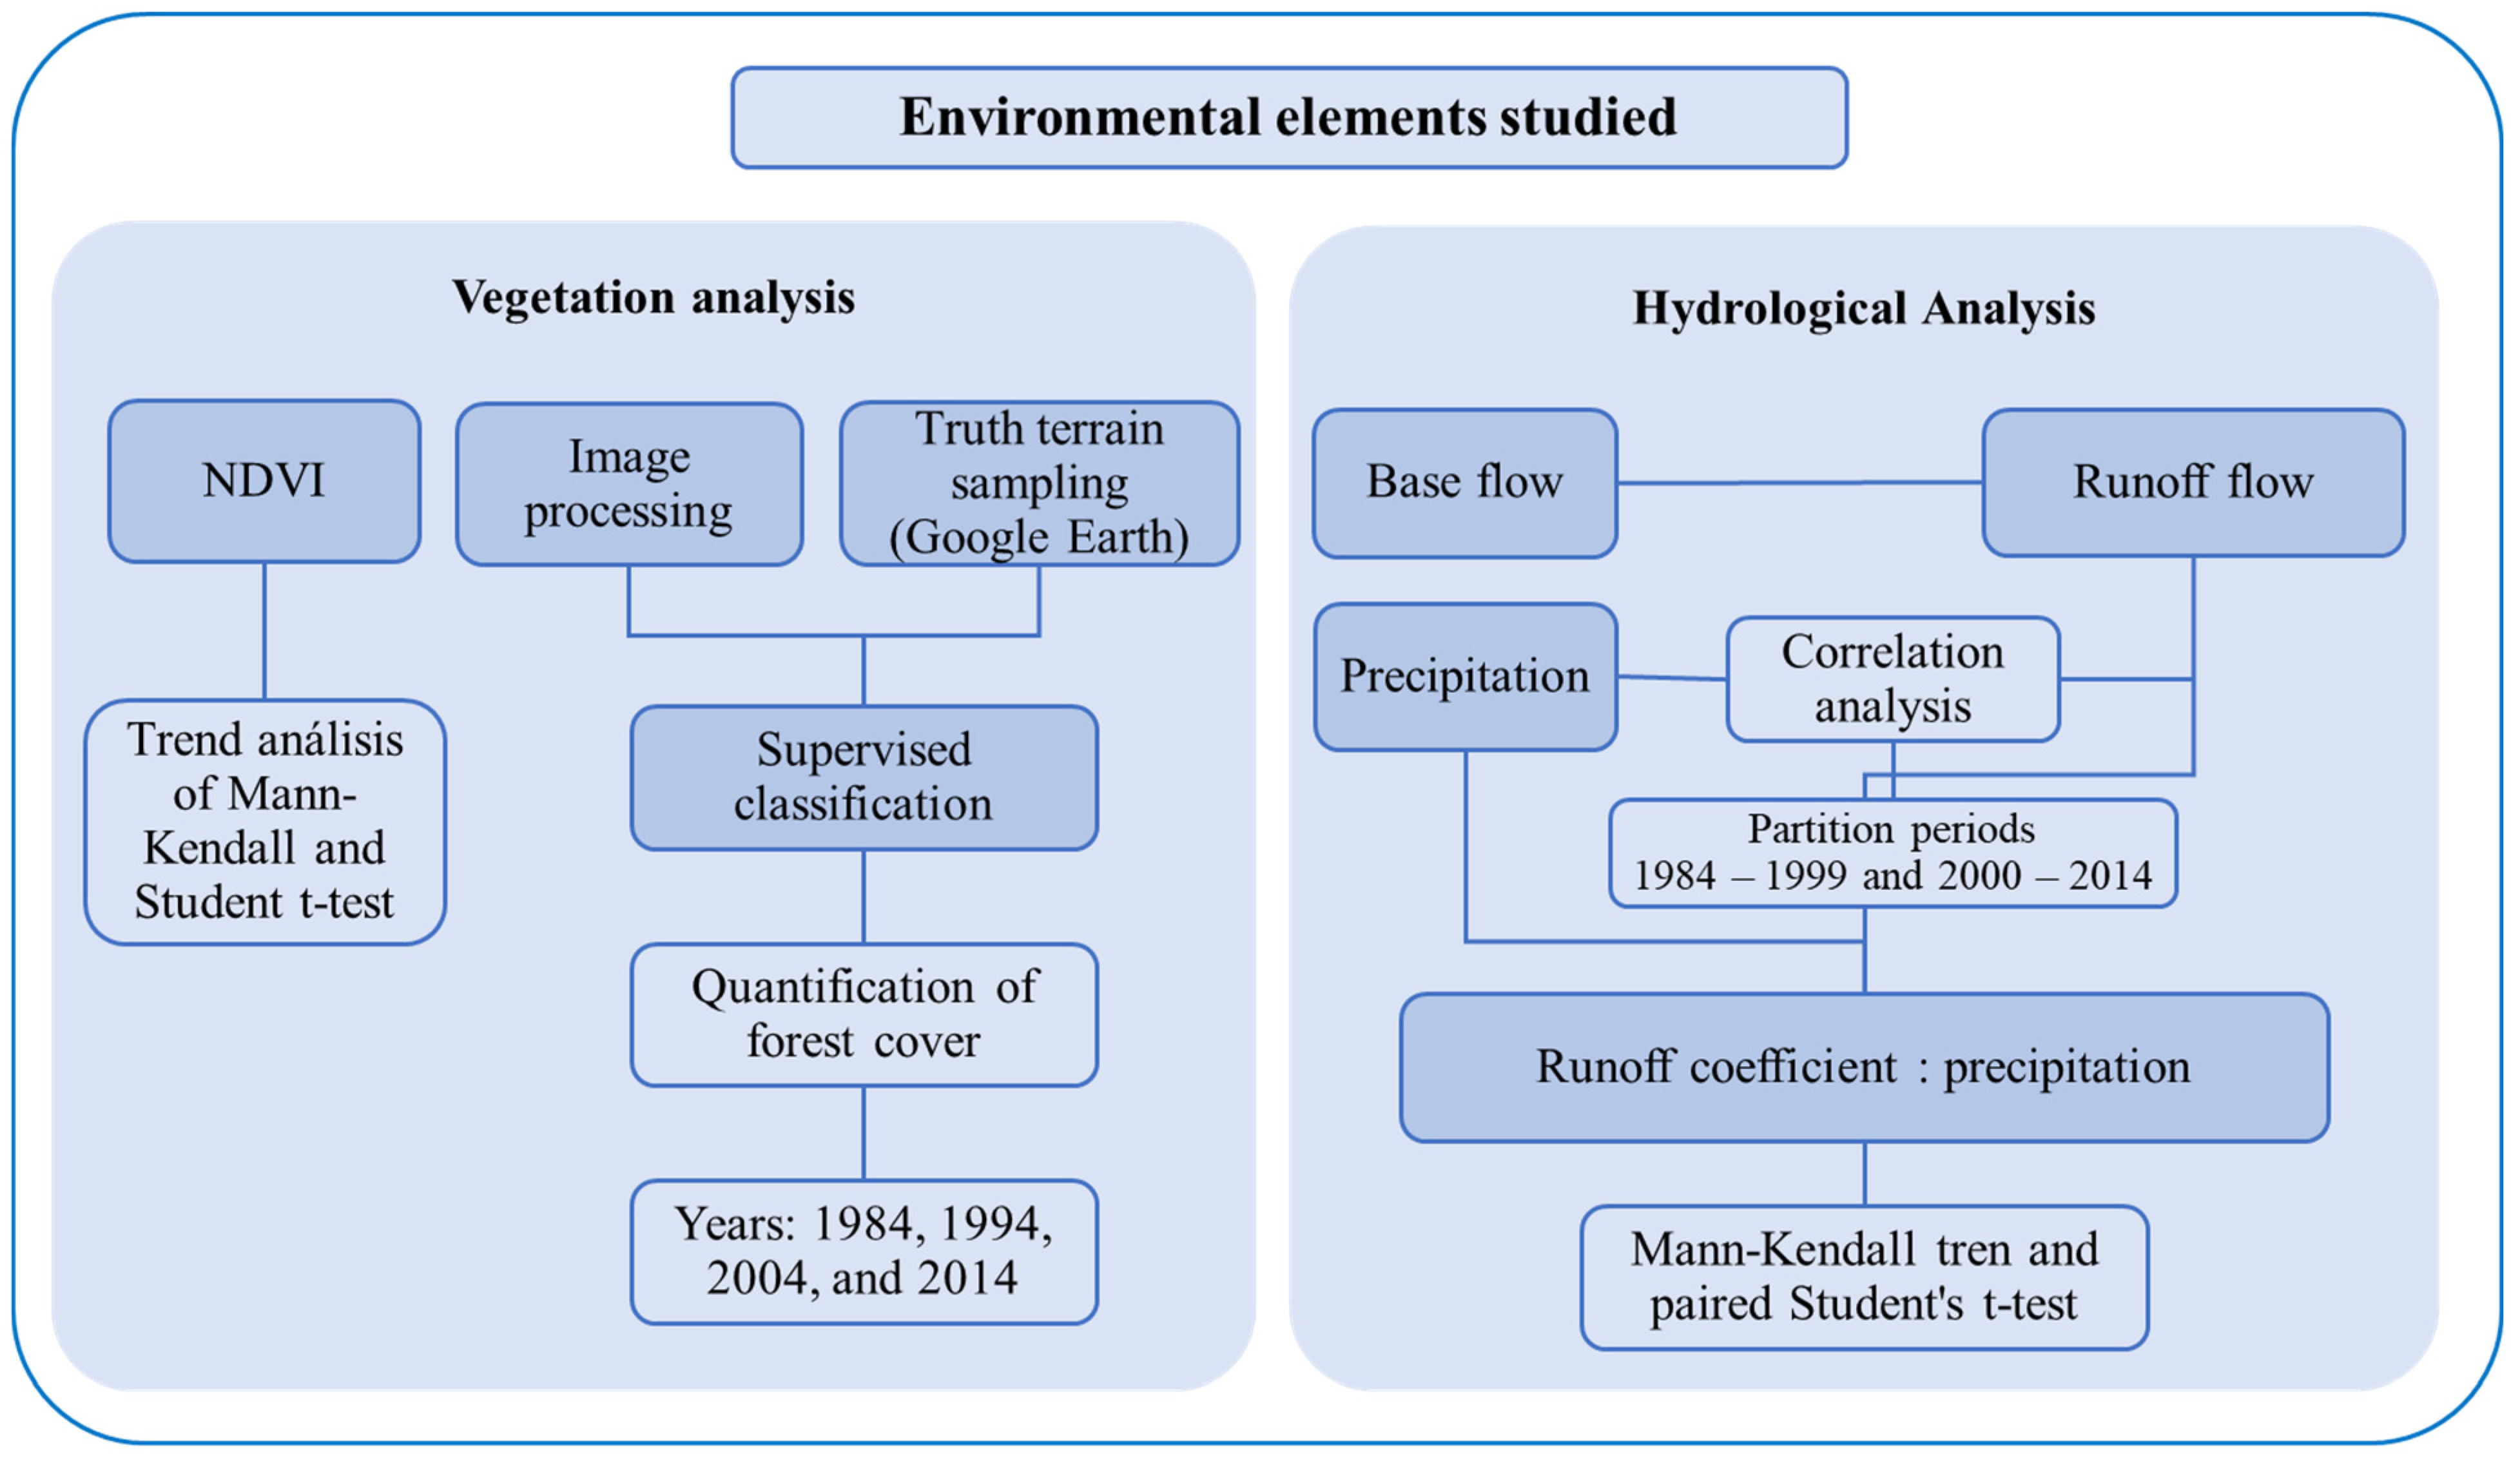
2.3. Analysis of Vegetation and Determination of the Forested Area

Data from the Normalized Difference Vegetation Index (NDVI) from The Global Inventory Modeling and Mapping Study (GIMMS) were used, from the Advanced Very High-Resolution Radiometer (AVHRR) sensor aboard the National Oceanic and Atmospheric Administration (NOAA) satellite. These data have a pixel of 8 km, with a temporal resolution of 15 days at every start and half of the month. This database has the advantage of having a fairly long time series, which can look at NDVI change trends more completely than other products. In addition, it contains two monthly datasets, made up of daily data recorded by the different NOAA satellites. By allowing the adequate filtering of unfavorable atmospheric conditions, a more consistent final product is obtained. This database source was obtained from the Google Earth Engine (available at: https://developers.google.com/earth-gine/datasets/catalog/NASA_GIMMS_3GV0#description; Accessed on 22 March 2022), expressed as an indicator of the dynamics of the vegetation in terms of its productivity and photosynthetic activity in the period of the years 1984–2014. Higher values correspond to vegetation with high density and high photosynthetic activity; conversely, low values correspond to coverages other than vegetation (e.g., bodies of water, bare soil, snow, rocks, etc.). NDVI values greater than 0.05 were taken into account, as they may already contain information on the presence of vegetation [39]. The filtering of extremely high values and negative values, originating from atmospheric anomalies and the presence of clouds, was carried out, replacing them with average values between the values before and after the day of recording. In the case where more than two values were absent, an extrapolation of the data was made using a linear forecast, a function contained in the Excel spreadsheet.
The forested surface of the years 1984, 1994, 2004, and 2014, was determined by supervised classification. This was evaluated via historical images from Landsat 5 TM satellites (Thematic Mapper), using seven bands; these included the bands of the spectral indices, the NDVI index, and the Normalized Difference Water Index (NDWI) for the years 1984, 1994, 2004. For the year 2014, Landsat 8 OLI (Operational Land Imager) was used with bands from 1 to 7. In the same way, the bands of the NDVI and NDWI spectral indices were included. During the process, the images of the entire evaluated year were used: 7 for 1984, 15 for 1994, 22 for Landsat 5 images for the year 2004. For the year 2014, 23 Landsat 8 images were taken. Filters were used to only obtain images with 50% cloud. A shadow and cloud mask was run to obtain clean pixels, taking advantage of Google Earth Engine coding, which allows working at the pixel level. Subsequently, a median of the pixels of all the images and in all the bands was calculated; to later obtain a single image with all its bands, clean and free of shadows and clouds, the NDVI and NDWI spectral indices were added.
During the classification, 4 main covers were distinguished: (i) forest cover, (ii) grasslands, (iii) bodies of water, and (iv) wetlands. The other covers such as crops, urban areas, and bare soils were considered as part of the grasslands because they were not the object of analysis in this study. Then, 30-pixel samples were taken for each coverage, based on the visualization of the RGB images. The Random Forest classification algorithm was used in the classification. For validation and training, it was taken with a 70% and 30% proportion of data, respectively, taking Google Earth images as field truth. In the estimation of the precision, the confusion matrix, and the percentage of the Producer’s Precision (PA) were used, where values with precision greater than 90% were minimally accepted. The entire process of obtaining, evaluating, and analyzing the images used the Google Earth Engine platform. Finally, the mapping and quantification of the coverage of the forested area were carried out using the unique values report tool of the free geographic information system software Qgis version 3.16 (https://qgis.org/en/site/forusers/visualchangelog316/index.html; Accessed on 22 March 2022) Hannover.
To be more exact in the estimation, mainly of forest cover, an operation of maximum values was carried out to cover places that were afforested and that were later harvested. For this, the reclassification of the supervised classification raster layer was carried out, providing a value of 1 for all the forest cover and a value of 0 for the rest of the covers. This was performed considering, for the year 1994, the maximum value of 1984 and 1994; for 2004, the maximum values of the years 1984, 1994, and 2004; and, for 2014, the maximum values of the years 1984, 1994, 2004, and 2014. The coverage area discount was made for grasslands, where bare soils were grouped.
In the visualization of the distribution of the vegetation, the combination of the RGB bands 5–6–4 of Landsat 5 was used for the years 1984, 1994, and 2004; for the year 2014, it was made by combining RGB 4–5–3 bands from Landsat 8.

2.4. Hydrological Analysis

The water data used come from daily average base flow data from 1984 to 2014, from the hydrological monitoring stations of Paso del Borracho for the Tacuarembó Basin and Paso Aguiar for the Rio Negro Basin, from the National Directorate of Uruguayan Water (DINAGUA) https://www.ambiente.gub.uy/SIH-JSF/paginas/visualizador/visualizador.xhtml (Accessed on 11 November 2021). These data are very important because they represent the output of water to the basin’s water system, where the quantity monitored depends on the type of cover, upstream of the basin. It is important to understand the hydrological characteristics of the basin, the temporal variations, and changes or alterations in the water regime of the basin [37]. Data from monthly and annual averages, and an extreme data filter, were used. Some missing data were filled in by averaging the upper and lower data. In the case where there were more than three missing data, interpolation was performed using a linear forecast, a function contained in the Excel spreadsheet.
Precipitation data were obtained from the CHIRPS (Climate Hazards Group Infrared Precipitation with Station) database; (available on Google Earth Engine: https://developers.google.com/earth-engine/datasets/catalog/UCSB-CHG_CHIRPS_DAILY; Accessed on 22 March 2021). These databases have a spatial resolution of 0.05°, an area of approximately 5.5 km, and a daily temporal resolution; they are available from 1981 to the present [49]. The validation of the CHIRPS satellite data builds on previous studies, where there is a good correlation with rain gauge data for stations in the study region [50].
The data for base flow and water yield allowed us to obtain the data for the surface runoff and the average daily runoff flow (CE), expressed in millimeters (mm); this is defined as the excess of water that did not infiltrate and was displaced towards the channels. This was determined by the following formula:
E = (Q ∗ T)/(1000 ∗ A)
where:
E = Drainage flow (mm)
Q = Base flow m3/second
T = time in seconds/day
A = Basin area km2.
Likewise, data on precipitation and runoff flow were used to generate data on the proportion of the surface runoff coefficient, defined as the proportion of precipitation that was transformed into runoff flow [51].

2.5. Analysis of Data

An interannual time series analysis of the average value of the historical NDVI index, the NDVI difference to determine separability and the surface runoff coefficient for the period 1984–2014 in both basins was carried out. For the time series, the Mann–Kendall test was performed to estimate the significance of the trend. The determination coefficient analysis was also carried out with R2, accompanied by the value of the slope. In addition, the paired Student t-test was performed to determine the significance of the differences in the time series between both basins. Likewise, the simple linear regression analysis was carried out to evaluate the coefficient of determination and to evaluate the variation in the model generated between the annual surface runoff and the accumulated annual precipitation with all the data; another similar analysis was performed, partitioning the data into two periods of time (1984–1999 and 2000–2014). This was to observe the alteration of the runoff flow due to the increase in vegetation, which is a function of precipitation [52,53]. All analyses were performed using MS Excel software, R Studio software, and Statgraphics Centurion 19 software.

3. Results

3.1. Seasonal Dynamics of NDVI Index, Precipitation, and Runoff Flow

The monthly distribution of the NDVI index data, as part of the monitoring of the vegetation and precipitation, and as part of the hydrological income, provides details of the state of each basin in the period 1989–2014. In the NDVI index dynamics, in both basins, a pronounced seasonal behavior in the vegetation is observed. The highest values are between October and April. The maximum average values are found in November, with 0.65 and 0.63, and the minimum values are in July with 0.51 and 0.49 (Tacuarembó and Río Negro Basin, respectively). When performing the paired Student t-test, evidence of significant statistical differences between both basins (p < 0.001) was found; that is, both basins are very different due to changes in vegetation cover (Figure 3a).
Unlike the seasonal pattern of the NDVI index, in precipitation, both basins showed relatively constant values throughout the year, with few pronounced seasonal variations (Figure 3b). The vast majority of rainfall occurs between October and April (62% of annual rainfall). The maximum average precipitation occurs in April, with averages between 131 and 141 mm, and the minimum in August, with average values of 93 and 77 mm (Río Negro and Tacuarembó Basins, respectively). Likewise, when performing the paired Student t-test (p > 0.05), there are no significant differences between the two basins; that is, the precipitation in both basins is similar.
The monthly runoff flow (RF) in both basins showed a greater seasonality than the precipitation. The RF of both basins is statistically different when performing the paired Student t-test (p < 0.001; Figure 3c). The maximum RF of the Tacuarembó Basin occurs in May and June, with values of 75.02 and 74.73 mm, respectively; the minimum average RF is in January at 23.49 mm. While in the Rio Negro basin the maximum RF occurs in June and July, with values of 60.38 and 58.69 mm, respectively, the minimum average flow occurs in January with 16.49 mm. In both basins, when analyzing the coefficient of determination between precipitation and RF, it is observed that the best values of R2 are found in the second month (Tacuarembó R2 = 0.57, Río Negro R2 = 0.56); that is, the precipitation water takes 2 months to form part of the RF in draining (Figure 3c).

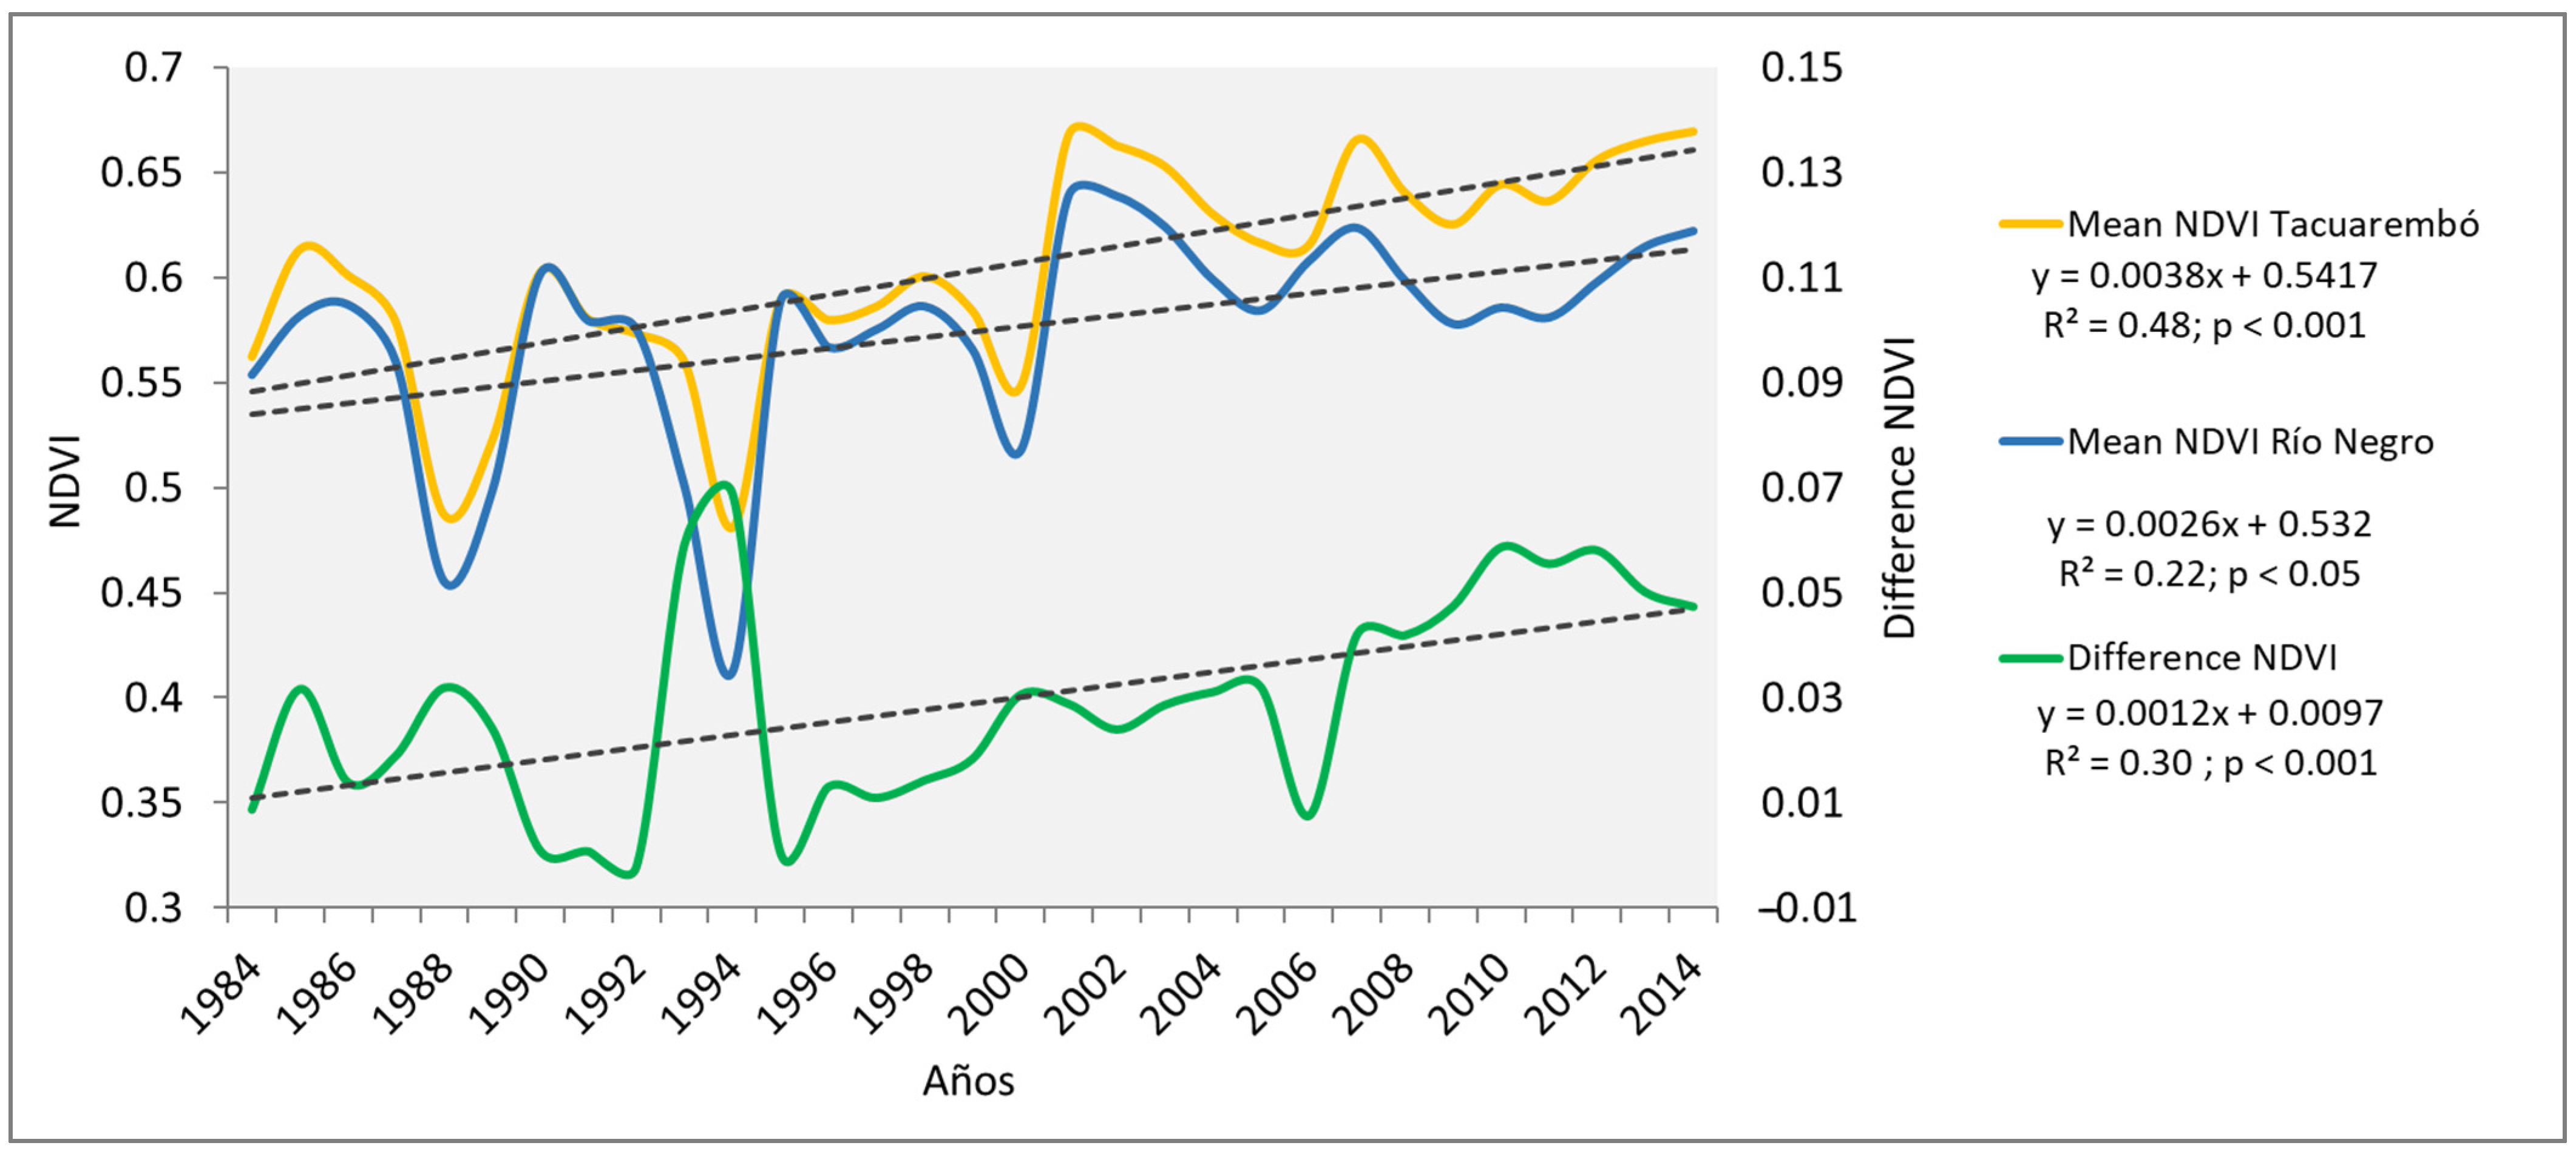
3.2. Forested Area and Temporal Trend of the NDVI Index
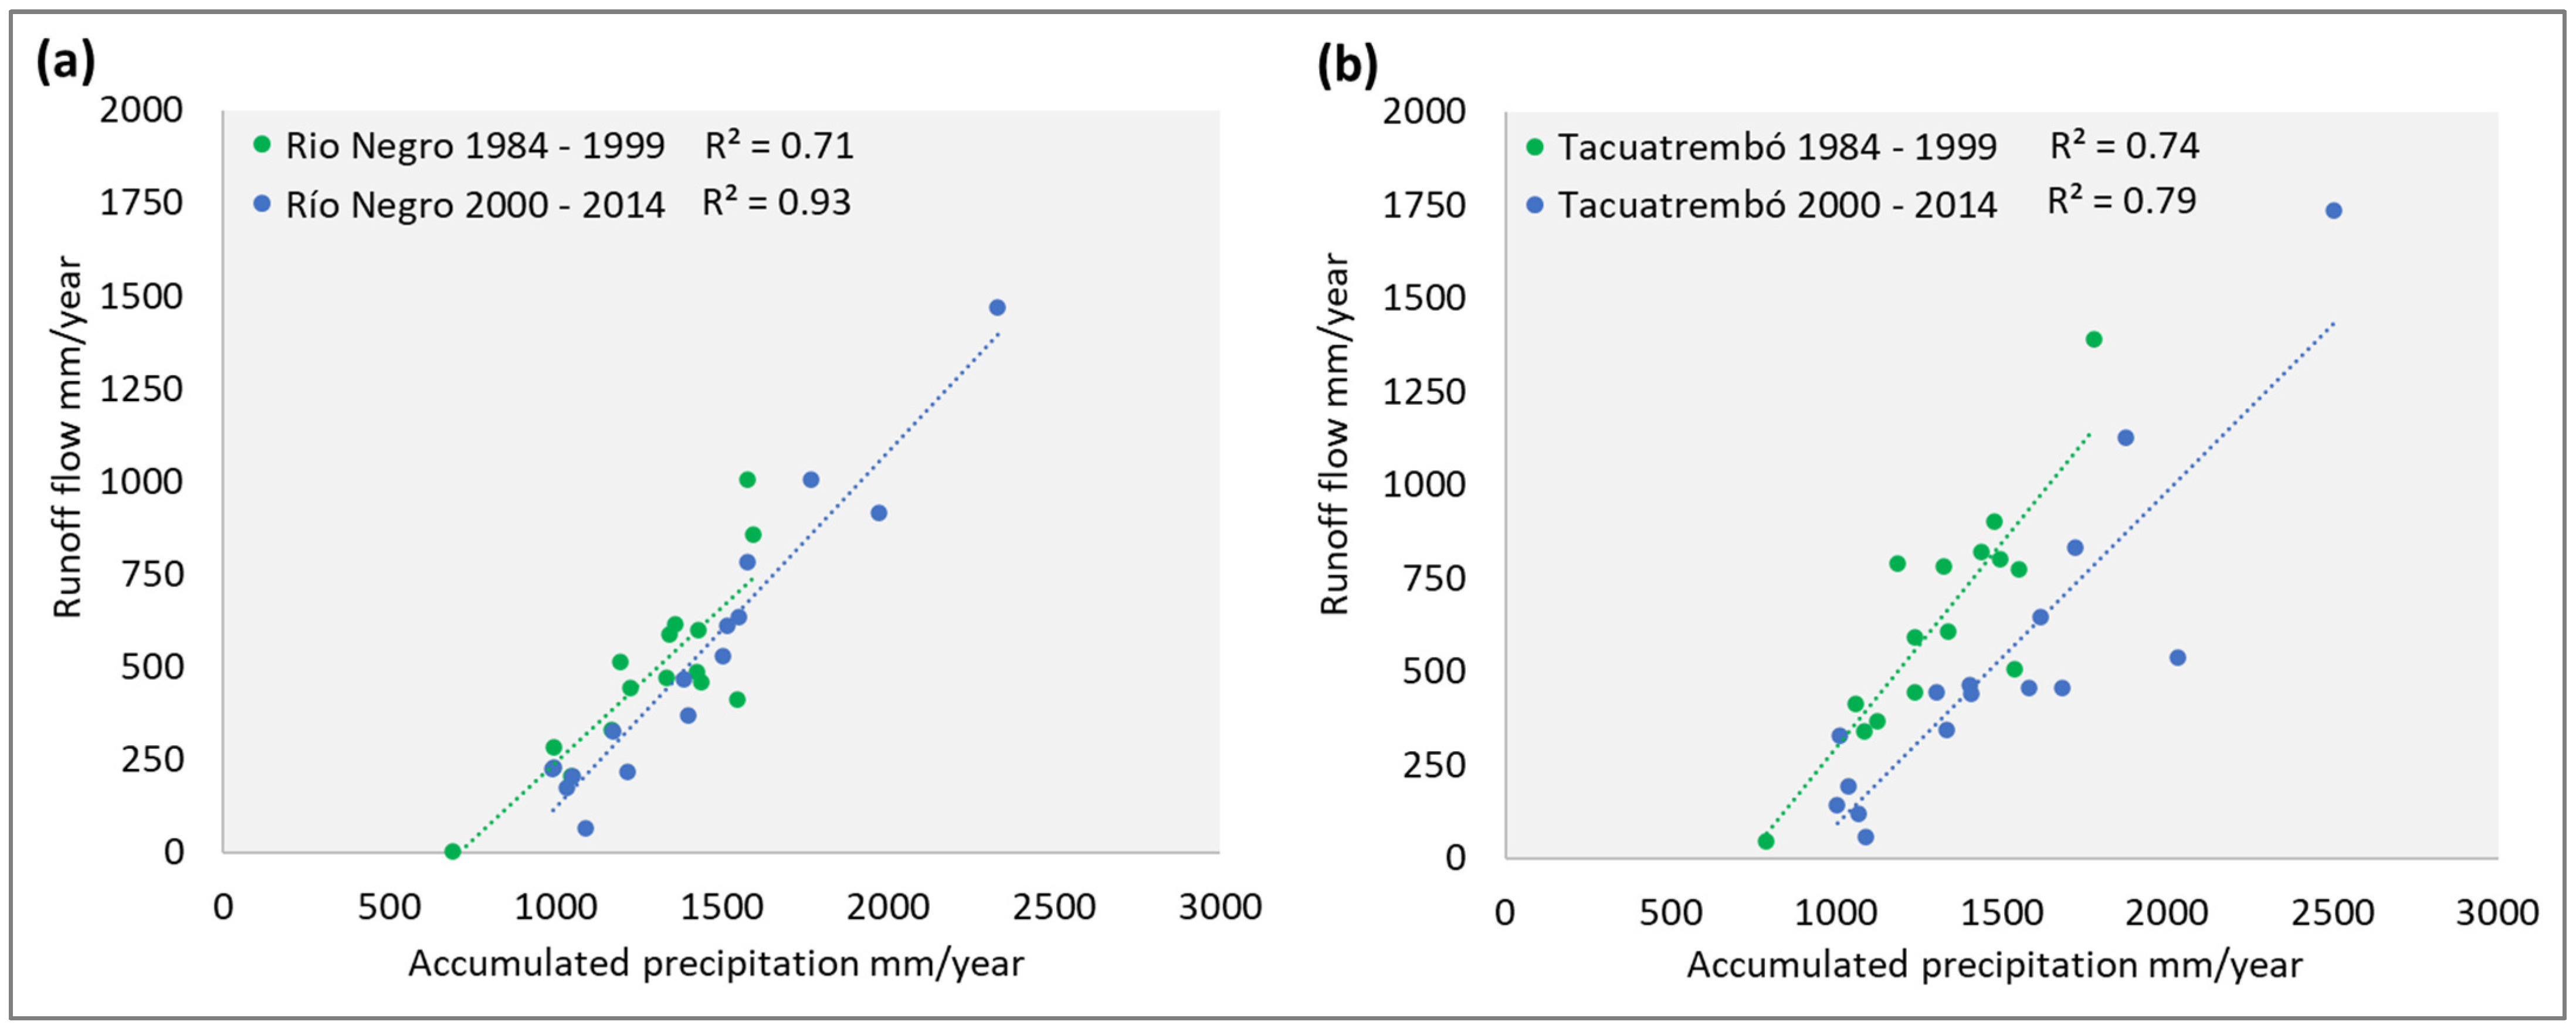
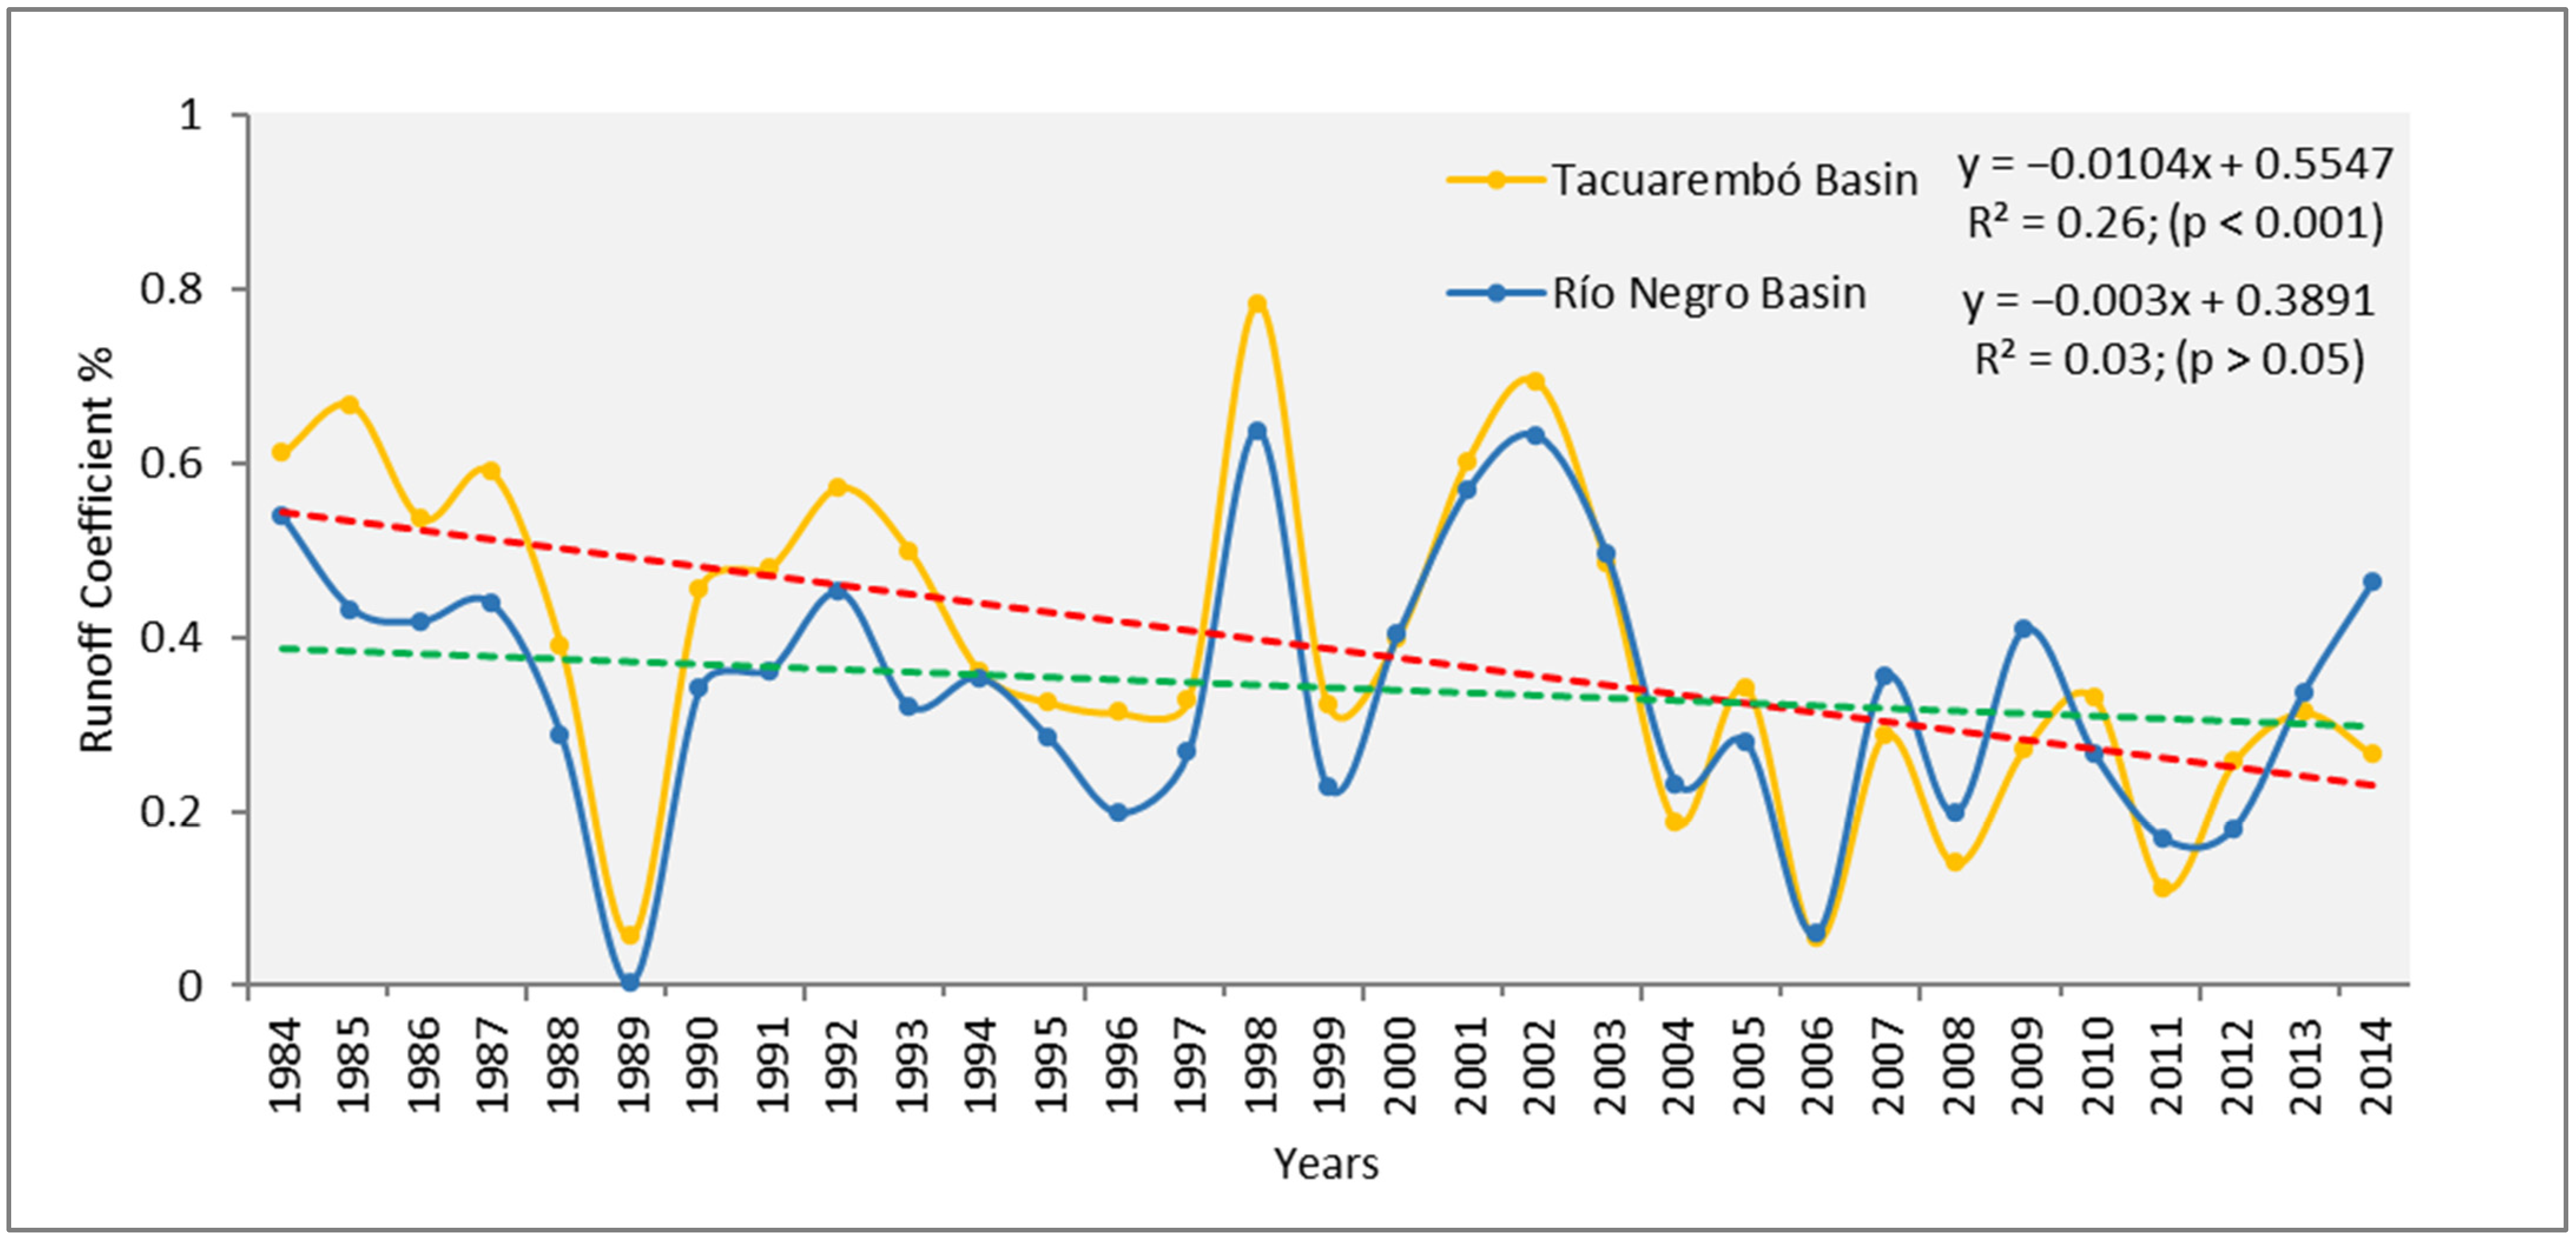
In the analysis of the spatial dynamics of four moments in the period 1984–2014, with intervals of 10 years, the evolution of the distribution of vegetation is observed, especially regarding afforestation and grasslands. The images with a combination of RGB bands (bands 4–5–3 for Landsat 5 TM, 1984–2004, and bands 5–6–4 for Landsat 8 OLI, 2014) manage to enhance the vegetation; this is because the NIR band NIR (near infrared) helps to observe the photosynthetic activity of the vegetation (Figure 4).
According to the satellite images and the supervised classification carried out, the greatest changes in vegetation cover are seen in the Tacuarembó basin. The initial changes occurred in the northern part of the basin due to the increase in forest plantations (Figure 4). The growth of forest cover in the years 1984–1994 was barely pronounced. In Figure 5, it can be seen that the increase was from 1% to 3%, respectively. After 10 years, a drastic and sustained change in forestation (brick red color of the RGB images in Figure 3), from 3% to 11% of the basin surface, is visualized. Subsequently, there was another considerable increase in afforestation, accompanied by deforested spaces (bare soil due to tree harvesting), reaching 28% of the surface of the basin by 2014. For the Tacuarembó basin, it can be seen that the spaces with grasslands were displaced, until they were located in the southeastern part of the basin, decreasing from 83% in 1984 to 56% in 2014.
In contrast, in the Río Negro basin, few changes in vegetation cover were observed. The predominance of the grasslands was not altered to a great extent, nor did they vary in their extension, remaining in a state with little variation throughout the evaluated period; the reduction in grasslands was only 6% (Figure 5). It is necessary to note that, in the Río Negro basin, the forest cover did not increase significantly. Meanwhile, the coverage in water bodies had a greater increase compared to the other basin, due to the increase in lakes and reservoirs.
The interannual temporal behavior of the dynamics of the vegetation cover of both basins in the period 1984–2014, analyzed with the annual average of the maximum monthly values of the NDVI index, in general, showed a pattern of a positive, increasing, and significant trend when performing the Mann–Kendall trend test (Figure 6). The results showed significant differences between the annual values of both basins, according to the paired Student t-test (p < 0.001). The basin with the greatest development of vegetation, with a very significant positive trend, was the Tacuarembó basin (p < 0.001), with an increase at an annual rate of change in the NDVI index of 0.0038/year (R2 = 0.48, p < 0.001). Meanwhile, the Río Negro basin maintained a regular significant growth, with a positive trend, but to a lesser extent (0.0026/year, R2 = 0.22, p < 0.05). When analyzing the difference in NDVI index values between the two basins, a significant positive trend was also observed (slope = 0.0012/year, R2 = 0.30, p < 0.001), as shown by the green line in Figure 6. Finally, it gives evidence of the gradual increase in the difference and the separability of the annual values of the NDVI index between the two basins analyzed; this is, accentuated from the year 2000 to 2014, where the separability becomes more evident. In addition, evaluating the differences between the slopes in percentage terms, using the rate of change (slope) of the Río Negro basin concerning the Tacuarembó basin as a reference, made clear that the increase due to the afforestation of grasslands was 46%.

3.3. Water Regime

In the interannual analysis of the runoff flow (RF), it can be visually verified that in both basins there are very pronounced variations depending on precipitation, which, until 2004, maintained a similar behavior (Figure 7). As of 2005, the variations seem to differ, since the RF in Río Negro remains in line with the increase or decrease in precipitation; meanwhile, in the Tacuarembó basin. A lower response to the increase in RF is observed during rainy years.
The results of the hydrological analysis are shown below, using the coefficient of determination between runoff flow and annual precipitation. The analysis carried out for the entire evaluation period shows a significant positive correlation in both basins (Figure 8). The Río Negro basin shows a high coefficient of determination (R2 = 0.85; p < 0.05), with little data dispersion, deducing that the runoff flow did not have a significant change and is closely linked to precipitation. Contrary to the Tacuarembó basin, an R2 = 0.64 (p < 0.05) is observed with scattered data and a lower coefficient of determination, possibly due to the reduction in runoff flow due to the effect of surface change; in this case, it is the change in vegetation.
To observe the effect of the change in vegetation cover before and after afforestation on the water regime, the results of dividing the runoff flow and annual accumulated precipitation data into two periods (1984–1999 and 2000–2014) are presented; there are 15 years in both basins. The Río Negro basin shows a sustained correlation, maintaining the relationship in both periods (Figure 9a). The ordinates to the origin (sloping line) keep their position with little displacement. Neither the slopes nor those ordered to the origin were different between both periods (p > 0.05). In the Tacuarembó basin, the correlation in the periods was different. A significant displacement of the ordinate line of the origin to the right was observed (Figure 9b; p < 0.01). This result confirms that in the period 2000–2014, despite sustained rainfall over time, surface runoff decreased, possibly due to the demand for water for the development of vegetation (post-forestation), affecting the runoff flow; for an annual rainfall of 1500 mm for the period before afforestation, for example, a water yield of 846 mm/year would be expected. On the other hand, for the period after the establishment of afforestation, this same level of rainfall would produce a yield of 539 mm/year (36% less than the period 1984–1999).
The proportion of rainfall that was transformed into runoff showed a significant downward trend in the Tacuarembó forested basin, but not in the Rio Negro basin (Figure 10). Statistical differences were observed between the two basins when performing the paired Student t-test (p < 0.05). The Tacuarembó basin shows a significant downward trend when performing the Mann–Kendall test (p < 0.001) at a rate of −0.0104/year and with R2 = 0.26. Meanwhile, the Río Negro basin does not show a statistically significant trend (p > 0.05). Likewise, the differences in the runoff coefficient of the adjusted model in the trend lines (red and green lines) for the year 1984 concerning 2014, in the Río Negro basin, differ by 9%; for Tacuarembó, the difference amounts to 32%. When performing the calculation, by placing the Rio Negro basin as the normal reduction in these years, the afforestation of pastures would have affected the reduction in the runoff coefficient by 23%.

4. Discussion

In general, both basins presented differentiated results, where, on the one hand, the Tacuarembó basin considerably increased the forested area, and on the other, the Río Negro basin remained stable, conserving its vegetal cover over time with a predominance of natural grasslands. This had a direct impact on water yield; the runoff flow was considerably reduced in the forested basin and the runoff coefficient showed a clear tendency to decrease (Figure 9 and Figure 10).
These results are consistent with what has been found in several studies [1,2,5,6,54], where they provide evidence of the impact of afforestation on the water regime. This impact depends on various factors such as variety, age, tree species, soil type and fertility, rainfall regime, presence of moisture, temperature, [2,55], etc. Therefore, these have a direct impact on the water balance, affecting the two paths of precipitation, liquid flow from the surface and evapotranspiration [16]. In this study, surface water flow was analyzed; however, the effects of evapotranspiration (ET) could affect the reduction in water flow [56]. It is reported that the absorption of water, redirected toward the atmosphere, is two times greater than that of grasslands [57]. This is due to the high photosynthetic rate, the efficient use of light and water, and the high levels of transpiration due to the intensification of stomatal activity [10]. In addition, productivity increases, deep roots develop that reach groundwater [9], and soil moisture levels are modified by evaporation due to radiation [13].
In the preliminary analysis of the precipitation and the annual NDVI index obtained from the remote sensors, through the results of the statistical analysis, indications of alteration of the vegetation cover are observed. Despite receiving the same level of precipitation, both basins have differences in their vegetation cover, being higher in the Tacuarembó basin. This initial analysis can help to get an idea of the transformations that are occurring in both basins. These same analyses were carried out in various places in Uruguay where there is the same orientation, both in precipitation and in the seasonality of the NDVI index [58,59]. This index is directly linked to productivity levels [60,61]. Afforestation presents higher productivity, expressed with high NDVI index values; during the development of the plant, the accumulation of biomass considerably increases the photosynthetic activity, alongside the greater interception of radiation and the intensification of transpiration. This increases the demand for water in large amounts, affecting the normal flow of the base flow [62].
The results found in this study indicate that in the 31 years analyzed, the NDVI index increased continuously and significantly in both basins, but with greater magnitude in the forested basin (Tacuarembó; Figure 6); this is consistent with the conclusions of analyses performed regarding forest vegetation cover in other studies in Uruguay [63,64]. The strong fall in the NDVI index that occur in three periods, 1988, 1994, and 2000, coincided with the moments of drought that occurred [65]. The point of change in the increase in the NDVI index occurred in the year 2000 and increased suddenly until 2004. This indicates the accelerated development process in the first years of the Eucalyptus grandis plantations, determining that the NDVI index is strongly influenced by changes in vegetation cover and climatic variables [66].
It is necessary to consider that the NDVI index in this study may have limitations in its analysis. The atmospheric effect, presence of clouds, solar angle, pixel size, and other factors, can alter the approximation of the information of the reflected area [67]. This contributes to uncertainty when it comes to recording the photosynthetic activity of plants. It is also necessary to mention that temporary data could be lost in the processing when considering the maximum monthly data and the average of each year [68]. However, this also helps to carry out filters in the case of anomalous data, due to the presence of clouds or the effect of factors such as temperature, humidity, precipitation, seasonality, wind speed, or water vapor [69]. Therefore, it is necessary to keep in mind that this uncertainty was worked on, which can generate errors in the results obtained.
According to Lezama et al. [70], the conservation of a constant water regime in grasslands is mainly due to the floristic gradient; this is associated with variables such as the type and depth of the soil, the edaphic properties, the slope, and the topography in the redistribution of water, humidity, temperature, and the altitude. All these characteristics can explain the differences between the two basins, which influence the development of vegetation cover [6]. These characteristics support the development of roots to intercept and take advantage of the groundwater source. This directly influences the development of the canopy, being observed in the highest NDVI index values and evidencing the increase of 46% when comparing the slopes of both basins. These trends and values increase with the rates of NDVI index change and are consistent with Huang et al.’s [66] study; this reports a significant increase in the NDVI index due to the increase in forest cover in the Qin mountainous region in China, which shows much higher values (annual changes of 0.0053/year; R2 = 0.8159; p < 0.01), compared to what was found in the forested basin of Tacuarembó (slope = 0.0038/year; R2 = 0.48; p < 0.001).
The greatest development in forest plantations in the Tacuarembó basin, composed mainly of Eucalyptus grandis, is from the year 2000, according to the analysis of the trend of the NDVI index; this is where the differences between both basins are more evident (Figure 6). The effect is observed after 2 years (the year 2002) on the runoff flow and the runoff coefficient (Figure 9 and Figure 10). This is because the effect of forest plantations on runoff is short-term, during the 2 to 3 years of development, and it depends a lot on the species [2]. In general, the Eucalyptus grandis tends to develop deep and lateral roots, an increased leaf area index (LAI), and an increased height development. In the process, it makes use of large amounts of water, depending on the amount of precipitation and deep-water infiltration [71], due to its rapid early growth and canopy development; this directly impacts the runoff flow.
It is also worth considering that part of the forest cover corresponds to the development of native tree species in fragmented patches, mainly in the northwestern part of the Tacuarembó basin, in riverbank areas, upperparts, sloping ravine areas, and in areas in transition between dry and humid spaces [72,73]. For this reason, the quantification of forest cover by remote sensing could be overestimated, finding, within the plantations, hydrophilic species in contact with water, mesophilic species in humid areas, and xerophilous species in remote, high, rocky areas, and areas with a low soil depth [74]. It should also be considered that native species have a degree of effect on the runoff flow and that the effects will be greater in grasslands than in native forests, due to the physiological similarity with afforestation [75].
The results of this study, regarding the supervised classification, show considerable consistency; these are similar values to the classification carried out by the Mapbiomas project (available at: https://amazonia.mapbiomas.org/; Accessed on 17 December 2022), which carried out a mapping of Coverage from 1985 to 2021, covering the entire ecosystem of the Pampas and the Amazon in South America. Likewise, the Copernicus Land Monitoring Service’s annual maps of the global land cover change (available at: https://lcviewer.vito.be/download; Accessed on 17 December 2022), also coincides with what has been found; this strengthens the consistency of the monitoring procedures. In this studio, the differences do not exceed 1%, considering the individual analysis of each year; but if more attention is paid to the procedure to obtain precision in the forest cover when considering the forest areas that were harvested, the differences widen by 4%, a criterion that the sources mentioned above do not handle.
The analysis of the correlation between the runoff flow and the annual accumulated precipitation for the two periods analyzed (1984–1999 and 2000–2014) for both basins was an important element in identifying the effect of afforestation. Everything starts from the premise that runoff is strongly correlated with precipitation [52]. The partition of temporal data into periods helps to observe the true effects of cover change on the water regime since runoff is very sensitive to variations and changes in the surface due to human activities [76]. Observing this displacement of the ordinate to the origin helps to determine that the period 2000–2014 saw a greater intensification of forestry activity; this, in turn, induced greater evapotranspiration and a consequent reduction in the runoff [2].
The time series analysis of the runoff/precipitation coefficient (RPC), defined as the proportion of precipitation that was transformed into the base flow (Figure 10), shows that the impact of afforestation on water yield in the Tacuarembó basin has a significant negative trend. This is similar to what was found by Kang et al. [77] and Y Yang et al. [78], who found a significant negative trend in the RPC; this had a direct negative correlation with ET and temperature, which increased considerably due to the effect of forest plantations in the Yanhe basin in China. This affected the increase in the water absorption capacity due to the increase in the photosynthetic activity of the canopy, the root structural development of forest plantations, and the increase in ET. This is in stark contrast to the Rio Negro basin, which, despite decreasing the RPC level, there is a non-significant trend in the effect on water yield; this is because the grassland absorbs less water as it is seasonal, is dependent on precipitation, is from a less-developed structure, and increases less alongside ET, compared to forest cover that is more stable throughout the year [55]. It should also be noted that, in this basin, the runoff decreases due to the appearance of an increase in lagoons and dams distributed throughout the basin. The difference in the RPC average between the two basins is 23%, which is not so far from the result found by [79], where they compare the effect of afforestation and crops in the regions of the Loess Plateau in China, with a 17% difference in the RPC between both coverages.

5. Conclusions

Changes that alter the land cover, such as forest plantations, affect the water yield of the basins. This work demonstrates that remote sensing can help improve the robust analysis of vegetation dynamics and its consequences on the water regime. The changes made to the natural cover (from grassland to forest plantations) are easily identified by satellite images and the NDVI index. This allowed us to identify the relevant changes in the two basins studied. The increase in forest area is also a means to determine changes in vegetation. As such, precipitation was a common factor in both basins and allowed us to see the differences when contrasted with the runoff flow and the runoff coefficient; this can not only be determined by the problem in question, but also by climate change in combination with human activities. Therefore, the importance of this study lies mainly in its contribution to demonstrating the impact generated by the afforestation of grasslands on the reduction in the water regime; it also propounds the usefulness of remote sensors when studying the effects of the change in vegetation cover on the functioning of the lands’ ecosystems. It is evident that, behind all this, there are deeper social and ecological problems, which can consequently cause problems in the long term. The findings of this study undoubtedly have an impact on the environment, the economy, and society in general, by confirming that not everything in forestry activity has a “positive” impact; instead, it also has its “side dark” and this can have consequences. Knowing about these consequences can help to manage them properly.
It is recommended that this type of study, the time series of the NDVI index or runoff, be disaggregated into periods according to the breakpoints independently; this is to observe trends in changes and the true effects of changes in coverage on the water regime due to the events occurring in each year (for example, the El Niño phenomenon, anomalies in temperature, anomalies in precipitation, etc). Likewise, it is also necessary to complement the results with information on evapotranspiration and surface temperature, to observe the influence of plantation growth on these variables. The results should also be complemented with a complete analysis of the water balance in these two basins, to observe the impact of afforestation on the different destinations of precipitation.

Author Contributions

Conceptualization, D.C. and M.N.; formal analysis, D.C.; investigation, D.C. and M.N.; resources, D.C.; writing—original draft preparation, D.C. and C.C.; writing—review and editing, D.C., M.C., C.C. and M.N.; visualization, D.C. and C.C.; supervision, M.C. and M.N. All authors have read and agreed to the published version of the manuscript.

Funding

The research is funded by the Research Department of the Catholic University of Temuco, Chile.

Data Availability Statement

The data presented in this study are available on request from the corresponding author.

Conflicts of Interest

The authors declare no conflict of interest.

References

  1. Sidi Almouctar, M.A.; Wu, Y.; Kumar, A.; Zhao, F.; Mambu, K.J.; Sadek, M. Spatiotemporal analysis of vegetation cover changes around surface water based on NDVI: A case study in Korama basin, Southern Zinder, Niger. Appl. Water Sci. 2021, 11, 4. [Google Scholar] [CrossRef]
  2. Farley, K.A.; Jobbagy, E.G.; Jackson, R.B. Effects of afforestation on water yield: A global synthesis with implications for policy. Glob. Chang. Biol. 2005, 11, 1565–1576. [Google Scholar] [CrossRef]
  3. Kergoat, L.; Lafont, S.; Douville, H.; Berthelot, B.; Dedieu, G.; Planton, S.; Royer, J. Impact of doubled CO 2 on global-scale leaf area index and evapotranspiration: Conflicting stomatal conductance and LAI responses. J. Geophys. Res. Atmos. 2002, 107, ACL-30. [Google Scholar] [CrossRef]
  4. Nosetto, M.D.; Jobbágy, E.G.; Brizuela, A.B.; Jackson, R.B. The hydrologic consequences of land cover change in central Argentina. Agric. Ecosyst. Environ. 2012, 154, 2–11. [Google Scholar] [CrossRef]
  5. Cheng, C.; Zhang, F.; Shi, J.; Kung, H.-T. What is the relationship between land use and surface water quality? A review and prospects from remote sensing perspective. Environ. Sci. Pollut. Res. 2022, 29, 56887–56907. [Google Scholar] [CrossRef]
  6. Jobbágy, E.G.; Acosta, A.M.; Nosetto, M.D. Rendimiento hídrico en cuencas primarias bajo pastizales y plantaciones de pino de las sierras de Córdoba (Argentina). Ecología Austral 2013, 23, 087–096. [Google Scholar] [CrossRef]
  7. van Dijk, A.I.J.M.; Keenan, R.J. Planted forests and water in perspective. Ecol. Manage. 2007, 251, 1–9. [Google Scholar] [CrossRef]
  8. Silveira, L.; Gamazo, P.; Alonso, J.; Martínez, L. Effects of afforestation on groundwater recharge and water budgets in the western region of Uruguay. Hydrol. Process. 2016, 30, 3596–3608. [Google Scholar] [CrossRef]
  9. Christina, M.; Nouvellon, Y.; Laclau, J.-P.; Stape, J.L.; Bouillet, J.-P.; Lambais, G.R.; Le Maire, G. Importance of deep water uptake in tropical eucalypt forest. Funct. Ecol. 2017, 31, 509–519. [Google Scholar] [CrossRef] [Green Version]
  10. Cristiano, P.M.; Campanello, P.I.; Bucci, S.J.; Rodriguez, S.A.; Lezcano, O.A.; Scholz, F.G.; Madanes, N.; Di Francescantonio, D.; Carrasco, L.O.; Zhang, Y.-J.; et al. Evapotranspiration of subtropical forests and tree plantations: A comparative analysis at different temporal and spatial scales. Agric. For. Meteorol. 2015, 203, 96–106. [Google Scholar] [CrossRef]
  11. Whitehead, D.; Beadle, C.L. Physiological regulation of productivity and water use in Eucalyptus: A review. For. Ecol. Manag. 2004, 193, 113–140. [Google Scholar] [CrossRef]
  12. Maier, C.A.; Albaugh, T.J.; Cook, R.I.; Hall, K.; McInnis, D.; Johnsen, K.H.; Johnson, J.; Rubilar, R.A.; Vose, J.M. Comparative water use in short-rotation Eucalyptus benthamii and Pinus taeda trees in the Southern United States. For. Ecol. Manag. 2017, 397, 126–138. [Google Scholar] [CrossRef] [Green Version]
  13. Ouyang, L.; Wu, J.; Zhao, P.; Li, Y.; Zhu, L.; Ni, G.; Rao, X. Consumption of precipitation by evapotranspiration indicates potential drought for broadleaved and coniferous plantations in hilly lands of South China. Agric. Water Manag. 2021, 252, 106927. [Google Scholar] [CrossRef]
  14. Wang, K.; Onodera, S.-I.; Saito, M.; Shimizu, Y.; Iwata, T. Effects of forest growth in different vegetation communities on forest catchment water balance. Sci. Total Environ. 2022, 809, 151159. [Google Scholar] [CrossRef] [PubMed]
  15. Shen, X.; Liu, Y.; Liu, B.; Zhang, J.; Wang, L.; Lu, X.; Jiang, M. Effect of shrub encroachment on land surface temperature in semi-arid areas of temperate regions of the Northern Hemisphere. Agric. For. Meteorol. 2022, 320, 108943. [Google Scholar] [CrossRef]
  16. Nosetto, M.D. Conversión de Pastizales en Forestaciones: Impactos Sobre la dinámica del agua y las sales. Ph.D. Thesis, Facultad de Agronomía. Universidad de Buenos Aires, Buenos Aires, Argentina, 2007. [Google Scholar]
  17. Filoso, S.; Bezerra, M.O.; Weiss, K.C.B.; Palmer, M.A. Impacts of forest restoration on water yield: A systematic review. PLoS ONE 2017, 12, e0183210. [Google Scholar] [CrossRef] [Green Version]
  18. von Stackelberg, N.; Chescheir, G.; Skaggs, R.; Amatya, D. Simulation of the Hydrologic Effects of Afforestation in the Tacuarembó River Basin, Uruguay. Trans. ASABE 2007, 50, 455–468. [Google Scholar] [CrossRef]
  19. Carlos, P.A. Plantaciones Forestales e Impactos Sobre el ciclo del Agua: Un Anaálisis a Partir del Desarrollo de las Plantaciones Forestales en Uruguay; Grupo Guayubira: Montevideo, Uruguay, 2007. [Google Scholar]
  20. Jobbágy, E.G.; Vasallo, M.; Farley K a Piñeiro, G.; Garbulsky, M.F.; Nosetto, M.D. Forestación En Pastizales: Hacia Una Visión Integral De Sus Oportunidades Y Costos Ecológicos. Agrociencia 2006, 10, 109–124. [Google Scholar]
  21. Milione, G.M.; Mujica, C.R.; Bea, S.A.; Dominguez Daguer, D.; Gyenge, J.E. Forestación en pastizales: El rol de las especies y el manejo forestal sobre el proceso de salinización secundaria de suelos. Rev. De Investig. Agropecu. 2020, 46, 73–80. [Google Scholar]
  22. Baldi, G.; Nosetto, M.D.; Jobbágy, E.G. El efecto de las plantaciones forestales sobre el funcionamiento de los ecosistemas sud-americanos. AmbiÊNcia 2008, 4, 23–34. [Google Scholar]
  23. Bonilla, S.; Haakonsson, S.; Somma, A.; Gravier, A.; Britos, A.; Vidal, L.; De León, L.; Brena, B.; Pírez, M.; Piccini, C.; et al. Cianobacterias y cianotoxinas en ecosistemas límnicos de Uruguay. Innotec 2015, 10, 9–22. [Google Scholar] [CrossRef]
  24. Kruk, C.; Martínez, A.; Martínez De la Escalera, G.; Trinchin, R.; Manta, G.; Segura, A.M. Floración excepcional de cianobacterias tóxicas en la costa de Uruguay, verano 2019. Innotec 2019, 18, 36–68. [Google Scholar]
  25. Delgado, S.; Alliaume, F.; García Préchac, F.; Hernández, J. Efecto de las plantaciones de Eucalyptus sp. sobre el recurso suelo en Uruguay. Agrociencia Urug. 2006, 10, 95–108. [Google Scholar]
  26. Farley, K.A.; Piñeiro, G.; Palmer, S.M.; Jobbágy, E.G.; Jackson, R.B. Stream acidification and base cation losses with grassland afforestation. Water Resour. Res. 2008, 44, W00A03. [Google Scholar] [CrossRef] [Green Version]
  27. Brazeiro, A.; Cravino, A.; Fernández, P.; Haretche, F. Forestación en pastizales de Uruguay: Efectos sobre la diversidad de aves y mamíferos a escala de rodal y del paisaje. Ecosistemas 2018, 27, 48–59. [Google Scholar]
  28. Raffaele, E.; Núñez, M.; Relva, M. Plantaciones de coníferas exóticas en Patagonia: Los riesgos de plantar sin un manejo adecuado. Ecología Austral 2015, 25, 089–092. [Google Scholar] [CrossRef]
  29. Ferraz, S.F.; Lima, W.D.P.; Rodrigues, C.B. Managing forest plantation landscapes for water conservation. For. Ecol. Manag. 2012, 301, 58–66. [Google Scholar] [CrossRef]
  30. Lara, A.; Little, C.; Urrutia, R.; McPhee, J.; Álvarez-Garretón, C.; Oyarzún, C.; Soto, D.; Donoso, P.; Nahuelhual, L.; Pino, M.; et al. Assessment of ecosystem services as an opportunity for the conservation and management of native forests in Chile. For. Ecol. Manag. 2009, 258, 415–424. [Google Scholar] [CrossRef]
  31. Alvarez-Garreton, C.; Lara, A.; Boisier, J.P.; Galleguillos, M. The Impacts of Native Forests and Forest Plantations on Water Supply in Chile. Forests 2019, 10, 473. [Google Scholar] [CrossRef] [Green Version]
  32. Ellison, D.; Morris, C.E.; Locatelli, B.; Sheil, D.; Cohen, J.; Murdiyarso, D.; Gutierrez, V.; van Noordwijk, M.; Creed, I.F.; Pokorny, J.; et al. Trees, forests and water: Cool insights for a hot world. Glob. Environ. Chang. 2017, 43, 51–61. [Google Scholar] [CrossRef]
  33. Han, F.; Yan, J.; Ling, H.-B. Variance of vegetation coverage and its sensitivity to climatic factors in the Irtysh River basin. PeerJ 2021, 9, e11334. [Google Scholar] [CrossRef] [PubMed]
  34. Zhang, S.; Li, Z.; Lin, X.; Zhang, C. Assessment of Climate Change and Associated. Water 2019, 11, 1373. [Google Scholar] [CrossRef] [Green Version]
  35. Senay, G.B.; Leake, S.; Nagler, P.L.; Artan, G.; Dickinson, J.; Cordova, J.T.; Glenn, E.P. Estimating basin scale evapotranspiration (ET) by water balance and remote sensing methods. Hydrol. Process. 2011, 25, 4037–4049. [Google Scholar] [CrossRef]
  36. Gutierrez-Cori, O.; Espinoza, J.C.; Li, L.Z.X.; Wongchuig, S.; Arias, P.A.; Ronchail, J.; Segura, H. On the Hydroclimate-Vegetation Relationship in the Southwestern Amazon During the 2000–2019 Period. Front. Water 2021, 3, 8499. [Google Scholar] [CrossRef]
  37. Xu, W.; Yang, D.; Li, Y.; Xiao, R. Correlation Analysis of Mackenzie River Discharge and NDVI Relationship. Can. J. Rem. Sens. 2016, 42, 292–306. [Google Scholar] [CrossRef]
  38. Sun, P.; Liu, S.; Jiang, H.; Lü, Y.; Liu, J.; Lin, Y.; Liu, X. Hydrologic Effects of NDVI Time Series in a Context of Climatic Variability in an Upstream Catchment of the Minjiang River1. JAWRA J. Am. Water Resour. Assoc. 2008, 44, 1132–1143. [Google Scholar] [CrossRef]
  39. Moses, O.; Blamey, R.C.; Reason, C.J.C. Relationships between NDVI, river discharge and climate in the Okavango River Basin region. Int. J. Clim. 2021, 42, 691–713. [Google Scholar] [CrossRef]
  40. Lu, X.X.; Wang, J.; Higgitt, D.L. NDVI and its relationships with hydrological regimes in the Upper Yangtze. Can. J. Remote Sens. 2000, 26, 418–427. [Google Scholar] [CrossRef]
  41. Graziano, A. ¿Quién habla de forestación? Polisemia ambiental y conflictos sociales en Uruguay. Rev. Cienc. Soc. 2010, 26, 84–94. [Google Scholar]
  42. Paruelo, J.M. Ecosystem services and tree plantations in Uruguay: A reply to Vihervaara et al. For. Policy Econ. 2012, 22, 85–88. [Google Scholar] [CrossRef]
  43. Silva, M.; Mendoza, N. Validation of meteorological series and estimation of climate change indicators in agricultural locations from Uruguay. Rev. De Climatol. 2020, 20, 47–60. [Google Scholar]
  44. Amarante, F.B.; do Scherer, C.M.S.; Goso Aguilar, C.A.; Reis AD dos Mesa, V.; Soto, M. Fluvial-eolian deposits of the Tacuarembó formation (Norte Basin–Uruguay): Depositional models and stratigraphic succession. J. S. Am. Earth. Sci. 2019, 90, 355–376. [Google Scholar] [CrossRef]
  45. Resquin, F.; Navarro-Cerrillo, R.M.; Rachid-Casnati, C.; Hirigoyen, A.; Carrasco-Letelier, L.; Duque-Lazo, J. Allometry, Growth and Survival of Three Eucalyptus Species (Eucalyptus benthamii Maiden and Cambage, E. dunnii Maiden and E. grandis Hill ex Maiden) in High-Density Plantations in Uruguay. Forests 2018, 9, 745. [Google Scholar] [CrossRef] [Green Version]
  46. Lucas, C.; Aguilera-Betti, I.; Muñoz, A.A.; Puchi, P.; Sapriza, G.; Profumo, L.; Maxwell, R.S.; Venegas-González, A. Cross-continental hydroclimate proxies: Tree-rings in Central Chile reconstruct historical streamflow in Southeastern South American rivers. Prog. Phys. Geogr. Earth Environ. 2022, 46, 458–480. [Google Scholar] [CrossRef]
  47. Dirección Nacional de Medio Ambiente. Plan de Monitoreo del Río Tacuarembó. Informe de Actividades y Presentación de Resultados; Ministerio de Ambiente: Plaza Independencia, Uruguay, 2020. [Google Scholar]
  48. Ministerio de Vivienda Ordenamiento Terrtorial y Medio Ambiente. Monitoreo de Calidad del Agua Río Negro Informe 2019; Dirección Nacional de Medio Ambiente, Área de Información Planificación y Calidad Ambiental: Montevideo, Uruguay, 2020. [Google Scholar]
  49. Funk, C.; Peterson, P.; Landsfeld, M.; Pedreros, D.; Verdin, J.; Shukla, S.; Husak, G.; Rowland, J.; Harrison, L.; Hoell, A.; et al. The climate hazards infrared precipitation with stations—A new environmental record for monitoring extremes. Sci. Data 2015, 2, 150066. [Google Scholar] [CrossRef] [PubMed] [Green Version]
  50. Rivera, J.A.; Hinrichs, S.; Marianetti, G. Using CHIRPS Dataset to Assess Wet and Dry Conditions along the Semiarid Cen-tral-Western Argentina. Adv. Meteorol. 2019, 2019, 8413964. [Google Scholar] [CrossRef] [Green Version]
  51. Hildrew, A.G.; Statzner, B. European Rivers: A Personal Perspective. In Rivers of Europe; Elsevier Ltd.: Amsterdam, The Netherlands, 2009; pp. 685–698. [Google Scholar] [CrossRef]
  52. Saifullah, M.; Li, Z.; Li, Q.; Zaman, M.; Hashim, S. Quantitative Estimation of the Impact of Precipitation and Land Surface Change on Hydrological Processes through Statistical Modeling. Adv. Meteorol. 2016, 2016, 6130179. [Google Scholar] [CrossRef]
  53. Li, Y.; He, D.; Ye, C. Spatial and temporal variation of runoff of Red River Basin in Yunnan. J. Geogr. Sci. 2008, 18, 308–318. [Google Scholar] [CrossRef]
  54. Buytaert, W.; Iñiguez, V.; De Bièvre, B. The effects of afforestation and cultivation on water yield in the Andean páramo. For. Ecol. Manag. 2007, 251, 22–30. [Google Scholar] [CrossRef]
  55. Nosetto, M.D.; Jobbagy, E.G.; Paruelo, J.M. Land-use change and water losses: The case of grassland afforestation across a soil textural gradient in central Argentina. Glob. Chang. Biol. 2005, 11, 1101–1117. [Google Scholar] [CrossRef]
  56. Xiao, Q.; Xiao, Y.; Luo, Y.; Song, C.; Bi, J. Effects of afforestation on water resource variations in the Inner Mongolian Plateau. PeerJ 2019, 7, e7525. [Google Scholar] [CrossRef] [PubMed] [Green Version]
  57. Kelliher, F.M.; Leuning, R.; Schulze, E.D. Evaporation and canopy characteristics of coniferous forests and grasslands. Oecologia 1993, 95, 153–163. [Google Scholar] [CrossRef]
  58. Baeza, S.; Baldassini, P.; Bagnato, C.; Pinto, P.; Paruelo, J.M. Caracterización del uso/cobertura del suelo en Uruguay a partir de series temporales de imágenes MODIS Land Use / Land Cover Classification in Uruguay Using Time Series of MODIS Images. Agrociencia Urug. 2014, 18, 95–105. [Google Scholar] [CrossRef]
  59. Texeira, M.; Oyarzabal, M.; Pineiro, G.; Baeza, S.; Paruelo, J.M. Land cover and precipitation controls over long-term trends in carbon gains in the grassland biome of South America. Ecosphere 2015, 6, art196. [Google Scholar] [CrossRef] [Green Version]
  60. Paruelo, J.M.; Epstein, H.E.; Lauenroth, W.K.; Burke, I.C. ANPP estimates from NDVI for the central grassland region of the United States. Ecology 1997, 78, 953–958. [Google Scholar] [CrossRef]
  61. Piñeiro, G.; Oesterheld, M.; Paruelo, J.M. Seasonal Variation in Aboveground Production and Radiation-use Efficiency of Temperate rangelands Estimated through Remote Sensing. Ecosystems 2006, 9, 357–373. [Google Scholar] [CrossRef]
  62. Vassallo, M.M.; Dieguez, H.D.; Garbulsky, M.F.; Jobbágy, E.G.; Paruelo, J.M. Grassland afforestation impact on primary productivity: A remote sensing approach. Appl. Veg. Sci. 2012, 16, 390–403. [Google Scholar] [CrossRef]
  63. Díaz, I.; Ceroni, A.; López, G.; Achkar, M. Análisis espacio-temporal de la intensificación agraria y su incidencia en la producti-vidad primaria neta. Rev. ElectrÓNic@ De Medioambiente UCM 2018, 19, 24–40. [Google Scholar]
  64. Ceroni, M.; Achkar, M.; Gazzano, I.; Burgeño, J. Estudio del NDVI mediante análisis multiescalar y series temporales utilizando imágenes SPOT, durante el período 1998-2012 en el Uruguay. Rev. Teledetección 2015, 43, 31. [Google Scholar] [CrossRef] [Green Version]
  65. Cruz, G.; Baethgen, W.; Bartaburu, D.; Bidegain, M.; Giménez, A.; Methol, M.; Morales, H.; Picasso, V.; Podestá, G.; Taddei, R.; et al. Thirty Years of Multilevel Processes for Adaptation of Livestock Production to Droughts in Uruguay. Weather. Clim. Soc. 2017, 10, 59–74. [Google Scholar] [CrossRef]
  66. Huang, C.; Yang, Q.; Guo, Y.; Zhang, Y.; Guo, L. The pattern, change and driven factors of vegetation cover in the Qin Mountains region. Sci. Rep. 2020, 10, 20591. [Google Scholar] [CrossRef] [PubMed]
  67. Cao, C.; Vermote, E.; Xiong, X. Using AVHRR lunar observations for NDVI long-term climate change detection. J. Geophys. Res. Earth Surf. 2009, 114, D20105. [Google Scholar] [CrossRef] [Green Version]
  68. Shen, X.; Liu, B.; Henderson, M.; Wang, L.; Jiang, M.; Lu, X. Vegetation Greening, Extended Growing Seasons, and Temperature Feedbacks in Warming Temperate Grasslands of China. J. Clim. 2022, 35, 5103–5117. [Google Scholar] [CrossRef]
  69. Roderick, M.; Smith, R.; Cridland, S. The precision of the NDVI derived from AVHRR observations. Remote Sens. Environ. 1996, 56, 57–65. [Google Scholar] [CrossRef]
  70. Lezama, F.; Alice, A.; León, R.J.; Paruelo, J.M. Heterogeneidad de la vegetación en pastizales naturales de la región basáltica de Uruguay. Ecología Austral 2006, 16, 167–182. [Google Scholar]
  71. Schenk, H.J.; Jackson, R.B. Rooting depths, lateral root spreads and below-ground/above-ground allometries of plants in wa-ter-limited ecosystems. J. Ecol. 2002, 90, 480–494. [Google Scholar] [CrossRef] [Green Version]
  72. Brazeiro, A.; Brussa, P.; Toranza CBrazeiro, A.; Brussa, P.; Toranza, C. Livestock effects on the forest-grassland ecotone dynamics in highland landscapes of Uruguay. Ecosistemas 2018, 27, 14–23. [Google Scholar]
  73. Toranza, C.; Lucas, C.; Ceroni, M. Distribución espacial y cobertura arbórea del bosque serrano y de quebrada en Uruguay Los desafíos de mapear ecosistemas parchosos. Agrociencia Urug. 2019, 23, 135–146. [Google Scholar]
  74. Traversa-Tejero, I.P.; Alejano-Monge, M.R. Caracterización, distribución y manejo de los bosques nativos en el norte de Uruguay. Rev Mex Biodivers. 2013, 84, 249–262. [Google Scholar] [CrossRef] [Green Version]
  75. Hejduk, L.; Kaznowska, E.; Wasilewicz, M.; Hejduk, A. Dynamics of the Natural Afforestation Process of a Small Lowland Catchment and Its Possible Impact on Runoff Changes. Sustainability 2021, 13, 10339. [Google Scholar] [CrossRef]
  76. Awotwi, A.; Anornu, G.K.; Quaye-Ballard, J.; Annor, T.; Forkuo, E.K. Analysis of climate and anthropogenic impacts on runoff in the Lower Pra River Basin of Ghana. Heliyon 2017, 3, e00477. [Google Scholar] [CrossRef] [PubMed]
  77. Kang, Y.; Gao, J.; Shao, H.; Zhang, Y. Quantitative Analysis of Hydrological Responses to Climate Variability and Land-Use Change in the Hilly-Gully Region of the Loess Plateau, China. Water 2020, 12, 82. [Google Scholar] [CrossRef] [Green Version]
  78. Yang, S.; Kang, T.; Bu, J.; Chen, J.; Wang, Z.; Gao, Y. Detection and Attribution of Runoff Reduction of Weihe River over Different Periods during 1961–2016. Water 2020, 12, 1416. [Google Scholar] [CrossRef]
  79. Hu, Y.; Tian, Q.; Zhang, J.; Benoy, G.; Badreldin, N.; Xing, Z.; Luo, Z.; Zhang, F. Effectiveness of Chinese pine (Pinus tabulaeformis) plantation at reducing runoff and erosion rates in Anjiagou Watershed in Semi-arid Region of Gansu, China. PLoS ONE 2022, 17, e0271200. [Google Scholar] [CrossRef] [PubMed]
Figure 1. Location of the study area and base flow monitoring stations. (a) The red line and polygon correspond to the delimitation of the Tacuarembó River Upper Basin. (b) The blue line and polygon correspond to the delimitation of the Upper Río Negro Basin. The Base Flow Monitoring Stations (MS) are represented by the red dot (Paso del Borracho—Upper Tacuarembó River Basin) and the blue dot (Paso Aguiar—Upper Negro River Basin). The red box encloses the exact location of both basins in South America. The yellow lines correspond to the international limits.
Land 12 00185 g001
Figure 2. Diagram of the environmental elements studied.
Land 12 00185 g002
Figure 3. Analysis of the annual profile of the NDVI index and precipitation for the period 1984–2014. (a) Box and whisker plot of the monthly average of the NDVI index. Green boxes correspond to the Tacuarembó basin and orange boxes to the Río Negro basin. (b) Accumulated average monthly precipitation. Boxes in blue correspond to the Tacuarembó basin and boxes in red correspond to the Río Negro basin. (c) The monthly average runoff flow is expressed in mm. Boxes in lead correspond to the Tacuarembó basin and in red, to the Río Negro basin. The boxes represent the interquartile range, the bars represent the maximum and minimum values, the intermediate “X” identifies average values and the outer points correspond to the outlier. (d) Variation analysis of the coefficient of determination between accumulated precipitation and runoff flow. The runoff flow was considered for a single month and the precipitation gradually accumulated month by month.
Land 12 00185 g003
Figure 4. Analysis of the spatial dynamics of vegetation of four moments in the period 1984, 1994, 2004, and 2014. The images correspond to the Landsat 5 TM (1984, 1995, and 2005) combination of RGB 4–5–3 bands, and Landsat 8 OLI (2014) with a combination of RGB 5-6-4. The bar graph corresponds to the increase in the forested area, carried out by supervised classification in both basins.
Land 12 00185 g004
Figure 5. Change in coverage expressed in % in four moments 1984, 1994, 2004, and 2014 of the coverage of bodies of water, forestry, wetlands, and grasslands. Unlabeled values did not exceed 2%.
Land 12 00185 g005
Figure 6. Time series trend analysis (1984–2014) of annual averages of maximum monthly values of the NDVI index and the difference between the two basins. The yellow line corresponds to the annual averages of the NDVI index of the Tacuarembó basin. The blue line corresponds to the annual averages of the NDVI index of the Río Negro basin. The green line corresponds to the difference between the annual average values of the NDVI index of both basins. Dashed black lines correspond to the trend of each time series.
Land 12 00185 g006
Figure 7. Precipitation regime and interannual runoff flow in the period 1984–2014 of the two basins under study. The bars are the average accumulated precipitation. The black line (Tacuarembó Basin) and the red line (Río Negro Basin) correspond to the cumulative runoff flow in mm from the Paso del Borracho and Paso Aguiar monitoring stations, respectively.
Land 12 00185 g007
Figure 8. Correlation analysis between the annual runoff flow and the annual accumulated precipitation for the period 1984–2013 of the two basins analyzed.
Land 12 00185 g008
Figure 9. Correlation analysis between surface runoff and annual accumulated precipitation of the Río Negro basin (a) and the Tacuarembó basin (b) for the periods 1984–1999 (green dots) and 2000–2014 (blue dots).
Land 12 00185 g009
Figure 10. Trend analysis and level of significance of the surface runoff coefficient in the Tacuarembó basin (yellow line) and Río Negro basin (blue line). The broken red and green lines correspond to the trend of the runoff coefficient time series of the Tacuarembó and Rio Negro basins, respectively.
Land 12 00185 g010
Table 1. Summary of the main characteristics of the basins under study.
CharacteristicTacuarembóRío Negro
Elevation (masl)88–39198–397
Area (km2)66058002
Perimeter (km)683885
Average base flow (m3/s)132.25122.04
Baseflow monitoring locationPaso del BorrachoPaso Aguiar
Latitude, Longitude (° Decimals)−31.87583; −55.47111−32.28611; −54.83111
Mean annual precipitation (mm)14841330
Average annual temperature (°C)18.219
Predominant vegetationgrassland and forestPastureland
Slope (%)7.64.7
Drainage directionNorth to southnortheast to southwest
Disclaimer/Publisher’s Note: The statements, opinions and data contained in all publications are solely those of the individual author(s) and contributor(s) and not of MDPI and/or the editor(s). MDPI and/or the editor(s) disclaim responsibility for any injury to people or property resulting from any ideas, methods, instructions or products referred to in the content.

