


Towards European Transitions: Indicators for the Development of Marginal Urban Regions

Department of Civil Environmental and Architectural Engineering (DICEA), University of Padua, Via Venezia 1, 30151 Padova, PD, Italy
*
Author to whom correspondence should be addressed.
Land 2023, 12(1), 27; https://0-doi-org.brum.beds.ac.uk/10.3390/land12010027
Submission received: 7 November 2022
/
Revised: 13 December 2022
/
Accepted: 19 December 2022
/
Published: 22 December 2022
(This article belongs to the Special Issue Landscapes at Risk. Social Capital Asset in the COVID-Scape Climate)
Abstract
:Urban transitions and urban-scape have been heavily impacted by the COVID-19 pandemic and will likely be affected by the current Ukrainian-Russian conflict. These two major events have affected European urban regions and especially marginal regions. Indeed, these regions are mostly struggling with inequality, lack of optionality, interoperability, and resilience due to their energy dependency and digital asymmetries. The continuous demand for a green and digital transition to strengthen social and economic resilience sought and targeted by the European Community has driven the policy of recent years to new European Guidelines. Nevertheless, the digital transition will require sustainability targets in the urban context, changing economic, social, and ecological relationships and balances. In this context, faced with these new transitions, marginal urban regions must plan, design, build, and manage future urban planning choices in a new digital-hybrid space. Therefore, it is crucial to support these transitions with a multi-dimensional sustainability concept through economic, environmental, social, and digital measurements. Urban sustainability indicators (USIs) play an essential role in supporting urban choices and planning. The current study analyzes recent literature and European standards to verify if and how they have changed in embracing the European Policy Pillar under a new and different sustainability profile, which needs to include digital sustainability. As a matter of fact, even if the concept of digitization has been recognized as a pillar of ongoing transitions, the literature and even European indicators struggle to recognize it as a tangible and measurable indicator of sustainability. Seeking to bridge the gap between European requirements and urban practice, the aim of this study is to identify and suggest new key indicators of digitalization to enable the digital sustainability of urban planning to be measured. These indicators can be used to implement a new valuation tool capable of supporting marginal regions by promoting sustainable urban investments in this new hybrid space.
1. Introduction
In recent years, the COVID-19 pandemic has been one of the engines of European dual transition policies, despite its social and economic impacts. In addition to the pandemic situation, the current Ukrainian-Russian conflict heavily impacted and currently is affecting the urban scape and, in particular, marginal urban regions development. These two events have stressed out the existing disparities between urban regions and marginal regions. On the one hand, the pandemic has highlighted the digital discrepancies and delay of these areas in health, work, and administrative responses to digital demands dictated by these events. On the other hand, the Ukrainian conflict has highlighted the high European energy dependence, aggravated by unsustainable and highly under-digitized energy choices. As mentioned, the social–economic life has had to struggle, mostly addressing digital urban deficiencies in different sectors.
These challenges have been the opportunity and the boost to implement new policies seeking for a more environmentally sustainable, social, digital, and resilient Europe [1,2,3].
This ongoing request for green and digital transitions to strengthen social and economic resilience requested and targeted by the European Community has driven the policies of recent years, leading to new European Policy Guidelines. This Program focuses on six headline ambitions for Europe in the coming years: (1) A European Green Deal (EGD); (2) An economy that works for people; (3) A Europe fit for the digital age; (4) Protection for our European way of life; (5) A stronger Europe in the world; (6), and a new push for European democracy [4]. These are the six pillars and challenges that European Urban Regions will face and handle in the near future to strengthen European cohesion. Indeed, European countries are undergoing unprecedented transformations and transitions in the context of major uncertainties linked to the global and security outlook.
The first pillar (1) set by the European Green Deal, approved in 2019, leads to green and ecological transitions that may make it possible to achieve climate neutrality by 2050 through an intermediate transition step to 55% by 2030. This ambitious plan demands a drastic drop in greenhouse gas emissions to be implemented immediately by all European countries, leading to tangible improvements of urban and environmental living conditions [5]. Cities, urban developments, and regions have already started to confront ecological challenges and changes to achieve this goal through projects and plans that seek a circular economy and clean technologies.
The second (2), fourth (4), and sixth pillar (6) are tightly related to social transitions that Europe must handle. Social fairness, equity, resilience, and welfare are the targets under these pillars. To consolidate its social, economic, and regional cohesion, according to the Treaty on the Functioning of the European Union, the EU aims to reduce development disparities between European regions, the underdevelopment of peripheral regions and the rural areas suffering from production, demographic, and natural deficiencies. By including these three pillars, the EU introduced a new dimension that was previously barely considered the social aspect of sustainability and equality [6]. As pointed out by Newell and Simms, many transitions seeking green and ecological benefits have historically led to social regression, such as the shift from coal to gas in the 1980s in the UK. [7].
Literature and practice have already introduced and consolidated an environmental and social sustainability assessment of urban settlements through more or less traditional indicators and indexes [8,9,10,11,12,13,14]. There is a consistent and substantial background that fills the need for urban sustainability assessment of these two European macro-pillars as social and environmental transitions have been a part of European aims even before the European Green Deal approval. On the contrary, the third pillar, “Europe fit for the digital age” (3), is a more recent pillar that has been introduced and announced in 2020. This headline deals with digitalization through digital technologies, artificial intelligence, data, and metadata that are changing and interfering with social, ecological, and economic dimensions of our life [4,15]. On 9 March 2021, the European Commission (EC) presented a vision for European digital transformation to be achieved by 2030. This proposal seeks a Digital Compass involving four major cardinal goals: digital skills, digital transformation of businesses, secure and sustainable digital infrastructures, and digitalization of public services. Furthermore, the European Commission (EC) is currently working on a digital transformation that pursues three macro-pillars: technology that works for the people; a fair and competitive digital economy; an open, democratic, and sustainable society. However, even though the concept of digitization has been recognized as a pillar of ongoing transitions, the literature and even European indicators struggle to recognize it as a tangible and measurable indicator of sustainability. This lack is evident in the assessment of the urban sustainability sector, which hardly tends to value digitalization as a value-added tool able to account for sustainability achievements in the planning processes.
Assessing sustainable developments and measuring the achievements of required targets is a real challenge for urban regions pursuing European Goals [16]. This difficulty is primarily due to the combination of Urban Scale complexity with the challenge of sustainability measurement through indices and indicators. This complexity can be exponential if we need to introduce additional variables and indicators that are no more linked to the traditional physical urban scale and space but to a third hybrid dimension, which has been introduced by the digital space.
To systematically assess urban processes through all the different dimensions of sustainability, we first need to describe how sustainability has been addressed at an urban scale and then identify how the literature, practice, and policies assessed it through indexes and indicators.
Given the context described above, critical reviews and comparative analyses on existing indicators and indexes have been performed to analyze the current practices to value urban sustainability levels and to suggest possible future drivers in this field. Our analysis investigates the recent literature, following the new European Policy Guidelines publication in 2019. This short timeframe has been selected to capture whether the literature and practice started to implement urban assessment tools and indicators after Europe recognized digitalization as a fundamental pillar. Consequently, we inscribed our work in this incipient line of research by addressing the following research questions:
- Which sustainability dimensions do current indicators cover in urban assessment?
- Has the digital transition been taken into consideration in the assessment of urban sustainability?
- What lessons can be drawn from current practices to support the development of future indicator sets for urban sustainability assessment?
The findings of the current study lay the foundations for future research on defining new evaluation matrices for urban sustainability assessment. The results can assist policymakers in implementing valuation tools to support and justify sustainable urban programmatic choices. Further studies in this field need to focus on implementing indexes and indicator matrices to assess digital sustainability. This study may represent a starting point for completing the missing knowledge on digital sustainability in the urban sector.
There are five sections in this study. Following the introduction, Section 2 details the related literature review, and Section 3 details materials and methodology including the research design and search strategy. Section 4 elucidates the results of the study and presents the discussion focusing on the absence of digital indicators in the urban field. Finally, Section 5 discusses the conclusion, limitations, and future research directions.
2. Literature Review
Sustainability, and specifically sustainable urban planning is considered a mandatory strategy to improve livability, ensure self-sustaining communities, and reduce environmental impacts over the long-term [17]. Over the last decade, urban sustainability has become increasingly eminent both on political agendas and on scientific studies due to the recent European sustainability policies emission [18].
It is clear how difficult it is to measure such a volatile and aleatory concept as that of sustainability. However, the need to go through its measurement has become mandatory to ensure responsible and interoperable planning for policymakers. To help policymakers, municipalities, and public institutions to pragmatically measure, assess, and infer in the urban sustainable development field, the use of indicators and indexes can be a supportive and easily readable tool, if properly implemented [9,19,20,21]. Nowadays, the gap between theory and practice is evident. The literature and theory have developed various tools to measure urban sustainability that often discount the problem of an adequate interpretation of the concept of sustainability, which is vague and not unique [16].
The use of indicators has become increasingly important in recent years for two strictly related aspects:
- Their nature and purposes.
- Their outcomes.
Regarding the the first aspect, indicators can be seen not only as neutral and numerical instruments such as “data carriers” for measuring sustainability, but also considered as “messages carriers” [19,22,23,24,25]. As for this second aspect, indices and indicators are not only measurement tools that researchers and specialists use in their analysis, but are also political and normative tools used by policy makers and the public sector to set targets and funds [18,26].
To facilitate their application, Urban Sustainability Indicators (USIs) are used and classified according to different sustainable dimensions. The literature, studies, and practice have so far embraced the division of sustainability into three dimensions or pillars: economic, environmental or ecological, and social or governmental/ethical factors [9,10,11,17,27,28,29,30,31]. These three pillars are so widely accepted that this taxonomy is also known as the ‘‘Triple Bottom Line’’. Each pillar includes several indicators that can best represent and measure the state of the specific dimension. The sustainability concepts linked to these three dimensions focus primarily on improving long-term human well-being by balancing these three pillars. They provide for the reduction of resource consumption and environmental damage, maximizing efficiency in the use of resources and ensuring social equity and democracy [18,32,33,34,35,36,37,38,39].
In Table 1, we identified these three main urban sustainability dimensions including a brief description for each dimension, which summarizes the frameworks that the literature and practice link to each dimension. The descriptions are extracted from the related literature, attempting to describe urban sustainability divided into dimensions [9,40,41,42,43,44].
According to the literature, Social Sustainability is achieved by fostering the capability of present and future generations to create fair, rightful, and sustainable communities. The mandatory key words of the pillar related to this are: identities, relationships, institutions, participation, health, education, food, water, housing affordability, social cohesion, inequalities, justice, welfare, and equity [17,45]. Economic Sustainability refers to utilizing, preserving, and maintaining resources in urban development and management, generating long-term value, which must be achieved through optimal use, recycling, and protection of scarce natural resources [17,46,47,48]. The literature associated with this pillar uses keywords such as human and social capital, intergenerational equity for resources, distributional equity, optimal growth, and economic activity. Finally, Ecological Sustainability on an urban scale is directly linked to vulnerability and increasing resilience of citizens at the environmental level [28]. Both sustainable urban policies and urban environmental planning are crucial tools, capable of monitoring and managing ecological resources and services, biodiversity and natural ecosystems [17].
The literature and best practices associated with this pillar are concepts such as climate change, natural resource management and thresholds, resource and renewable energy consumption, infrastructure and cities, biodiversity and ecosystem.
In the same table, we have included the Sustainable Development Goals of the 2030 Agenda for Sustainable Development (SDGs) to be associated with each urban dimension that better fits the goal targets. Seven goals are associated with the Social Dimension, while six goals are included in the environmental dimension, and four goals with the economic dimension.
Despite the three-macro dimensions recognized above, some authors usually divide the Social Dimension into two categories: the Social and the Governance/Institutional dimensions. A recent literature review study conducted in 2021 was performed to identify how the authors classify USIs by pillars [49]. This study showed that about 60% of the analyzed papers did not organize the frameworks in pillars, only 18% of the studies were organized within four pillars (Economic, Environmental, Social, and Institutional/Governance), and 22% of the papers were organized into three sustainability dimensions (Economic, Environmental, and Social). [50].
Also, according to the EU’s 2022 Annual Sustainable Growth Strategy, sustainable transitions can be reach and need to be measured through four dimensions (Economic, Environmental, Social, and Governance) [50,51]. Composing a Transitions Performance Index (TPI), the EC monitors and ranks countries based on their progress towards fair and prosperous sustainability across the four mentioned transitions, focusing on resilience, inclusiveness, and sustainability. Each dimension is described as detailed in Table 1:
- Social: health life, work and inclusion, free or non-remunerated time, equality;
- Governance: fundamental rights, security, transparency, sound public finances;
- Economic: education, wealth, labor productivity and research and development intensity, industrial base;
- Environmental: reduction of greenhouse gas emissions, biodiversity, material use, energy productivity.
However, considering the recent update of the European Policy Guidelines, which includes digitalization as one of the main ambitions, we believe that it is mandatory to include this pillar as one of the sustainability dimensions mentioned above. This inclusion will lead to adequate recognition and assessment of the Digitalization Sustainability dimension as an independent pillar to be persecuted.
Digitalization has been defined in several ways in these recent years by the literature and sector studies [27,52,53,54]. However, the common thread of the definitions could be summarized as “the way many domains of social life are restructured around digital communication and media infrastructures” [55]. Digitalization is an effective and recognized tool that can improve effectiveness, interoperability, and transparency, reducing costs and wastefulness through automatization in many different fields and sectors. Many studies have been conducted to define whether and how digital technologies are really supporting sustainable developments by helping to address the major challenges of tackling climate change [56].
It can be said that little has been studied about the effects of digitization on the urban system compared to other areas. However, today it is accepted worldwide that intangible investments, such as digitalization and R&D, information technology, artificial intelligence and ‘big data’ development and exploitation changed the accounting, financial, and enterprises world. In addition to this, a change in the accounting method is required [57,58]. Digitalization and intangible investments are recognized as non-assessed value capturing in the accounting field. Due to this lack, in 2019 Lev [58] proposed a reform in accounting approaches. This change, required by Lev for non-tangible assessment, is necessary not only in the accounting field, but in general in all sectors that include intangible investments, such as the urban field.
As mentioned, several fields could take advantages from digital sustainability, creating new opportunities for sustainable developments [15]. However, on the other hand, digitization also implies new challenges in balancing technological drive, energy consumption, and social imbalances. It is mandatory to balance the use of digital technology fairly and wisely in order to not penalize yield distribution nor increase inequalities [59,60,61].
Few studies have been performed on how digitalization can negatively affect both environmental and social sustainability [62]. However, despite the possible dual effects that digitization may have on the sustainability pillars, it can still be said that digitalization could be an effective tool in urban planning and building design if properly applied, through technology that improves efficiency, smartness, and reduction of emissions, waste of resources, and time [63].
In this perspective, we want to explore how digitalization can pave the way for sustainable development, even in the urban field. We propose Digitalization as a Sustainable Dimension in the urban field to be included in the existing three sustainable pillars, implementing a new Dimensions Classification that we are going to call from here onward the ESED Classification (Economic-Social-Environmental-Digital).
On the basis of this, in the next Section we will demonstrate that urban sustainable indicators and indexes are lacking in assessing the digital sphere both at the literature and the European Commission levels, underestimating the digital dimension.
3. Materials and Methods—Indicators for Urban Sustainability
In the urban context, the use of indexes and indicators to assess urban sustainability levels has become increasingly important in supporting urban regions’ transitions [64,65]. This is due to the key role of urban assessment, which started to distinguish between sustainable and unsustainable investments. The impact of urban indicators is crucial in assessing urban development process. Indicators help policymakers, decision-makers, and more in general the public to better understand and map the status of a regional area, measuring and assessing its current strengths and weaknesses. By defining needs and opportunities policymakers can easier identify urban development priorities and strategies according to sustainable targets [17,66]. Indicators are used to improve urban assessment robustness of urban assessment and to secure the analysis. To assess different levels of sustainability often indicators are compounded together to create ad hoc indexes. Simple indicators, which assess individual phenomena, can be weighted together to compose indexes capable of describing complex scenarios [67]. Indicators and indexes are often used mainly for two reasons. First, they are quantitative measures easily readable by the involved stakeholders in the decision-making processes, who are often not technicians. Indeed, indicators can help them to implement informed decisions without ambiguity, which can be clearly reported to the community [68,69]. Furthermore, indicators can be used through all the stages of the urban process comparing expectations, results and impacts in sustainability targets [70]. Due to their impact on public decision policy, since the early 90′s many studies focused on the classification and selection of Urban Sustainability indicators. However, since then many aspects of urban developments have been changed and even European Policy has been update trying to integrate these changes and new features in Sustainability concepts.
The approach applied in this study followed the three phases showed below and presented in Figure 1. A fourth phases will be conducted in future research as an application of the current results.
Phase I provides for an extensive review of USIs both in Literature (Step I) and through the European SDGs (Step II). The 2019 Political Guidelines focused on six headline ambitions for Europe are considered as leverage steps toward sustainable programmatic choices in different fields. However, we investigated whether academic studies have internalized Digitalization Goals and Targets set off by the EC to respond to urgent sustainable needs in the urban field as well. To achieve this, we analyzed studies on the Urban Sustainable Assessment that occurred after Political Guidelines publications in Step1, from 2020 onwards. We want to respond to the following question: “has the digital transition been taken into account and internalized in the assessment of urban sustainability?”
There is an extensive literature review on USIs and an accurate classification of indicators that has been run by Verma and Raghubanshi in 2018 [9]. However, what happened next? We conducted a systematic ESED Classification of urban sustainability indicators by comparing existing studies in Urban Sector. In Step II, we organized Sustainable development goals Indicators (SDGIs) according to our ESED Classification.
Phase II provides a statistical analysis of the data collected in Phase I and presents these results. In Phase III, to recognize the importance and the impact that Digital Transition will have on Urban Filed, we proposed to implement the Digital Sustainable Dimension, introducing new digital indicators to be drawn from different fields.
3.1. Phase I—Indicators for Urban Sustainability
3.1.1. Academic Studies
In collecting the sets of indicators, the retrieval of measurement initiatives from academia was deemed necessary to verify whether and how literature has internalized digital transition in its approaches as one of the European new Pillar. Only documents published from 2020 onwards have been analyzed.
Academic measurement initiatives were identified through a systematic literature review, for which the Scopus search engine was selected due to its wide coverage of sustainability journals. This was then crossed with a Google Scholar search. The search was conducted using ‘urban’ AND ‘sustain*’ (to include both the terms “Sustainability” and “Sustainable”) as keywords from 2020 onwards, with the following query: TITLE (urban AND sustainab*) AND (LIMIT-TO (PUBYEAR, 2022) OR LIMIT-TO (PUBYEAR, 2021) OR LIMIT-TO (PUBYEAR, 2020)) AND (LIMIT-TO (LANGUAGE, “English”)) AND (EXCLUDE (SUBJAREA, “ARTS”) OR EXCLUDE (SUBJAREA, “MATH”) OR EXCLUDE (SUBJAREA, “MEDI”) OR EXCLUDE (SUBJAREA, “CENG”) OR EXCLUDE (SUBJAREA, “PHYS”) OR EXCLUDE (SUBJAREA, “BIOC”) OR EXCLUDE (SUBJAREA, “PSYC”) OR EXCLUDE (SUBJAREA, “CHEM”) OR EXCLUDE (SUBJAREA, “NURS”) OR EXCLUDE (SUBJAREA, “VETE”) OR EXCLUDE (SUBJAREA, “HEAL”) OR EXCLUDE (SUBJAREA, “IMMU”) OR EXCLUDE (SUBJAREA, “NEUR”)). In the first selection, all studies not strictly correlated and relevant to the current research topic were excluded. The remaining selection yielded 962 results as of July 20, 2022, which have been reduced to 150 including the ‘inde*’ query. We then crossed this search output with the search that was run in Google Scholar. The remaining studies were then filtered and included in the final sample according to the following criteria: (i) large-scale application, at least 30 indexes included in each study; (ii) clear and comprehensive focus on sustainability; (iii) urban scale field recognition; and (iv) list of indicators or indexes that can be clearly identified and accessible. The application of the filters mentioned above yielded a final sample of 1.112 indexes through 10 selected studies.
To determine how urban sustainability translates into metrics, a systematic analysis of the 1.112 collected indexes was carried out, assigning a Sustainability Dimension and a Sustainability Sub-Areas to each indicator. The Sustainability Dimensions selected as described in Section 2 can be classified as ESED, including Economic, Social/governance/institutional, Environmental, and Digital Dimensions.
We presented our results in Table 2, which classifies indexes and indicators of the different Authors by Dimensions and Sub-Areas.
3.1.2. Sustainable Development Goals Indicators
In Step 2 of Phase I, we analyzed the SDGIs as presented by EC. Established by the United Nations’ 2030 Agenda for Sustainable Development, the Sustainable development goals Indicators (SDGIs) set up major principles and priorities, representing a combined goal- and issue-oriented framework [71]. The 17 SDGs covers a thematic area (Goal) and is further sub-devided in169 Targets and 231 unique indicators, However, we need to emphasize that the total actual number of SDGIs is 248, 13 of them have been used multiple times under different targets. The proposed SDGIs have been linked to the most applicable and pertinent categories within each. According to this classification, each indicator has been identified with a cross-typological characterization to standardize comparisons and statistical analysis. As said, each indicator is identified by a unique code that identifies the Goal and the Target, to whom the indicator belongs. For example, the Indicator “Ratio of land consumption rate to population growth rate” is identified by the code number 11.3.1, which means that this indicator is the first one (0.1) belonging to Goal 11 (“Make cities and human settlements inclusive, safe, resilient and sustainable”) and to Target 3 (“By 2030, enhance inclusive and sustainable urbanization and capacity for participatory, integrated and sustainable human settlement planning and management in all countries).
As we performed with academic studies, we then classified the 231 indicators, set by the UN, into the four Sustainable Dimensions (ESED) identified by the authors. After analyzing SDGs Indicators, we acknowledged that some of them were the combination of multi-index. Some indicators proposed by the SDGs are characterized by complex formulations and are a combination of several and different factors. For this reason, we had to classify them under multiple and non-univocal Sustainable Dimensions. As shown in the Venn Diagram (Figure 2), many indicators have been placed under two or more different dimensions.
4. Results and Discussion—Phase II and III
It is crucial to analyze the results of our classifications. This study identified and classified under each dimension over 1.390 indicators.
According to the summary of the descriptive analysis (Table 3), which combined the classification of both Academic Studies and SDGs Indicators, 20% of the Indexes (i.e., 277) have been classified in the Economic Dimension, 30% of the Indexes (i.e., 423) have been classified in the Social Dimension, 48% of the Indexes (i.e., 672) have been classified in the Environmental Dimension and only 2% of the Indexes (i.e., 22) have been classified in the Digital Dimension. According to our classification, the United Nations are the ones that mostly considered Digitalization Dimension in their indicators. The results of the SDGs Indicators show that 24% of the indexes were included in the Economic Dimension, 41% in the Social Dimension, 31% in the Environmental Dimension, and 5% in the Digital Dimension.
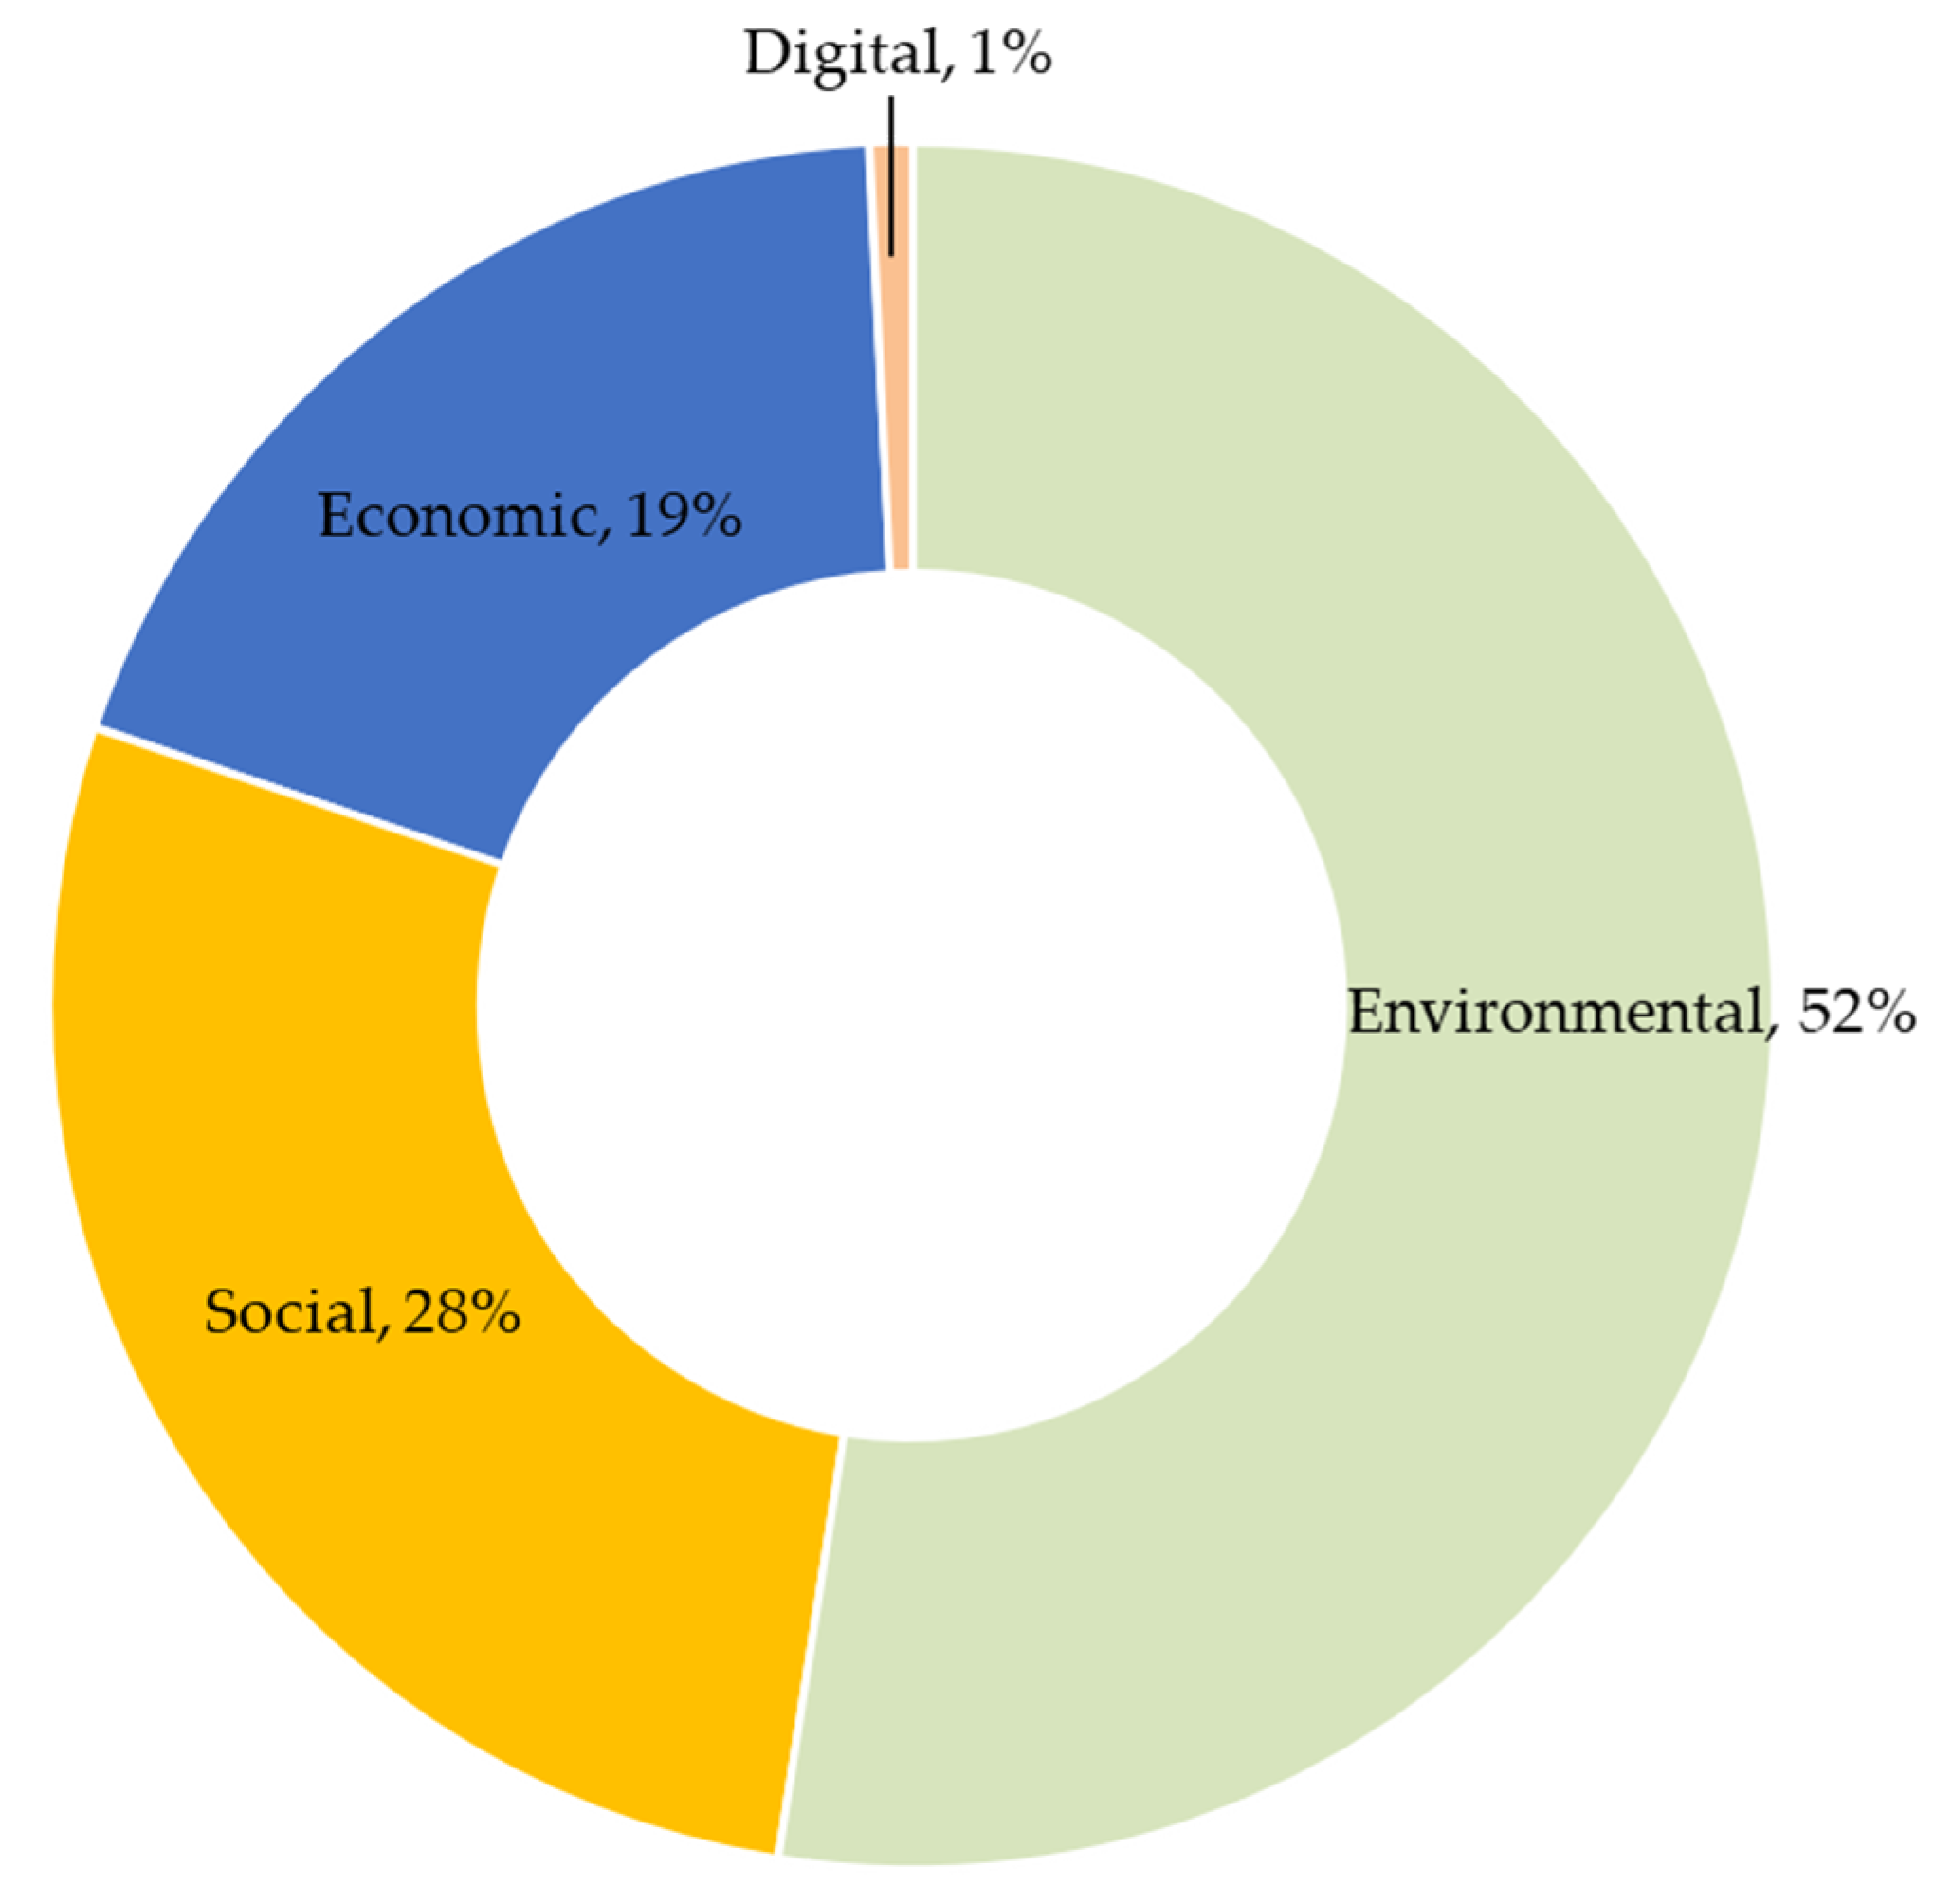
If we exclude the source of SDGs and analyze only the Academic Studies (Figure 3 and Figure 4), only four authors included at least one Digital indicator to account for Urban Digital Sustainability, with an average of only one digital indicator per study. According to Figure 4, 19% of the Indexes (i.e., 213) have been classified in the Economic Dimension, 31% of the Indexes (i.e., 311) have been classified in the Social Dimension, 59% of the Indexes (i.e., 589) have been classified in the Environmental Dimension and only 1% of the Indexes (i.e., 9) have been classified in the Digital Dimension.
Comparing Academic Studies with the classification of the European Goals (Table 4), it is clear that Academic Studies are decidedly more concerning and tend to pay more attention on the Environmental Dimension of Sustainability (52% vs. 31%), and they tend to underestimate the social (28% vs. 41%) and the digital dimension (1% vs. 5%) with respect to the UE Targets.
Analyzing the results of our ESED classification, as presented in Table 4, we can observe how the digital dimension at both UE and Academic Level is not adequately taken into account, with an overall average of only two digital indicators per study (Table 3), more precisely academic studies show an average of one digital indicator per study, with an average of 1% of the overall indicators, as shown in Table 4. At European level the number of digital indicators rises up to 13, with a 5% distribution, which is above the academic studies indications. These results stress out how academic research is still far behind the European requirements in terms of digital transition. The Digital Dimension, which is represented by the studies analyzed above, accounts for urban Sustainability by including the following indexes: Internet and digital access, services or skills, Mobile phone traffic or possession, Energy used for web servers, Domotica Percentage. Considering the strong emphasis that the EC is giving to the twin transition, these few indicators seem not to be exhaustive and seem to underestimate the sustainability measure of the digital dimension in the urban field, focusing mainly only on measuring digital sprawl rather than its sustainability.
An extensive literature review on the digital sustainability definition was provided by Wut et al., which exanimated this concept in several research fields. They summarized their findings describing digital sustainability as digital preservation along its overall life cycle in the socio-cultural and organizational context [72]. However, the introduction of new additional digital indicators will have to address the awareness that digitalization also leads to various sustainability challenges. The increase in digitization processes could generate spillover effects both at an environmental and social level. As regards environmental externalities, the increase in energy consumption could be a concern. In terms of social effects, the main problems could be related to increasing social vulnerability, due to the disparity and inequality in the distribution of value capture, and due to the increasing gap in information and technology access. This effect is well known as the digital divide effect [73].
Despite many studies focusing on digital sustainability definition, the literature shows a profound lack of contextualization and presence in the urban sector. As a consequence, today the absence of an appropriate selection of indices and indicators capable of defining the Sustainable Dimension is relevant. An attempt to introduce digitalization indicators in urban contests was made by Dmitrieva and Guseva [74]. The authors proposed to take into account the digitalization factor as one of the keys to assessing territorial competitiveness. However, this study takes into account only the traditional concept of urban competitiveness from an economic point of view and does not seek global sustainability. Feroz et al. mentioned the impact that digitalization is having on urban sustainability, focusing on a literature review of studies on smart cities and sustainable cities [75]. Yet, they do not account for sustainable assessment and measure through indexes and indicators. In fact, they limit their study to verifying whether it is well accepted, by current literature, that digitization contributes to resilience and sustainability of the urban sector.
Considering that urban studies lack consideration and therefore measurement of digital sustainability, our suggestion is to look for digital indexes and indicators in other fields, such as entrepreneurial, business financial, and industrial fields. These areas have a more consolidated and sensitive awareness of the impact and the effects that digitalization could have on the dimension of sustainability, given the longer contacts that they had with digital transformations. These fields already recognized digitalization impacts on costs, spaces, optionality, resilience, and information asymmetries in their systems. To verify which sectors are highly involved in the digital sustainability assessment, we first run a literature review on Scopus and exported in VOSviewer. The VOSviewer software was used to analyze the keywords “digital index” and “digital indicators” [76]. This software allows users to visualize data maps of bibliometric networks based on Visualization of Similarities (VOS) and it is ussually used to perform preliminary research litterature review [77,78,79]. The distance between the nodes (in our cases the names of the Journals) is proportional to the divergence that occurs between the topics of the journals [80].
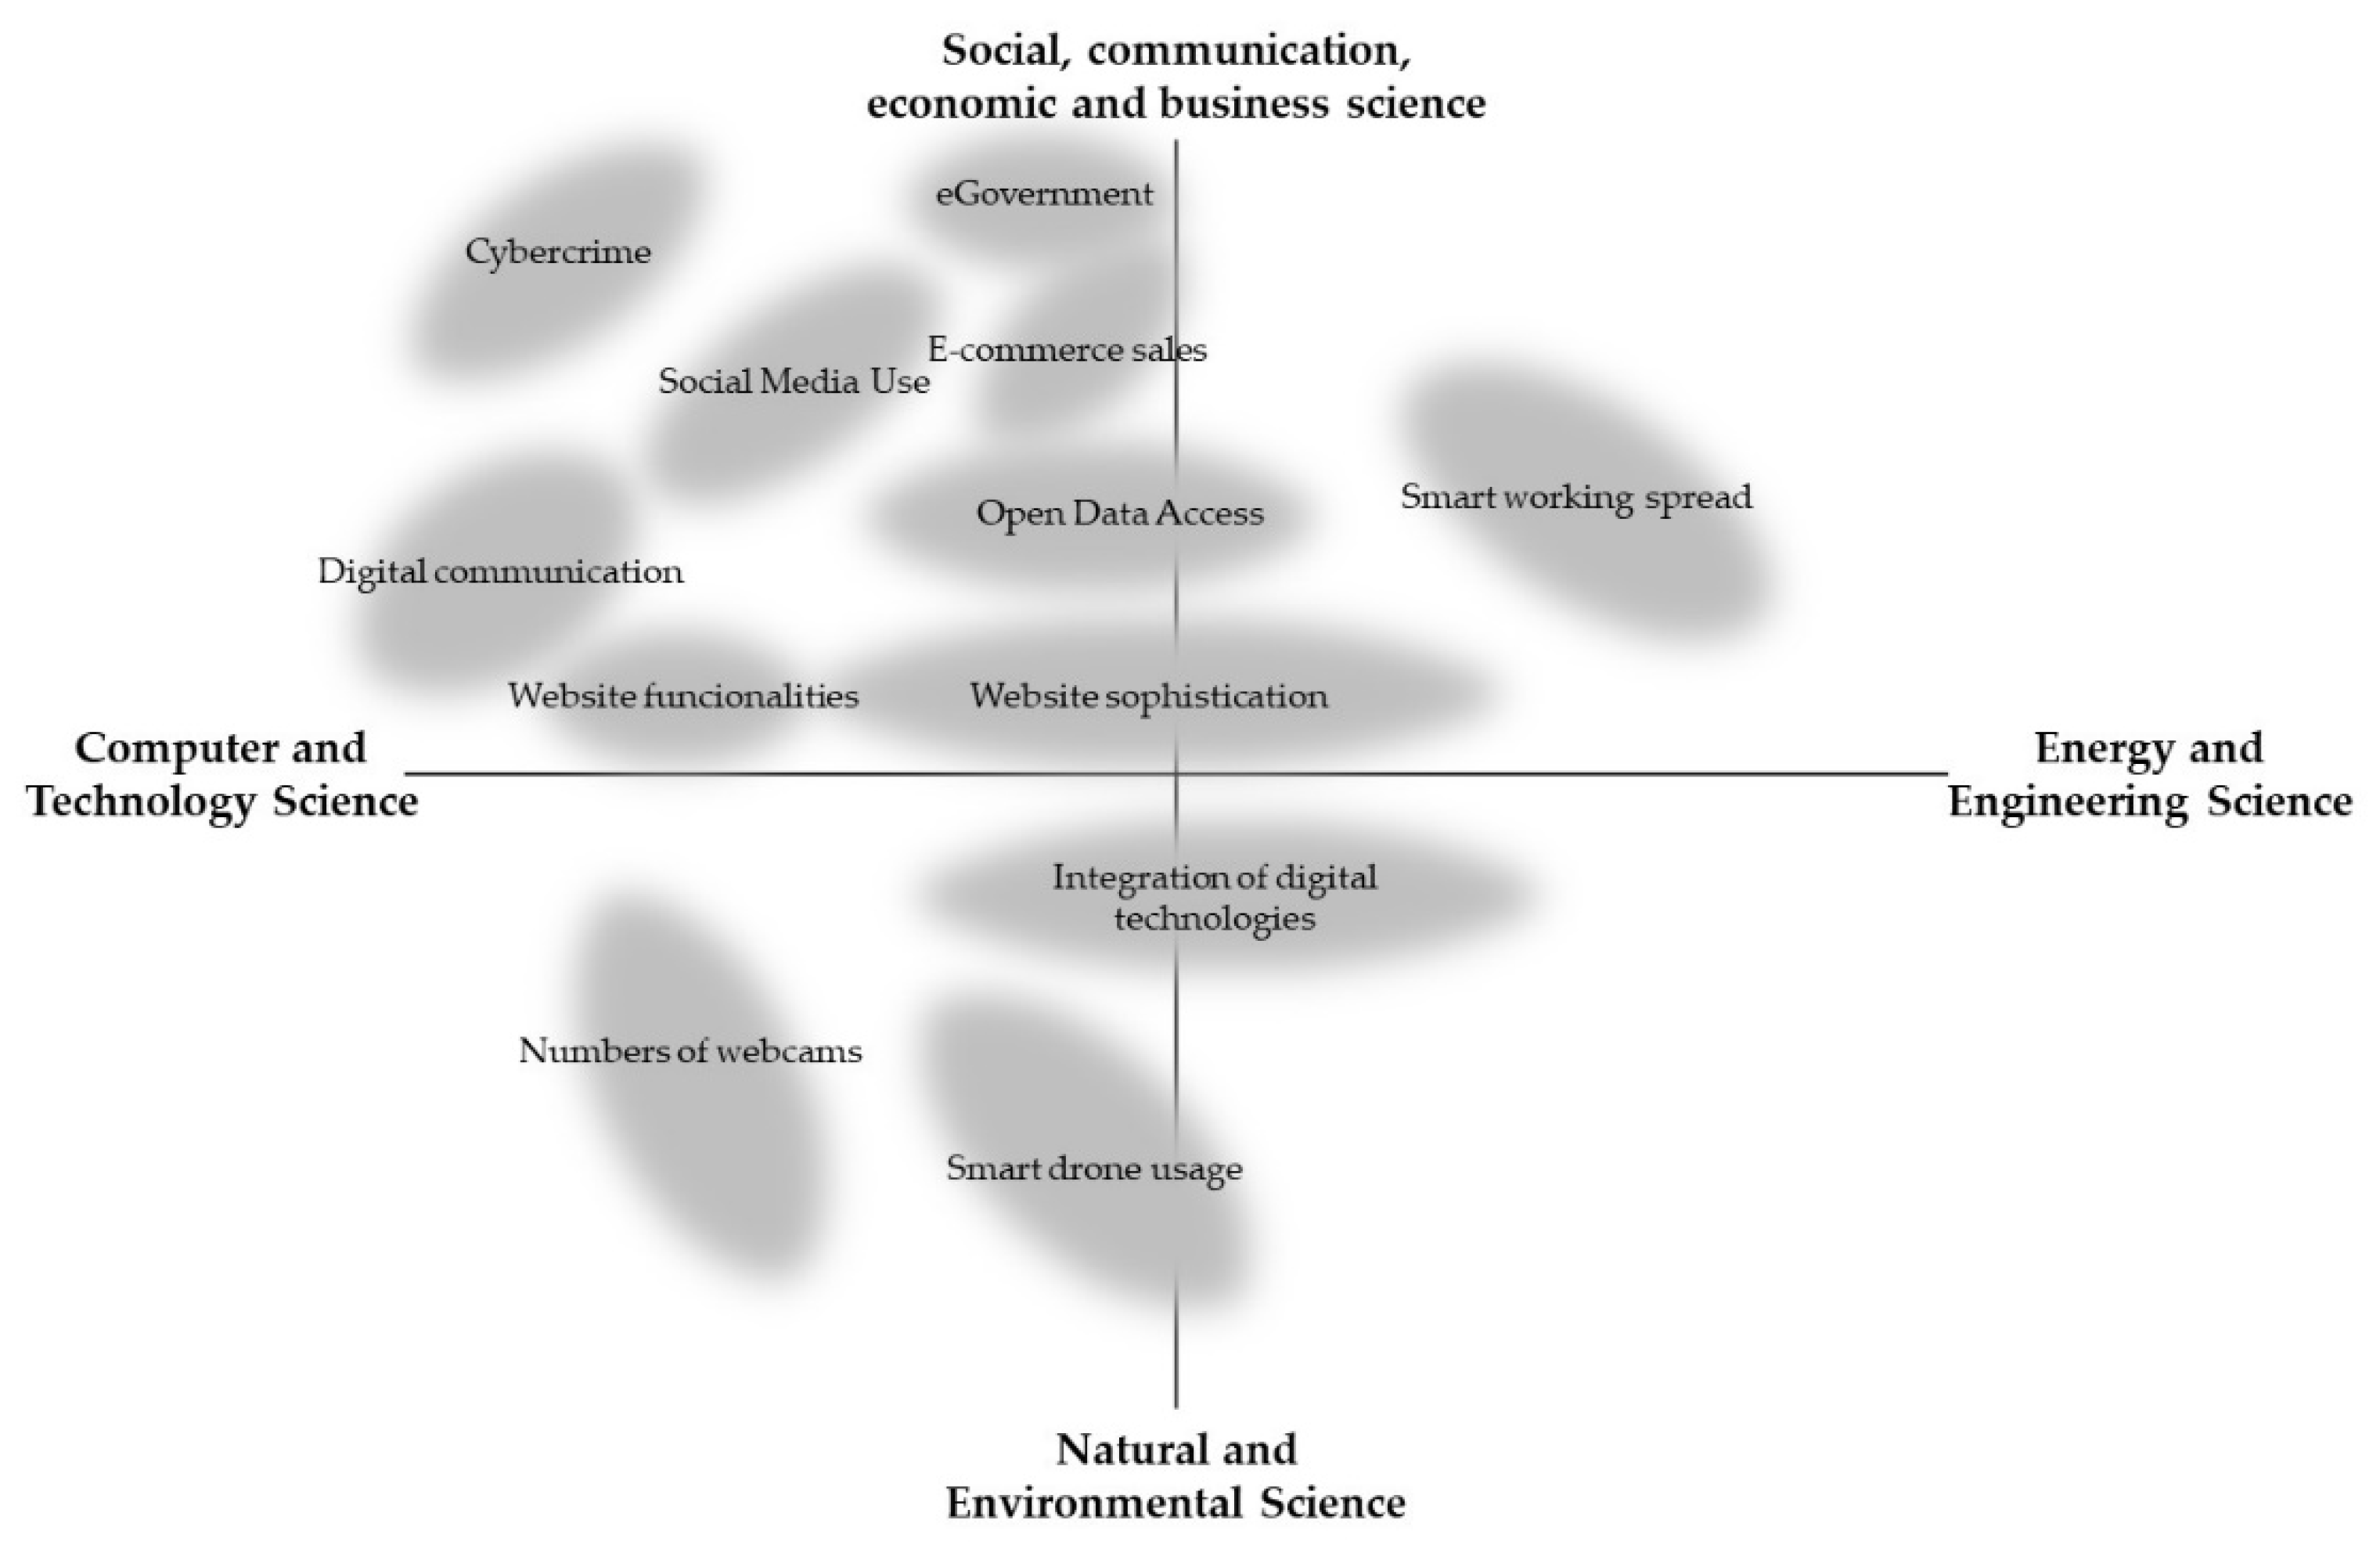
Through this logic, our two-dimensional map (Figure 5) represents the existing network between journals that published papers and sudies between 2020 and 2022 that include the keywords mentioned above. In addition, the size of the nodes is weighted by the number of articles published in the quoted journal based on the selected query.
The analysis produced a total of five clusters which represent five different journal topics. According to the names of the journals, these are the main topics for each cluster:
- Cluster 1: social, communication, economic and business science.
- Cluster 2: natural and environmental science.
- Cluster 3: computer and technology science.
- Cluster 4: energy and engineering.
- Cluster 5: material and mechanical science.
This clustering can help identify the most relevant fields that study and suggest digital indicators to measure sustainable systems.
We further analyzed, in depth, some of the papers mentioned above to search for digital indicators and indices that could encourage and be a sort of guideline to the urban sector in measuring digital sustainability. In Figure 6, we reported the results of this preliminary research, identifying the most recurrent digital indexes classified by the field of belonging. Most of the indexes detected belong to the social and economic and to information and technology fields. [27,81,82,83,84].
The indices and indicators examined are a possible driver for further research as a link between the urban field and the digital sustainability assesment. However, these indices need to be deeper analyzed to better interpret the urban dimension and its peculiarites. We believe that a systematic review of these indicators and indices could help urban studies to implement the assessment of the Digital Sustainable Dimension, which can be an engine for the development of marginal urban regions.
5. Conclusions
In the near future, new digital technologies will increasingly lead us to convert traditional activities and processes towards new forms of virtual actions. Digitization will therefore bring new challenges to be faced in a “hybrid” virtual space with countless benefits. However, we are still unprepared to properly and wisely assess the economic, environmental, and social risks and implications. In this uncertain and unexplored near future, marginal urban regions need to ensure programmatic choices for sustainable development. To support them in their decisions, we believe that it will be extremely important to correctly assess and measure the sustainability of their choices. In this global contest, sustainability includes four pillars: Economic, Social, Environmental, and Digital (ESED Classification).
By analyzing the scientific literature of the last three years in the urban sector, the lack of sensitivity and digital evaluation was highlighted. Furthermore, our study proposes new indicators to be transferred to the urban environment to measure digital sustainability. This report is the starting point for follow-up studies that have the potential to introduce the digital dimension into the urban sector. In particular, further studies will have to focus on the possible correlations between these four pillars (ESED). Indeed, the identification of new indicators and evaluation matrices capable of measuring the sustainability of urban development will be crucial to promote sustainable marginal regional investments.
Author Contributions
Conceptualization, R.C. and G.M.; methodology, R.C.; software, R.C.; validation, R.C. and G.M.; formal analysis, R.C.; investigation, R.C.; resources, R.C.; data curation, R.C.; writing—original draft preparation, R.C.; writing—review and editing, G.M.; visualization, R.C.; supervision, G.M.; project administration, R.C.; funding acquisition, R.C. and G.M. All authors have read and agreed to the published version of the manuscript.
Funding
This paper is based upon research funded by European Social Fund REACT EU–PON “Research and Innovation” 2014–2020, Ministero dell’Università e della Ricerca MUR-DM 1062/2021, and Sinloc SpA (Sistemi Iniziative Locali), gratefully acknowledged by the authors.
Conflicts of Interest
The authors declare no conflict of interest.
References
- Trovato, M.R.; Cappello, C. Climate Adaptation Heuristic Planning Support System (HPSS): Green-Blue Strategies to Support the Ecological Transition of Historic Centres. Land 2022, 11, 773. [Google Scholar] [CrossRef]
- Cilliers, E.J.; Sankaran, S.; Armstrong, G.; Mathur, S.; Nugapitiya, M. From Urban-Scape to Human-Scape: COVID-19 Trends That Will Shape Future City Centres. Land 2021, 10, 1038. [Google Scholar] [CrossRef]
- Soroui, S.T. Understanding the Drivers and Implications of Remote Work from the Local Perspective: An Exploratory Study into the Dis/Reembedding Dynamics. Technol. Soc. 2021, 64, 101328. [Google Scholar] [CrossRef]
- Von der Leyen, U. Political Guidelines for the Next European Commission 2019–2024 Opening Statement in the European Parliament Plenary Session Speech in the European Parliament Plenary Session Ursula von Der Leyen; Publication Office of the European Union: Luxembourg, 2019; ISBN 9789276143802. [Google Scholar]
- Wolf, S.; Teitge, J.; Mielke, J.; Schütze, F.; Jaeger, C. The European Green Deal—More Than Climate Neutrality. Intereconomics 2021, 56, 99–107. [Google Scholar] [CrossRef]
- Kyriazi, A.; Miró, J. Towards a Socially Fair Green Transition in the EU? An Analysis of the Just Transition Fund Using the Multiple Streams Framework. Comp. Eur. Polit. 2022. [Google Scholar] [CrossRef]
- Newell, P.; Simms, A. How Did We Do That? Histories and Political Economies of Rapid and Just Transitions. New Polit. Econ. 2021, 26, 907–922. [Google Scholar] [CrossRef]
- Moussiopoulos, N.; Achillas, C.; Vlachokostas, C.; Spyridi, D.; Nikolaou, K. Environmental, Social and Economic Information Management for the Evaluation of Sustainability in Urban Areas: A System of Indicators for Thessaloniki, Greece. Cities 2010, 27, 377–384. [Google Scholar] [CrossRef]
- Verma, P.; Raghubanshi, A.S. Urban Sustainability Indicators: Challenges and Opportunities. Ecol. Indic. 2018, 93, 282–291. [Google Scholar] [CrossRef]
- Meijering, J.V.; Tobi, H.; Kern, K. Defining and Measuring Urban Sustainability in Europe: A Delphi Study on Identifying Its Most Relevant Components. Ecol. Indic. 2018, 90, 38–46. [Google Scholar] [CrossRef]
- Shen, L.Y.; Jorge Ochoa, J.; Shah, M.N.; Zhang, X. The Application of Urban Sustainability Indicators—A Comparison between Various Practices. Habitat Int. 2011, 35, 17–29. [Google Scholar] [CrossRef]
- Shen, L.; Kyllo, J.M.; Guo, X. An Integrated Model Based on a Hierarchical Indices System for Monitoring and Evaluating Urban Sustainability. Sustainability 2013, 5, 524–559. [Google Scholar] [CrossRef] [Green Version]
- Shmelev, S.E.; Shmeleva, I.A. Global Urban Sustainability Assessment: A Multidimensional Approach. Sustain. Dev. 2018, 26, 904–920. [Google Scholar] [CrossRef]
- Tang, J.; Zhu, H.L.; Liu, Z.; Jia, F.; Zheng, X.X. Urban Sustainability Evaluation under the Modified TOPSIS Based on Grey Relational Analysis. Int. J. Environ. Res. Public Health 2019, 16, 256. [Google Scholar] [CrossRef] [Green Version]
- Konys, A. How to Support Digital Sustainability Assessment? An Attempt to Knowledge Systematization. Procedia Comput. Sci. 2020, 176, 2297–2311. [Google Scholar] [CrossRef]
- Keirstead, J.; Leach, M. Bridging the Gaps between Theory and Practice: A Service Niche Approach to Urban Sustainability Indicators. Sustain. Dev. 2008, 16, 329–340. [Google Scholar] [CrossRef]
- Zeng, X.; Yu, Y.; Yang, S.; Lv, Y.; Sarker, M.N.I. Urban Resilience for Urban Sustainability: Concepts, Dimensions, and Perspectives. Sustainability 2022, 14, 2481. [Google Scholar] [CrossRef]
- Huang, L.; Wu, J.; Yan, L. Defining and Measuring Urban Sustainability: A Review of Indicators. Landsc. Ecol. 2015, 30, 1175–1193. [Google Scholar] [CrossRef]
- Merino-Saum, A.; Halla, P.; Superti, V.; Boesch, A.; Binder, C.R. Indicators for Urban Sustainability: Key Lessons from a Systematic Analysis of 67 Measurement Initiatives. Ecol. Indic. 2020, 119, 106879. [Google Scholar] [CrossRef]
- Tanguay, G.A.; Rajaonson, J.; Lefebvre, J.F.; Lanoie, P. Measuring the Sustainability of Cities: An Analysis of the Use of Local Indicators. Ecol. Indic. 2010, 10, 407–418. [Google Scholar] [CrossRef]
- Boyko, C.T.; Gaterell, M.R.; Barber, A.R.G.; Brown, J.; Bryson, J.R.; Butler, D.; Caputo, S.; Caserio, M.; Coles, R.; Cooper, R.; et al. Benchmarking Sustainability in Cities: The Role of Indicators and Future Scenarios. Glob. Environ. Chang. 2012, 22, 245–254. [Google Scholar] [CrossRef]
- Astleithner, F.; Hamedinger, A. The Analysis of Sustainability Indicators as Socially Constructed Policy Instruments: Benefits and Challenges of “Interactive Research”. Local Environ. 2003, 8, 627–640. [Google Scholar] [CrossRef]
- Gudmundsson, H. The Policy Use of Environmental Indicators—Learning from Evaluation Research. J. Transdiscipl. Environ. Stud. 2003, 2, 1–12. [Google Scholar]
- Elgert, L. Rating the Sustainable City: ‘Measurementality’, Transparency, and Unexpected Outcomes at the Knowledge-Policy Interface. Environ. Sci. Policy 2018, 79, 16–24. [Google Scholar] [CrossRef]
- Lehtonen, M.; Sébastien, L.; Bauler, T. The Multiple Roles of Sustainability Indicators in Informational Governance: Between Intended Use and Unanticipated Influence. Curr. Opin. Environ. Sustain. 2016, 18, 1–9. [Google Scholar] [CrossRef]
- Wu, J.; Wu, T. Sustainability indicators and indices: An overview. In Handbook of Sustainability Management; World Scientific: Singapore, 2011; pp. 65–86. ISBN 978-981-4354-81-3. [Google Scholar]
- Sacco, P.; Gargano, E.R.; Cornella, A. Sustainable Digitalization: A Systematic Literature Review to Identify How to Make Digitalization More Sustainable. IFIP Adv. Inf. Commun. Technol. 2021, 635, 14–29. [Google Scholar] [CrossRef]
- Mori, K.; Christodoulou, A. Review of Sustainability Indices and Indicators: Towards a New City Sustainability Index (CSI). Environ. Impact Assess. Rev. 2012, 32, 94–106. [Google Scholar] [CrossRef]
- D’Alpaos, C.; Andreolli, F. Urban Quality in the City of the Future: A Bibliometric Multicriteria Assessment Model. Ecol. Indic. 2020, 117, 106575. [Google Scholar] [CrossRef]
- Giuffrida, S.; Trovato, M.R.; Falzone, M. The Information Value for Territorial and Economic Sustainability in the Enhancement of the Water Management Process; Springer: Cham, Switzerland, 2017; Volume 10406 LNCS, ISBN 9783319623979. [Google Scholar]
- Trovato, M.R.; Giuffrida, S. The Protection of Territory from the Perspective of the Intergenerational Equity; Springer: Cham, Switzerland, 2018. [Google Scholar]
- Bottero, M.; Caprioli, C.; Cotella, G.; Santangelo, M. Sustainable Cities: A Reflection on Potentialities and Limits Based on Existing Eco-Districts in Europe. Sustainability 2019, 11, 5794. [Google Scholar] [CrossRef] [Green Version]
- Lami, I.M.; Bottero, M.; Abastante, F. Multiple criteria decision analysis to assess urban and territorial transformations: Insights from practical applications BT. In Strategic Decision Making for Sustainable Management of Industrial Networks; Rezaei, J., Ed.; Springer International Publishing: Cham, Switzerland, 2021; pp. 93–117. ISBN 978-3-030-55385-2. [Google Scholar]
- D’andria, E.; Fiore, P.; Nesticò, A. Small Towns Recovery and Valorisation. An Innovative Protocol to Evaluate the Efficacy of Project Initiatives. Sustainability 2021, 13, 10311. [Google Scholar] [CrossRef]
- Nesticò, A.; Elia, C.; Naddeo, V. Sustainability of Urban Regeneration Projects: Novel Selection Model Based on Analytic Network Process and Zero-One Goal Programming. Land Use Policy 2020, 99, 104831. [Google Scholar] [CrossRef]
- Bencardino, M.; Nesticò, A.; Esposito, V.; Valanzano, L. The Role of the Institutional Dimension in Defining Sustainable Development Policies in Italy; Springer: Cham, Switzerland, 2022; Volume 482 LNNS, ISBN 9783031068249. [Google Scholar]
- Nesticò, A.; Passaro, R.; Maselli, G.; Somma, P. Multi-Criteria Methods for the Optimal Localization of Urban Green Areas. J. Clean. Prod. 2022, 374, 133690. [Google Scholar] [CrossRef]
- De Paola, P.; Tajani, F.; Locurcio, M.; Di Liddo, F. Sustainable Real Estate and Resilient Cities: Management, Assessment and Innovations. Sustainability 2022, 14, 8984. [Google Scholar] [CrossRef]
- Del Giudice, V.; De Paola, P.; Forte, F. Valuation of Historical, Cultural and Environmental Resources, between Traditional Approaches and Future Perspectives; Springer: Cham, Switzerland, 2018. [Google Scholar]
- Hamilton, K. Where Is the Wealth of Nations? Measuring Capital for the 21st Century; World Bank Publications: Washington, DC, USA, 2006. [Google Scholar]
- Moldan, B.; Janoušková, S.; Hák, T. How to Understand and Measure Environmental Sustainability: Indicators and Targets. Ecol. Indic. 2012, 17, 4–13. [Google Scholar] [CrossRef]
- Feleki, E.; Vlachokostas, C.; Moussiopoulos, N. Holistic Methodological Framework for the Characterization of Urban Sustainability and Strategic Planning. J. Clean. Prod. 2020, 243, 118432. [Google Scholar] [CrossRef]
- Anand, S.; Sen, A. Human Development and Economic Sustainability. Sustainability 2017, 28, 421–441. [Google Scholar] [CrossRef] [Green Version]
- Longoni, A.; Cagliano, R. Environmental and Social Sustainability Prioritiesn: Their Integration in Operations Strategies. Int. J. Oper. Prod. Manag. 2015, 35, 216–345. [Google Scholar] [CrossRef]
- Bibri, S.E. Advances in the Leading Paradigms of Urbanism and Their Amalgamation: Compact Cities, Eco–Cities, and Data–Driven Smart Cities; Springer Nature: Berlin/Heidelberg, Germany, 2020; ISBN 9783030417451. [Google Scholar]
- Anejionu, O.C.D.; Thakuriah, P.V.; McHugh, A.; Sun, Y.; McArthur, D.; Mason, P.; Walpole, R. Spatial Urban Data System: A Cloud-Enabled Big Data Infrastructure for Social and Economic Urban Analytics. Futur. Gener. Comput. Syst. 2019, 98, 456–473. [Google Scholar] [CrossRef] [Green Version]
- Canesi, R. Urban Policy Sustainability through a Value-Added Densification Tool: The Case of the South Boston Area. Sustainability 2022, 14, 8762. [Google Scholar] [CrossRef]
- Canesi, R.; D’Alpaos, C.; Marella, G. A Case of Local Community Engagement for Urban Regeneration: The South Boston Area; Springer: Cham, Switzerland, 2022. [Google Scholar]
- Michalina, D.; Mederly, P.; Diefenbacher, H.; Held, B. Sustainable Urban Development: A Review of Urban Sustainability Indicator Frameworks. Sustainability 2021, 13, 9348. [Google Scholar] [CrossRef]
- European Commission, Directorate-General for Research and Innovation. Transition Performance Index 2021. Towards Fair and Prosperous Sustainability; European Commission: Brussels, Belgium, 2022; ISBN 9789276471400. [Google Scholar]
- Mcguinn, J.; Fries-Tersch, E.; Jones, M.; Crepaldi, C.; Masso, M.; Kadarik, I.; Samek Lodovici, M.; Drufuca, S.; Gancheva, M.; Geny, B. Social Sustainability: Concept and Brenchmarks; European Parliament: Luxembourg, 2020; Volume 139. [Google Scholar]
- Rachinger, M.; Rauter, R.; Müller, C.; Vorraber, W.; Schirgi, E. Digitalization and Its Influence on Business Model Innovation. J. Manuf. Technol. Manag. 2019, 30, 1741–1779. [Google Scholar] [CrossRef] [Green Version]
- Luz Martín-Peña, M.; Díaz-Garrido, E.; Sánchez-López, J.M. The Digitalization and Servitization of Manufacturing: A Review on Digital Business Models. Strateg. Chang. 2018, 27, 91–99. [Google Scholar] [CrossRef]
- Söderholm, P. The Green Economy Transition: The Challenges of Technological Change for Sustainability. Sustain. Earth 2020, 3, 6. [Google Scholar] [CrossRef]
- Brennen, J.S.; Kreiss, D. Digitalization. In The International Encyclopedia of Communication Theory and Philosophy; Wiley: Hoboken, NJ, USA, 2016; Volume 1. [Google Scholar]
- George, G.; Merrill, R.K.; Schillebeeckx, S.J.D. Digital Sustainability and Entrepreneurship: How Digital Innovations Are Helping Tackle Climate Change and Sustainable Development. Entrep. Theory Pract. 2021, 45, 999–1027. [Google Scholar] [CrossRef] [Green Version]
- Lev, B.; Feng, G. The End of Accounting and the Path Forward for Investors and Managers; John Wiley & Sons, Ltd.: New York, NY, USA, 2016. [Google Scholar]
- Lev, B. Ending the Accounting-for-Intangibles Status Quo. Eur. Account. Rev. 2019, 28, 713–736. [Google Scholar] [CrossRef]
- Appio, F.P.; Frattini, F.; Petruzzelli, A.M.; Neirotti, P. Digital Transformation and Innovation Management: A Synthesis of Existing Research and an Agenda for Future Studies. J. Prod. Innov. Manag. 2021, 38, 4–20. [Google Scholar] [CrossRef]
- Mondejar, M.E.; Avtar, R.; Diaz, H.L.B.; Dubey, R.K.; Esteban, J.; Gómez-Morales, A.; Hallam, B.; Mbungu, N.T.; Okolo, C.C.; Prasad, K.A.; et al. Digitalization to Achieve Sustainable Development Goals: Steps towards a Smart Green Planet. Sci. Total Environ. 2021, 794, 148539. [Google Scholar] [CrossRef]
- Balogun, A.L.; Marks, D.; Sharma, R.; Shekhar, H.; Balmes, C.; Maheng, D.; Arshad, A.; Salehi, P. Assessing the Potentials of Digitalization as a Tool for Climate Change Adaptation and Sustainable Development in Urban Centres. Sustain. Cities Soc. 2020, 53, 101888. [Google Scholar] [CrossRef]
- Lange, S.; Pohl, J.; Santarius, T. Digitalization and Energy Consumption. Does ICT Reduce Energy Demand? Ecol. Econ. 2020, 176, 106760. [Google Scholar] [CrossRef]
- Fertner, C.; Aagaard Christensen, A.; Andersen, P.S.; Olafsson, A.S.; Præstholm, S.; Caspersen, O.H.; Grunfelder, J. Emerging Digital Plan Data–New Research Perspectives on Planning Practice and Evaluation. Geogr. Tidsskr. Danish J. Geogr. 2019, 119, 6–16. [Google Scholar] [CrossRef]
- Brovarone, E.V. Pianificazione Urbana e Comportamenti Di Viaggio: Più Di Una Relazione. TeMA J. Land Use Mobil. Environ. 2010, 3, 55–62. [Google Scholar] [CrossRef]
- Krahe, M. From System-Level to Investment-Level Sustainability. An Epistemological One-Way Street; Académie Royale de Belgique: Brussels, Belgium, 2021; Volume 3. [Google Scholar]
- Serrano-López, R.; Linares-Unamunzaga, A.; Muñoz San Emeterio, C. Urban Sustainable Mobility and Planning Policies. A Spanish Mid-Sized City Case. Cities 2019, 95, 102356. [Google Scholar] [CrossRef]
- Sta, H. Ben Quality and the Efficiency of Data in “Smart-Cities”. Futur. Gener. Comput. Syst. 2017, 74, 409–416. [Google Scholar] [CrossRef]
- Wu, J. Urban Ecology and Sustainability: The State-of-the-Science and Future Directions. Landsc. Urban Plan. 2014, 125, 209–221. [Google Scholar] [CrossRef]
- Colding, J.; Barthel, S. An Urban Ecology Critique on the “Smart City” Model. J. Clean. Prod. 2017, 164, 95–101. [Google Scholar] [CrossRef]
- Ahvenniemi, H.; Huovila, A.; Pinto-Seppä, I.; Airaksinen, M. What Are the Differences between Sustainable and Smart Cities? Cities 2017, 60, 234–245. [Google Scholar] [CrossRef]
- Sachs, J.; Kroll, C.; Lafortune, G.; Fuller, G.; Woelm, F. Sustainable Development Report 2022; Cambridge University Press: Cambridge, UK, 2022; ISBN 9781009210089. [Google Scholar]
- Wut, T.M.; Lee, D.; Ip, W.M.; Lee, S.W.; Hoffmann, S. Digital Sustainability in the Organization: Scale Development and Validation. Sustainability 2021, 13, 3530. [Google Scholar] [CrossRef]
- Stürmer, M. Characteristics of Digital Sustainability. ACM Int. Conf. Proceeding Ser. 2014, 2014, 494–495. [Google Scholar] [CrossRef] [Green Version]
- Dmitrieva, E.O.; Guseva, M.S. Accounting for the Digitalization Factor in Assessing Territorial Competitiveness. SHS Web Conf. 2019, 62, 13003. [Google Scholar] [CrossRef] [Green Version]
- Feroz, A.K.; Zo, H.; Chiravuri, A. Digital Transformation and Environmental Sustainability: A Review and Research Agenda. Sustainability 2021, 13, 1530. [Google Scholar] [CrossRef]
- Van Eck, N.J.; Waltman, L. VOSviewer Manual—Version 1.6.8; CWTS: Leiden, The Netherlands, 2018; ISBN 0305-1862. [Google Scholar]
- Silvestri, C.; Silvestri, L.; Piccarozzi, M.; Ruggieri, A. Toward a Framework for Selecting Indicators of Measuring Sustainability and Circular Economy in the Agri-Food Sector: A Systematic Literature Review; Springer: Berlin/Heidelberg, Germany, 2022; ISBN 1136702202. [Google Scholar]
- Merli, R.; Preziosi, M.; Acampora, A.; Lucchetti, M.C.; Petrucci, E. Recycled Fibers in Reinforced Concrete: A Systematic Literature Review. J. Clean. Prod. 2020, 248, 119207. [Google Scholar] [CrossRef]
- Jin, R.; Yuan, H.; Chen, Q. Science Mapping Approach to Assisting the Review of Construction and Demolition Waste Management Research Published between 2009 and 2018. Resour. Conserv. Recycl. 2019, 140, 175–188. [Google Scholar] [CrossRef]
- Bornmann, L.; Haunschild, R.; Hug, S.E. Visualizing the Context of Citations Referencing Papers Published by Eugene Garfield: A New Type of Keyword Co-Occurrence Analysis. Scientometrics 2018, 114, 427–437. [Google Scholar] [CrossRef] [PubMed] [Green Version]
- Esses, D.; Csete, M.S.; Németh, B. Sustainability and Digital Transformation in the Visegrad Group of Central European Countries. Sustainability 2021, 13, 5833. [Google Scholar] [CrossRef]
- Tiago, F.; Gil, A.; Stemberger, S.; Borges-Tiago, T. Digital Sustainability Communication in Tourism. J. Innov. Knowl. 2021, 6, 27–34. [Google Scholar] [CrossRef]
- Chandy, A. Pest Infestation Identification in Coconut Trees Using Deep Learning. J. Artif. Intell. Capsul. Networks 2019, 1, 10–18. [Google Scholar] [CrossRef]
- Kotarba, M. Measuring Digitalization-Key Metrics. Found. Manag. 2017, 9, 123–138. [Google Scholar] [CrossRef]
Figure 1.
Detailed steps of the Research Process. Source: Authors.

Figure 2.
Venn diagram of SDGIs classified by ESED. Source: Authors.

Figure 3.
Academic Studies: radar chart of Sustainability Indicators Dimensions by Authors.

Figure 4.
Academic Studies: pPie chart of Sustainability Indicators Dimensions.

Figure 5.
Source visualization 2-D map including “Digital” and “Index” and “Indicator” keywords. Source: authors’ elaboration using VOSviewer.
Figure 5.
Source visualization 2-D map including “Digital” and “Index” and “Indicator” keywords. Source: authors’ elaboration using VOSviewer.

Figure 6.
Digital Sustainability Indexes and Indicators suggested by different academic fields.


Table 1.
Urban Sustainability Dimensions: definitions and covered SDGs.
| Urban Sustainability Dimensions | Key Words (Literature Review) | Key Words (European Commission) | SDGs 2030 Agenda |
|---|---|---|---|
| Social & Governance/Institutional | Social values, Gender equality, Identities, Relationships and institutions, Health, education, Food, Water, Housing affordability, Social Cohesion, Inequalities and Justice, Welfare and Equity | Social: health life, work and inclusion, empowerment, free or non-remunerated time, equality, Governance: fundamental rights, security, transparency, sound public finances, education, wealth |  |
| Economic | Human and social capital, Intergenerational equity for resources, Distributional equity, Optimal growth, Economic activity | Labour productivity and research and development intensity, industrial base, economic growth, Trickle down |  |
| Environmental | Climate change, Natural resource management and thresholds, Resource and renewable energy consumption, Infrastructure and cities, Biodiversity and Ecosystem | Eco-system integrity, Carrying capacity, Greenhouse gas emissions reduction, biodiversity, material use, energy productivity |  |
Table 2.
The most popular USIs used in Literature after 2019, categorized by ESED Classification.
| Sustainability Dimensions | Sustainability Sub-Areas | Indicators | Feleki et al., 2020 | Maranghi, 2020 | Chao 2020 | Steiniger et al., 2020 | Mangi, 2020 | Merino-Saum, 2020 | Michalina 2021 | Robati & Rezael, 2021 | Zeng et al., 2022 | Amoushahi et al., 2022 |
|---|---|---|---|---|---|---|---|---|---|---|---|---|
| Economic | ||||||||||||
| Economic Employment | ||||||||||||
| Unemployment rate/duration | 1 | 1 | 1 | 1 | 1 | 2 | 28 | 2 | 3 | |||
| Qualified workers | 1 | |||||||||||
| Business Wellbeing | ||||||||||||
| Active business/competitiveness | 1 | 37 | 2 | |||||||||
| Green business | 2 | |||||||||||
| Local Activities/Businesses | 1 | 1 | ||||||||||
| Foreign direct investments | 1 | |||||||||||
| Poverty | ||||||||||||
| Per capita annual expenditures | 2 | 3 | ||||||||||
| Poverty rate | 1 | 1 | 1 | 12 | 1 | |||||||
| Engel coefficient | 1 | 1 | ||||||||||
| Child labor rate | 1 | |||||||||||
| Economic Wellbeing | ||||||||||||
| Retirement security | 1 | 13 | 1 | |||||||||
| Average income | 1 | 1 | 1 | 1 | 6 | 1 | 1 | |||||
| Cost of Living | 1 | |||||||||||
| GDPs | 3 | 1 | 10 | 1 | ||||||||
| Inflation rate | 13 | 1 | ||||||||||
| Households | 1 | |||||||||||
| Government debt | 1 | 2 | 17 | 1 | ||||||||
| GINI coefficient | 1 | 1 | ||||||||||
| R&D | ||||||||||||
| R&D costs | 14 | 1 | ||||||||||
| High-tech industries/employability | 1 | |||||||||||
| Political Situation | ||||||||||||
| War | 1 | |||||||||||
| Economic downturn | 1 | |||||||||||
| Health expenditure by government | 1 | 3 | ||||||||||
| Social | ||||||||||||
| Population | ||||||||||||
| Demographic | 3 | 1 | ||||||||||
| Family Size | 2 | |||||||||||
| Population growth rate | 1 | 1 | ||||||||||
| Immigration Rate | 1 | |||||||||||
| Population density | 1 | 1 | 1 | 13 | 1 | 1 | ||||||
| Education | ||||||||||||
| The number of schools | 1 | |||||||||||
| People Education Level/Years | 1 | 1 | 4 | 1 | 33 | 2 | 2 | |||||
| Medical care | ||||||||||||
| Mortality rate | 1 | 1 | ||||||||||
| Number of doctors/Health institutions | 5 | 1 | 27 | 1 | 2 | |||||||
| Access to hospitals | 4 | |||||||||||
| Percentage of adults who exercise | 1 | 1 | ||||||||||
| Addictions | 1 | 2 | ||||||||||
| Life expectancy | ||||||||||||
| Medical coverage | 1 | 1 | 1 | |||||||||
| Life expectancy | 1 | 1 | 1 | |||||||||
| Social security | ||||||||||||
| Total crime rate | 1 | 1 | 1 | 2 | 1 | |||||||
| The number of deaths due to suicide | 1 | |||||||||||
| Police/Fire D. interventions | 1 | 2 | 5 | 1 | 1 | |||||||
| Equality | ||||||||||||
| Education equal rights | 1 | 25 | 1 | |||||||||
| Employment equal rights | 2 | 11 | 1 | 1 | ||||||||
| Culture | ||||||||||||
| Number of recreational facilities | 1 | 2 | 1 | 21 | 5 | 1 | 1 | |||||
| Community garden | 1 | |||||||||||
| Number of NGOs | 1 | |||||||||||
| Social capital | ||||||||||||
| Social engagement (Voters/Volunteers) | 1 | 1 | 2 | 21 | 1 | 2 | ||||||
| Number of homeless | 1 | 1 | ||||||||||
| House price | 1 | 1 | ||||||||||
| Social Housing | 1 | 1 | 26 | 1 | ||||||||
| Sustainability Policies | 9 | 3 | 17 | 1 | 1 | |||||||
| Number of traffic injuries | 1 | |||||||||||
| Environmental | ||||||||||||
| Water quality | ||||||||||||
| Water consumption (per capita) | 1 | 3 | 1 | 1 | 1 | 1 | 39 | 1 | 1 | 1 | ||
| Wastewater collected | 1 | 1 | ||||||||||
| Recycled water/Treatment systems | 2 | 2 | 1 | |||||||||
| Households with safe water | 1 | 1 | 1 | 1 | ||||||||
| Water quality | 1 | 1 | ||||||||||
| Waste management | ||||||||||||
| Waste production rate | 5 | 1 | 3 | 1 | 34 | 2 | 1 | |||||
| Waste recycling rate | 1 | 4 | 1 | 1 | 1 | 1 | 1 | 1 | 1 | |||
| Hazardous waste management | 1 | 1 | 1 | |||||||||
| Sewage treatment capacity/rate | 2 | |||||||||||
| Air quality | ||||||||||||
| Number of air pollution monitoring | 1 | 1 | ||||||||||
| Number of polluted days | 1 | 33 | 1 | |||||||||
| Greenhouse gas emissions | 5 | 8 | 2 | 1 | 4 | 21 | 1 | 1 | 1 | |||
| Energy resources | ||||||||||||
| Non-RES consumption | 1 | 13 | 1 | 1 | 3 | 1 | 31 | 2 | 1 | |||
| RES consumption | 1 | 1 | 1 | 1 | 1 | |||||||
| RECs/Smart Grids | 2 | |||||||||||
| Urban noise | ||||||||||||
| Noise pollution | 1 | 1 | 1 | 16 | 1 | 2 | ||||||
| Transportation | ||||||||||||
| Motor/non-motor vehicles | 1 | 3 | 2 | 1 | 1 | 2 | ||||||
| Public transport rate/Proximity | 1 | 1 | 3 | 1 | 2 | 39 | 2 | 1 | ||||
| Travel time/ Traffic congestion | 2 | 1 | 2 | |||||||||
| Modal split/Public Transport Use | 1 | 1 | 1 | 1 | 1 | 1 | ||||||
| Road network density per person | 2 | 2 | 1 | 2 | ||||||||
| Buildings | ||||||||||||
| Use of local materials/resources | 1 | 1 | 1 | 1 | ||||||||
| Buildings age | 1 | 1 | 1 | |||||||||
| Conservation Projects | 1 | 1 | ||||||||||
| Buildings Energy Certificates | 2 | 2 | ||||||||||
| Planning | ||||||||||||
| Urbanization rate | 1 | 19 | 2 | |||||||||
| Housing density/Surface coverage | 1 | 1 | 2 | 1 | 29 | 1 | 2 | |||||
| Sidewalk route length | 1 | 1 | 1 | |||||||||
| Use of existing sites | 1 | |||||||||||
| Public spaces vs. Private spaces | 1 | |||||||||||
| Distance to basic services | 1 | 3 | 5 | 25 | 1 | |||||||
| Green coverage rate of built-up areas | 2 | 3 | 1 | 2 | 15 | 1 | 2 | 2 | ||||
| Land use management Plan | 1 | 1 | 1 | |||||||||
| Biodiversity | ||||||||||||
| Tree density | 1 | 7 | 1 | 1 | 1 | |||||||
| Shannon-Wiener index | 1 | 23 | 1 | |||||||||
| Hazards/Climate Change | ||||||||||||
| Soil erodibility | 3 | 1 | 2 | |||||||||
| Natural disasters | 6 | 4 | ||||||||||
| Vulnerability to climate change | 1 | 1 | 21 | 2 | ||||||||
| Digital | ||||||||||||
| Connections | ||||||||||||
| Internet access/Digital services | 2 | 1 | 1 | 1 | ||||||||
| Mobile phone traffic | 1 | |||||||||||
| Energy used for web servers | 2 | |||||||||||
| Buildings | ||||||||||||
| Domotic | 1 |
Table 3.
Sustainability Indicators categorized by ESED Classification-Results.
| Sustainable Dimension | Feleki et al., 2020 | Maranghi, 2020 | Chao 2020 | Steiniger et al., 2020 | Mangi, 2020 | Merino-Saum, 2020 | Michalina 2021 | Robati & Rezael, 2021 | Zeng et al., 2022 | Amoushahi et al., 2022 | SDGIs | AVERAGE | TOTAL |
|---|---|---|---|---|---|---|---|---|---|---|---|---|---|
| Economic | 8 | 2 | 3 | 5 | 7 | 7 | 156 | 5 | 4 | 16 | 64 | 25 | 277 |
| Social | 6 | 9 | 6 | 11 | 13 | 10 | 194 | 29 | 8 | 25 | 112 | 38 | 423 |
| Environmental | 21 | 51 | 38 | 16 | 15 | 17 | 361 | 18 | 10 | 42 | 83 | 61 | 672 |
| Digital | 0 | 6 | 1 | 1 | 0 | 0 | 0 | 0 | 0 | 1 | 13 | 2 | 22 |
| TOTAL | 35 | 68 | 48 | 33 | 35 | 34 | 711 | 52 | 22 | 84 | 272 | 127 | 1394 |
| Economic | 23% | 3% | 6% | 15% | 20% | 21% | 22% | 10% | 18% | 19% | 24% | 20% | |
| Social | 17% | 13% | 13% | 33% | 37% | 29% | 27% | 56% | 36% | 30% | 41% | 30% | |
| Environmental | 60% | 75% | 79% | 48% | 43% | 50% | 51% | 35% | 45% | 50% | 31% | 48% | |
| Digital | 0% | 9% | 2% | 3% | 0% | 0% | 0% | 0% | 0% | 1% | 5% | 2% |
Table 4.
SDGs vs. Academic Studies Indicator Classification.
| SDGIs | Academic Studies | |||
|---|---|---|---|---|
| Sustainable Dimension | N. of Indexes | % | N. of Indexes * | % |
| Economic | 64 | 24% | 21 | 19% |
| Social | 112 | 41% | 31 | 28% |
| Environmental | 83 | 31% | 59 | 52% |
| Digital | 13 | 5% | 1 | 1% |
| TOTAL | 272 | 100% | 112 | 100% |
* Average number per Study.
Disclaimer/Publisher’s Note: The statements, opinions and data contained in all publications are solely those of the individual author(s) and contributor(s) and not of MDPI and/or the editor(s). MDPI and/or the editor(s) disclaim responsibility for any injury to people or property resulting from any ideas, methods, instructions or products referred to in the content. |
© 2022 by the authors. Licensee MDPI, Basel, Switzerland. This article is an open access article distributed under the terms and conditions of the Creative Commons Attribution (CC BY) license (https://creativecommons.org/licenses/by/4.0/).
Share and Cite
MDPI and ACS Style
Canesi, R.; Marella, G. Towards European Transitions: Indicators for the Development of Marginal Urban Regions. Land 2023, 12, 27. https://0-doi-org.brum.beds.ac.uk/10.3390/land12010027
AMA Style
Canesi R, Marella G. Towards European Transitions: Indicators for the Development of Marginal Urban Regions. Land. 2023; 12(1):27. https://0-doi-org.brum.beds.ac.uk/10.3390/land12010027
Chicago/Turabian StyleCanesi, Rubina, and Giuliano Marella. 2023. "Towards European Transitions: Indicators for the Development of Marginal Urban Regions" Land 12, no. 1: 27. https://0-doi-org.brum.beds.ac.uk/10.3390/land12010027
Note that from the first issue of 2016, this journal uses article numbers instead of page numbers. See further details here.