1. Introduction
Urban planning is a continuous process of forecasting, planning, and managing change and development [
1]. An urban planning project usually develops from a conception in broad terms toward more precise design and implementation [
2,
3,
4], with stakeholders providing input and feedback at key phases of the planning process. Visualization is at the core of design and implementation in the planning and design disciplines. A visualization can be considered as any graphical representation of information and data, from hand-drawn sketches of an idea to immersive and dynamic virtual environments in virtual reality [
5,
6]. The planning and design disciplines have embraced the continuous development of visualization technology, including the pioneering ‘before and after’ visualizations introduced by Repton [
7], the early adoption of 3D modeling technology, augmented and virtual reality (AR and VR) simulations [
8], and cutting-edge mixed-reality technologies [
9]. Augmented reality is a technology that superimposes a computer-generated image onto a user’s view of the real world. This provides a digital continuation of Humphry Repton’s paper overlay technique.
Visualizations are core to how the design field communicates, on both a qualitative and a quantitative level. This ranges from physical models of designs for greenspace and open space to fluid dynamics simulations of flooding events [
10]. The advent of sophisticated digital tools has begun to reshape how we consider visualization [
11]. Traditionally, visualization has taken on a top-down communicative role [
12], following a linear, one-to-one, or one-to-many relationship [
13], with the expert (designer or planner) using visualization as a tool for communicating a concept to one or more invested parties. This is the primary way in which visualizations are used in the planning and design disciplines.
One downside of this process is that it limits the potential of visualization to a fixed snapshot in time in the planning and design process and accords it a corresponding endpoint, in terms of the data lifecycle of the visualization. In the context of an analog medium, using visualizations, such as sketches or elaborate hand-drawn renderings, the creative endpoint comes as the natural progression of the underlying media and the typical creation process. Hand-drawn perspectives or renderings, as well as their digital equivalents, are not easily adaptable to a continually changing context once they are created. Instead, they become a milestone in the project, representing a fixed point in time, or a fixed comparison point, as with the Repton ‘before and after’ images. In this approach, there is little scope to create an adaptive visualization, a single visualization that continues to evolve within the project. The digital realm lends itself much more readily to a continuously evolving process but falls back onto the same fixed milestones when it is transferred to an analog medium through the creation of printed base maps, 3D printed models, or image rendering. Animations also represent a static milestone, regardless of the dynamic content, as the information within them, once created, is not easily recycled back into the greater contextualization process.
This dilemma is not inherently expanded through the adoption of the latest in visualization technology. In planning and design workshops or in experiments, virtual reality can be used as a new way to explore digital models, experimenting with a new medium for visualization as a tool for interactive exploration [
13,
14]. Subsequently, stakeholder feedback can be generated via interviews or standardized feedback forms. While this technique uses a novel form of visualization, the general context within which the visualization is used remains the same. It is a fixed point within a complex decision-making process. In principle, similar approaches can be seen with augmented reality [
15]. However, what ‘immersive technology’ does enable is a variety of new workflows and perspectives on how data can be used, along with visualizations. Visualizations can be used not only to generate data actively through feedback mechanisms, such as interviews, but also in a passive way through tracking user interactions with digital media [
15,
16]. The data that is generated can then be analyzed and will persist independently to influence either the next visualization or planning decisions [
17]; however, the visualization itself remains a static milestone.
Augmented reality applications have been developed to attempt to bridge the gap of reactive, multiuser design tools while keeping the longevity of the designs and data that are produced for further study [
18]. Augmented reality has been shown to improve map comprehension when used to visualize 3D terrain models alongside 2D cartographic representations [
19,
20] and allow for more interactive cartographic experiences [
21]. Planning and design approaches using touch tables support a workflow that best approximates the adaptive visualization principles that we discuss herein, using a continuous loop model of digital creation to enable the continued development and capture of digital assets, which may evolve naturally throughout a project’s lifetime [
22].
The general outcome of adopting the latest mixed-reality technology is that of creating new visualization methods. However, this yields limited value in the larger iterative design process. For example, virtual reality experiences offer little to no direct input for the next design iteration.
Considering the significant limitations of the current approaches, as outlined above, the aim of this paper is to introduce a newly developed framework that is designed to rethink how we approach visualization in collaborative settings, with the ongoing curation of an accessible, project-specific context. Using the case study of a proposed large high-rise urban development on Pazhou Island in Guangzhou (China), located in a flood-risk zone, we apply this framework to the creation of a novel augmented reality application that is designed to support project-wide knowledge integration, moving from static milestones to continuously evolving contexts.
Adaptation in the context of visualization in the planning and design process can take many forms and support different goals, Previous studies bringing adaptation into visualization have focused on context-aware systems, which are enabled by mobile devices [
23], stressing the importance of a comprehensive view of the context, including the time, location, users and information, to create information systems that update with respect to the changing context. Building on the contextual requirements of adaptation that were detailed by the authors of [
23], we expand upon the contextual requirements of adaptation, including adapting to current workflows through integration, iteration, and synthesis.
In the current paper, we propose a novel adaptive visualization theoretical framework and detail the four principles of integration, iteration, contextualization, and synthesis, describing how they aim to enrich the ways in which participants build and interact with visualizations in a collaborative workshop setting. We follow up with the practical creation of an interactive application designed to test and present how augmented reality is used to achieve the principles of adaptive visualization in a workshop setting, using this application in the context of the Pazhou Island case study. Finally, we discuss the advantages and novel design interactions afforded by the application of adaptive visualization in design creation, evaluation, and communication activities, and detail the limitations of the approach, offering routes for further research.
2. Background
2.1. The Adaptive Visualization Framework
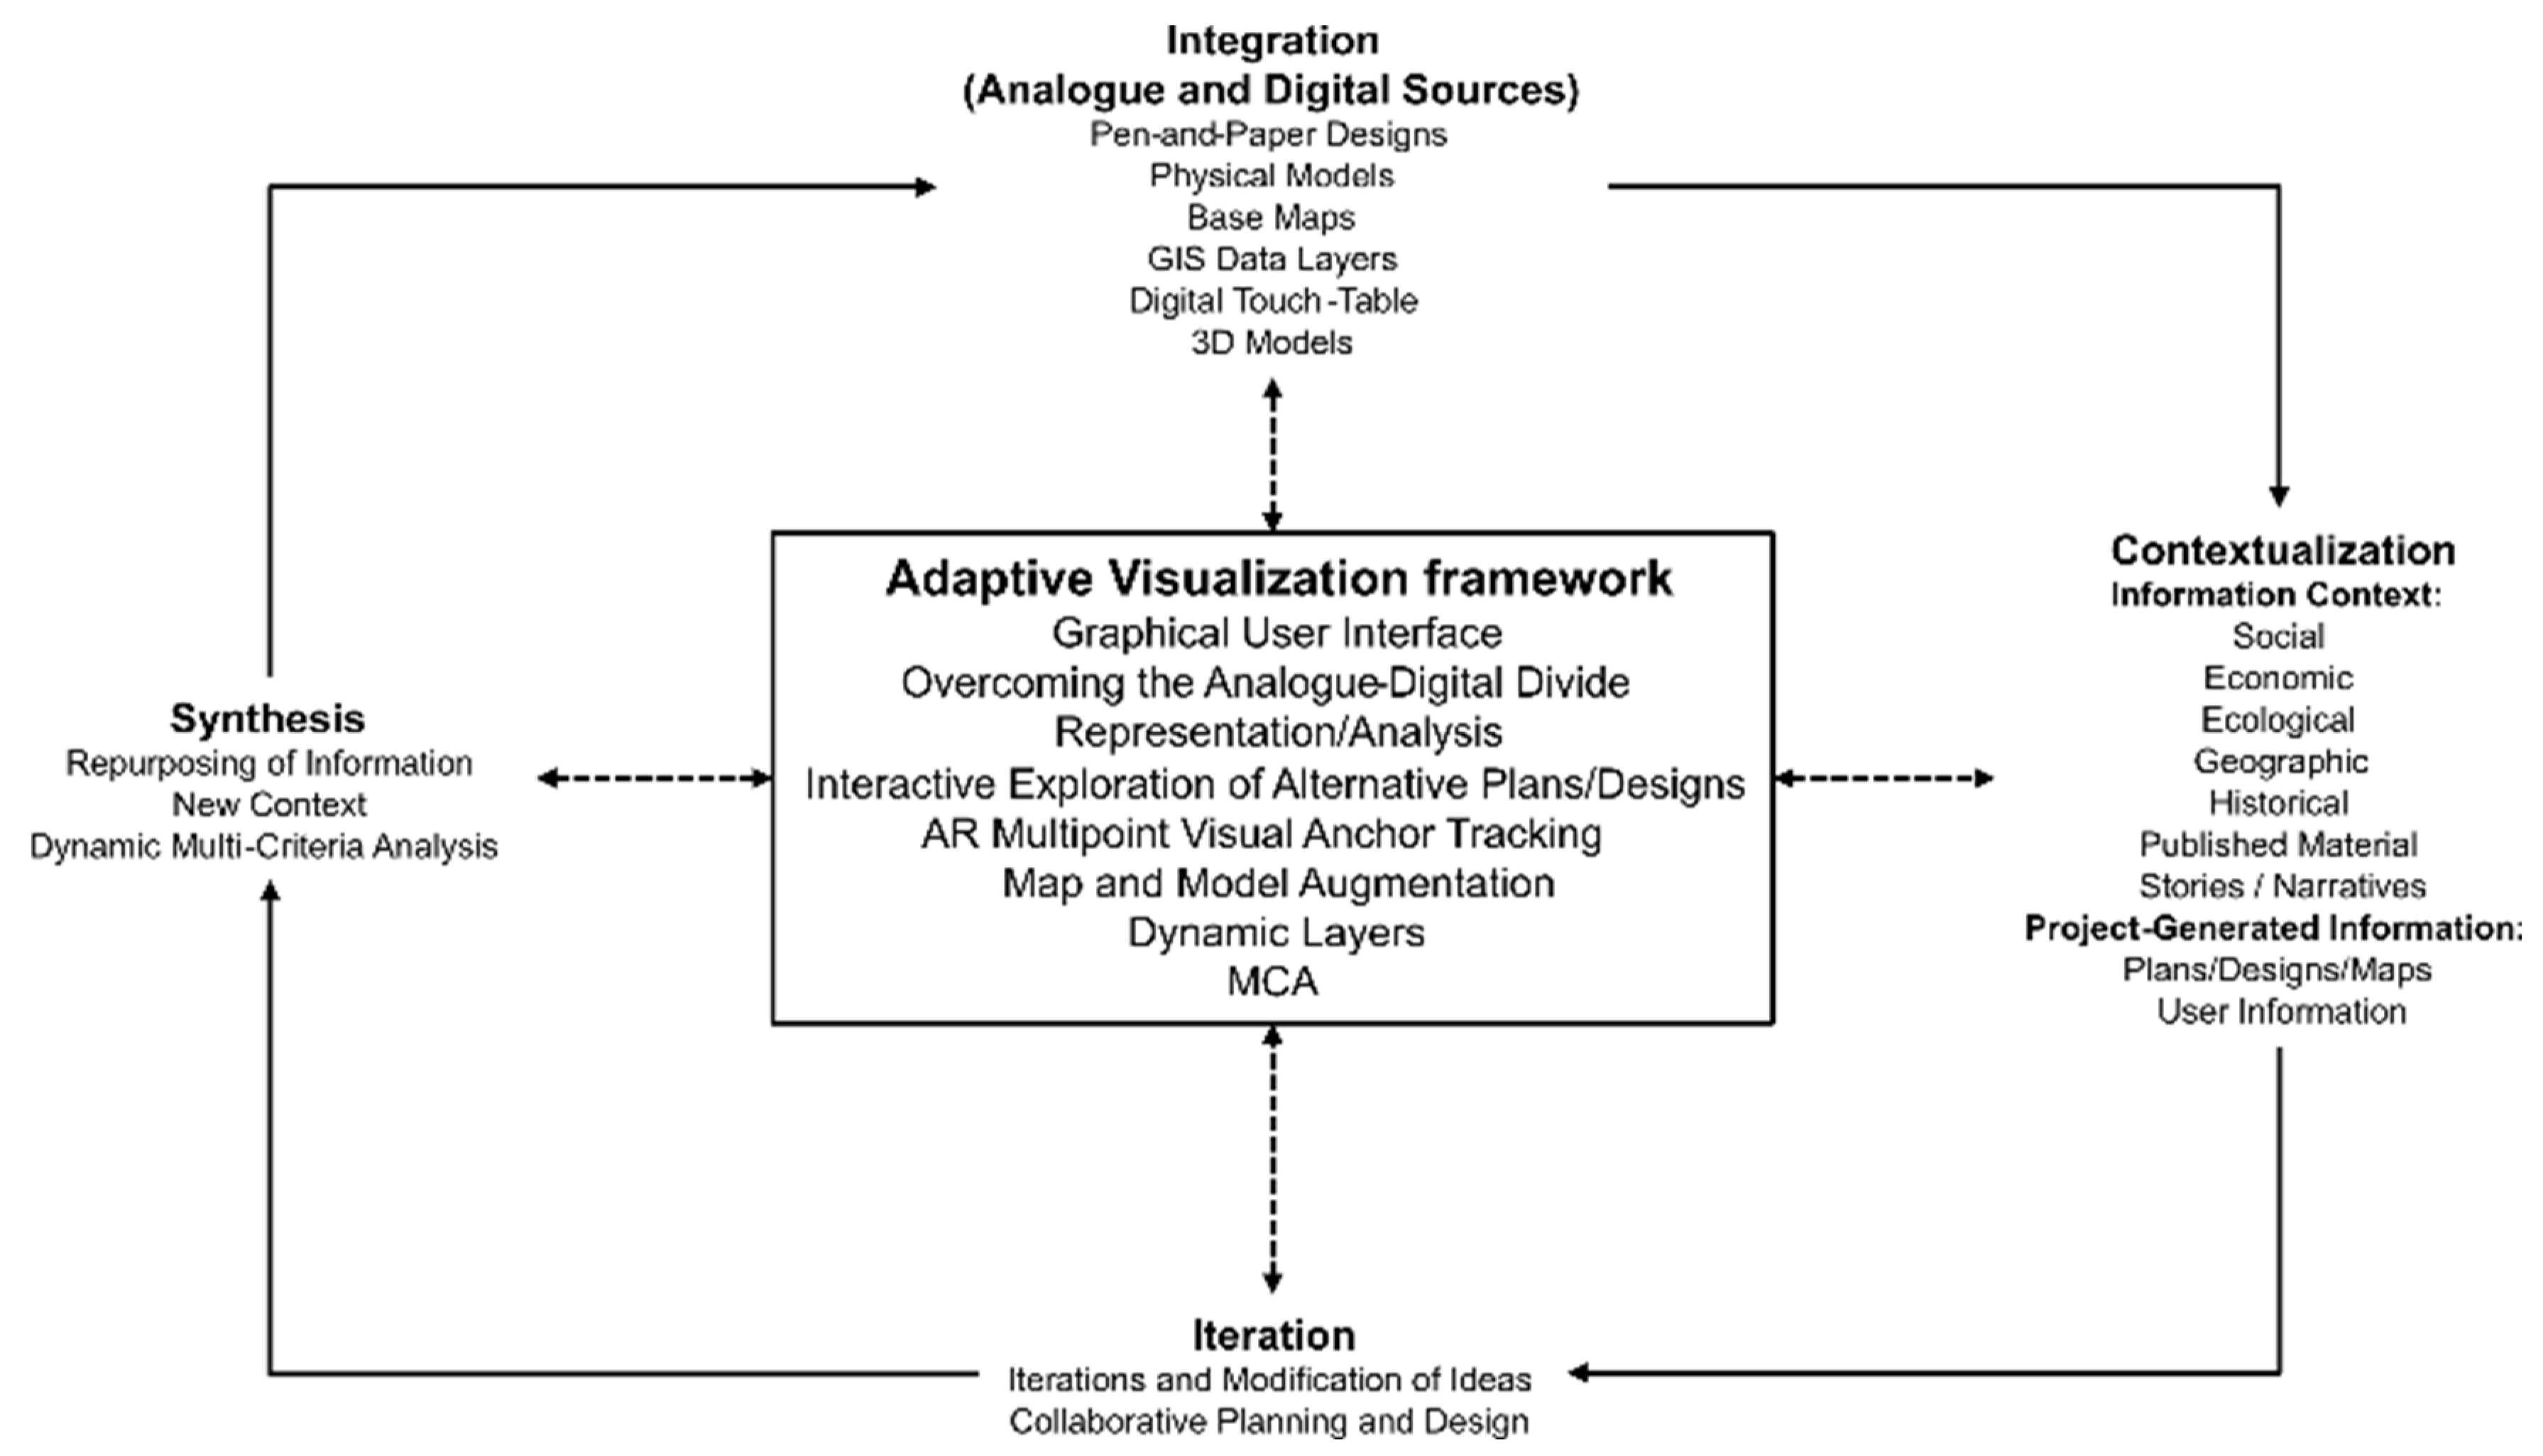
The adaptive visualization (AV) framework provides a set of principles and aims that are designed to frame how we see the role of data and visualization as a communicative tool in the planning and design of our domestic environment. Within the adaptive visualization framework, we see a completed visualization not as an end product, but as a staging area to begin a deeper exploration of a design challenge through interactive and adaptive means, by curating an evolving project context. Visualizations are the place where ideas are made concrete; they form the nexus of a focused discussion that is key to a productive collaborative workshop setting. Using the AV framework, we propose a dynamic process that changes and grows alongside an ongoing design process, which integrates new designs as they are created, adapts to new concerns as they are raised, and enables new ways of working with data as the process evolves.
Adaptive visualization aims to create a continuous approach to the planning and design process by adhering to the following four principles: integration, contextualization, iteration, and synthesis, as shown in
Figure 1.
2.2. Integration of Analog and Digital Resources
Visualization plays a central role in the planning and design disciplines, and any successful attempt to reframe the role of visualization must seek to encompass and not replace the current state of affairs while providing a route to naturally expanding the role that visualization can play. Many efforts have successfully used the latest immersive visualization technology to expand the catalog of visualizations that are available to project managers. However, embracing new technologies has often meant shunning previous methods, except when used as a baseline for comparison in adoption studies.
The AV framework highlights the fact that a new tool must be able to integrate with current tools and workflows and the current state of the art, without requiring a wholesale switch from a currently established workflow to a novel workflow. This comes from the understanding that novel technologies can often bring new capabilities but rarely improve upon the previous technologies in all respects. With digital enrichment, a map becomes an interface to access an expanding set of geographic information, and the map’s user is encouraged to create a visualization that best supports their decision process [
24]. Current approaches and workflows that must be integrated into a digital workflow include pen-and-paper design, base map annotations, and the use of a geographical information system (GIS) and 3D models. Typically, these are quite separate or only weakly connected approaches, with research focusing on bridging the digital assets, not involving analog resources [
25]. It is essential that new AV tools integrate well with these existing technologies. Therefore, our AV tool seeks to unite these often-disparate methodologies to enable the seamless interchange and integration of ideas across modalities, for example, both bringing digital models into hand-drawn designs and manipulating GIS datasets over tracing-paper sketches in real time. This integration with disparate base data is a form of adaptive mapping [
26], which aims to facilitate different users in working with the same task-independent data but receiving knowledge to suit the specific task for which they are responsible.
We see AV technology as integrating the various people who work on projects. Digital tools and hand-drawn tools require different skill sets and different approaches and often lead to disjointed projects. AV seeks to provide a bridge between different datasets and diverse skill sets. In this paper, we demonstrate methods to integrate hand-drawn sketches into GIS data and 3D digital models, to ensure that all data created during a project can support and enrich complementary approaches to planning and design.
2.3. Contextualization of Information
Contextualization is key to an ongoing planning and design process; indeed, much time in planning and design is focused on ensuring a shared understanding of the social, economic, geographic, and historical context within which a project is set, as well as creating maps, previously published material, gathering stories, and understanding the larger scale issues of a site and the context in which it sits. All of this should remain accessible for the evaluation and comparison of new planning proposals and design solutions. In addition, the context not only includes the direct context of the usage of an application, such as the time and location of use, the current users, and the technology being used but can also include the informational context of the process within which this visualization is used [
23].
During planning and design in this phase of site survey and analysis, considerable time is allocated to uncovering and documenting the current and potential issues facing the project site [
27]. This shared documentation of the project context is aimed at ensuring that further efforts are both constrained by and targeted toward current problems, in order to achieve the desired project outcomes.
Often, design challenges are multidimensional, and successful designs must address a variety of issues, even if they are not part of the current assignment, i.e., water issues, visitor management, access to green space, and commercial development. As such, it is important that an issue, once defined, should not be discarded when developing a novel design intervention that targets a particular issue. For example, the issue of flood resilience, if deemed important, should remain a design constraint when creating a design for a more traffic-friendly city. In this way, the context can permeate and constrain all design challenges to provide a more resilient plan.
2.4. Iteration of Ideas
In general, the process of planning and designing our environments is characterized by the iteration and modification of ideas. In an adaptive visualization framework, the evolution of design interventions is achieved through a continuous, exploratory design process. To maximize efficiency, it is crucial to be able to ‘stand on the shoulders of giants’, and, in doing so, create a frictionless way to evaluate, cross-compare, enhance, and redevelop the designs that have already been developed. In essence, previous designs from either your own project or from external sources, rather than being ignored, could provide an evolving body of ideas within which to situate new designs and compare contrasting solutions, in order to guide the ongoing design process. This method is especially effective when used to integrate interdisciplinary design thinking, such as in urban studies or urban planning, with that of architects, landscape architects, and hydraulic engineers. Accordingly, the current AV framework aims to enable a seamless way to incorporate traditional concepts, in which visualizations are an endpoint, into a continuous, iterative process.
2.5. Synthesis of Information and Resources
With the integration of workflow, set into an iterative planning and design process that is supported by a continuously growing design and site context, we can achieve the final goal of enabling visualization to truly become a jumping-off point into synthesizing new data, new visualizations, and new avenues of exploration. In an ideal world, the AV process would enable a new equality across designs, models, and data, in which each output can interact with, enrich, and evolve into others. In this way, for example, a historical site map could be intertwined with a 3D physical model, using an interactive flood map to act as a conversational starting point for the role of water dynamics in historical land use, and by considering how that process could shape the evolving landscape.
A key idea here is that a visualization created for a single purpose, such as a historical record or flood map simulation, can be repurposed within a new context. Visualizations can begin to create their own data, in effect, allowing the project to capture and leverage the design process to bootstrap the next generation of context-rich designs.
By bringing an interactive element into previously static plans and images, we aim to allow users to begin to remix previous data, to create a new starting point for their explorations. An example of this would be repurposing a 2D rasterized height map from a GIS source into an interactive flood map, in effect, allowing users to specify a desired flood scenario from which to begin their design interventions. This flood map, dynamically synthesized, provides a much more accessible view of the data than either a height map or a precomputed flood scenario, allowing users to both define a design-specific starting point and also provide a metric against which to evaluate future designs in a way that a static visualization could not easily accomplish. See
Section 4.1 for an example of how we integrate a flood simulation into a 3D Sketchup model on a 2D map, to evaluate the flood resilience of an evolving urban design.
Building on the integration of data sources, we show in
Section 4 how we can implement a dynamic multi-criteria analysis engine as a synthesized layer, drawing upon the entire selection of GIS data, which we can use as base maps. This can be an invaluable tool for exploring the multidimensional nature of intersecting contexts, such as population density, flood risk, and height data. When the technique is used to filter out the most salient areas in which to begin a design project, the AV method shows how to achieve this by combining disparate datasets; therefore, we can create a new project-specific dataset through the exploration of discrete datasets.
3. Materials and Methods
3.1. Pazhou Case Study
Pazhou Island, with an area of approximately 15 km2, is located in close proximity to the city center of Guangzhou, situated in the Pearl River Delta. A massive increase in population over recent decades led to dramatic changes in land use and character, transforming the Pearl River Delta from a mainly agriculturally dominated area, around 100 years ago, to a megacity with an estimated population of 120 million. It is now one of the most densely urbanized regions in the world and, as a result, development pressures are immense.
Due to its rapid urbanization, the mix of modern urbanized quarters and the remaining traditional agricultural landscape, as well as various environmental challenges including the problem of flooding, makes Pazhou Island an excellent case for collaborative and multifaceted design approaches. As part of the adaptive urban transformation project jointly conducted with the Delft University of Technology and the South China University of Technology, we have conducted several planning and design workshops in the Netherlands and China.
With changing population dynamics, rapid development, and hydrological concerns, the Pazhou case provides an excellent site by which to explore a dynamic approach to planning and design. However, the detailed adaptive visualization approach would apply to any project with a rich array of analog and digital media.
The visualization technologies used in our case study span a range of traditional media and newly developed cutting-edge digital technologies. Traditional analog media include, for example, maps, tracing-paper sketches, and physical models, while digital media include GIS datasets, 3D models, simulations, and multi-user touch tables. The AV contribution includes augmented reality-enabled maps via a custom-designed AR application, as described below.
3.2. Adaptive Visualization Application
To directly utilize the principles of the adaptive visualization framework within a planning and design workshop format, we created a tablet-based augmented reality application that could interface with the traditional paper media used in the workshop setting. Combining such different data types is a successful method by which to improve cartographic comprehension [
19,
20]. We chose augmented reality to ensure that the current workflows could be maintained without modification. Pen-and-paper sketches can be augmented, maps can be dynamically enhanced, and physical models can be transformed digitally, without altering the underlying presentation [
18]. This is in contrast with other digital augmentation methods, such as virtual reality [
28] and touch tables [
29], which require the entire transformation of the underlying representations into an exclusively digital representation.
We ensure that the fundamental experience of planning and design does not need to change and can be maintained with the AV tools being used to selectively enhance the process of design, when required.
The application is designed to mimic the layered approach of base maps and layers that are used in both traditional tracing-paper design and in digital approaches such as GIS software, with the added intrinsic ability to use an array of real-world base maps as the anchor, enhanced by the ability to digitally switch the base map, as desired. We use GIS base maps as our standard maps and enable users to add a variety of layered data on top of the maps. The concept of layers has been generalized in such a way as to allow 3D digital models, dynamic simulations, and spatial-visual annotations as simultaneous coexisting layers, with each type of layer being able to be toggled on and off at will. Each type of layer can also cycle between its associated data sets, allowing one instance of each data type to be visible at a time (i.e., a base map, data layer, context layer, simulation layer, and 3D model layer, all visible at once). The full extent of the data integrated into this prototype is described in
Section 4.1.
We present the designer with a simple graphical user interface, one that allows users to toggle combinations of layers together and set the parameters of interactive layers, such as the water level for the flooding simulations, and the multi-criteria analysis parameters for combining and weighting those layers. In the case of physical models, the interface presents the ability to toggle various visualization elements, such as land use, greenspace designs, and the larger city context.
3.3. Multipoint Interaction Tracking
The AV application uses multipoint visual anchor tracking, which is provided by the Vuforia package in the Unity game engine. Multipoint tracking enables users to easily track the base maps from a wide variety of angles, enabling users to focus closely on specific areas of a larger map, without losing tracking quality.
To achieve multipoint tracking on traditional base maps, we augment each paper map with a distinct tracking image in each corner. Each base map has identical tracking images, shown at the same spatial scale. This enables the seamless portability of digital enrichments across different base maps, similar to tracing-paper usage. However, with digital enrichments, we gain the extra advantage of being base-map scale-independent. Maintaining an equal ratio of marker size to map scale allows for tracking across A3, A2, and A1 maps. Embedding tracking into the analog maps removes any of the manual calibrations that are required by solutions using independently moving anchors [
30]. This leads to a more robust and fluid experience, such as that required for non-disruptive workshop enrichment.
The map-embedded tracking capability creates an anchor point between the digital and physical maps, allowing all augmentations to remain aligned to the physical base map, including the interactive layers, 3D models, and contextual additions. Creating a core, stable anchor point is the key requirement for a smooth and effective transition between the physical and digital data. This is in contrast to multi-marker approaches, in which the markers encode for separate, distinct viewpoints, with no ability to carry information over from one position to the next [
15].
During the design process, markers can become obscured by the designer, by tracing paper, and by other participants in the process. Multipoint tracking ensures that tracking can be maintained during the act of design since only one marker needs to be visible for successful augmentation. This ensures that the AV principle of integration allows for a continuous fusion of both established and novel workflows.
3.4. Workshop Data
The principles behind AV aim at uniting as many types of visualization and data as possible, including analog and digital maps, static and dynamic visualizations, 2D and 3D designs, and spatial contexts. Here, we will discuss each of the distinct types of visualizations that we have integrated into the new AV application. The application contains an implicit order or occlusion, with each layer occluding the layer below, unless it is set with a transparency. The layering, from top to bottom, is as follows: non-spatial data, 3D models, 2D layers, and base layers. Each layer can have its own transparency, while balancing layer opacity enables the user to simultaneously see real-world data, such as base maps and hand-drawn additions, as well as digital data. The 2D layers must all cover the same area as the paper base map and are created as the .PNG files, which are often exported directly from GIS applications, or they are manipulated to align with the base maps, in the case of images that derive from non-GIS sources, such as extracts from journals or presentations. Images that cannot be directly aligned spatially, such as photographs, can be added as non-spatial data sources. The underlying application is agnostic to underlying data sources and natively supports transparent regions. All image data cover the same spatial area but can be seen at a variety of spatial resolutions. Vector representations are converted to rasters before integration.
3.5. Base Layers
The primary task when implementing the relevant AV principles is to ensure seamless integration with the current workflows and to establish the first set of advantages gained by adopting the AV framework. In our case, this was necessary to integrate the process of pen-and-paper mapping using tracing paper and large-format printed base maps, created from GIS software. As such, we first integrated an expandable selection of GIS base maps for our site, including satellite imagery, infrastructure, and street maps. These base layers are toggleable and have dynamic transparency, such that switching between the underlying physical base map and replacing it with a digital map with contrasting content can be achieved seamlessly. This allows users to sketch on a physical map, while simultaneously evaluating the pen-and-paper sketches over different base data representations. This demonstrates a novel way to cross the analog–digital divide in a collaborative design scenario.
3.6. Static Data Layers
While the base layers emulate and expand upon the large-format printed base map toolset, the data layers aim to emulate the configurable digital-layered approach of a spatial GIS toolset. For our application, we integrated a variety of rasterized GIS datasets that cover population density over time, historical flood risk, surface permeability, land use, and water bodies. Each of these can be used as a static layer, and can be overlaid upon the base maps above, or visualized seamlessly into the physical map along with vector data, such as land use and waterways.
Static data layers can represent a variety of underlying data, including discrete data, such as land use, and continuous data, such as population density. Continuous data can then be enriched further, via dynamic processes, to bring interactivity and synthesis to disparate data sets.
3.7. Dynamic Layers
Dynamic layers are an enrichment of the static data layers, bringing real-time interactivity to the underlying physical media. These dynamic elements can be used to intuitively explore the dynamic nature of datasets, such as flood extent visualization with rising water levels, or a real-time weighting of various datasets, as seen in our multi-criteria analysis visualizations. To account for the different sources of dynamism in the project data, we can support several different dynamic layer concepts, such as the simulation layer and the weighted combination layer.
A simulation layer is a standalone layer that has the associated data and parameters sufficient to run a real-time simulation or that displays pre-computed simulations interactively with pre-recorded data for a heavier simulation burden. As an example of a simulation layer, we include the interactive flood extent visualizer, which combines an elevation map and an ambient water-height parameter. This simple setup is enough to give a suggestion of the hydrology features of our site [
31].
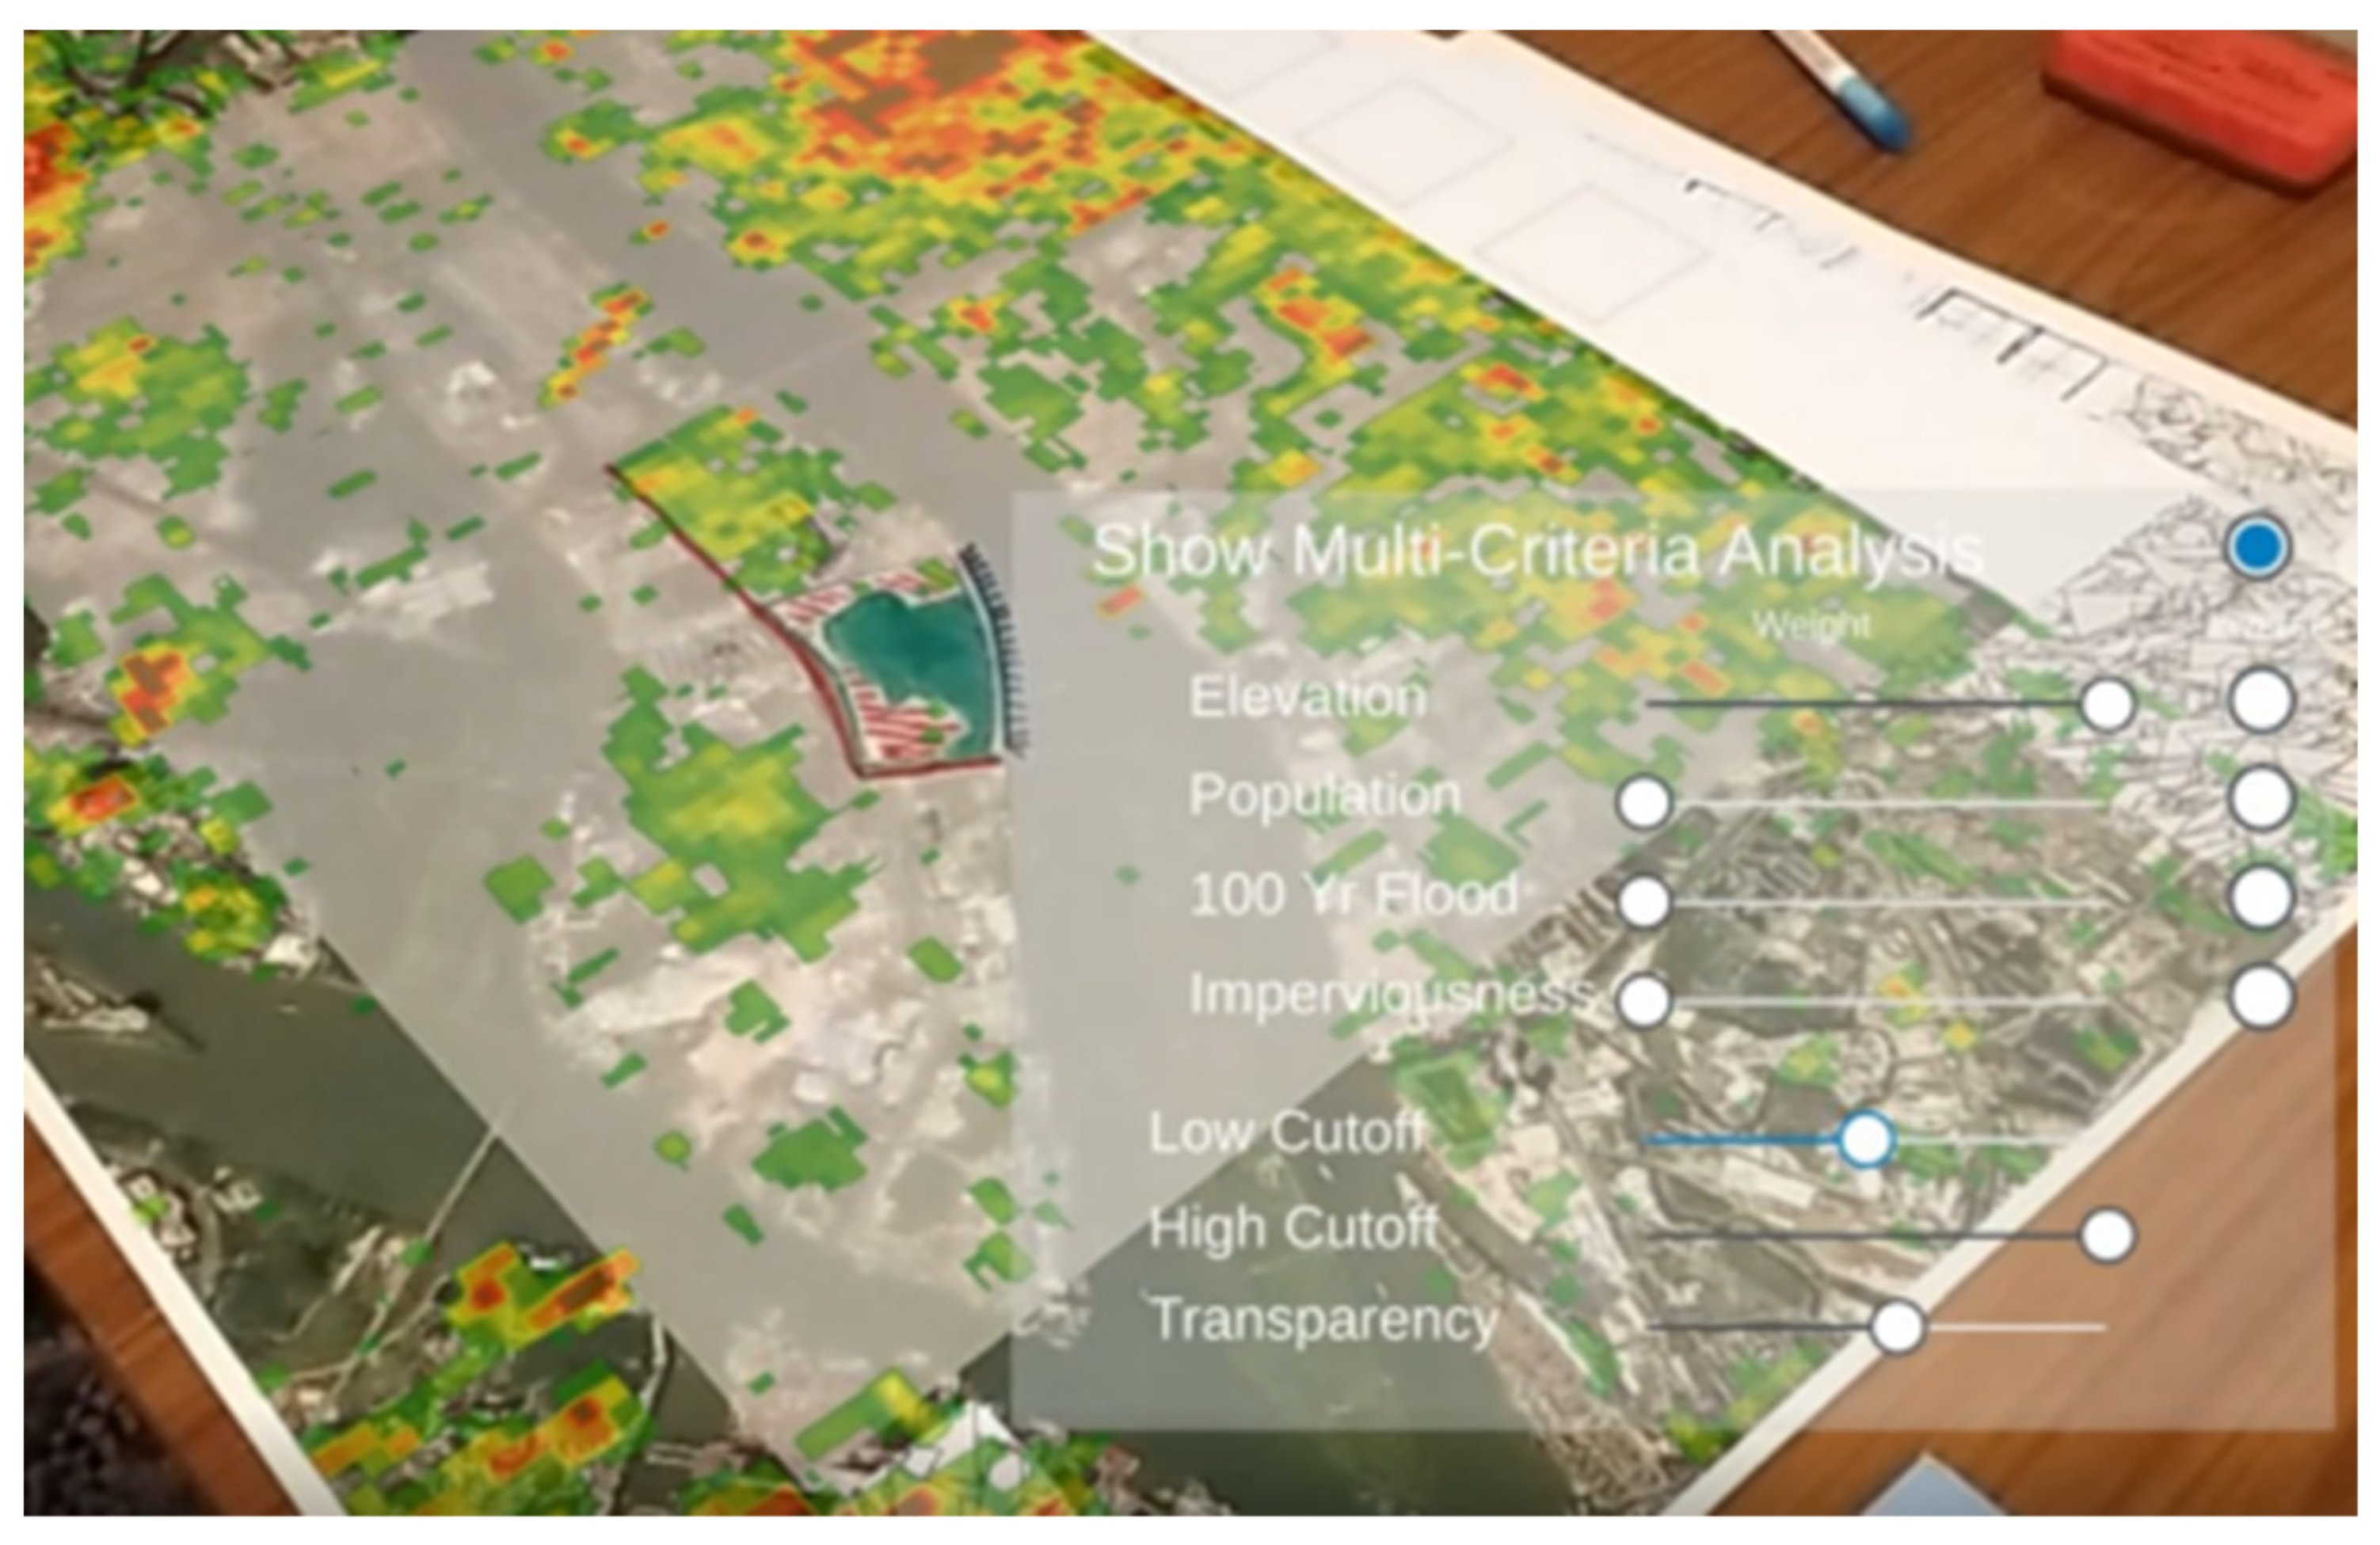
The weighted combination layer offers a more general approach to adding interactivity, using dynamic combinations of the static continuous data layers. In this way, we embody the AV synthesis principle, synthesizing new datasets as the need arises by dynamically specifying the weight parameter of a layer. We employ a multi-criteria analysis (MCA) approach to weighted dataset combination; this allows us to specify an array of underlying normalized datasets and allocate a weighting of importance for each one, with the value of each pixel being determined by
, where
represents the pixel coordinates.
represents the 2D array of pixel intensity values in the image, normalized between 0 and 1 for each selected dataset, and
is the given weight of each dataset, which can be selected by a toggle, as demonstrated in
Section 4.4.
Finally, we specify an upper and lower cutoff, along with a color scheme to visualize the layer. Pixels with an intensity below the lower cutoff or above the higher cutoff have their opacity set to 0. This approach to dataset combination provides an intuitive, real-time way to generate immediate feedback on the salience of spatial areas with regard to a certain goal, using a real-time, continuous evaluation of different criteria, goals, and their respective tradeoffs.
3.8. Three-dimensional Spatial Layers
Generally, the pen-and-paper design approach is limited to the 2D plane; however, we integrated both 2D and 3D data into the same application. We anchored 3D models, such as those designed in Sketchup, onto the 2D base map using static, 3D model layers. For our test site, we employed two large-scale urban models that represent a progression in the urban planning and design process over a three-year period. We created two 3D layers to enable users to situate the scaled 3D models within the 2D map, thereby encouraging a more geographical contextualization of the 3D model. As a layer, it can then interact visually with other layers, such as the flood extent visualization layer. These 3D layers occlude the base layers and simulation layers, but these can be occluded by the contextual layers. Digital layer occlusion is consistent within the digital realm, based on the distance to the camera. All real-world items, such as base maps or participants, are occluded by the models, with transparencies enabling less strict occlusion.
3.9. Three-dimensional Non-Spatial Layers
Finally, we integrated a collection of non-spatial data, by which we mean data that was not derived from a spatially linked source. We integrated images from presentation slides, reports, published journal articles, and onsite photographs for context-enriching multimedia. Non-spatial layers are key to ensuring that some experiential context is maintained when designing from a map-based perspective.
4. Results
The proposed theoretical framework provides a high-level motivation and structure for the re-imagining of analog and digital resources, describing the opportunities and benefits of creating an integrative approach to planning and design tools.
However, translating a theoretical framework into usable tools that capture the essence of the framework and its benefits, while remaining practical and user-friendly in a collaborative environment, is a non-trivial task. There are many possible ways to apply a theoretical framework to improve a process. The core result of this paper is demonstrating how augmented reality can be harnessed to combine digital and analog data in a collaborative workshop setting, to enable novel design interactions by following an adaptive visualization approach. What follows is a detailed account of how the abstract principles of the adaptive visualization framework have been built into a novel planning and design tool, and a discussion of the novel design interactions enabled by this approach. We will discuss the capabilities of the application and examine how it specifically addresses each of the principles of Integration, Iteration, Contextualization, and Synthesis.
4.1. Integration
The core aims for developing the AV application were to integrate the various data sets and visualizations created throughout an adaptive urban transformation project and facilitate the next stage of designs, which build upon a variety of data sources, including base maps, GIS data, hand-drawn sketches, and other data.
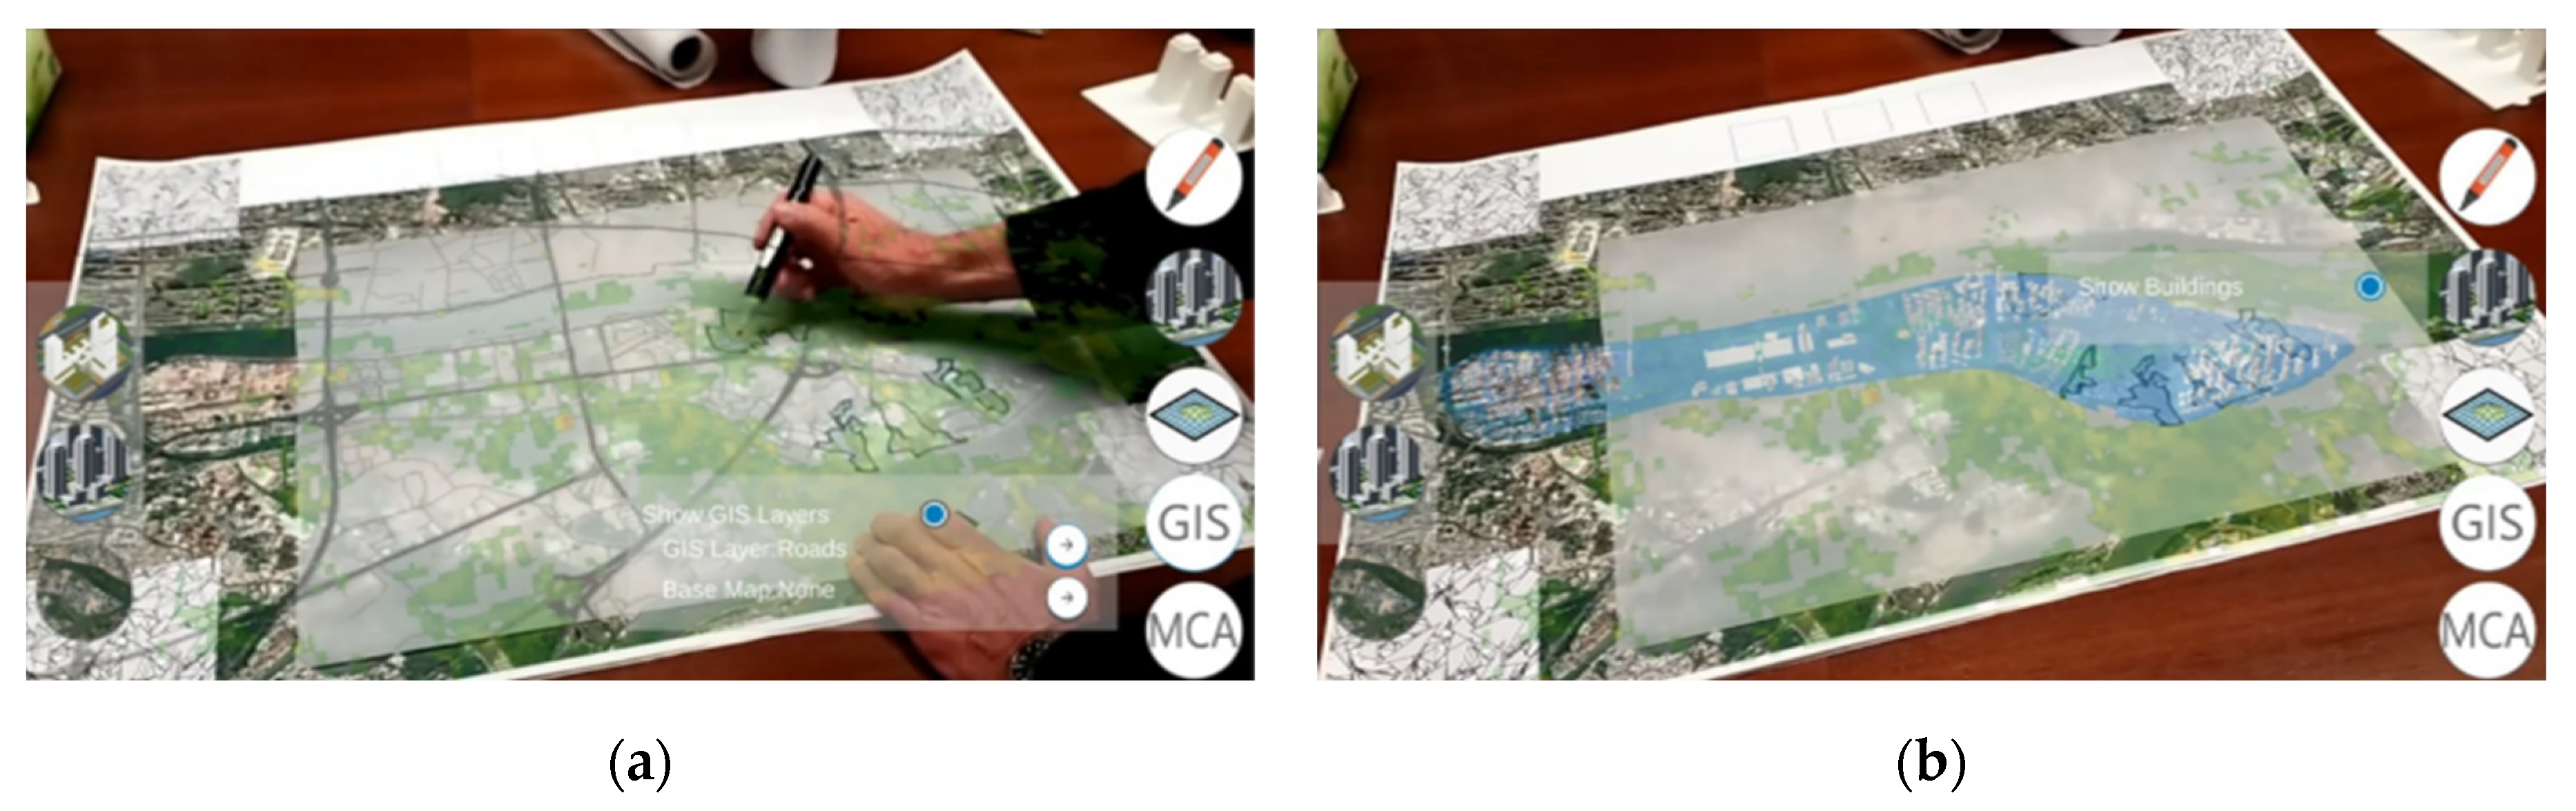
Figure 2 shows two screenshots taken while using the application, showing real-time map annotation being augmented with GIS, flood maps, and 3D design data. The icons to the right of the touch screen allow the user to select between the different modes (3D model augmentation, model inspection, and map augmentation). It allows the user to specify what types of layers they wish to toggle (3D, height map, GIS, or MCA) and settings. Each button opens a sub-menu overlay, allowing users to specify each layer’s properties, such as the image set and transparency.
The primary method of integration uses the AR-augmented GIS base maps, upon which we base the next iteration of designs. Initially, the design process would first involve consulting static renderings of 3D visualizations in a series of presentations, then the internalizing of these plans, before setting out to sketch updated ideas on paper, based on a base map, which is typically the satellite view of the area in question. Periodically, or for specific design purposes, we would align these sketches over different base maps to cross-reference our designs with other constraints, such as height maps, flood risk, population density, infrastructure, etc., which all affect the outcomes of the final designs.
Figure 2 shows the various iterations of how we integrate 3D models, GIS spatial layers, sketches, and dynamic simulations, streamlining the process of comparing our sketches against the various data that we have. In 5a, we see the real satellite base map, augmented with the infrastructure base layer (dark lines) and the MCA layer (semi-transparent green shading across the map). The augmented layers are set to have a transparency level that is suitable for combining both the hand-drawn map and the augmentations. Through dynamic switching, we can change the base map on which we have placed our sketch, allowing for quick cross-referencing. Atop this base map, we can dynamically visualize the static GIS layers, which would be unsuitable for a base map but can provide relevant contextual information, such as the population density, giving instant feedback for a design choice in conjunction with its relevant constraints.
Figure 2b shows how we can digitally integrate a three-dimensional model of the proposed building changes with the base map, to demonstrate how a hand-drawn sketch fits into the larger structural plans for the area. A further digital addition of the interactive flood map has been layered in, to compare the building suggestions with the flood extent projections.
4.2. Iteration
After integrating a variety of visualizations into one adaptive experience, we can begin to combine these data sources to help iterate the next design stages, without the problem of jumping between maps, sketches, slides, and models. While adaptive mapping focuses on the mapping process [
26], here, we focus on the ability to filter and combine static maps, dynamic features, and 3D models, filtered by user interaction.
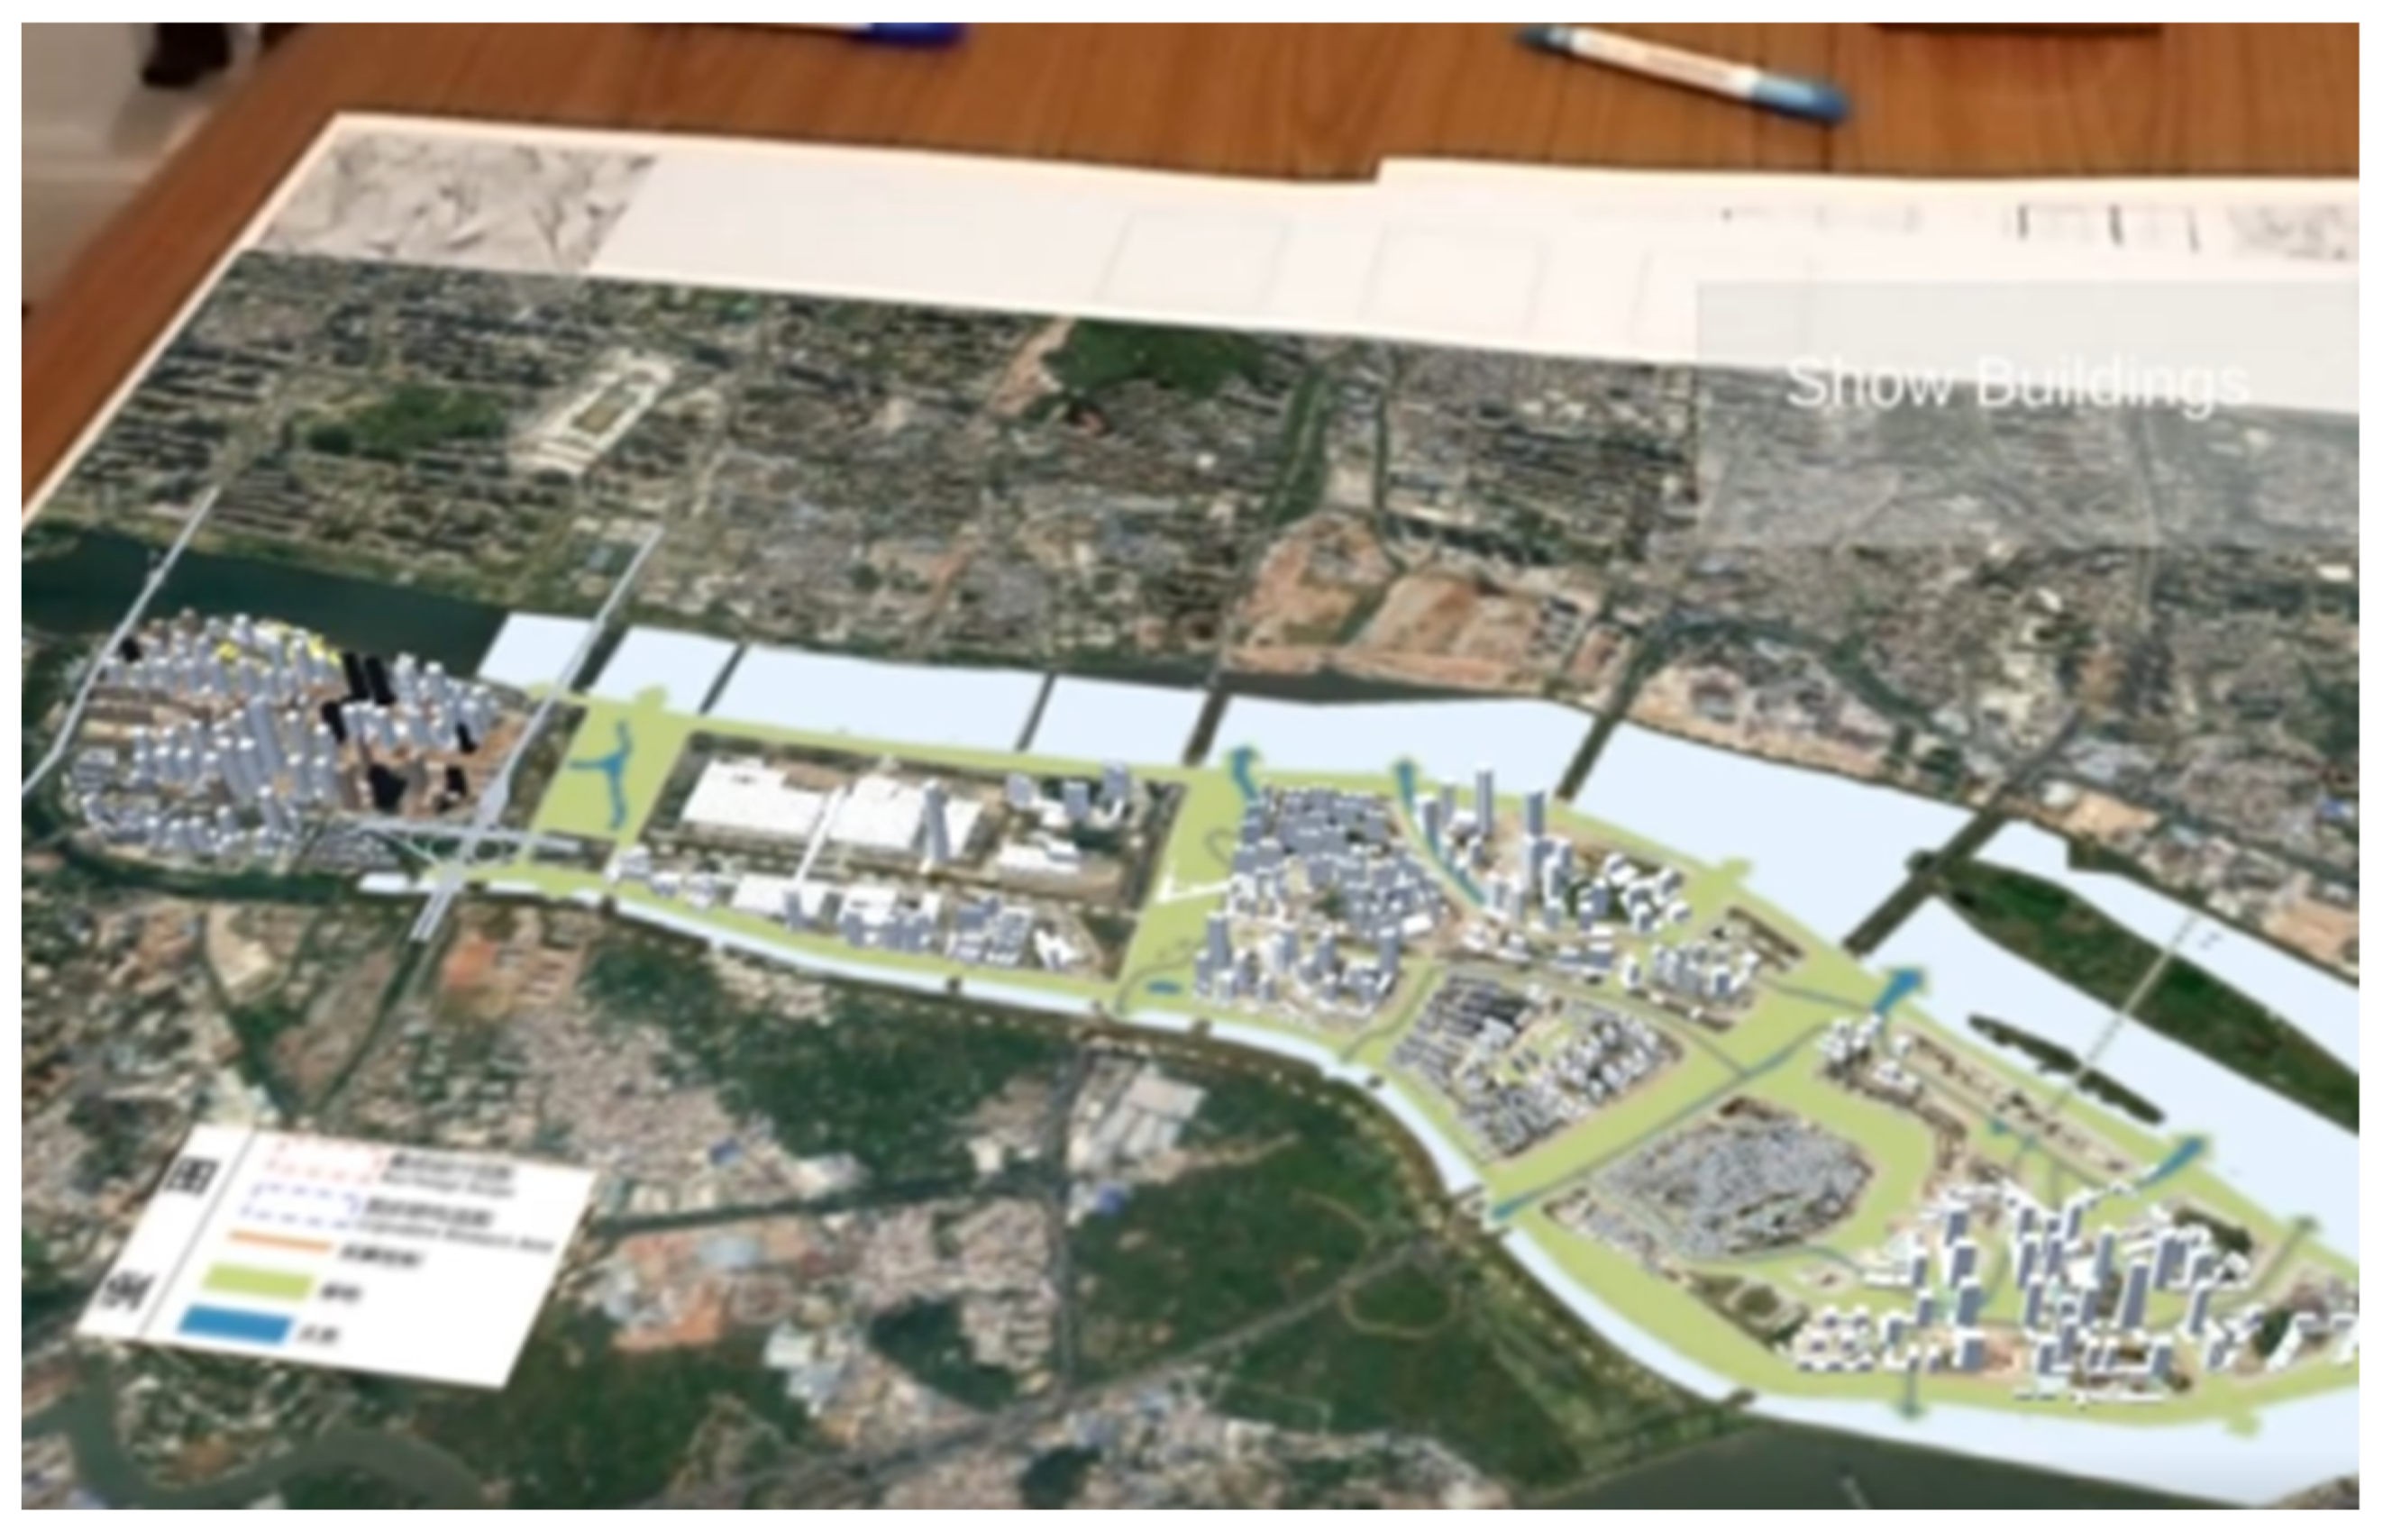
In
Figure 3, we see that the proposed greenspace area, sketched on paper, partially collides with the proposed plans for urban development. This collision of intentions would have been difficult to identify when considering how a sketch based on a current base map interacts with future urban development plans since they are not represented in the same base-map format. Identifying these contrasting plans as part of the standard design process highlights areas within a workshop that need to be explored in greater detail, facilitating a quicker and more targeted iterative process, guided by the identified constraints.
Further to integrating these sketches, we can focus on the iteration of designs in different media.
Figure 3 shows the combination of a digital design for a proposed green–blue corridor, taken from a PowerPoint presentation, a proposed 3D urban development plan, and the satellite image printed on paper, functioning as the base map. In this case, we gave priority to the 2D design layer, allowing it to obscure the 3D models. This creates a new iteration in which the proposed 2D greenspace proposals constrain and dynamically reshape the urban development footprint.
4.3. Contextualization
Throughout the project, we made a variety of site visits and conducted research to understand the project site, its problems, and the resulting concerns (c.f. [
32]). Through an adaptive visualization application, we sought to bring the important context information uncovered through this research into the planning and design process. We incorporated contextual data into the visualization to provide visual reminders of identified traffic concerns, previous flood events, and sites with a special local cultural heritage, which may serve to inform the design decisions taken afterward.
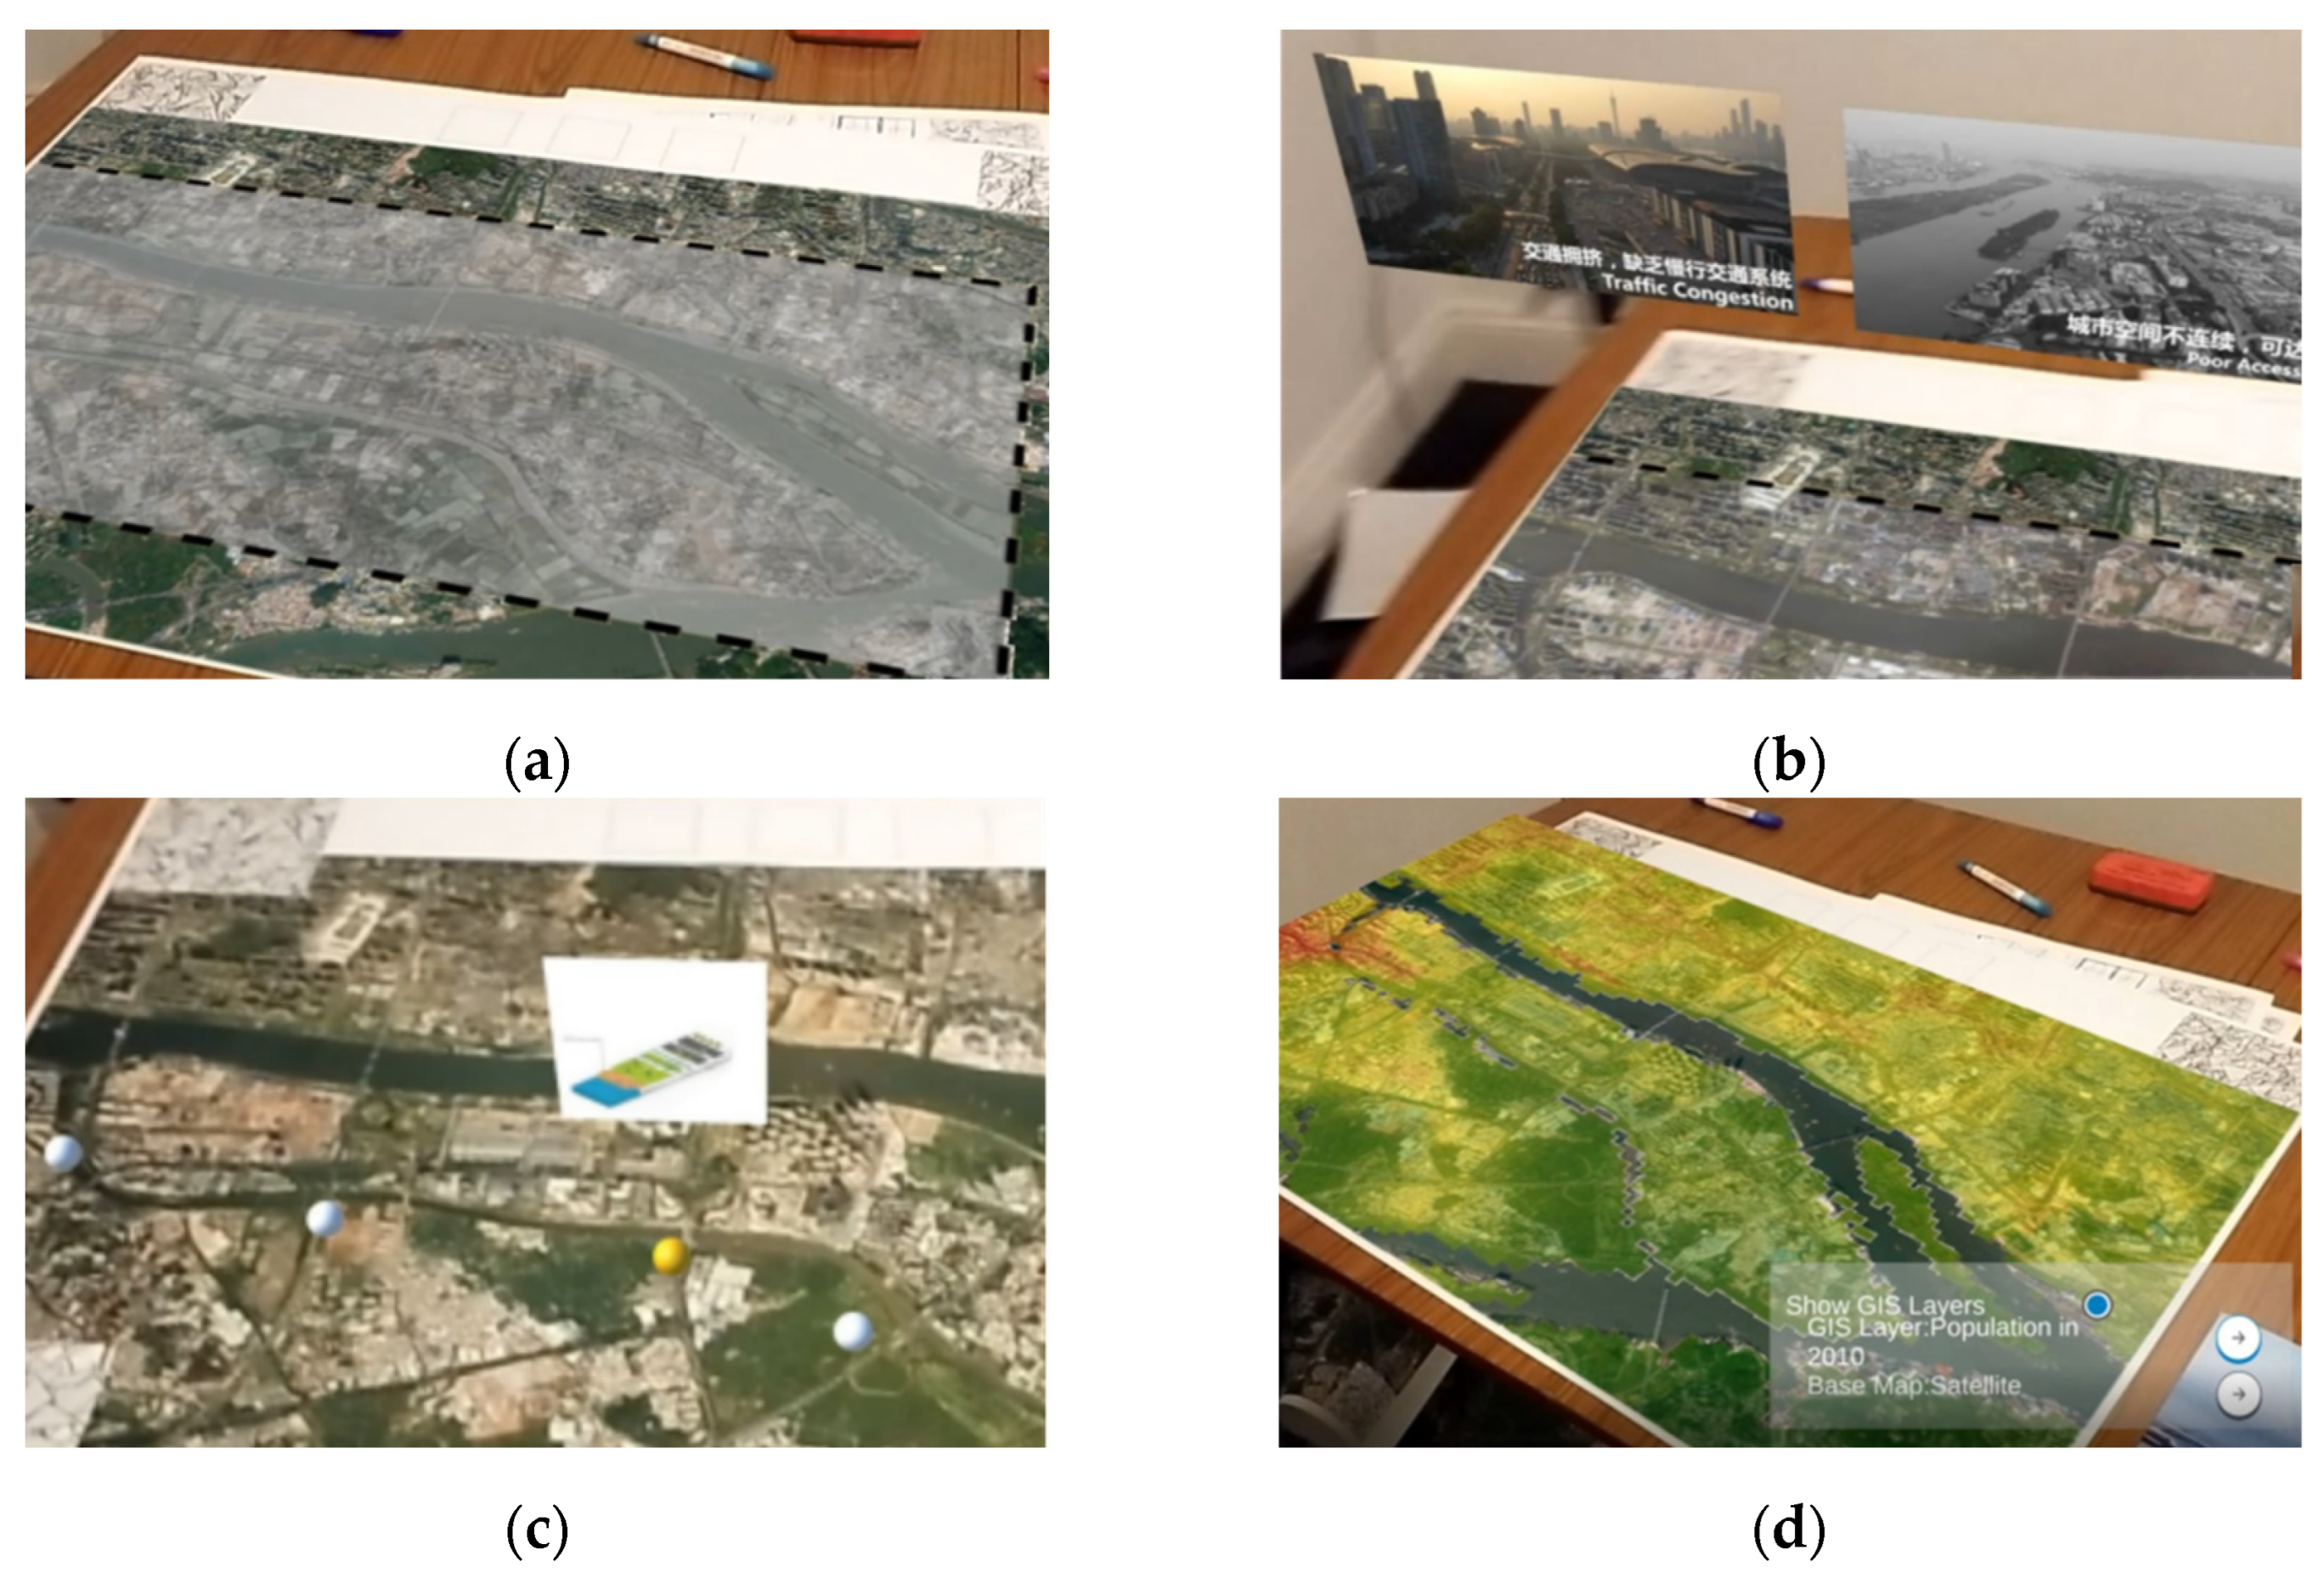
In creating this model, we brought historical maps, images detailing the issues that we are trying to address, and previous designs into the experience as toggleable layers that can be brought in at any time. Spatial information, such as historical maps, was overlaid as layers similar to GIS (
Figure 4a), whereas in
Figure 4b, the non-spatial elements were embedded into the space around the base maps, hanging in the air and visible from either side.
Figure 4c shows how research from related publications can be brought in, with individual design annotations linked to areas on the map. Here, each white ball contains an annotation from a previous presentation concerning flood defenses; focusing on that ball will bring up the associated figure for reference. The context layers aim to inform and inspire the decision-making process, while not explicitly constraining the spatial data.
We also brought in the ability to dynamically filter and display the GIS dataset layers, to help create a targeted context for the designs.
Figure 4d shows how we can selectively filter the height map to show the lowest-lying areas of the island. Doing so can inform where we place our green spaces, if we are aiming to tackle the flood problems shown in the contextual overlays. Adding dynamic layers and adjusting them so as to only show the relevant information for a specific design problem is a useful way of adding context to a base map, guiding designs without overcrowding the digital space.
4.4. Synthesis
As the most powerful principle in the adaptive visualization framework, synthesis is the most challenging principle for developers to concretely implement. Iteration, integration, and contextualization are picked up naturally, and, with limited barriers to adoption, synthesis requires a more complex approach and an understanding of the underlying context of the application being developed.
In the AR application, we approach the concept of synthesis from two angles: first, the creation of dynamic elements from static data, and two, the combination of visualizations and the data needed to create new and distinct layers. We embodied the creation of new dynamic elements through the introduction of the interactive flood map, which is a synthetic creation from a singular rasterized dataset. The process of creating the flood map is entirely independent of the specific height map that is used, enabling the quick and easy synthesis of arbitrary interactive simulations. In effect, we create a ‘generic transformer’ that can be applied to any rasterized dataset of continuous data. This transformer enables us to create an array of distinct behaviors by specifying weightings, data thresholds, and color gradients.
The flood-risk map is a single dataset instantiation of a more general class of transformers that take an array of underlying datasets and their weightings, as well as dynamically specified thresholds for visualization and color schemes.
We built onto the GIS filtering, to expand to incorporate a method for combining multiple GIS datasets through a pixel-wise linearly weighted summation, with dynamic high and low thresholds. A fully-fledged example of this activity is the MCA layer, shown in
Figure 5, which takes, as arguments, a variety of continuous datasets including population density, height maps, and imperviousness to synthesize a truly dynamic layer, in which the user can specify their preferential weighting of each normalized dataset. This allows the users to highlight the very specific areas of interest, based on their criteria, such as highlighting low-lying areas with a high population density, to guide the selection of potential intervention sites.
Finally, when a user is content with their choice of data and its combination, the application allows the user to save their current layer configuration. This can create a new static layer to be used later on.
5. Discussion
In this study, we have described the idealized principles of the adaptive urban visualization framework, and have shown that equality across visualization, data, and models will require some rethinking of how we generate, store, and integrate our workflows. The outlined principles provide a framework within which the user can utilize concrete applications that enrich the planning and design workshop environment. We developed example software that utilizes the current tools to bring further utility in comparing and combining the distinct datasets. We have demonstrated many pathways for the contributions and iterations between visualizations, data, and designs that have not previously been tapped.
There are many possible approaches to translating adaptive visualization principles into a toolset for use in a workshop setting. The validity of our mobile augmented reality-based methodology depends on our ability to capture the core principles in an inclusive and intuitive manner, without causing undue disruption to the traditional workflow process. We have chosen mobile augmented reality since it can maintain workshop processes while allowing for selective process enrichment, without replacing the workshop format. By employing well-established user interface elements (buttons, checkboxes, and sliders), the application proved to be easy to use, needing minimal training. Mobile augmented reality supports multi-user collaboration natively, offering the ability to scale the number of tablets as required, maintaining the core focal point of interaction and the large-format base maps, and supporting flexible workshop sizes and simultaneous workgroups. Furthermore, through screen-casting, the mobile AR approach supports interactive presentations, enriching the final workshop process of presenting designs and evaluating decisions in an interactive manner.
However, there are limitations to the mobile augmented reality approach. AR is currently in its infancy, with dedicated application development time required for each project that wishes to use an augmented reality approach. Furthermore, this approach needs specialist hardware and some familiarity with tablet-based interactions. This hardware and software development barrier will limit the adoption of the adaptive visualization approach, until creating these applications has become a generic process. Finally, in our implementation, the current 2D data formats are based on rasterized exports of GIS data, creating a quality bottleneck. Future research should aim to integrate GIS data more directly.
We have documented a single application that is capable of integrating disparate visualizations from across the analog–digital spectrum, combining 3D and 2D datasets, and enabling real-time rudimentary data synthesis through interactive explorations. During the AUT project meetings, we successfully engaged the participants by showing the capabilities of the application to provide real-time feedback during a design task, drawing from both static data and dynamic simulations to generate a dialog around hydrodynamic interventions.
Figure 2 shows two stills from a video recorded during the use of the application, successfully blending hand-drawn maps, flood simulations, 3D models, and GIS data during a live presentation. This experience demonstrates that with a sufficiently dynamic framework, the latest AR technology can augment our collaborative workflow without replacing the existing methodologies, enabling efforts to be directed toward enriching workflows instead of replacing them, allowing the applications to be used by participants who have had no prior training with the application.
Utilizing the AV application while a design was being created and discussed proved to be a fruitful approach, enabling grounded discussion of the design choices via exploratory sessions. Using screen-sharing, the digital augmentations of the base map were visible to the entire audience while the design was being developed live, with multiple participants. As such, this proved to be a convenient way to cross-reference previous designs, incorporate prior knowledge, and work within multiple project constraints. In general, we found that the augmented reality application successfully applied the AV principles by allowing participants to cross the digital and analog barrier, as well as the barrier between 2D and 3D digital designs, allowing 2D designs to modify 3D models, and vice versa. Furthermore, transforming static base data to dynamic filtered heat maps yielded a new application for our underlying data that would not have been possible with the data alone, such as flood visualization and MCA explorations.
While augmenting a discussion with interactive data visualization, we were able to describe where to put flood barriers while simulating a progressive flood event, as part of the presentation of different solutions. Using the dynamic data as a metric of success, we were able to ask each designer, “Do your flood plans address the areas of most concern?” This allowed the intersection of hand-drawn designs and overlaid data to concretely address the question and guide the design and discussion. Finally, we were able to effortlessly steer the discussion to target low-lying areas with high population numbers, using the dynamic layers without any prior planning or preparation.
There remain considerable opportunities for future work. Currently, the AV application is strictly a single-user experience. While several users can utilize the application independently at the same time on the same maps, some features, such as the MCA, could benefit from direct communication between users. Further to this finding, the underlying data format of each layer is required to be a rasterized image; the addition of native vector images would greatly improve the data preparation process and enable higher precision with these visualizations. While data formats for the layers have been left intentionally loose, allowing for any equally sized and scaled 2D image, this puts considerable pressure on the user to create a standard dataset. While this can be achieved easily through GIS exporting, ensuring non-spatial sources, such as aligning content from PDFs, can be a challenge. The ability to perform native data upload and transformations (i.e., scaling, rotating, and cropping) within the application would provide a smoother user experience. Finally, further work will be required in assessing the explicit user feedback over the entirety of the application capabilities.
6. Conclusions
Visualization technology is core to the planning and design of natural and urban environments. Digital visualization technologies, such as GIS systems and 3D modeling, have seen widespread adoption in the field. Simultaneously, analog technologies, such as map-driven sketching, continue to play a role in planning workshops, due to their flexible and interactive nature. In this paper, we propose a theoretical framework for adaptive visualization, to facilitate the reconciliation of analog and digital design processes in a workshop setting.
The adaptive visualization framework posits that, with the integration of digital data sources and physical resources, we can create novel, context-rich decision-making tools. We propose that augmented reality applications can combine the flexibility and interactivity of analog approaches and the flexibility of digital approaches, such as dynamic simulation visualization and 3D modeling.
To test this integrative approach, this paper details an innovative augmented reality application that enriches the collaborative map-based approach to planning and design, with digital 3D models, interactive site-specific simulations, and dynamic data-driven highlighting [
33]. As a result of developing this application, we have detailed novel design interactions for a case study in Pazhou, China. These context-specific examples demonstrate that introducing adaptive visualization principles has been exemplary in enriching the collaborative planning and design process, enabling new formats for collaborative and interactive discussions.
The adaptive visualization approach used herein for planning and design workshops, as demonstrated in the Pazhou Island case study, is independent of any specific site context. It would be applicable to any collaborative planning session handling a variety of digital, analog, and dynamic spatial data [
33]. As a generic platform for spatial dynamic data visualization, this approach could be extended to more complex data and the simulation modeling of complex systems, such as urban development [
33], migration patterns [
34], and urban traffic flows [
35]. The presented application is site-specific, due to the nature of the site-specific data presented at the workshop. Further research is required to expand the application for a more general and configurable approach that builds upon the adaptive visualization principles.
We believe that future efforts directed toward the pursuit of integration, iteration, contextualization, and synthesis for adaptive visualization will further enrich the planning and design process. We expect that the continued development of data-rich planning applications will lead to a new approach to data and information management throughout the life of a planning and design project, with a shifting emphasis on the evolution of analog and digital resources for long-term, integrative, and iterative planning processes.


