
Urban Parks Quality Assessment Using Multi-Dimension Indicators in Chengdu, China


Department of Landscape Architecture, School of Architecture, Southwest Jiaotong University, Chengdu 611756, China
*
Author to whom correspondence should be addressed.
Land 2024, 13(1), 86; https://0-doi-org.brum.beds.ac.uk/10.3390/land13010086
Submission received: 4 November 2023
/
Revised: 5 December 2023
/
Accepted: 9 January 2024
/
Published: 11 January 2024
(This article belongs to the Special Issue Landscape Architecture and Design in Urban and Peri-Urban Environment)
Abstract
:High-quality urban parks are considered an integral part of health resources as they can deliver diverse ecosystem services. However, the quality of parks is not always similar, resulting in different levels and values of the services provided. A systematic and complete assessment frame of urban park quality is limited. From the perspective of landscape architecture and design, this study aims to propose a comprehensive assessment framework of urban park quality based on six dimensions (planning and design, cultural services, complete and various facilities, landscape planting, landscape management, and landscape ecology), consisting of 27 indicators with different weights by using the objective and subjective weighting method. Taking the city of Chengdu, China as a case study, 100 urban parks are studied via field investigation and scored using methods that consist of a category count, existence score, field measurement, experts score, and photo review and recheck (13,589 images). The results reveal the spatial distribution and differences in park quality, including six quality dimensions and five districts, and the proportion of the existing quality elements in 100 parks. Based on the results, the spatial areas (Barren area, Low-quality area, Medium-quality area, and High-quality area) are identified, which leads to the establishment of the improvement strategies of spatial equity regarding multi-quality parks. The results can help improve the assessment index system of urban parks, guide the landscape planning and design of urban parks for sustainability, as well as provide a reference for future environmental and social equity development, so as to provide insight and reference for decision-makers and designers considering the landscape planning and design of parks.
1. Introduction
Urban parks can provide plenty of human well-being benefits and advance sustainable development [1,2,3,4] by delivering a variety of ecosystem services, such as regulating services, provision services, and cultural services [5,6,7,8]. They can also supply health benefits [9] such as reducing the incidence of diseases [10] by providing spaces for people to carry out physical activities and exercises [11], bringing people close to nature [12], and developing social activities [13] for the residents’ daily lives. Most empirical studies have proven that urban parks have a positive impact on residents’ health, both physical and psychological [10,11,12]. So, they are considered one of the most important strategies for improving public health [14].
Although parks are an important health resource, urban parks and their benefits do not always have equitable access and enjoyment [15,16,17,18]. Existing research regarding the environmental equity of urban parks mostly focuses on two aspects: (1) “land equity” (e.g., spatial distribution), such as the equity of sports facilities [19]; and (2) “human equity” that mainly focuses on the equity in terms of age or gender [20,21,22], socioeconomic status [23], national ethnicity, or class differentiation [24]. For example, communities with a high proportion of high-income people have more park resources [25]; conversely, communities with a high proportion of minorities (such as Blacks and Latinos) lack park resources [26]. However, most of the existing literature ignores the “equity of urban park quality”, that is, the category and quality of ecosystem services provided by urban parks vary from the parks’ quality.
In addition, the evaluation indicators of park equity are mostly based on those of the urban green space evaluation system, such as the number of parks, per capita green space area, and green coverage rate, which focus on a quantity or area occupation assessment that tends to be more egalitarian. Further, the accessibility can effectively reflect the spatial rationality of urban parks and become a mainstream evaluation method such as in measuring objective and perceived proximity [27], density [28], and distance and travel time [29]. The quantitative characterization method and visual analysis are combined with methods such as the shortest path distance method [30] and the two-step floating catchment method [18]. This is simple and enables an intuitive measurement and interpretation of accessibility. However, none of these may accurately reflect the potential availability of parks. Current studies believe that the physical environment (e.g., park quality) affects people’s potential choices and visits to parks [10]. For example, by improving the quality of parks, this can effectively increase the frequency of visits of people [31]. High-quality parks can provide a large number of different ecosystem services [5], such as climate regulation services [32]. More precisely, the park’s vegetation elements (such as trees and grassland) [33], vegetation planting forms [34], water coverage, and landscape characteristic factors (such as green space rate and canopy density) [35] all significantly affect the supply capacity of climate regulation services.
The existing literature mainly focuses on the visual quality such as aesthetic features [36,37,38,39], the environmental quality such as air and sound quality [40,41,42], the usage and recreation quality (e.g., facilities, furnishings) [43,44], and vegetation quality [45,46,47,48] of urban parks. Moreover, most studies propose specific indicators based on the research objects and use them as standards for evaluating park quality, for instance, the indicators, such as the water surface area, vegetation coverage, and visual greening, are often used to assess the cooling effects or thermal comfort (physical or psychological) [49,50,51]. There is no such common and comprehensive assessment and evaluation index system for the quality of urban parks. Further, it is difficult to propose one common framework of park quality to assess and evaluate the practical design since there are no specific standards for design quality assurance.
However, landscape architecture provides the possibility to build a common assessment framework of park quality due to it being responsible for the design process that integrates aesthetics, functionality, harmony with nature [52], and landscape sustainability [53]. Although the objects of landscape architecture involve a very wide range, such as from gardens and parks to natural heritage, landfills, and brownfields, LA is dedicated to designing for sustainability, a healthy and harmonious environment for people, flora, and fauna. To a large extent, LA determines the quality of the park. Constructing a complete evaluation framework from LA helps to improve the quality of the park from the source. The proposal of an assessment index system of urban park quality is still lacking, particularly regarding the logic of landscape architecture and design. However, from a global perspective, there is no world-class standard definition of landscape architecture, nor is there a standard index system [54]. The current research related to park quality from the perspective of LA mainly focuses on different criteria instead of a comprehensive and logical index system. For example: (1) the characteristics of landscape design, such as planting design (e.g., composition, color, diversity, and conservation) [55,56], the water surface area [36], park pathway characteristics [57], the land slope, and buildings [58]; (2) the functionality of parks, such as the convenience and recreation facilities [44], accessory elements [37], and the physical activities [59]; (3) the management of parks [42], such as the park’s cleanliness [60]. Evaluation methods and tools also vary with different indicators. Meanwhile, as landscape architecture continues to develop, its core concerns are also constantly changing and expanding [61,62]. To compare the definitions, studies, and practical scopes of landscape architecture and design in different countries, this involves landscape planning, landscape design, landscape management [63,64], and landscape planting [65], as well as concern for human well-being [66]. Hence, all the design principles and the core field mentioned here that can improve park quality can be used as the reference indicators of this study.
Therefore, the main objective of this study is to propose a comprehensive and diversified assessment framework of urban park quality from the perspective of landscape architecture, then taking the city of Chengdu in China as the empirical study to verify the assessment framework. The continuation of this paper consists of the following parts. The methods and materials are presented in Section 2. Section 3 reveals the main findings. The implications, limitations, and future research directions are discussed in Section 4. The last section summarizes the conclusion. This study is not only a supplementary study on the theories and methods of environmental equity considering urban parks, but also an optimization study on the quality evaluation system of urban parks, providing a reference for future sustainable landscape planning and design.
2. Materials and Methods
2.1. Study Area
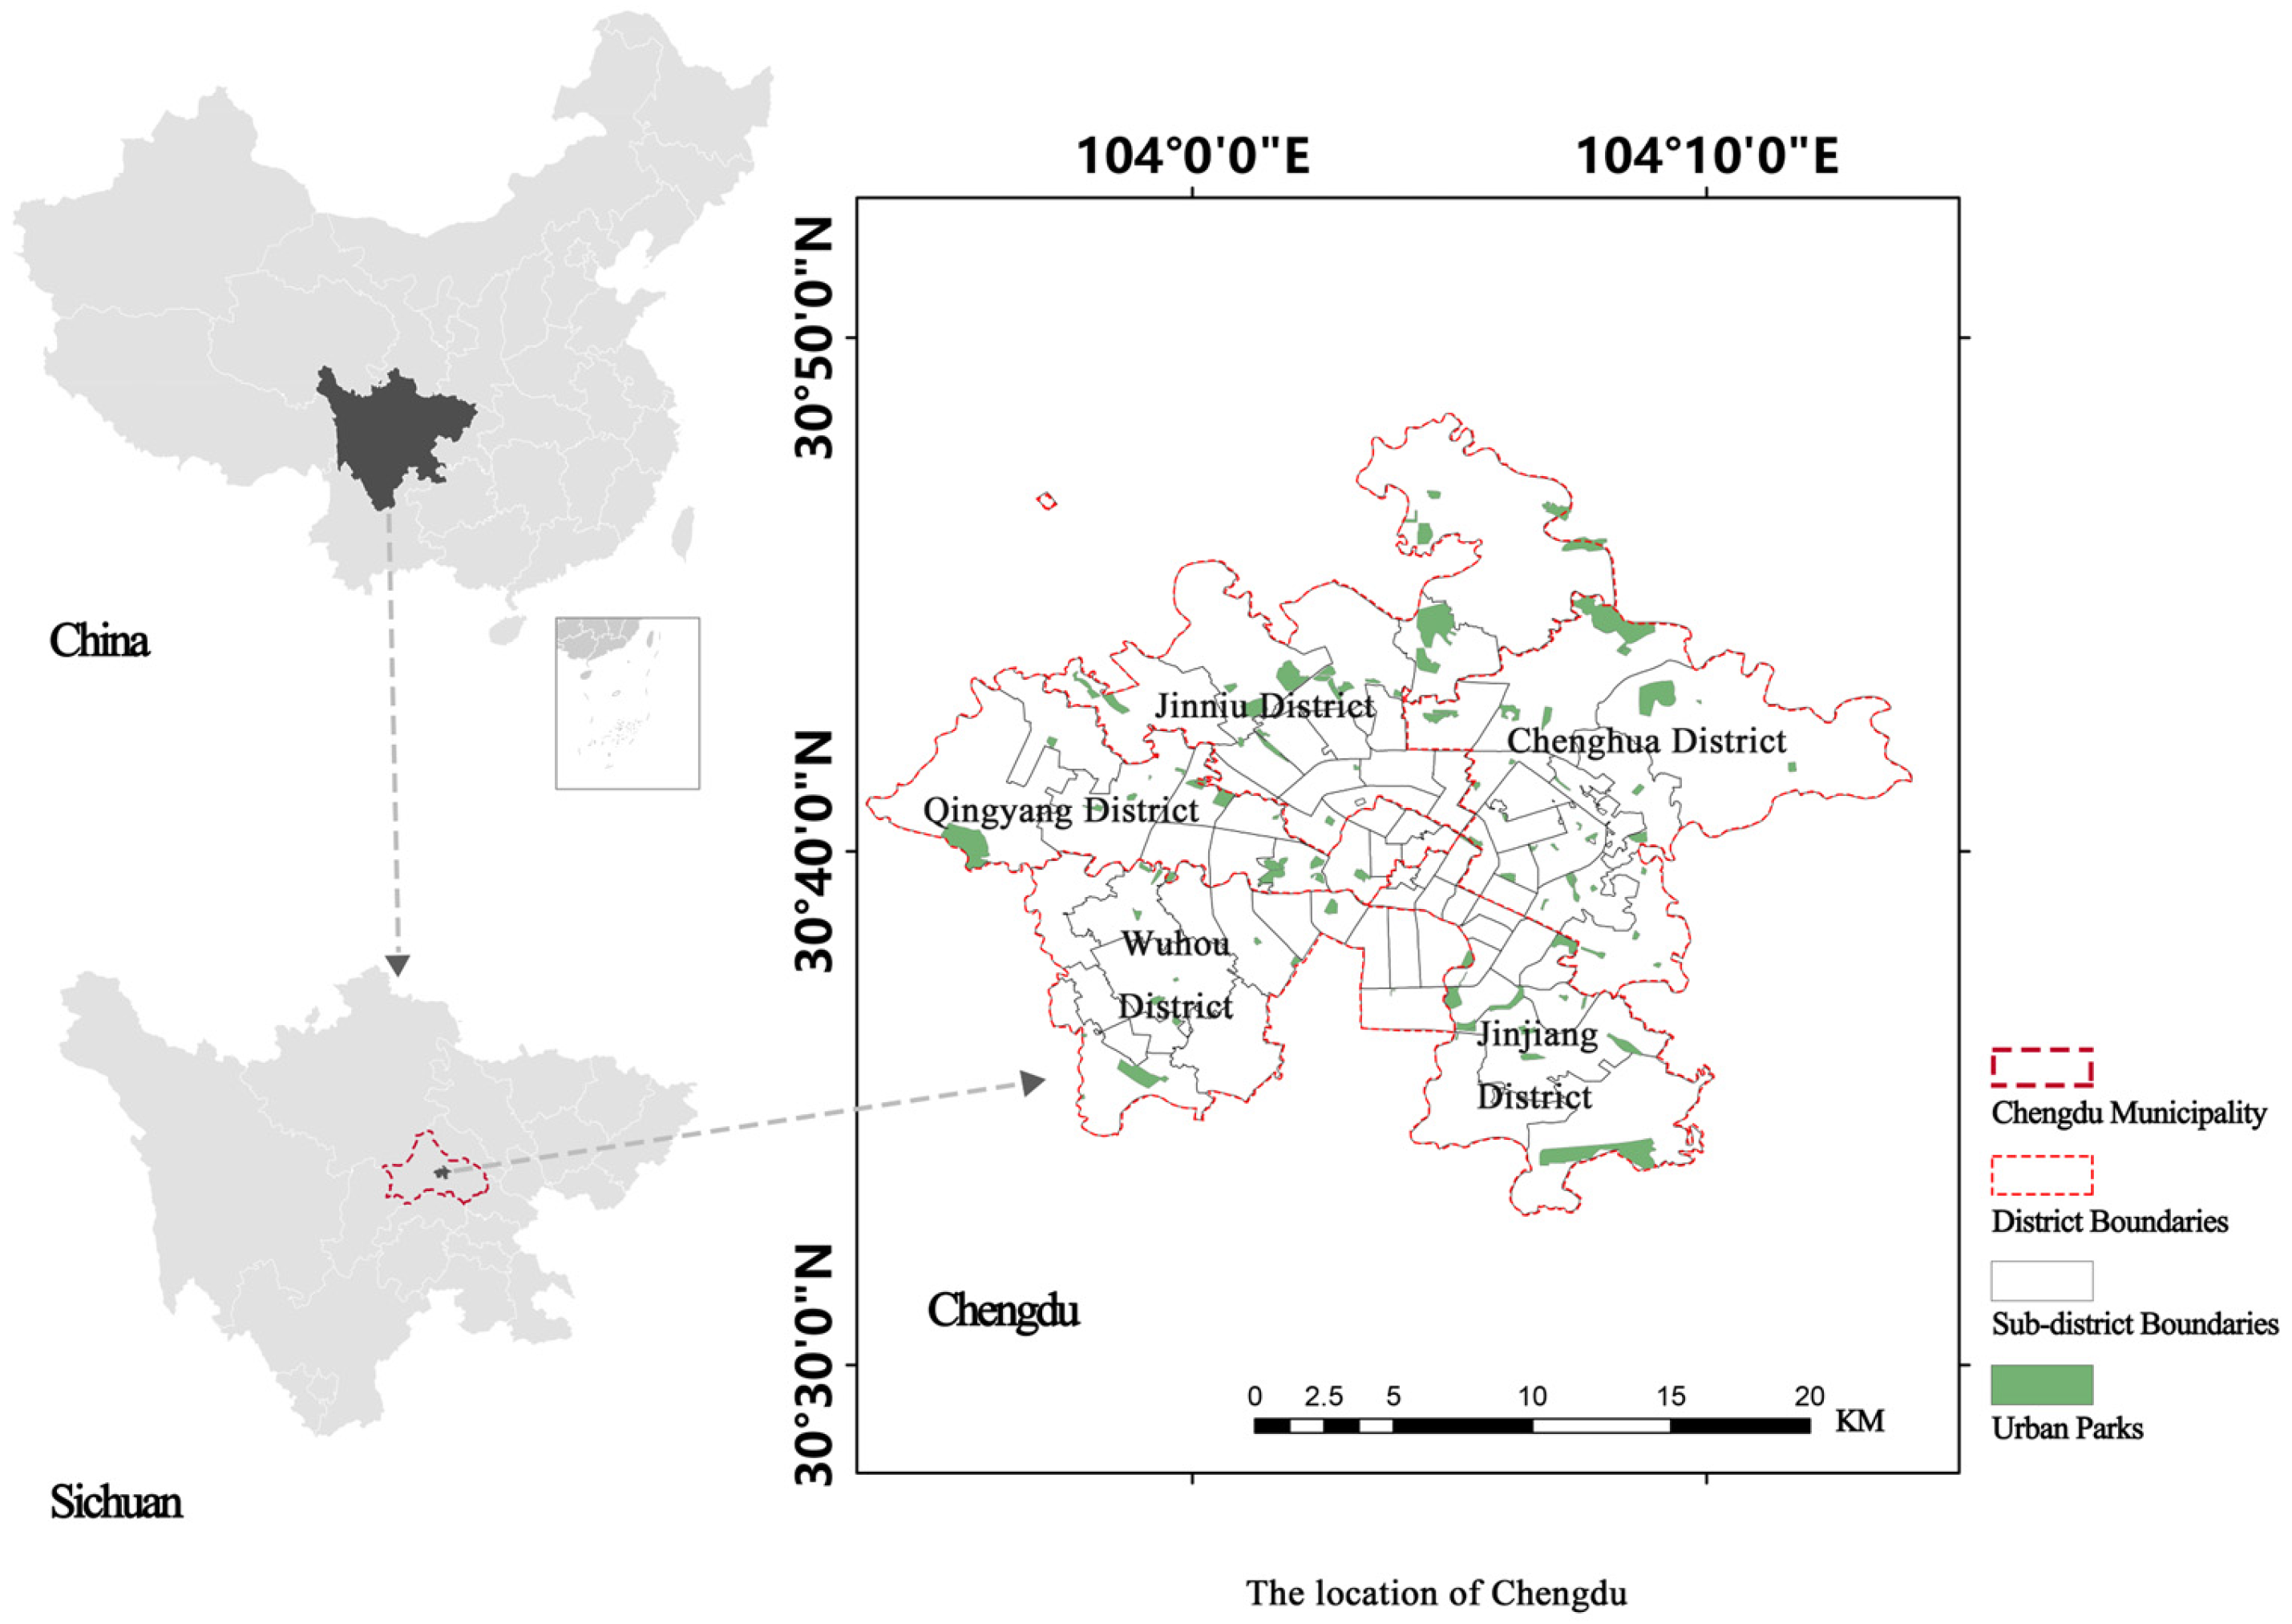
Chengdu is the capital of Sichuan Province with a current population of around 20 million, a built-up area of 94,958 ha, and an urbanization rate of 74.41% [67]. In 2018, General Secretary Xi Jinping proposed the concept of “park city” for the first time in Chengdu. In early 2022, the State Council approved Chengdu’s construction of a park city demonstration area that implements new development concepts. In recent years, the Chengdu government gave great importance to the supply and restoration of urban green spaces to improve human welfare and advance the urban environment. This study focuses on Chengdu’s five districts of the central city: Jinniu, Qingyang, Wuhou (does not include the four sub-districts under control in Gaoxin District), Chenghua, and Jinjiang District, covering an area of 421 km2 and being inhabited by over 5.7 million residents [67].
According to the <Urban Green Space Classification Standard (CJJT85-2017)> published by the Ministry of Housing and Urban-Rural Development of China, this study only considered three kinds of urban parks, including urban comprehensive parks, community parks, and special parks (e.g., zoos, botanical parks, heritage parks, and amusement parks). Because these parks provide spaces for residents to engage in daily recreation and socialization with enough area, urban public gardens were excluded since they are usually too small. Finally, 100 urban parks in the central five districts of Chengdu were targeted. However, these park resources are not always equitably distributed and enjoyed in such a compact city. Figure 1 shows the location of the study area, and the spatial distribution of urban parks in the study area.
2.2. Assessment Framework of Multiple-Quality Urban Parks
This study proposes an assessment framework of urban parks to assess their diversified qualities from the perspective of landscape architecture and design. Specifically, various facts and dimensions should be considered [54] while we are considering the quality of a certain park. First, the quality of a park largely depends on its landscape planning, design, and management. However, there is no universal definition of landscape architecture and design (LAD). It involves landscape planning, landscape design, landscape management [63,64], landscape planting [65], and human welfare [66], which combines the definitions, studies, and projects of LAD in the world. Hence, this study identifies six dimensions that are capable of representing park quality, according to the nature of LAD, based on prior studies, including: (1) landscape planning and design [39,48,64,66,68,69], (2) cultural services [44,70,71], (3) complete and various facilities [43,44,70,71], (4) landscape planting [45,46,47,72], (5) landscape management [9,43,71], and (6) landscape ecology [48,73] (see Table 1). Second, some criteria that are directly related to the six dimensions are also taken from the <Urban Park Grade Rating Standard in Chengdu (DB 5101/T 135—2021)> (UPGRSC), such as artistic, historic, cultural, and scientific values. Those indicators in the UPGRSC were not chosen since they are not closely related to LAD, and some of them cannot directly represent park quality (e.g., visitors’ satisfaction, park construction investment, and operation funds). Thus, we created a complete and multi-dimension assessment framework to evaluate the park quality, consisting of 27 indicators, and considering various stakeholders such as residents, managers of urban parks, landscape planners, and designers.
Therefore, the assessment framework of multiple-quality urban parks was established that includes 27 indicators under six dimensions (see Table 1). There are four methods to rank the quality score of urban parks: category count, existence score, field measurement, and field research and experts score. The details are explained below.
- Category count (M1). Scores are given by the number of categories. The more categories, the higher the score. For example, in terms of leisure and recreation facilities, a park with both a café, a tea room, and a chess room, etc., could receive more points.
- Existence score (M2). The criterion is whether it exists or not. Scores for presence and 0 for absence. For example, it would be 0 if there are no accessibility facilities.
- Field measurement (M3). Use different tools and techniques to measure and calculate a specific indicator. The evaluation results are used to determine the score of this indicator. In this study, only the vegetation coverage is measured by calculating the ratio of the vertical projection area of green spaces to the total area of the park.
- Field research and experts score (M4). A panel of experts from different fields marked the scores by conducting field research (see Section 2.3).
2.3. Quality Score System of Urban Parks
To process this study, a panel of experts was organized and was responsible for the indicators’ selection, the weight assignment of each indicator, field investigation and research, and the review and check of all scores, consisting of eight experts from different academic or practical backgrounds (must have a senior title or more than five years of employment). The panel included one landscape planner, two landscape architects, two botanists, one nature education practitioner, one zoologist, and one park manager. Two residents are included when the check of the final scores occurs.
The quality score system of urban parks consists of two main steps: (1) the weight assignment of each indicator’s value; and (2) the identification of the final score of each park. First, 27 indicators represent different aspects of the park’s quality, and likewise, they should be assigned different weights. So, each sub-criterion was weighted from 1 to 4 using the objective and subjective weighting method. The value 4 represents the maximum weight matching. Specifically, the document UPGRSC and the prior studies (e.g., [71,74]) guide the adjustment of the weight of each indicator (objective). The panel evaluation adjusts for relatively important indicators (subjective) based on their professional knowledge and several discussions.
Finally, the quantitative score system of the multi-quality urban parks is carried out (see Table 1). Table 1 demonstrates the certain weights of each indicator. The sum of the score is 65.
Second, field investigation and research were conducted from 7 September 2022 to 8 October 2023. A total of 100 urban parks in the central five districts of Chengdu were studied, as well as scored by the assessment framework (including four methods). About 20 thousand images of urban parks were obtained during the investigation, and 13,589 images were selected for further review. Further, after integration with 27 indicators, the authors and the panel of experts rechecked the previous scores and rated the quality of the urban parks by reviewing 13,589 images to ensure the fairness and reliability of scores. Thus, the final scores were obtained.
3. Results
3.1. Assessment of Multi-Dimension Qualities of Urban Parks
3.1.1. Total Points and Spatial Characteristics of Urban Parks
According to the field investigation and the official statistics, there are 100 urban parks (UPs) in the study area, with a green area of 2010.79 ha, including 27 UPs in Jinniu District, 14 UPs in Wuhou District, 14 UPs in Jinjiang District, 15 UPs in Qingyang District, and 30 UPs in Chenghua District. According to the assessment framework of multi-quality urban parks, a total of 100 UPs are scored for six dimensions of quality. Table 2 shows the number, area, and average score of three types of parks in different districts. We can see that the area of parks in the Jinniu District is much higher (904.09 ha) than that of the other four administrative regions. The area of parks in the Wuhou District is the lowest (204.58 ha). Moreover, from the perspective of the administrative region, the average points of UPs in the Jinjiang District are the highest (38.07). This was followed by the Qingyang District (37.53), Chenghua District (35.22), Jinniu District (31.22), and Wuhou District (25.54) (see Figure 2). Although the Jinniu District occupies the largest park area, its average point of quality is only 31.22. The quality of the parks in the Jinniu District varied, with points ranging from 16.5 (lowest) to 52 (highest). We can see that the indicators in terms of the number and area of parks are not enough when evaluating environmental equity, therefore park quality should be included as an important index.
Further, Figure 3 shows the spatial distribution of the scores of urban park quality in the study area. Of 100 UPs, the highest score is 56.5 points, while the lowest score is 9, indicating a huge difference in the parks’ quality. There are 64 UPs under 39 scores out of 65, accounting for 64%, which means most of the UPs are not qualified regarding their multi-qualities. A total of 26 UPs were scored from 39 to 50, representing 26% of UPs of an average or above average quality. Only 10% of UPs are above 50 points out of 65. Moreover, we can see that 15 sub-districts do not contain any parks. Among them, 8 sub-districts are located near First Ring Road representing the central area of Chengdu. Furthermore, we can see that the scores vary widely between regions considering the park quality. The distribution of high-level areas and low-level areas is staggered from the core to the periphery. Judging from the main traffic arteries of the First and Second Ring roads in the study area, although there are 8 sub-districts with a 0-score (no UPs) within the First Ring Road, there are also many high-score areas (high-quality parks). Additionally, there are many moderate-scoring areas (with average-quality parks) scattered around the Second Ring Road. In terms of east–west distribution, the spatial differences are more clear. Generally, the East has more high-quality parks compared to the West.
3.1.2. Analysis of Six Quality Dimensions
An assessment of the multi-dimension qualities of urban parks is established with six dimensions, including planning and design (PD), cultural services (CS), complete and various facilities (CVF), landscape planting (LP), landscape management (LM), and landscape ecology (LE). The scores of 27 indicators are normalized from 0 to 1 for comparison. Figure 4 shows the proportion of existing quality elements (27 indicators) in various parks of five districts and in 100 parks.
Comparing the five administrative districts, we can see that UPs in the Jinjiang District have more balanced scores regarding quality elements, more diverse infrastructure and facilities, high-quality plant resources, and beautiful plant landscapes. UPs in the Qingyang District provide more and various cultural services. The parks in the Jinniu District are better maintained. Further, the sum and average scores of CVF and LP are the highest, indicating that UPs of Chengdu attach great importance to the integrity and diversity of facilities, as well as the configuration and design of plants. This also shows that planners and designers will give priority to meeting the basic needs of residents such as leisure and recreation, fitness and sports, convenience, shading, etc., and have high requirements for plants when they are planning and designing urban parks. In addition, PD ranks third, indicating that landscape planning, layout, and design concepts are well-considered during park construction in the study area. LM ranks fourth, which also represents the importance of the management and maintenance of UPs. CS ranks fifth, demonstrating that planners and designers do not pay much attention to the provision of cultural services in the UPs of the study area. Additionally, the park’s artistic value, aesthetic value, historical and cultural value, and scientific and educational value are low. LE ranks last, and its score ratio is significantly lower than that of the other five dimensions, indicating that the plan and design of urban parks in the study area have largely ignored landscape ecology, especially considering low carbon, environmental protection, and biodiversity.
Further, all parks are divided into three levels based on their area, i.e., small parks (<5 ha), medium parks (5–10 ha), and large parks (>10 ha). The statistical results are shown in Table 3. This shows the statistics of six dimensions of urban parks with three sizes. It reflects that the larger the park, the higher the quality score in four dimensions (PD, CVF, LP, LM). Yet, regarding the dimensions of CS and LE, the fraction does not increase with increasing area.
3.2. Identification of Spatial Areas Based on Multi-Quality Parks
Quantitative data and maps can be used to identify spatial areas [5] relative to the quality of urban parks. For better comparison, we normalized the score from 0 to 1 based on the final scores of 100 parks. Note that we took the average of the sum of the scores if there is more than one park in the same sub-district. Further, we identify four spatial areas that reflect the various characteristics regarding the quality of the UP. In line with the previous results of this study, we code places with zero or extremely low quality as the “Barren area” (0–0.25) (BA), followed by the “Low-quality area” (0.25–0.5) (LA), the “Medium-quality area” (0.5–0.75) (MA), and the “High-quality area” (0.75–1) (HA). So, the spatial areas based on multi-quality parks are identified in Figure 5, reflecting the current situation and spatial characteristics of park quality in the study area. Further, different strategies are developed and proposed based on these four spatial areas (BA, LA, MA, and HA). In what follows, we outline critical strategies and concerns in the four areas considering park quality improvement and planning.
BA is primarily a key area, which contains many sub-districts without urban parks at all. According to the assessment results of six dimensions of urban park quality, they are all extremely low. It is thus important to improve their multi-quality by redesigning and replanting, and it is essential to increase the coverage of urban parks regardless of the quality.
LA consists of many low-quality urban parks, which are mainly concentrated in the city center area, maybe because the land is too expensive, and it is rarely used for parks. Moreover, parks in LA failed to achieve a passing grade in all six dimensions of quality assessment. Considering PD, the concept and local suitability of landscape planning and design are weak, and there are no water features in most UPs in LA. Regarding CS and CVF, their values are extremely low, meaning that UPs in LA cannot meet basic needs, such as facilities for convenience, recreation facilities, accessible facilities, sports, and fitness facilities, which are particularly limited. Most UPs in LA lack cultural connotations and can provide very limited cultural services, especially artistic, historical, and scientific value. Furthermore, those parks in LA generally ignore landscape ecology when they are planned and designed. Thus, they should be developed and renewed by implementing ecological restoration, facilities improvement, and cultural services development.
MA is an area that needs further optimization. It includes many UPs that have been newly built in recent years within the context of park city construction in Chengdu, which ensures new modern technologies and tools, and the comprehensive consideration of landscape planning and design. Compared to parks in other regions, most of the parks in MA have made significant progress in LP and LE, including the improvement of awareness and the application of technologies. However, considering the provision of scientific and educational value, the water quality, and the biodiversity of UPs, it is essential to improve and advance.
Further, HA is primarily a protected area since it has UPs with high quality (the scores from 0.77 to 0.85), which are mainly distributed in the Qingyang District (there are two cultural and historical parks and three parks with local cultural characteristics that account for a great proportion in the assessment quality system). The scores of quality are high, considering PD, CS, CVF, LP, and LM, meaning that they generally have richer landscapes, more diverse facilities, diversified provision of cultural services, and suitable measures of park maintenance and management. However, in HA, planners and designers ignore sustainability and ecology, which should be paid more attention in the future to advance the delivery capacity of ecosystem services, particularly the regulating services.
Therefore, six dimensions should be considered comprehensively. In addition, it is necessary to carefully consider the park situation in different areas, making up for the shortcomings, instead of only thinking about one aspect.
4. Discussion
4.1. Implications
This study reveals the differences and spatial characteristics of park quality in five districts of Chengdu, and the proportion of 27 quality elements within six dimensions in 100 parks by assessing the framework of multi-dimensional qualities of urban parks. This extends the prior work on park quality assessment [40,41,42,44,70,71], and spatial and environmental equity [73,75]. The findings of this study are original and lead to guidelines for the development and improvement of landscape architecture and design considering urban parks.
The multicriteria of park quality build on many prior studies as we mentioned before (for example, [43,44,70,71]), and we verified some of them, for instance, the results of this study found that the facilities most relevant to people’s basic needs are the most accessible and available in parks [44]. Compared with those studies, this assessment framework tends to be more comprehensive and complete. In particular, the six dimensions almost include most of the factors related to the LAD of urban park quality except for some invisible qualities (e.g., climate regulating), because it is not difficult to see the commonality among those indicators of the prior studies, which are based on the representation (e.g., aesthetic and cultural) and functionality (e.g., recreation, physical activities, and ecological function) of the park. Most of them only focused on certain factors that lacked a comprehensive system. For instance, some studies only focused on the park facilities and aesthetic features, e.g., [44] and [70], and vegetation and furnishings (e.g., lighting, benches, adult games, rubbish bins, and toilets) [56]. Some studies added factors such as maintenance level [76], biodiversity, architectural objects [71], and cleanliness [60].
Further, our research finds that the method in this study has some advantages over the photo selection and rating based on the social media platform that was used by many prior studies [26,44,77,78]. The method combines field investigation and photo rating, which is better for rating the park quality in particular, because the images provided on the social media platform have some limitations since most of them are uploaded by the users and visitors. The proportion of older adults who use social media platforms is generally small, which means that to some extent, some older adults have lost the right to speak about their preferences for parks. In addition, the photos uploaded by a social platform or review website may not always accurately represent the evaluated place. People often upload photos of the scenery that they think is good, rather than some infrastructures in the park (such as toilets and seats). In addition, due to the social nature of social media platforms, people tend to embellish the photos when they upload, such as adding filters (distorting the scenery). Therefore, the image data obtained cannot completely represent the situation and characteristics of the park, resulting in the score evaluation of quality also having some uncertainties.
Considering the average score of the park quality in five districts, the score of the Jinjiang District is 38.07, ranked first, followed by the Qingyang District (37.53). These two districts have always been the two areas with the highest housing prices in the study area, which may result in the high quality of urban parks. Moreover, there are more high-scoring areas within the First Ring Road, that is, in the city center area. However, at the same time, there are also many 0-point areas, which do not contain any park resources at all. This may be because, in a densely populated city such as Chengdu, land prices are very expensive. Urban land use types have been established for many years that are difficult to change. Further, the spatial differences in park quality in terms of the total points are seen. There are more high-quality residential areas in the eastern region than in the western region, which may be due to Chengdu’s policy trends in recent years. Chengdu has vigorously developed the Eastern New District and comprehensively promoted various construction projects there, including the development and renewal of urban parks, and has actively promoted and improved the quality of its eastern regional parks. It can be seen that policy guidance is very vital [79].
Regarding the quality concerns, the points of the six dimensions of park quality are, in descending order, LP, CVF, PD, LM, CS, and LE. The CVF and LP elements of 100 parks are relatively high, indicating that Chengdu UPs attach great importance to the integrity and diversity of facilities, as well as the configuration and design of vegetation. More specifically, most parks in Chengdu create beautiful plant scenery through rational plant allocation, the use of native species, the protection of old trees, and the improvement of vegetation coverage. Although CVF is the second most important park quality dimension, the sports and fitness facilities are uncommon and sufficiently diverse. Almost 39% of parks have no sports or fitness facilities. Without these facilities, residents may not be able to enjoy the sports and fitness benefits of parks, thereby impacting park visitation [80], as well as the residents’ health [12]. Furthermore, accessible facilities are rare in most parks, maybe due to the inadequate implementation of accessibility regulations and design guidelines. However, the basic, guided tour and convenience facilities are common in almost every park, meaning that the basic needs of visitors are given priority. A total of 22% of parks have no accessibility facilities and 49% of parks have insufficient equipment. The absence of barrier-free facilities is extremely unfair to people with disabilities and some disadvantaged groups, depriving them of the possibility to fairly use park-related facilities and carry out related activities. PD ranked third, indicating that the planners and designers of Chengdu parks paid more attention to the landscape concept, spatial layout, diverse functions, and traffic organization by integrating local conditions. However, the water features are normally uncommon such as the lack of sustainable water resources. This may be due to technical and financial constraints in water purification and maintenance. In terms of CS, people tend to appreciate aesthetic values [81], while those invisible values or abstract artistic values are not always perceived and appreciated. Four indicators of this dimension are generally ignored during the process of landscape planning and design. Meanwhile, LE is a dimension that is often considered and mentioned in reality. However, it had few positive effects. In particular, the low carbon and environmental protection should be advanced and considered more in the future. Additionally, considering the low scores and proportion of LM, maybe not because of the outdated management styles, instead the management issues were not given too much consideration during the process of landscape planning and design of the park. For example, plant designers chose tree species that are more expensive or difficult to maintain, which makes subsequent maintenance more difficult and costly; or, some parts of the construction were not constructed in full accordance with the design drawings, resulting in increased maintenance costs in the later period and poor maintenance. In summary, six dimensions should be considered as a whole throughout the entire design process of urban parks.
4.2. Limitations and Future Research Directions
This study has some limitations that point to directions for future research mainly related to two aspects: environmental equity and the methodology of park quality assessment.
Regarding the research on spatial and environmental equity, there are two important points. First, this study failed to consider indicators such as accessibility and the socio-economic data (demographic data and housing data) to analyze the environmental equity and justice integrating the park quality, since the prior studies show that there is significant social inequality in the accessibility of parks [42], and the park resources are affected by gender or age [22,82], socio-economic status [23], and race [15]. Future research should establish a research framework that combines both the demand and supply of park resources, rather than only consider the park quality, to create a multi-dimensional environmental equity assessment system by integrating park quality, accessibility, transportation, park area, geographical level, people’s needs, and so on. Further, a sub-district with only one park would have a small area but a high score (the area would show higher value in the assessment scores of park quality), although this was not found in this study. It still deserves attention and consideration in future research. This also shows that, from the perspective of spatial and environmental equity, park quality is difficult to use as an evaluation indicator alone, but should be combined with criteria such as accessibility and population characteristics.
Moreover, there are some deficiencies in the methods of quality evaluation of urban parks in this paper. First, the park location, area, and visitation are important factors that affect the quality, thus, it is necessary to combine them with the park quality to improve the assessment framework of this study. It could establish models combining resident interviews or questionnaires to determine the appropriate proportion of the contributions made by the various indicators, integrating the experts’ review and evaluation to adjust the parameter weights in future research. Furthermore, there are four methods (category count, existence score, field measurement, and experts score and research) to analyze and evaluate the indicators. The fourth method (field research and experts score) mainly relied on the panel’s subjective opinion, and the panels of experts were also responsible for the review and recheck of the final scores. However, the members of the expert group are all from Chengdu (there may be regional or ethnic differences when it comes to subjective evaluation), and their participation in the decision-making process was sometimes likely to be influenced by the local social, institutional, and political environment. Therefore, future studies or replication studies in other regions should establish more scientific criteria for the selection of individuals or groups of experts. Whether the results of this study can be generalized to Chinese cities outside of Chengdu and even to other cities around the world remains to be verified. Moreover, the evaluation framework established in this paper has not been evaluated and analyzed for parks outside Chengdu, and its operability and extensibility need to be further verified. In future studies, this framework should be applied to evaluate other well-known parks around the world, and the evaluation methods and results should be compared to other studies to further verify the evaluation framework. Last but not least, the assessment framework of urban park quality proposed in this study is based on the background of LAD. Although it integrates aspects such as design, aesthetics, function, ecology, and human well-being, it cannot cover every aspect of park quality, such as the sound quality, air quality, the level of thermal comfort, etc. This still needs further development, and future research should consider adding more indicators of landscape ecology and ecosystem regulating services.
5. Conclusions
A total of 100 parks were surveyed and studied regarding their quality in six dimensions and 27 indicators in the study area of Chengdu, China. The results show that the quality of urban parks in the study area has great differences, and the spatial distribution is unfair. From the perspective of administrative regions, the average score of the Jinjiang District City Park is 38.07, ranking first, followed by the Qingyang District (37.53), Chenghua District (35.22), Jinniu District (31.22), and Wuhou District (25.54). A total of 15 sub-districts do not contain any park green space resources at all. The highest score among 100 UPs is 56.5 points, and the lowest score is 9 points, which shows that the quality difference between parks is huge. Among them, 64% of parks scored below 39, indicating that the overall quality of most UPs is unqualified. Moreover, the park scores vary widely from region to region. From the core to the periphery, the distribution of high-rise areas and low-rise areas is staggered. There are more high-scoring areas within the First Ring Road, and there are more high-quality residential areas in the eastern region than in the western region. Considering the six dimensions and 27 evaluation indicators of park quality, the planning and design of parks in the five districts have different trade-offs. For example, urban parks in the Qingyang District provide a variety of cultural services, while parks in the Jinniu District pay more attention to park management and maintenance. Furthermore, the larger the park size, the better the quality in four dimensions (PD, CVF, LP, and LM). It is worth noting that balancing the proportion of the six dimensions of quality elements should be the primary task of future planning and design, rather than just focusing on one aspect of the elements. Based on the results, we identified four spatial regions that reflect various characteristics of park quality, namely, BA, LA, MA, and HA. According to different spatial characteristic areas, corresponding park quality improvement strategies are proposed. In BA and LA, the improvement and adjustment of park quality have become more important to create a fair environment. In MA and HA, it is necessary to improve the quality of certain aspects of the park.
This study reveals the capacity of ecosystem services provision of different urban parks to residents by assessing the multi-quality of urban parks. It is essential to create a justice and equity environment particularly in the different communities by identifying and correcting the differences in park quality. The study can provide insight and reference for decision-makers and designers considering the landscape planning and design of parks. Overall, the findings of this study will help improve the urban park evaluation index system from the perspective of LAD, and help guide landscape planners and designers scientifically to plan and design urban parks. These findings also provide a reference for future environmental equity and social equity development.
Author Contributions
Conceptualization, S.Z.; methodology, S.Z., X.L. and S.L.; software, S.Z., X.L. and S.L.; validation, S.Z.; formal analysis, S.Z. and H.S.; investigation, S.Z. and H.S.; resources, S.Z.; data curation, S.Z. and H.S.; writing—original draft preparation, S.Z.; writing—review and editing, S.Z.; visualization, S.Z.; supervision, S.Z.; project administration, S.Z.; funding acquisition, S.Z. All authors have read and agreed to the published version of the manuscript.
Funding
This work was funded by the National Natural Science Foundation of China (NSFC) (Grant No. 52008345); Sichuan Philosophy and Social Science Foundation Project (Grant No. SCJJ23ND496); and the Sichuan Key Research Base of Social Sciences (Extended) National Park Research Center (No. GJGY2022-ZC005).
Data Availability Statement
The data presented in this study are available on request from the corresponding author. The data are not publicly available due to privacy.
Acknowledgments
The authors sincerely thank all anonymous reviewers and editors for their comments and help. Thanks to all those who participated in the field investigation and all experts who ranked the park and proposed the professional suggestions.
Conflicts of Interest
The authors declare no conflict of interest.
References
- Benedict, M.A.; McMahon, E.T. Green Infrastructure: Smart Conservation for the 21st Century. Renew. Resour. J. 2002, 20, 12–17. [Google Scholar]
- Rössler, S. Green space development in shrinking cities—Opportunities and constraints. Urbani Izziv 2008, 19, 147–152. [Google Scholar] [CrossRef]
- Young, R.F. Managing municipal green space for ecosystem services. Urban For. Urban Green. 2010, 9, 313–321. [Google Scholar] [CrossRef]
- Tzoulas, K.; Korpela, K.; Venn, S.; Yli-Pelkonen, V.; Kamierczak, A.; Niemela, J.; James, P. Promoting ecosystem and human health in urban areas using Green Infrastructure: A literature review. Landsc. Urban Plan. 2007, 81, 167–178. [Google Scholar] [CrossRef]
- Zhang, S.; Muñoz Ramírez, F. Assessing and mapping ecosystem services to support urban green infrastructure: The case of Barcelona, Spain. Cities 2019, 92, 59–70. [Google Scholar] [CrossRef]
- Coutts, C.; Hahn, M. Green Infrastructure, Ecosystem Services, and Human Health. Int. J. Environ. Res. Public Health 2015, 12, 9768–9798. [Google Scholar] [CrossRef]
- Gómez-Baggethun, E.; Barton, D.N. Classifying and valuing ecosystem services for urban planning. Ecol. Econ. 2013, 86, 235–245. [Google Scholar] [CrossRef]
- Lafortezza, R.; Davies, C.; Sanesi, G.; Konijnendijk, C. Green Infrastructure as a tool to support spatial planning in European urban regions. iForest Biogeosci. For. 2013, 6, 102–108. [Google Scholar] [CrossRef]
- Zhang, S.; Li, X.; Chen, Z.; Ouyang, Y. A bibliometric analysis of the study of urban green spaces and health behaviors. Front. Public Health 2022, 10, 1005647. [Google Scholar] [CrossRef]
- Xie, B.; An, Z.; Zheng, Y.; Li, Z. Healthy aging with parks: Association between park accessibility and the health status of older adults in urban China. Sustain. Cities Soc. 2018, 43, 476–486. [Google Scholar] [CrossRef]
- Wang, H.; Dai, X.; Wu, J.; Wu, X.; Nie, X. Influence of urban green open space on residents’ physical activity in China. BMC Public Health 2019, 19, 1–12. [Google Scholar] [CrossRef] [PubMed]
- Sugiyama, T.; Carver, A.; Koohsari, M.J.; Veitch, J. Advantages of public green spaces in enhancing population health. Landsc. Urban Plan. 2018, 178, 12–17. [Google Scholar] [CrossRef]
- Taylor, S.; John, L. Supplying urban ecosystem services through multifunctional green infrastructure in the United States. Landsc. Ecol. 2013, 28, 1447–1463. [Google Scholar]
- Rayan-Gharra, N.; Ofir-Gutler, M.; Spitzer, S. Shaping health: Conducting a community health needs assessment in culturally diverse peripheral population groups. Int. J. Equity Health 2022, 21, 1–13. [Google Scholar] [CrossRef]
- Wolch, J.R.; Byrne, J.; Newell, J.P. Urban green space, public health, and environmental justice: The challenge of making cities “just green enough”. Landsc. Urban Plan. 2014, 125, 234–244. [Google Scholar] [CrossRef]
- Lome-Hurtado, A.; Touza-Montero, J.; White, P.C.L. Environmental Injustice in Mexico City: A Spatial Quantile Approach. Expo. Health 2020, 12, 265–279. [Google Scholar] [CrossRef]
- Zhang, R.; Sun, F.; Shen, Y.; Peng, S.; Che, Y. Accessibility of urban park benefits with different spatial coverage: Spatial and social inequity. Appl. Geogr. 2021, 135, 102555. [Google Scholar] [CrossRef]
- Lan, T.; Liu, Y.; Huang, G.; Corcoran, J.; Peng, J. Urban green space and cooling services: Opposing changes of integrated accessibility and social equity along with urbanization. Sustain. Cities Soc. 2022, 84, 104005. [Google Scholar] [CrossRef]
- Xiao, T.; Ding, T.; Zhang, X.; Tao, Z.; Liu, Y. Spatial Accessibility to Sports Facilities in Dongguan, China: A Multi-Preference Gaussian Two-Step Floating Catchment Area Method. Appl. Spat. Anal. Policy 2022, 15, 1093–1114. [Google Scholar] [CrossRef]
- Baran, P.K.; Smith, W.R.; Moore, R.C.; Floyd, M.F.; Bocarro, J.N.; Cosco, N.G.; Danninger, T.M. Park Use Among Youth and Adults: Examination of Individual, Social, and Urban Form Factors. Environ. Behav. 2014, 46, 768–800. [Google Scholar] [CrossRef]
- Akpınar, A. How perceived sensory dimensions of urban green spaces are associated with teenagers’ perceived restoration, stress, and mental health? Landsc. Urban Plan. 2021, 214, 104185. [Google Scholar] [CrossRef]
- Yakınlar, N.; Akpınar, A. How perceived sensory dimensions of urban green spaces are associated with adults’ perceived restoration, stress, and mental health? Urban For. Urban Green. 2022, 72, 127572. [Google Scholar] [CrossRef]
- Gordon-Larsen, P.; Nelson, M.C.; Page, P.; Popkin, B.M. Inequality in the built environment underlies key health disparities in physical activity and obesity. Pediatrics 2006, 117, 417–424. [Google Scholar] [CrossRef]
- Liu, D.; Kwan, M.P.; Kan, Z. Analysis of urban green space accessibility and distribution inequity in the City of Chicago. Urban For. Urban Green. 2021, 59, 127029. [Google Scholar] [CrossRef]
- Chaudhary, S.; McGregor, A.; Houston, D.; Chettri, N. Environmental justice and ecosystem services: A disaggregated analysis of community access to forest benefits in Nepal. Ecosyst. Serv. 2018, 29, 99–115. [Google Scholar] [CrossRef]
- Hamstead, Z.A.; Fisher, D.; Ilieva, R.T.; Wood, S.A.; McPhearson, T.; Kremer, P. Geolocated social media as a rapid indicator of park visitation and equitable park access. Comput. Environ. Urban Syst. 2018, 72, 38–50. [Google Scholar] [CrossRef]
- Van Cauwenberg, J.; Cerin, E.; Timperio, A.; Salmon, J.; Deforche, B.; Veitch, J. Park proximity, quality and recreational physical activity among mid-older aged adults: Moderating effects of individual factors and area of residence. Int. J. Behav. Nutr. Phys. Act. 2015, 12, 1–8. [Google Scholar] [CrossRef]
- Schipperijn, J.; Cerin, E.; Adams, M.A.; Reis, R.; Smith, G.; Cain, K.; Christiansen, L.B.; van Dyck, D.; Gidlow, C.; Frank, L.D.; et al. Access to parks and physical activity: An eight country comparison. Urban For. Urban Green. 2017, 27, 253–263. [Google Scholar] [CrossRef]
- Xing, L.; Liu, Y.; Liu, X.; Wei, X.; Mao, Y. Spatio-temporal disparity between demand and supply of park green space service in urban area of Wuhan from 2000 to 2014. Habitat Int. 2018, 71, 49–59. [Google Scholar] [CrossRef]
- La Rosa, D.; Takatori, C.; Shimizu, H.; Privitera, R. A planning framework to evaluate demands and preferences by different social groups for accessibility to urban greenspaces. Sustain. Cities Soc. 2018, 36, 346–362. [Google Scholar] [CrossRef]
- Yang, Y.; Lu, Y.; Yang, H.; Yang, L.; Gou, Z. Impact of the quality and quantity of eye-level greenery on park usage. Urban For. Urban Green. 2021, 60, 127061. [Google Scholar] [CrossRef]
- Norton, B.A.; Coutts, A.M.; Livesley, S.J.; Harris, R.J.; Hunter, A.M.; Williams, N.S.G. Planning for cooler cities: A framework to prioritise green infrastructure to mitigate high temperatures in urban landscapes. Landsc. Urban Plan. 2015, 134, 127–138. [Google Scholar] [CrossRef]
- Lobaccaro, G.; Acero, J.A. Comparative analysis of green actions to improve outdoor thermal comfort inside typical urban street canyons. Urban Clim. 2015, 14, 251–267. [Google Scholar] [CrossRef]
- Lai, D.; Liu, W.; Gan, T.; Liu, K.; Chen, Q. A review of mitigating strategies to improve the thermal environment and thermal comfort in urban outdoor spaces. Sci. Total Environ. 2019, 661, 337–353. [Google Scholar] [CrossRef]
- Morakinyo, T.E.; Lam, Y.F. Simulation study on the impact of tree-configuration, planting pattern and wind condition on street-canyon’s micro-climate and thermal comfort. Build. Environ. 2016, 103, 262–275. [Google Scholar] [CrossRef]
- Polat, A.T.; Akay, A. Relationships between the visual preferences of urban recreation area users and various landscape design elements. Urban For. Urban Green. 2015, 14, 573–582. [Google Scholar] [CrossRef]
- Gungor, S.; Polat, A.T. Relationship between visual quality and landscape characteristics in urban parks. J. Environ. Prot. Ecol. 2018, 19, 939–948. [Google Scholar]
- Liu, M.; Nijhuis, S. Mapping landscape spaces: Methods for understanding spatial-visual characteristics in landscape design. Environ. Impact Assess. Rev. 2020, 82, 106376. [Google Scholar] [CrossRef]
- Milburn, L.A.S.; Brown, R.D. The relationship between research and design in landscape architecture. Landsc. Urban Plan. 2003, 64, 47–66. [Google Scholar] [CrossRef]
- Rigolon, A. Parks and young people: An environmental justice study of park proximity, acreage, and quality in Denver, Colorado. Landsc. Urban Plan. 2017, 165, 73–83. [Google Scholar] [CrossRef]
- Lam, K.-C.; Ng, S.-L.; Hui, W.-C.; Chan, P.-K. Environmental Quality Of Urban Parks And Open Spaces In Hong Kong. Environ. Monit. Assess. 2005, 111, 55–73. [Google Scholar] [CrossRef] [PubMed]
- Xu, M.; Xin, J.; Su, S.; Weng, M.; Cai, Z. Social inequalities of park accessibility in Shenzhen, China: The role of park quality, transport modes, and hierarchical socioeconomic characteristics. J. Transp. Geogr. 2017, 62, 38–50. [Google Scholar] [CrossRef]
- McCormack, G.R.; Rock, M.; Toohey, A.M.; Hignell, D. Characteristics of urban parks associated with park use and physical activity: A review of qualitative research. Health Place 2010, 16, 712–726. [Google Scholar] [CrossRef] [PubMed]
- Zhang, R.; Peng, S.; Sun, F.; Deng, L.; Che, Y. Assessing the social equity of urban parks: An improved index integrating multiple quality dimensions and service accessibility. Cities 2022, 129, 103839. [Google Scholar] [CrossRef]
- Bao, Y.; Gao, M.; Luo, D.; Zhou, X. The Influence of Plant Community Characteristics in Urban Parks on the Microclimate. Forests 2022, 13, 1342. [Google Scholar] [CrossRef]
- Kendal, D.; Williams, K.J.H.; Williams, N.S.G. Plant traits link people’s plant preferences to the composition of their gardens. Landsc. Urban Plan. 2012, 105, 34–42. [Google Scholar] [CrossRef]
- Wai, K.; Tan, T.Z.; Morakinyo, T.E.; Chan, T.; Lai, A. Reduced effectiveness of tree planting on micro-climate cooling due to ozone pollution—A modeling study. Sustain. Cities Soc. 2020, 52, 101803. [Google Scholar] [CrossRef]
- Chen, X.; Wu, J. Sustainable landscape architecture: Implications of the Chinese philosophy of “unity of man with nature” and beyond. Landsc. Ecol. 2009, 24, 1015–1026. [Google Scholar] [CrossRef]
- Klemm, W.; Heusinkveld, B.G.; Lenzholzer, S.; van Hove, B. Street greenery and its physical and psychological impact on thermal comfort. Landsc. Urban Plan. 2015, 138, 87–98. [Google Scholar] [CrossRef]
- Kwong, C.; Lam, C.; Weng, J.; Liu, K.; Hang, J. The effects of shading devices on outdoor thermal and visual comfort in Southern China during summer. Build. Environ. 2023, 228, 109743. [Google Scholar]
- Xu, J.; Wei, Q.; Huang, X.; Zhu, X.; Li, G. Evaluation of human thermal comfort near urban waterbody during summer. Build. Environ. 2010, 45, 1072–1080. [Google Scholar] [CrossRef]
- McHarg, I.L. Design with Nature; American Museum of Natural History: New York, NY, USA, 1969; ISBN 0385021429. [Google Scholar]
- Ostojić, R.A.D.J.; Çiğ, A.P.D.A. (Eds.) Sustainable Practices in Horticulture and Landscape Architecture; Iksad: Ankara, Turkey, 2022; ISBN 0854046356. [Google Scholar]
- Zhang, S. Knowledge Mapping Analysis of the Study of Ecosystem Services and Landscape Architecture. J. Urban Plan. Dev. 2022, 148, 1–11. [Google Scholar] [CrossRef]
- Mahmoud, A.H.; Omar, R.H. Planting design for urban parks: Space syntax as a landscape design assessment tool. Front. Archit. Res. 2015, 4, 35–45. [Google Scholar] [CrossRef]
- Alberich, J.; Pérez-Albert, Y.; Morales, J.I.M.; Picón, E.B. Environmental Justice and Urban Parks. A Case Study Applied to Tarragona (Spain). Urban Sci. 2021, 5, 62. [Google Scholar] [CrossRef]
- Zhai, Y.; Baran, P.K. Do configurational attributes matter in context of urban parks? Park pathway configurational attributes and senior walking. Landsc. Urban Plan. 2016, 148, 188–202. [Google Scholar] [CrossRef]
- Jahani, A.; Allahverdi, S.; Saffariha, M.; Alitavoli, A.; Ghiyasi, S. Environmental modeling of landscape aesthetic value in natural urban parks using artificial neural network technique. Model. Earth Syst. Environ. 2022, 8, 163–172. [Google Scholar] [CrossRef]
- Duan, Y.; Wagner, P.; Zhang, R.; Wulff, H.; Brehm, W. Physical activity areas in urban parks and their use by the elderly from two cities in China and Germany. Landsc. Urban Plan. 2018, 178, 261–269. [Google Scholar] [CrossRef]
- Ayala-Azcárraga, C.; Diaz, D.; Zambrano, L. Characteristics of urban parks and their relation to user well-being. Landsc. Urban Plan. 2019, 189, 27–35. [Google Scholar] [CrossRef]
- Milburn, L.S.; Brown, R.D.; Mulley, S.J.; Hilts, S.G. Assessing academic contributions in landscape architecture. Landsc. Urban Plan. 2003, 64, 119–129. [Google Scholar] [CrossRef]
- Milburn, L.A.S.; Brown, R.D. Research productivity and utilization in landscape architecture. Landsc. Urban Plan. 2016, 147, 71–77. [Google Scholar] [CrossRef]
- Gazvoda, D. Characteristics of modern landscape architecture and its education. Landsc. Urban Plan. 2002, 60, 117–133. [Google Scholar] [CrossRef]
- Rodiek, J.E. Landscape planning: Its contributions to the evolution of the profession of landscape architecture. Landsc. Urban Plan. 2006, 76, 291–297. [Google Scholar] [CrossRef]
- Körner, S. Nature conservation, forestry, landscape architecture and historic preservation: Perspectives for a conceptual alliance. In Wild Urban Woodlands: New Perspectives for Urban Forestry; Springer: Berlin/Heidelber, Germany, 2005; pp. 193–220. [Google Scholar]
- Thompson, I.H. Environmental ethics and the development of landscape architectural theory. Landsc. Res. 1998, 23, 175–194. [Google Scholar] [CrossRef]
- Chengdu Statistic Bureau. Chengdu Statistical Yearbook 2020; Chengdu Bureau of Statistics: Chengdu, China, 2020. [Google Scholar]
- Neuman, M. Regional design: Recovering a great landscape architecture and urban planning tradition. Landsc. Urban Plan. 2000, 47, 115–128. [Google Scholar] [CrossRef]
- Kullmann, K. Disciplinary convergence: Landscape architecture and the spatial design disciplines. J. Landsc. Archit. 2016, 11, 30–41. [Google Scholar] [CrossRef]
- Hughey, S.M.; Walsemann, K.M.; Child, S.; Powers, A.; Reed, J.A.; Kaczynski, A.T. Using an environmental justice approach to examine the relationships between park availability and quality indicators, neighborhood disadvantage, and racial/ethnic composition. Landsc. Urban Plan. 2016, 148, 159–169. [Google Scholar] [CrossRef]
- Srdjevic, B.; Srdjevic, Z.; Reynolds, K.M.; Lakicevic, M.; Zdero, S. Using Analytic Hierarchy Process and Best–Worst Method in Group Evaluation of Urban Park Quality. Forests 2022, 13, 290. [Google Scholar] [CrossRef]
- Politi Bertoncini, A.; Machon, N.; Pavoine, S.; Muratet, A. Local gardening practices shape urban lawn floristic communities. Landsc. Urban Plan. 2012, 105, 53–61. [Google Scholar] [CrossRef]
- Xiao, Y.; Wang, Z.; Li, Z.; Tang, Z. An assessment of urban park access in Shanghai—Implications for the social equity in urban China. Landsc. Urban Plan. 2017, 157, 383–393. [Google Scholar] [CrossRef]
- Blue, B.; Index, G. Evaluating Neighborhood Green-Space Quality Using a Building Blue–Green Index (BBGI) in Nanjing, China. Land 2022, 11, 445. [Google Scholar]
- Tan, P.Y.; Samsudin, R. Effects of spatial scale on assessment of spatial equity of urban park provision. Landsc. Urban Plan. 2017, 158, 139–154. [Google Scholar] [CrossRef]
- Rigolon, A. A complex landscape of inequity in access to urban parks: A literature review. Landsc. Urban Plan. 2016, 153, 160–169. [Google Scholar] [CrossRef]
- Clemente, P.; Calvache, M.; Antunes, P.; Santos, R.; Orestes, J.; João, M. Combining social media photographs and species distribution models to map cultural ecosystem services: The case of a Natural Park in Portugal. Ecol. Indic. 2019, 96, 59–68. [Google Scholar] [CrossRef]
- Wood, S.A.; Guerry, A.D.; Silver, J.M.; Lacayo, M. Using social media to quantify nature-based tourism and recreation. Sci. Rep. 2013, 3, 2976. [Google Scholar] [CrossRef]
- Depietri, Y.; Kallis, G.; Baró, F.; Cattaneo, C. The urban political ecology of ecosystem services: The case of Barcelona. Ecol. Econ. 2016, 125, 83–100. [Google Scholar] [CrossRef]
- Veitch, J.; Ball, K.; Crawford, D.; Abbott, G.R.; Salmon, J. Park improvements and park activity: A natural experiment. Am. J. Prev. Med. 2012, 42, 616–619. [Google Scholar] [CrossRef]
- Lu, S.; Wu, F.; Wang, Z.; Cui, Y.; Chen, C.; Wei, Y. Evaluation system and application of plants in healing landscape for the elderly. Urban For. Urban Green. 2021, 58, 126969. [Google Scholar] [CrossRef]
- Akpınar, A. Green exercise: How are characteristics of urban green spaces associated with adolescents’ physical activity and health? Int. J. Environ. Res. Public Health 2019, 16, 4281. [Google Scholar] [CrossRef]
Figure 1.
The location of the study area and the spatial distribution of urban parks.

Figure 2.
The average points of urban parks in five districts.

Figure 3.
The spatial distribution of the scores of park quality.

Figure 4.
The proportion of existing quality elements (27 indicators) in various parks of each district and in 100 parks.
Figure 4.
The proportion of existing quality elements (27 indicators) in various parks of each district and in 100 parks.

Figure 5.
The spatial areas based on multi-quality parks.


Table 1.
Assessment index of multi-quality of urban parks.
| Index | Explanation and Examples | Weight | Method |
|---|---|---|---|
| Planning and design (PD) | |||
| Concept | It is an original and typical concept. | 3 | M4 |
| Planning and layout | Scientific and reasonable spatial layout planning. | 2 | M4 |
| Functional diversity | All age friendly. Diverse functions and rich content settings. | 1 | M1 |
| Traffic organization | Reasonable tour route and classification. Accessibility. | 1 | M3 and M4 |
| Use the terrain wisely, e.g., meet the drainage and rainwater collection requirements. | 1 | M4 | |
| Adjust measures to local conditions | E.g., terrain combined with green space to create a diversified landscape. | 2 | M4 |
| Water features | Maintain reasonable water levels, and make sustainable use of water resources. | 2 | M2 |
| Cultural services (CS) | |||
| Artistic value | Integrate public art into the urban park, e.g., sculpture and land art. | 2 | M2 |
| Aesthetic value | Attractive landscape features and views. | 3 | M4 |
| Historical and cultural value | It has profound cultural connotations, historical values, and cultural landscape displays. | 3 | M4 |
| Scientific and educational value | It has important research, science popularization, and environmental education value in the aspects of natural heritage, animal and plant resources, etc. | 3 | M4 |
| Complete and various facilities (CVF) | |||
| Basic facilities | The water, electricity, gas, and monitoring systems are complete and running well. | 2 | M1 |
| Architectures and buildings | Buildings with high artistic construction techniques and historical value. | 2 | M1 |
| A variety of functional buildings in harmony with the surrounding environment. | 2 | M1 | |
| Guided tour facilities | It has a guide sign system with comprehensive and accurate tour information. | 2 | M2 |
| Leisure and recreation facilities | Provide daily or periodic recreation activities for people, e.g., cafes and chess rooms. | 3 | M1 |
| Facilities for convenience | Equipped with fixed convenience service points and daily convenience facilities, e.g., drinking water, public seats, toilets, shops, and parking lots. | 3 | M1 |
| Sports and fitness facilities | Provide facilities for different people to exercise, e.g., tennis courts, swimming pools, basketball play courts, etc. | 3 | M1 |
| Accessible facilities | There is barrier-free access and signage at the main entrance and exit, and the toilets are equipped with barrier-free toilets. | 1 | M2 |
| Landscape planting (LP) | |||
| Rational plant allocation | The trees and shrubs are dense and have distinct layers, and the canopy line and the forest edge line are beautiful. | 3 | M4 |
| Regional characteristics | Mainly native tree species. | 2 | M1 |
| Vegetation coverage | Plants (including lawns) grow lush, and the vegetation coverage rate of the park is ≥80%. | 4 | M3 |
| Old trees and famous wood species | There are positive protection measures, and the protection rate reaches 100%. | 2 | M4 |
| Landscape management (LM) | |||
| Plant maintenance and management | The plants in the garden are kept in the best condition, and there is no random cutting or naked phenomenon. | 3 | M4 |
| Environmental hygiene | The facilities (i.e., ground, toilets, walls, etc.) are clean, tidy, and without odor. | 2 | M4 |
| Water quality | Water security for human, flora, and fauna. | 2 | M3 |
| Intelligent facilities | Intelligent management system. A certain number of intelligent facilities. | 1 | M1 |
| Landscape ecology (LE) | |||
| Low carbon and environmental protection | E.g., effective use of green lighting and clean energy. | 1 | M1 |
| The application of sponge city (e.g., roads, parking lots, permeable paving), and low carbon environmental protection measures of resource recycling. | 2 | M1 | |
| Biodiversity | Plant and animal diversity, including the invasive species. | 2 | M2 and M4 |
Table 2.
The general information of urban parks in the five districts of Chengdu.
| Districts | Comprehensive Parks | Community Parks | Special Parks | No. (Total) | Area (ha) | Quality Score (Mean) |
|---|---|---|---|---|---|---|
| Jinniu | 7 | 10 | 10 | 27 | 904.09 | 31.22 |
| Wuhou | 4 | 7 | 3 | 14 | 204.58 | 25.54 |
| Qingyang | 5 | 5 | 5 | 15 | 288.04 | 37.53 |
| Chenghua | 14 | 9 | 7 | 30 | 395.48 | 35.22 |
| Jinjiang | 7 | 6 | 1 | 14 | 218.6 | 38.07 |
Table 3.
Statistics of urban parks with different sizes.
| No. | Score (Mean) | PD (Mean) | CS (Mean) | CVF (Mean) | LP (Mean) | LM (Mean) | LE (Mean) | |
|---|---|---|---|---|---|---|---|---|
| Small parks (<5 ha) | 30 | 28.13 | 5.53 | 3.45 | 8.8 | 6.39 | 3.25 | 0.72 |
| Medium parks (5–10 ha) | 24 | 34.85 | 6.71 | 5.44 | 9.79 | 6.77 | 4.65 | 1.65 |
| Large parks (>10 ha) | 23 | 36.36 | 7.09 | 5.30 | 10.90 | 6.91 | 4.75 | 1.32 |
Notes: The total score of the assessment system is 65, and the scores of six dimensions are 12 (PD), 11 (CS), 18 (CVF), 11 (LP), 8 (LM), and 5 (LE), respectively.
Disclaimer/Publisher’s Note: The statements, opinions and data contained in all publications are solely those of the individual author(s) and contributor(s) and not of MDPI and/or the editor(s). MDPI and/or the editor(s) disclaim responsibility for any injury to people or property resulting from any ideas, methods, instructions or products referred to in the content. |
© 2024 by the authors. Licensee MDPI, Basel, Switzerland. This article is an open access article distributed under the terms and conditions of the Creative Commons Attribution (CC BY) license (https://creativecommons.org/licenses/by/4.0/).
Share and Cite
MDPI and ACS Style
Zhang, S.; Song, H.; Li, X.; Luo, S. Urban Parks Quality Assessment Using Multi-Dimension Indicators in Chengdu, China. Land 2024, 13, 86. https://0-doi-org.brum.beds.ac.uk/10.3390/land13010086
AMA Style
Zhang S, Song H, Li X, Luo S. Urban Parks Quality Assessment Using Multi-Dimension Indicators in Chengdu, China. Land. 2024; 13(1):86. https://0-doi-org.brum.beds.ac.uk/10.3390/land13010086
Chicago/Turabian StyleZhang, Sining, Haoxiang Song, Xiaopeng Li, and Shixian Luo. 2024. "Urban Parks Quality Assessment Using Multi-Dimension Indicators in Chengdu, China" Land 13, no. 1: 86. https://0-doi-org.brum.beds.ac.uk/10.3390/land13010086
Note that from the first issue of 2016, this journal uses article numbers instead of page numbers. See further details here.