
An Interpretation of Landscape Preferences Based on Geographic and Social Media Data to Understand Different Cultural Ecosystem Services


School of Landscape Architecture, Beijing Forestry University, Beijing 100083, China
*
Author to whom correspondence should be addressed.
Land 2024, 13(2), 125; https://0-doi-org.brum.beds.ac.uk/10.3390/land13020125
Submission received: 9 November 2023
/
Revised: 17 January 2024
/
Accepted: 18 January 2024
/
Published: 23 January 2024
(This article belongs to the Special Issue Ecosystem Services Design from Single Space Solution to Landscape Vision)
Abstract
:A crucial component of ecosystem services (ES) that represents social and humanities values is the cultural ecosystem service (CES), which refers to the non-material advantages that the environment provides for humans. CES are challenging to deeply understand, and little is known about the interactions between CES and landscape variables, particularly in some remote Chinese cities. In order to assess the dominant landscape variables of different CESs from physical, experiential, intellectual and inspirational aspects, this article investigates the landscape variables that may influence the public preferences of various CESs based on social media and geographic data in Anshun, China. The findings are displayed below. The public preferences of various CESs are impacted by the landscape variables in different ways. Physical CESs are influenced by both natural and infrastructure elements, demonstrating that accessibility to restaurants, accommodation, and transit affects how people interact with plays in public. Experiential CESs are primarily influenced by sensory elements, particularly the visual senses, suggesting that when people visit such settings, they place more emphasis on sensory experiences. Intellectual CESs are mostly affected by sensory and natural elements, implying that intellectual CESs with a natural perception are more alluring to tourists. Inspirational CESs are mainly influenced by natural and infrastructure elements, people usually consider nature and convenience when they go to such scenic spots. From the standpoint of promoting people’s wellbeing and boosting tourism appeal, the study’s results can offer fresh perspectives and content additions for the tourism landscape planning and management in Anshun.
1. Introduction
With the advancement of urbanization and the improvement of people’s living standards, society’s requirements are gradually shifting from material requirements to non-material requirements, such as the pursuit of spiritual delight and the desire to be close to nature [1,2]. This shift is motivating an increasing number of individuals to travel to see nature up close and cherish the landscape’s intangible benefits. Governments and society are therefore paying more attention to the inclusion of cultural ecosystem services (CES), which represent the intangible advantages of ecosystem services (ES), as a reference indicator for ecosystem valuation [3]. To inform the next stage of landscape planning and policy making, it is essential to establish communication between CES and landscape variables in order to collect scientifically sound information.
Culture Ecosystem Services (CES) refer to the non-material benefits that humans derive from ecosystems, providing them with services that include spiritual, aesthetic, educational and recreational dimensions [4]. CES is of great importance to promoting the harmonious development of man and nature and enhancing the well-being of mankind [5,6,7]. Previous research related to ecosystem services has focused on the ecological aspects of biophysical research and economic valuation [8,9]. Little is known about CES and there has been a failure to develop a unified system for understanding CES [10,11]. Moreover, the effective integration of CES into practical landscape planning and policy development to enhance the value of the non-material aspects of landscape services has been hampered by lack of information on how landscape variables affect CES, especially some sensory categories [12]. The quantification of landscape variables is often used as an important way to study the spatial distribution of CESs [13]. It has been repeatedly demonstrated in past studies that natural and infrastructural elements are fundamental landscape variables that primarily influence the spatial and temporal distribution of CESs [14]. However, other sensory experiences of sound, odour and landscape perception have not been included in many studies, possibly due to difficulties in obtaining and quantifying data, which should be addressed in future research.
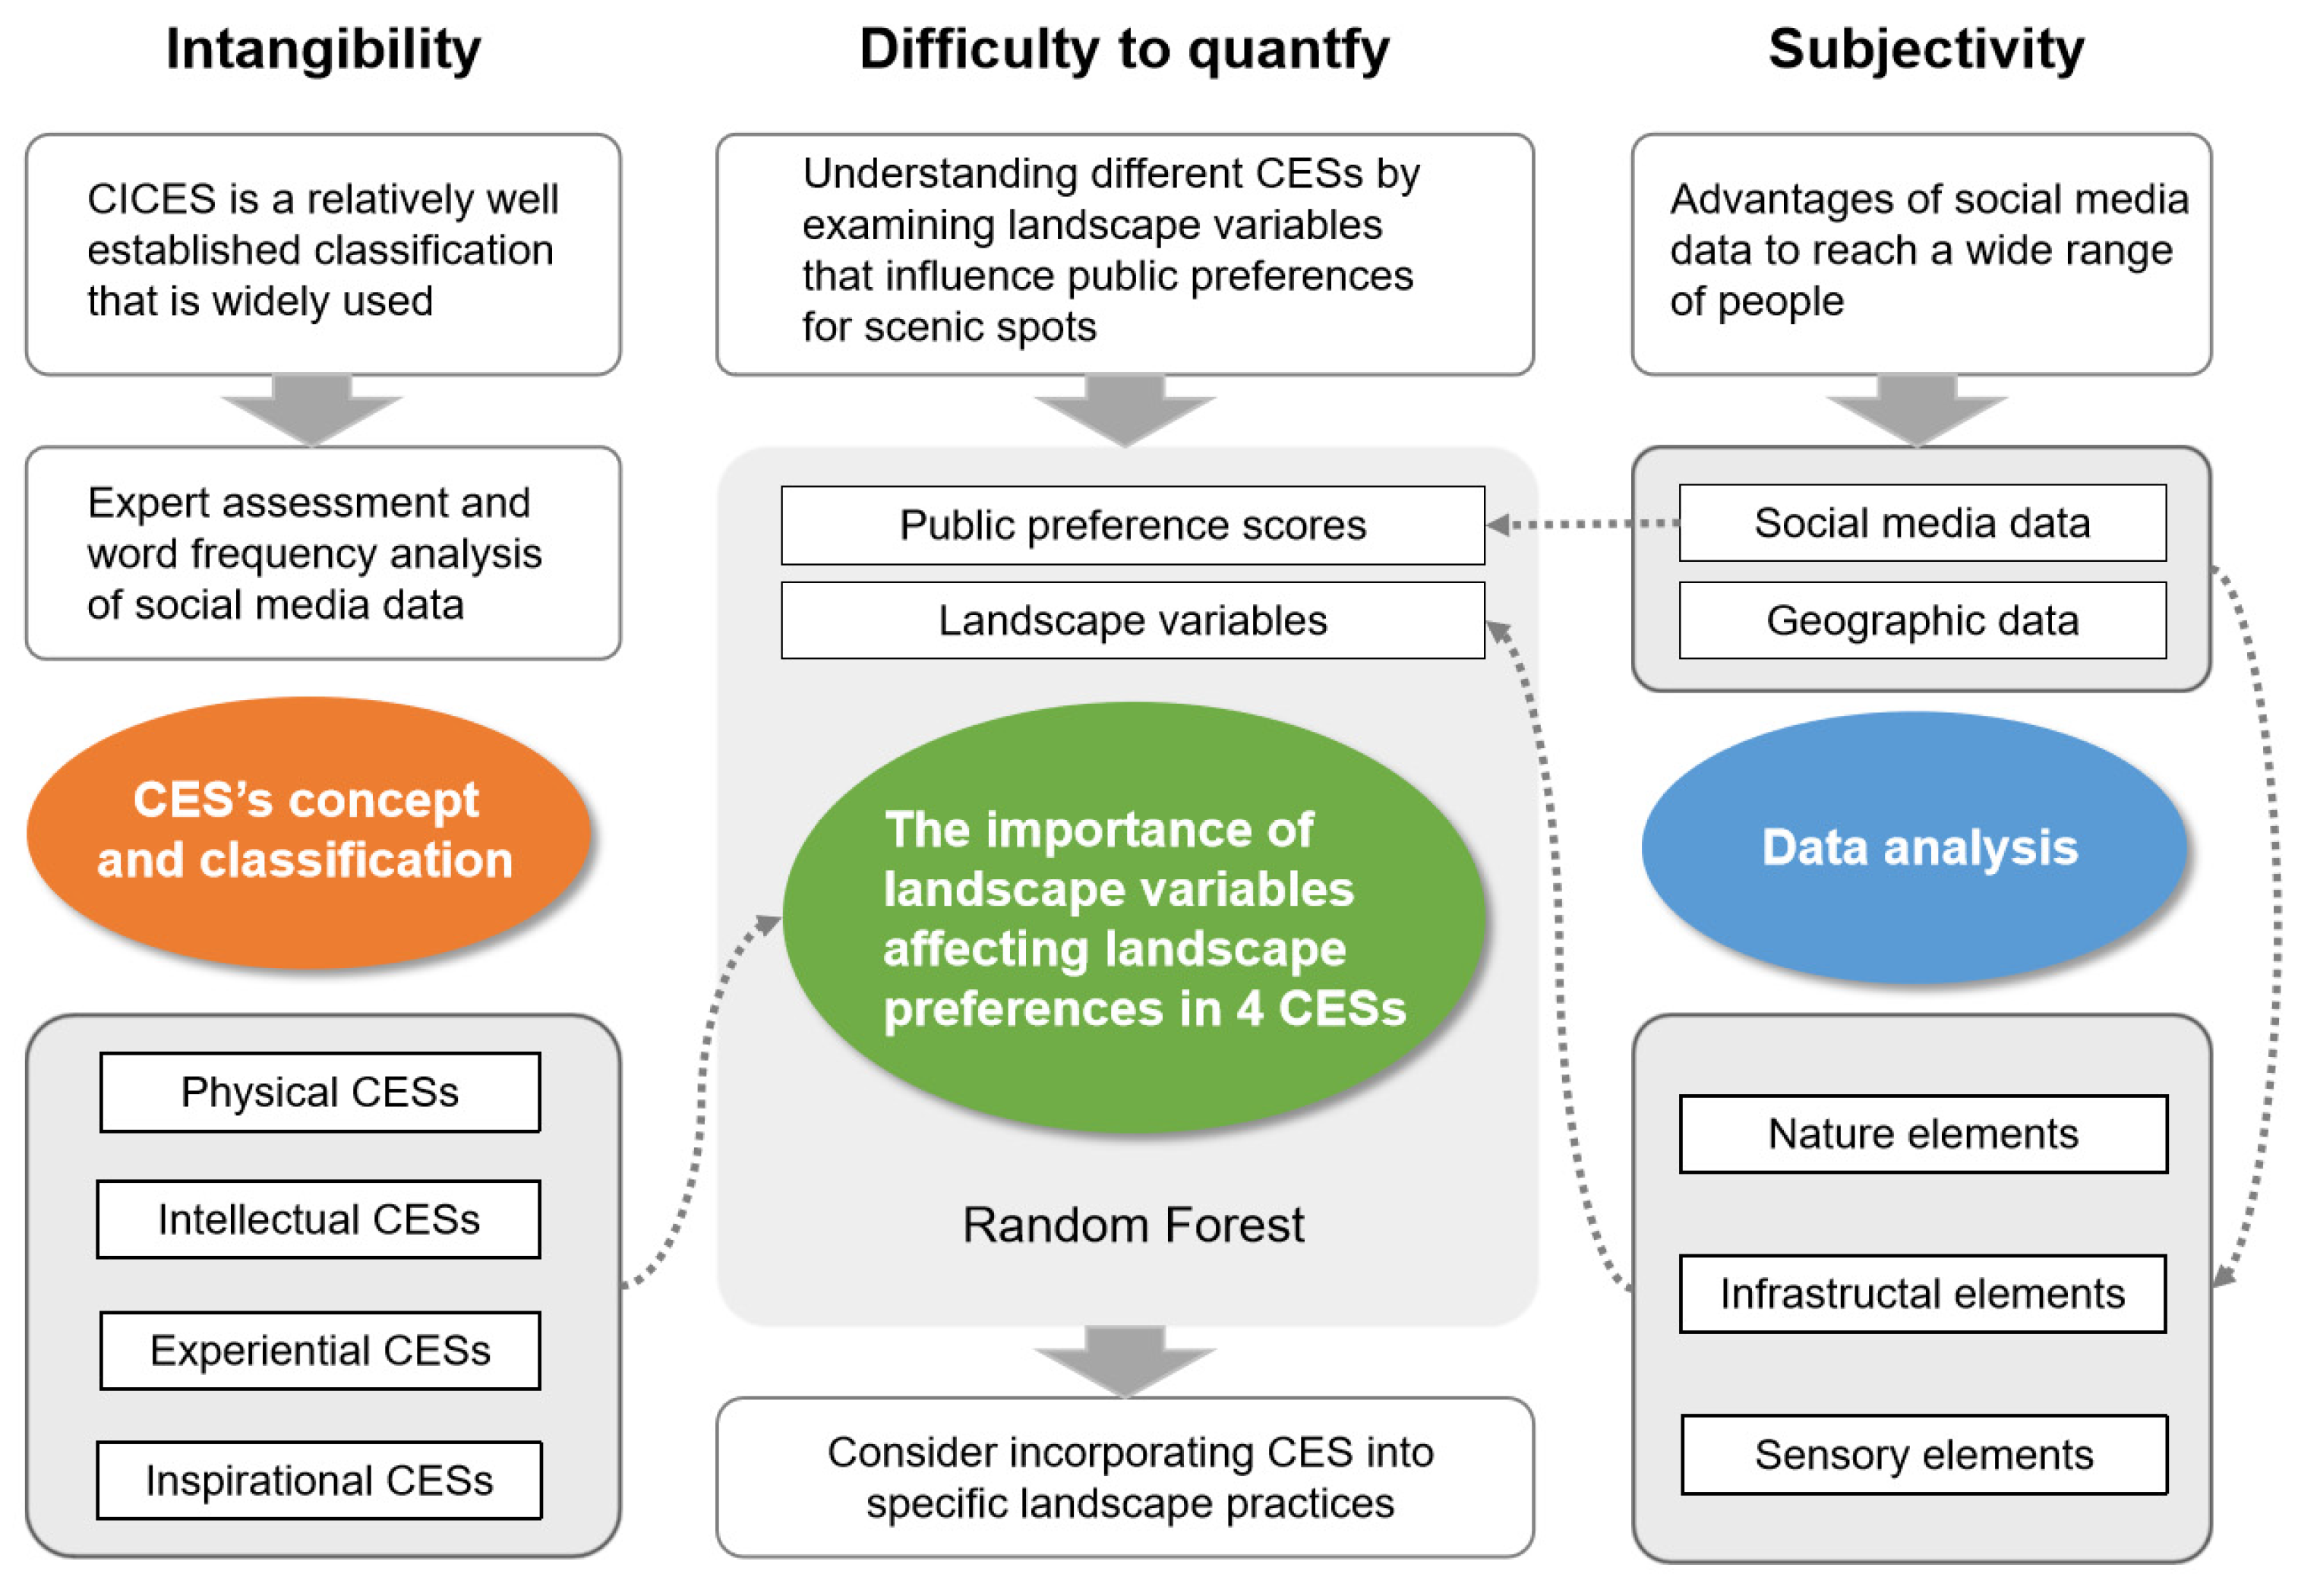
CES is intangible, subjective and difficult to quantify; most studies on CES are mainly based on indirect evaluation methods such as qualitative description, monetised value assessment and non-monetised quantitative assessment [15]. Firstly, CES was described qualitatively using participatory mapping methods [3], smartphone location data [16], social media image data [17], and by asking for expertise or opinions [18]. Qualitative description methods are more detailed and incorporate the actual needs of different populations, but the credibility of the results may be questionable. Secondly, the monetised value of the CES is assessed by evaluating the economic value [19,20,21]. Monetary value data is widely available and easily quantifiable, but the method makes it difficult to capture the value of CES in terms of social relations, sense of place, access to inspiration, etc., through economic or monetary values [22,23]. Finally, the quantitative non-monetary assessment of CES is carried out using interviews [24], questionnaires [25] and indicator systems [26]. However, these assessment methods are often subject to semantic processing and conversion of questionnaire questions, which limit their applicability and lead to many uncertainties in practice [27].
In recent years, social media data have emerged as a new method for understanding CES due to their large data sample and the large range of people it can reach in recent years [17]. The geographic location, image content, text tags and keywords contained in social media data provide a wealth of data on the spatial distribution of human environmental activities for relevant research [17,28]. It resolved the research difficulties of intangibility and subjectivity. Many researchers have also tried to mine image information using deep learning models to indirectly predict the classification of CES from the classification results of image content [29,30]. Nevertheless, there are some drawbacks and controversies with using this approach, such as the complex composition of social users of social media and the fact that people in different regions have different preferences for the use of social platforms [31]. At the same time, a growing number of researchers believe that social media is likely to be increasingly valuable for research and management of nature-based tourism [32]. Therefore, social media data are suitable for this research to investigate how the landscape variables of the tourism landscape in Anshun area affect different CES.
To explore how landscape variables affect different CESs, an indicator that evaluates the results of that effect is also needed—landscape preferences. Landscapes are areas perceived by people, and the central component of landscape value is based on human perception [33]. Landscape preference usually reflects society’s perceived preference for a particular landscape and is the result of a combination of perceptual activities, such as the public’s emotional perception when confronted with the landscape [32]. Based on the attention restoration theory (ART) [34], different people perceive the same landscape differently, so landscape preferences are influenced by personal interests, differences in social and cultural backgrounds, and educational attainment [35]. Currently, some Chinese social media platforms, such as Ctrip, Tuniu and Where to go, can provide a large amount of data on tourists’ reviews and ratings of landscape preferences [33], including their comments on the features, advantages and disadvantages of the attractions, as well as their subjective feelings (e.g., service quality, comfort, environmental quality, etc.), which can provide valuable data for assessing the public’s landscape preferences. It can be a promising idea to understand CES by examining the public preferences using social media [36] and the landscape variables that influence them to each CES [37].
In this article, the tourism landscape of Anshun City is used as the research object, and this article primarily uses geographic and social media data to obtain the basic data. It classifies the landscape into different CESs based on comments made on social media, conducts regression analysis on the landscape variables (nature, infrastructure, sensory) that may influence the public preferences of CESs. Based on this, corresponding landscape planning recommendations are made for each type of CESs (physical, experiential, intellectual, inspirational) to guide landscape practices, strengthen the cultural service provision of ecosystems, enhance local tourism attractiveness and enhance people’s well-being.
The aim of this study is to assess the dominant landscape variables of different CESs from physical, experiential, intellectual and inspirational aspects. This article focuses on the following two issues: (i) What are the main landscape variables that influence the public’s landscape preferences in Anshun? (ii) Are there differences in the main landscape variables affecting the landscape preferences of different CESs? If differences exist, what are the main landscape variables that influence the landscape preferences of different CESs?
It is possible to gain an understanding of CES and contribute to incorporating CES as an important indicator in landscape planning and policy making to better meet the public’s expectations by studying their preferences and the significant landscape variables, thereby exploring the various non-material benefits that different CESs provide to the public. The study is of great significance to the development of tourism in remote areas of China, which helps to clarify the future development direction of local tourist landscapes. The results and data of the study can help urban planners and managers to carry out landscape planning and practical policies in the Anshun area, in order to effectively improve tourists’ satisfaction, and the well-being of local residents.
2. Materials and Methods
2.1. Study Area
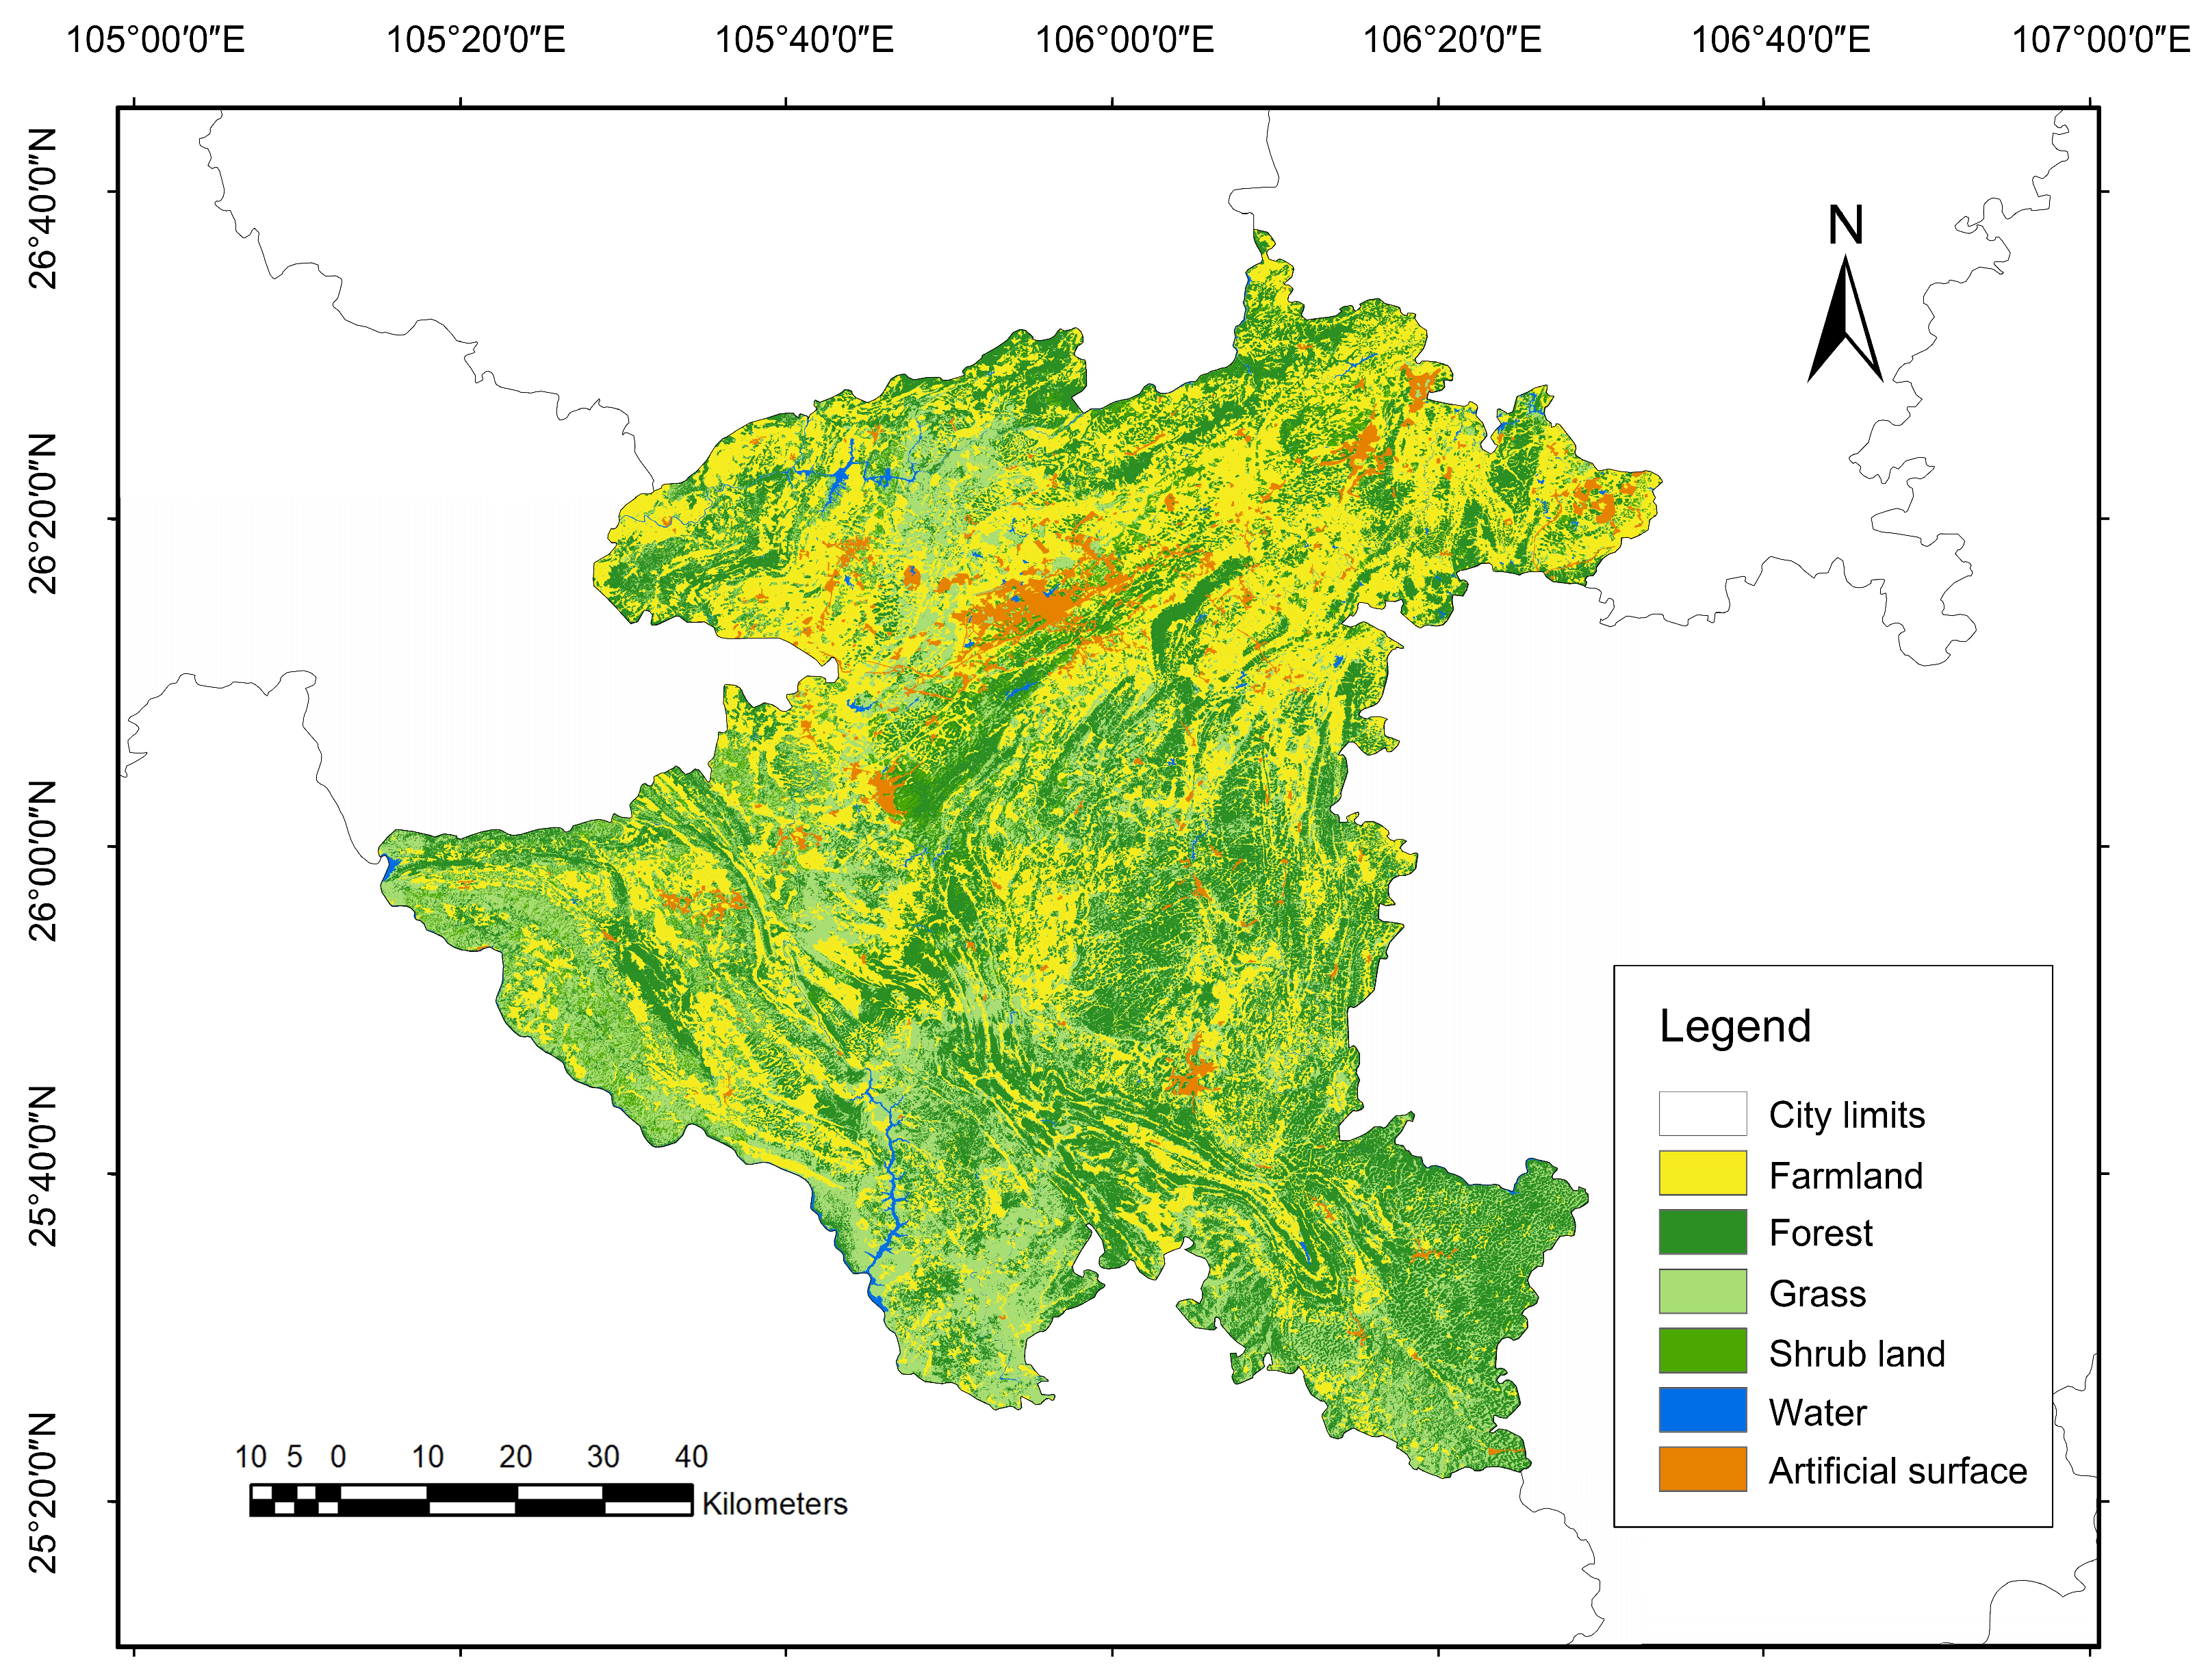
Anshun, located in the mid-western part of Guizhou Province in southwestern China, is situated between 105°13′~106°34′ E and 25°21′~26°38′ N (Figure 1). It is an important watershed area between the Wujiang River Basin of the Yangtze River system and the Beipanjiang River Basin of the Pearl River system, with a total area of 9267 square kilometres and a total population of 3 million people. Anshun is part of the Qianzhong hill plain basin in the western plateau mountain region of Guizhou. The topography of the city is complex and varied, mainly dominated by karst landforms, accounting for 77.82%, which is a typical karst landform concentration distribution area in the world. Anshun belongs to the western part of the subtropical humid monsoon climate zone, there are often valley winds and summer winds in the territory, and there are many clouds and rain, cool, humid, low solar radiation, and the air quality is excellent at 99.8% all year round. The city’s tourism resources account for 12% of the city’s total area, much higher than the national average of 1% and Guizhou Province’s 4.2% and is the earliest identified Class A tourism open city in China. Anshun is also a famous historical and cultural city in Guizhou, with unique historical and cultural heritage such as Tunbao, pierced cave and Yelang cultures. In recent years, to cope with the increased development of tourism, Anshun has made great efforts to improve infrastructure construction, with the Shanghai-Kunming Expressway running across the east and west, the Guiyang-Kunming Railway crossing the whole territory, and the Shanghai-Kunming High-speed Railway already having several stations in Anshun.
Anshun has good natural conditions, a variety of beautiful landscape types, a rich historical and cultural heritage, and its infrastructure that is gradually being improved. However, because of the area’s relatively slow economic development, the local investment in tourism development is sporadic and ungoverned, the attractions’ attractiveness is insufficient, the region’s tourism resources have not been used to their full potential, and the tourism industry has not developed as expected. Due to the wide-ranging practical implications for Anshun, this study investigates the cultural ecological services provided by the local tourism landscape in order to guide planning and actual policy formulation for the tourism landscape in the region, improve the cultural service supply of the local landscape, increase the local tourism attractiveness, and enhance the positive growth of the local tourism economy.
2.2. Research Frame
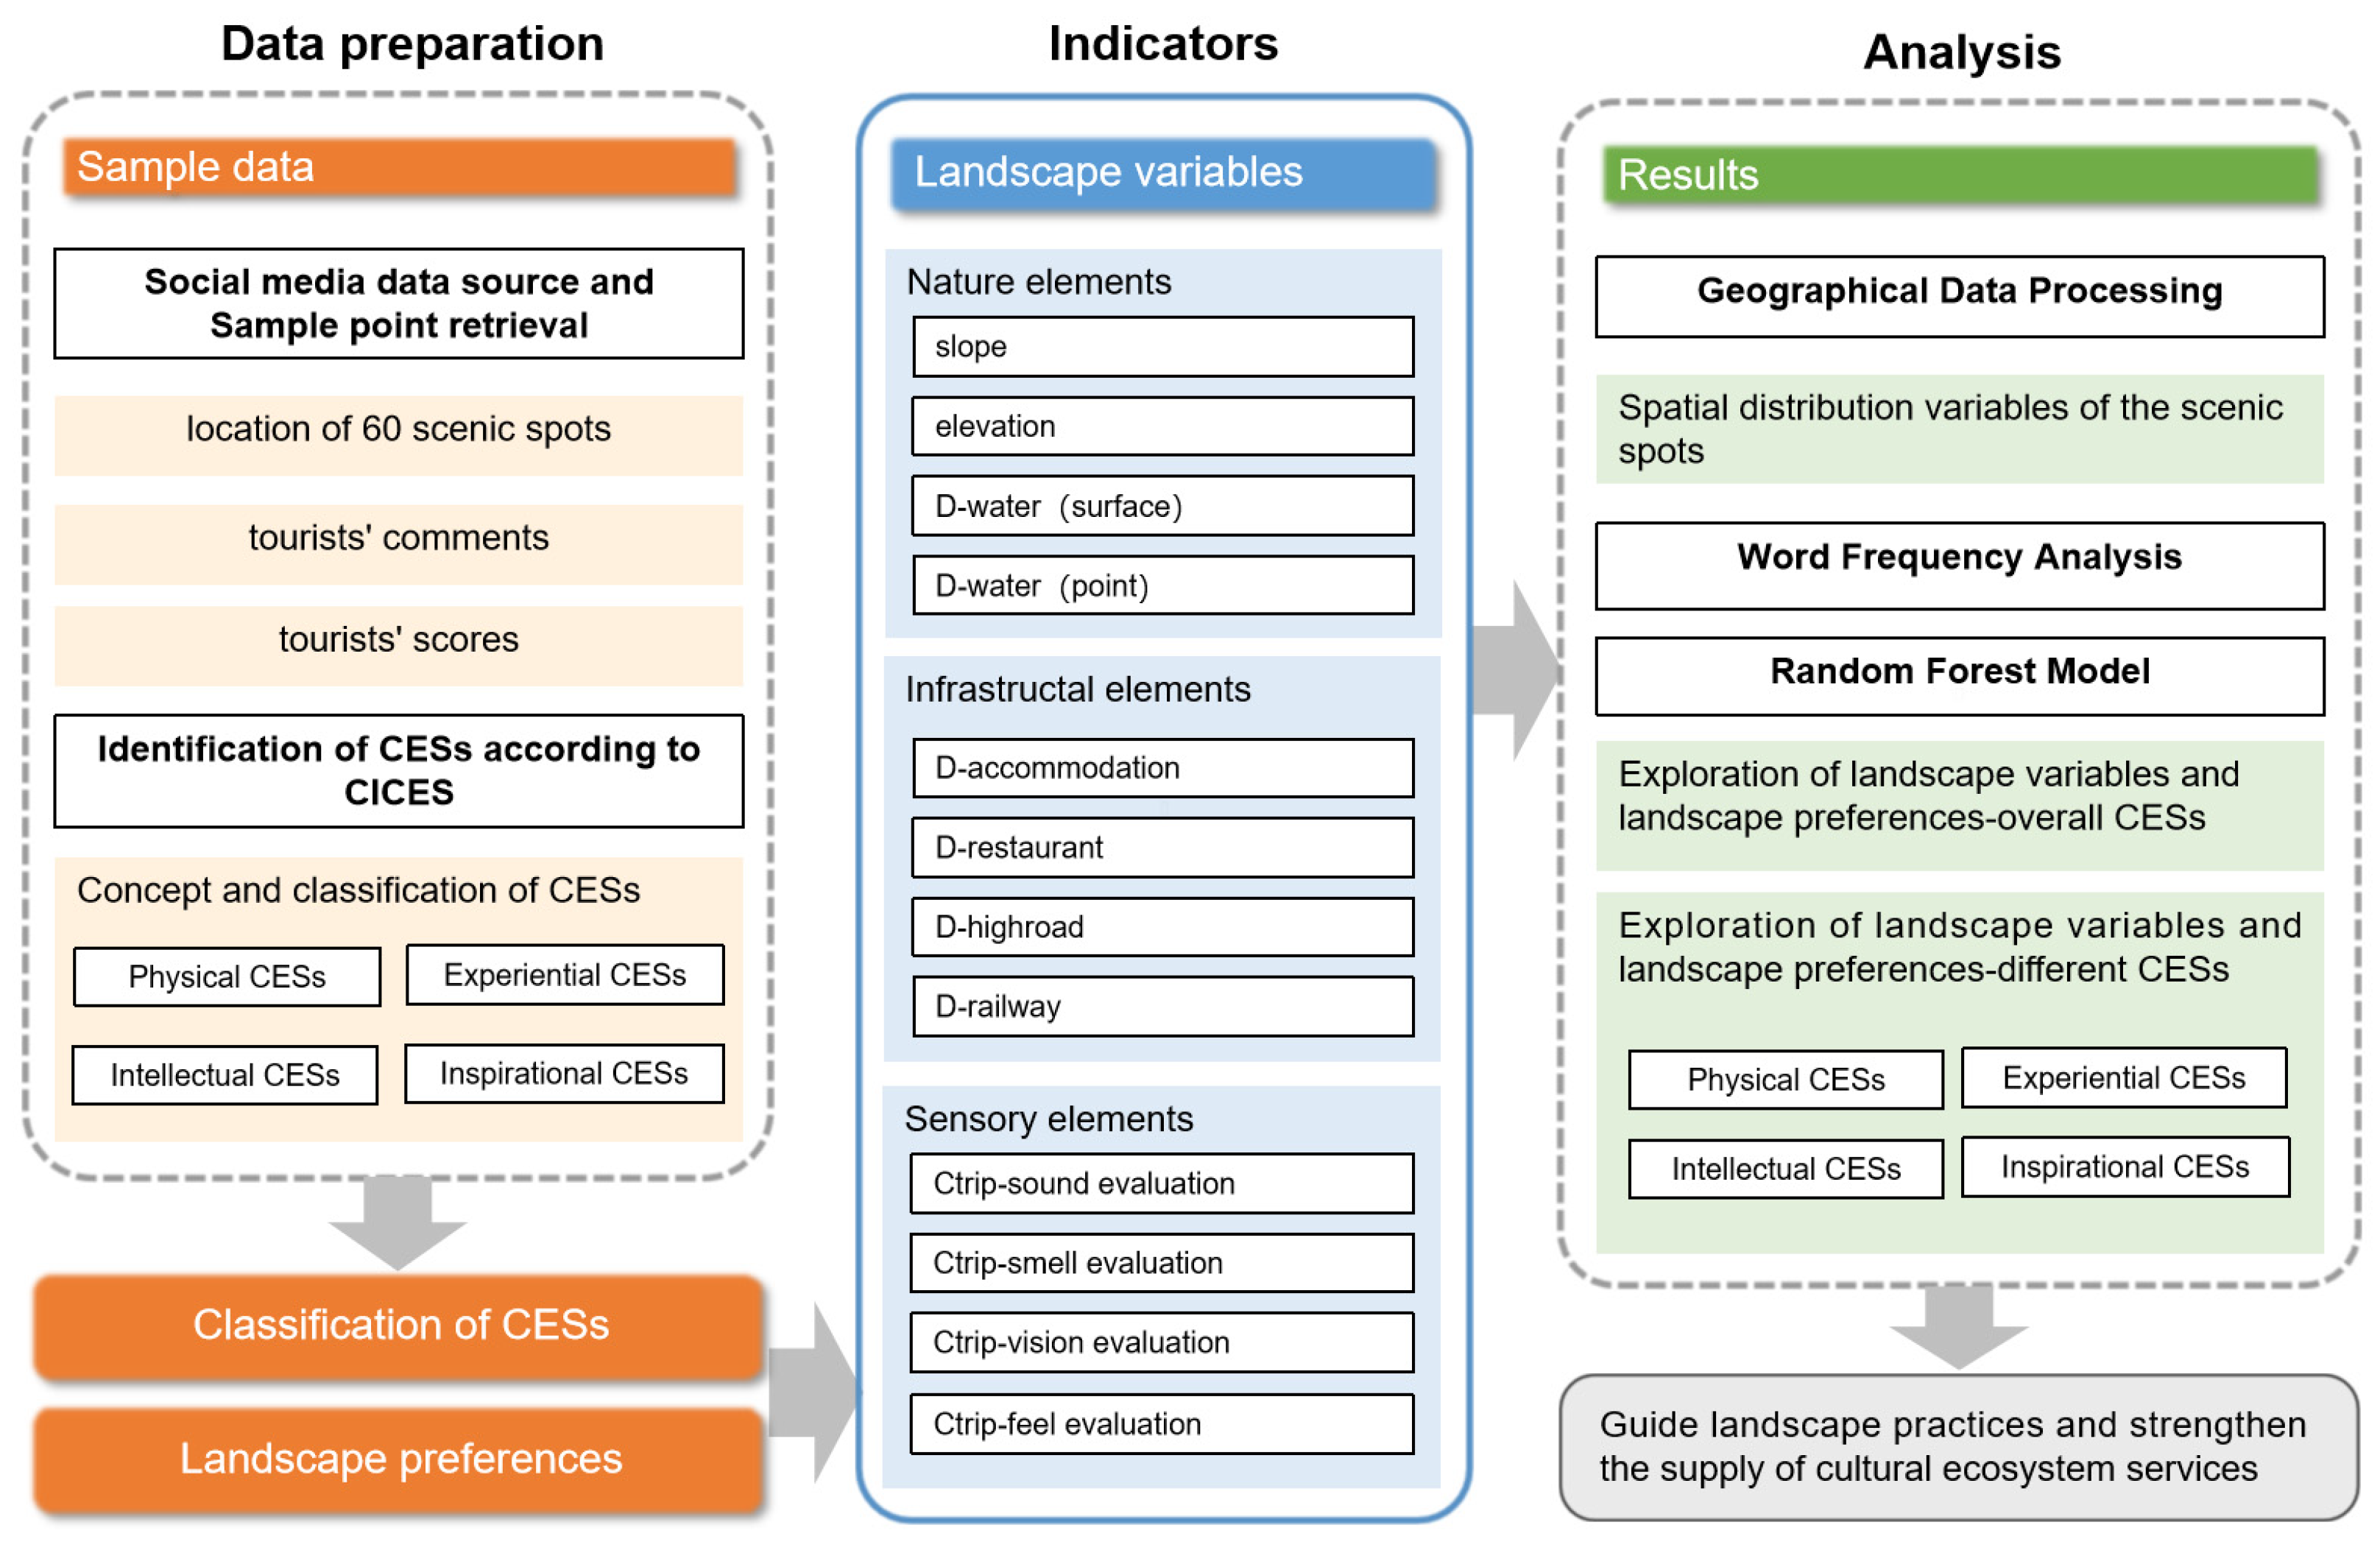
We investigate the dominant landscape variables that affect the landscape preferences of various CESs in Anshun using data from social media and geographic information. Based on the findings of the data analysis, we gain understanding of the landscape service values of various CESs (Figure 2 and Figure 3).
The research methodology’s specifics are as follows:
- Crawl social media data on all scenic spots in Anshun from Ctrip (https://you.ctrip.com/place/anshun518.html (accessed on February 2023), excluding those with less than 10 reviews), including: names of scenic spots, tourist comments, and tourist ratings, excluding invalid data and integrating valid data.
- Identify the text of tourist comments and classify the subword.
- Analyse the word frequency of subword.
- Based on the word frequency, experts were consulted to categorize all scenic spots into four different CESs (physical, experiential, intellectual, and inspirational) in accordance with the International Classification of Ecosystem Services (CICES).
- Obtain the DEM and geographic information data on land cover, landform types, road networks, hydrology and POI, etc.
- Process the geographic data in ArcGIS (the spatial resolution of these data is 12.5 m).
- Determine the landscape variables from the natural, infrastructural and sensory perspectives.
- Integrate the data obtained above on tourist ratings and landscape variables, random forest regression was conducted to obtain the ranking of importance of landscape variables affecting public preference for all CESs.
- The same random forest regression was used to regress the data for different CESs separately to obtain the ranking of importance of landscape variables affecting public preference for different CESs.
Specifically, the study period lasts from June 2022 to July 2023, and the date of crawling data is February 2023.
2.3. Social Media Data Source
2.3.1. Sample Point Retrieval
Ctrip is an important travel service app in China, offering a variety of services including tickets, accommodation and transportation, and its market size is one of the largest in China, and it has a sizable following. The sample data obtained from Ctrip is more representative due to its efficient services, authentic data and diverse products [38]. Ctrip includes basic information on most tourism products and their usage and evaluation data, including tourist ratings, reviews, number of comments, peak seasons and ticket prices for each attraction. These data can objectively reflect tourist preferences and behaviour [12], making it a reliable source of data for researching tourist attractions in China.
This study mainly used the Internet data collection software “Octopus Collector” (https://www.bazhuayu.com/) to obtain basic data from the Ctrip website. The sampling point retrieval process consisted of the following steps: cleaning the data and coordinating the conversion of the collected data; capturing the names of scenic spots, tourist comments, and tourist ratings in Anshun (Figure 4), excluding those with less than 10 reviews. Random and automatically generated comments have also been removed to ensure that the remaining comments are representative. Finally, sixty representative scenic spots were selected from all the attractions in Anshun City to be included in the analysis (Figure 5).
Among them, tourist’s comments can reflect the subjective feelings of tourists, which are the source of data on the characteristics of the sensory category landscape and the main basis for the CES classification. Tourist’s ratings represent the public’s preference for the attraction, and tourist’s ratings of the scenic spots on Ctrip are the comprehensive assessment result made by a large number of tourists who actually arrive and visit the attraction, and this score result can reflect to a certain extent the public’s actual preference for the landscape.
2.3.2. Word Frequency Analysis
Using the word separation and classification search platform in the web data crawling tool “Jisouke”, the comments of tourists on Ctrip were divided into phrases, and the key words of the comments were extracted through various filtering conditions such as word nature, word frequency and filtering, and repetitive words such as onomatopoeia were excluded to determine the effective word separation of the comments. In this study, the extracted words were divided into four categories (biological and natural landscape elements, cultural landscape elements, perceptual elements and human elements) and 20 sub-categories (Table 1).
The results of the word frequency analysis are an important basis for experts to classify CES and assess landscape variables.
2.4. Classification of CESs
CES provide social values to humans indirectly through subjective human intentions and feelings, such as aesthetics, spiritual healing, research and education, etc., and can be an important representation of the interaction between ecosystem services and human well-being. There are many proposals for the classification of CES in the academic community, including the Millennium Ecosystem Assessment [4], the Economics of Ecosystems and Biodiversity [39], the International Common Classification of Ecosystem Services (CICES) used by the EU initiative [39,40], the Nature’s Contribution to People system used by the Intergovernmental Panel on Biodiversity and Ecosystem Services (IPBES) [41], and the classification system for final ecosystem goods and services (FEGS) proposed by the United States Environmental Protection Agency (USEPA) [42], etc. All of these classifications are intended to be general in nature, but they all derive from a specific context. Of these, CICES is widely used in the classification of ecosystem services (ES), particularly CES, which provides a relatively high level of detail in a nested hierarchy of ‘taxonomic levels,’ providing an appropriate structure for the assessment of ES [43], so CICES was chosen as the criterion for the CES classification in this study. According to the CICES definition of the CES classification, all CES were classified into four categories: physical, experiential, intellectual, and inspirational [44].
Previous research has found that the terms associated with landscape variables are similar within the same landscape type, so the public’s comments can effectively distinguish between landscape types [24]. Thus, three professionals were invited to discriminate the lexical meaning of the 11,816 sub-words originating from the comments of the 60 scenic spots according to the CICES definition of CES classification, where sub-words related to CES were evaluated twice to represent different CES characteristics (Table 2), and finally the results of the word frequency analysis (Table 1) were combined to classify all attractions into four categories: physical, experiential, intellectual, and inspirational [45].
To test the reliability of the word frequency classification procedure, three professionals from different professional backgrounds were invited separately and the professionals were asked to participate independently in the discrimination.
2.5. Landscape Variables
A set of key landscape variables mentioned in the literature that may influence the public’s perception of the landscape were collected in order to later investigate how they affect the landscape preferences of CESs. The main landscape variables include three main categories: natural elements, infrastructural elements, and sensory elements (Table 3).
- (1)
- Natural elements
Anshun is located in the karst landscape region of southwest China, and it has been studied that the soil properties differ at different altitudes of the karst landscape region, with the increase in soil nutrients at lower altitudes being greater than at higher altitudes [46], soil nutrients directly influence vegetation recovery, so vegetation richness tends to be higher at lower elevations. At the same time, the slope has a greater influence on the redistribution of rainfall in the soil [47,48]. The lower the slope, the slower the soil loss, while the opposite will result in faster soil loss, degradation of vegetation, increased soil erosion, increased rock exposure and rock desertification. Therefore, both elevation and slope can be factors that contribute to different landscape perceptions in karst landscapes. In addition, water is one of the most important and attractive visual elements in a landscape and has for long been important to human perceptions of landscape quality and the quality of many outdoor recreational experiences [49].
To summarise, the most frequently selected natural element indicators were: elevation (elevation), slope (slope), distance to water surface (D-water (surface)) and distance to water system point (D-water (point)), which refer to the distance between the attraction and the nearest water surface and water system point, respectively. The first two were obtained through DEM data analysis of Anshun, the latter two were obtained in ArcGIS 10.8 using Euclidean distance and nearest neighbour distance analysis.
- (2)
- Infrastructural elements
In terms of infrastructural elements, the distance of the attraction from the nearest highroad, railway, accommodation, restaurant was measured in ArcGIS 10.8 using Euclidean distance and nearest neighbour analysis, denoted as: distance to highroad (D-highroad), distance to railway (D-railway), distance to accommodation (D-accommodation), distance to restaurant (D-restaurant). It is worth mentioning that roads, railways and other infrastructures will give visitors easy access [50]; however, landscapes too close to roads can also bring greater noise to recreational activities and landscapes too close to roads can also bring louder noise to recreational activities and affect people’s perception of the landscape.
- (3)
- Sensory elements
Sensory elements at the emotional level guide people’s perception of the landscape by triggering a sense of familiarity, attachment, connection and other emotions in the perceiving subject and are important factors influencing landscape perception [51]. In contrast to most of the above indicators, which can be directly quantified to describe socially physical characteristics, some sensory indicators, such as olfactory and tactile elements, are difficult to quantify and have rarely been considered in previous studies. In this study, the content of attraction reviews from social media data was used as a data source, which was judged by experts and relevant word frequencies were calculated to represent the corresponding sensory element: Ctrip-sound, Ctrip-smell, Ctrip-vision and Ctrip-feel.
2.6. Statistical Analysis
Random Forest (RF) was used to investigate the correlation between landscape preferences and landscape variables of different CESs. RF is a machine learning algorithm with a strong generalization ability [52], it will take a random sample of the original data set to form a number of different sample data sets, then build a number of different decision tree models based on these data sets, and finally, based on the average of these decision tree models or voting to obtain the final analysis results [53]. RF has many advantages, such as no need to preprocess the data, convenient and fast processing, and stable results, thus RF is a good fit for assessing the importance of each landscape characteristic.
The public rating data of 60 major scenic spots in Anshun and their landscape variables were composed into a sample data set, and 60 different decision tree models were built based on these datasets for random forest regression calculations. The public landscape preference scores are the output variables and the 12 landscape variables are the input variables.
The calculation formula is as follows,
where V(Yi) denotes the public landscape preference score for Yi, p(Yi = Xj) denotes the probability of the prediction set. There are two important parameters to optimise in the model: the number of spanning trees (Ntree) and the number of randomly selected variables at each node (Mtry) [54].
During data analysis, the data were constantly re-ordered and re-segmented, and the training percentage was set to 0.7 for multiple training sessions to improve the accuracy of the training results.
The input variable importance in the model was ranked. It is defined as the cumulative contribution of the influence factor to the branch of the decision tree during the learning process. The larger the value, the more important is the variable’s influence on the public preference. The contribution rate of each variable to the fitting accuracy was defined as the relative importance, with a sum of 1.
3. Results
3.1. Spatial Distribution Characteristics of Scenic Spots
Among all the scenic spots, most of the scenic spots in Anshun are located in the higher terrain in the north, where are Xixiu district, Zhenning Buyi and Miao Autonomous county and Guanling Buyi and Miao Autonomous county (Figure 6a).
According to the results of expert judgements and word frequency analysis, the 60 scenic spots in Anshun can be divided into four categories: physical CESs with eight scenic spots, experiential CESs with 25 scenic spots, intellectual CESs with 20 scenic spots, and inspirational CESs with seven scenic spots. The physical CESs are concentrated in the northern part of Xixiu District, with a few in Zhenning, Guanling and Ziyun Buyi Miao Autonomous Counties (Figure 6b). Experiential CESs are concentrated at the junction of Zhenning and Guanling Buyi Miao Autonomous Counties (Figure 6c). Intellectual CESs are concentrated in the northern part of Xixiu District, with a small distribution in Zhenning, Guanling and Buyi Miao Autonomous Counties (Figure 6d). Inspirational CESs are distributed at the junction of Zhenning and Guanling Buyi Miao Autonomous Counties, with only isolated distributions in northern Xixiu District and Ziyun Buyi Miao Autonomous County (Figure 6e).
The distribution of scenic spots clearly corresponds to the distribution of the highway network (Figure 7a). In the north of Anshun, the Hu Kun Expressway runs from northeast to northwest through the northern part of the city, and along the perimeter of the motorway are concentrated many of Anshun’s well-known attractions. In contrast, the Ziyun Buyi Autonomous County, located in the southeast corner of Anshun, has fewer highways and is less accessible by car and less developed in terms of attractions. Compared to the highways, the railway network in Anshun is more evenly distributed, with the nearest railways in Anshun being relatively close to each other and less correlated with the distribution of scenic spots (Figure 7b).
As a tourist destination rich in natural landscape resources, water features have always been an important factor in attracting tourists to travel to Anshun, which is rich in water resources and has a relatively short distance from each scenic spot to the water (Figure 7c). Water resources are mainly concentrated in Zhenning Buyi Miao Autonomous County (Figure 7d), which has numerous scenic spots highlighted by water features and also concentrates on many of Anshun’s famous scenic spots popular with tourists, such as Huangguoshu Waterfall, Steeple Pond Waterfall and Silver Chain Falling Pool Waterfall.
3.2. Exploration of Landscape Variables and Landscape Preference
Twelve landscape character indicators were used as inputs to the Random forest to predict public landscape preferences for different CESs. Figure 8 and Figure 9 illustrate the proportion of importance of each feature.
According to the predicted results of the overall CESs (Figure 8), it can be seen that natural elements, infrastructural elements and sensory elements all have different degrees of importance on the overall landscape preference, especially the natural elements have a greater influence on the overall landscape preference, with slope, elevation and D-water (surface) being the top three landscape variables affecting the overall landscape preference of Anshun, from which can be seen that natural scenery, such as rich topography and water features, are the main attraction for tourists to come to Anshun. For infrastructural elements, tourists are more concerned with practical needs such as D-restaurant and D-highroad. For sensory elements, there is a significant correlation between Ctrip-feel and Ctrip-vision on landscape preferences, which shows that public preferences are more influenced by sensory and visual sensory factors.
The predictions were different for the different CESs (Figure 9):
For physical CESs, the top three factors influencing their landscape preferences are elevation, D-water (surface), and D-highroad. Physical CESs focus on the resources (both biotic and abiotic elements) that the ecosystem provides for recreation and focus on the variety of recreational activities that people will engage in such landscapes. The availability of natural conditions, such as good topography and water, is certainly popular with the public. At the same time, convenient infrastructure conditions such as transport, restaurants and accommodation are also the important factors for people to consider physical CESs for their excursions.
For experiential CESs, landscape preferences are mainly influenced by sensory elements, especially visual senses, with Ctrip-vision being the most significant factor influencing landscape preferences for this type of scenic spots. Experiential CESs focus on the aesthetic features of natural and semi-natural landscapes and the perceptions provided by their biotic and abiotic elements; therefore this result is not difficult to understand as these landscapes are more focused on bringing people a perceptual experience and visuals are the most direct sensory source of perceiving aesthetic features. In addition, the landscape preference of experiential CESs is also influenced by factors such as D-water (surface) and D-highroad.
For intellectual CESs, landscape preferences are mainly influenced by natural and sensory elements, with the main influencing indicators being D-water (point), D-water (surface), elevation, and Ctrip-feel. The specific content of intellectual CESs is divided into two aspects: science education and cultural heritage. These CESs focus on the study of educational activities through the natural environment of living and non-living factors in the ecosystem, and sites with landscape heritage and cultural heritage values usually belong to intellectual CESs. According to the analysis results, it is clear that natural ecological conditions are the basic conditions for conducting educational activities, on the basis of which people make good sensory perceptions of culturally valuable landscapes in order to obtain a better educational experience from them.
For inspirational CESs, landscape preferences are mainly influenced by elements of the natural and infrastructure, with the main influencing indicators being, in order, elevation, D-water (surface), D-water (point), D-accommodation, and D-restaurant. Inspirational CESs refer to landscapes, ecosystems and their elements that have religious or spiritual symbols or are used in art, architecture, advertising, local symbols and folklore. Such scenic spots are usually in good ecological base conditions, for example, Stone Cottage, Gaolaozhuang Scenic Area and Slippery Rock Wharf Scenic Area are built by water and have a quiet environment where people can enjoy the spiritual inspiration brought by the natural landscape, while the convenience of accommodation and restaurants can also influence visitors’ preference for such scenic spots.
In the RF model, Ntree is set to the default value of 100, Mtry is set to the square root of the number of input variable and a maximum depth of 10. Under these conditions, the model does a good job of predicting the landscape variables that influence public preferences across CESs, and the actual and estimated scores of public landscape preference show better agreement (Figure 10).
Table 4 shows the performance of the five models, where the smaller the values of MSE (mean square error), RMSE (root mean square error), MAE (mean absolute error), and MAPE (mean absolute percentage error) are, the more accurate the model is. R2, the coefficient of determination, and the closer the result is to 1 the more accurate the model is. Since the R2 for the test set was calculated using a nonlinear equation fit, there are some negative values that are not strictly R2, and the R2 is not informative.
4. Discussion
4.1. Spatial Distribution Variables of the Scenic Spots
Most of the scenic spots in Anshun are located in the higher terrain in the north, which may be related to a number of economic and social reasons such as better natural scenery, better infrastructure, more concentrated population distribution, greater resource development and favourable policies in the north of Anshun. Xixiu District is the main urban area of Anshun City, with a more developed economy and a more concentrated population. It is the political, economic and cultural centre of the city and is rich in tourism resources, with three 4A-level tourist attractions, as well as a number of national and provincial key cultural heritage protection units. The resource in Xixiu District focus on entertainment and education, so the scenic spots in Xixiu District are mostly Physical CESs and Intellectual CESs. Zhenning buyi Miao Autonomous County has obvious karst geomorphological features, with a variety of caves, underground rivers, waterfalls, lakes and springs, and rich geothermal resources, making it “a karst kingdom”. Due to the outstanding natural scenery of Zhenning County, known as “Silver City” and “Waterfall Township”, the county’s scenic spots are mostly based on natural sightseeing and inspiration, so the scenic spots mostly belong to Experiential CESs and Inspirational CESs. Meanwhile, the county’s scenic spots in Guanling Buyi Miao Autonomous County are more Physical, Intellectual CESs, and a few Experiential, Intellectual CESs. The above three counties are rich in tourism resources, each with its own characteristics, and due to the early good development, has now developed into the city of Anshun tourism card. Moreover, the remaining counties of Puding, Pingba and Ziyun are not yet well developed because of the relative isolation of the traffic and the general natural and humanistic conditions, and even if there are a few scenic spots, they are scattered all over the place, and there has not been any centralised tourism development yet. The uneven distribution of scenic spots in Anshun is certainly affected by many factors such as nature, society and economy, but it is not conducive to the long-term development of Anshun. Therefore, the natural resources and human resources in the southern part of Anshun should be given enough attention by planners and managers, so that they can become the rising star of tourism development in Anshun and promote the balanced development of tourism economy.
The development of the tourism economy in the Anshun region can be approached in two ways. On the one hand, for the transport infrastructure, the distribution of scenic spots in Anshun is highly compatible with the distance from the scenic spots to the highway, which means that the distribution of major scenic spots in Anshun is clearly influenced by road traffic, and the road network can effectively drive the development of the tourism landscape along the route. Nowadays, with the gradual improvement of the road network in Anshun, self-drive tours have replaced the previously common train trips as the first choice for tourists travelling within Guizhou Province, which explains why the distribution of scenic spots is significantly correlated with their distance to the highway. Therefore, to develop the tourism economy in the south of Anshun, it is advisable to use the development of the highway network as an entry point to strengthen the construction of transport infrastructure in order to drive the development of tourism resources. On the other hand, for the natural landscape resources, tourists’ preference for the landscape of Anshun is also closely related to the indicator of distance from scenic spots to water. Anshun benefits from its unique natural scenery of mountains and water, with numerous natural wonders within its borders, such as waterfalls and caves. These natural wonders are often made famous thanks to the good local water resources, which are just right to satisfy the pursuit of spiritual enjoyment and the desire to be close to nature for people who have lived in the city for a long time, so Anshun is increasingly becoming a tourist destination for urban tourists on short-term trips.
4.2. Landscape Variables That Influence Landscape Preferences of Different CESs
In the light of the rising standard of living, the strong demand for tourism and the increasing demand for non-material aspects, planners and managers of tourist attractions in Anshun should seize this opportunity in a timely manner, develop tourism resources in the territory in a scientific, rational and equitable manner, accelerate the improvement of related service infrastructure, incorporate the enhancement of cultural ecosystem service values into landscape planning and policy formulation, enhance the non-material aspects of tourists’ landscape perceptions, and cater to the current expectations of tourists for attraction planning in order to increase the attractiveness of tourism in Anshun, enhance the well-being of local people and promote the good development of Anshun’s tourism economy.
For all types of scenic spots, the most significant factors influencing their landscape preference were natural elements, with slope, elevation and D-water (surface) having a greater impact on overall landscape preference in Anshun. However, the results of the random forest regressions differed for different CESs of scenic spots.
Effectively enhancing the non-material aspects of tourists’ landscape perceptions through rational landscape planning requires an understanding of the intrinsic correlation between public preferences and landscape variables in different CESs, and their application to concrete practice.
For physical CESs that rely mainly on natural conditions for recreational activities (e.g., mountain climbing, skiing and rafting), distance from infrastructure such as highways and restaurants needs to be considered when planning and formulating policies for their scenic areas in order to improve the accessibility and convenience of the scenic spots, and enabling visitors to more easily engage in rich recreational activities and have a better experience of physical-type cultural services. Obviously, physical CESs are strongly influenced by the accessibility of infrastructure and natural landscape features [13]. Good and convenient infrastructure not only provides the necessary conditions for mountaineering, skiing, rafting, and other related activities, but is also important for people to be able to rest and recover after the activity [55].
For experiential CESs that focus on aesthetic experiences with a focus on natural and semi-natural landscapes, planners and decision-makers should focus on the impact of sensory factors on the visitor experience, especially visual experiences, which can often bring the most intuitive and impactful aesthetic feelings to visitors. Several earlier studies have also demonstrated that people’s perceptions of landscapes are mostly shaped by their visual environment. Since visual attention and landscape identification are closely intertwined, visitors’ perceptions of landscapes are influenced by their visual perception, which in turn influences their encounters with various visual impacts [56].
For intellectual CESs, where science and research activities are carried out through the natural ecological environment, often rely on local traditional buildings, cultural heritage and cultural landscapes to bring educational perceptions to visitors. The natural landscape combined with physical perception can be used to bring better intellectual cultural services to visitors. Previous studies have shown that both natural and infrastructural elements were essential landscape characteristics for intellectual CESs, which are related to the diversity of science and cultural education [13]. The current study adds that sensory factors also have an influential factor on intellectual CESs.
For inspirational CESs with spiritual elements such as religion, folklore, local cultural symbols and art, which can bring new inspiration to visitors, they are usually located in places with good ecological base conditions. Needless to say, inspiration can come from ecological and natural sources [57]. Moreover, the planning of inspirational CESs also involves focusing on infrastructure, such as accommodation, restaurants and roads, as accessibility is an important factor in attracting visitors to CESs.
In summary, in the future, tourism landscape planning in Anshun should not only consider topographic, hydrological, economic, policy and other basic development conditions, but also try to evaluate and classify the cultural service content, purposefully considering the landscape variables that dominate the landscape preference of the scenic spots, and incorporate them into the indicators that guide the planning. This allows the landscape to supply a higher value of cultural services, tourists gain richer and more comprehensive perception of the landscape, attracting more tourists to Anshun for travel and tourism, and promoting the benign development of the local tourist attractions in Anshun.
4.3. Research Limitations
Based on geographical and social media data, this study investigates the correlation between landscape preferences and landscape variables of different CESs, and then gives reasonable suggestions for landscape planning and policy formulation in Anshun from the perspective of enhancing the non-material aspects of landscape perception. This helps us to gain a deeper understanding of the public’s preferences for different CES types of tourist attractions, and to apply this information to the location of tourist attractions, the configuration of infrastructure, and the formulation of superordinate policies in Anshun, so as to effectively enhance tourists’ experience of cultural ecosystem services. It is particularly important to note that the findings of this study are only applicable to guide the planning and policy formulation of scenic spots in Anshun due to the different natural ecological conditions, social-cultural background, economic conditions, policy context and major visitor segments in different regions. The article still has some unavoidable problems due to the limitations of insufficient sample size, difficulty in obtaining data, and time constraints of the study, as the research data mainly comes from the Internet. In addition, due to user privacy issues, the social media data used does not include information on social-demographic characteristics, such as user age, gender and education level; therefore, it is not possible to predict potential differences in preferences for landscape features among people from different backgrounds [58,59]. There are also many other influential factors on public preference besides the 12 variables mentioned in the article, such as: tourism resources of scenic spots, landscape richness, plant coverage, etc. In this paper, due to the factors of topic, research methodology, length and so on, it is not possible to consider all the influential factors into the regression model for statistical purposes, which can be supplemented in the future research. Furthermore, due to time restrictions, constrained circumstances, and other objective factors, we were unable to perform field interviews and attractiveness assessments in the local region for this article. By conducting field interviews and evaluating attractions, the researcher may gain a firsthand understanding of locals’ perspectives on tourism landscapes and the cultural services offered by the sites. In subsequent related investigations, the variety of research methodologies may be enhanced and improved to increase the study’s completeness and scientific validity.
5. Conclusions
The existing tourist attractions in Anshun are mostly located in the northern part of the city where the terrain is high and the highway network is dense, while the tourism resources in the south have not been vigorously developed. The natural landscape, history and humanities of the southern part of Anshun should be given sufficient attention by planners and managers in order to promote the long-term, balanced development of the tourism economy in Anshun. The development of tourism resources in the southern part of Anshun City can start from actively improving the highway network, restaurants, accommodation and other infrastructures, and choosing the more water-rich and potential tourism landscape along the road as the object of development, so as to attract more tourists to visit the area.
In order to make the planning and design of the tourism landscape in Anshun more responsive to the current expectations of tourists, planners can consider the non-material aspects of tourists’ needs for spiritual enjoyment and closeness to nature when planning and designing the tourism landscape and enhance the experience of ecosystem cultural services for tourists. Managers can also consider incorporating indicators related to ecosystem cultural services when formulating relevant policies and regulations. For the future planning of the tourism landscape in Anshun, planners can try to use the findings of this study as a guide to target the landscape planning and design of each type of CESs from the perspective of enhancing the perceptual experience of the non-material aspects of the landscape. Physical CESs and inspirational CESs should pay attention to the convenience of visitors to the attractions. Experiential CESs should focus on the planning and design of the visual experience of the landscape. Intellectual CESs can be considered to enhance the sensory perception of visitors to the landscape on the basis of ensuring good natural ecology. Thus, the existing tourism landscape in Anshun City can play a correspondingly higher value in cultural services, so that the landscape experience of tourists is richer, strengthening the attractiveness and influence of tourism and driving the steady growth of the tourism economy in Anshun.
Author Contributions
Conceptualization, Y.Y. and W.D.; methodology, Y.Y.; software, Y.Y.; validation, W.D. and Y.Y.; formal analysis, Y.Y.; investigation, Y.Y.; resources, Y.Y.; data curation, Y.Y.; writing—original draft preparation, Y.Y.; writing—review and editing, Y.Y.; visualization, Y.Y.; supervision, W.D.; project administration, W.D.; funding acquisition, W.D. All authors have read and agreed to the published version of the manuscript.
Funding
This research received no external funding.
Institutional Review Board Statement
Ethical review and approval were waived for this study, due to involving no more than minimal risk.
Data Availability Statement
Data is contained within the article and Appendix A.
Acknowledgments
I would like to express my gratitude to Wei Duan and my peer HaoXian Cai for their support and assistance with this research work.
Conflicts of Interest
The authors declare no conflicts of interest.
Appendix A
Figure A1.
The word frequency information crawled from Ctrip for landscape comments.

Figure A2.
Summary of relevant analytical data for each scenic spot.

References
- Emborg, J.; Gamborg, C. Land Use Policy A wild controversy: Cooperation and competition among landowners, hunters, and other outdoor recreational land-users in Denmark. Land Use Policy 2016, 59, 197–206. [Google Scholar] [CrossRef]
- Guo, Z.; Zhang, L.; Li, Y. Increased dependence of humans on ecosystem services and biodiversity. PLoS ONE 2010, 5, e13113. [Google Scholar] [CrossRef] [PubMed]
- Gajardo, L.J.; Sumeldan, J.; Sajorne, R.; Madarcos, J.R.; Goh, H.C.; Culhane, F.; Langmead, O.; Creencia, L. Cultural values of ecosystem services from coastal marine areas: Case of Taytay Bay, Palawan, Philippines. Environ. Sci. Policy 2023, 142, 12–20. [Google Scholar] [CrossRef]
- Millennium Ecosystem Assessment. Ecosystems and Human Well-Being: Synthesis Reports; Millennium Ecosystem Assessment: Washington, DC, USA, 2005. [Google Scholar]
- Gret-Regamey, A.; Weibel, B. Global assessment of mountain ecosystem services using earth observation data. Ecosyst. Serv. 2020, 46, 101213. [Google Scholar] [CrossRef]
- Lakshmi, A. Coastal ecosystem services & human wellbeing. Indian J. Med. Res. 2021, 153, 382–387. [Google Scholar] [PubMed]
- World Resources Institute. Ecosystems and Human Well-Being: A Framework for Assessment, 2nd ed.; Island Press: Washington, DC, USA, 2003. [Google Scholar]
- Daniel, T.C.; Muhar, A.; Arnberger, A.; Aznar, O.; Boyd, J.W.; Chan, K.M.A.; Costanza, R.; Elmqvist, T.; Flint, C.G.; Gobster, P.H.; et al. Contributions of cultural services to the ecosystem services agenda. Proc. Natl. Acad. Sci. USA 2012, 109, 8812–8819. [Google Scholar] [CrossRef] [PubMed]
- Plieninger, T.; Dijks, S.; Oteros-Rozas, E.; Bieling, C. Assessing, mapping, and quantifying cultural ecosystem services at community level. Land Use Policy 2013, 33, 118–129. [Google Scholar] [CrossRef]
- Hattam, C.; Broszeit, S.; Langmead, O.; Praptiwi, R.A.; Lim, V.C.; Creencia, L.A.; Tran, D.H.; Maharja, C.; Mitra Setia, T.; Wulandari, P.; et al. A matrix approach to tropical marine ecosystem service assessments in South east Asia. Ecosyst. Serv. 2021, 51, 101346. [Google Scholar] [CrossRef]
- Liquete, C.; Piroddi, C.; Drakou, E.G.; Gurney, L.; Katsanevakis, S.; Charef, A.; Egoh, B. Current status and future prospects for the assessment of marine and coastal ecosystem services: A systematic review. PLoS ONE 2013, 8, e67737. [Google Scholar] [CrossRef]
- Bai, Y.; Chen, Y.; Alatalo, J.M.; Yang, Z.; Jiang, B. Scale effects on the relationships between land characteristics and ecosystem services- a case study in Taihu Lake Basin, China. Sci. Total Environ. 2020, 716, 137083. [Google Scholar] [CrossRef]
- Li, Y.; Xie, L.; Zhang, L.; Huang, L.; Lin, Y.; Su, Y.; AmirReza, S.; He, S.; Zhu, C.; Li, S.; et al. Understanding different cultural ecosystem services: An exploration of rural landscape preferences based on geographic and social media data. J. Environ. Manag. 2022, 317, 115487. [Google Scholar] [CrossRef] [PubMed]
- Zhang, H.; Huang, R.; Zhang, Y.; Buhalis, D. Cultural ecosystem services evaluation using geolocated social media data: A review. Tour. Geogr. 2020, 24, 646–668. [Google Scholar] [CrossRef]
- Dong, L.; Zhu, W.; Gao, Y.; Li, S. Progress in the study of ecosystem cultural services. J. Peking Univ. Nat. Sci. Ed. 2014, 50, 1155–1162. [Google Scholar]
- Wang, Y.; Hayashi, K. Methodological development of cultural ecosystem services evaluation using location data. J. Clean. Prod. 2023, 396, 136523. [Google Scholar] [CrossRef]
- Richards, D.R.; Tunçer, B. Using image recognition to automate assessment of cultural ecosystem services from social media photographs. Ecosyst. Serv. 2018, 31, 318–325. [Google Scholar] [CrossRef]
- Balázsi, Á.; Danhardt, J.; Collins, S.; Schweiger, O.; Settele, J.; Hartel, T. Understanding cultural ecosystem services related to farmlands: Expert survey in Europe. Land Use Policy 2021, 100, 104900. [Google Scholar] [CrossRef]
- Ginsburgh, V. Contingent valuation, willingness to pay, and willingness to accept. In Economic Ideas You Should Forget; Springer: Cham, Switzerland, 2017; pp. 65–66. [Google Scholar]
- Zhao, N.; Wang, H.; Zhong, J.; Sun, D. Assessment of recreational and cultural ecosystem services value of islands. Land 2022, 11, 205. [Google Scholar] [CrossRef]
- Sumarga, E.; Hein, L.; Edens, B.; Suwarno, A. Mapping monetary values of ecosystem services in support of developing ecosystem accounts. Ecosyst. Serv. 2015, 12, 71–83. [Google Scholar] [CrossRef]
- Zheng, S.; Ma, M.; Li, H.; Wang, Q.; Zhang, X. Evaluation of Ecospatial Cultural Services in Urban Centres from the Perspective of Residents’ Well-being—A Case Study of Beijing. Urban Dev. Res. 2021, 28, 21–27. [Google Scholar]
- Christie, M.; Fazey, I.; Cooper, R.; Hyde, T.; Kenter, J.O. An evaluation of monetary and non-monetary techniques for assessing the importance of biodiversity and ecosystem services to people in countries with developing economies. Ecol. Econ. 2012, 83, 67–78. [Google Scholar] [CrossRef]
- Wartmann, F.M.; Purves, R.S. Investigating sense of place as a cultural ecosystem service in different landscapes through the lens of language. Landsc. Urban Plann. 2018, 175, 169–183. [Google Scholar] [CrossRef]
- Riechers, M.; Barkmann, J.; Tscharntke, T. Diverging perceptions by social groups on cultural ecosystem services provided by urban green. Landsc. Urban Plann. 2018, 175, 161–168. [Google Scholar] [CrossRef]
- Liu, Z.; Huang, Q.; Yang, H. Supply-demand spatial patterns of park cultural services in megalopolis area of Shenzhen, China. Ecol. Indic. 2021, 121, 107066. [Google Scholar] [CrossRef]
- Buchel, S.; Frantzeskaki, N. Citizens’ voice: A case study about perceived ecosystem services by urban park users in Rotterdam, the Netherlands. Ecosyst. Serv. 2015, 12, 169–177. [Google Scholar] [CrossRef]
- Ghermandi, A.; Sinclair, M. Passive crowdsourcing of social media in environmental research: A systematic map. Glob. Environ. Chang. 2019, 55, 36–47. [Google Scholar] [CrossRef]
- Gosal, A.S.; Ziv, G. Landscape aesthetics: Spatial modelling and mapping using social media images and machine learning. Ecol. Indicat. 2020, 117, 106638. [Google Scholar] [CrossRef]
- Jean-Christophe, F.; Jens, I.; Nicolas, B. Coupling crowd-sourced imagery and visibility modelling to identify landscape preferences at the panorama level. Landsc. Urban Plann. 2020, 197, 103756. [Google Scholar]
- Van Zanten, B.T.; Verburg, P.H.; Koetse, M.J.; Van Beukering, P.J.H. Preferences for European agrarian landscapes: A meta-analysis of case studies. Landsc. Urban Plann. 2014, 132, 89–101. [Google Scholar] [CrossRef]
- da Mota, V.T. Catherine Pickering, Using social media to assess nature-based tourism: Current research and future trends. J. Outdoor Recreat. Tour. 2020, 30, 100295. [Google Scholar] [CrossRef]
- Ren, X. Consensus in factors affecting landscape preference: A case study based on a cross-cultural comparison. J. Environ. Manag. 2019, 252, 109622. [Google Scholar] [CrossRef]
- Cai, K.; Huang, W.; Lin, G. Bridging landscape preference and landscape design: A study on the preference and optimal combination of landscape elements based on conjoint analysis. Urban For. Urban Green. 2022, 73, 127615. [Google Scholar] [CrossRef]
- Kaplan, R.; Kaplan, S.; Brown, T. Environmental preference: A comparison of four domains of predictors. Environ. Behav. 1989, 21, 509–530. [Google Scholar] [CrossRef]
- Kenter, J.O.; Jobstvogt, N.; Watson, V.; Irvine, K.N.; Christie, M.; Bryce, R. The impact of information, value-deliberation and group-based decision-making on values for ecosystem services: Integrating deliberative monetary valuation and storytelling. Ecosyst. Serv. 2016, 21, 270–290. [Google Scholar] [CrossRef]
- Czembrowski, P.; Kronenberg, J.; Czepkiewicz, M. Integrating non-monetary and monetary valuation methods–SoftGIS and hedonic pricing. Ecol. Econ. 2016, 130, 166–175. [Google Scholar] [CrossRef]
- Yang, B.; Zhang, J. A study on tourism image perception of Tianmu Mountain based on network text analysis--Taking Ctrip.com travelogue and review as an example. Fujian For. Sci. Technol. 2017, 44, 118–125. [Google Scholar] [CrossRef]
- Haines-Young, R.; Potschin, M. Common international classification of ecosystem services (CICES, Version 4.1). Eur. Environ. Agency 2012, 33, 107. [Google Scholar]
- Potschin, M.; Haines-Young, R. Defining and measuring ecosystem services. Routledge Handb. Ecosyst. Serv. 2016, 1, 25–44. [Google Scholar]
- Pascual, U.; Balvanera, P.; Díaz, S.; Pataki, G.; Roth, E.; Stenseke, M.; Watson, R.T.; Dessane, E.B.; Islar, M.; Kelemen, E.; et al. Valuing nature’s contributions to people: The IPBES approach. Curr. Opin. Environ. Sustain. 2017, 26, 7–16. [Google Scholar] [CrossRef]
- Landers, D.H.; Nahlik, A.M.; Rhodes, C.R. The Beneficiary Perspective: Benefits and Beyond; Routledge Handbook of Ecosystem Services; Routledge: London, UK, 2016; pp. 74–87. [Google Scholar]
- Czúcz, B.; Arany, I.; Potschin-Young, M.; Bereczki, K.; Kertész, M.; Kiss, M.; Aszalós, R.; Haines-Young, R. Where concepts meet the real world: A systematic review of ecosystem service indicators and their classification using CICES. Ecosyst. Serv. 2018, 29, 145–157. [Google Scholar] [CrossRef]
- Clemente, P.; Calvache, M.; Antunes, P.; Santos, R.; Cerdeira, J.O.; Martins, M.J. Combining social media photographs and species distribution models to map cultural ecosystem services: The case of a Natural Park in Portugal. Ecol. Indic. 2019, 96, 59–68. [Google Scholar] [CrossRef]
- Haines-Young, R.; Potschin, M. Common International Classification of Ecosystem Services (CICES): Consultation on Version 4; European Environment Agency: Nottingham, UK, 2013.
- Zhang, J.; Chen, H.; Fu, Z.; Wang, K. Effects of vegetation restoration on soil properties along an elevation gradient in the karst region of southwest China. Agric. Ecosyst. Environ. 2021, 320, 107572. [Google Scholar] [CrossRef]
- Fan, C.; Zhao, L.; Hou, R.; Fang, Q.; Zhang, J. Quantitative analysis of rainwater redistribution and soil loss at the surface and belowground on karst slopes at the microplot scale. Catena 2023, 227, 107113. [Google Scholar] [CrossRef]
- Fang, Q.; Zhao, L.; Hou, R.; Fan, C.; Zhang, J. Rainwater transformation to runoff and soil loss at the surface and belowground on soil-mantled karst slopes under rainfall simulation experiments. Catena 2022, 215, 106316. [Google Scholar] [CrossRef]
- Burmil, S.; Daniel, T.C.; Hetherington, J.D. Human values and perceptions of water in arid landscapes. Landsc. Urban Plan. 1999, 44, 99–109. [Google Scholar] [CrossRef]
- Mühl, S. Landscape and infrastructure preferences of recreational rowers in Germany. J. Outdoor Recreat. Tour. 2020, 29, 100271. [Google Scholar] [CrossRef]
- Lee, C.-H. Understanding rural landscape for better resident-led management: Residents’ perceptions on rural landscape as everyday landscapes. Land Use Policy 2020, 94, 104565. [Google Scholar] [CrossRef]
- El Islem Karabadji, N.; Korba, A.A.; Assi, A.; Seridi, H.; Aridhi, S.; Dhifli, W. Accuracy and diversity-aware multi-objective approach for random forest construction. Expert Syst. Appl. 2023, 225, 120138. [Google Scholar] [CrossRef]
- Wang, Y.; Chen, X.; Gao, M.; Dong, J. The use of random forest to identify climate and human interference on vegetation coverage changes in southwest China. Ecol. Indic. 2022, 144, 109463. [Google Scholar] [CrossRef]
- Belgiu, M.; Drăguţ, L. Random forest in remote sensing: A review of applications and future directions. ISPRS J. Photogramm. Remote Sens. 2016, 114, 24–31. [Google Scholar] [CrossRef]
- Gidlow, C.; Cerin, E.; Sugiyama, T.; Adams, M.A.; Mitas, J.; Akram, M.; Reis, R.S.; Davey, R.; Troelsen, J.; Schofield, G.; et al. Objectively measured access to recreational destinations and leisure-time physical activity: Associations and demographic moderators in a six-country study. Health Place 2019, 59, 102196. [Google Scholar] [CrossRef]
- Yuan, G.; Wang, H.; Wang, M.; Lin, M. Visual attention and ethnic landscape perception: A case of three cities in the Guangdong–Hong Kong–Macao greater bay area. Appl. Geogr. 2022, 147, 102781. [Google Scholar] [CrossRef]
- Dai, P.; Zhang, S.; Gong, Y.; Yang, Y.; Hou, H. Assessing the inspirational value of cultural ecosystem services based on the Chinese poetry. Acta Ecol. Sin. 2022, 42, 467–475. [Google Scholar] [CrossRef]
- Kalivoda, O.; Vojar, J.; Skřivanová, Z.; Zahradník, D. Consensus in landscape preference judgments: The effects of landscape visual aesthetic quality and respondents’ characteristics. J. Environ. Manag. 2014, 137, 36–44. [Google Scholar] [CrossRef] [PubMed]
- Sharafatmandrad, M.; Mashizi, A.K. Visual value of rangeland landscapes: A study based on structural equation modeling. Ecol. Eng. 2020, 146, 105742. [Google Scholar] [CrossRef]
Figure 1.
Study area.

Figure 2.
Research methods.

Figure 3.
The treatment of the research difficulties in CES.

Figure 4.
Land use data.

Figure 5.
Public preference scores.

Figure 6.
Distribution of scenic spots: (a) Distribution of scenic spots-overall CESs, in the legend the low value indicate 0 and max value is equal at 1033.16; (b) Distribution of scenic spots-Physical CESs, in the legend the low value indicate 0 and max value is equal at 64.05; (c) Distribution of scenic spots-Experiential CESs, in the legend the low value indicate 0 and max value is equal at 652.64; (d) Distribution of scenic spots-Intellectual CESs, in the legend the low value indicate 0 and max value is equal at 402.62; (e) Distribution of scenic spots-Inspirational CESs, in the legend the low value indicate 0 and max value is equal at 69.83.

Figure 7.
Spatial landscape characteristics: (a) Distance to the highroad; (b) Distance to the railway; (c) Distance to the water surface; (d) Distance to the water system.
Figure 7.
Spatial landscape characteristics: (a) Distance to the highroad; (b) Distance to the railway; (c) Distance to the water surface; (d) Distance to the water system.

Figure 8.
The relative importance of the indicators of the overall CESs.

Figure 9.
The relative importance of the indicators: (a) Physical CESs; (b) Experiential CESs; (c) Intellectual CESs; (d) Inspirational CESs.
Figure 9.
The relative importance of the indicators: (a) Physical CESs; (b) Experiential CESs; (c) Intellectual CESs; (d) Inspirational CESs.

Figure 10.
Scatter plot of predicted and true values: (a) Overall CESs; (b) Experiential CESs; (c) Intellectual CESs.
Figure 10.
Scatter plot of predicted and true values: (a) Overall CESs; (b) Experiential CESs; (c) Intellectual CESs.


Table 1.
Different types of comment splitting.
| Category | Sub-Category | Word Examples |
|---|---|---|
| Biological and natural landscape elements | Plant type | Bonsai, fruit trees, rape, cherry blossoms, petals, cherries, vegetation |
| Land type | waterfalls, waterholes, caves, countryside, farms, gardens, stone forests, rivers | |
| Animal type | monkeys, birds | |
| Cultural landscape elements | Building | architecture, ancient buildings, villages, villages |
| Restaurant | buffet, dinner, lunch | |
| Homestay | hotel | |
| Tickets | buy tickets | |
| Price | cheap, expensive, cost-effective | |
| Entertainment | take pictures, perform, dance | |
| Distance | far, near | |
| Perception elements | Sound | sound, loud |
| Smell | air, fresh, refreshing | |
| Feel | shocking, comfortable, happy | |
| Vision | Spectacular, good-looking, clean and pleasant | |
| Weather | cool, cold | |
| Sense of place | Traffic | walk, car, boat |
| Service | commercial streets, tourists | |
| Mood | Pleased, comfortable | |
| Time | morning, evening | |
| People | tour guides, tourists, friends, children |
Table 2.
Classification of CES.
| CES Types Defined [44] | CES Category (Based on CICES) | Definition | Examples for Classification |
|---|---|---|---|
| Physical | Recreation | Resources provided for recreational activities in the ecosystem (its biological and non-biological elements). | Comments containing attractions for recreational activities (e.g., mountain climbing skiing and rafting). |
| Experiential | Aesthetics | Feelings provided by the aesthetic characteristic of natural and semi-natural landscapes and their biological and non-biological elements | Comments containing descriptions of the landscape and beauty (e.g., mountain and river). |
| Intellectual | Scientific and educational | Research or educational activities conducted through the natural environment of the ecosystem and its biological and non-biological components. | Comments containing attractions for educational training or research activities, (e.g., educational bases). |
| Cultural heritage and identity | Value of the landscape, species or location to the local heritage and cultural heritage. | Comments containing cultural heritage or intangible cultural heritage (e.g., traditional buildings, local culture, cultural landscape and traditional practices). | |
| Inspirational | Spiritual and religious | Landscapes, ecosystems and their elements that have religious or spiritual purposes. | Comments containing temples and religious attractions (e.g., churches, burning incense and worshiping buddha). |
| Inspiration | Landscapes, ecosystems and their elements used in art architecture, advertising, local symbols, and folklore. | Comments containing attractions with art publicity and local symbols (e.g., art gallery and music) |
Table 3.
Landscape variables.
| Dimension | Code | Meaning |
|---|---|---|
| Natural elements | Slope | Slope of the scenic spots |
| Elevation | Elevation of the scenic spots | |
| D-water (surface) | Distance to the nearest water bodies | |
| D-water (point) | Distance to the nearest water points | |
| Infrastructural elements | D-highroad | Distance to the nearest highroad |
| D-railway | Distance to the nearest railway | |
| D-accommodation | Distance to the nearest accommodation | |
| D-restaurant | Distance to the nearest restaurant | |
| Sensory elements | Ctrip-sound | Sound evaluation word frequency in Ctrip |
| Ctrip-smell | Smell evaluation word frequency in Ctrip | |
| Ctrip-vision | Vision evaluation word frequency in Ctrip | |
| Ctrip-feel | Touch or feel evaluation word frequency in Ctrip |
Table 4.
Performance of the RF Model.
| Data Set | MSE | RMSE | MAE | MAPE | R2 | |
|---|---|---|---|---|---|---|
| Overall CESs | Train set | 0.009 | 0.096 | 0.072 | 1.641 | 0.859 |
| Test set | 0.124 | 0.352 | 0.276 | 6.411 | −0.283 | |
| Physical CESs | Train set | 0.001 | 0.031 | 0.022 | 0.502 | 0.759 |
| Test set | 0.234 | 0.484 | 0.413 | 9.644 | −2.899 | |
| Experiential CESs | Train set | 0.012 | 0.111 | 0.08 | 1.79 | 0.823 |
| Test set | 0.129 | 0.359 | 0.304 | 6.669 | −2.259 | |
| Intellectual CESs | Train set | 0.021 | 0.145 | 0.124 | 2.811 | 0.721 |
| Test set | 0.163 | 0.404 | 0.298 | 6.685 | −0.38 | |
| Inspirational CESs | Train set | 0.005 | 0.074 | 0.065 | 1.463 | 0.844 |
| Test set | 0.075 | 0.275 | 0.218 | 4.865 | −0.885 |
Disclaimer/Publisher’s Note: The statements, opinions and data contained in all publications are solely those of the individual author(s) and contributor(s) and not of MDPI and/or the editor(s). MDPI and/or the editor(s) disclaim responsibility for any injury to people or property resulting from any ideas, methods, instructions or products referred to in the content. |
© 2024 by the authors. Licensee MDPI, Basel, Switzerland. This article is an open access article distributed under the terms and conditions of the Creative Commons Attribution (CC BY) license (https://creativecommons.org/licenses/by/4.0/).
Share and Cite
MDPI and ACS Style
Yang, Y.; Duan, W. An Interpretation of Landscape Preferences Based on Geographic and Social Media Data to Understand Different Cultural Ecosystem Services. Land 2024, 13, 125. https://0-doi-org.brum.beds.ac.uk/10.3390/land13020125
AMA Style
Yang Y, Duan W. An Interpretation of Landscape Preferences Based on Geographic and Social Media Data to Understand Different Cultural Ecosystem Services. Land. 2024; 13(2):125. https://0-doi-org.brum.beds.ac.uk/10.3390/land13020125
Chicago/Turabian StyleYang, Yuanting, and Wei Duan. 2024. "An Interpretation of Landscape Preferences Based on Geographic and Social Media Data to Understand Different Cultural Ecosystem Services" Land 13, no. 2: 125. https://0-doi-org.brum.beds.ac.uk/10.3390/land13020125
Note that from the first issue of 2016, this journal uses article numbers instead of page numbers. See further details here.