1. Introduction
Since the 20th century, global population growth and rapid urbanization have strained natural resources and intensified environmental issues. According to the Millennium Ecosystem Assessment, 60% of the global natural ecosystems have degraded due to human activities [
1]. In 2015, the United Nations proposed the “2030 Agenda for Sustainable Development”, covering 17 Sustainable Development Goals (SDGs) to achieve global sustainable development through promoting environmental protection, economic growth, and social development [
2]. As the SDGs become a reference point in the global policy-making process [
3,
4], there is an urgent need to promote, develop, and modify governance mechanisms to mainstream SDGs into decision-making processes.
Despite the increasing attempts to integrate SDGs into decision-making processes, there are limited investigations integrating spatial planning with the SDGs. Incorporating the progress of the SDGs into spatial planning could contribute to ensuring that urban development activities are aligned with the long-term objectives of sustainable development. Experiences have emerged across different countries and organizations in linking the SDGs with overarching objectives [
5], but there are limited investigations integrating spatial planning with the SDGs. The Major Function Oriented Zone (MFOZ) planning in China represents a pioneering approach, focusing on ecosystem services to bridge the gap in quantitative analysis for sustainable development [
6]. By aligning municipalities according to their environmental capacities and development potentials, MFOZ planning seeks to optimize territorial development and protection, showcasing the integral role of spatial planning in leveraging ecosystem services toward achieving sustainable development [
6,
7]. Due to the potential of MFOZ planning [
8], it is essential to integrate the regional development objectives with SDGs in the MFOZ framework.
In the context of spatial planning for SDGs, it still needs a more detailed evaluation of SDG progress across various scales to improve the operability and feasibility of local governments. The scientific monitoring and evaluation of the progress on various scales is an essential part of achieving these SDGs, as it can identify pivotal areas and cities that require improvement, assisting policymakers and urban planners in formulating targeted strategies and policies. Current research focuses primarily on the SDGs evaluation on the national scale [
9], provincial scale, or community scale [
10]. However, on the regional scale, the challenge lies in how to better distill similar or different characteristics among cities for classification studies. On the city scale, the evaluation and implementation of SDGs still lack assessments due to a lack of supported indicators and corresponding data. Although current studies have attempted various methods such as Weighting Assignment methods [
11], Multiple-Attribute models [
12] and Discriminant Analysis [
13] for the classification and evaluation of sustainable development on different aspects, however, such evaluations often struggle to objectively categorize into a few types for broader-scale management decisions. Clustering techniques represent a valuable algorithm that allows for the grouping of similar characteristics among a set of objects, ensuring high homogeneity within groups and significant heterogeneity between groups. Cluster analysis has been applied in numerous fields, such as energy systems, social behaviors, and the identification of patterns in investments and consumption. Clustering algorithms are particularly useful in grouping key factors that require more attention to ensure the achievement of target values. Therefore, we utilized cluster analysis to examine the current status of SDGs and the regions for each type.
At the same time, ecosystem services, an essential part of achieving the SDGs, and how different cities can efficiently realize the SDGs through ecosystem services during the spatial planning still need further exploration. Given the limited resources available for achieving the SDGs, it is necessary to understand the mechanisms and influencing factors behind their achievement. Ecosystem services offer various benefits through the structure, function, and processes of ecosystems, such as food production, water supply, climate regulation, and biodiversity [
14]. Effective management of ecosystem services could help improve natural resources’ benefits, enhance human well-being, and reduce the ecological and environmental impacts of achieving the SDGs [
15]. Existing research shows that ecosystem services provide a solid foundation for achieving the SDGs by addressing urban resource shortages, increasing resource efficiency, stimulating economic development, and improving social welfare [
16]. For example, Xu et al. (2023) utilized a geographical detector to analyze the interactive effects of ecosystem services and human well-being [
4]. Similarly, Qiu et al. (2022) employed a structural equation model to examine the pathways through which ecosystem services influence human well-being in the context of the SDGs [
17]. Despite these advancements, there remains a gap in quantitative analyses guiding the implementation of SDGs through ecosystem services.
Therefore, this study, which focuses on 288 cities in China, combines global SDGs with China’s MFOZ types, evaluates the SDGs’ current implementation, and uses cluster analysis to dissect SDGs’ zoning types. Based on this, this study explores the influencing factors of the implementation of SDGs from the perspective of ecosystem services and proposes target strategies corresponding to zoning types. The research aims to answer the following three research questions: (1) What is the current status of SDG implementation in relation to MFOZ in different cities? (2) How do different cities’ zoning types impact the implementation of SDGs? (3) What role can ecosystem services play in improving and achieving SDGs? This study could offer a comprehensive significance for integrating spatial planning and ecosystem services into SDG strategies. Highlighting the impact of zoning types and ecosystem services on SDG implementation, it encourages policymakers and urban planners worldwide to adopt tailored, region-specific approaches for sustainable development. The research could contribute significantly to the global sustainable development discourse, demonstrating the potential of innovative spatial planning to enhance SDG initiatives.
2. Materials and Methods
2.1. Study Area
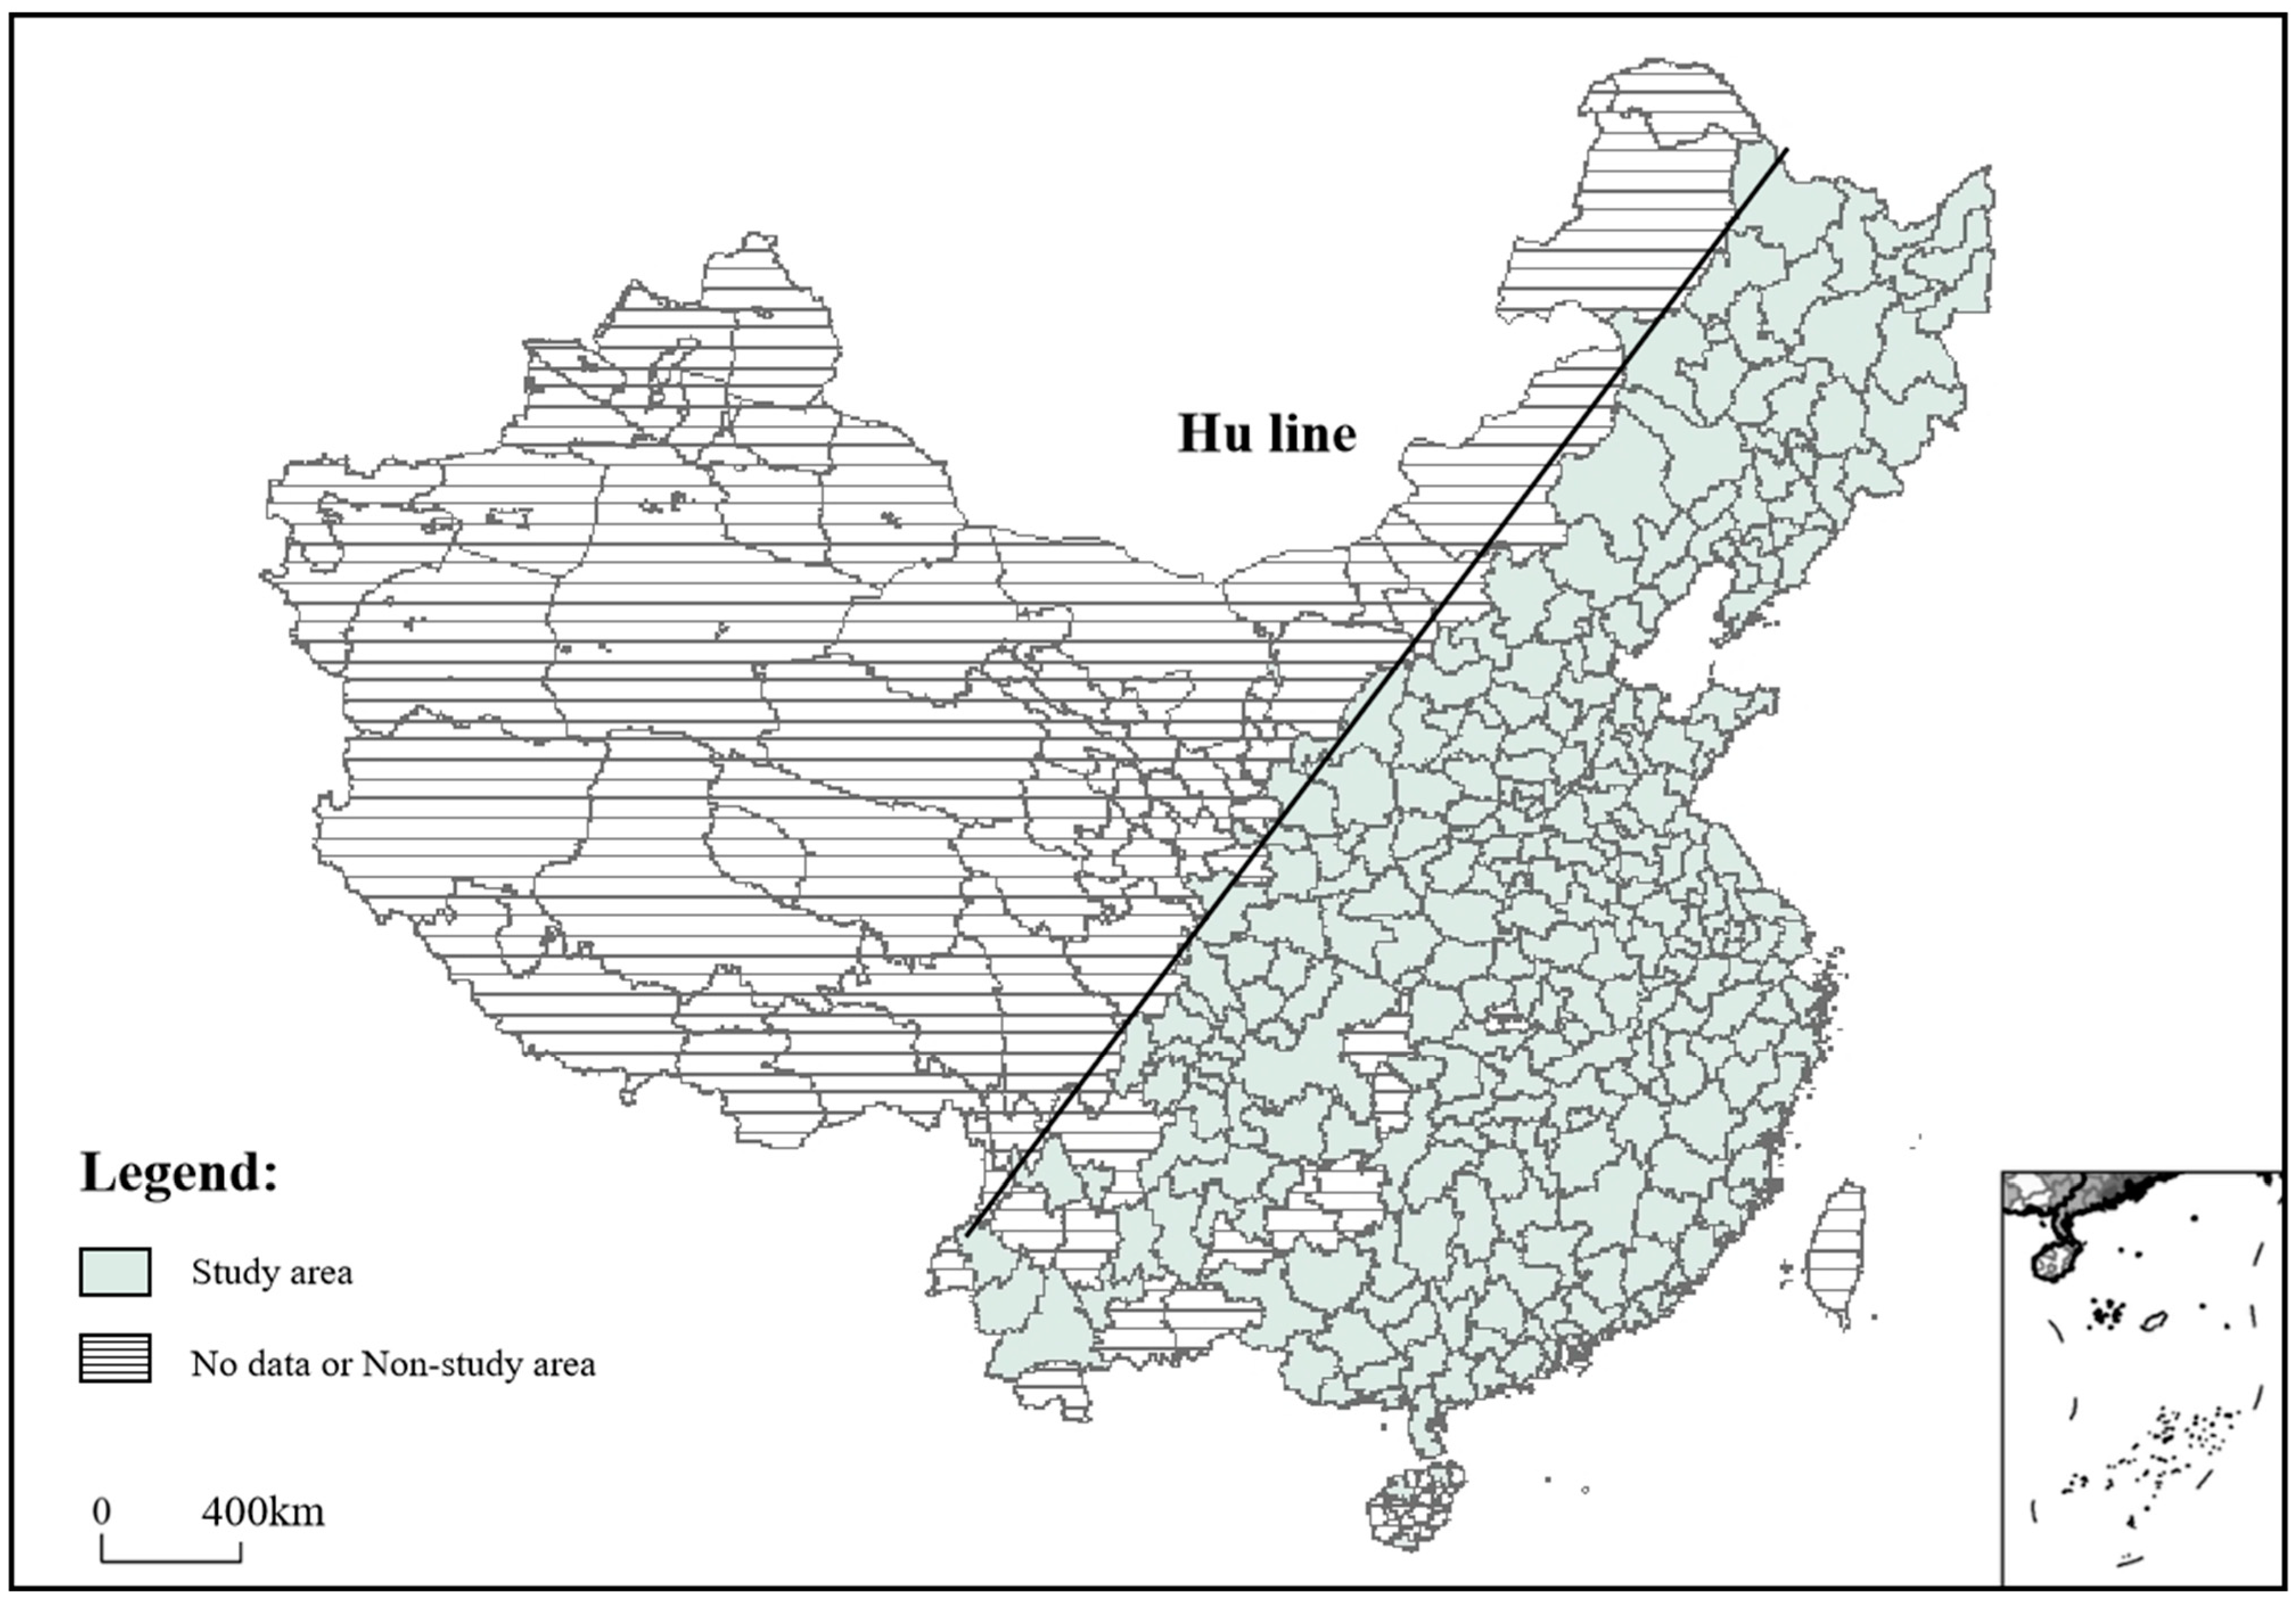
As a geographic and social divider in China, the eastern region of the Hu Line covers 43.4% of the area but contains 93.7% of the population and approximately 95% of the GDP, presenting intense sustainability challenges [
18]. The Hu Line, as an essential part of MFOZ, represents significant sustainability implications. Therefore, this study investigates the implementation of SDGs in 288 Chinese cities, analyzing spatial differentiation and mechanisms through the lens of ecosystem services. The selected cities include four centrally administered municipalities, 15 sub-provincial cities, 16 provincial capitals, and 253 other cities, encompassing a wide range of environmental conditions, population sizes, and GDP performances (
Figure 1) [
19]. This diverse sample, reflective of varying stages of socioeconomic development, offers a comprehensive basis for exploring the spatial dynamics of SDGs and identifying the roles of ecosystem services, and environmental, and economic factors in their achievement.
2.2. Methodology
Focused on 288 cities east of the Hu Line in China, this study aims to integrate the SDGs with MFOZ planning. Through a literature review and descriptive analysis, this study assesses the alignment of SDGs with MFOZ directions and selects five related SDGs, seven targets, and eight indicators. Leveraging cluster analysis and geographical data from ArcGIS, this study categorizes cities into four zoning types based on SDG implementation (
Figure 2). Furthermore, using correlation analysis informed by ecosystem services, socioeconomic conditions, and environmental conditions, this study unravels the pivotal factors influencing SDGs’ implementation. The research culminates in tailored strategies for each zoning type, bridging global sustainability objectives with spatial planning focused on local urban developmental needs for sustainable urban growth in the region.
2.2.1. Conceptual Framework of SDGs for MFOZ
Spatial planning policy is a key tool for achieving the dual goals of optimizing and protecting spatial development. China has proposed the MFOZ, which has three major directions including urbanization, food security, and ecological security. These policies control the development intensity and direction in different regions by delineating important functional areas, thus affecting ecosystem services and SDGs [
20]. Currently, most studies have evaluated cities according to three types of directions from the perspective of economic and social efficiency, but limited studies have yet explored them in the context of the SDGs, especially through ecosystem service methods. Therefore, by evaluating the current development status of all the cities combining the SDGs with the MFOZ, this study can propose a more targeted direction for optimizing the corresponding layouts and, thus, better implementing the SDGs. In addition, previous studies have found that many factors, such as socioeconomic and environmental factors, can affect SDG scores. Given the various environmental, socio-economic characteristics and ecosystem services among local cities, they usually make different trade-offs in the decision-making process and spatial planning toward SDGs. Drawing from prior research [
21,
22], this study constructed a conceptual framework of SDG driving factors comprising environmental, socioeconomic, and ecosystem service conditions.
As for the dependent variable, the researchers review all the indicators, including 17 goals and 169 targets of “United Nations: 2030 Agenda for Sustainable Development”, one of the most widely used SDGs indicators system [
21]. According to previous research [
21,
22], more than 60% of indicators missing rate greater than 50% for individual SDG indicators even on the national scale. Furthermore, the data for SDG 1 (no poverty) are missing (missing rate > 85%), and there are no data for indicators of SDG 13. SDG 16 (peace, justice, and strong institutions) has a missing rate of more than 66%, and SDG 14 was excluded because most Chinese cities do not have marine areas and, resulting in a lack of data for indicators on this SDG. Then, the study conducts a literature review considering SDGs and MFOZ and selects the SDGs aligned with the categorization criteria, development objectives, and regional development policies of MFOZ. Through this two-step process, this study finally selects the eight SDG indicators of five SDGs related to the three major directions of MFOZ, including urbanization-oriented, environment-oriented, and agriculture-oriented directions (refer to
Table 1).
Socioeconomic conditions, such as population growth and economic development, can pressure the realization of the SDGs. For instance, regions experiencing rapid economic growth may face unique challenges in balancing economic objectives with sustainable practices. The local government’s public financial expenditure plays a pivotal role in decisions related to SDG implementation. Areas with substantial public financial expenditure and sustainable infrastructure development capacity are more likely to devise strategies to mitigate the pressures brought about by population and economic growth, ensuring effective SDG achievement.
Environmental conditions profoundly impact the achievement of SDGs. These conditions encompass the city’s ecological and environmental characteristics, including geology, temperature, climate, and water resources. Such natural endowments determine cities’ challenges and opportunities in achieving their SDGs. For instance, regions with intricate geographies or extreme climates might face heightened challenges. Furthermore, the availability of natural resources also influences the feasibility and scope of sustainable initiatives, such as harnessing land and water for sustainable practices.
Ecosystem services play a pivotal role in the successful realization of the SDGs. They deliver many human benefits from ecosystem structure, functions, and processes, encompassing food provision, water purification, climate stabilization, and biodiversity conservation. By adeptly managing ecosystem services, this study can amplify the advantages of natural resources, bolster human well-being, and concurrently reduce the ecological and environmental repercussions associated with achieving the SDGs.
2.2.2. Data Sources and Methodological Approach for SDG Indicators
The scores for each SDG at the city scale are obtained from provincial and municipal statistical yearbooks published by the China Statistics Press in 2020, the “China Urban Statistical Yearbook”, the “China Environmental Statistical Yearbook”, and the Statistical Yearbook of each city [
21]. Except for the pollution treatment rate—which was directly obtained from the statistical yearbook, the formulas for computing other indicators are as follows (
Table 2).
2.2.3. Variable Selection for Ecosystem Service, Environmental and Socio-Economic Factors
Independent variables included Ecosystem Services, environmental, and socioeconomic conditions (refer to
Table 3)
Ecosystem services: this study uses the produce containing the values of 11 ecosystem services, which include food production, raw material production, water supply, gas regulation, climate regulation, environmental purification, hydrological regulation, soil conservation, nutrient cycling, biodiversity, and aesthetic landscape [
23]. The dataset detailing the spatial distribution of ecosystem service value across China is predicated on the remote sensing classification of various national land ecosystem types. Values for different equivalent factors for ecosystem services were adjusted according to national net primary productivity, precipitation, and soil conservation spatial distribution data.
Environmental conditions included DEM, slope, temperature, precipitation, greening coverage rate of the built-up area, maintenance of nutrient cycles, raw material production, and park green space area. DEM and slope data are sourced from the Resource and Environment Science and Data Center (
https://www.resdc.cn, accessed on 2 February 2024) and conducted using GIS, with precipitation and temperature from the National Meteorological Administration of China (
https://data.cma.cn, accessed on 2 February 2024). Land use data of urban parks were sourced from the World Cover Center (
https://esa-worldcover.org/en, accessed on 2 February 2024) with a spatial resolution of 10 m. The data on other factors were obtained from the China City Statistical Yearbook.
Socioeconomic conditions included year-end resident population, GDP, the proportion of tertiary industry in regional GDP, and local general public budget expenditure. The data on these factors were obtained from the China City Statistical Yearbook.
Table 3.
The data source of the variables.
Table 3.
The data source of the variables.
| Factor Types | Index | Unit | Data Source | Reference |
|---|
| Ecosystem Services | Eleven Ecosystem Services | 10,000 Yuan/km2 | https://www.resdc.cn/DOI/DOI.aspx?DOIID=48 (accessed on 2 February 2024) | [24] |
| Socioeconomic condition | Year-end Resident Population | 10,000 people | China City Statistical Yearbook | [25] |
| Regional Gross Domestic Product (GDP) | 100 million RMB | China City Statistical Yearbook | [26] |
| Proportion of Tertiary Industry in Regional GDP | % | China City Statistical Yearbook | [27] |
| Local General Public Budget Expenditure | RMB | China City Statistical Yearbook | [28] |
| Environment condition | DEM | m | Resource and Environment Science and Data Center (https://www.resdc.cn, accessed on 2 February 2024) | [29] |
| Slope | ° | Resource and Environment Science and Data Center (https://www.resdc.cn, accessed on 2 February 2024) | [29] |
| Precipitation | mm | the National Meteorological Administration of China (https://data.cma.cn, accessed on 2 February 2024) | [21] |
| Temperature | °C | the National Meteorological Administration of China (https://data.cma.cn, accessed on 2 February 2024) | [30] |
| Greening Coverage Rate of the Built-up Area | % | https://esa-worldcover.org/en (accessed on 2 February 2024) | [31] |
| Maintenance of Nutrient Cycles | % | China City Statistical Yearbook
China Environmental Statistical Yearbook | [32] |
| Raw Material Production | % | China City Statistical Yearbook
China Environmental Statistical Yearbook | [33] |
| Park Green Space Area | Area (hm2) | https://esa-worldcover.org/en (accessed on 2 February 2024) | [31] |
2.2.4. Cluster Analysis of SDGs Using the Two-Step Clustering
This study first explored the SDG levels of various cities by clustering them based on the set of SDGs indicators. A two-step cluster is an unsupervised machine-learning algorithm known for automatically determining the number of clusters based on the data. One of its main advantages is its capability to handle continuous and categorical variables, making it versatile in dealing with diverse datasets. Additionally, the method does not require the pre-specification of the number of clusters. This method was widely used in Ecosystem research [
34]. By employing the Two-step clustering technique on multiple continuous variables, this study captured the nuanced relationships and interdependencies among the indicators, enabling a more informed and structured data segmentation.
The two steps included the following: (1) Pre-clustering: Initially, the dataset is sieved into numerous “mini-clusters” or pre-clusters using Mahalanobis distance. This initial segmentation is an attempt to reduce the computational demand of large datasets. (2) Hierarchical Clustering: the sub-clusters are hierarchically merged based on the log-likelihood distance. The optimal number of clusters is determined through the Schwarz Bayesian Criterion (BIC), guiding the determination of the most suitable cluster count. This study implemented the model in the SPSS 22.0 software.
The results from the Two-step clustering were then integrated with GIS to provide a spatial visualization, enhancing the clarity and context of the findings [
35]. This study visualized the location of clusters and their regions to represent geographical patterns and associations of how the SDGs level is distributed in China.
2.2.5. Correlation Analysis for Influencing Factors of SDGs
Correlation analysis is widely used for studying the potential relationship among different variables. Its adaptability allows for analysis across a broad spectrum of research questions, especially with multiple predictors and outcomes, as in this study. One of the standout advantages of correlation analysis is its ability to handle multiple independent and dependent variables concurrently. Furthermore, correlation analysis does not just indicate whether a relationship exists and how strong and in which direction that relationship might be. The model was implemented in the Pycharm 2022.3 software for this study.
3. Results
3.1. Assessment of SDG Implementation Status
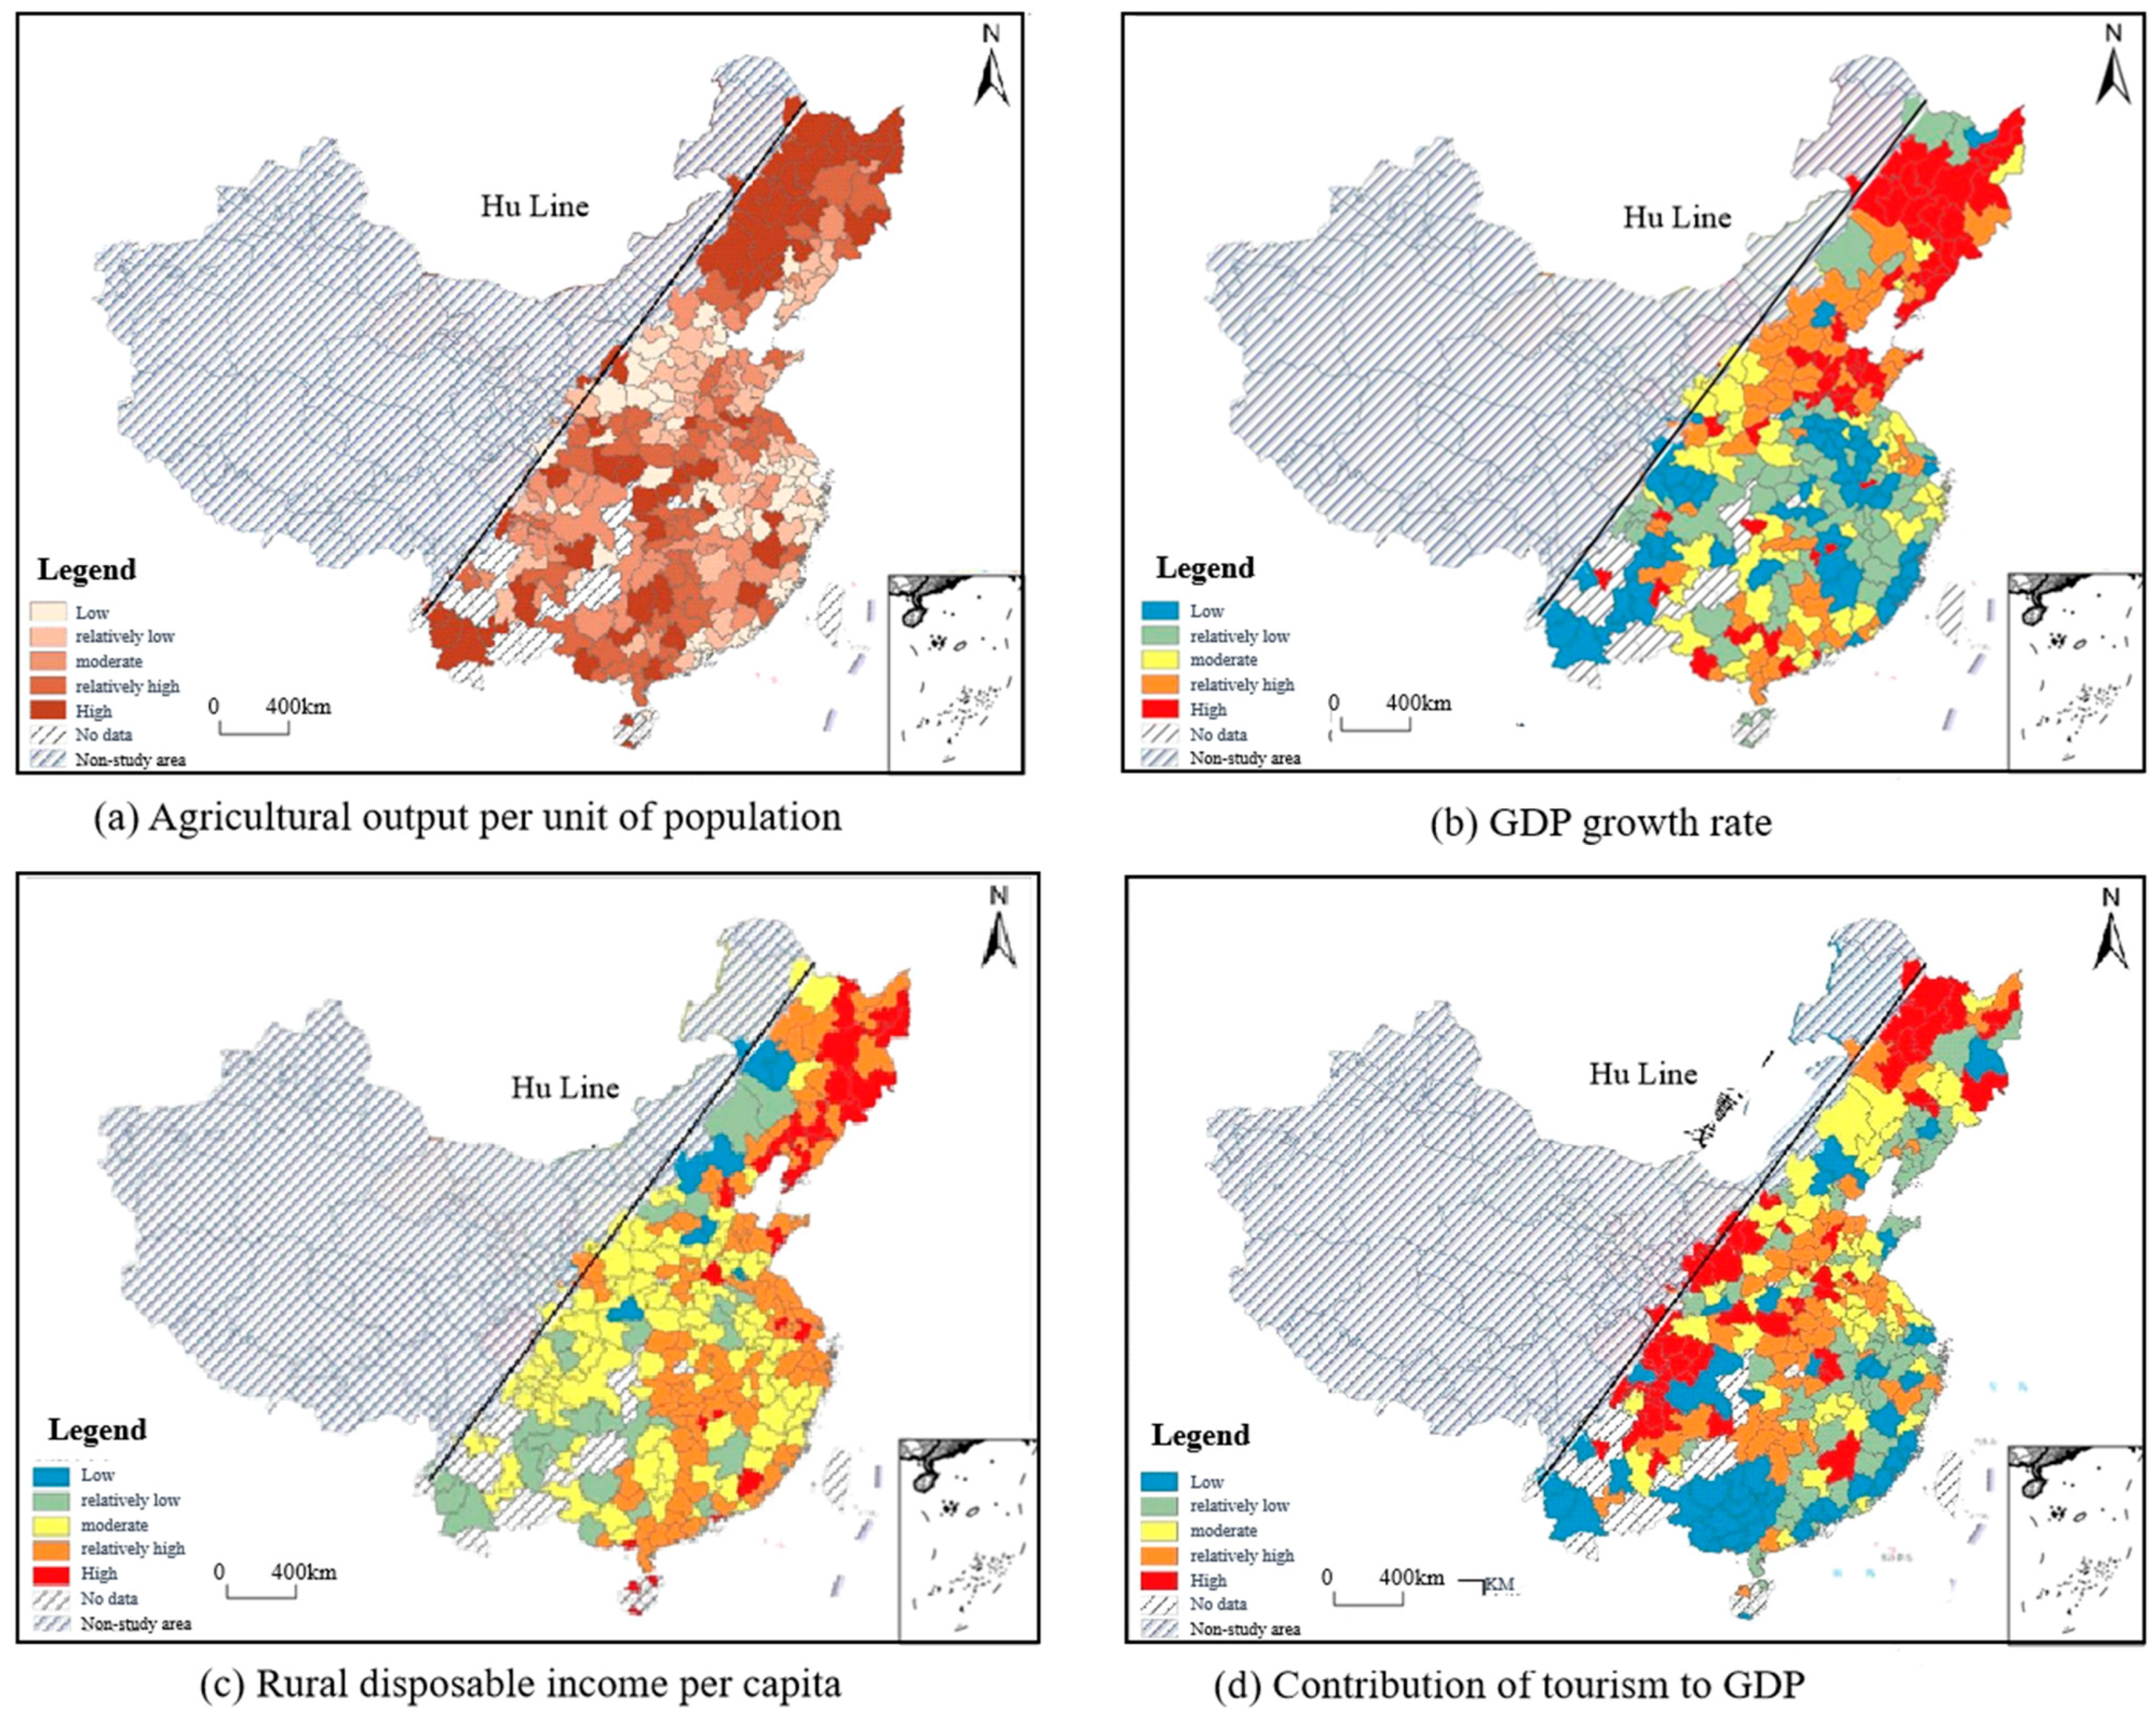
As for the SDG indicators related to agricultural productions, agricultural development is notably strong in the northeast cities and the northwest cities, but features a slightly subdued agriculture sector in southeastern cities (refer to
Figure 3). When focusing on agricultural development (
Figure 3a), it is clear that northeastern Inner Mongolia, northern Heilongjiang, northern Jilin, and northern Liaoning Province lead the pack, primarily due to their inherent natural resources. On the opposite end, urban agglomerations in Beijing-Tianjin-Hebei, the Yangtze River Delta, and the Pearl River Delta showcase the weakest agricultural development due to their high urbanization levels and intensive land development.
As for the SDG indicators related to urbanization, in terms of economic advancement, southern cities are accelerating at a brisk pace. The rural disposable income in the southeast outpaces the southwest, while northern cities lag in economic growth and exhibit the lowest rural disposable income. Focusing on GDP growth (
Figure 3b), cities in Fujian, Zhejiang, Jiangxi, and Anhui provinces demonstrate robust economic expansion. In contrast, cities in northwestern Gansu, western Inner Mongolia, most of Shandong, and the northeastern provinces lag, likely due to location and industry considerations. As for rural per capita disposable income (
Figure 3c), the cities of Heilongjiang, Jilin, and Liaoning provinces are at the bottom, while cities in Inner Mongolia, Sichuan, and Yunnan provinces rise to the top.
At the same time, tourism development in southeastern and northwest cities is notably vigorous, while Northeastern cities exhibit the weakest tourism industry (
Figure 3d). In specific, the highest levels of development are found in western Inner Mongolia, Yunnan, Guangxi, Guangdong, and Fujian provinces due to their rich natural resources. However, cities in Sichuan, eastern Gansu, and Shaanxi exhibit the weakest tourism development.
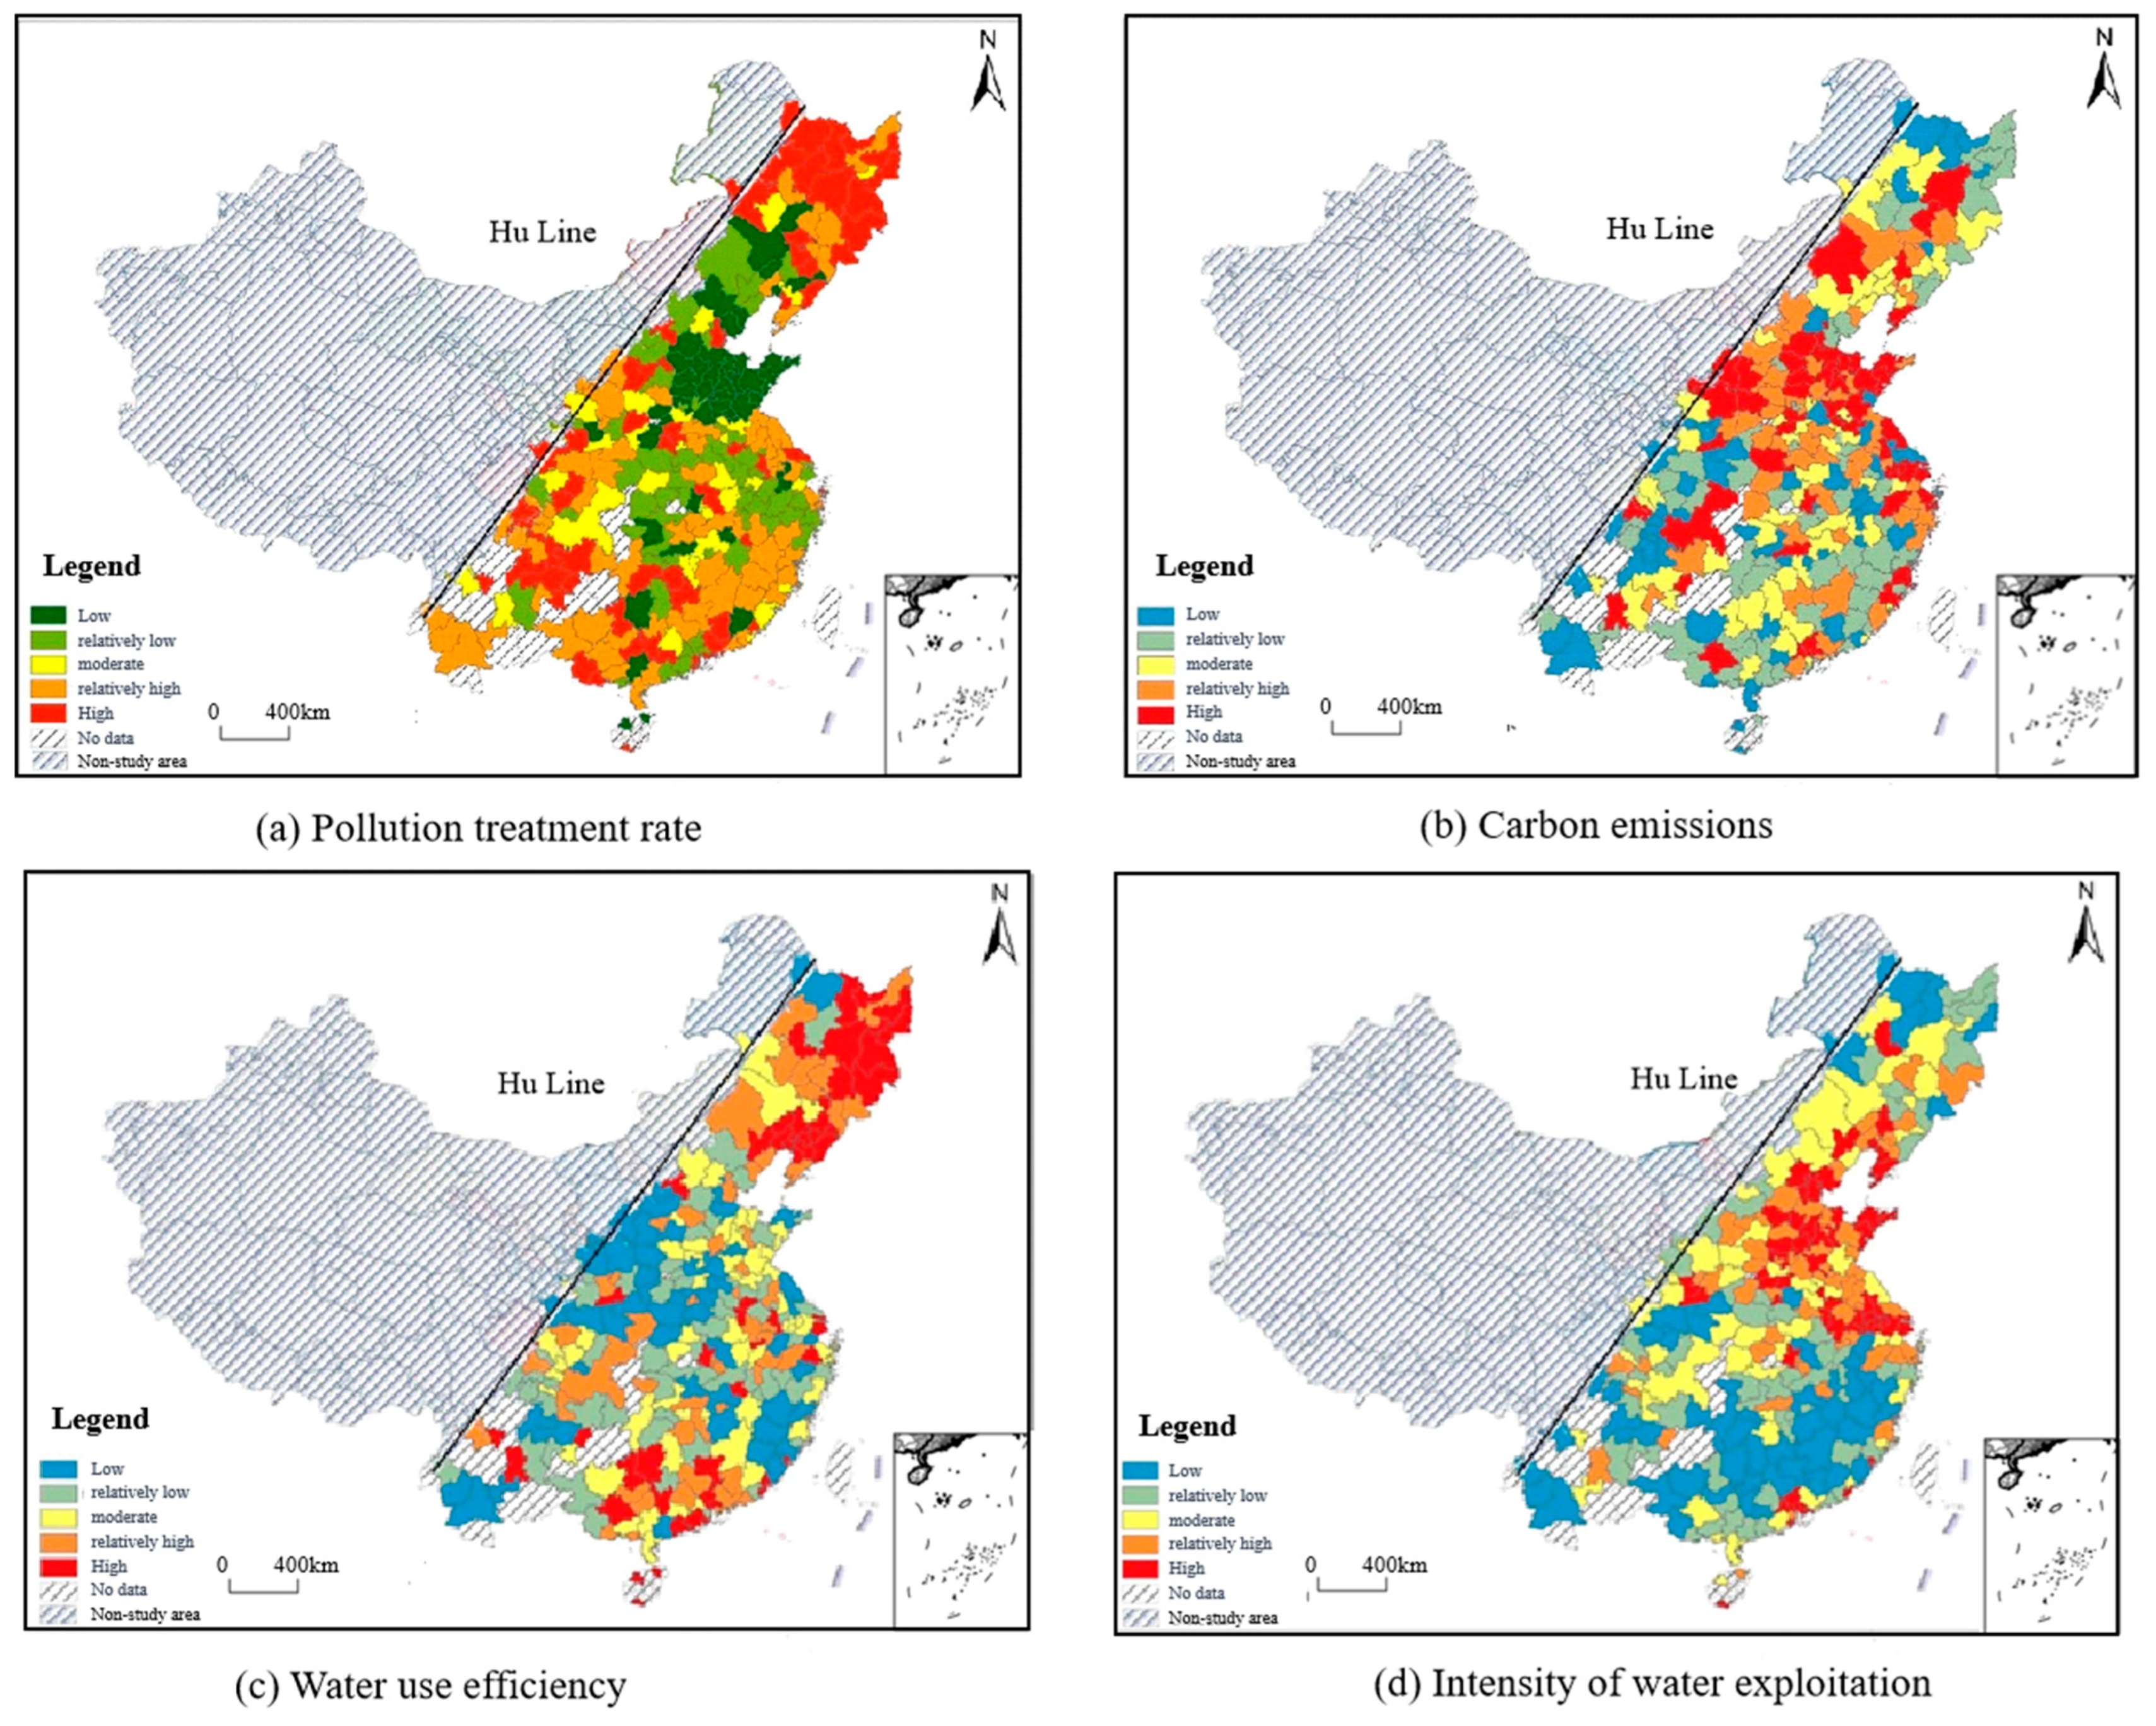
Regarding the SDGs indicators related to ecological functions, cities in the north exhibit the highest pollution treatment rates, followed by cities in the southeastern coastal regions, while cities in the northeast and southwest have the lowest rates. Conversely, the trend in carbon emissions is exactly the opposite. Despite their higher pollution treatment rates (
Figure 4a), northern cities are burdened by significant carbon emissions (
Figure 4b). On the other hand, northeast and southwest cities, despite lower pollution treatment rates, contribute less to carbon emissions. The southeast coastal areas sit in the middle with a moderate pollution treatment rate, yet higher carbon emissions. Specifically, Gansu, western Inner Mongolia, Hebei, and Shandong provinces excel in pollution treatment rates, while eastern Inner Mongolia, Heilongjiang, and Jilin provinces fall behind. Carbon emissions are lowest in northeastern Inner Mongolia and northwestern Heilongjiang, whereas northwestern Shaanxi, Hebei, Shandong, Shanghai, and Guangdong provinces grapple with higher emissions due to urbanization and industry pressure.
At the same time, northern cities show high water use intensity and low efficiency, while southern cities exhibit low intensity but higher efficiency, with northeast cities being the most efficient. Northern cities hold the highest intensity and lowest efficiency of water resource utilization. Northeast cities hold a medium level of water use intensity but their efficiency is the highest. Most southern cities display the lowest intensity but higher efficiency of water resource utilization. In specific, cities including Heilongjiang, Inner Mongolia, Shaanxi, and Shanxi provinces exhibit high water use intensity (
Figure 4c), likely due to agricultural demand. Meanwhile, eastern Heilongjiang, Jilin, Liaoning, and northern Sichuan provinces display lower water use intensity. With regard to water use efficiency (
Figure 4d), northern Sichuan, Yunnan, western Guangxi, Hunan, Jiangxi, northeastern Fujian, and western Zhejiang provinces lag, while Hebei, Shandong, northeastern Henan, and western Liaoning provinces lead the way, though improvements are necessary moving forward.
3.2. Spatial Zoning According to SDGs Implementation Status
According to the cluster analysis, SDG scores can be divided into four zoning types to facilitate targeted, effective strategies (refer to
Figure 5), including mixed-oriented with high consumption and output (24.3%), non-agriculture-oriented with low consumption and high output (12.5%), agriculture-oriented with low consumption and output (55.9%), and agriculture-oriented with high consumption and output (7.3%) cities.
Agriculture-oriented cities with low consumption of ecological resources and low output of agriculture production and urbanization comprise 55.9%. Mostly located in northeastern, northern, and southern parts of eastern China, including cities such as Jilin, Siping, Tonghua, and Tieling (
Table 4), these cities have the lowest water use efficiency (376.81), lowest carbon emissions (18.90), and high agricultural output (10,014.84). However, their GDP growth rate is the lowest (4.85%) due to a predominance of the traditional agricultural industry. While reduced resource consumption in ecological resources results from low-intensity development, these areas exhibit slow economic and social progress. Notably, a few provincial capitals, such as Harbin, are categorized as this type. Although urbanization is rapid in northeastern China, the tertiary sector, such as tourism, contributes limitedly to the GDP, while the primary sector maintains a relatively high level.
Cities characterized by mixed orientation with high consumption of ecological resources and high output of agriculture production and urbanization, constitute 24.3% of the total. These cities, including Ningbo, Tai’an, Wuxi, and Dalian, are primarily located in the central and eastern regions of China. They exhibit multi-industry development with relatively high agricultural (6941.50) and tourism outputs (0.25%), alongside robust GDP growth rates (5.21%). High resource consumption of ecological resources in these areas, evident in substantial carbon emissions (43.75), intense water exploitation (48.42%), and low water efficiency (1233.55), results in substantial pressure on sustainability goals despite the overall high economic and social output. It is noteworthy that the research findings categorize Hangzhou, a sub-provincial city, into this group, primarily attributable to its relatively high resource consumption and comparatively low tourism contribution, especially when compared with other non-agricultural cities.
Non-agriculture cities demonstrating low consumption and high output represent 12.5% of the total. These are generally concentrated in provincial capitals or economically developed areas, such as Beijing, Shanghai, Guangzhou, Chongqing, and Tianjin. Their main characteristics include lowest agricultural output (6683.09), highest tourism outputs (3.67%), and GDP growth (6.21%), suggesting low agricultural development but high GDP growth from tourism and other industries. These cities thrive economically and maintain the low intensity of water exploitation (17.30%) and high water use efficiency (2272.95), representing an effective approach to realizing the SDGs. The lowest pollution treatment rate (76.06%) and relatively low carbon emissions (38.64) signify areas necessitating optimization in the future for this type of city.
Agriculture-oriented cities with high consumption and high output account for 7.3% of the total. Zaozhuang, Heze, and Hanzhong are typical examples within this cluster. These cities are dominated by the traditional agricultural industry (Rural disposable income per capita: 12,161.35), and consume substantial natural resources. Despite low carbon emissions (23.05), these cities feature intensive water resource development (36.26%) and low water use efficiency (598.86), coupled with high GDP growth rates (5.65%). They could be suitable for economic and social development in agricultural areas, provided they prioritize the implementation of SDGs.
3.3. Influencing Factors of SDGs from the Perspective of Ecosystem Services
The research findings (
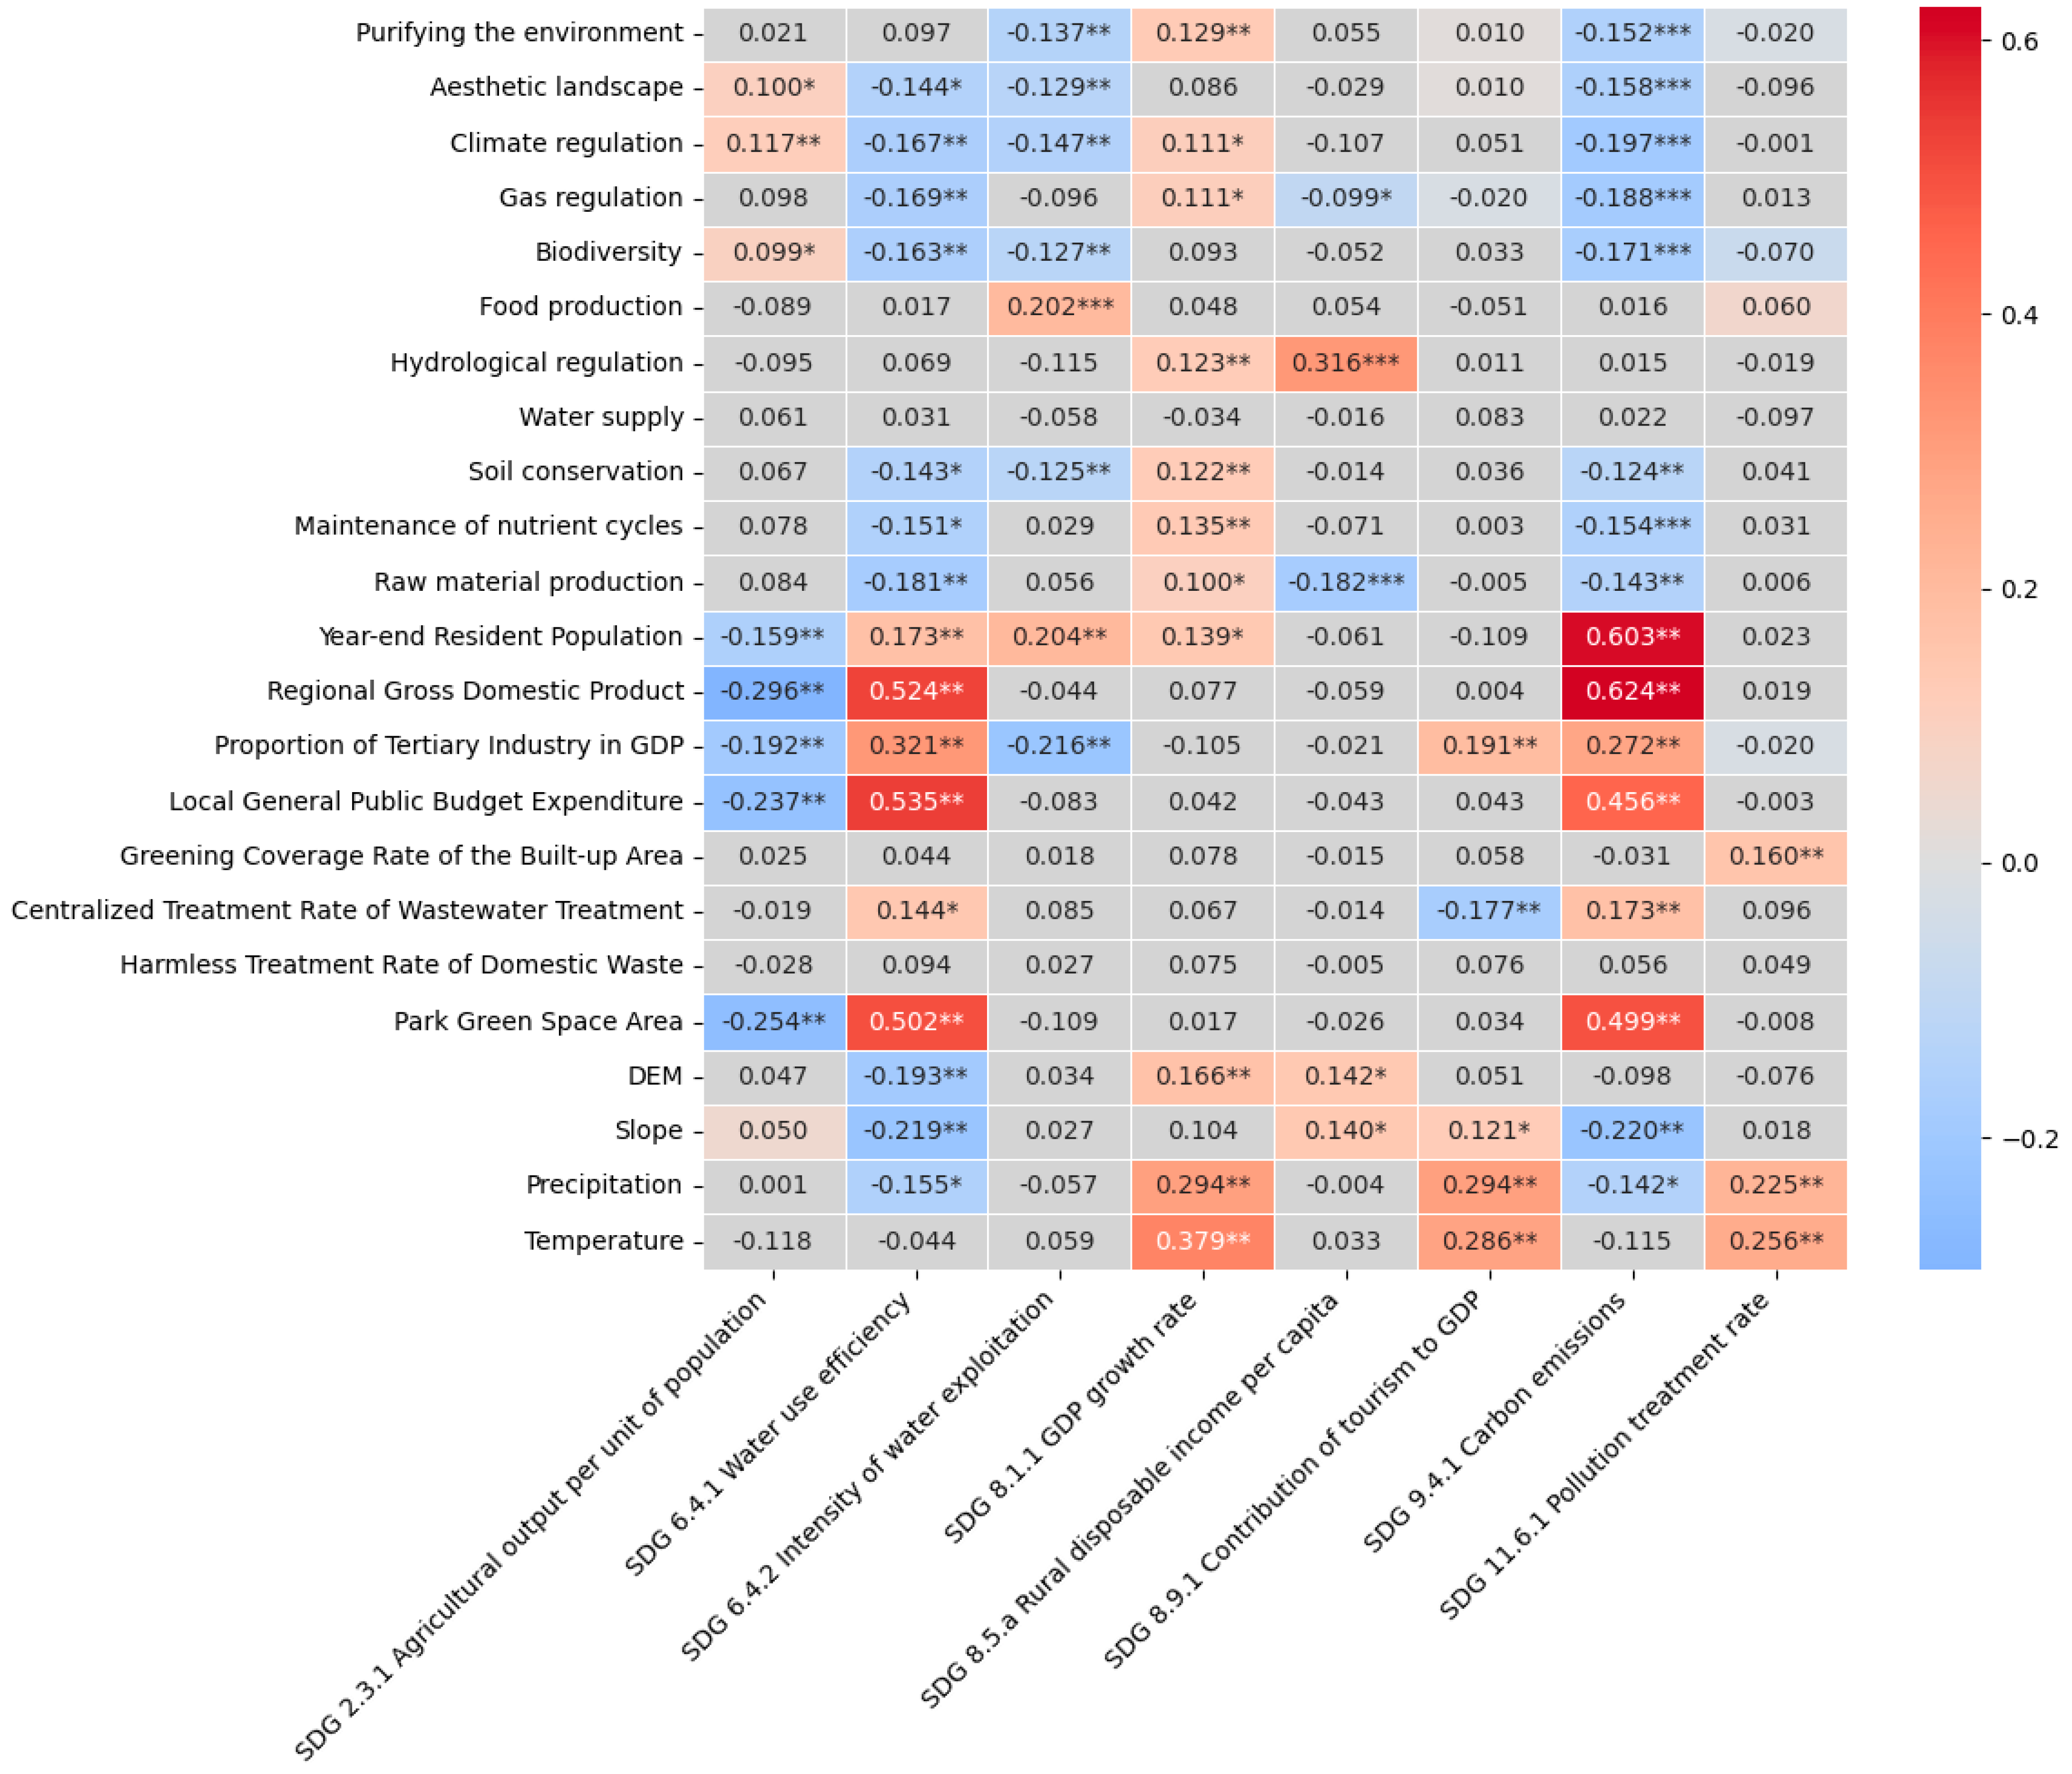
Figure 6) indicate that population and agriculture development amplified the intensity of water exploitation, while developing the tertiary industry and six types of ecosystem services could modulate it. Specifically, for the economic indicators, the year-end resident population exhibits a positive correlation with the intensity of water resource development (0.204), while the proportion of tertiary industry in GDP demonstrates a negative correlation (−0.216). Further, the influence of food production on water resource development intensity is positively correlated. Moreover, ecosystem services, including environmental purification, aesthetic landscaping, climate regulation, biodiversity, and soil conservation, generally correlate negatively with the intensity of water resource development. Such services could act as mitigating agents against excessive water resource exploitation, reducing the likelihood of encountering water resource challenges.
In addition, the results show that economic and environmental indicators have a positive effect on the efficiency of water use, while seven types of ecosystem services diminish water use efficiency. Specifically, economic indicators, such as year-end resident population (0.173), GDP (0.524), the proportion of tertiary industry in GDP (0.321), and local general public budget expenditure (0.535), are found to amplify water use efficiency. Environmental indicators, namely centralized treatment rate of wastewater treatment plants (0.144) and park green space area (0.502), also have a negative effect on water use efficiency. However, ecosystem services, including aesthetic landscape, climate regulation, gas regulation, and biodiversity, reduce water resource efficiency.
For urban areas emanating high carbon emissions, particularly those of high consumption types, ecosystem services can potentially mitigate carbon emissions and decelerate the trend of global warming. Despite economic growth significantly increasing carbon emissions, eight types of ecosystem services play a pivotal role in reducing such emissions, and environmental indicators have a limited mitigating effect. In particular, the economic variables, namely year-end resident population (0.603), GDP (0.624), the proportion of tertiary industry in GDP (0.272), and local general public budget expenditure (0.456), exhibit a positive correlation with carbon emissions, while all environmental variables either have no effect or intensify carbon emissions. Ecosystem services, including environmental purification, landscape aesthetics, climate regulation, biodiversity, food production, and soil conservation, are pivotal in carbon emissions. These findings suggest that regions undergoing economic development might confront escalating emissions unless ecosystem services are ardently amplified and exploited.
Seven ecosystem services, such as environmental purification, hydrological regulation, etc., are positively correlated with GDP growth rates, but most other economic and environmental indicators, except for demographic growth, do not show a significant effect. Specifically, ecosystem services such as environmental purification, hydrological regulation, soil conservation, and nutrient cycle maintenance positively correlate with GDP growth rate, indicating that areas with higher levels of these services have faster GDP growth rates. Except for demographic growth (0.139), other environmental and economic variables do not significantly impact the GDP growth rate. This finding suggests that areas with low output could enhance natural resources to improve the sustainable provisions of these ecosystem services. Aesthetic landscape, climate regulation, gas regulation, food production, water supply, and raw material production do not pass the significance test, indicating that these ecosystem services have not been effectively utilized to increase the GDP growth rate and improve residents’ economic and social living standards.
All the economic indicators and three ecosystem services positively correlate with agricultural output per population unit. Specifically, the year-end resident population (−0.159), GDP (−0.296), proportion of tertiary industry in GDP −0.192), and local general public budget expenditure (−0.237) demonstrate a positive correlation with agricultural output per unit of population. Concurrently, ecosystem services such as climate regulation, biodiversity, and aesthetic landscape positively correlate with agricultural output per population unit. In addition, gas regulation and hydrological regulation are positively correlated with the income of rural residents, implying that an ascension in the level of these two ecosystem services correlates with an increment in per capita disposable income, subsequently stimulating the economic status of residents.
4. Discussion
This study crafted a unique sustainability blueprint by deftly combining global SDGs with China’s distinct MFOZ typologies at various scales. This provides an innovative way to integrate SDGs into decision-making processes through spatial planning. This integration promotes the adaptability and applicability of global sustainability benchmarks in localized contexts, emphasizing the importance of such coordinated approaches in today’s interconnected world.
The research introduced an innovative methodology that includes a rigorous assessment of current SDG trajectories as well as cluster analysis. This methodological ensemble provides a robust evaluation of SDGs within the studied region and serves as a versatile template for other regions, globally, seeking to assess and improve their sustainability pathways.
One of the hallmarks of this study is its intricate exploration of the interrelationships between economic indicators, environmental characteristics, and ecosystem services. Such a comprehensive approach promotes a deeper understanding of the multifaceted dynamics influencing sustainable development and highlights the pivotal role of ecosystem services as levers in advancing SDGs. This framework provides a blueprint to improve the operability and feasibility of achieving SDGs through these indicators for local governments in other countries.
By spotlighting unique challenges and opportunities inherent in SDG realization, it offers policymakers a treasure trove of insights. More importantly, the research equips decision-makers with actionable recommendations, ensuring that urban planning not only aligns with sustainability benchmarks but also resonates with the ground realities of the region.
4.1. Harmonizing SDGs and Spatial Planning for Sustainable Urban Development
Integrating the aspirations of SDGs with spatial planning paves the way for mainstreaming SDGs into decision-making processes. By amalgamating SDGs’ holistic perspective with the applicability and mandatory spatial planning, cities are encouraged with a comprehensive yet nimble, toolkit to mitigate developmental dilemmas, thus ensuring that urban growth narratives are both prosperous and sustainable [
36]. The zoning derived from the research grounded in SDGs offers a lens to appraise and potentially recalibrate the spatial planning typologies critically. For instance, cities characterized as mixed-oriented with high consumption and output could be further nuanced in their MFOZ categorization to ensure that their accelerated economic trajectories do not inadvertently compromise ecological and societal objectives [
37]. By acting as a dynamic feedback mechanism, such data-driven insights empower MFOZ frameworks to be more agile, pivoting and responding to the ever-evolving urban landscapes. In addition, by providing a city’s consumption-output matrix, we can directly provide the city-oriented status by major theme functional areas and propose precise strategies. Urban areas often show a unique balance of high productivity and low consumption, especially in non-agricultural sectors, suggesting a model of economic efficiency and careful use of resources. By analyzing these patterns, we can develop strategies that leverage cities’ specific strengths and weaknesses. This approach helps create urban plans that harmonize economic growth with sustainability, proving that these goals can complement each other.
The sustainable development assessment model applied in this study serves as an effective tool for policy implementation, offering a fresh perspective compared to previous approaches like weighing assignment methods, Multiple-Attribute models, and Discriminant Analysis used in sustainable development evaluations. These methods often require decision-makers to subjectively weight indicators, which may lead to biased outcomes. Moreover, such approaches typically necessitate predefined categorization, establishing criteria for each indicator’s category in advance, which may lack flexibility when dealing with continuous sustainable development indicators. Based on the unsupervised algorithms of cluster analysis, this study further extracts classifications on the regional scale to provide a reference. Cluster analysis does not require the predefined categorization of groups and can automatically identify groupings based on the inherent structure of the data, demonstrating strong adaptability [
38,
39]. Furthermore, it does not rely on the subjective weighting of indicators, thereby reducing bias in the evaluation results [
38,
39]. As the necessity of bespoke policies for SDG realization [
40], the variety of zones, including mixed-use areas with high consumption and output, non-agricultural zones with low consumption but high output, and agricultural cities with low consumption and output, highlight the significance of applying the cluster analysis algorithms local contexts in achieving SDGs [
41].
In mixed-oriented cities with both high consumption and high output, as outlined in the MFOZ planning, there’s a strategic aim to balance urban and agricultural roles. These cities’ diversified industrial base and rapid economic expansion spotlight the critical need to focus on sustainable resource use to achieve the SDGs. Given their considerable resource consumption and carbon emissions, implementing pollution control measures, enhancing resource management technologies, and investing in renewable energy, waste management, and sustainable agriculture become imperative. These efforts are essential to optimizing resource output efficiency and leveraging ecosystem services, thereby promoting a sustainable and resilient urban environment. Non-agricultural development cities with low consumption and high output are expected to have stronger economic and population agglomeration capabilities. These cities are characterized by their dependence on the tourism industry and high GDP growth rates. Here, strategies should focus on promoting sustainable tourism that respects and enhances local cultures, economies, and environments. The governments of these areas should also invest in eco-friendly infrastructure and improve services and facilities for the residents and tourists.
According to MFOZ planning, agriculture-oriented cities are tasked with safeguarding farmland and ensuring the continuity of agricultural production. This approach underscores the importance of ecosystem services and the need for an industrial transformation that bridges agriculture with other sectors, enhancing both resource consumption and output efficiency. For cities characterized by low consumption and low output, strategies should aim at revitalizing rural communities and boosting agricultural productivity. This enhancement can be realized through the adoption of modern agricultural technologies, improving market access, and offering better support to farmers. Promoting sustainable farming practices is crucial to reduce agriculture’s ecological impact.
In contrast, for agriculture-oriented cities with high consumption and high output, the focus should shift towards increasing agricultural productivity in a resource-efficient manner. This objective can be met by implementing precision agriculture techniques, conserving water and soil resources, and encouraging carbon-neutral farming practices. Such measures not only aim at sustaining high productivity levels but also ensure that agricultural practices are environmentally sustainable and aligned with global efforts to combat climate change and promote sustainability.
4.2. Evaluating the Synergies between Ecosystem Services and SDGs
The analysis underscores the complex interrelationships between ecosystem services and SDGs. We found that enhancing ecosystem services could significantly contribute to achieving multiple SDGs related to water resources sustainability, reduction in carbon emissions, economic growth, and increasing rural residents’ income.
The findings reveal the critical role of ecosystem services in achieving water resource sustainability and decreasing carbon emissions. Thus, enhancing these services is crucial for environmental sustainability [
33]. The identified correlations between ecosystem services and SDGs align with a body of the literature underscoring the essential role of ecosystem services for sustainable development [
42,
43,
44]. The impact of services like environmental purification, aesthetic landscapes, climate regulation, and biodiversity on carbon emission reduction corroborates the view that these ecosystem services are key to global carbon sequestration efforts [
42]. These services can, on one hand, directly or indirectly enhance the supply of water resources, and on the other hand, reduce resource consumption, thereby decreasing water utilization and carbon emissions. For example, soil conservation could contribute to improving water retention, and increase soil carbon storage, contributing to reduced water use and lower carbon emissions. Well-maintained natural landscapes can reduce the need for engineered solutions for recreation and mental health, which are often more resource-intensive [
43]. Environmental purification reduces water exploitation and carbon emissions through plants absorbing CO
2 and natural water filtration. This body of evidence reinforces the argument that effective management and enhancement of ecosystem services are essential strategies for achieving sustainability goals [
42].
On the other hand, our results indicate that ecosystem services could contribute to the GDP growth rate. This suggests that these services, such as environmental purification, hydrological regulation, soil conservation, and nutrient cycle maintenance, if managed well, can stimulate economic growth and improve the social well-being of residents. These results also highlight the potential of ecosystem services to stimulate economic growth. The natural processes, by maintaining the health and sustainability of the environment, can enhance economic productivity and stability, potentially leading to an increase in the overall economic growth rate. This could be through various mechanisms such as reducing costs associated with water treatment, preventing soil erosion that could damage agricultural productivity, or ensuring water availability for industrial and agricultural use. The positive correlation between hydrological regulation and the income of rural residents is in line with the study by Kronenberg & Fuchs (2021), suggesting that hydrological services can significantly contribute to rural livelihoods and income [
16]. By providing a robust framework for assessing the impacts of different ecosystem services on SDGs, the study reinforces their argument and provides a practical approach to leveraging ecosystem services to realize SDGs.
The results indicate that ecosystem services currently did not contribute to improving rural incomes. This may be because certain ecosystem services are underutilized in boosting residents’ income and regional economic development, highlighting the necessity for specific strategies to exploit these services for sustainable growth. This observation aligns with the existing literature, previous studies pointed out that despite abundant ecosystem services, their potential for driving economic and social development and enhancing income is not effectively used [
45]. Therefore, it is urgent to have a deeper comprehension of the utilization of the value of these ecosystem services, and integrating this understanding into policy and decision-making is crucial for sustainable development [
46].
4.3. Interplay of Socio-Economic and Environmental Development with Ecosystem Services
The results indicate that agriculture development brings challenges to SDGs by utilizing natural resources, especially water resources, highlighting the potential of ecosystem services and industry transformations. Agriculture-oriented cities, which are the largest number of cities according to the results, have long faced water scarcity issues. The findings suggest a direct relationship between increased food production in agriculture-focused regions and heightened water resource development intensity. This may be because of inefficient water usage methods, like traditional farming methodologies, which could lead to suboptimal agricultural outputs [
47]. The results indicate that the growth of the Tertiary Industry and various ecosystem services, however, offer counterbalances to this trend. These factors introduce alternative avenues for economic growth and environmental sustainability that do not heavily rely on water resources, thereby offering potential solutions to the water scarcity challenges faced by agriculture-oriented cities. For instance, diversifying agricultural activities emphasizing sustainable ventures like agro-tourism can provide alternate income sources, reducing the pressure on water resources [
48].
This study also found that focusing solely on numerical values of SDGs, such as water efficiency, may harm ecosystem services and go against sustainable development. The results show that the assiduous enhancement of water use efficiency, driven by economic growth and water usage, can militate against the quality and provision of certain ecosystem services. This may be because focusing solely on water efficiency metrics can lead to water usage exceeding the sustainable supply capacity of ecosystem services even with high water use efficiency. Recent research has underscored that while initiatives to augment water use efficiency have surged, primarily propelled by economic growth and stringent environmental management measures, they do not always culminate in desired environmental outcomes [
49]. A zealous pursuit of water efficiency might sometimes be at odds with the broader objective of ecosystem sustainability. This shifts the focal point from mere efficiency to effective water governance. It should ensure that increased efficiency does not undermine the intrinsic value and services provided by ecosystems.
Furthermore, compared to the quantity of urban ecological spaces, the function through the ecosystem services contributes to the SDGs. The research results show that environmental indicators such as park area and green space rate have a limited effect on the SDGs, while the ecosystem services formed through these ecological spaces are beneficial to the SDGs. Traditional environmental measures, such as increasing green space areas, while beneficial, may have limited effects. These approaches usually emphasize the size of areas like parks, without adequately considering their ecological roles. This oversight can lead to a limited contribution towards SDGs, as merely expanding green areas without enhancing their ecosystem functions might not yield significant environmental benefits. In contrast, a functional urban ecosystem can offer many services, from stormwater management and temperature regulation to promoting biodiversity and offering recreational spaces [
43,
50]. These spaces play a pivotal role in aligning urban development with SDGs. For cities aiming to achieve these SDGs, the emphasis should be moved from merely increasing the quantity of green spaces to enhancing their quality and functionality.
Socio-economic development during urbanization could lead to the degrader of SDGs, ecosystem services can serve as powerful levers while traditional environmental measures have limited effects. Socio-economic development accompanying urbanization can negatively impact SDGs, such as those related to water usage and carbon emissions, by increasing demand and degrading natural resources. Ecosystem services harness the inherent capabilities of natural systems to provide essential services that benefit society, the economy, and the environment. These services can improve urban resilience, enhance biodiversity, and contribute to the well-being of urban populations while promoting sustainability.
5. Conclusions
In the context of China’s MFOZ typologies, this provides an innovative way to integrate SDGs into decision-making processes through spatial planning. Based on 288 cities to the east of the Hu Line, this research innovatively includes a rigorous assessment of current SDG trajectories through cluster analysis for decision-making and policy strategies by the governor and planner on different scales. By building an indicator framework including ecosystem services, and socioeconomic and ecological aspects, this study provides a robust way of achieving SDGs within the studied region and serves as a versatile template for other regions globally.
As for the SDG evaluation, agricultural development is notably strong in the northeast cities and the northwest cities, but features a slightly subdued agriculture sector in southeastern cities. As for the SDG indicators related to urbanization, in terms of economic advancement, southern cities are accelerating at a brisk pace. The rural disposable income in the southeast outpaces the southwest, while northern cities lag in economic growth and exhibit the lowest rural disposable income. At the same time, tourism development in southeastern and northwest cities is notably vigorous, while northeastern cities exhibit the weakest tourism industry. Regarding the SDGs indicators related to ecological functions, cities in the north exhibit the highest pollution treatment rates, followed by cities in the southeastern coastal regions, while cities in the northeast and southwest have the lowest rates. Conversely, the trend in carbon emissions is exactly the opposite.
The study identified four zoning types based on the implementation status of SDGs, including mixed-oriented with high consumption and output, non-agriculture-oriented with low consumption and high output, agriculture-oriented with low consumption and output, and agriculture-oriented with high consumption and output cities. Agriculture-oriented cities with low consumption and low output comprise 55.9%. These cities have the lowest water use efficiency (376.81), lowest carbon emissions (18.90), and high agricultural output (10,014.84). However, their GDP growth rate is the lowest (4.85%) due to a predominance of the traditional agricultural industry. Cities characterized by mixed-orientation with high consumption and high output, constitute 24.3% of the total. They exhibit multi-industry development with relatively high agricultural (6941.50) and tourism outputs (0.25%), alongside robust GDP growth rates (5.21%). These areas also have high resource consumption substantial carbon emissions (43.75), intense water exploitation (48.42%), and low water efficiency (1233.55). Non-agriculture cities demonstrating low consumption and high output represent 12.5% of the total. Their main characteristics include low agricultural development (6683.09) but high GDP growth (6.21%) from tourism (3.67%) and other industries, maintaining low intensity of water exploitation (17.30%), and high water use efficiency (2272.95). Agriculture-oriented cities with high consumption and high output account for 7.3% of the total. These cities are dominated by traditional agricultural industry (Rural disposable income per capita: 12,161.35). Despite low carbon emissions (23.05), these cities feature intensive water resource development (36.26%) and low water use efficiency (598.86), coupled with high GDP growth rates (5.65%). This nuanced classification accentuates the heterogeneity of urban trajectories and underscores the importance of tailoring strategies to each city type’s characteristics and challenges.
In the face of sustainable development challenges, traditional environmental strategies often fall short of fostering comprehensive sustainable outcomes. Contrarily, ecosystem services emerge as critical drivers, underpinning various SDG objectives. Social and economic development are found to negatively contribute to SDGs. Traditional environmental measures, such as increasing green space areas, while beneficial, may have limited effects. Ecosystem services in achieving water resource sustainability, decreasing carbon emissions, and increasing GDP growth rate. These services are key in addressing environmental challenges and improving urban livability, making them essential for cities aspiring to meet SDG targets. In addition, the growth of the Tertiary Industry, such as agro-tourism, is also found to achieve SDGs.
Focusing solely on numerical values of SDGs, such as water efficiency, may harm ecosystem services and go against sustainable development. The results show that the assiduous enhancement of water use efficiency, driven by economic growth and water usage, can militate against the quality and provision of certain ecosystem services. Thus, a broader perspective on water management is essential—one that not only addresses human consumption needs but ensures ecological vitality. Sustainable urban trajectories necessitate this harmonious coexistence, where water strategies are conceived holistically, keeping both anthropogenic and environmental requisites in equilibrium.
This study also has some limitations that require further research. Due to the data availability at the city scale, the study only focused on eight indicators aligned with MFOZ, potentially missing out on some nuances of sustainable development. In addition, while our study provides a foundational classification of cities based on their alignment with SDGs, we acknowledge its limitations in capturing the full spectrum of urban diversity. As the development of big data, future studies could utilize the new technology and delve deeper, incorporating a wider array of SDG indicators to provide a more comprehensive picture of China’s urban sustainable development. In addition, this research integrates MFOZ spatial planning with the SDGs, optimizing spatial planning strategies while achieving sustainable development objectives. Future research may compare SDG variations over different periods and adjust spatial planning strategies. To effectively bridge international SDGs with China’s unique development policies, future research should focus on creating cross-cultural policy frameworks that identify and integrate the strengths of both global standards and local strategies. This entails conducting comparative analyses using multidimensional assessment tools to evaluate the adaptability and effectiveness of sustainability initiatives across diverse urban settings. Emphasizing interdisciplinary approaches, studies should explore innovative policy instruments, like green finance and eco-civilization concepts, tailored to China’s socio-economic and environmental contexts. Such research can provide actionable insights into the development of integrated, context-specific strategies that enhance SDG implementation, offering a nuanced understanding of how to achieve sustainable urban development in a way that harmonizes global aspirations with China’s regional development priorities.
Author Contributions
Conceptualization, H.F.; Methodology, H.F., J.L., X.D., Z.C. and M.H.; Validation, H.F.; Formal analysis, J.L., X.D., Z.C. and M.H.; Resources, H.F., J.L., X.D. and Z.C.; Writing—original draft, H.F., J.L. and X.D.; Writing—review & editing, H.F. and Z.C.; Visualization, X.D.; Supervision, M.H.; Project administration, J.L.; Funding acquisition, M.H. All authors have read and agreed to the published version of the manuscript.
Funding
This study was supported by the National Natural Science Foundation of China (grant no. 42071123).
Data Availability Statement
The original contributions presented in the study are included in the article, further inquiries can be directed to the corresponding author.
Conflicts of Interest
Min He has been involved as a consultant and expert in China Urban Construction Design & Research Institute. The other authors declare no conflicts of interest.
References
- Millennium Ecosystem Assessment. Ecosystems and Human Well-Being; Island Press: Washington, DC, USA, 2005. [Google Scholar]
- The United Nations. Sustainable Development Goals. 2015. Available online: https://www.un.org/sustainabledevelopment/inequality (accessed on 1 January 2024).
- Gao, Q.; Fang, C.L.; Liu, H.M.; Zhang, L.F. Conjugate evaluation of sustainable carrying capacity of urban agglomeration and multi-scenario policy regulation. Sci. Total Environ. 2021, 785, 147373. [Google Scholar] [CrossRef]
- Zhao, Z.; Cai, M.; Wang, F.; Winkler, J.A.; Connor, T.; Chung, M.G.; Zhang, J.; Yang, H.; Xu, Z.; Tang, Y.; et al. Synergies and tradeoffs among Sustainable Development Goals across boundaries in a metacoupled world. Sci. Total Environ. 2020, 751, 141749. [Google Scholar] [CrossRef]
- Kuc-Czarnecka, M.; Markowicz, I.; Sompolska-Rzechula, A. SDGs implementation, their synergies, and trade-offs in EU countries—Sensitivity analysis-based approach. Ecol. Indic. 2023, 146, 109888. [Google Scholar] [CrossRef]
- Rigolon, A.; Browning, M.; Jennings, V. Inequities in the quality of urban park systems: An environmental justice investigation of cities in the United States. Landsc. Urban Plan. 2018, 178, 156–169. [Google Scholar] [CrossRef]
- Chen, D.; Zhao, Q.; Jiang, P.; Li, M. Incorporating ecosystem services to assess progress towards sustainable development goals: A case study of the Yangtze River Economic Belt, China. Sci. Total Environ. 2022, 806, 151277. [Google Scholar] [CrossRef]
- Wang, Z.; Fu, H.; Jian, Y.; Qureshi, S.; Jie, H.; Wang, L. On the comparative use of social media data and survey data in prioritizing ecosystem services for cost-effective governance. Ecosyst. Serv. 2022, 56, 101446. [Google Scholar] [CrossRef]
- Kronenberg, K.; Fuchs, M. Aligning tourism’s socio-economic impact with the United Nations’ sustainable development goals. Tour. Manag. Perspect. 2021, 39, 100831. [Google Scholar] [CrossRef]
- Qiu, J.Q.; Yu, D.Y.; Huang, T. Influential paths of ecosystem services on human well-being in the context of the sustainable development goals. Sci. Total Environ. 2022, 852, 158443. [Google Scholar] [CrossRef] [PubMed]
- Nie, X.; Lu, B.; Chen, Z.; Yang, Y.; Chen, S.; Chen, Z.; Wang, H. Increase or decrease? Integrating the CLUMondo and InVEST models to assess the impact of the implementation of the Major Function Oriented Zone planning on carbon storage. Ecol. Indic. 2020, 118, 106708. [Google Scholar] [CrossRef]
- He, Z.C.; Zhao, C.H.; Fürst, C.; Hersperger, A.M. Closer to causality: How effective is spatial planning in governing built-up land expansion in Fujian Province, China? Land Use Policy 2021, 108, 105562. [Google Scholar] [CrossRef]
- Dong, J.W.; Wang, Y.H.; Wang, L.L.; Zhao, W.J.; Huang, C. Assessment of PM2.5exposure risk towards SDG indicator 11.6.2-A case study in Beijing. Sustain. Cities Soc. 2022, 82, 103864. [Google Scholar] [CrossRef]
- Kong, X.; Fu, M.; Zhao, X.; Wang, J.; Jiang, P. Ecological effects of land-use change on two sides of the Hu Huanyong Line in China. Land Use Policy 2021, 113, 105895. [Google Scholar] [CrossRef]
- Guan, C.M.; Hu, Q. Does high-speed railway impact urban logistics industry agglomeration? Empirical evidence from China’s prefecture-level cities. Socio-Econ. Plan. Sci. 2023, 87, 101557. [Google Scholar] [CrossRef]
- Wang, W.; Zhang, X.; Wu, Y.; Zhou, L.; Skitmore, M. Development priority zoning in China and its impact on urban growth management strategy. Cities. 2017, 62, 1–9. [Google Scholar] [CrossRef]
- Wu, X.; Liu, J.; Fu, B.; Wang, S.; Wei, Y.; Li, Y. Bundling regions for promoting Sustainable Development Goals. Environ. Res. Lett. 2022, 17, 044021. [Google Scholar] [CrossRef]
- Shuai, C.; Yu, L.; Chen, X.; Zhao, B.; Qu, S.; Zhu, J.; Liu, J.; Miller, S.A.; Xu, M. Principal indicators to monitor sustainable development goals. Environ. Res. Lett. 2021, 16, 124015. [Google Scholar] [CrossRef]
- Xu, X. Land Ecosystem Service Value Spatial Distribution Dataset in China; Resource Environment Science Data Register and Publishing System: Beijing, China, 2018. [Google Scholar] [CrossRef]
- Peng, W.; Wang, G.; Zhou, J.; Xu, X. Effects of the land use change on ecosystem service value based on RS & GIS. J. Landsc. Res. 2015, 7, 21. [Google Scholar]
- Liu, Y.; Hu, J.; Yang, W.; Luo, C. Effects of urban park environment on recreational jogging activity based on trajectory data: A case of Chongqing, China. Urban For. Urban Green. 2021, 67, 127443. [Google Scholar] [CrossRef]
- Mak, B.K.; Jim, C. Linking park users’ socio-demographic characteristics and visit-related preferences to improve urban parks. Cities 2019, 92, 97–111. [Google Scholar] [CrossRef]
- Li, Q.Y.; Zeng, F.E.; Liu, S.H.; Yang, M.A.; Xu, F. The effects of China’s sustainable development policy for resource-based cities on local industrial transformation. Resour. Policy 2021, 71, 101940. [Google Scholar] [CrossRef]
- Guo, Y.M.; Shi, Y.R. Impact of the VAT reduction policy on local fiscal pressure in China in light of the COVID-19 pandemic: A measurement based on a computable general equilibrium model. Econ. Anal. Policy 2020, 69, 253–264. [Google Scholar] [CrossRef]
- He, J.; Yi, H.; Liu, J. Urban green space recreational service assessment and management: A conceptual model based on the service generation process. Ecol. Econ. 2016, 124, 59–68. [Google Scholar] [CrossRef]
- Sharma, R.; Malaviya, P. Ecosystem services and climate action from a circular bioeconomy perspective. Renew. Sustain. Energy Rev. 2023, 175, 113164. [Google Scholar] [CrossRef]
- Fan, Z.; Duan, J.; Lu, Y.; Zou, W.; Lan, W. A geographical detector study on factors influencing urban park use in Nanjing, China. Urban For. Urban Green. 2021, 59, 126996. [Google Scholar] [CrossRef]
- de Macedo, M.B.; Gomes, M.N., Jr.; de Oliveira, T.R.P.; Giacomoni, M.H.; Zhang, K.; Lago, C.A.F.D.; Mendiondo, E.M. Low Impact Development practices in the context of United Nations Sustainable Development Goals: A new concept, lessons learned and challenges. Crit. Rev. Environ. Sci. Technol. 2022, 52, 2538–2581. [Google Scholar] [CrossRef]
- Zhang, J.; Wang, S.; Pradhan, P.; Zhao, W.; Fu, B. Mapping the complexity of the food-energy-water nexus from the lens of Sustainable Development Goals in China. Resour. Conserv. Recycl. 2022, 183, 106357. [Google Scholar] [CrossRef]
- García-Jiménez, R.; Pérez-García, J.M.; Margalida, A.; Morales-Reyes, Z. Avian scavengers’ contributions to people: The cultural dimension of wildlife-based tourism. Sci. Total Environ. 2022, 806, 150419. [Google Scholar] [CrossRef]
- Lam, N. Geographic information systems and science. Ann. Assoc. Am. Geogr. 2003, 93, 259–261. [Google Scholar] [CrossRef]
- He, H.; Shen, L.; Du, X.; Liu, Y. Analysis of temporal and spatial evolution of tourism resource carrying capacity performance in China. Ecol. Indic. 2023, 147, 109951. [Google Scholar] [CrossRef]
- Yi, P.; Dong, Q.; Li, W.; Wang, L. Measurement of city sustainability based on the grey relational analysis: The case of 15 sub-provincial cities in China. Sustain. Cities Soc. 2021, 73, 103143. [Google Scholar] [CrossRef]
- Chen, M.; Liu, W.; Tao, Z. Challenges and pathways for the SDGs: Exploring the policy agenda towards 2030 in China. Sustain. Dev. 2020, 28, 19–28. [Google Scholar]
- Liu, Y.; Li, X.; Chen, Y. Transition of Major Function-Oriented Zoning in China: A Policy Tool for Balanced Regional Development. J. Reg. Sci. 2018, 58, 373–396. [Google Scholar]
- Pedersen, E.R.G.; Gwozdz, W.; Hvass, K.K. Exploring the Relationship Between Business Model Innovation, Corporate Sustainability, and Organisational Values within the Fashion Industry. J. Bus. Ethics 2016, 149, 267–284. [Google Scholar] [CrossRef]
- Garduño-Jiménez, A.L.; Durán-Alvarez, J.C.; Ortori, C.A.; Abdelrazig, S.; Barrett, D.A.; Gomes, R.L. Delivering on sustainable development goals in wastewater reuse for agriculture: Initial prioritization of emerging pollutants in the Tula Valley, Mexico. Water Res. 2023, 238, 119903. [Google Scholar] [CrossRef] [PubMed]
- Godovykh, M.; Ridderstaat, J. Health outcomes of tourism development: A longitudinal study of the impact of tourism arrivals on residents’ health. J. Destin. Mark. Manag. 2020, 17, 100462. [Google Scholar] [CrossRef]
- Huan, Y.; Zhu, X.; Liang, T.; Zhou, G.; Wang, L.; Zhang, L.; Feng, Z. Identifying holistic actions for implementing the sustainable development goals related to livelihood–energy–ecosystem–water nexus in the Asian water tower region. Resour. Conserv. Recycl. 2023, 191, 106905. [Google Scholar] [CrossRef]
- Livingstone, S.W.; Cadotte, M.W.; Isaac, M.E. Ecological engagement determines ecosystem service valuation: A case study from Rouge National Urban Park in Toronto, Canada. Ecosyst. Serv. 2018, 30, 86–97. [Google Scholar] [CrossRef]
- Birendra, K.C.; Dhungana, A.; Dangi, T.B. Tourism and the sustainable development goals: Stakeholders’ perspectives from Nepal. Tour. Manag. Perspect. 2021, 38, 100822. [Google Scholar]
- Hu, B.A.; Wu, H.F.; Han, H.R.; Cheng, X.Q.; Kang, F.F. Dramatic shift in the drivers of ecosystem service trade-offs across an aridity gradient: Evidence from China’s Loess Plateau. Sci. Total Environ. 2023, 858, 159836. [Google Scholar] [CrossRef]
- Tao, J.Y.; Lu, Y.Q.; Ge, D.Z.; Dong, P.; Gong, X.; Ma, X.B. The spatial pattern of agricultural ecosystem services from the production-living-ecology perspective: A case study of the Huaihai Economic Zone, China. Land Use Policy 2022, 122, 106355. [Google Scholar] [CrossRef]
- Liu, J.; Yang, H.; Gosling, S.N.; Kummu, M.; Flörke, M.; Pfister, S.; Hanasaki, N.; Wada, Y.; Zhang, X.; Zheng, C.; et al. Water scarcity assessments in the past, present, and future. Earth’s Futur. 2017, 5, 545–559. [Google Scholar] [CrossRef] [PubMed]
- Turner, K.G.; Anderson, S.; Gonzalez-Chang, M.; Costanza, R.; Courville, S.; Dalgaard, T.; Dominati, E.; Kubiszewski, I.; Ogilvy, S.; Porfirio, L.; et al. A review of methods, data, and models to assess changes in the value of ecosystem services from land degradation and restoration. Ecol. Model. 2016, 319, 190–207. [Google Scholar] [CrossRef]
- Tilman, D.; Balzer, C.; Hill, J.; Befort, B.L. Global food demand and the sustainable intensification of agriculture. Proc. Natl. Acad. Sci. USA 2011, 108, 20260–20264. [Google Scholar] [CrossRef] [PubMed]
- Nelson, E. Efficiency, sustainability, and policy in urban water and land management. Environ. Sci. Policy 2019, 100, 177–190. [Google Scholar]
- Grafton, R.Q.; Williams, J.; Perry, C.J.; Molle, F.; Ringler, C.; Steduto, P.; Udall, B.; Wheeler, S.A.; Wang, Y.; Garrick, D.; et al. The paradox of irrigation efficiency. Science 2018, 361, 748–750. [Google Scholar] [CrossRef]
- Liu, J.; Hertel, T.W.; Lammers, R.B.; Prusevich, A.; Baldos, U.L.C.; Grogan, D.S.; Frolking, S. Achieving sustainable irrigation water withdrawals: Global impacts on food security and land use. Environ. Res. Lett. 2017, 12, 104009. [Google Scholar] [CrossRef]
- Gómez-Baggethun, E. Urban ecosystem services. In Urbanization, Biodiversity and Ecosystem Services: Challenges and Opportunities; Springer Nature: Dordrecht, The Netherlands, 2013. [Google Scholar]
| Disclaimer/Publisher’s Note: The statements, opinions and data contained in all publications are solely those of the individual author(s) and contributor(s) and not of MDPI and/or the editor(s). MDPI and/or the editor(s) disclaim responsibility for any injury to people or property resulting from any ideas, methods, instructions or products referred to in the content. |
© 2024 by the authors. Licensee MDPI, Basel, Switzerland. This article is an open access article distributed under the terms and conditions of the Creative Commons Attribution (CC BY) license (https://creativecommons.org/licenses/by/4.0/).


