
Landcover Change, Land Surface Temperature, Surface Albedo and Topography in the Plateau Region of North-Central Nigeria

Abstract
:1. Introduction
2. Experimental Section
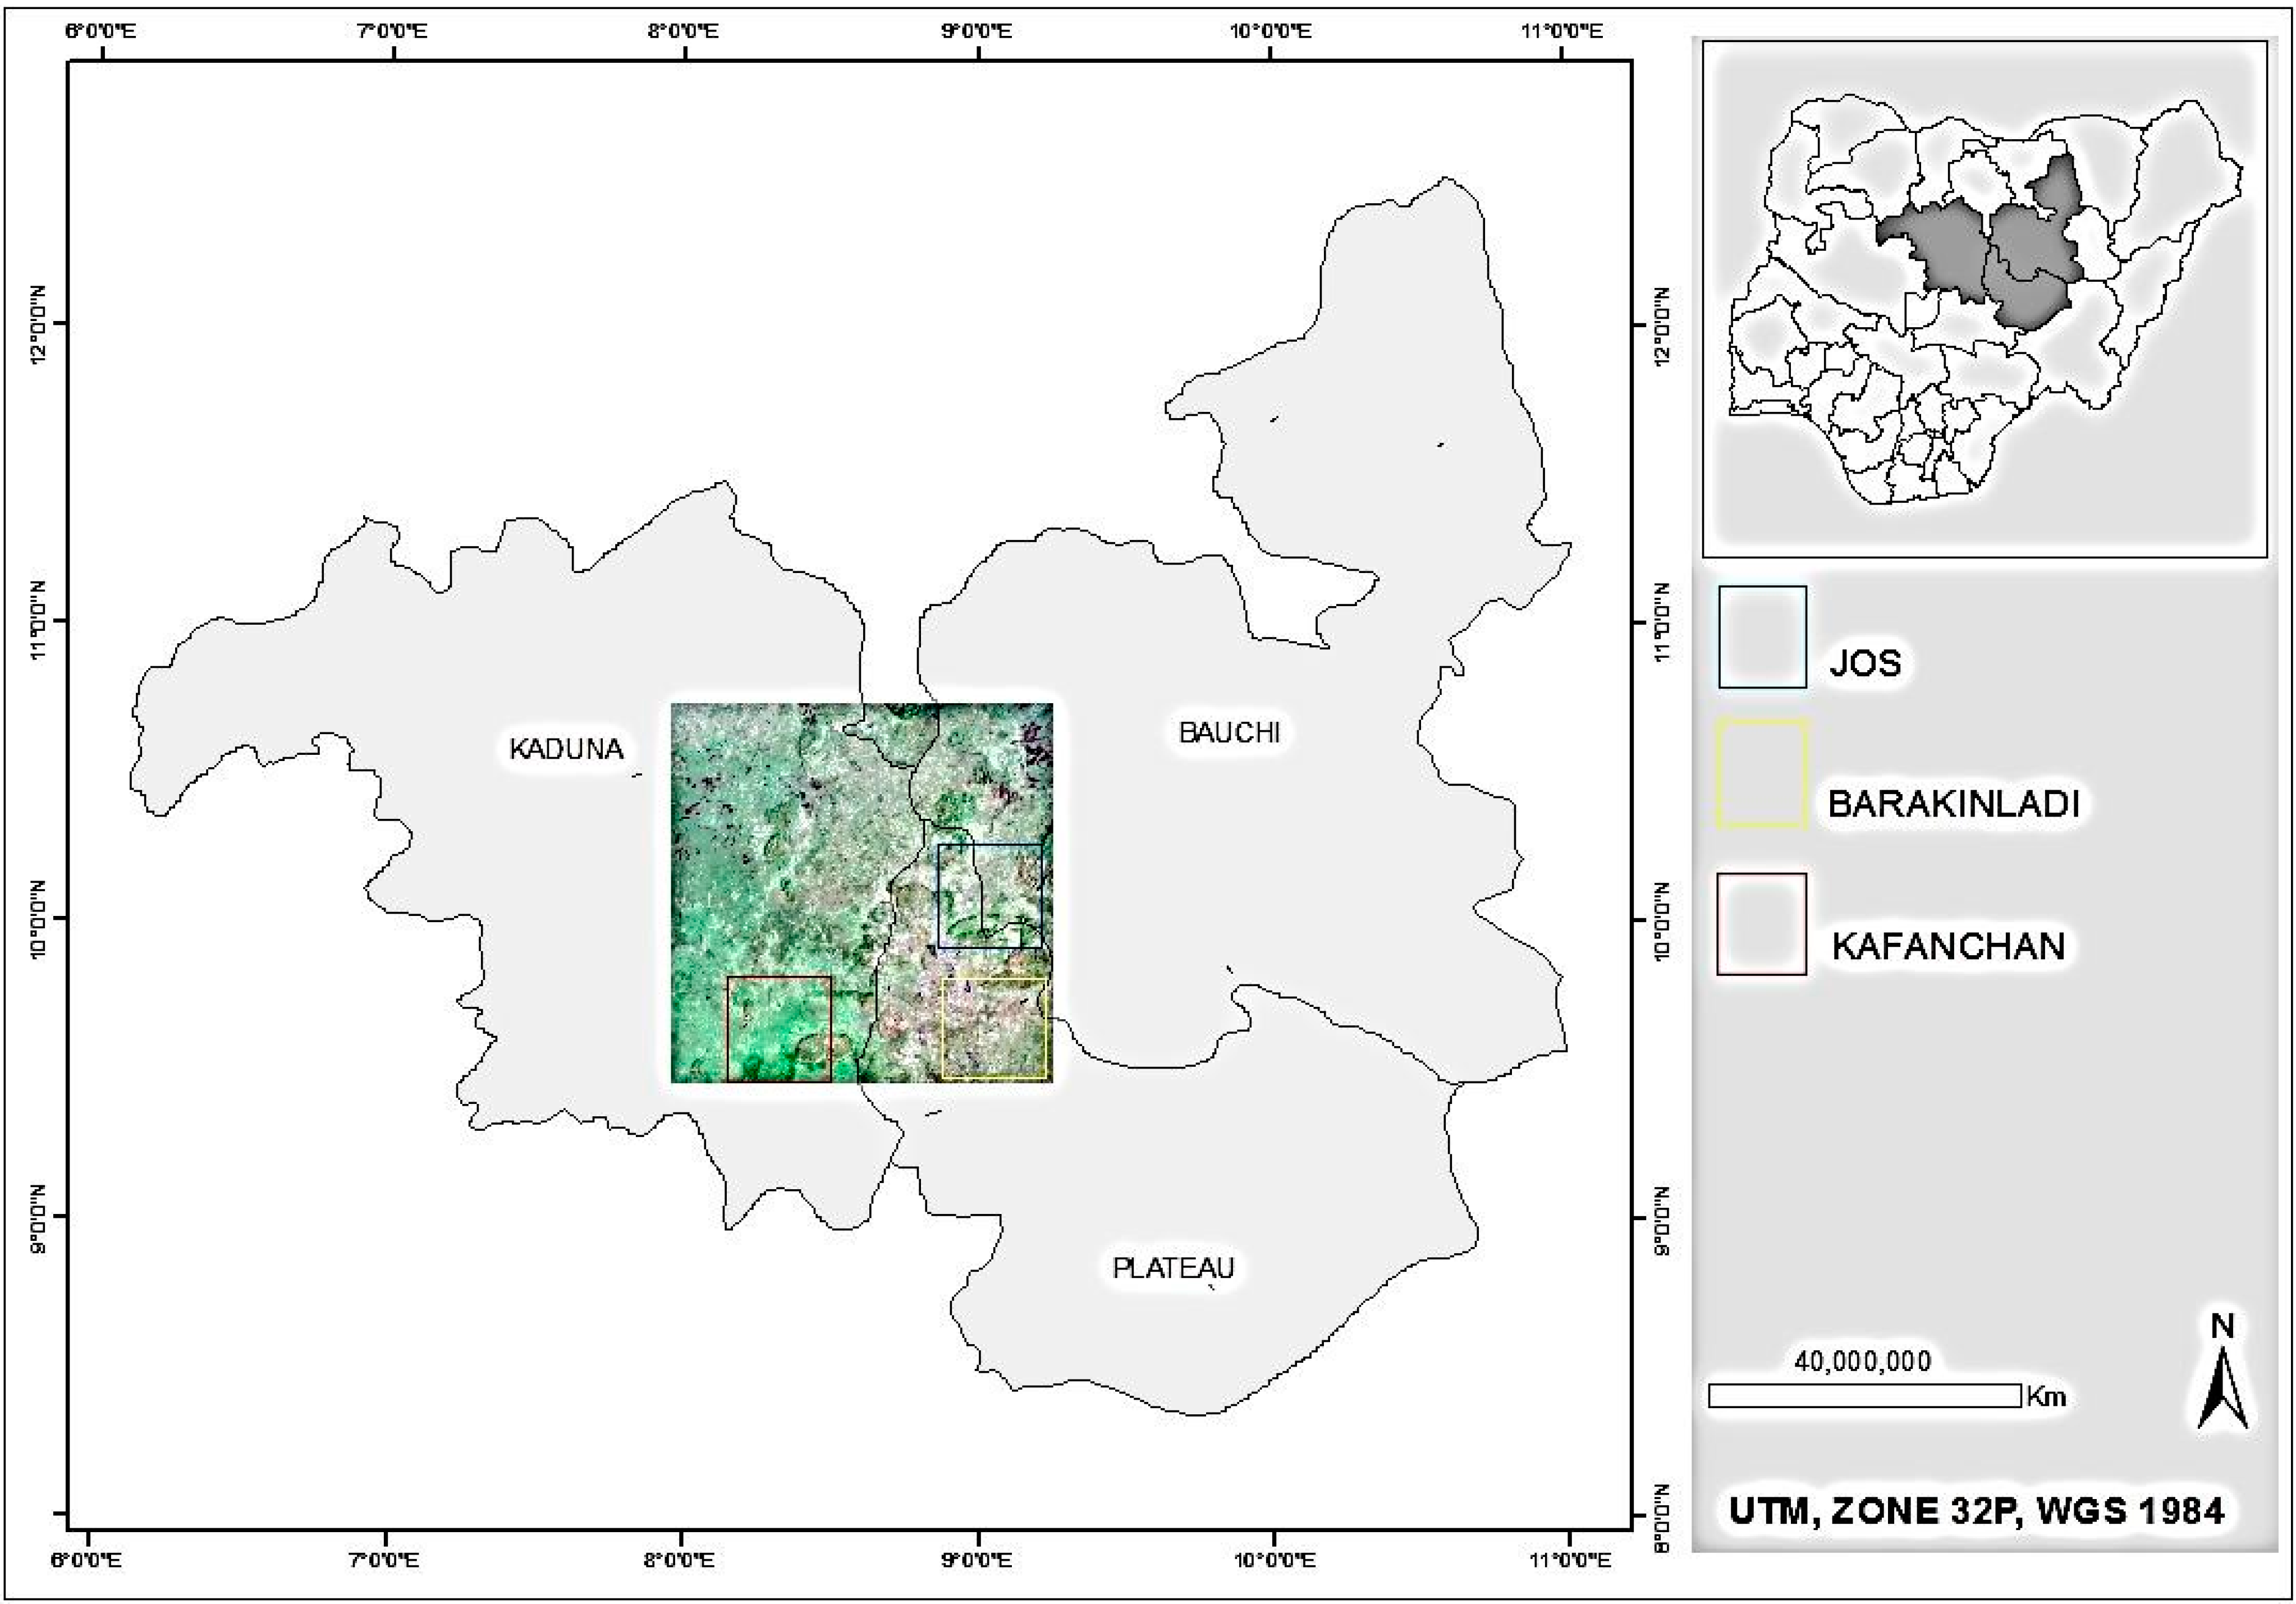
2.1. Study Area
2.1.1. Location
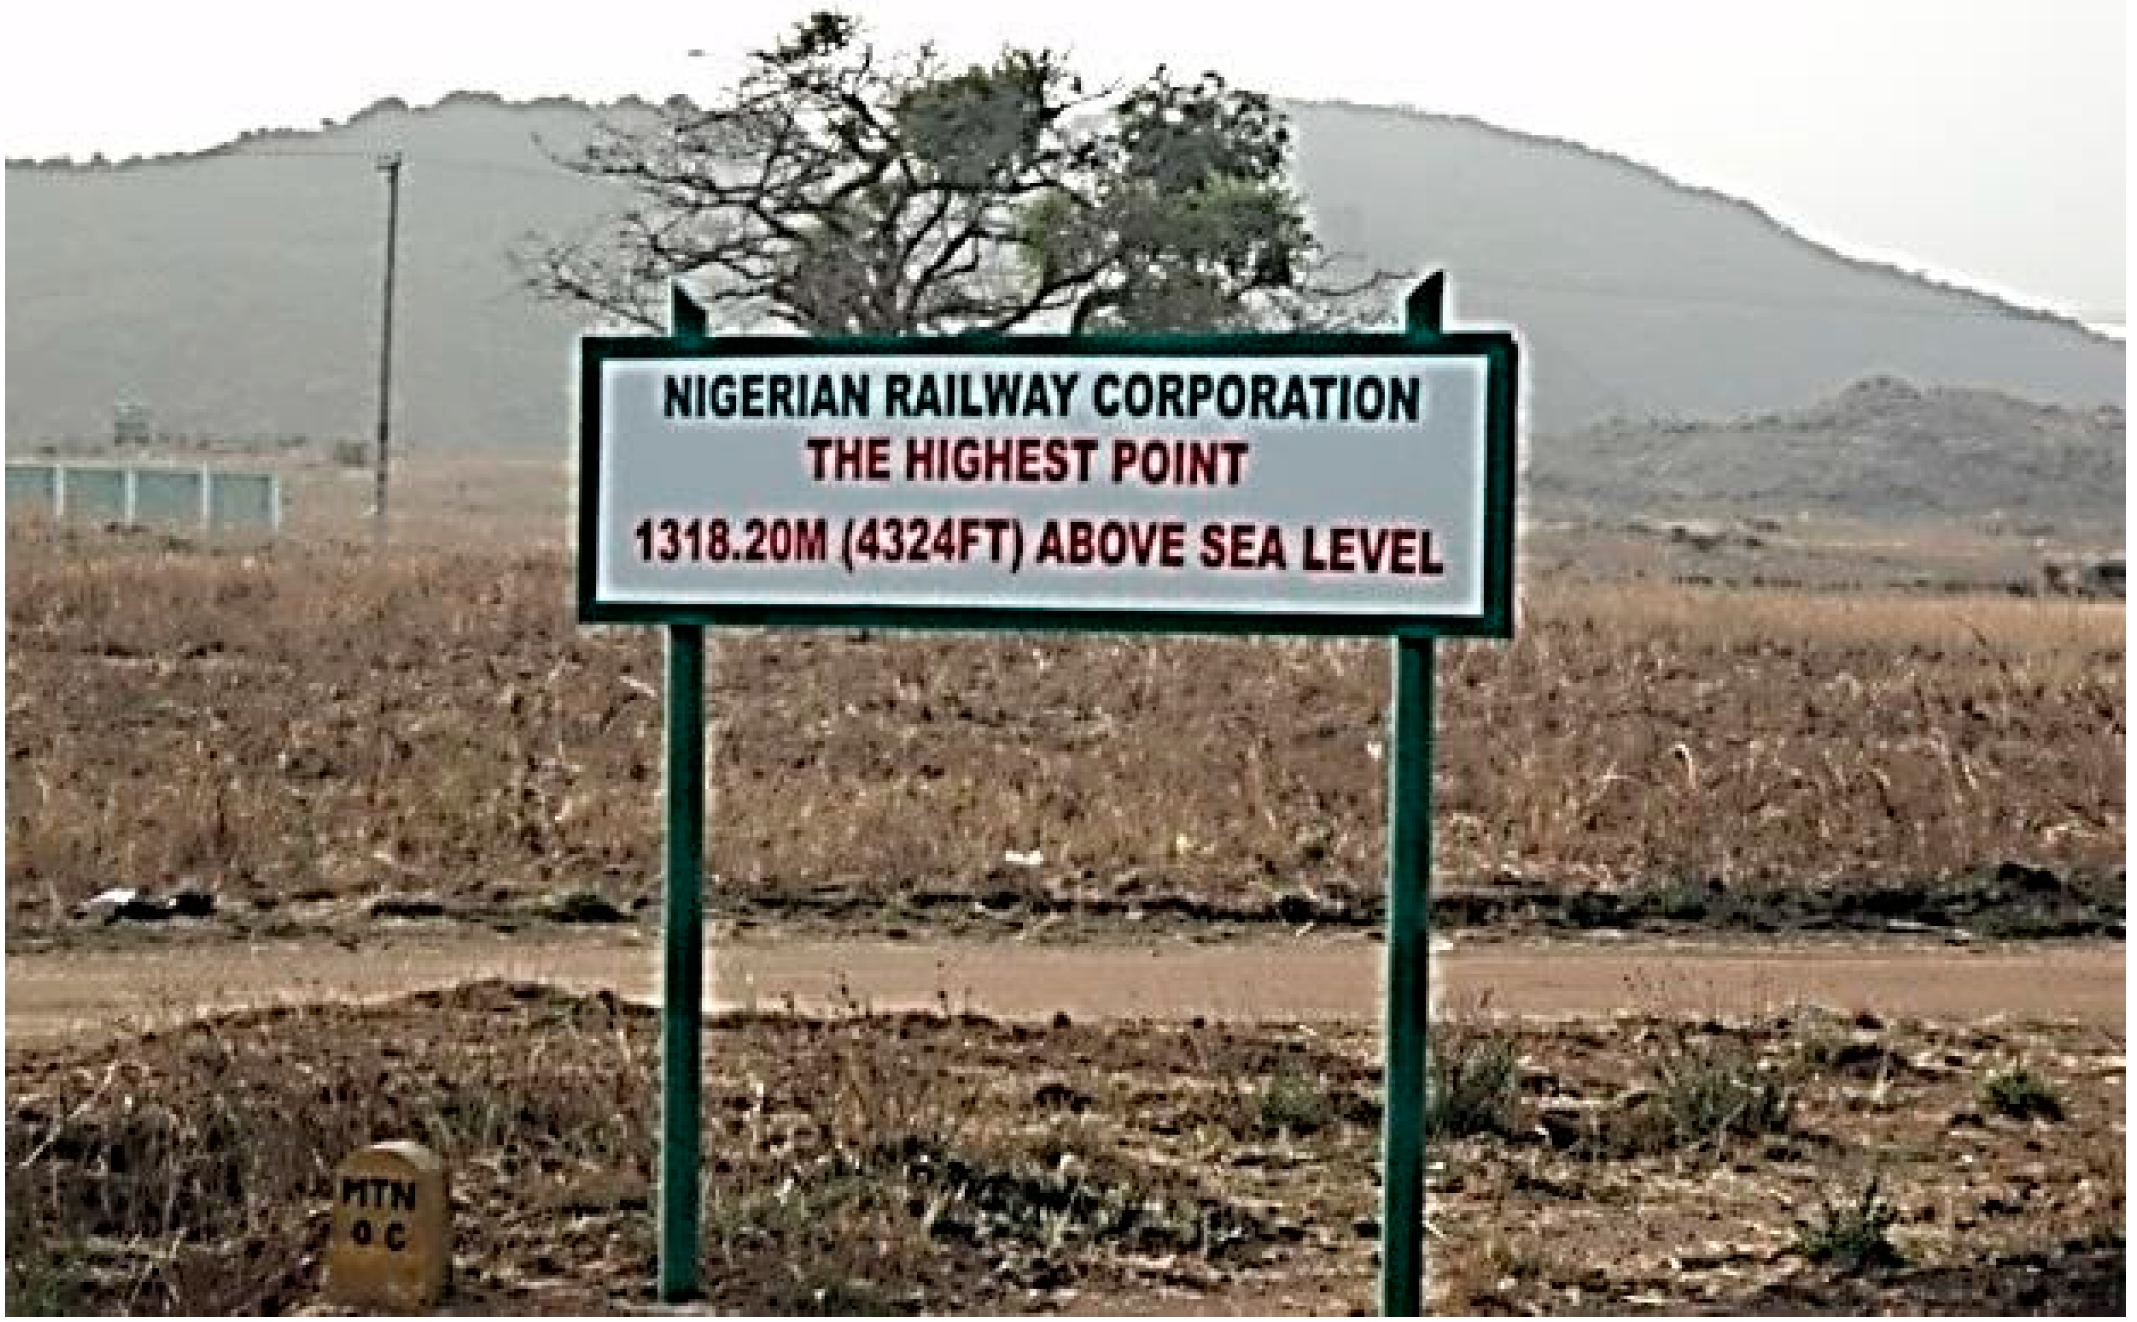
2.1.2. Relief and Drainage


2.1.3. Weather, Climate and Vegetation
- The plateau complex; this occurs over the central part of the plateau and contains grassland and shrubland.
- The Southwest complex; this occurs in the south-western part of the plateau and is covered with riparian woodland.
- The west escarpment complex; this occurs in the western part of the plateau and is covered with shrubland and riparian woodland.
- The east escarpment complex; this occurs in the eastern part of the plateau and is also covered with shrubland and riparian woodland.
- The Toro complex; this occurs mainly on the mainly on the Mongu plains and is covered by shrubland.
- Alluvial complex; this is found intermittently within other complexes and is covered with riparian woodland.
2.1.4. Human Setting
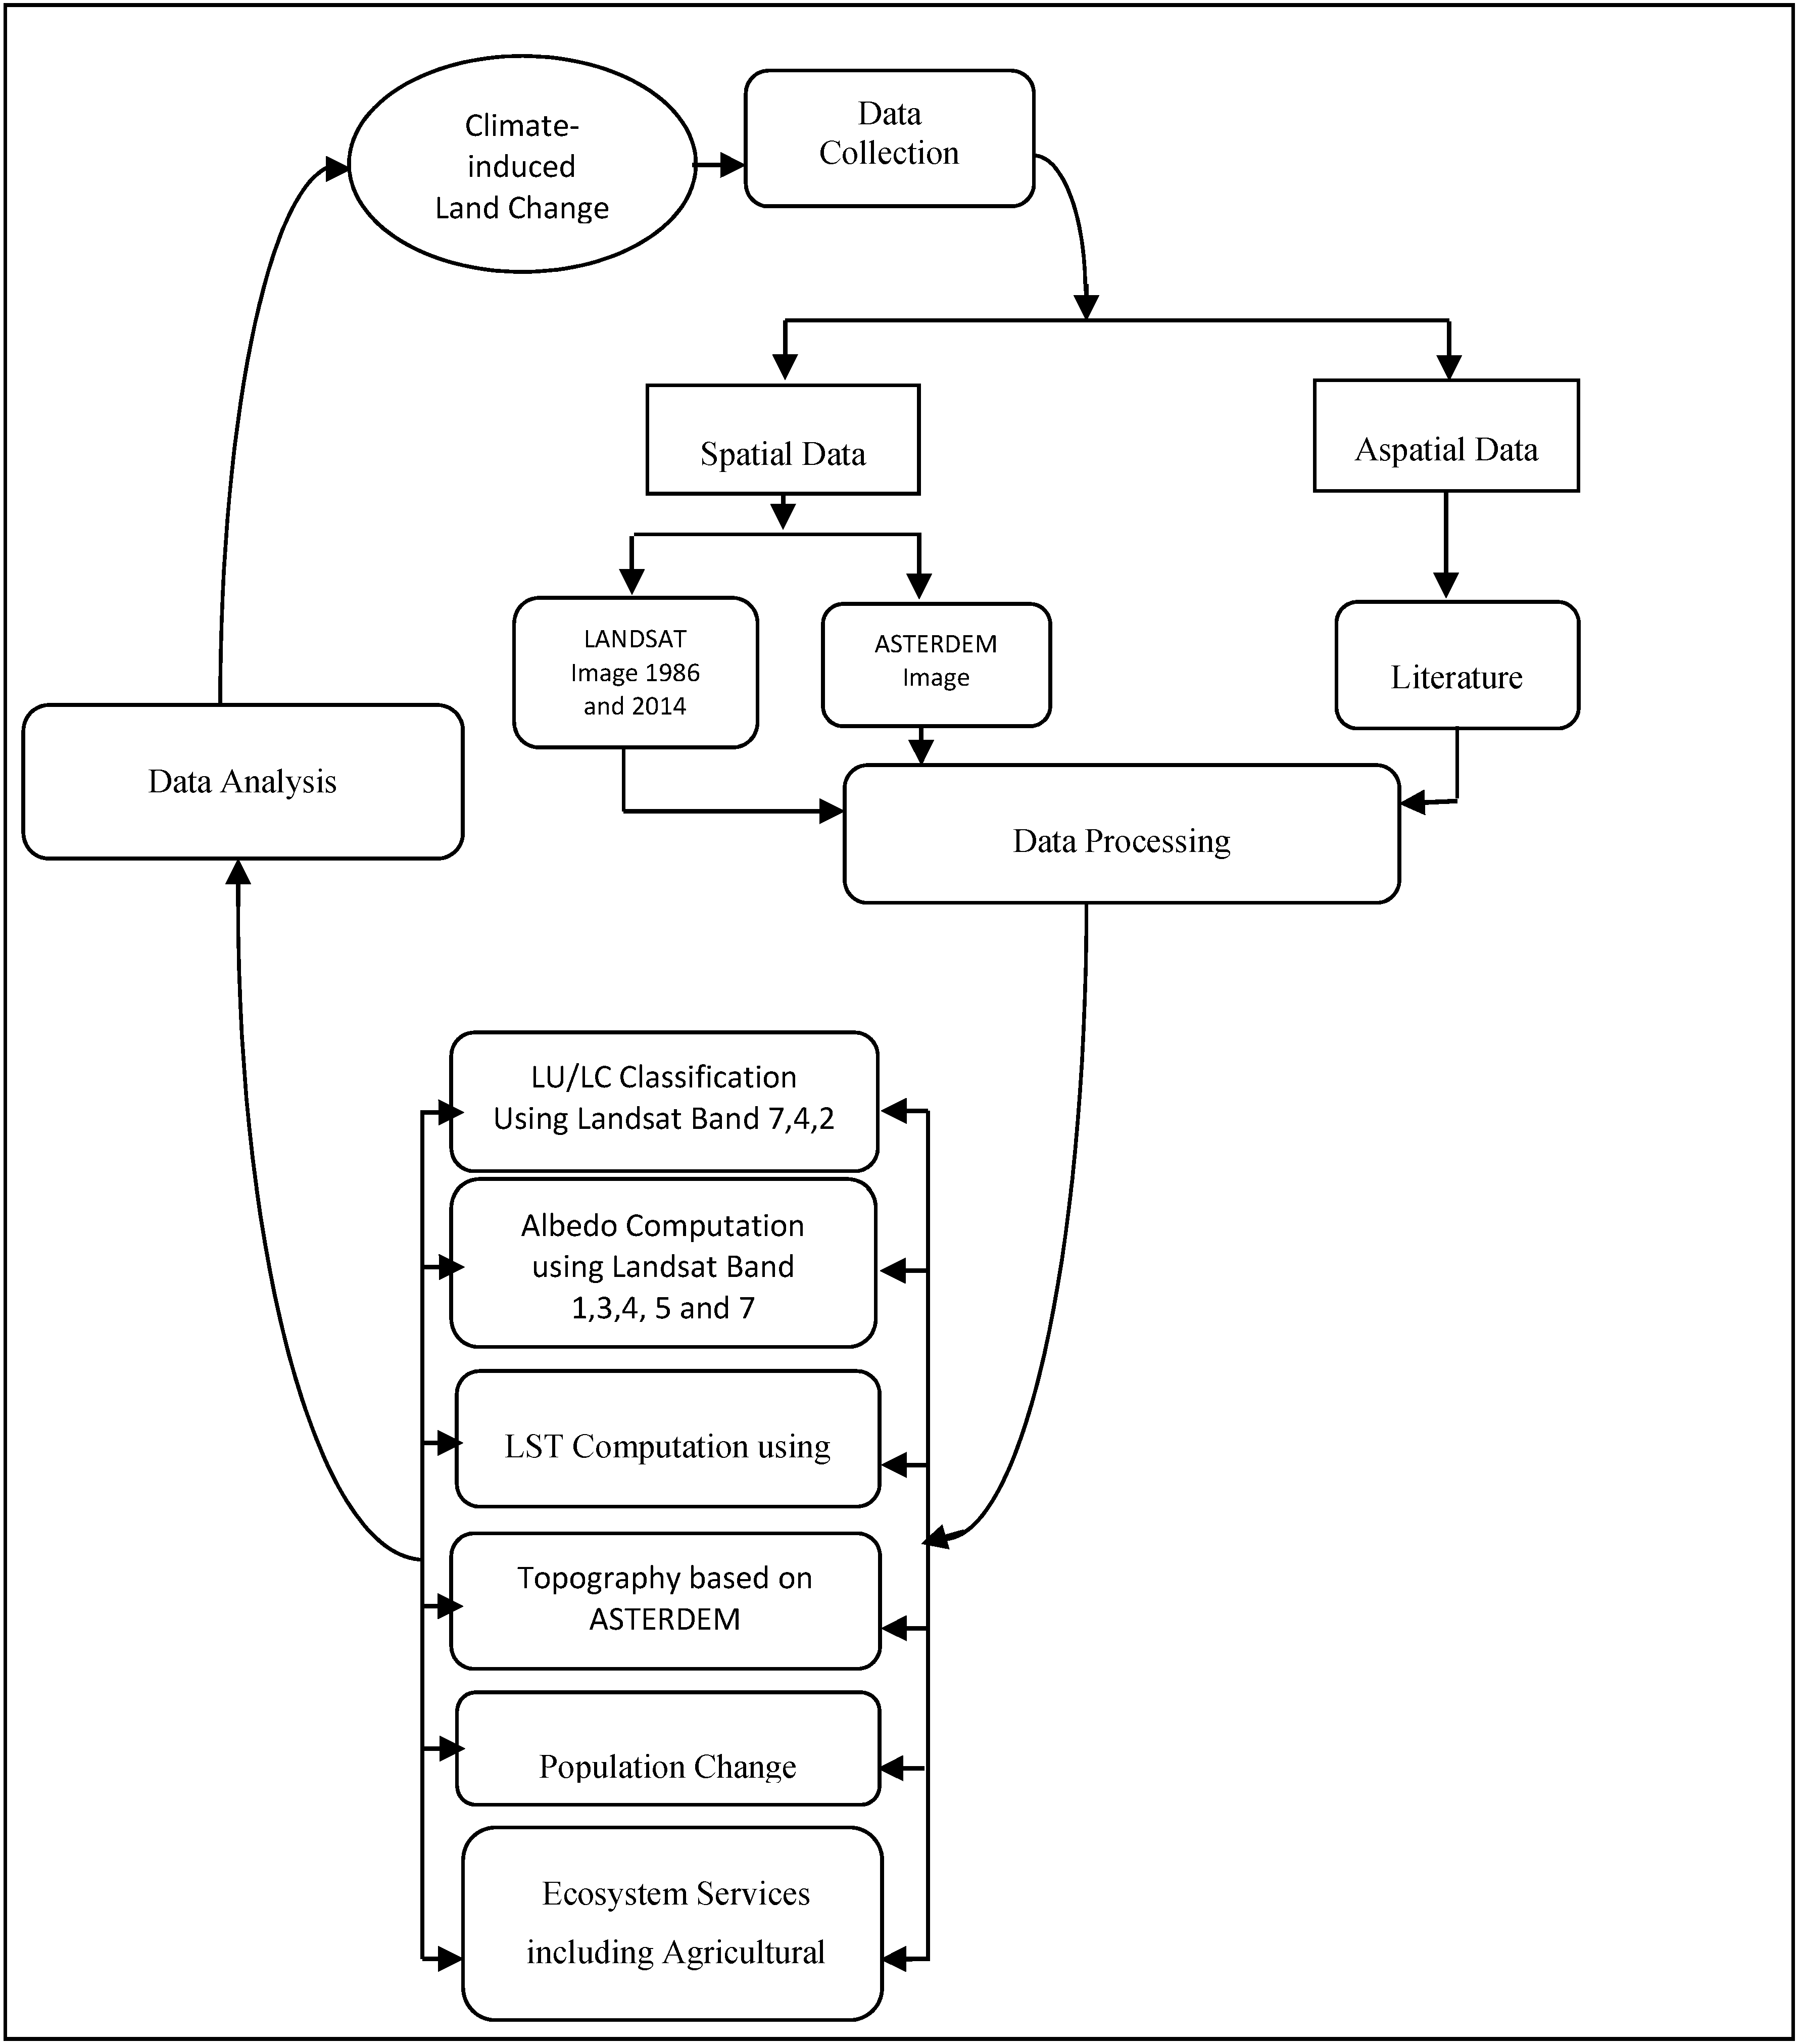
2.2. Methodology

2.2.1. Data Acquisition

| S/N | Data | Source | Scale |
|---|---|---|---|
| 1 | LANDSAT TM (1986) | Landcover.org | 30 m |
| 2 | LANDSAT ETM+ (2014) | Landcover.org | 30 m |
| 3 | ASTERDEM | lpdaac.usgs.gov | 30 m |
| 4 | Population Records | NPC, 1991 and 2006 | N/A |
2.2.2. Data Processing
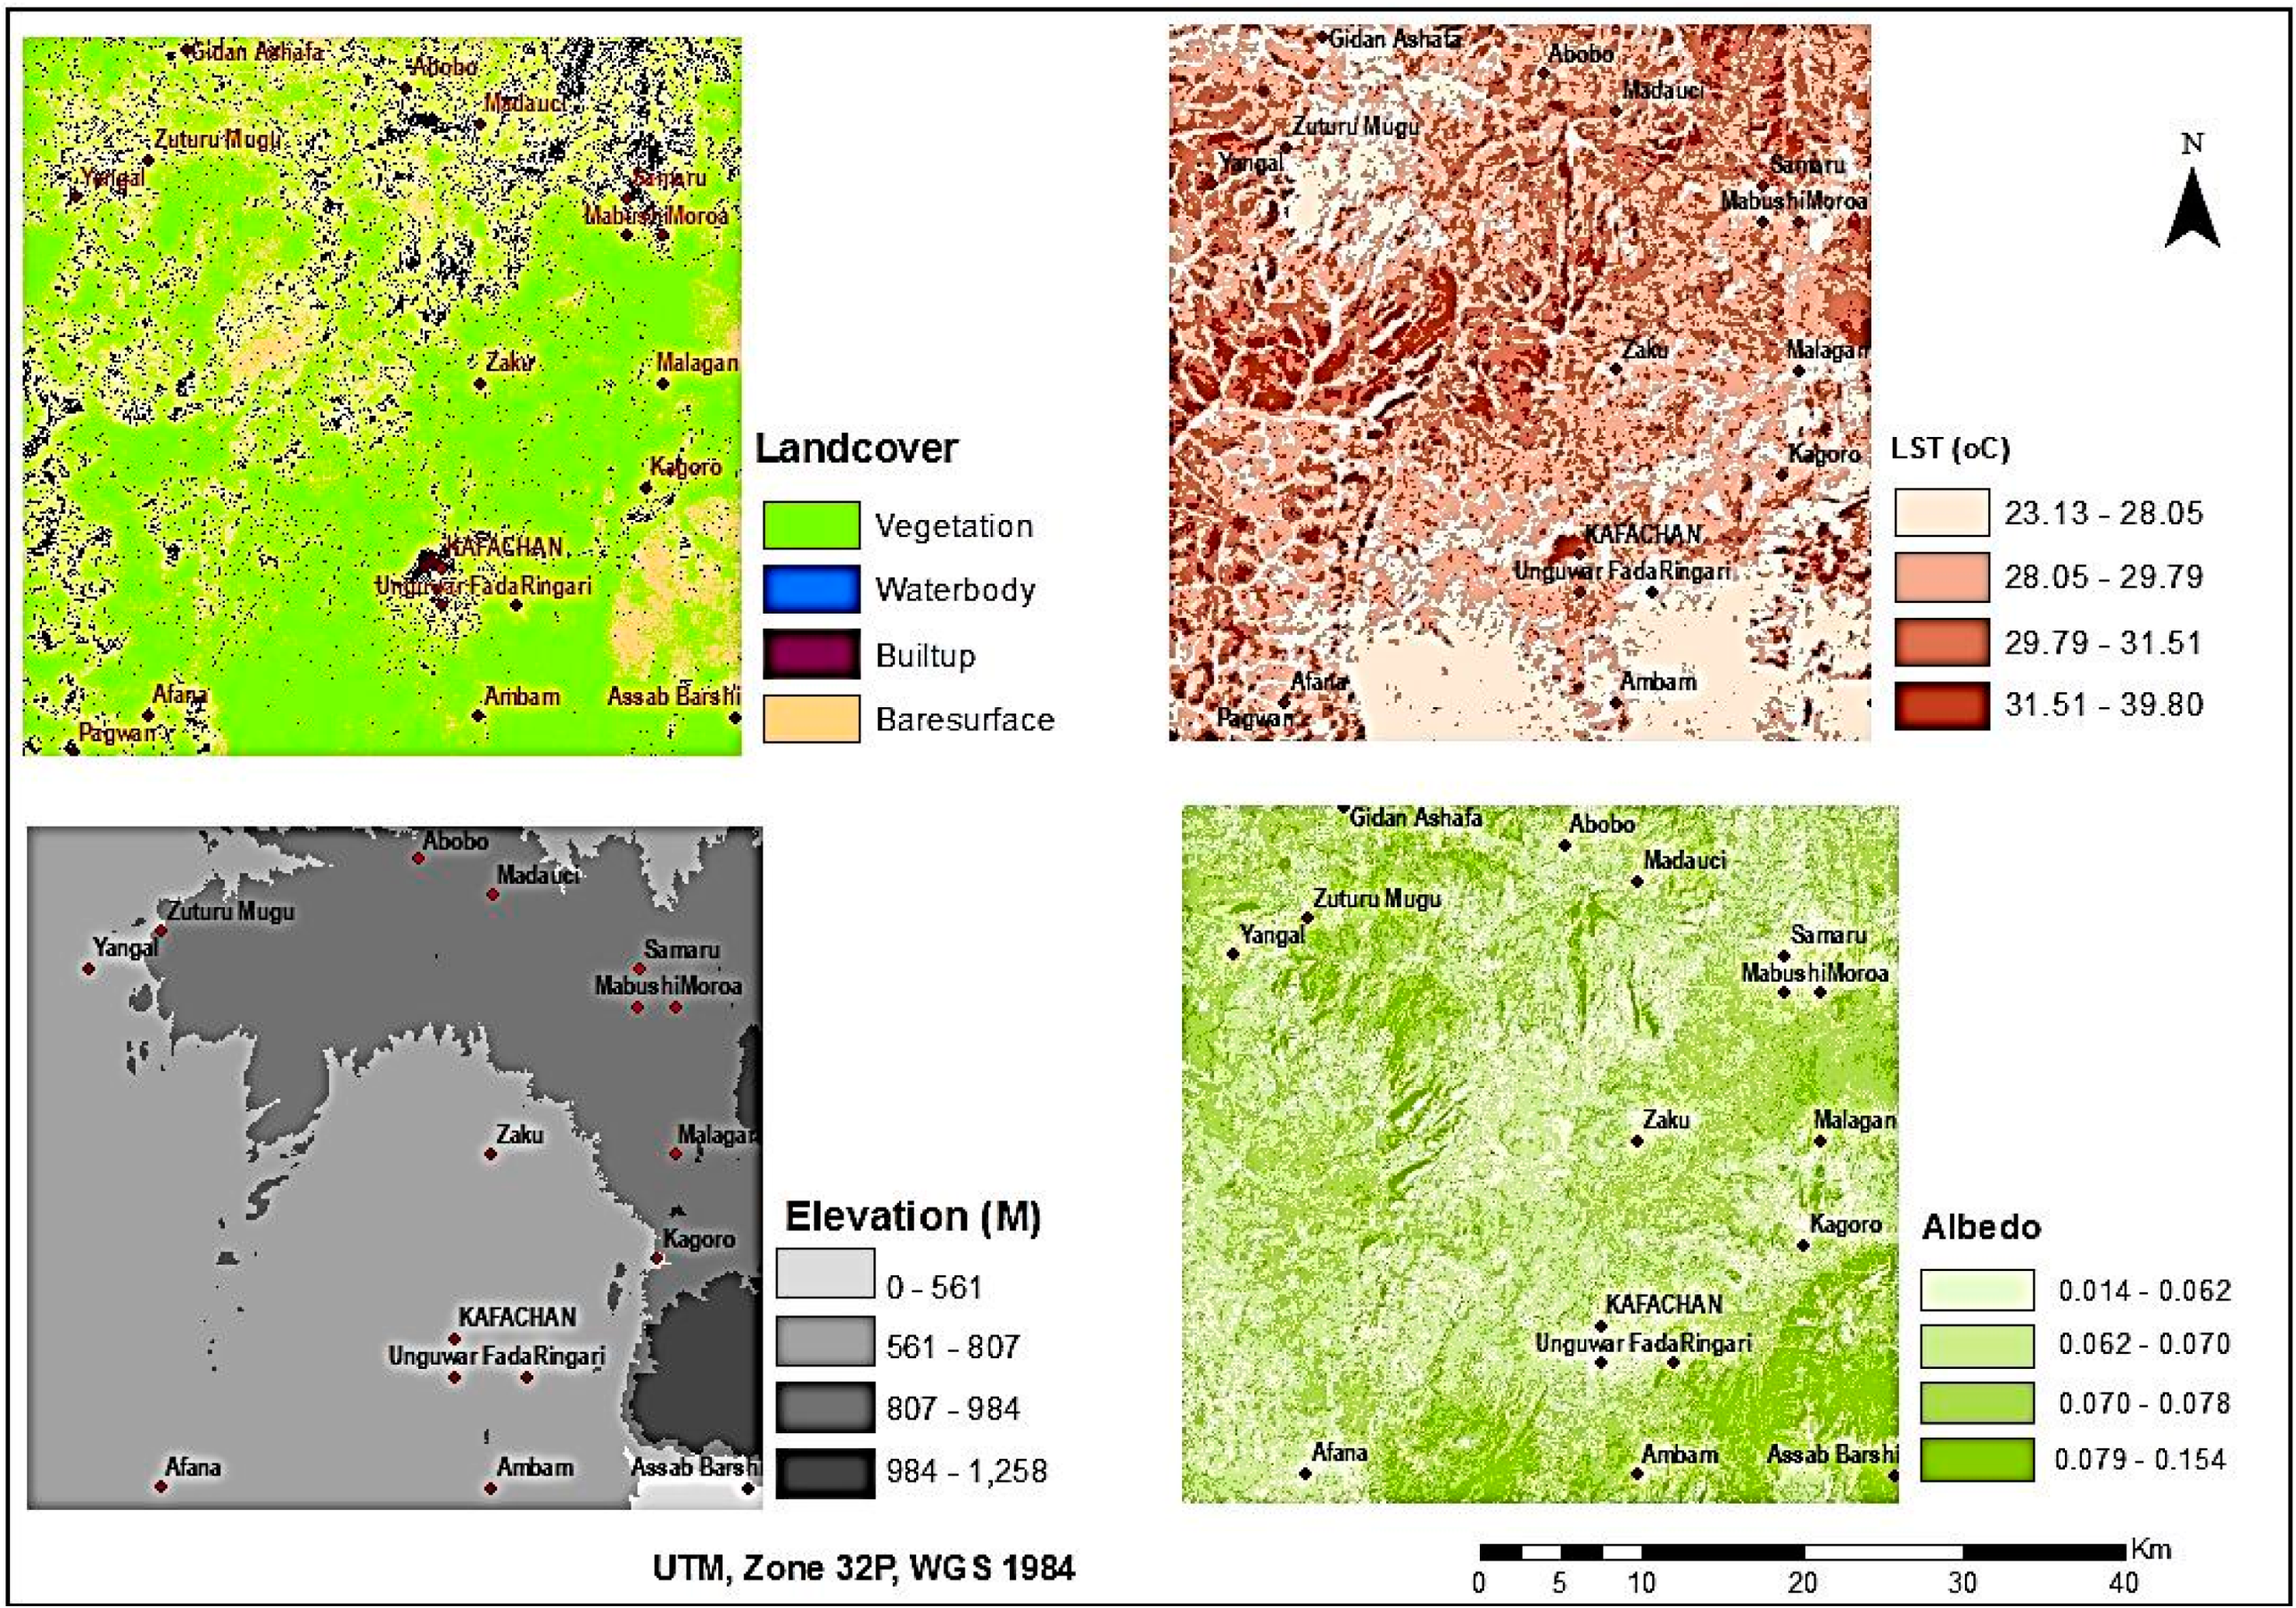
Landcover Classification
- Vegetation
- Water body
- Built up
- Cultivation/Bare surface
Land Surface Temperature (LST) Computation
Albedo Computation
Data Cleaning and Configuration
- their history of Landcover change and degradation;
- their history of resource conflicts;
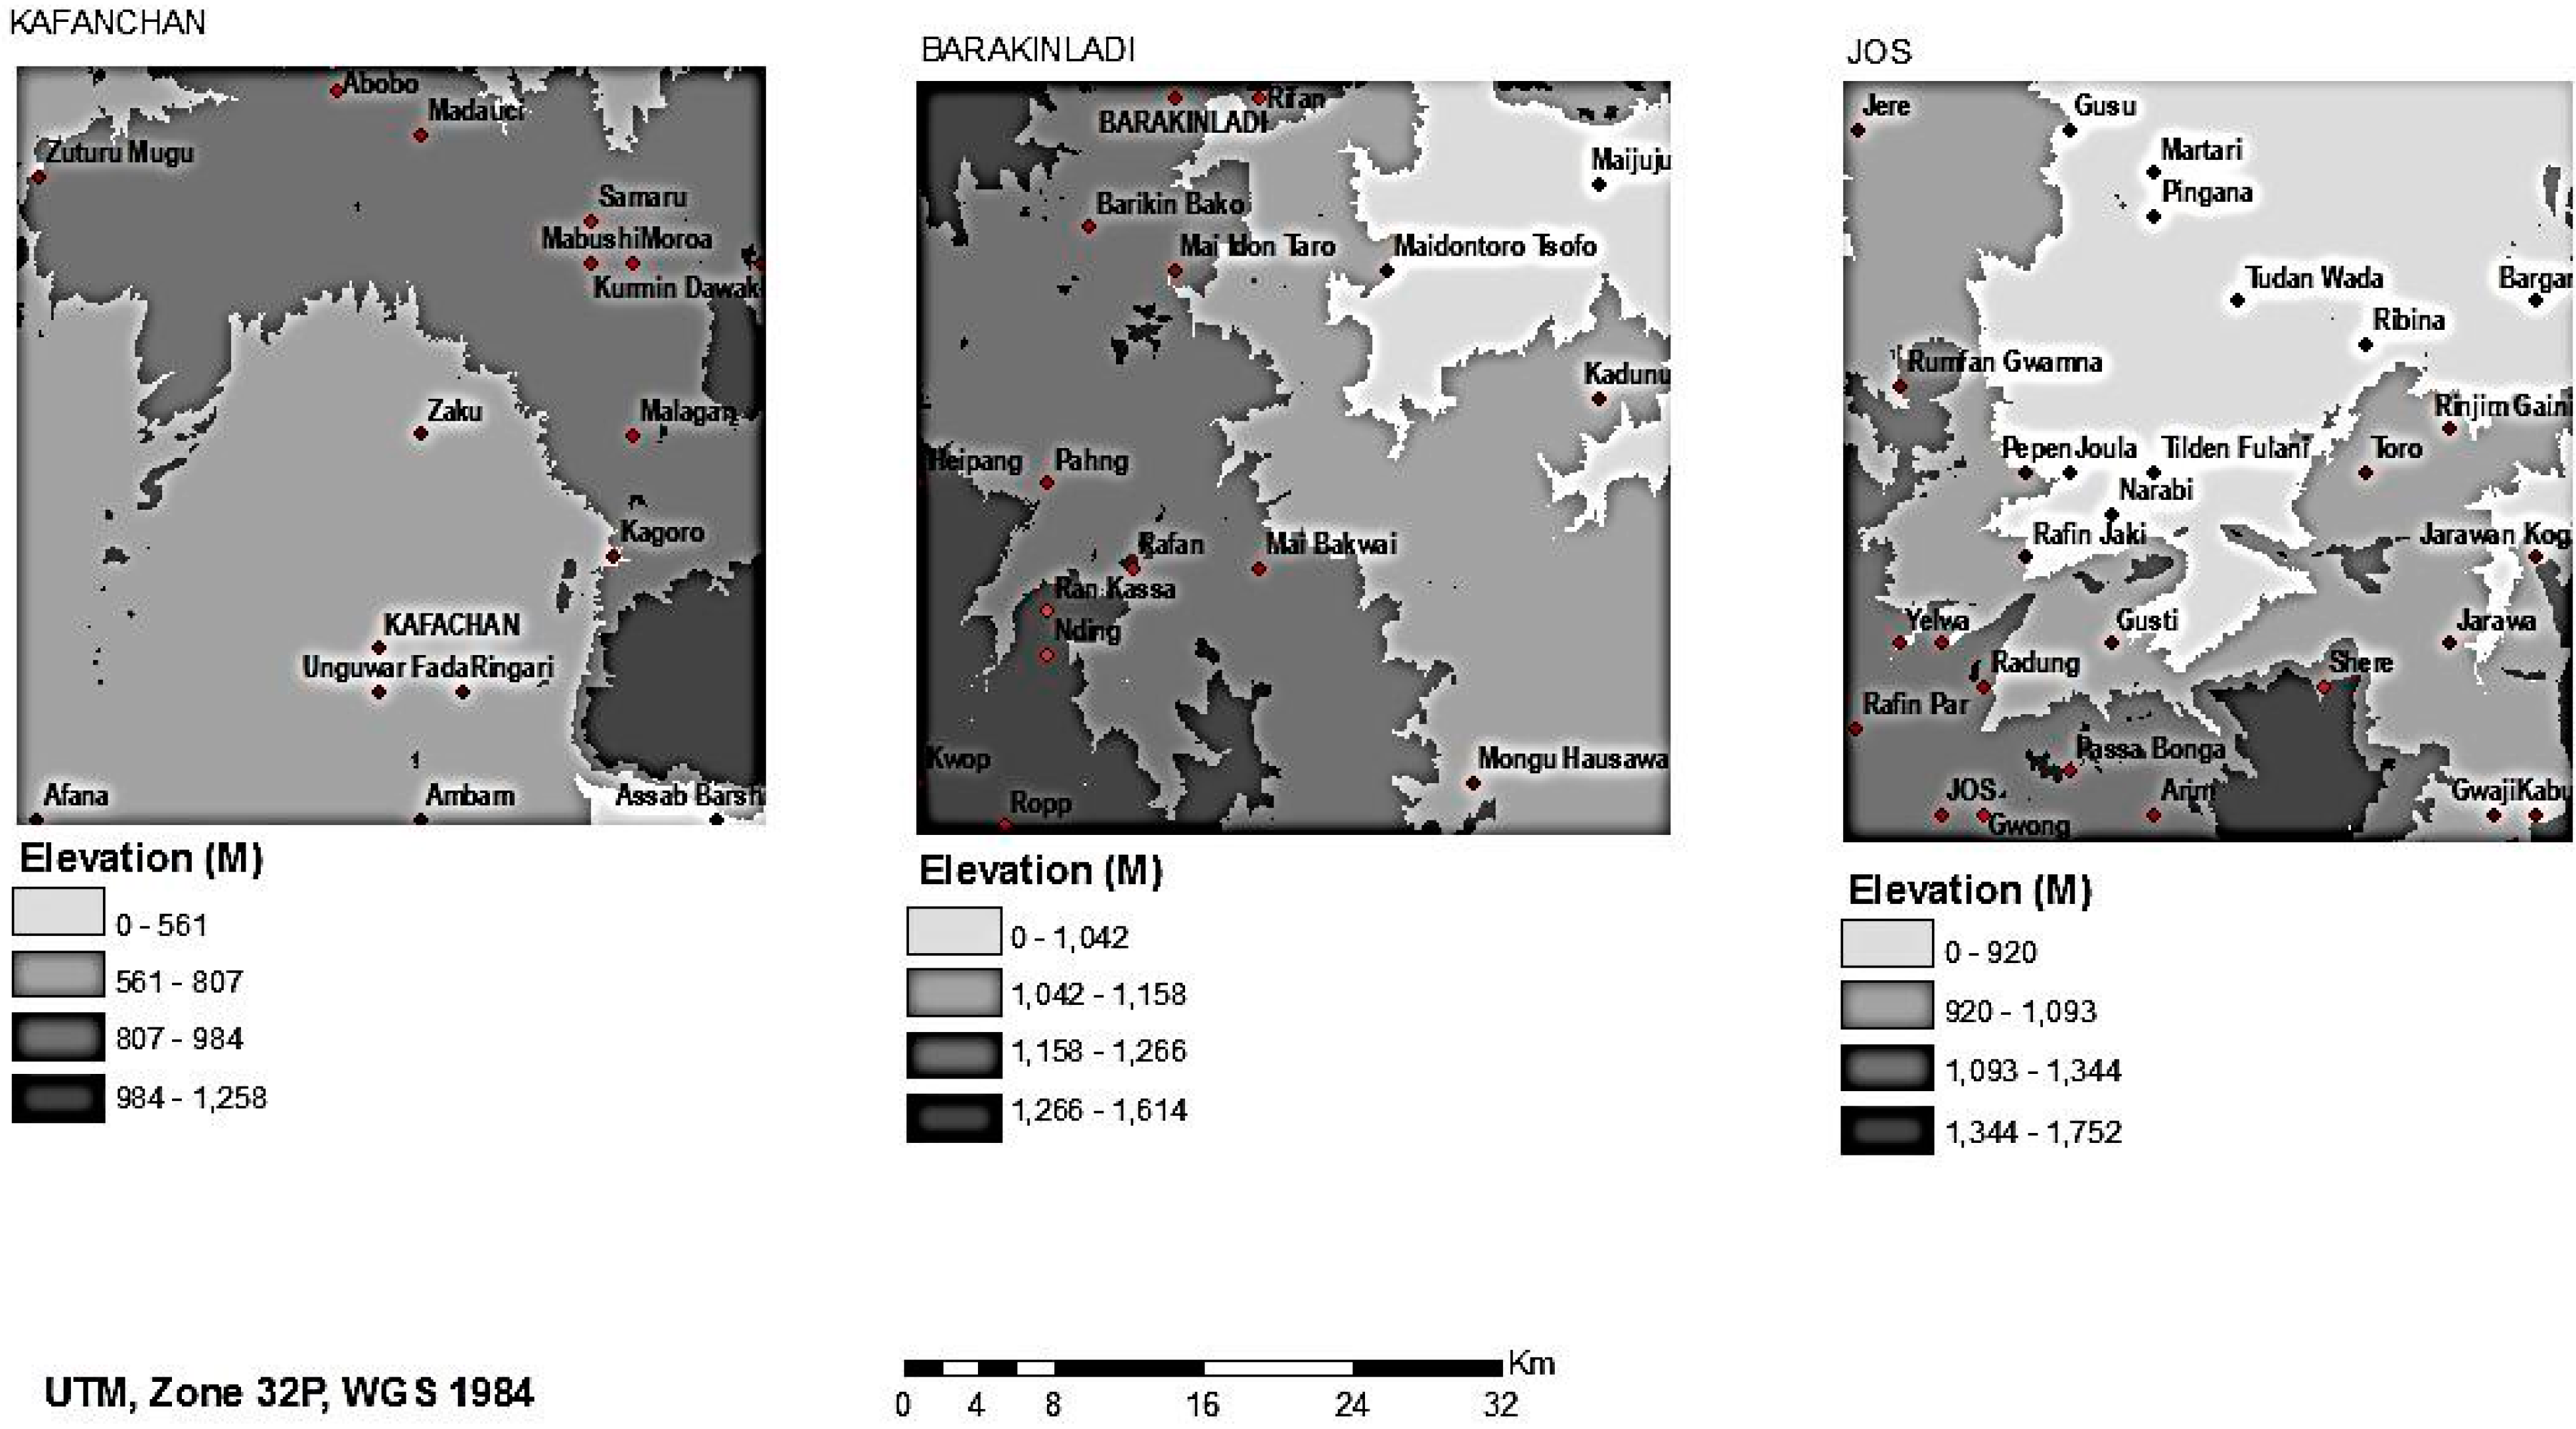
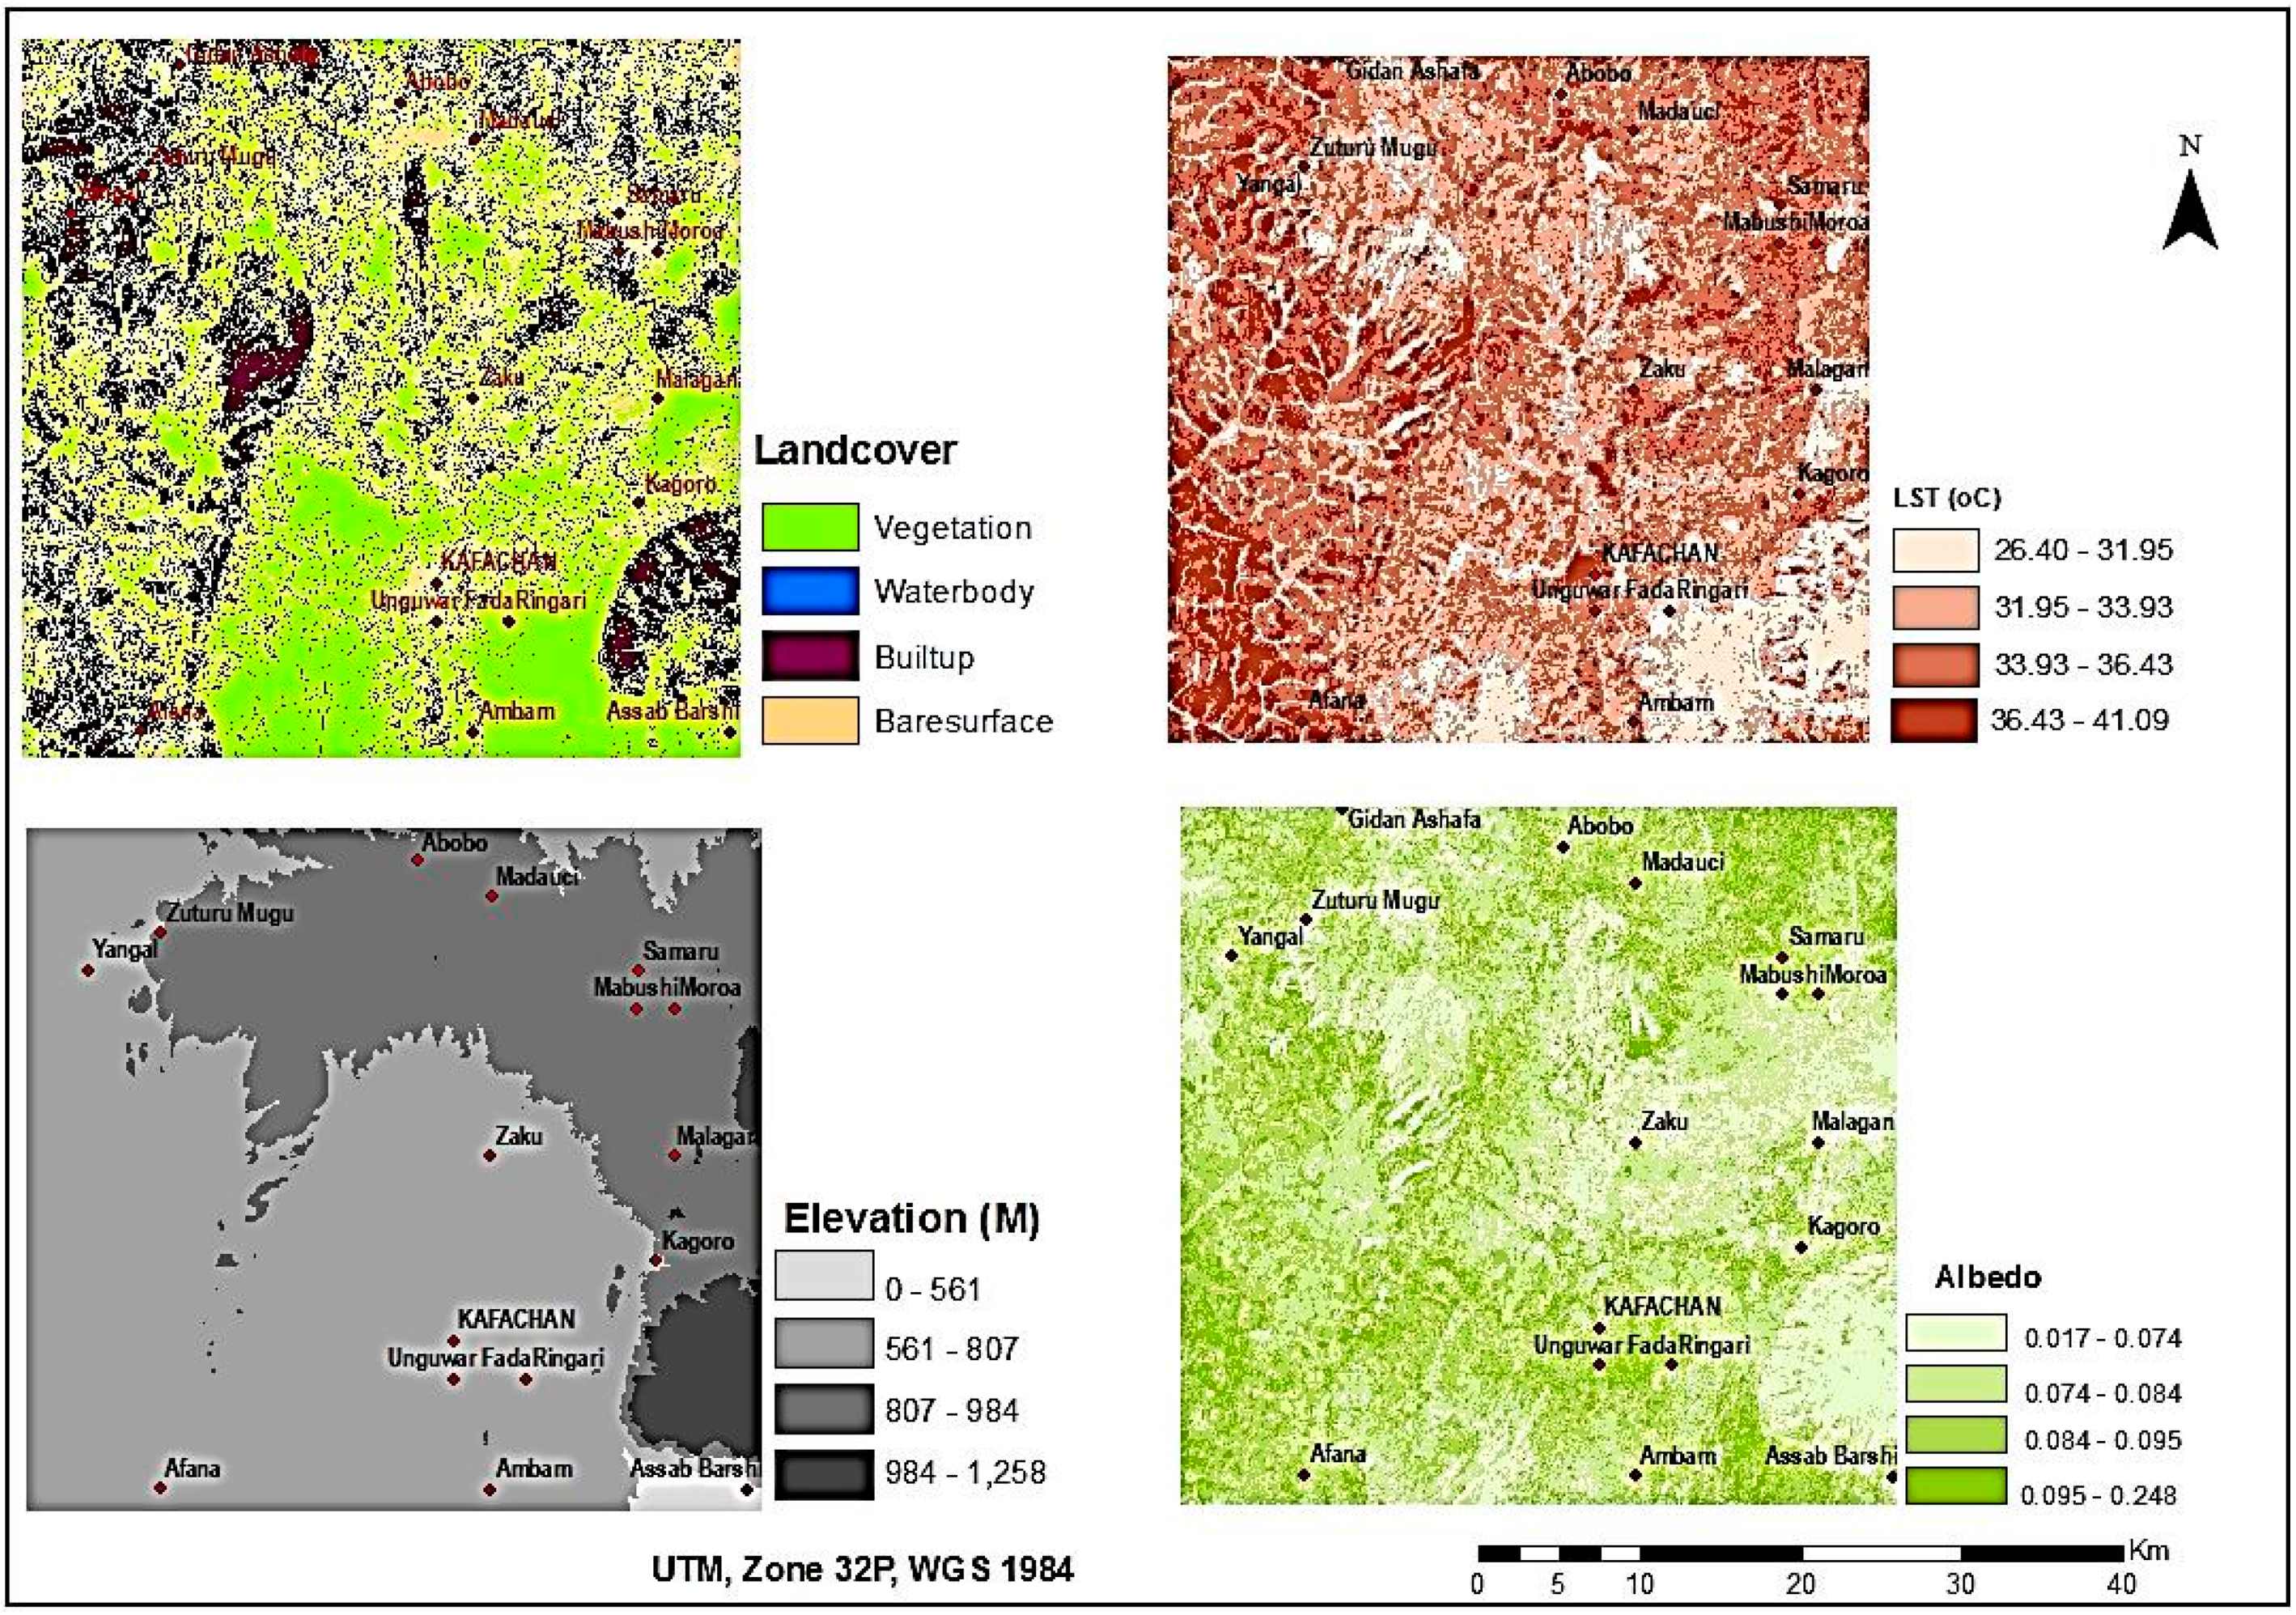
- their altitude morphology (Barakinladi having the highest and Kafachan the lowest; and
- contiguous socioeconomic activities and settlement characteristics.
Analysis of Inter/Intra-Relationships
LST and Albedo Weighted Average Computation
3. Results and Discussion
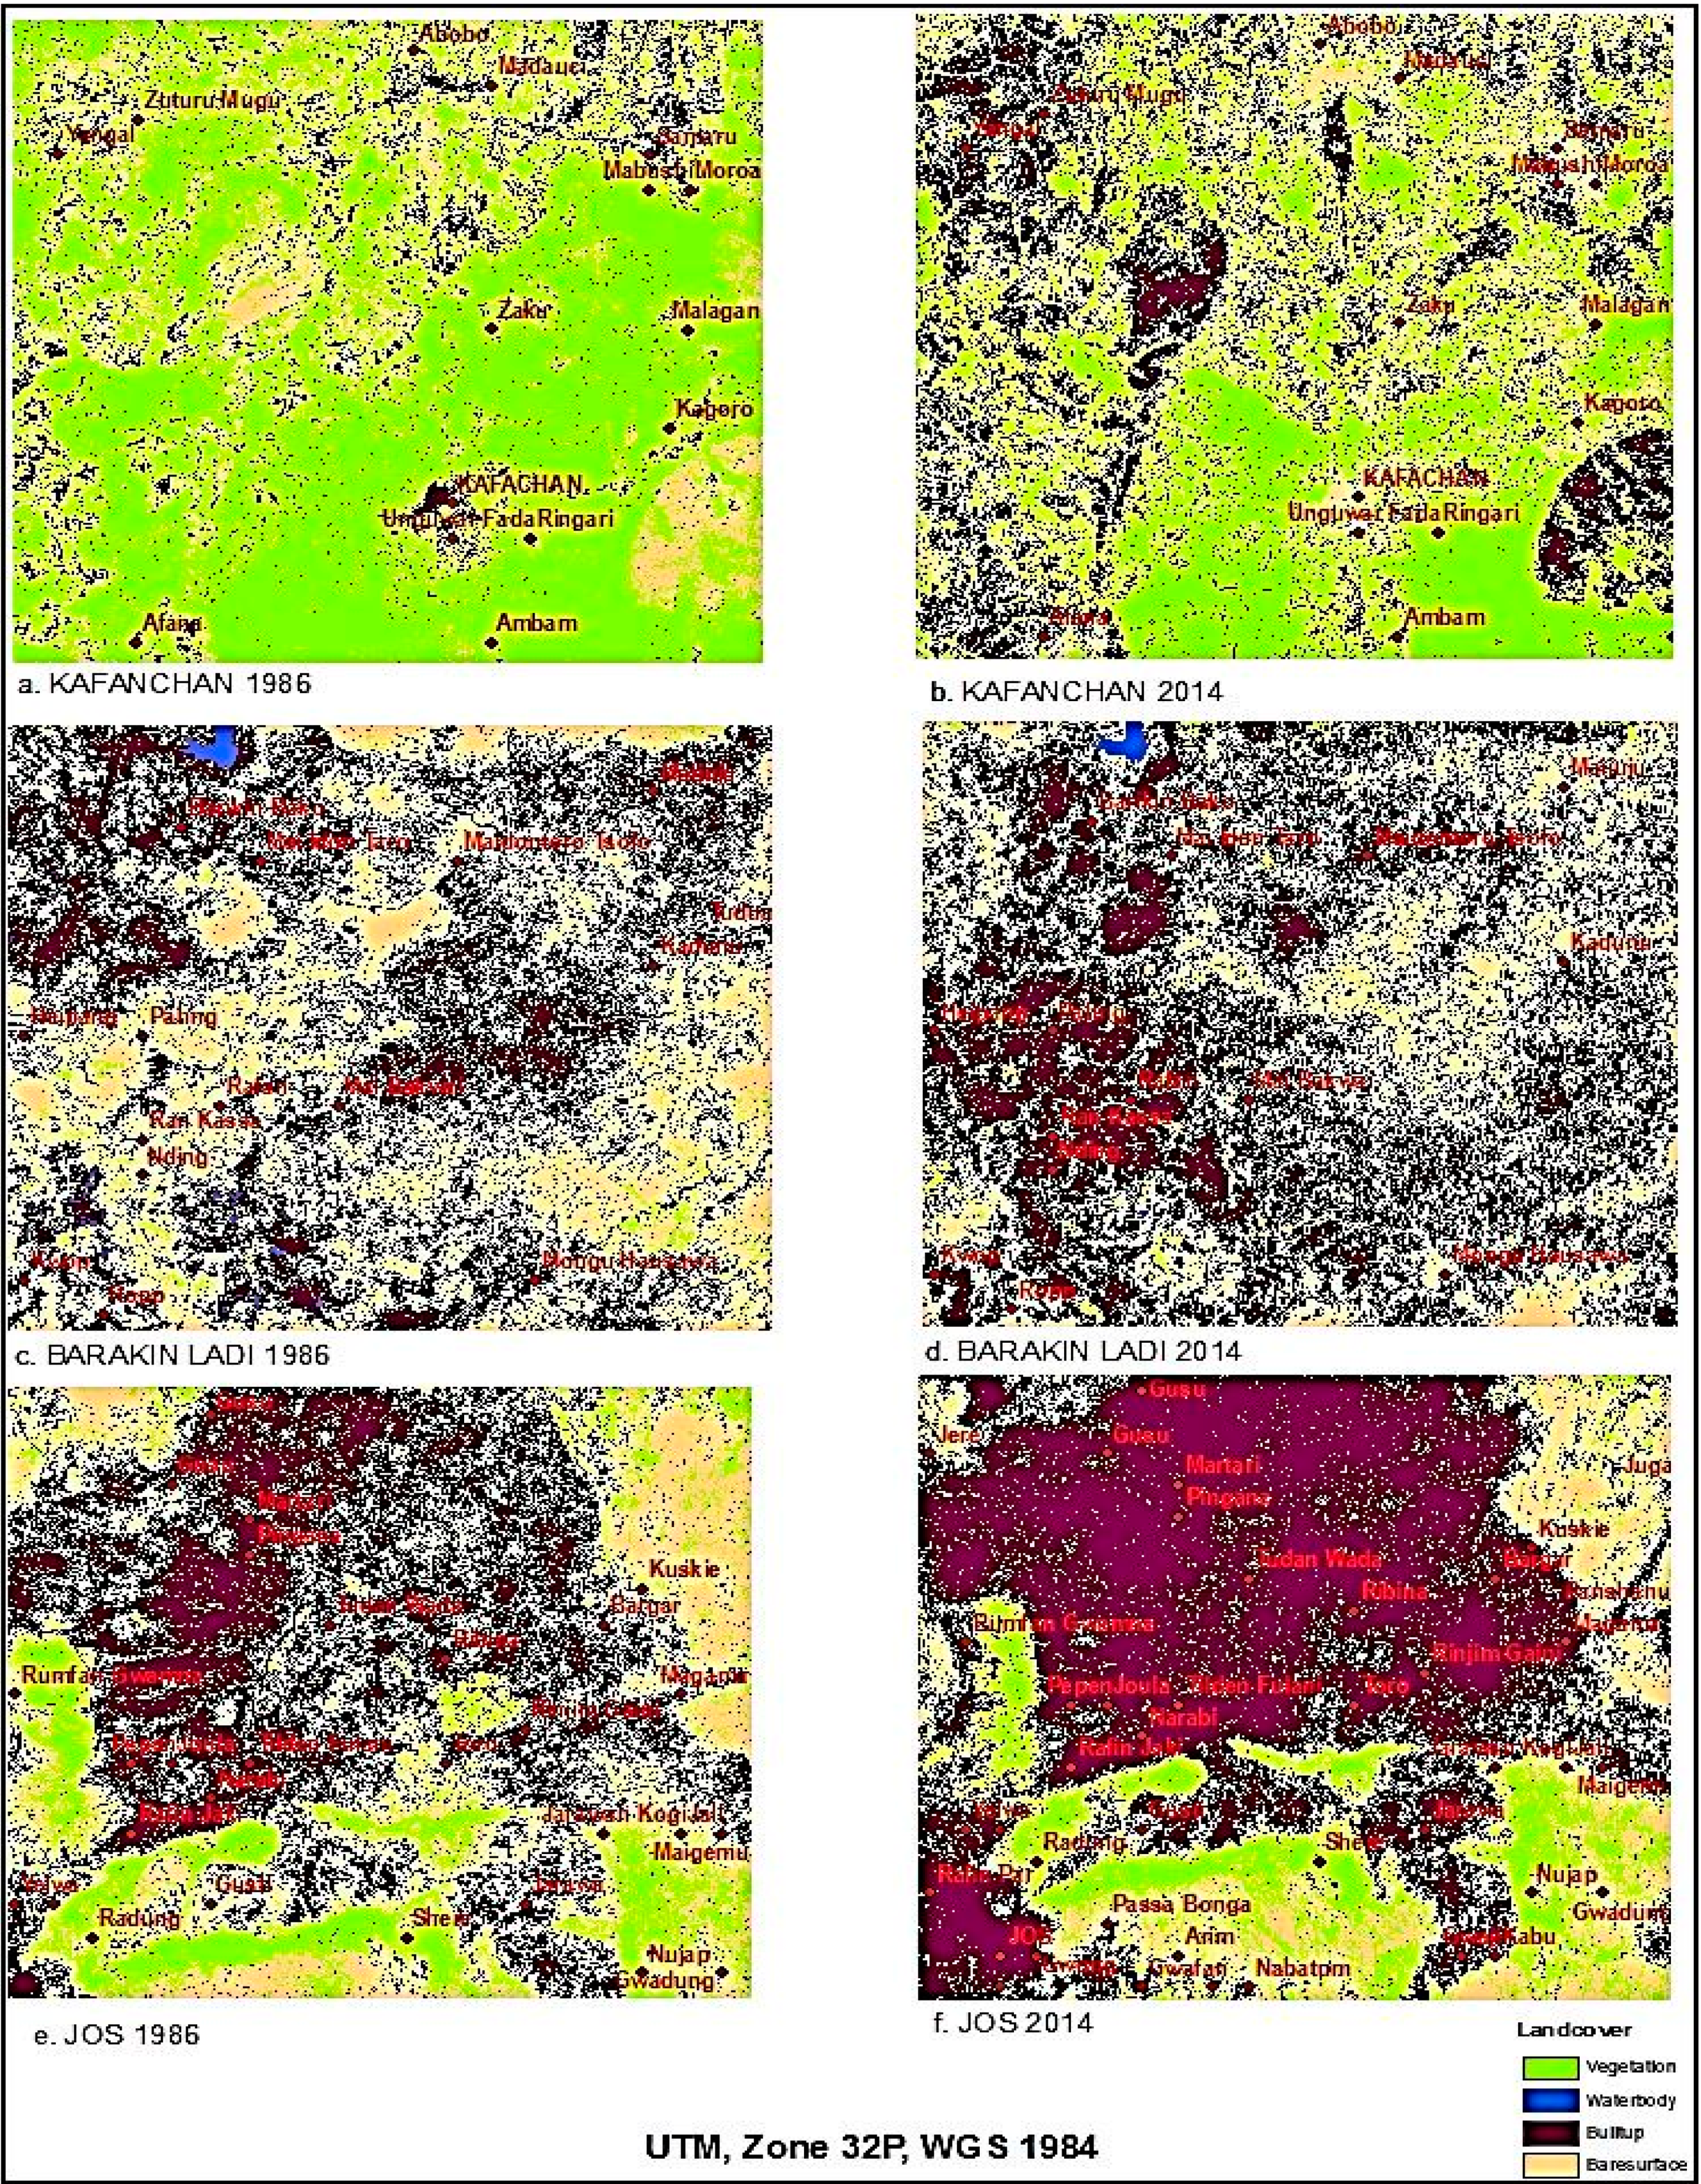
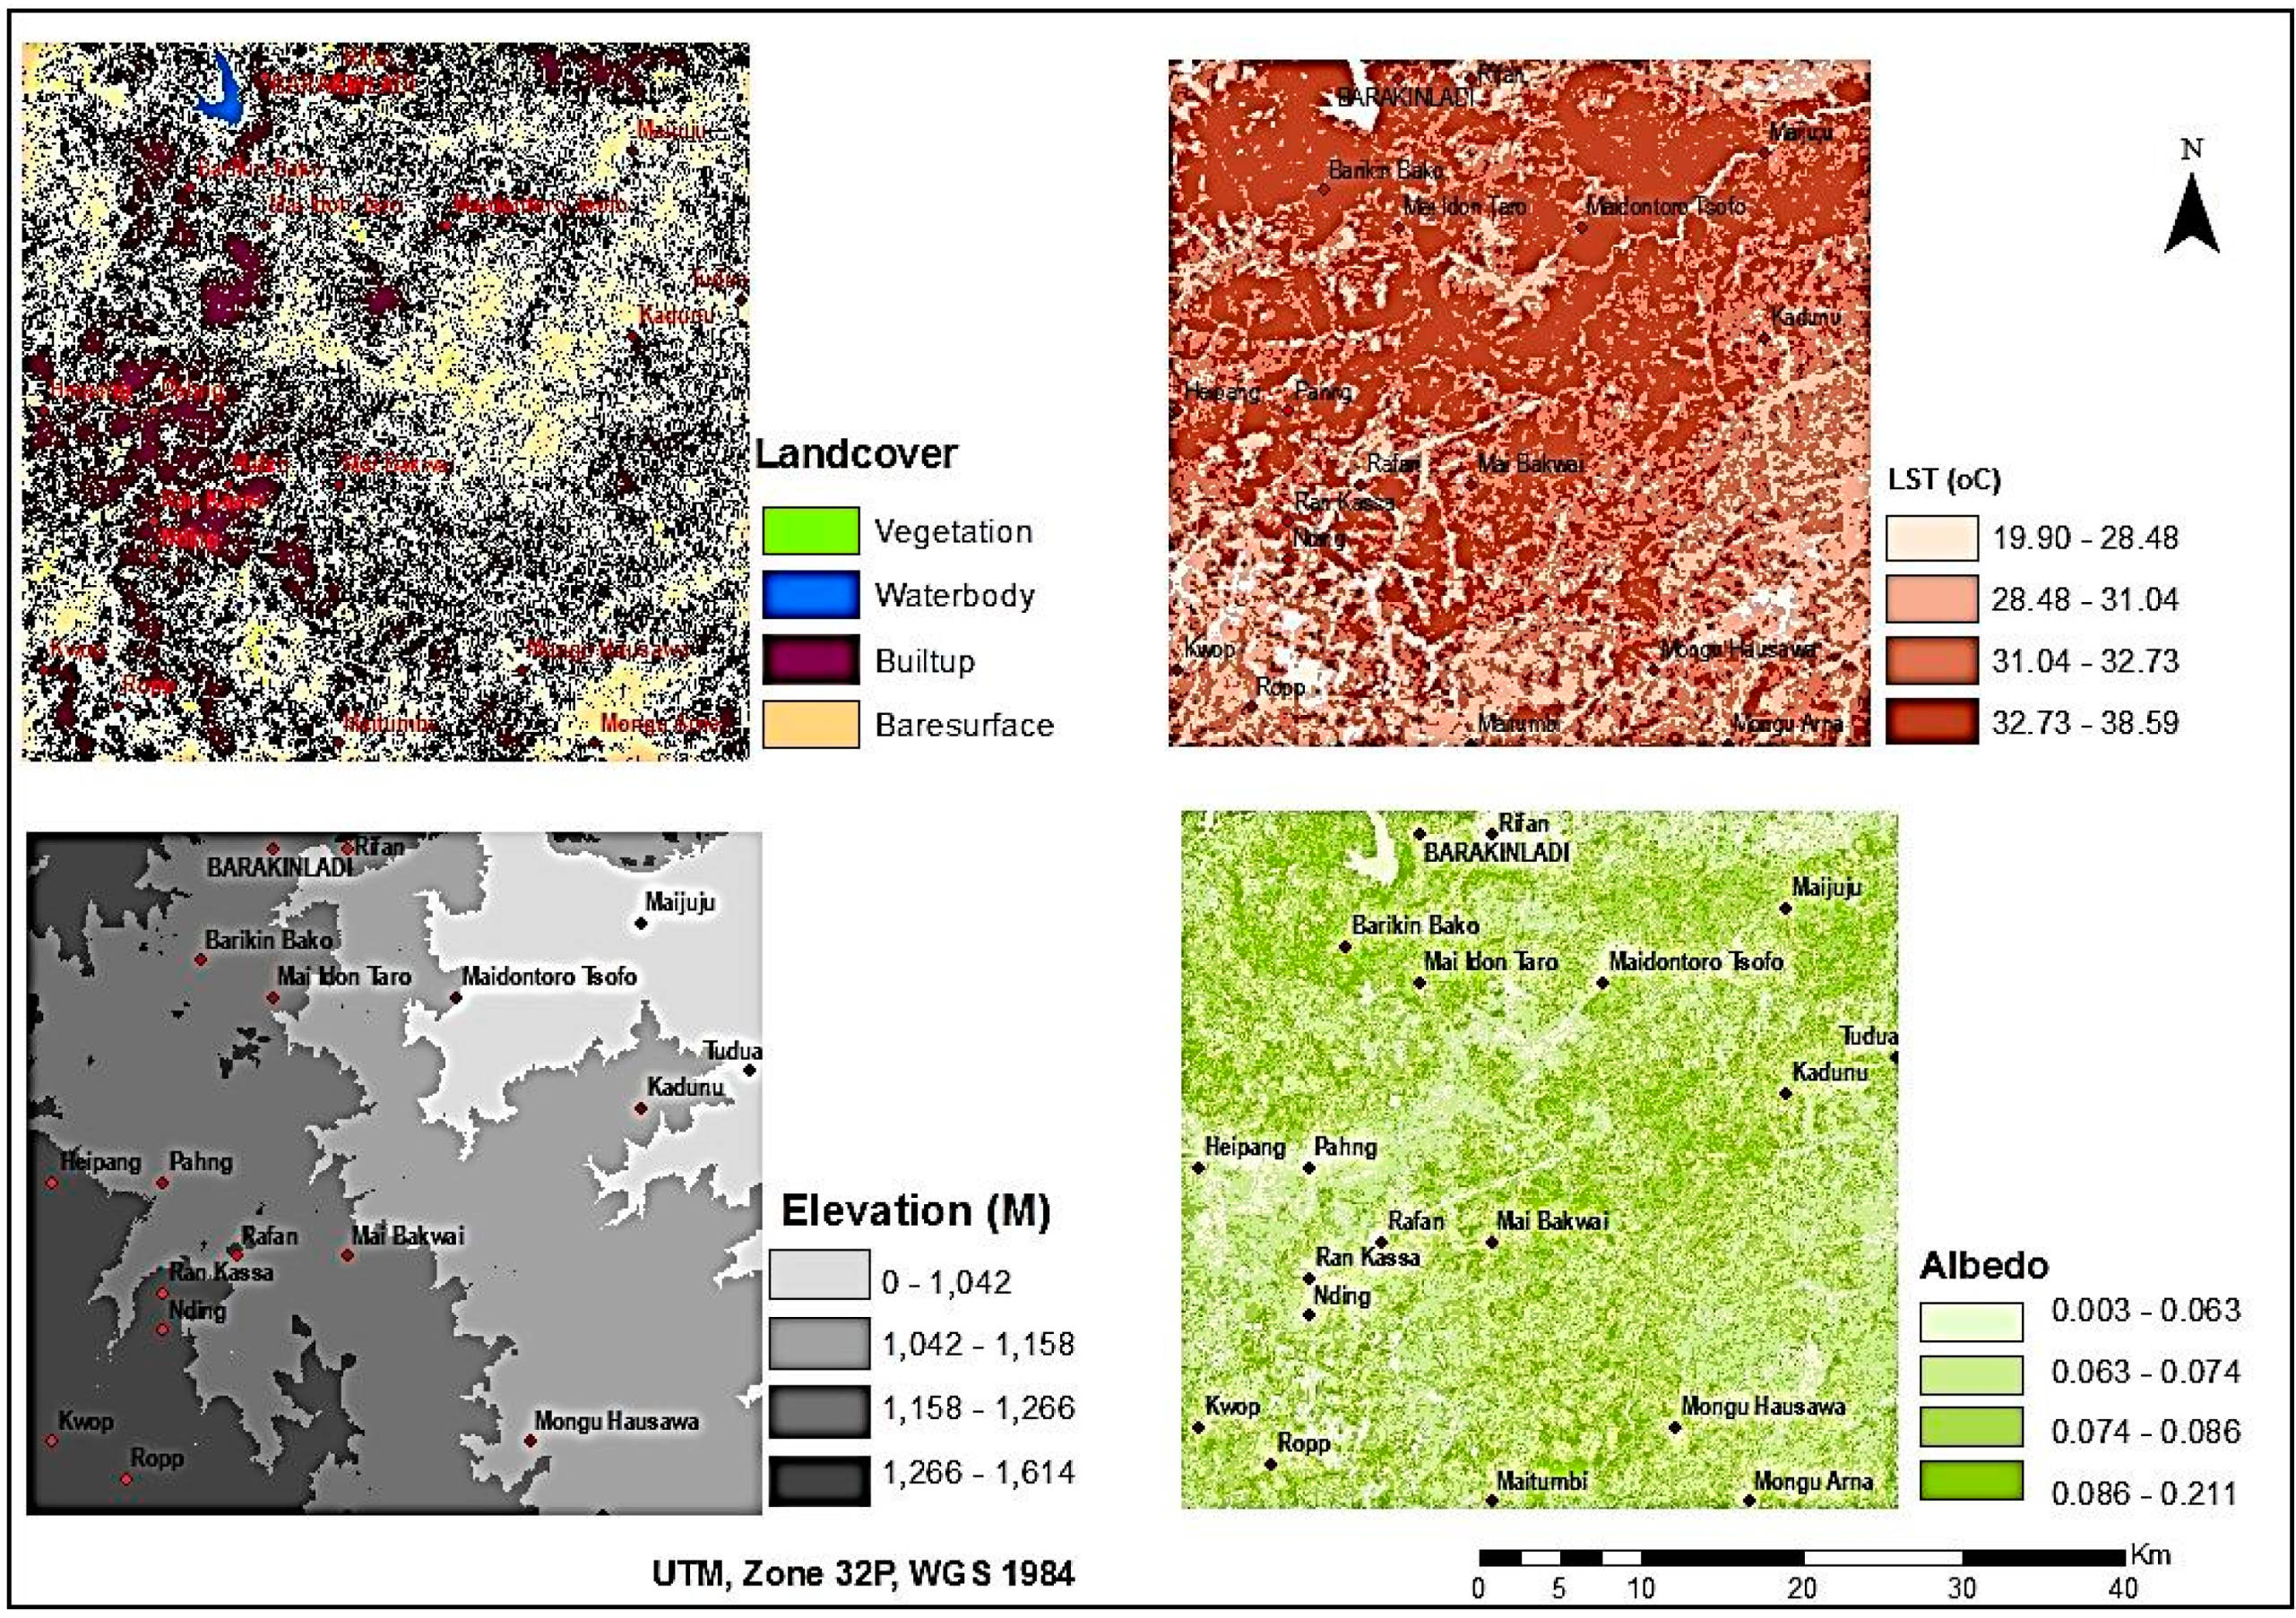
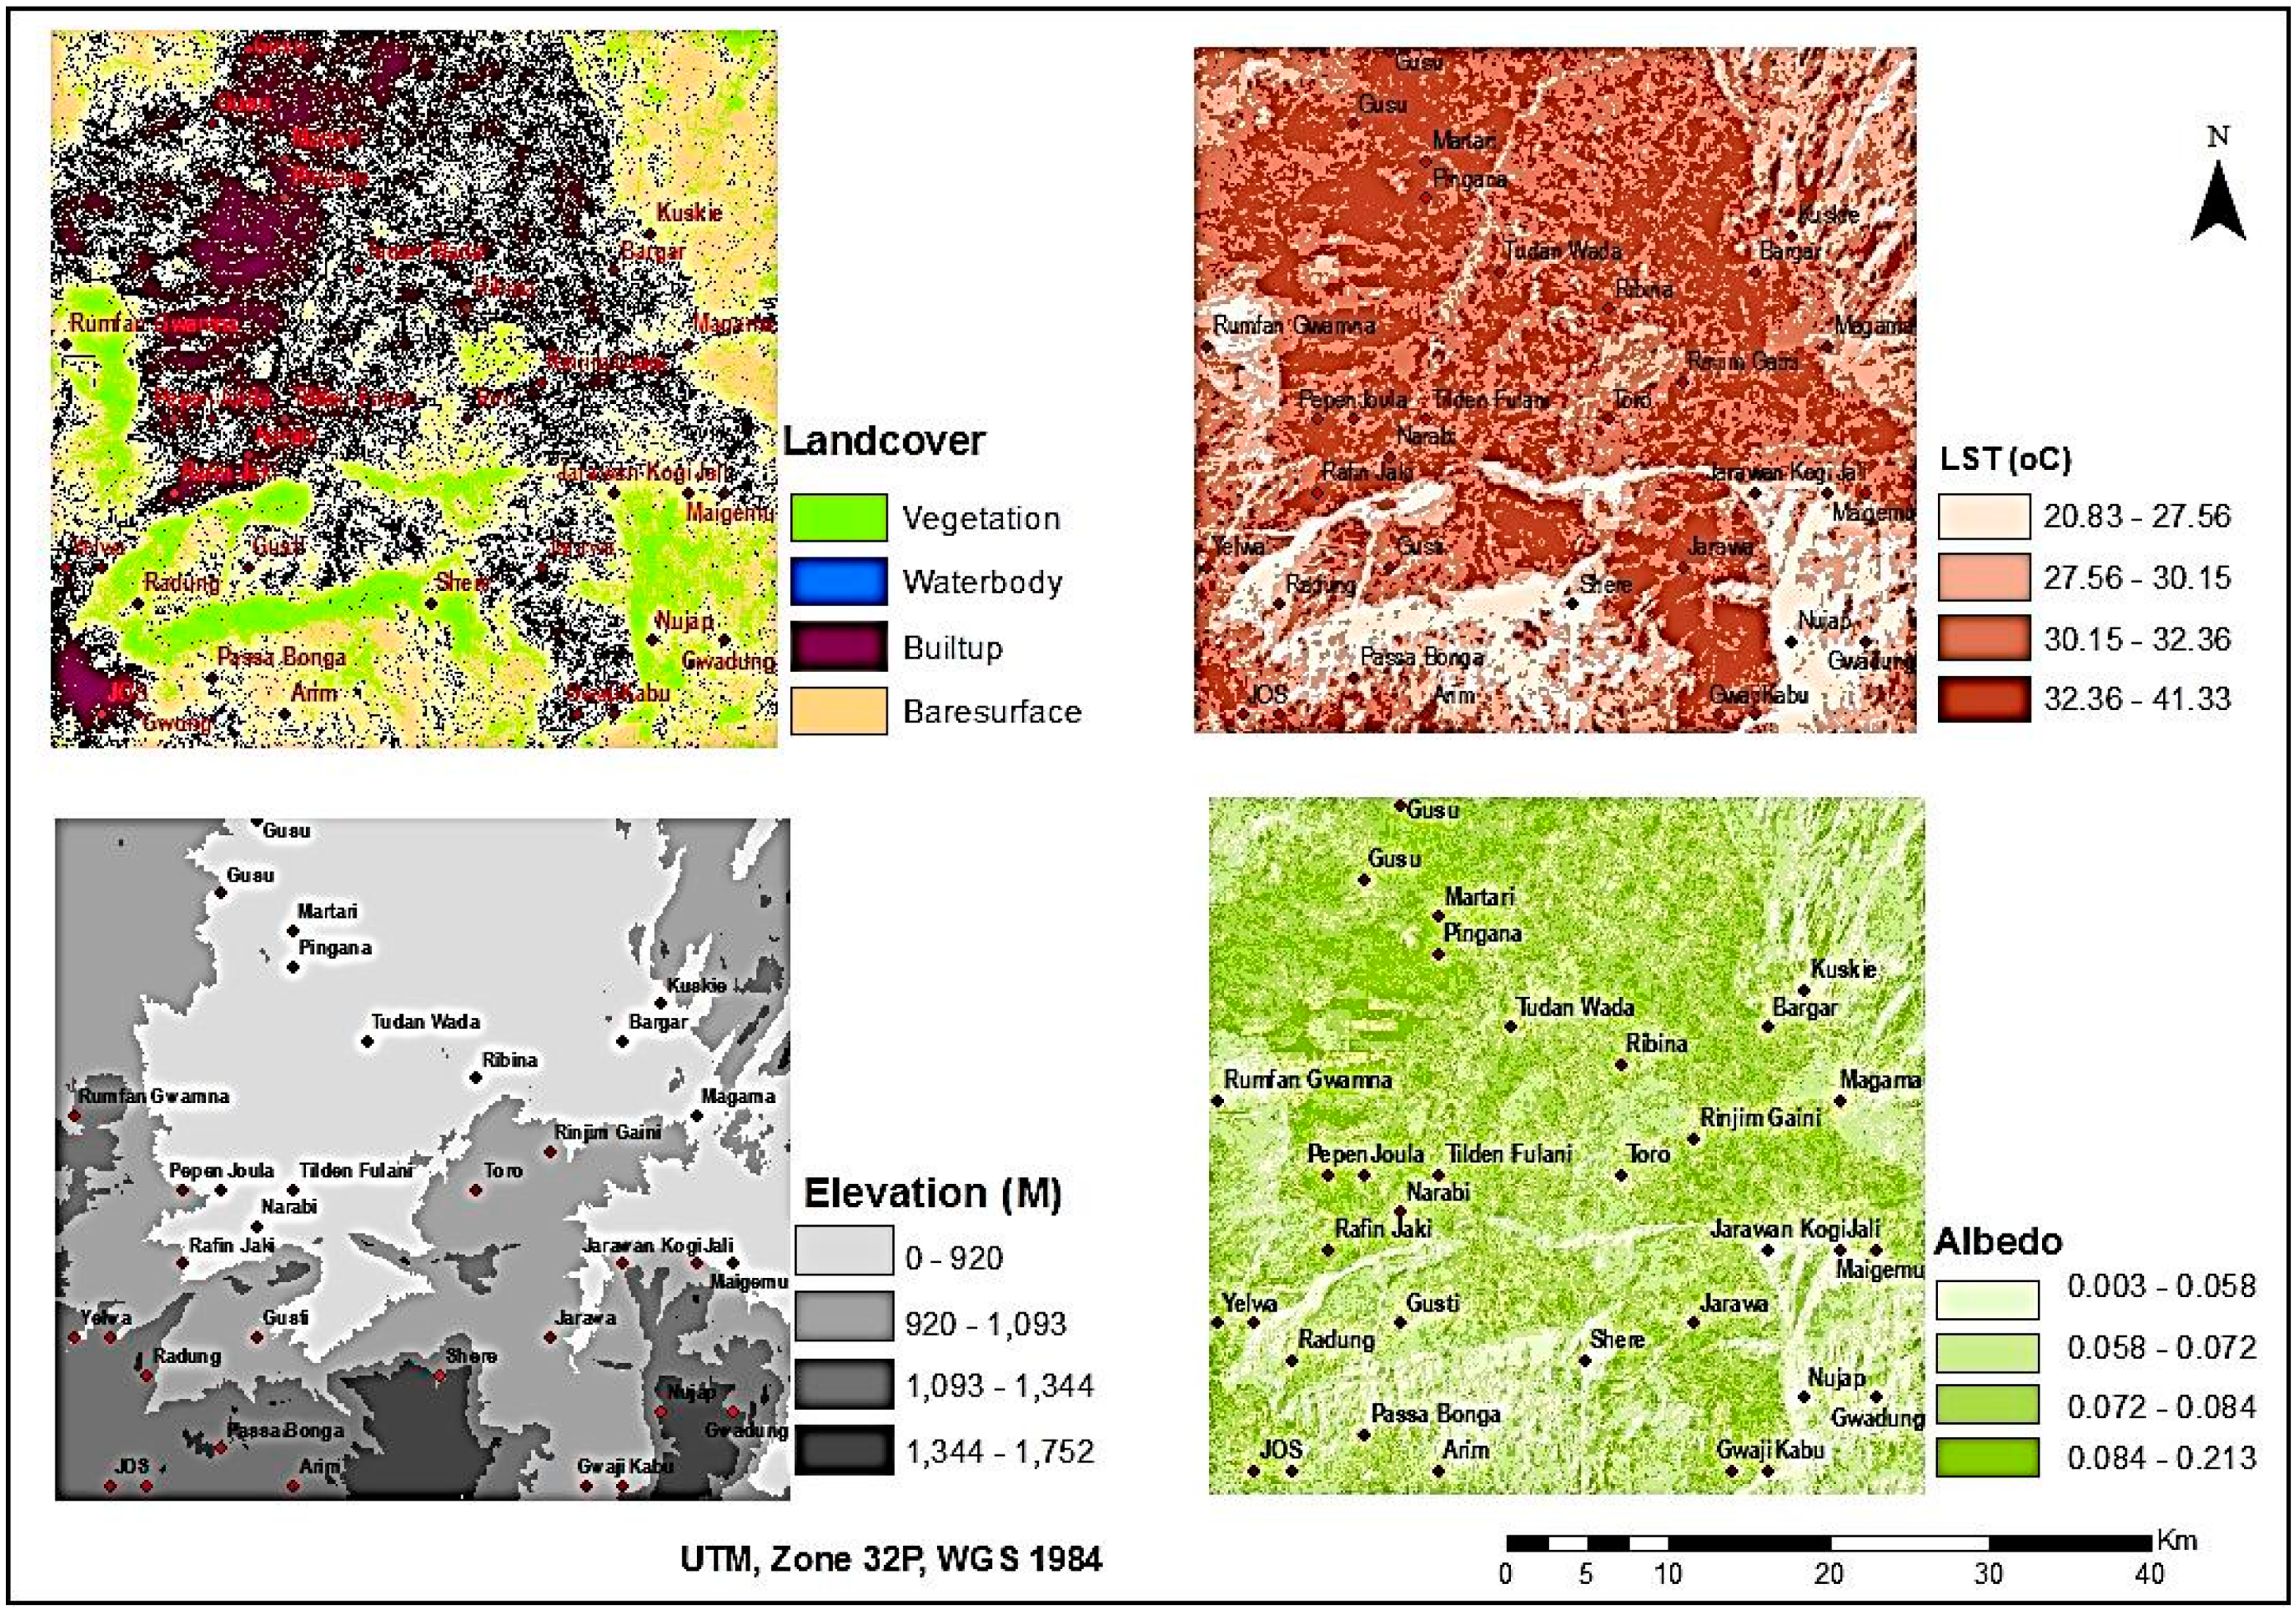
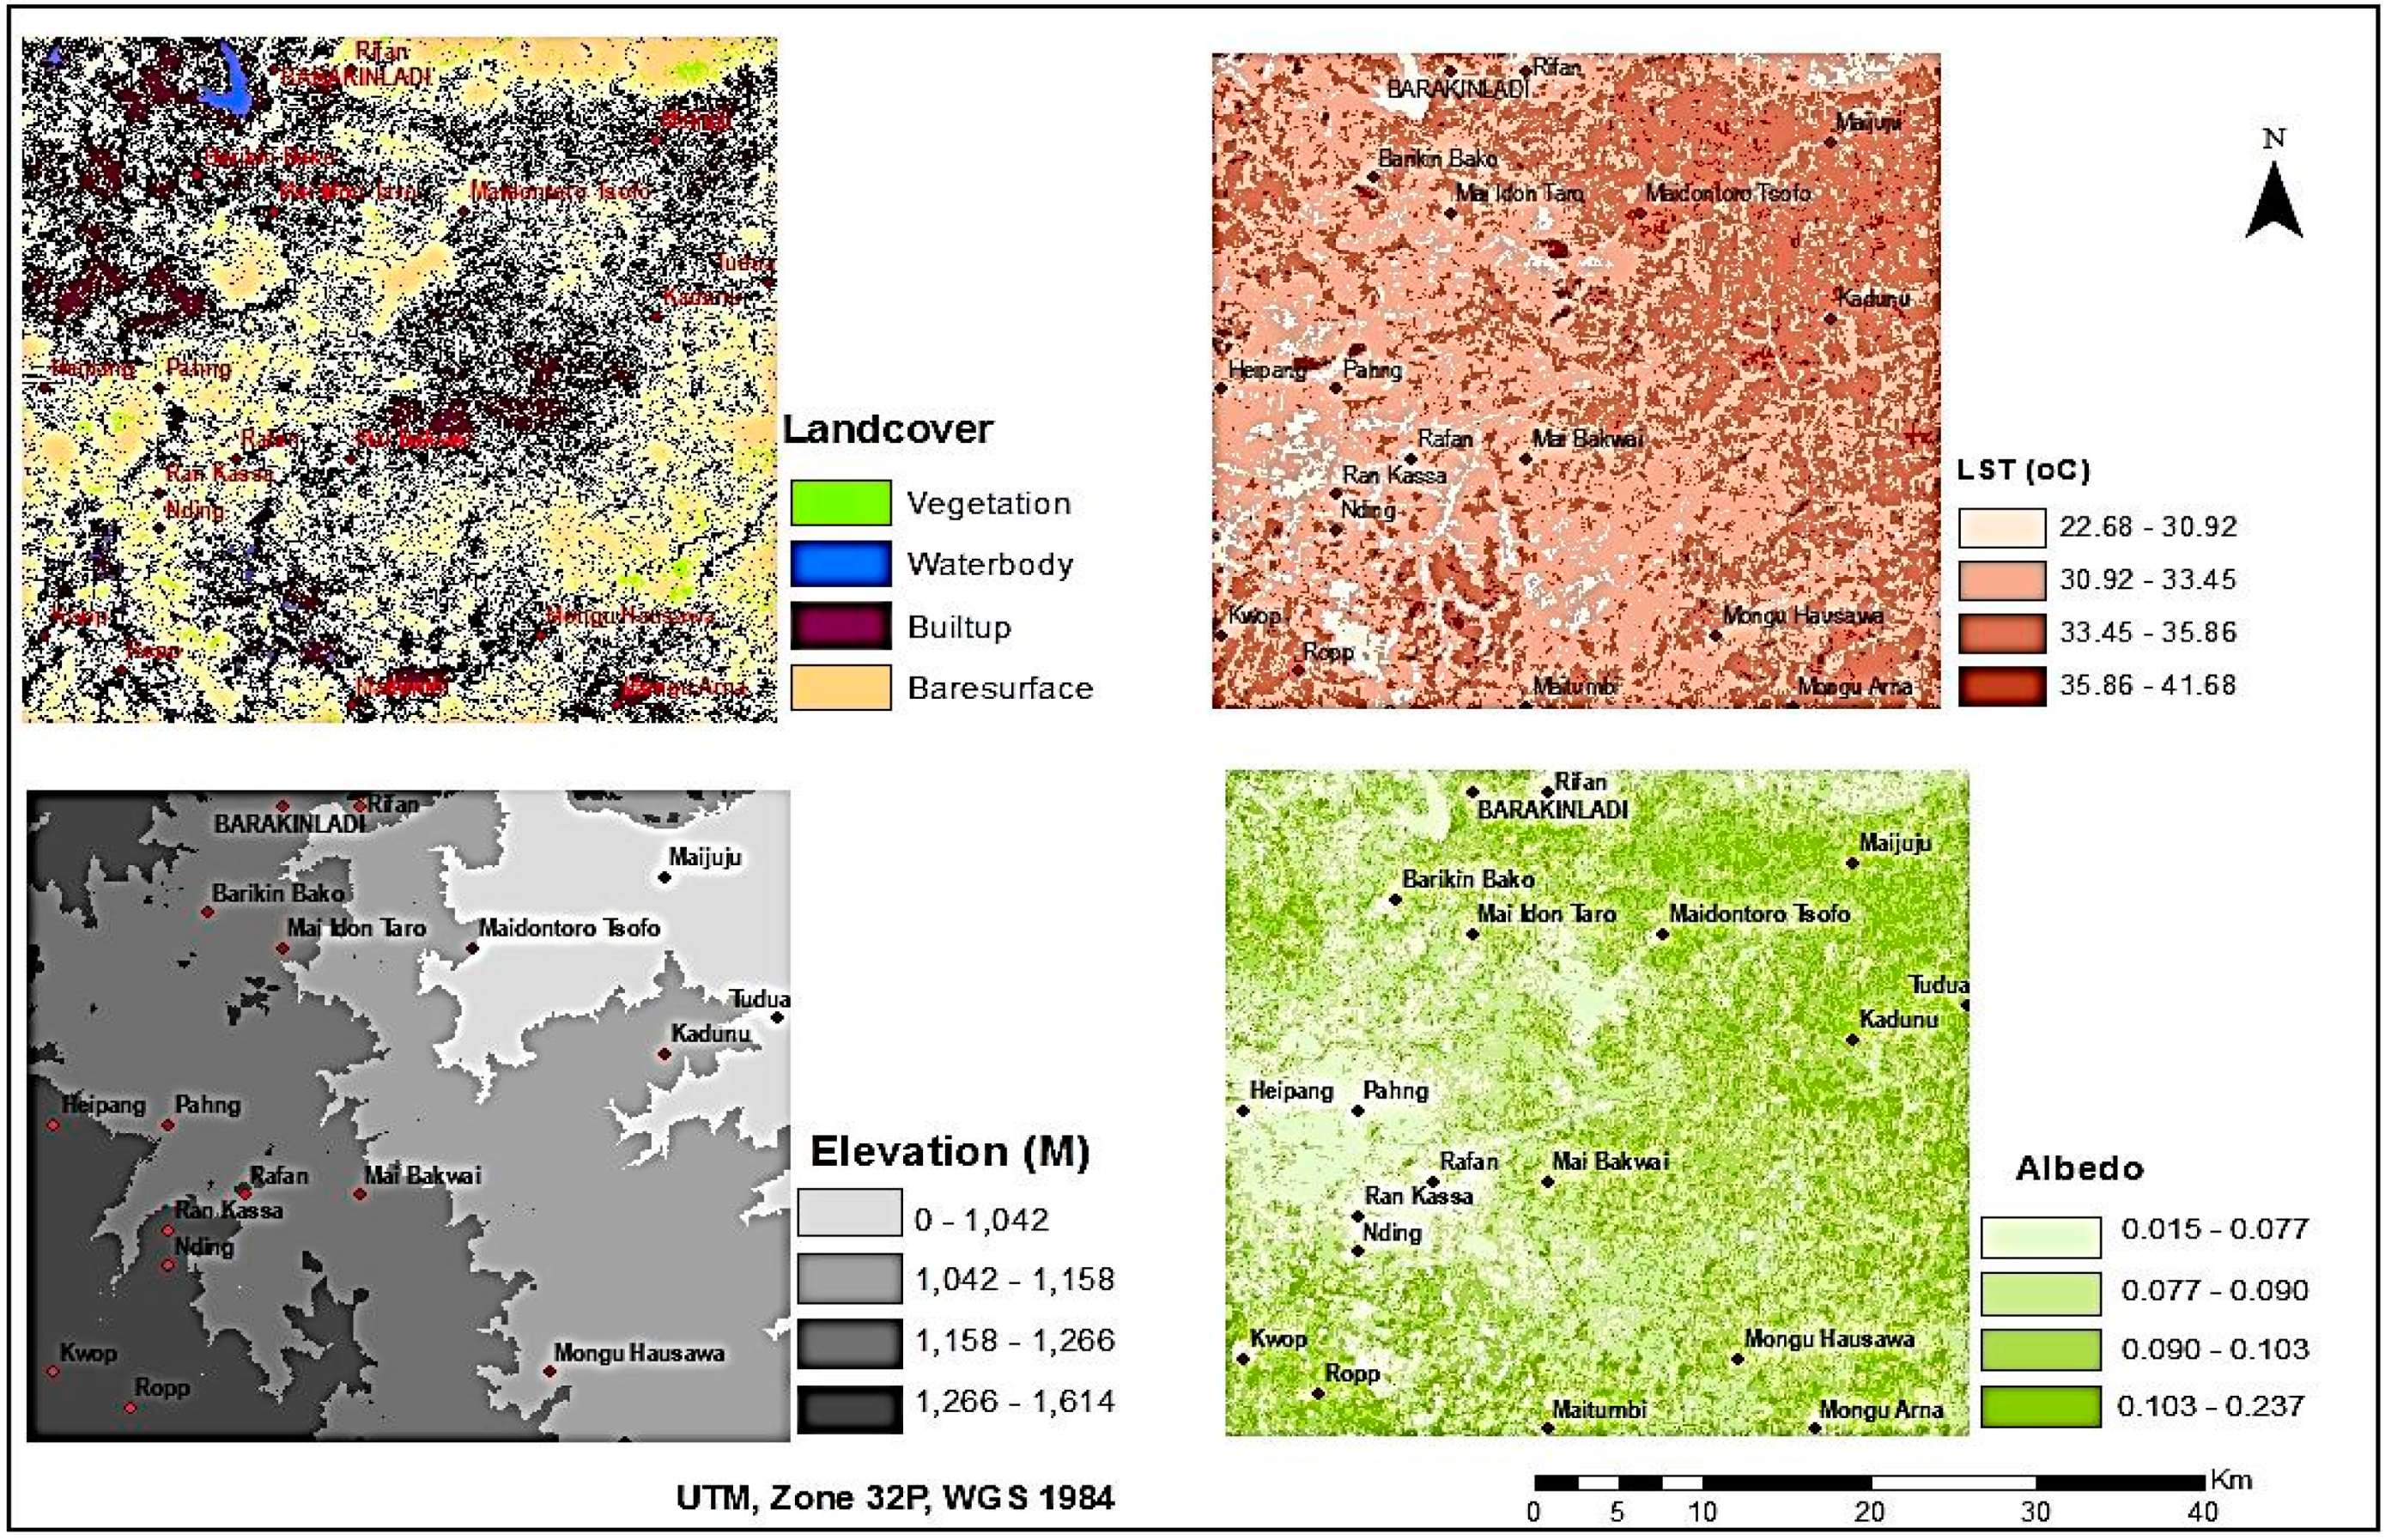
3.1. Landcover, LST, Albedo and Topography Dynamics in the Study Area
3.1.1. Landcover Change

| Land Cover | Area in 1986 | % | Area in 2014 | % | % Change |
|---|---|---|---|---|---|
| Vegetation | 716,659 | 29.048 | 468,787 | 19.001 | −10.047 |
| Water body | 33 | 0.0013 | 2 | 0.000 | −0.001 |
| Built up | 812,973 | 32.952 | 962,427 | 39.010 | 6.058 |
| Cultivation/Bare surface | 937,463 | 37.998 | 1,035,912 | 41.989 | 3.990 |
| Total | 2,467,128 | 100.0 | 2,467,128 | 100.0 | 0.00 |
| Land Cover | Area Covered in 1986 | % | Area Covered in 2014 | % | % Change |
|---|---|---|---|---|---|
| Vegetation | 369,658 | 14.98 | 208,523 | 8.452 | −6.531 |
| Water body | 16,061 | 0.65 | 9650 | 0.391 | −0.260 |
| Built up | 975,219 | 39.53 | 1,174,055 | 47.588 | 8.059 |
| Cultivation/Bare surface | 1,106,190 | 44.84 | 1,074,900 | 43.569 | −1.268 |
| Total | 2,467,128 | 100 | 2,467,128 | 100 | 0 |
| Land Cover | Area Covered in 1986 | % | Area Covered in 2014 | % | % Change |
|---|---|---|---|---|---|
| Vegetation | 303,242 | 12.291296 | 124,127 | 5.03123 | −7.2600611 |
| Water body | 401 | 0.0162537 | 9 | 0.00036 | −0.0158889 |
| Built up | 845,115 | 34.255012 | 904,881 | 36.6775 | 2.4224929 |
| Cultivation/Bare surface | 1,318,370 | 53.437438 | 1,438,111 | 58.2909 | 4.8534571 |
| Total | 2,467,128 | 100 | 2,467,128 | 100 | 0 |
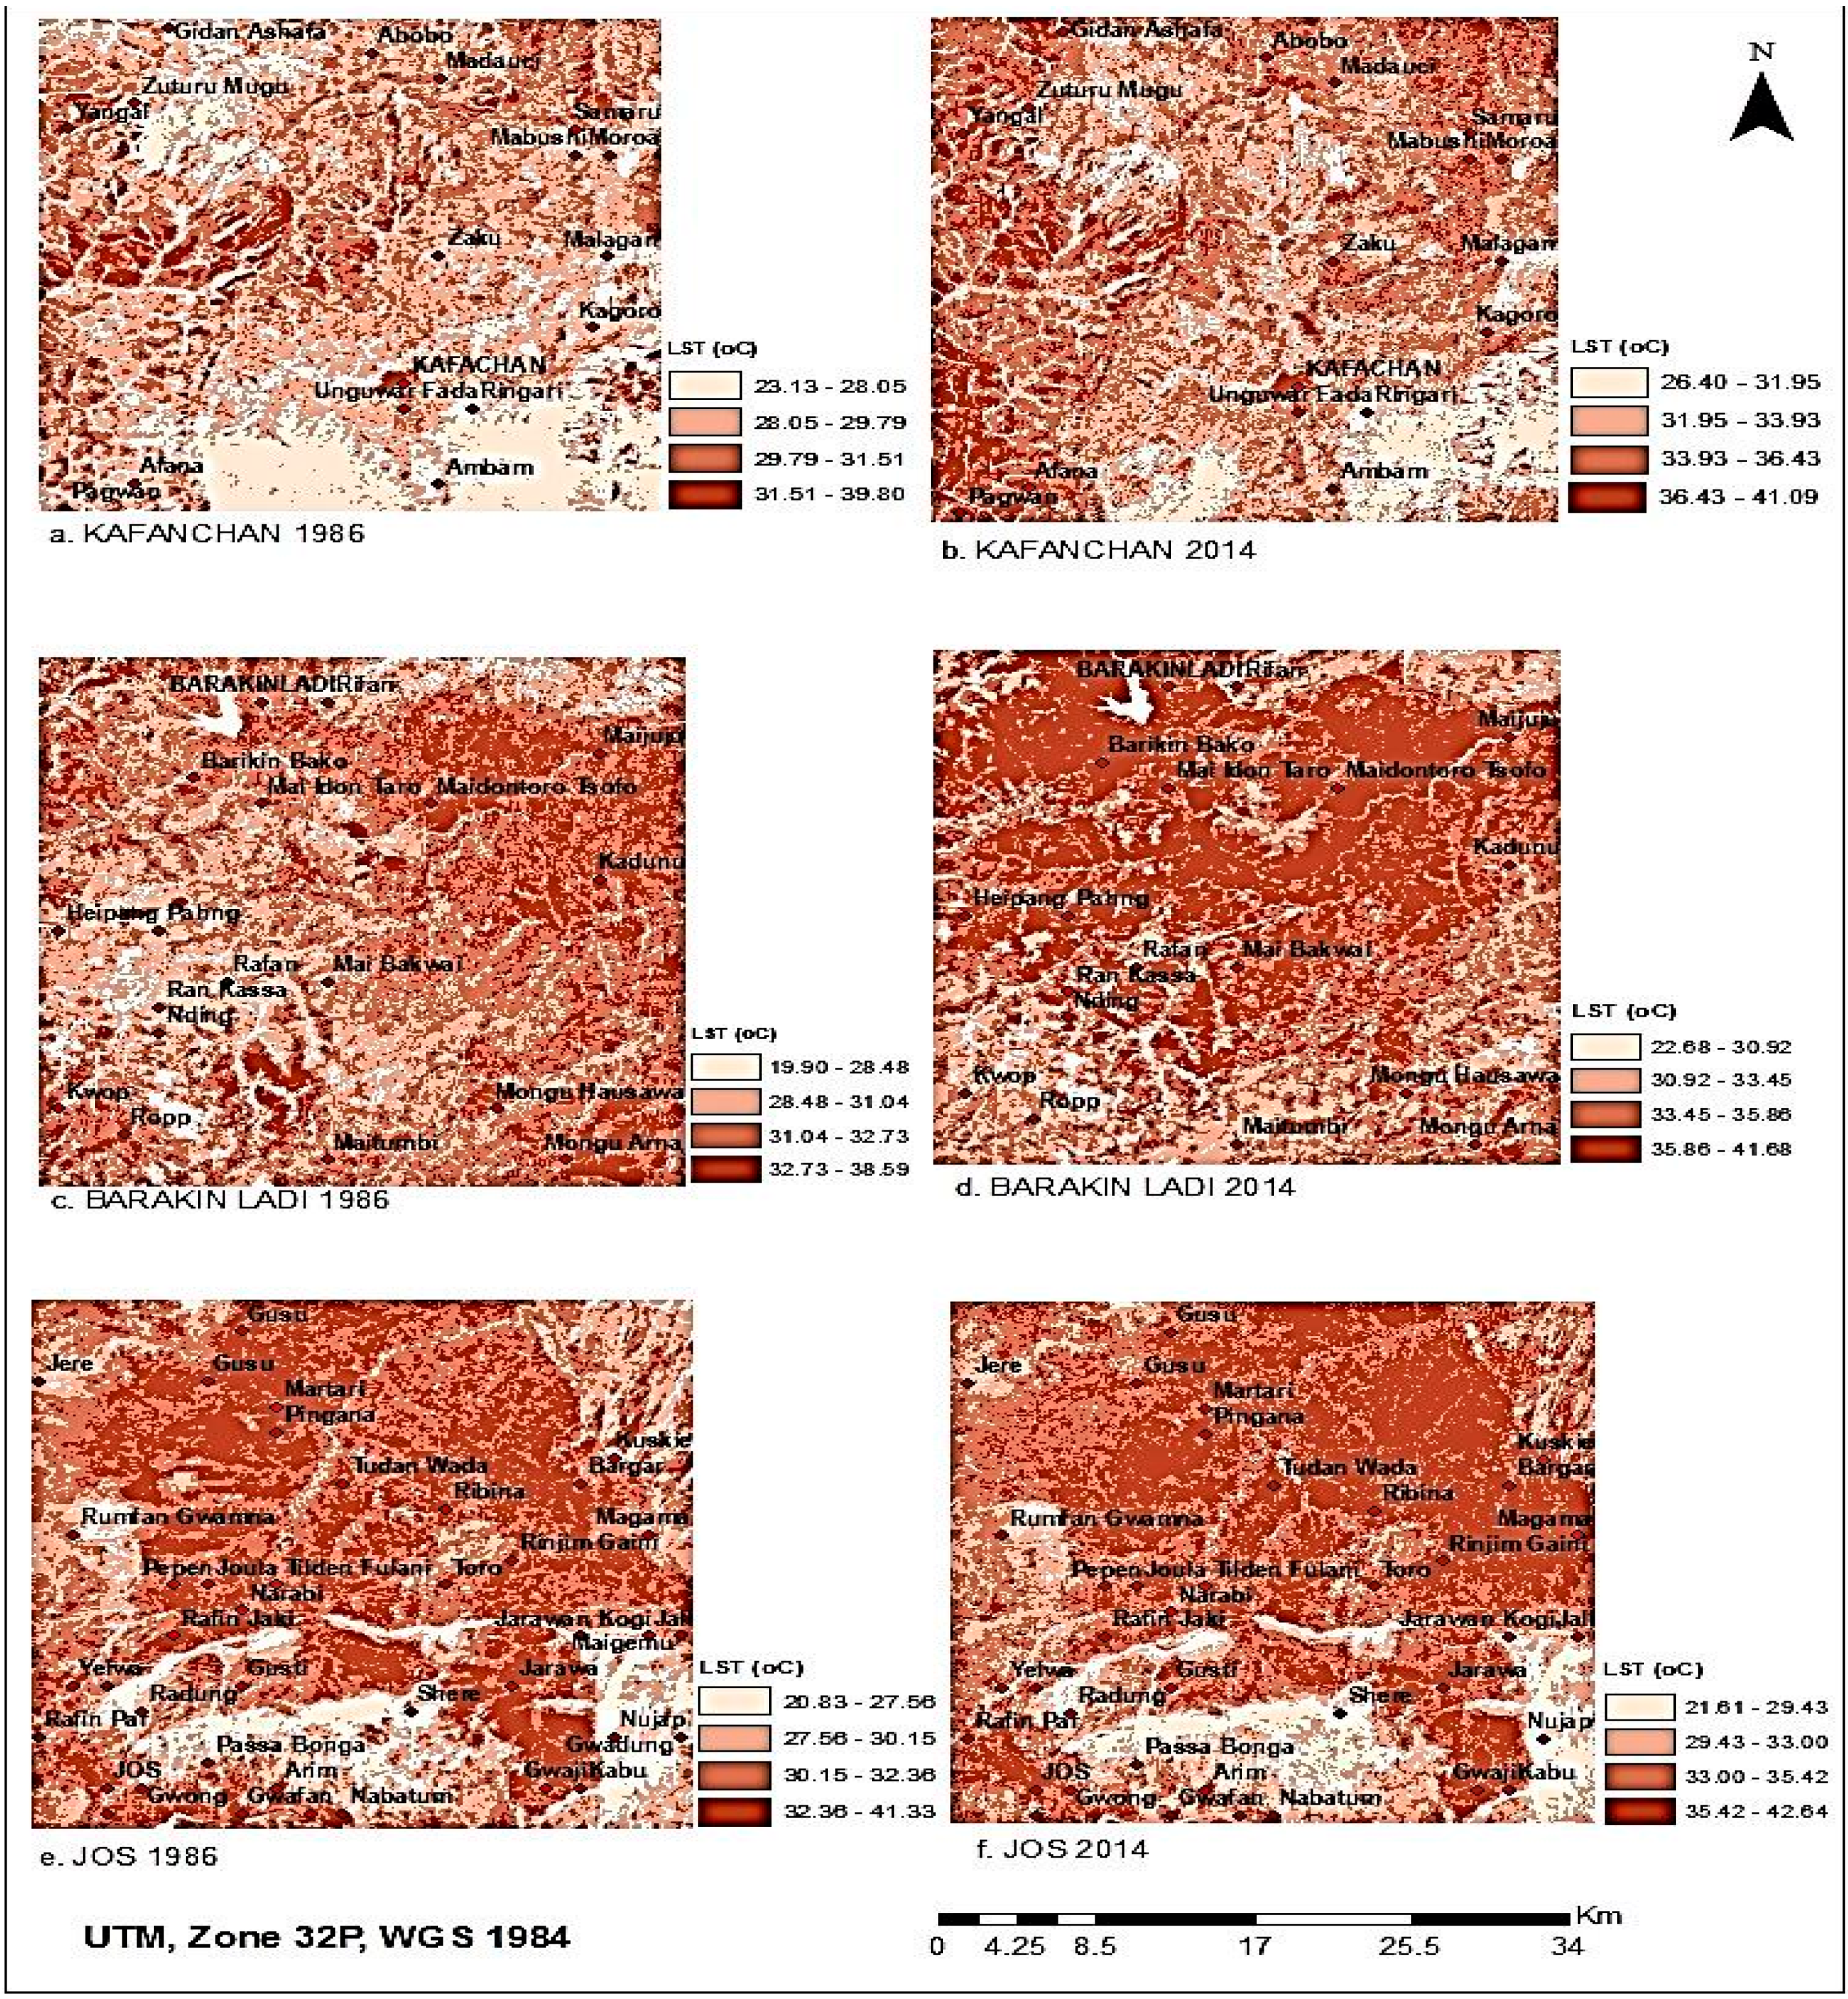
3.1.2. LST Change
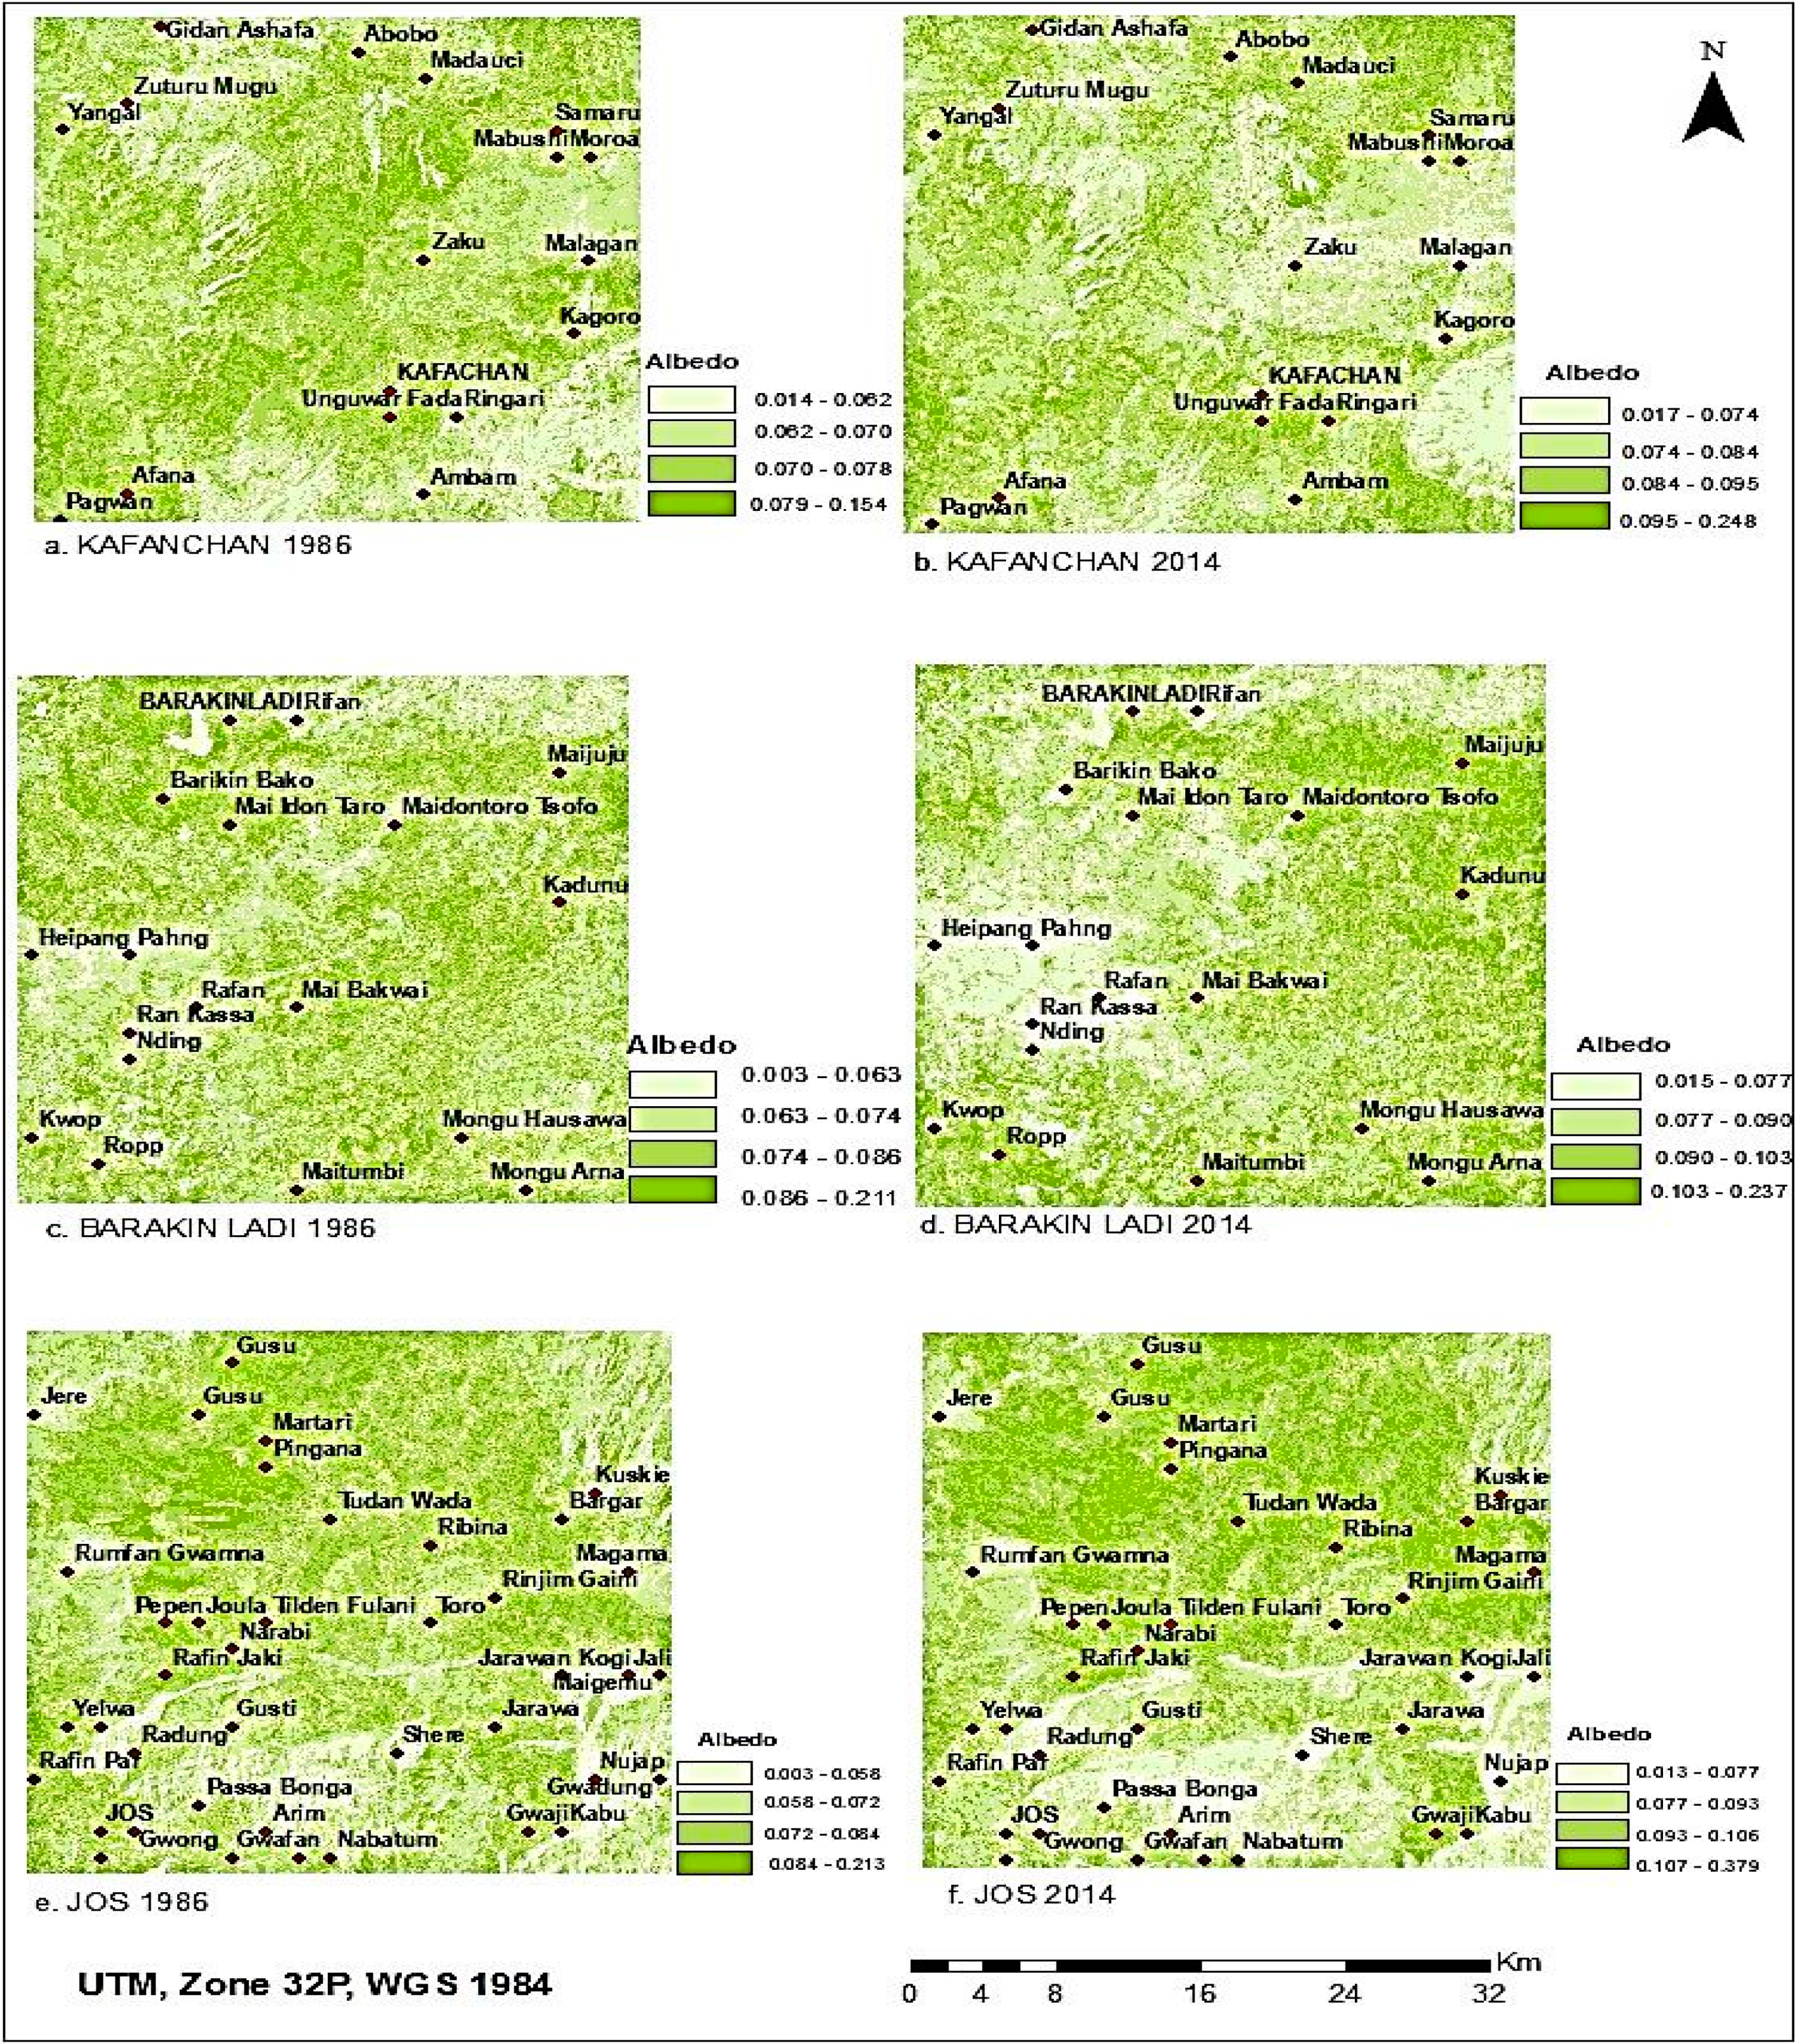
3.1.3. Albedo Change

3.1.4. Difference in Altitude

3.2. Inter/Intra Relationship between the Parameters

| Land Cover | Mean Elevation (m) | Albedo | LST (°C) |
|---|---|---|---|
| Vegetation | 791.81 | 0.068 | 28.825 |
| Water body | 0 | 0.0221 | 25.593 |
| Built up | 799.50 | 0.0789 | 30.702 |
| Cultivation/Bare surface | 795.55 | 0.0721 | 30.215 |
| Land Cover | Topography (m) | Albedo | LST (°C) |
|---|---|---|---|
| Vegetation | 1152.61 | 0.063 | 29.536 |
| Water body | 1206.49 | 0.039 | 23.943 |
| Built up | 1168.11 | 0.082 | 32.894 |
| Cultivation/Bare surface | 1160.91 | 0.071 | 32.150 |


| Land Cover | Topography (m) | Albedo | LST (°C) |
|---|---|---|---|
| Vegetation | 953.23 | 0.064 | 28.696 |
| Water body | 1039.61 | 0.028 | 26.083 |
| Built up | 999.11 | 0.082 | 32.187 |
| Cultivation/Bare surface | 1003.92 | 0.071 | 30.718 |

| Land Cover | Topography (m) | Albedo | LST (°C) |
|---|---|---|---|
| Vegetation | 803.34 | 0.0843 | 34.47 |
| Water body | 739.12 | 0.0798 | 33.02 |
| Built up | 798.10 | 0.0832 | 34.33 |
| Cultivation/Bare surface | 783.70 | 0.0819 | 34.31 |

| Land Cover | Topography (m) | Albedo | LST (°C) |
|---|---|---|---|
| Vegetation | 1158.77 | 0.0784 | 31.72 |
| Water body | 1249.23 | 0.0522 | 24.12 |
| Built up | 1159.82 | 0.0856 | 34.06 |
| Cultivation/Bare surface | 1169.38 | 0.0953 | 34.89 |

| Land Cover | Topography (m) | Albedo | LST (°C) |
|---|---|---|---|
| Vegetation | 988.32 | 0.0986 | 34.81 |
| Water body | 1001.34 | 0.1070 | 35.81 |
| Built up | 984.42 | 0.0986 | 34.76 |
| Cultivation/Bare surface | 1012.21 | 0.0983 | 34.80 |

| Land Cover | KAF | BAR | JOS |
|---|---|---|---|
| Vegetation | 803.34 | 1158.77 | 988.32 |
| Water body | 739.12 | 1249.23 | 1001.34 |
| Built up | 798.10 | 1159.82 | 984.42 |
| Bare surface | 783.70 | 1169.38 | 1012.21 |
| Land Cover | KAF ALB 86 | BAR ALB 86 | JOS ALB 86 | KAF ALB 14 | BAR ALB 14 | JOS ALB 14 |
|---|---|---|---|---|---|---|
| Vegetation | 0.0716 | 0.0785 | 0.0749 | 0.0843 | 0.0683 | 0.0986 |
| Water body | 0.0670 | 0.0523 | 0.0846 | 0.0798 | 0.0457 | 0.1070 |
| Built up | 0.0713 | 0.0856 | 0.0751 | 0.0832 | 0.0745 | 0.0986 |
| Bare surface | 0.0712 | 0.0953 | 0.0743 | 0.0818 | 0.0781 | 0.0983 |
| Total | 0.0712 | 0.0891 | 0.0748 | 0.08270 | 0.0755 | 0.0985 |
| Land Cover | KAF LST 86 | BAR LST 86 | JOS LST 86 | KAF LST 14 | BAR LST 14 | JOS LST 14 |
|---|---|---|---|---|---|---|
| Vegetation | 29.79 | 30.89 | 31.05 | 34.47 | 31.72 | 34.81 |
| Water body | 28.34 | 23.25 | 32.97 | 33.02 | 24.12 | 35.81 |
| Built up | 29.72 | 32.36 | 31.03 | 34.32 | 34.06 | 34.76 |
| Bare surface | 29.66 | 32.62 | 31.00 | 34.31 | 34.89 | 34.80 |
| Total | 29.69 | 32.31 | 31.05 | 34.32 | 34.19 | 34.79 |
| Location | ALB_86 | ALB_14 | LST_86 | LST_14 |
|---|---|---|---|---|
| Kafanchan | 1.2905 | 1.3056 | 1.2125 | 1.5543 |
| Barakinladi | 1.842 | 2.5088 | 1.8103 | 2.5088 |
| Jos | 2.1356 | 4.4037 | 2.1356 | 4.2035 |
3.3. Discussion
3.4. Implication for Ecosystem Service Delivery and Resource Conflict
4. Conclusions
Acknowledgment
Author Contributions
Conflict of Interest
References
- McMichael, A.J.; Patz, J.; Kovats, R.S. Impacts of global environmental change on future health and health care in tropical countries. Br. Med. Bull. 1998, 54, 475–488. [Google Scholar] [CrossRef] [PubMed]
- Bates, B.C.; Kundzewicz, Z.W.; Wu, S.; Palutikof, J.P. Climate Change and Water; Technical Paper of the Intergovernmental Panel on Climate Change; IPCC Secretariat: Geneva, Switzerland, 2008. [Google Scholar]
- Simms, A. Up in Smoke? Latin America and the Caribbean: The Threat from Climate Change to the Environment and Human Development; The 3rd Report from the Working Group on Climate Change and Development; New Economics Foundation: London, UK, 2006. [Google Scholar]
- Nigerian Environmental Study/Action Team (NEST). Regional Climate Modelling and Climate Scenarios Development in Support of Vulnerability and Adaptation Studies: Outcome of Regional Climate Modeling Efforts over Nigeria; NEST: Ibadan, Nigeria, 2004. [Google Scholar]
- IPCC. Contribution of working group I to the fourth assessment report of the intergovernmental panel on climate change. In Climate Change 2007: The Physical Science Basis; Cambridge University Press: Cambridge, UK, 2007; pp. 1–996. [Google Scholar]
- Ajibade, I.M. Climate Change and Human Rights: A Case Study of Vulnerability and Adaptation in Coastal Communities in Lagos, Nigeria. Ph.D. Thesis, University of Western Ontario, London, ON, Canada, 2013. [Google Scholar]
- Pinheiro, A.C.T.; Privette, J.L.; Bates, J.J.; Pedelty, J. Satellite retrieval of land surface temperature: Challenges and opportunities. In Earth Science Satellite Remote Sensing Science; Qu, J.J., Gao, W., Lafatos, M., Murphy, R.E., Salomonson, V.V., Eds.; Springer Verlag: Berlin, Germany, 2005; Volume 1, pp. 69–87. [Google Scholar]
- Barton, I.J. Satellite-derived sea surface temperatures: A comparison between operational, theoretical and experimental algorithms. J. Appl. Meteorol. 1992, 31, 432–442. [Google Scholar] [CrossRef]
- Lagouarde, J.P.; Kerr, Y.H.; Brunet, Y. An experimental study of angular effects on surface temperature for various plant canopies and bare soils. Agric. For. Meteorol. 1995, 77, 167–190. [Google Scholar] [CrossRef]
- Qin, Z.; Karnieli, A.; Berliner, P. A mono-window algorithm for retrieving land surface temperature from Landsat TM data and its application to the Israel-Egypt border region. Int. J. Remote Sens. 2001, 22, 3719–3746. [Google Scholar] [CrossRef]
- Dash, P.; Göttsche, F.M.; Olesen, F.S.; Fischer, H. Land surface temperature and emissivity estimation from passive sensor data: Theory and practice current trends. Int. J. Remote Sens. 2002, 23, 2563–2594. [Google Scholar] [CrossRef]
- Schmugge, T.; French, A.; Ritchie, J.C.; Rango, A.; Pelgrum, H. Temperature and emissivity separation from multispectral thermal infrared observations. Remote Sens. Environ. 2002, 79, 189–198. [Google Scholar] [CrossRef]
- Igusky, K. Quantifying Albedo and Surface Temperature over Different Landcovers: Implications for Carbon Offsets. Master’s Thesis, Duke University, Durham, NC, USA, 2008. [Google Scholar]
- Schaaf, C.B. Albedo and Reflectance Anisotropy: Assessment of the Status of the Development of the Standards for the Terrestrial Essential Climate Variables; Global Terrestrial Observing System: Rome, Italy, 2009. [Google Scholar]
- Preuschmann, S. Regional Surface Albedo Characteristics-Analysis of Albedo Data and Application to Land-Cover Changes for a Regional Climate Model. Ph.D. Thesis, Hamburg University, Hamburg, Germany, 2012. [Google Scholar]
- Aires, F.; Prigent, C.; Rossow, W.B.; Rothstein, M. A new neural network approach including first-guess for retrieval of atmospheric water vapor, cloud liquid water path, surface temperature and emissivities over land from satellite microwave observations. J. Geophys Res. 2001, 106, 14887–14907. [Google Scholar] [CrossRef]
- Pitman, A.J.; Narisma, G.T.; Pielke, R.A., Sr.; Holbrook, N.J. Impact of land cover change on the climate of Southwest Western Australia. J. Geophys. Res. 2004, 109. [Google Scholar] [CrossRef]
- McAlpine, C.A.; Syktus, J.; Deo, R.C.; Lawrence, P.J.; McGowan, H.A.; Watterson, I.G.; Phinn, S.R. Modeling the impact of historical land cover change on Australia’s regional climate. Geophys. Res. Lett. 2007, 34. [Google Scholar] [CrossRef]
- Nair, U.S.; Ray, D.K.; Wang, J.; Christopher, S.A.; Lyons, T.J.; Welch, R.M.; Pielke, R.A., Sr. Observational estimates of radiative forcing due to land use change in Southwest Australia. J. Geophys. Res. 2007, 112. [Google Scholar] [CrossRef]
- Findell, K.L.; Shevliakova, E.; Milly, P.C.D.; Stouffer, R.J. Modelled impact of anthropogenic landcover change on climate. J. Clim. 2007, 20, 3621–3634. [Google Scholar] [CrossRef]
- Liang, S. Narrowband to broadband conversions of land surface albedo. I: Algorithms. Remote Sens. Environ. 2000, 76, 213–238. [Google Scholar] [CrossRef]
- Sobrino, J.A.; Li, Z.L.; Soria, G.; Jiménez, J.C. Land surface temperature and emissivity retrieval from remote sensing data. Recent Res. Dev. Geophys. 2002, 4, 21–44. [Google Scholar]
- Kerr, Y.H.; Lagouarde, J.P.; Nerry, F.; Ottlé, C. Land surface temperature retrieval techniques and applications: Case of AVHRR. In Thermal Remote Sensing in Land Surface Processes; Quattrochi, D.A., Luvall, J.C., Eds.; CRC Press: Boca Raton, FL, USA, 2004; pp. 33–109. [Google Scholar]
- Owen, T.W.; Carlson, T.N.; Gillies, R.R. Remotly sensed surface parameters governing urban climate change. Int. J. Remote Sens. 1998, 19, 1663–1681. [Google Scholar] [CrossRef]
- Tasumi, M.; Allen, R.G.; Trezza, R. At-surface reflectance and albedo from satellite for operational calculation of land surface energy balance. J. Hydrol. Eng. 2008, 13, 51–63. [Google Scholar] [CrossRef]
- Ojo, O. The Climates of West Africa; Heineman: London, UK, 1977. [Google Scholar]
- Abiodun, B.J.; Salami, A.T.; Tadross, M. Climate Change Scenarios for Nigeria: Understanding Biophysical Impacts; Climate Systems Analysis Group, Cape Town, for Building Nigeria’s Response to Climate Change Project; Nigerian Environmental Study/Action Team (NEST): Ibadan, Nigeria, 2011. [Google Scholar]
- Building Nigeria’s Response to Climate Change. Annual workshop of Nigerian Environmental Study Team (NEST): The recent global and local action on climate change. In Proceedings of the Building Nigeria’s Response to Climate Change, Abuja, Nigeria, 8–9 October 2008.
- Akor, G. Climate change and agriculture: The Nigerian story. In Proceedings of the Conference Presentation FES, Accra, Ghana, 10–11 April 2012.
- Werz, M.; Conley, M. Climate Change, Migration and Conflict in Northwest Africa: Rising Dangers and Policy Options Across the Arc of Tension; Centre for American Progress: Washington, DC, USA, 2012. [Google Scholar]
- Osunmadewa, B.A.; Enokela, S.E. Remote sensing and GIS for assessing land use landcover Change: A case study of Jos and environs, Plateau State Nigeria. In Proceedings of the Tropentag, Development on the Margin, Bonn, Germany, 5–7 October 2011.
- Okelo, A.N.; Majekodunmi, A.O.; Malala, A.; Welburn, S.C.; Smith, J. Identifying motivators for state-pastoralist dialogue: Exploring the relationships between livestock services, self-organisation and conflict in Nigeria’s pastoralist Fulani. Pastoralism 2014, 4. [Google Scholar] [CrossRef]
- Ye, D.Z.; Gao, Y.X. Meteorology of Qinghai–Xizhang (Tibet) Plateau; Science Press: Beijing, China, 1979. [Google Scholar]
- Alford, M.T.; Hill, I.D.; Rackham, L.J.; Tuley, P. The Jos Plateau, a survey of environment and land use. In Occasional Publications (New Series); Morgan, W.T.W., Ed.; University of Durham: England, UK, 1979. [Google Scholar]
- Artis, D.A.; Carnahan, W.H. Survey of emissivity variability in thermography of urban areas. Remote Sens. Environ. 1982, 12, 313–329. [Google Scholar] [CrossRef]
- Xu, L.; Myneni, R.B.; Chapin, F.S., III; Callaghan, T.V.; Pinzon, J.E.; Tucker, C.J.; Zhu, Z.; Bi, J.; Ciais, P.; Tømmervik, H.; et al. Temperature and vegetation seasonality diminishment over northern lands. Nat. Clim. Change 2013. [Google Scholar] [CrossRef]
- Van de Kerchove, R.; Lhermitte, S.; Veraverbeke, S.; Goossens, R. Spatio-temporal variability in remotely sensed land surface temperature, and its relationship with physiographic variables in the Russian Altay Mountains. Int. J. Appl. Earth Obs. Geoinf. 2013, 20, 4–19. [Google Scholar] [CrossRef] [Green Version]
- Kvalevag, M.M.; Myhre, G.; Bonan, G.; Levis, S. Anthropogenic landcover changes in a GCM with surface albedo changes based on MODIS data RIDA-3598–2008. Int. J. Climatol. 2010, 30, 2105–2117. [Google Scholar] [CrossRef]
- Guttschuss, E. Leave Everything to God Accountability for Inter-Communal Violence in Plateau and Kaduna States, Nigeria; Human Rights Watch: New York, NY, USA, 2013. [Google Scholar]
- Carina, T. Revenge in the Name of Religion: The Cycle of Violence in Plateau and Kano States; Human Rights Watch: New York, NY, USA, 2005; Volume 17, p. 83. [Google Scholar]
© 2015 by the authors; licensee MDPI, Basel, Switzerland. This article is an open access article distributed under the terms and conditions of the Creative Commons Attribution license (http://creativecommons.org/licenses/by/4.0/).
Share and Cite
Odunuga, S.; Badru, G. Landcover Change, Land Surface Temperature, Surface Albedo and Topography in the Plateau Region of North-Central Nigeria. Land 2015, 4, 300-324. https://0-doi-org.brum.beds.ac.uk/10.3390/land4020300
Odunuga S, Badru G. Landcover Change, Land Surface Temperature, Surface Albedo and Topography in the Plateau Region of North-Central Nigeria. Land. 2015; 4(2):300-324. https://0-doi-org.brum.beds.ac.uk/10.3390/land4020300
Chicago/Turabian StyleOdunuga, Shakirudeen, and Gbolahan Badru. 2015. "Landcover Change, Land Surface Temperature, Surface Albedo and Topography in the Plateau Region of North-Central Nigeria" Land 4, no. 2: 300-324. https://0-doi-org.brum.beds.ac.uk/10.3390/land4020300