Agricultural Land Use Change after NAFTA in Central West Mexico


Centro de Investigaciones en Geografía Ambiental, Universidad Nacional Autónoma de México, Morelia, Michoacán 58190, Mexico
*
Author to whom correspondence should be addressed.
Land 2017, 6(4), 66; https://0-doi-org.brum.beds.ac.uk/10.3390/land6040066
Submission received: 19 July 2017
/
Revised: 29 September 2017
/
Accepted: 30 September 2017
/
Published: 5 October 2017
(This article belongs to the Special Issue Understanding the Patterns, Drivers and Consequences of Agricultural Land Use Change and Land-Use Intensity)
Abstract
:It has been suggested that agricultural land use change and modernization in agricultural production techniques are related to the loss of crop diversity. Two processes contribute to this loss; first is the replacement of landraces by modern varieties, and second is the abandonment of traditional crops in favor of cash crops. We studied the expression of these processes in a region that is both an agro-biodiversity and cultural center and one of the most significant fruit exporters of Mexico. We analyzed agricultural change based on the transformation of cropping areas and the primary crops’ locations in Michoacán state. We examined the crop-harvested area statistics from 1950 to 2015, and identified 23 crops as the most important in terms of harvested area and monetary value. After NAFTA (North American Free Trade Agreement), harvested area for nine crops changed significantly: seven crops increased, and two decreased. Positive trends were observed for commercial fruits oriented to export markets, and negative trends were observed for traditional crops. These crops, such as beans and maize, are important for food security. Additionally, we analyzed how these land-use and agricultural changes overlap in zones of maize planted-area change. Using a maize-race collection database, we identified three native maize races that could be at risk due to the abandonment of maize in favor of commercial crops.
1. Introduction
Mexico plays an important role in international food markets. The country is a leader in certain agricultural products such as avocados, berries, and vegetables [1]. Rural areas and the agricultural sector have suffered significant changes in Mexico’s recent history. Before the 1980s, agricultural policy was oriented to the production of food for the local market; the main objective was to produce enough food at a low price to support the growth of the cities and domestic industrialization [2]. However, during the 1980s, the global development policies changed to reflect what is known as neoliberalism. Neoliberalism is characterized by strong market integration and trade liberalization between countries and a change in the role of the government as an economic agent [3]. International free-trade agreements such as NAFTA (North American Free Trade Agreement) are instances of such neoliberal policies [4]. NAFTA created a free-trade zone among Canada, the USA, and Mexico. In Mexico, NAFTA has had both negative and positive consequences for the agricultural sector. Since NAFTA’s implementation in 1994, fruit and vegetable exports from Mexico have grown, however, at the same time, grain imports have also grown, especially of maize, which is the Mexican food staple [5].
Changes in the agricultural policies in Mexico after NAFTA included the development of agricultural areas, where products for the international market are grown, but some changes have also negatively impacted small farmers. Small-scale maize agriculture is practiced in a difficult political environment with almost no government support and low maize prices because of massive importation of highly subsidized crops [6]. In addition to the reduction in traditional maize production, there are other consequences of trade liberalization, such as migration from rural areas, environmental contamination due to agricultural intensification, and reduction of crop diversity [7]. After NAFTA’s origin in 1994, maize prices in Mexico declined, thus, affecting small farmers. However, in 2006, this tendency reversed due to high demand for corn in the US and the world, and maize prices increased, causing an increment in the tortilla prices. Tortilla is the staple food in Mexico, and is made only with maize. Hence, Mexico is in a vulnerable situation because of its dependence on imported food [6]. The maize system is polarized between powerful stakeholders in the maize-tortilla chain and small and medium-scale maize farmers with minimal resources; the latter farmers are unlikely to benefit from the present international phenomenon of increasing food prices because of a lack of market integration [8]. Small farmers are vulnerable to volatile and uncertain markets.
Previous work has shown that agricultural modernization, such as the use of modern varieties or substitution of traditional crops by cash crops, is a cause of crop diversity loss [9]. Crop diversity reduction in centers of origin could have consequences for global agriculture, such as the loss of genetic traits that are useful to face climate change and pests [10]. Mexico is the center of origin and diversification of important global crops, such as maize, beans, cacao, cotton, papaya, and tomatoes, among others [11]. It not only still preserves 59 maize landraces, which are the result of a heterogeneous physiography, but also the country’s ethnic and cultural diversity. The conservation of maize landraces occurs in the context of indigenous and peasant farming across Mexico [12,13]. The state of Michoacán is an example of a high agro-biodiversity region, hosting areas with 3000 years of agricultural traditions, where maize is the center of indigenous cultures [14].
Maize cultivation in the state of Michoacán is varied, both in terms of technology adaptation and types of maize landraces used. In this state, it is possible to find contrasting agricultural systems: from slash and burn to modern precision agriculture assisted by satellite technology. In each region, technology and production depend on environment and market opportunities [15]. Maize diversity is high, with 27 of the 59 races described to be found in Mexico [16,17]. Race is a taxonomical category to group landraces and refers to a group of population that have common morphological characteristics [17]. It has been reported that in Michoacán, eight maize races are vulnerable because of their small populations. These races are Maíz Dulce, Conejo, Elotes occidentales, Tabloncillo, Celaya, Zamorano Amarillo, Vandeño, and Mushito. The main causes of maize races’ vulnerability are crop substitution, preference for improved white maize, and reduction of area devoted to landraces. Sorghum in the valleys and avocado in the sierras are now occupying land that was used for maize in the past [18].
In this paper, we analyzed the changes in crops and crop area in Michoacán, a state located in the west-central region of Mexico and well known for its dynamic agricultural sector [19]. We evaluated the effects of international market integration on the harvested area of main crops. We analyzed how those crop changes have impacted agrobiodiversity by analyzing planted maize area and the possible consequences for native maize diversity. The main aims of this research were: (i) to define which were the main crops in the state of Michoacán in the recent years; (ii) to analyze the cropping patterns of these crops and changes from 1950 to 2015; (iii) to map the main changes in planted maize area; and (iv) overlapping this map on one of maize race collections, to identify races that could be vulnerable because of maize cropping area changes.
2. Materials and Methods
2.1. Study Area
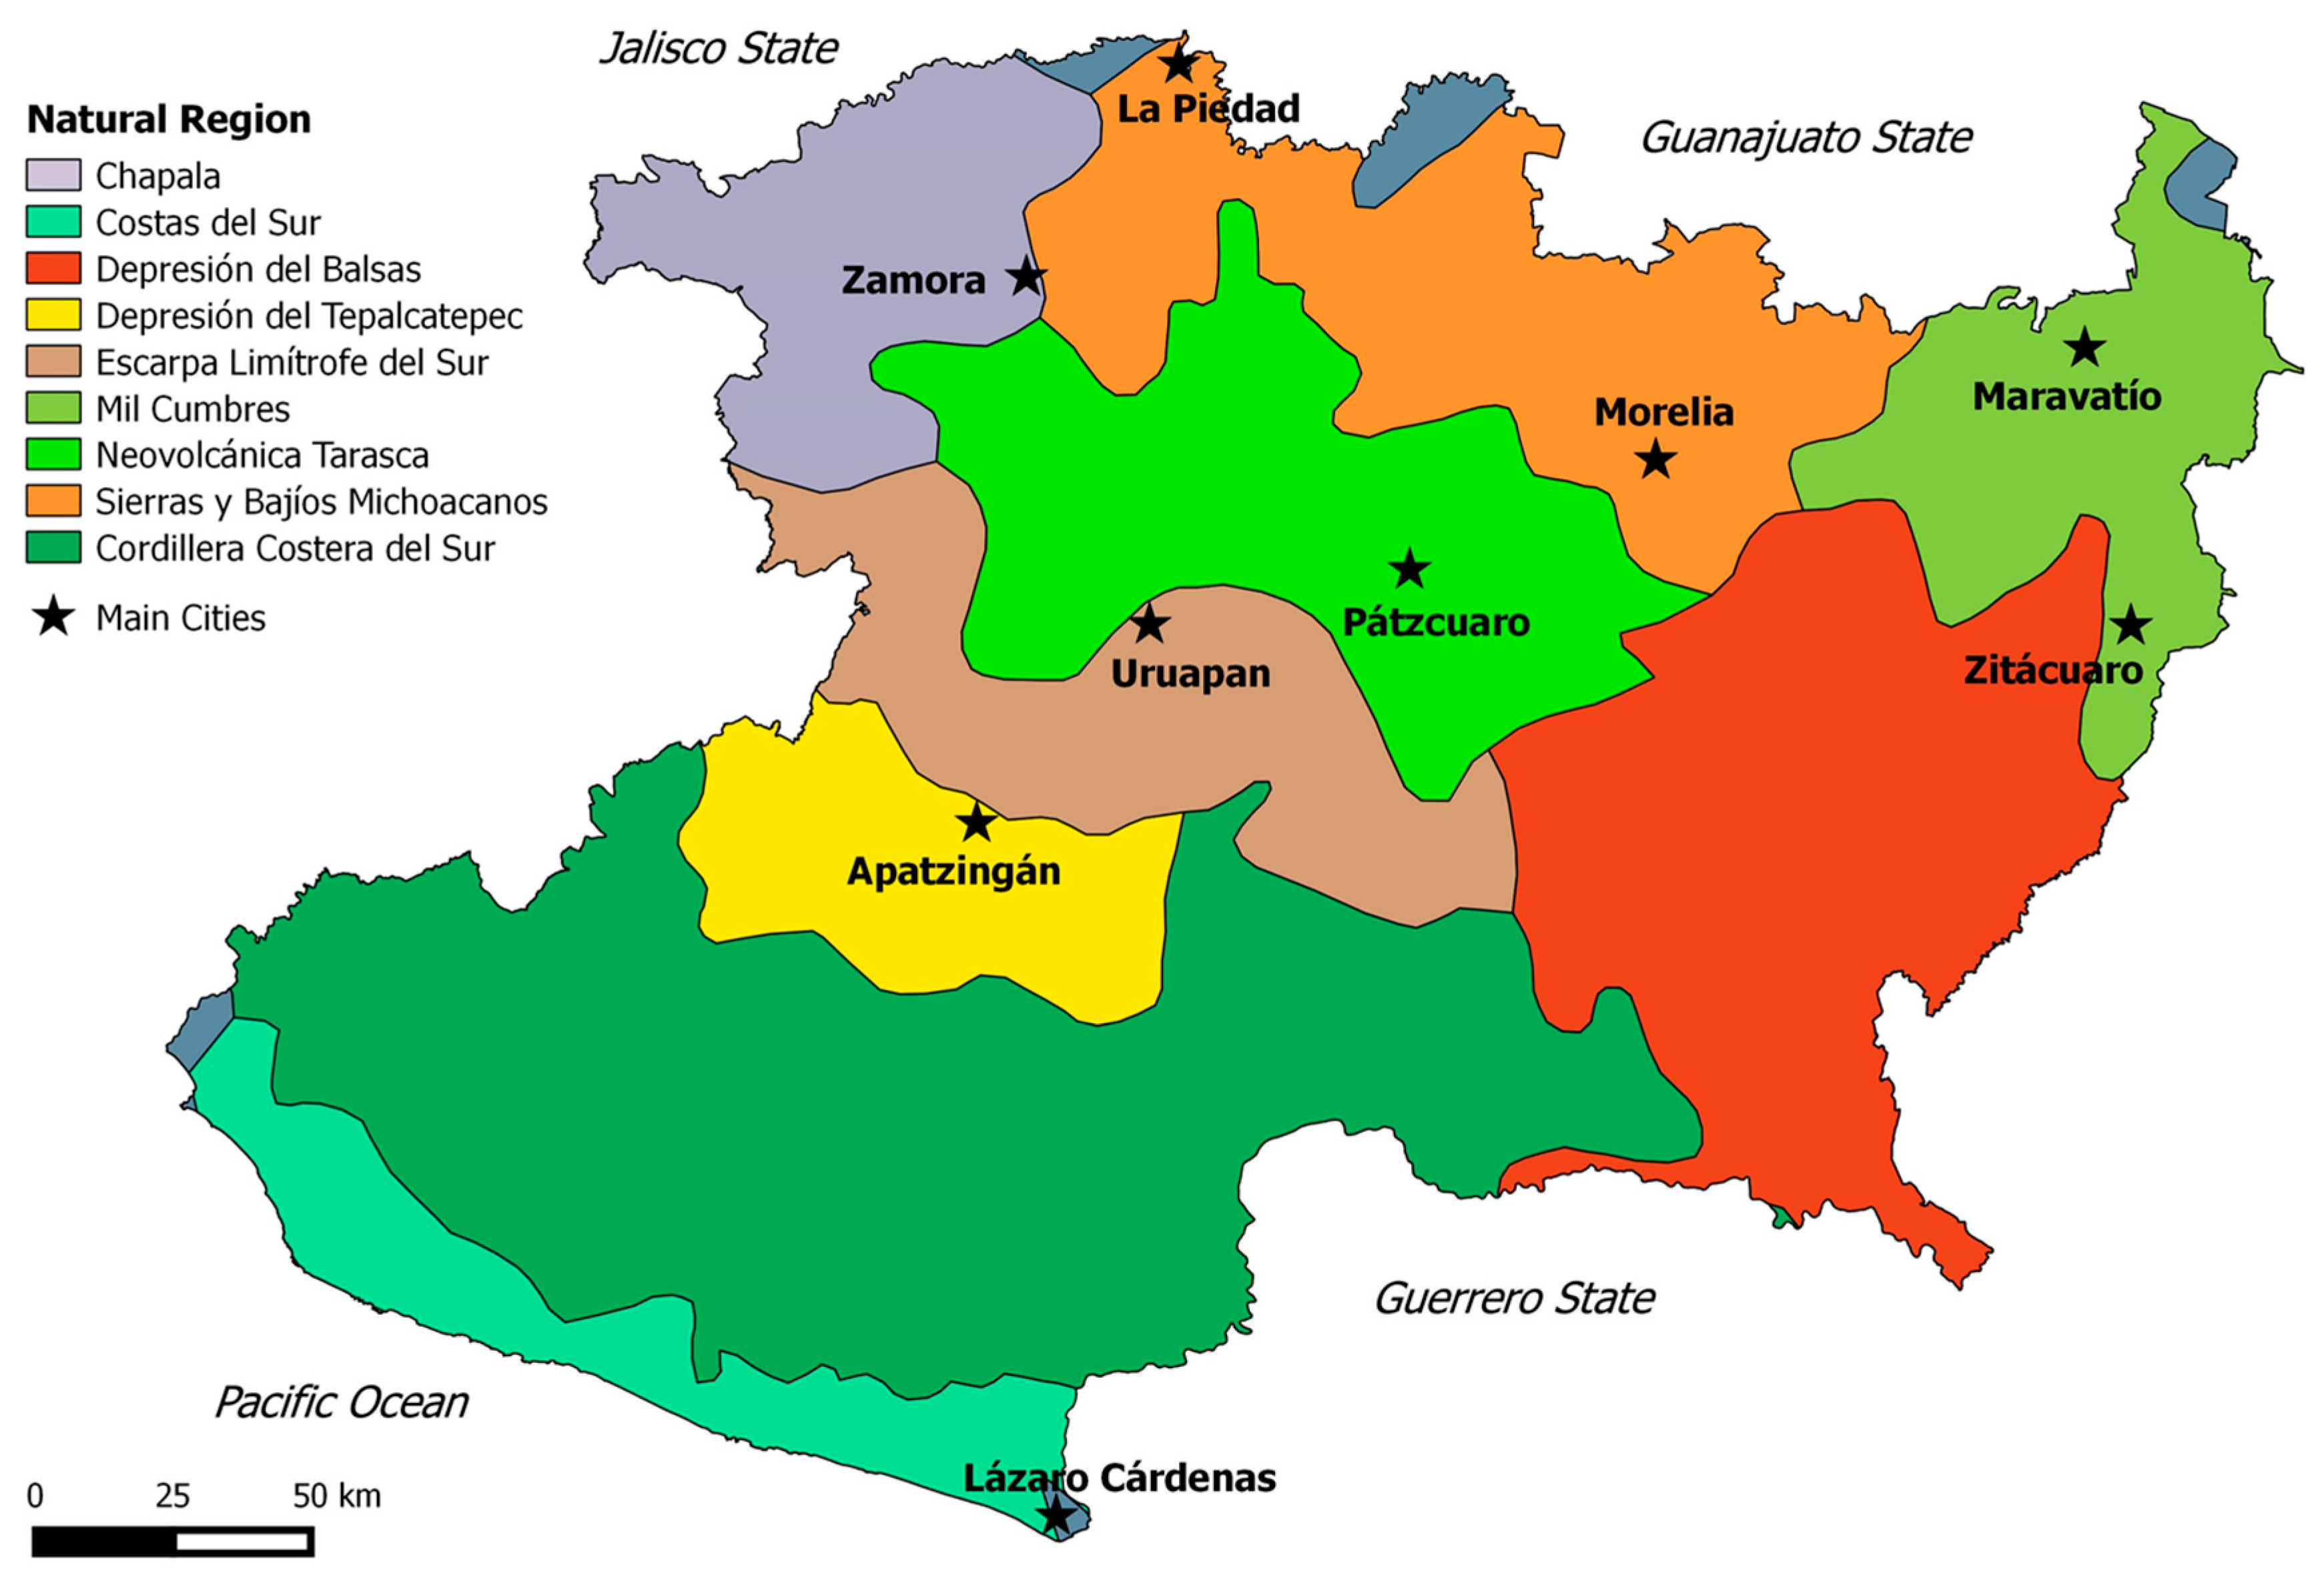
The area of study was the state of Michoacán, to the west of Mexico City. This state is of average size compared to the other states in the country. It has a complex relief because it is crossed by two of Mexico’s main mountain ranges: The Neovolcanic Belt and the South Sierras. The elevation ranges from 0 to 3840 MASL (meters above sea level). Its climate is also diverse, ranging from tropical deserts to rainforest, and coniferous forest in the highlands. The main soil types are: Leptosol (19%), Luvisol (20%), Phaeozem (11%), Regosol (12%), and Vertisol (16%) [20]. Michoacán has nine natural regions (see Figure 1) based on relief, climatic, and vegetation criteria [21]. Due to this environmental variation, agricultural environments are also diverse. Michoacán has important and contrasting agricultural regions. Three of the most important regions are the following: (1) El Bajío, located in the north of the state, is the region with the most agricultural development because of its temperate climate. Grains, vegetables, and fruits are the main products; (2) In the middle of the state, near Uruapan city, avocado plantations have modified the landscape, converting the forest zone into an international area for avocado production; (3) In the central west, the Apatzingán Valley, with an extremely hot and dry climate, has experienced agriculture development programs for more than half a century, including irrigation programs, and is now a leader in lime production [19].
Agriculture and livestock are the main economic activities of the state, and represent 8% of the Gross National Product [20]. Michoacán leads in products for the international market such as avocado, blackberry, strawberry, and lime [1]. International migration is also very important in the state. Michoacán is among the states with the highest emigration rates, along with Jalisco and Zacatecas. This state has a long history of migration, starting in the middle of the last century with the bilateral Bracero Program between Mexico and the USA, which allowed millions of Mexicans to work temporarily in the US farms. This migration phenomenon has changed the demographic structure of rural communities in Michoacán [23]. From 1990 to 1995, a total of 214,000 persons migrated from Michoacán to the USA, placing this state among those with the highest migration rates in the country [24]. The total population of the state is 4.35 million, and the state ranks tenth in terms of population. The following four cities represent 25% of the population: Morelia (13%) located in the center north of the state, Uruapan (6%) in the center, Zamora (3%) in the west, and Apatzingán in the center southwestern (2%; Figure 1). Dispersion of the population is high, with 32% of the population living in rural villages with fewer than 2500 habitants [20].
2.2. Data Gathering and Analysis
The sources of data were the agricultural censuses performed by INEGI (National Institute of Statistics and Geography) and SIAP (Agriculture, Food and Fishery Information System), which depends on the Agriculture and Food Ministry. INEGI’s agricultural censuses began in 1930, but because of questions of data reliability, we analyzed the data starting in 1950. The frequency of the census was every ten years until 1991, where the subsequent census was performed in 2007. Additionally, census data from 1980 were estimated from a sample because of the data lost in the 1985 earthquake. The SIAP data started in 1980. From 1980 to 2003, the data are at state scale for the main crops, while since 2003, SIAP has data by municipality. Table 1 shows the source of data for each year and the scale in each case. For some crops, such as blackberry, fodder oats, grass, green chili pepper, onion, papaya, potato, tomato, vetch, and others, we did not get data for the whole period of the analysis. In the maps in the Supplementary Materials, we show the legend: “no data” for the specific year with missing data by crop. For a few crops, we obtained data starting in 1950 without missing values; these crops were avocado, beans, limes, maize, sugar cane, and wheat. The census data from 1950 includes beans in monocrop and intercropped with maize. We analyzed both areas to get the total for beans. Some crops are cultivated in two seasons: fall-winter and spring-summer. We summed both seasons to get the annual total for both municipality and state statistics.
Maize diversity data were taken from the Global Maize Project database [16]. This database is a compilation of maize records, including gene banks, collections from researchers, and recent surveys by several Mexican institutions coordinated by CONABIO (National Commission for the Understanding and Use of Biodiversity, Comisión Nacional para el Conocimiento y Uso de la Biodiversidad, in Spanish). The database contains 22,931 records of maize observations, but for 4119 records, the race was not determined, and an additional 455 records did not have geographic coordinates for the locations. In total, there were 64 race names. We extracted the records for the state of Michoacán. In Michoacán, there were 28 races, however, we excluded the race called Mushito de Michoacán because it is not reported by Sánchez et al. [17]. The database for Michoacán contains 856 records collected from 1943 to 2010.
We defined the most important crops in the state based on the total harvested area and the total market value in 2010 [28]. First, we sorted all the crops according to these two variables; then, we selected the crops that accounted for 80% or more in each variable. Afterwards, we combined both lists and obtained a list of 23 crops (Table 2). These crops represent 93% of the total harvested area in the state and 92% of the total market value of all crops in 2010. Some of them are important in terms of both planted area and market value. Maize is the most important crop by harvested area, followed by grain sorghum and avocado. By market value, avocado is the most important, followed by maize and blackberry.
Then, we analyzed changes in the total harvest area by crop at the state level. We carried out trend analysis using the Kendall correlation by crop type. Next, we looked for areas with changes within the state by evaluating harvested area at the municipal scale to find crop changes in specific municipalities or groups of them. To do so, we plotted maps for each crop by year. To produce maps that were easy to evaluate visually, we plotted the harvests in ranks; for each year, we divided the harvested area into ten ranks, each with a different color intensity in the map. This display method allowed us to easily compare the yearly changes in harvested area for each crop (see Supplementary Materials). The statistical analysis and plots were developed in R [30]. In the case of maize, we did a more detailed analysis because we were interested in statistically evaluating trends in the changes to harvested area at the municipal scale. This analysis was done in two main steps. First, we analyzed the trends for planted maize area by municipality, and second, we built a geographic information system database by municipality with maps for each crop and the maize collection database. We looked for spatial changes in the planted maize area and maize diversity to allow us to detect relationships between these two variables and consider the implications for maize diversity in different regions of Michoacán.
3. Results
3.1. Dominant Crops in the State
The agricultural landscape of the state is dominated by a notably small number of crop types. However, official agricultural statistics show that there were 120 types of crops planted in 2015. These statistics indicate consistent increase in the numbers of different crop types planted [28]. In 1980, there were 93 crops. This number grew to 94 in 1990 and to 104 in 2000. In 2015, there were 16 new crops that were not reported in 2000 (including artichoke, asparagus, blueberry, chard, chia, jackfruit, noni, spinach, and rambutan). These new crops are mainly grown for the international market. In 2015, four crops covered 70% of the total planted area of the state of Michoacán: maize (40%), avocado (12%), sorghum (9%), and grass (8%). Five crops represented 72% of the total value of the harvest: avocado (39%), maize (12%), blackberry (8%), strawberry (7%), and lime (5%) [1,28]. Maize, sorghum, and lime supplied the local and domestic markets. Avocado, blackberries, and strawberries were mainly for the international markets, while grass was used for livestock grazing.
Maize is cultivated almost everywhere in the state. It is possible to find maize fields in a wide elevation range and in very different environments. However, cultivated maize area is concentrated in the north of the state, in a belt from west to east that covers the three main regions of Chapala, Sierras y Bajíos Michoacanos, and Mil Cumbres (Figure 1). These areas are characterized by fertile and deep soil and warm to temperate climate. In 2015, in this northern area, 13 municipalities, out of a total of 113, comprised 32% of the harvested maize area, and 18 municipalities harvested 45% of the total volume in the state [28]. Technology varies from region to region, but fertilizers and pesticides are commonly used. The use of hybrid seed is exclusive to the irrigated and mechanized zones located in some regions in the north, center, and west of the state. In other zones, such as the Meseta Purhépecha (in the Neovolcánica Tarasca region), farmers exclusively use local seed from landraces [15].
Avocado orchards dominate the landscape of the center of the state, in a belt from west to east in the Escarpa Limítrofe del Sur and the southern part of the Neovolcánica Tarasca regions. This crop requires andosols soils and humid and temperate climates, and most plantations are located from 1100 to 2900 MASL in a region of pine and oak forest [31]. Blackberry plantations are relatively new in the state; they were first reported in the national statistics in 2003. Blackberry plantations are concentrated in two places, in the central/west-central region of the state and the tails of the Escarpa Limítrofe del Sur region. These are temperate areas of valleys and hills. Strawberries are produced mainly in two regions, in the Zamora valley in the Chapala region and the Maravatío valley in the Mil Cumbres region. They are cultivated on irrigated lands. Lime is cultivated in and around the Apatzingán Valley in the west-central part of the state, which is in the Depresión de Tepalcatepec region. This is a very hot and dry region, which is irrigated by the tributaries of the Balsas River. Finally, grass is planted in the southwest part of the state, in the mostly hilly Costas del Sur region with a hot climate.
3.2. Main Crop Trends
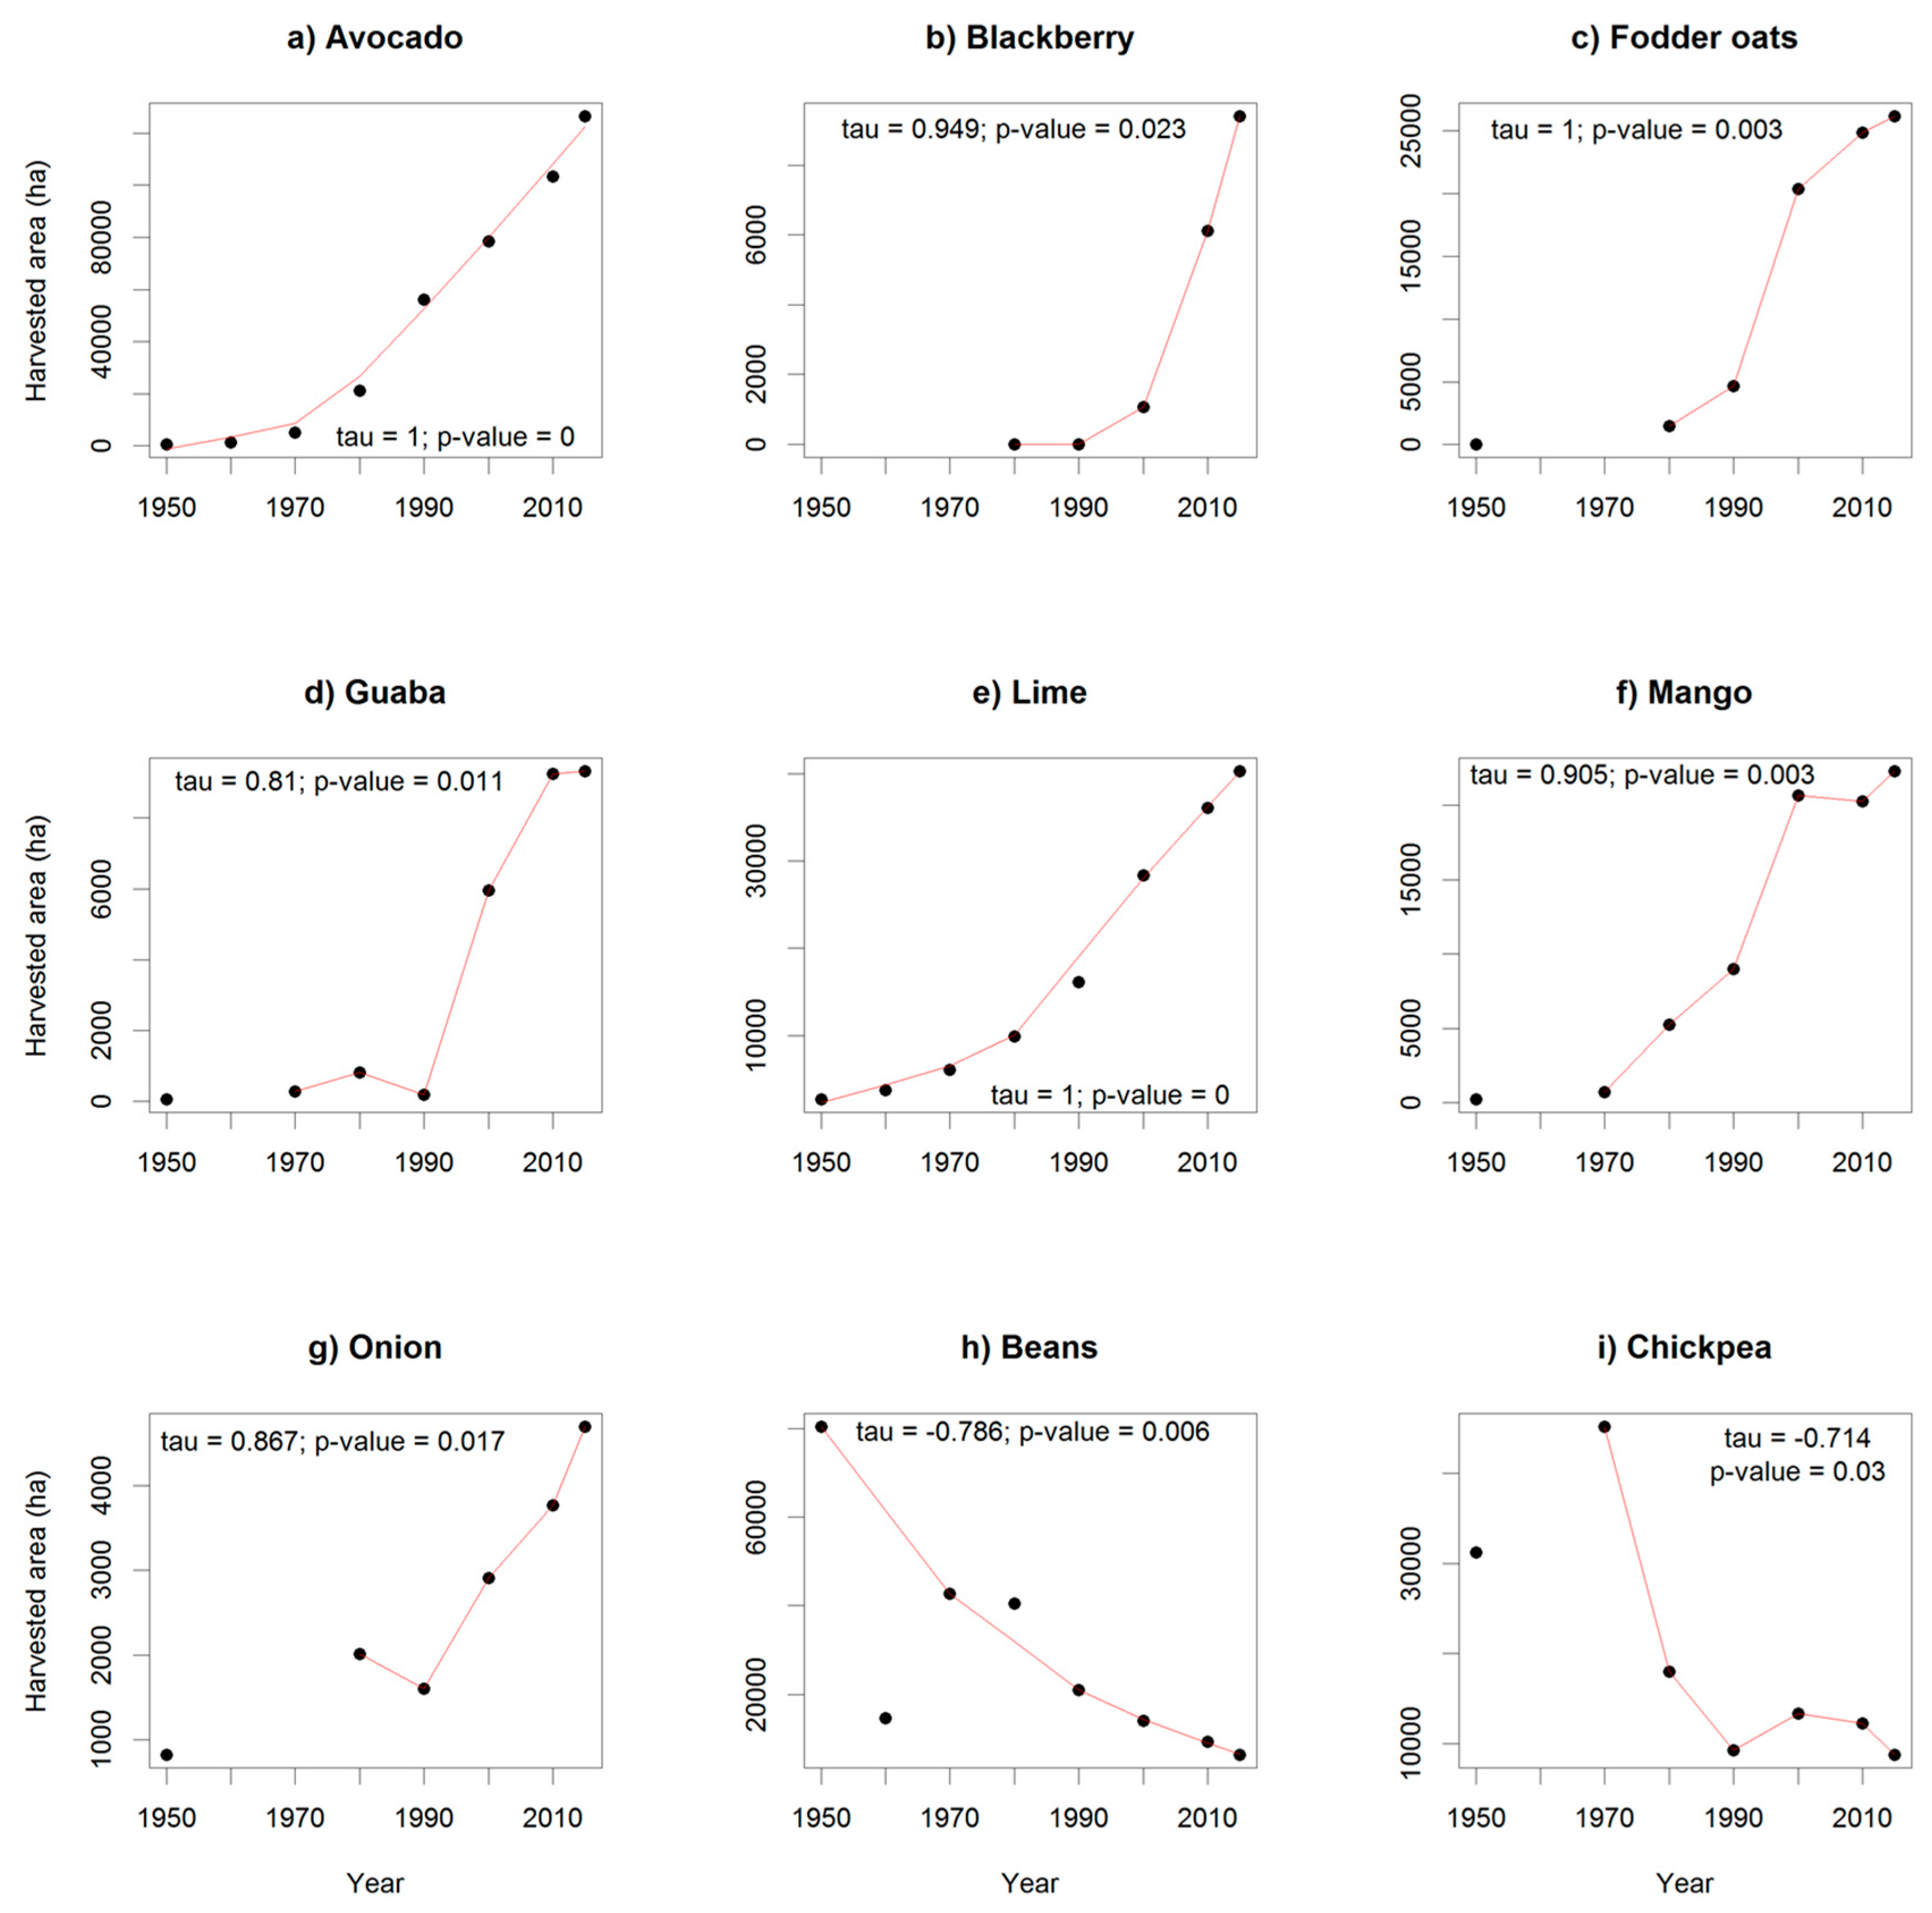
The total area harvested of 14 crops, of the 23 crops analyzed, showed no significant change. These crops are banana, fodder sorghum, grain sorghum, grass, green chili peppers, maize, melons, papayas, potatoes, strawberries, sugar cane, tomatoes, vetch, and wheat. The area of seven other crops (avocado, blackberry, fodder oats, guava, lime, mango, and onion) has increased, and the area of only two crops has decreased (beans and chickpeas; Figure 2). Even with an agricultural policy that favors crops for the international market, the area devoted to growing maize for local consumption has not been reduced significantly in the state.
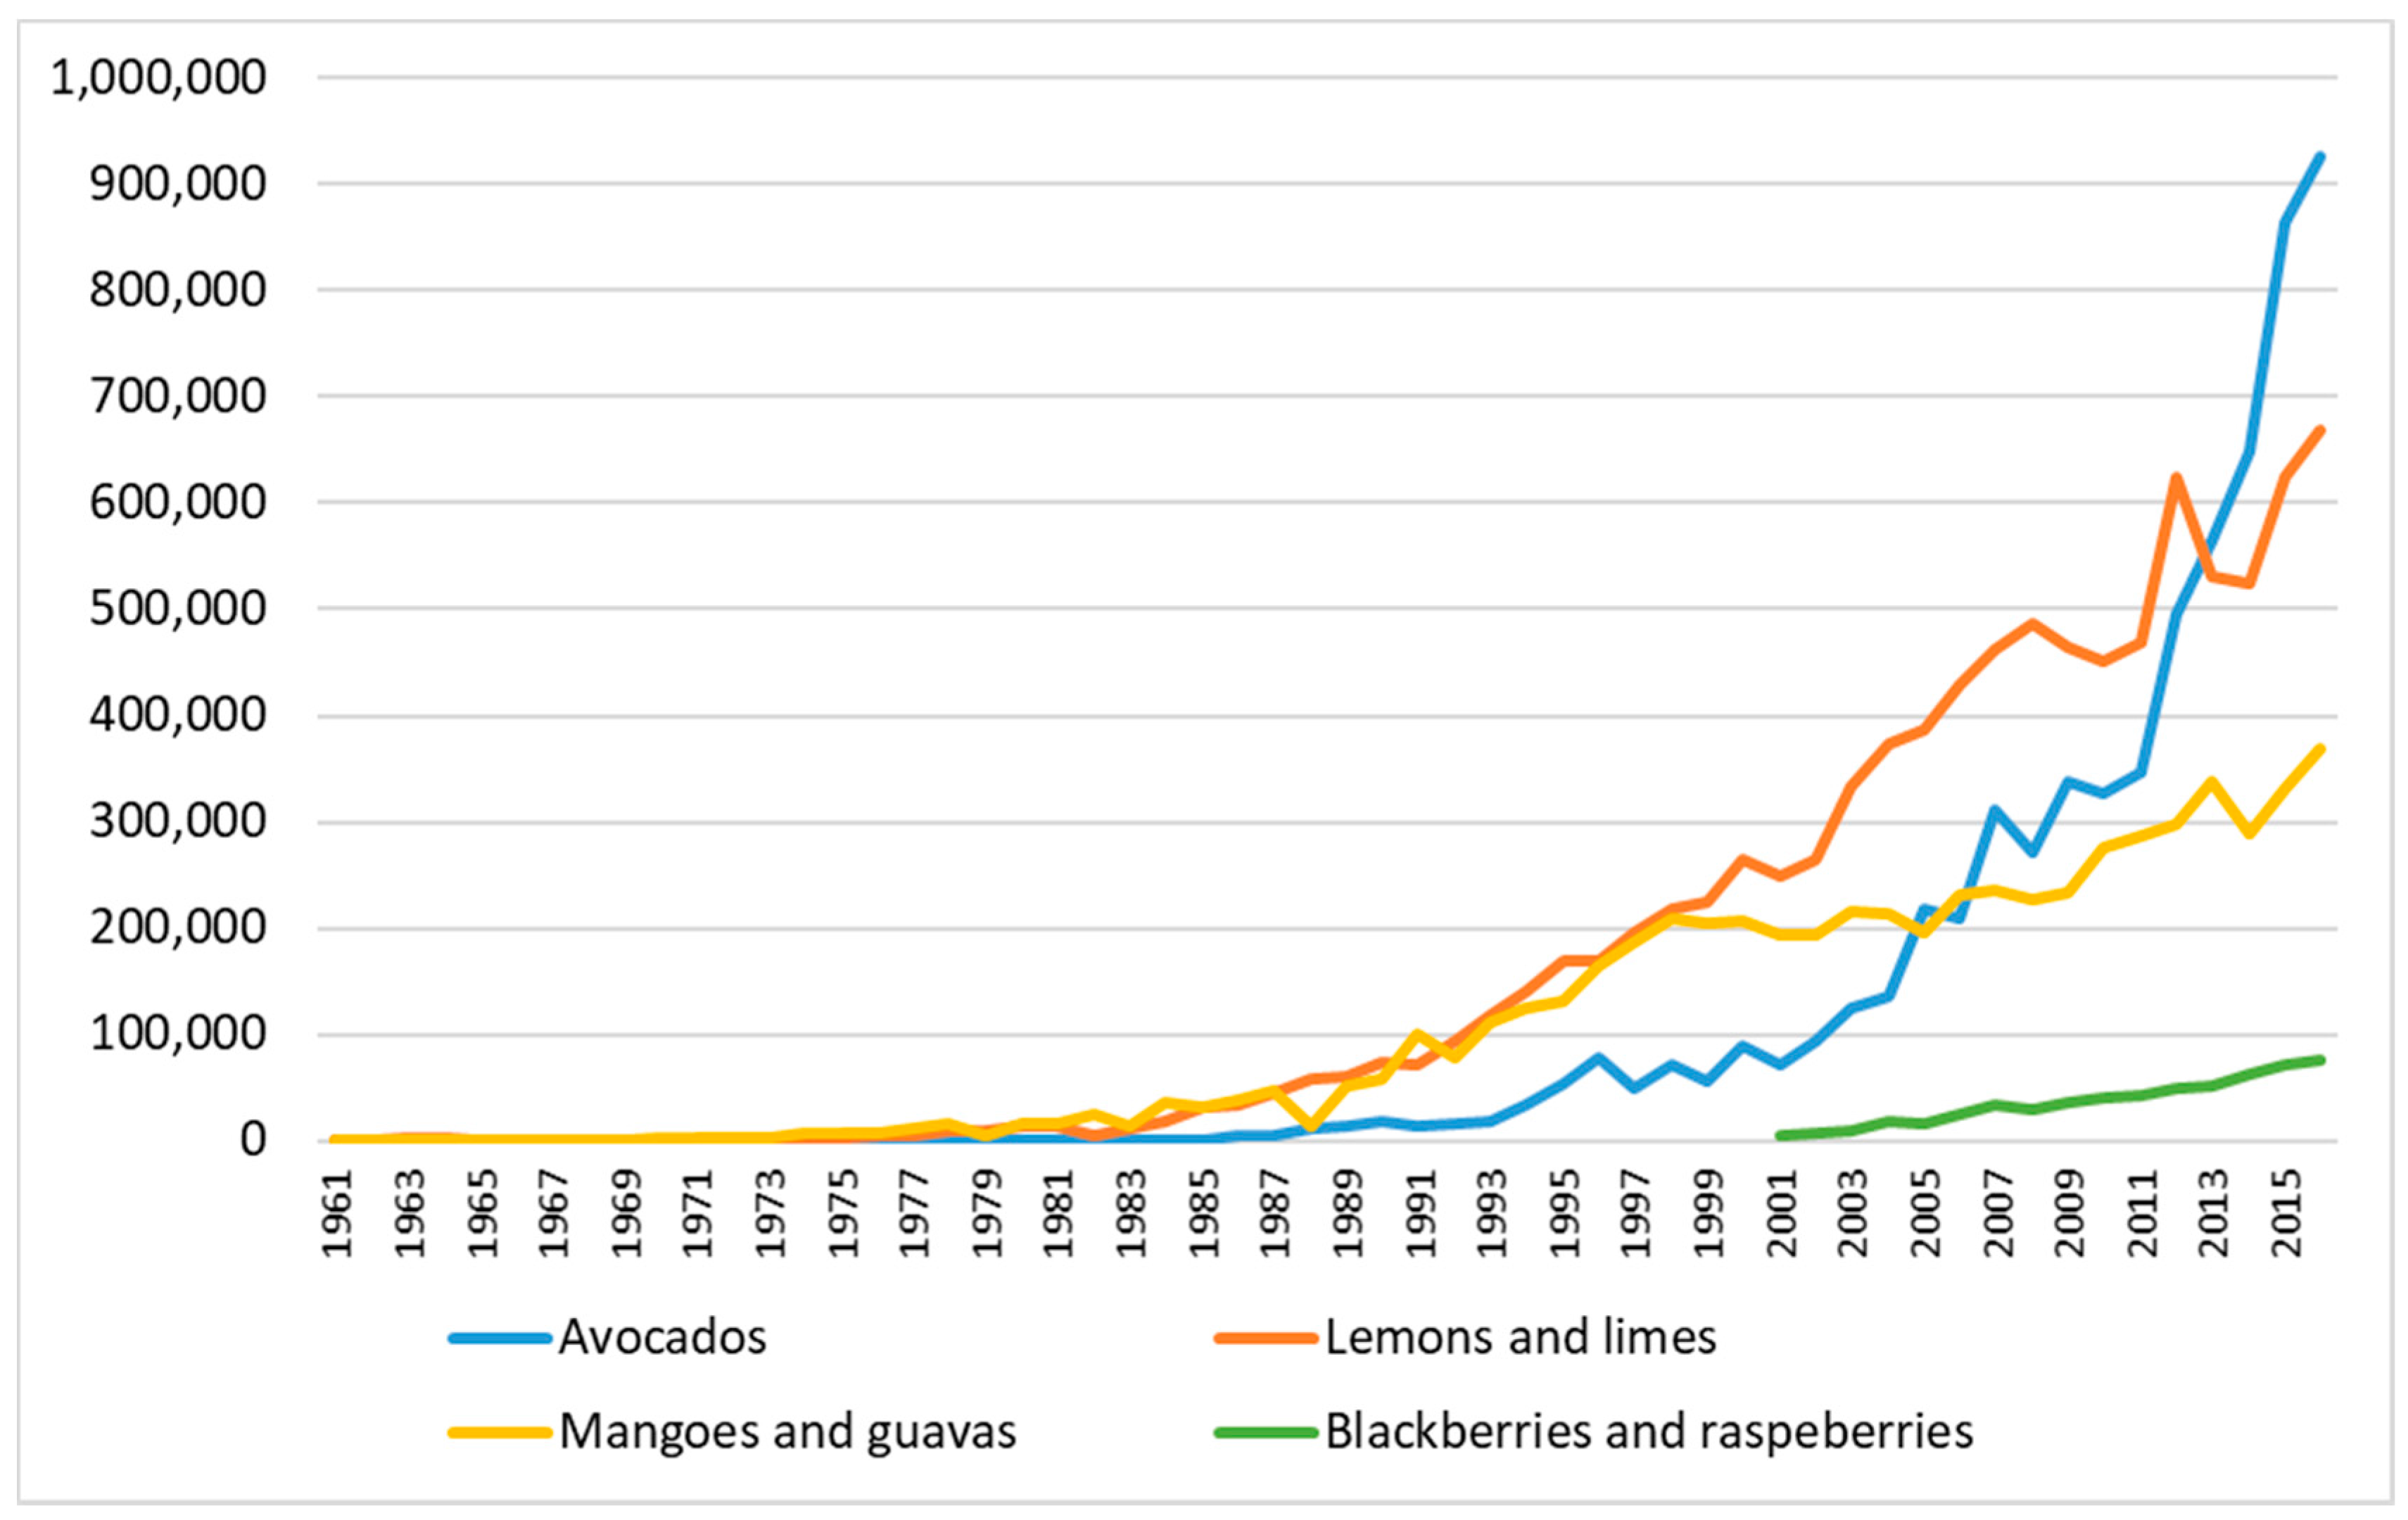
Avocado and lime (Figure 2a,e) had the most dramatic increase in harvested area in the last several decades (Table 3). In the 1950s, there were dispersed avocado orchards in few municipalities. After 1970, the cultivated area experienced explosive growth in Uruapan and the surrounding municipalities. Limes were first planted in the state long ago in the west-central region, and then, expanded constantly to neighboring municipalities in the last 65 years (see Supplementary Materials). The increments of these two crops responded mainly to international market demand (Figure 3) [32,33,34]. In the case of blackberries (Figure 2b), cultivated almost exclusively for the international market [35], exports have been growing steadily since 2001 (Figure 3) There are no records of this crop in the state before 1980. In the recent decades, the increase has been extraordinary, growing almost 500% from 2000 to 2010. This has happened in the central and the west-central parts of the state (see Supplementary Materials). Guava and mango are produced mostly for the national market, but exports have increased too in the last 30 years (Figure 3). Their planted area showed an increase from 1980 to 2000, but then, it plateaued (Figure 2d,f). These two crops were widespread in the state in 1950, but in the last 30 years, guava has increased in area only in the east of the state and mango in the center.
The areas of bean and chickpea cultivation (Figure 2h,i) have experienced a significant decrease. The area of bean cultivation has constantly decreased since 1980. The area of chickpea cultivation dropped sharply between 1970 and 1990. These changes reflect changes in crop distribution regions within Mexico. Beans are now cultivated in the north central part of the country, in the state of Zacatecas, and chickpeas in the northwest, in the state of Sinaloa [28].
There are some crops whose production area location changed radically. Fodder oats cropping areas were in the center in 1950, but after 2003, the northeast municipalities were the most important producers of this crop. Melon cropping land changed from the north in 1950 to the southeast in 2015. Strawberry planted area grew and moved from the center to the northeast and northwest. Tomato expanded in the northwest and in various municipalities, in the center south and southwest. Banana plantations were common in many areas with tropical climate in the 1950s and 1960s; however, in the 1970s, they started to become more concentrated, and by 2010, there was only one municipality in the southeast that had almost all of the state’s banana plantations. These patterns of concentration are associated to an increase in specialization on one cash crop of the agricultural areas.
3.3. Trends in Maize Planted Area by Municipality
Maize was cropped in almost every municipality even before the registers of agricultural census data. In the last 65 years, total planted maize area change at the state level is not statistically significant (Table 3). After 2003, we could see that the number of municipalities that had few hectares of maize started to increase. By 2015, there were extremely large zones in the southeast and many municipalities in the center with almost no maize planted area. Trend analysis based on the Kendall correlation test by municipality showed that 56 municipalities, out of 113, had a positive trend in maize cultivation, but only nine were significant. A total of 42 municipalities experienced a negative trend, but only nine were significant, and 15 municipalities showed no trend (Figure 2). In the nine municipalities with negative trends, we found that other crops had increased in area, which could be a maize area replacement. Most of the municipalities with a negative maize trend showed a positive trend in cash crops for the international market. We lack field data from farms to claim that maize is being replaced by cash crops. However, we can hypothesize an interaction between these trends. For example, in Tingambato and Tacámbaro (center of the state), maize area is decreasing while avocado is augmenting; in Cotija (center west), there is less maize and more sugar cane and avocado; in Ziracuaretiro (center), there is less maize and more avocado and blackberries. In Apatzingán, lime plantations are expanding and maize-cropping land is shrinking. In Múgica (center south), mango and papaya plantations are augmenting and maize area is declining. In Copándaro and Chucándiro (center north), vegetables and flowers and specifically, onions have become very important. In Ecuandureo (northwest), we could not find a specific crop that is increasing, but rather a combination of crops, such as grain sorghum, tomatoes, and peas. We found that in every municipality where maize area is declining, there is at least one cash crop that is increasing in the planted area. However, fieldwork in those areas is needed to confirm that maize has been replaced by these other crops. For avocado, there are reports that show extensive conversion of maize fields to avocado plantations [38].
3.4. Maize Race Diversity Implications
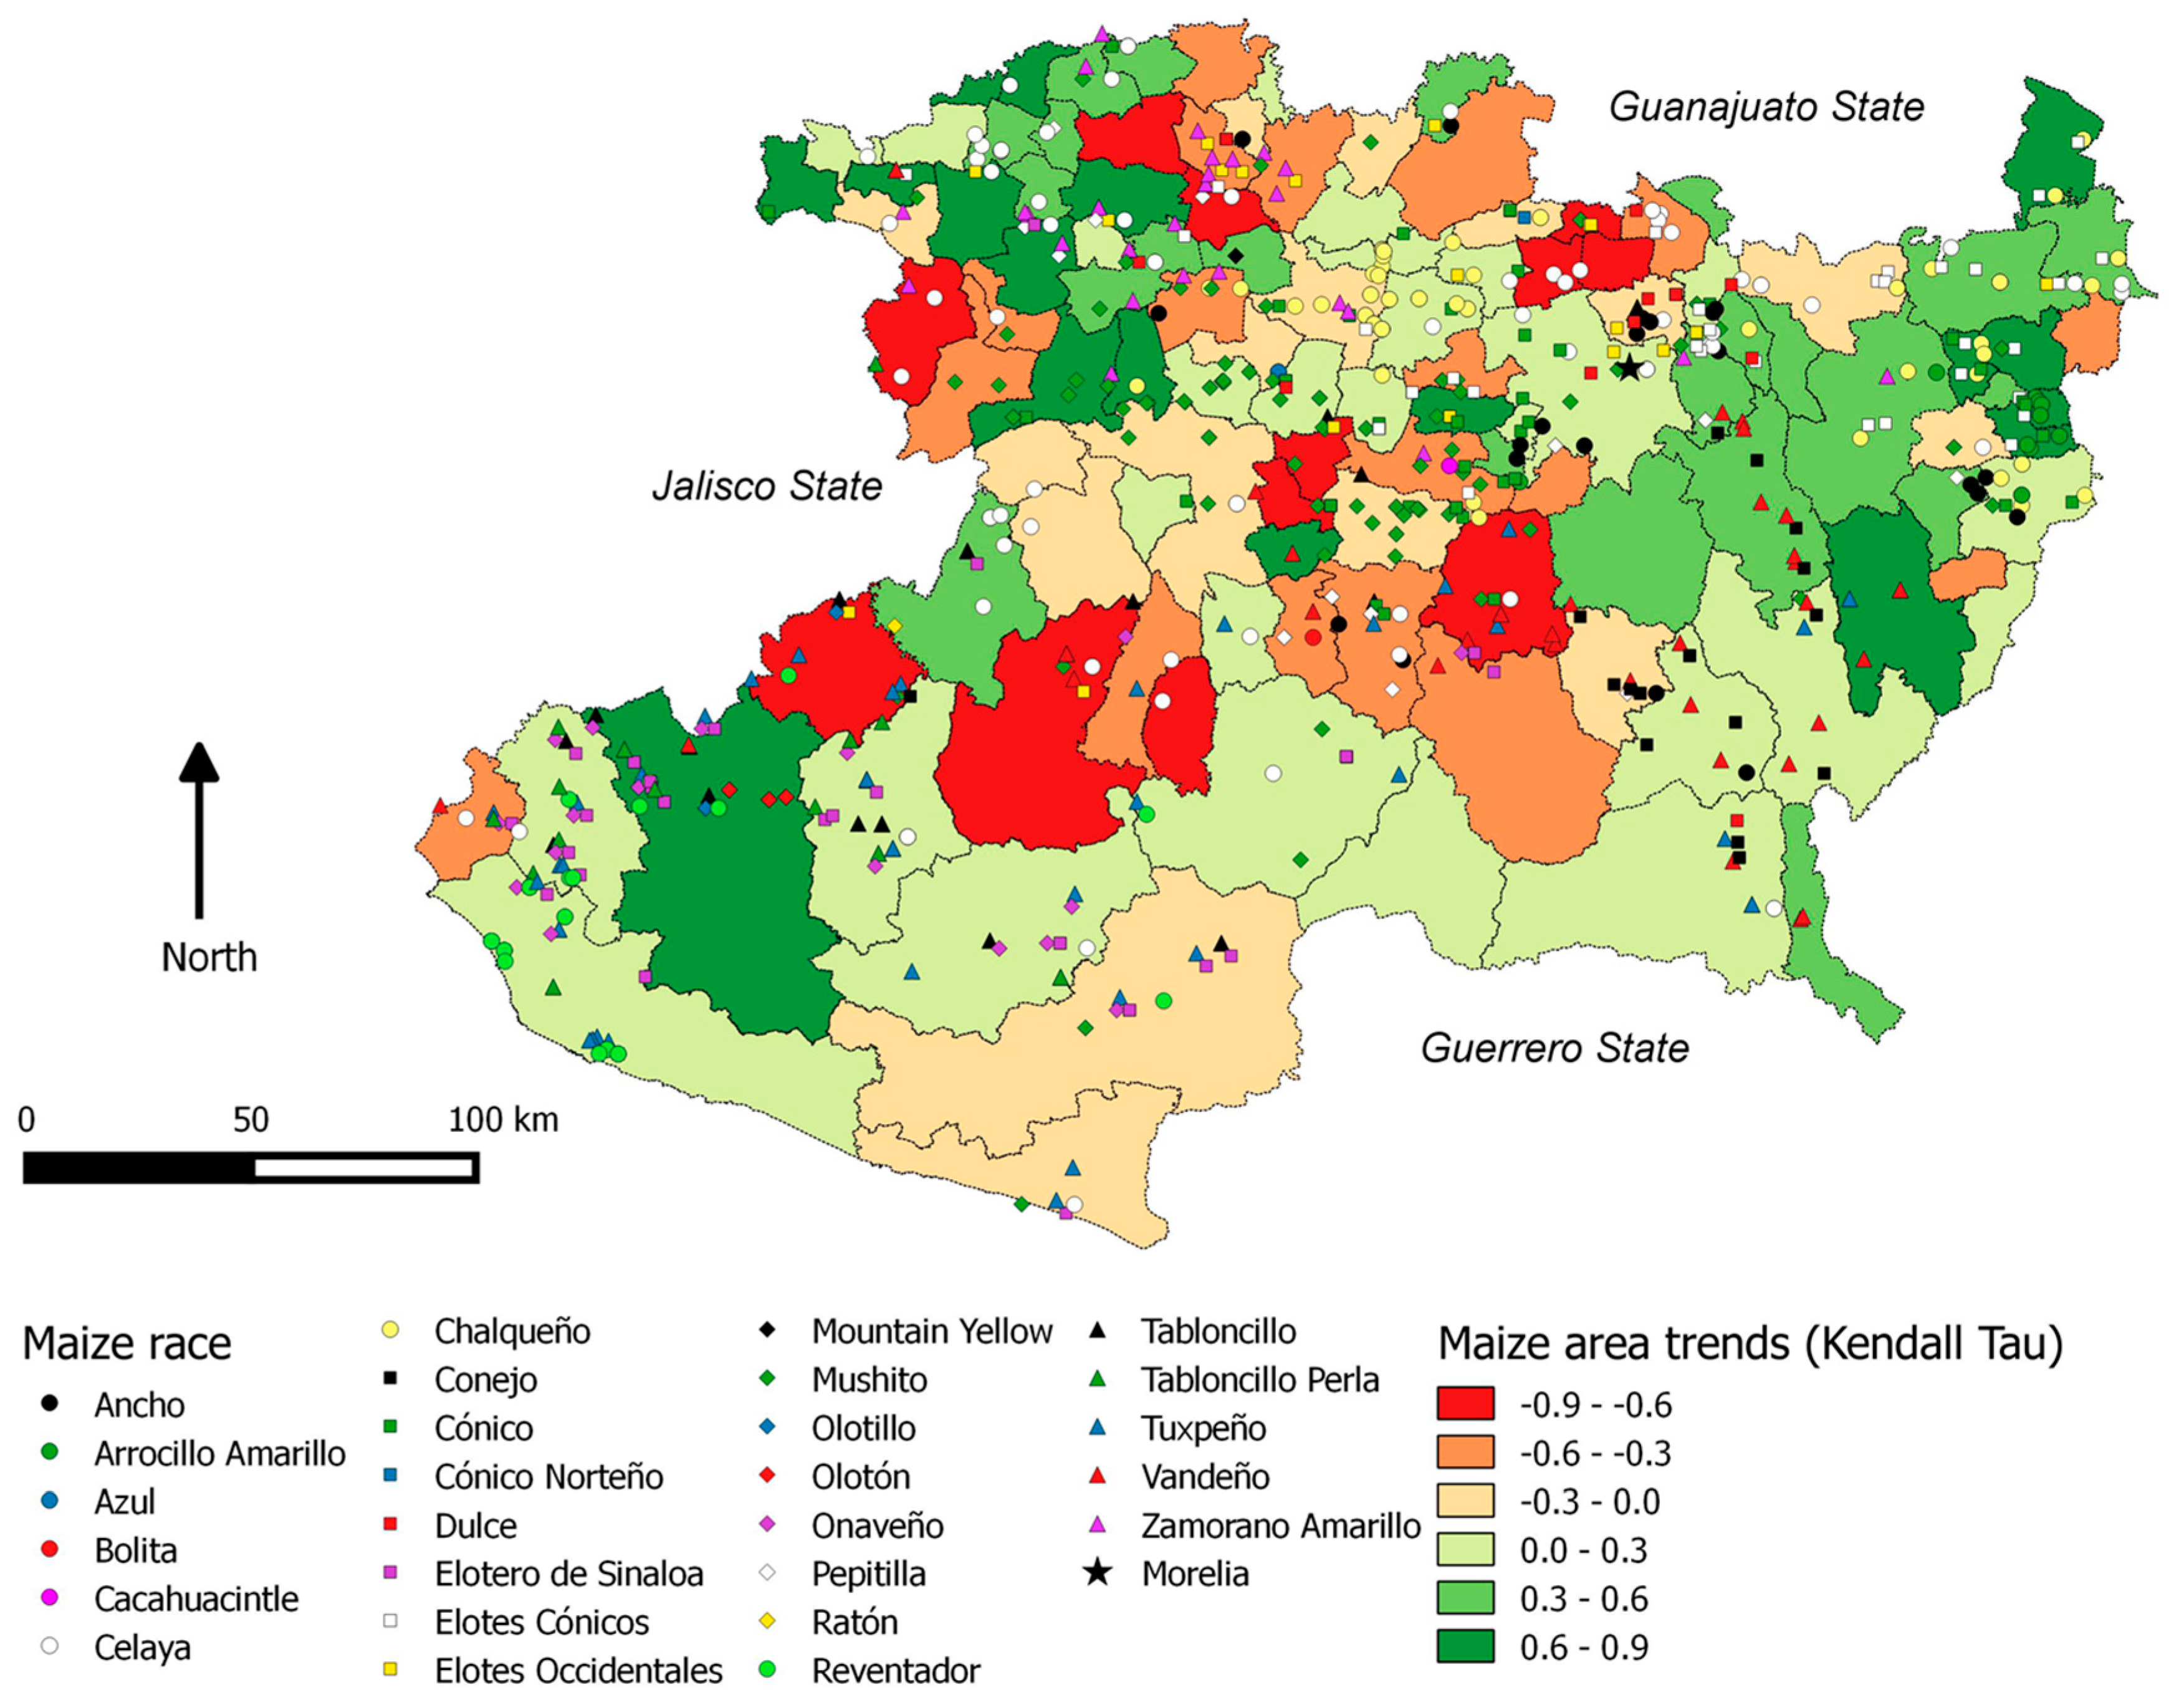
As mentioned above, maize race diversity is high in the state, with 27 of the 59 races reported in the country [16,17]. In total, there were 856 maize collections in the state, the first collections taken in 1943 and the last in 2010. The period with the most intense collection effort was from 2005 to 2010, when 61% of the samples were taken. The distribution of the samples is not homogeneous. There were some areas with many samples and others with very few. Most of the samples are in the center and northwest (Figure 4).
Frequencies of maize samples by race are not homogenous. Eight races represent 65% of the samples and 19 races 35% (Table 4). The most common races are Mushito (152 records), Celaya (100), Chalqueño (76), Cónico (60), Tuxpeño (56), Elotes Cónicos (40), Vandeño (38), and Zamorano Amarillo (36). Seven races have very few samples: Olotillo (8), Mountain Yellow (4), Cacahuacintle (3), Cónico Norteño (2), Azul (1), Bolita (1), and Ratón (1). In Table 4, we can see the number of collections by race, the percentage compared to the total collections, the period of collection, and the region from which they were collected. Among the races with very few samples, there are three that were collected many years ago, Cónico Norteño, Olotillo, and Ratón. For three races (Azul, Bolita, and Cacahuacintle), we do not know the date of collections. A revision is needed to confirm or reject the presence of these six races in the state.
We mapped the planted maize area trends along with the maize race collections in the state (Figure 4). We found that there are some races in areas of rapid crop changes. A large part of Pepitilla records in the center are in an area of rapid decrease of planted maize area and an increase in avocado and blackberry plantations. Similarly, Vandeño race is in a region of rapid increase of avocado and lime plantations. Dulce race has few collections, and some of them are in areas of declining maize cropping, while sorghum and vegetable cropping is increasing.
4. Discussion
Even though agricultural land change is a complex phenomenon, we have confirmed that main crop area expansion in Michoacán occurred due to international market integration [5]. Planted areas of avocados, limes, blackberries, and strawberries have grown due to exports [32,33,34,35]. We could see a relationship between the increase of volumes of exports and planted areas for five of the most dynamic crops: avocados, limes, blackberries, mangoes, and guava (Figure 2 and Figure 3). As in other regions of the world, the agricultural changes in Michoacán have been linked to the increase in international demand. In Brazil, beef and soybean exports are the main drivers of pasture and soy bean expansion [39]. Particularly, we can argue that NAFTA’s implementation has been a driver for expansion of fruit plantations (avocado, lime, blackberry mango, and guava). After NAFTA’s implementation in the 1990s, we saw the fastest planted area expansion for these five crops. Other regions of Mexico have followed the same pattern of export crop expansion: Jalisco with tequila, and Sinaloa with tomatoes and other vegetables. In fact, export markets for fruits and vegetables have increased 5% in volume from 1980 to 2009 for Mexico as a whole [40]. A similar process has been found for cattle production in Mexico. Due to rising beef demand in the US market, cattle ranching has increased in Mexico, causing land use change and deforestation in the southern area of the country [41].
In Mexico, not all agricultural changes are due to exogenous factors. Internal rural policies and history have contributed to the current bimodal agricultural sector. There is a modern sector integrated into national and international markets at the same time that there is an agricultural sector dominated by small farmers cropping mainly for auto-consumption [42]. For some authors, traditional agriculture is strongly rooted in rural Mexico and this is a factor that contributes to the continuing cultivation of traditional crops such as maize [43]. However, the existence of this traditional sector cannot explain changes for planted bean area. Bean crop land reductions could be attributed to deeper socioeconomic changes in rural areas. Beans, together with maize, were the staple food in Mexico until recently. In recent years, there has been a constant reduction in the consumption of beans, which are substituted by other protein sources such as meat [44]. Beans were cultivated in the milpa system with maize, squash, and other vegetables. According to our data, planted bean area has been declining since 1950. During this period, there was also a reduction in the population engaged in agriculture [45] and increases in family income from employment outside the farm [46]. This change could not only be affecting beans diversity, but also other traditional crops like squash, chili peppers, tomatoes, tomatillos, and chayotes, for which we do not have data. It is important to do some field research to reveal the state of these crops.
These changes in crop patterns could be affecting native agrobiodiversity, such as native maize races. We found indications of replacements of native maize area by cash crops. We forecasted that this process will continue in the areas that are suitable for cash crops, for example berries and fruit plantations such as avocado, mango, papaya, and limes. However, it is true that maize cultivation does not disappear from the municipalities where those cash crops are planted. For example, in 2015, in the municipalities with the largest conversions from maize to avocado, it is still possible to find some planted maize area in Tingambato (27% maize and 59% avocado), Tacámbaro (9% maize and 59% avocado), and Ziracuaretiro (9% maize and 68% avocado). About maize races at risk, we think Pepitilla, Vandeño, and Dulce races need more research to assess their current state (Figure 4 and Table 4). We could not confirm the findings of Carrera-Valtierra et al. [18] regarding the endangered situation of the Elotes occidentales, Tabloncillo, Celaya, Zamorano Amarillo, and Mushito races. However, we think that it is very important to obtain current data about hybrid maize use because this could be an important factor in the loss of maize races.
We lack reliable current information regarding hybrid maize use in the state. Some authors estimated that 79% of planted maize area in the country is planted with landraces and 21% with improved maize seed, which include hybrids [47]. The agricultural census from 1970 is the only instance where statistics about hybrid planted maize area were taken. That year, a total of 8% of the state’s planted maize area was sowed with hybrid maize. The municipalities with the largest use of hybrid varieties were in the north-central region and the Apatzingán Valley [27]. However, based on anecdotal experience, we could postulate that hybrid maize seed is used mostly in irrigated areas [48]. Those areas are also the most mechanized. In 2015, there were 98,764 hectares with irrigation, making up 24% of the total harvested area. We could hypothesize that this is the minimum area that has been planted with hybrids.
Based on published work, we have seen that native races and small farmers are resisting the challenges of this economic period dominated by powerful agro-food companies in the global market. Small-scale studies on socioeconomic and environmental changes have shown that maize farmers continue planting maize for socioeconomic and cultural reasons and how they have adapted to this economic context [4,45]. However, we believe that there are other crops such as beans that have been affected by those policies. In the last 65 years, planted bean areas in Michoacán have been reduced significantly, and we also expect a significant reduction in bean diversity. The decrease in the production of these basic foods has been happening throughout Mexico. It represents a present and future risk factor for national consumers because it means that Mexicans will become increasingly dependent on the food produced in other countries [40].
5. Conclusions
In the last 65 years, agriculture in central western Mexico has experienced enormous changes. Several commercial crops have extended over the territory and have changed the agricultural landscape. Some areas that had traditional multi-crop landscapes are now dominated by monocultures such as avocado, limes, mangoes, guava, and blackberries. The primary driver of these changes is the high market value that these products have in the context of NAFTA. This gambling on export agricultural expansion does not occur without a cost of losing food security for national consumers, and agro-biodiversity for the world in general. However, we have found evidence of resistance in some regions, meaning that traditional crops are still in the field.
Maize cropping area has not experienced a significant reduction in its total planted area in Michoacán, but we observed several areas with significant reductions. There were some zones with increase in planted maize area, but we could not determine what kind of varieties were being planted in those zones because of lacking census data. Regarding maize race diversity, seven maize races have notably few collections, and most of their records were registered many years ago. Three races are in places where planted maize area is significantly reduced. There is a need for reliable statistics about hybrid seed use in the state to evaluate the extent of the substitution of maize landraces by hybrids.
There are almost no socioeconomic and diversity studies about beans in Mexico. Beans, like maize, are a staple food in Mexico, but there is little information regarding their diversity. Planted area statistics indicate that bean cultivation is dramatically decreasing. It is possible that the crop is experiencing genetic erosion in the state.
Supplementary Materials
The following are available online at www.mdpi.com/2073-445X/6/4/66/s1, Maps of planted area for each crop by municipality. For each year planted area was sorted and divided in 10 breaks. Color intensity shows the ranking of each municipality in that ranked scale. White color is for the first rank with the less plantations and intense red for the largest rank. There are no data for some crops for some years, which are indicated as “no data”. Data from 1950 to 1991 come from agricultural census carried out by INEGI and data from 2003 to 2015 come from annual surveys carried out by SIAP (see text for details).
Acknowledgments
First author thanks Centro de Investigaciones en Geografía Ambiental at Universidad Nacional Autónoma de México for a postdoctoral scholarship (2015–2016). We also appreciate the financial assistance provided by the UNAM-DGAPA-PAPIIT (No. IN-210015).
Author Contributions
Orozco-Ramírez Quetzalcóatl and Marta Astier conceived and designed the research and the data analysis; Orozco-Ramírez Quetzalcóatl prepared and analyzed the data; Sara Barrasa and Orozco-Ramírez Quetzalcóatl wrote the paper.
Conflicts of Interest
The authors declare no conflict of interest.
References
- Sistema de Información Agroalimentaria y Pesquera (SIAP). Atlas Agroalimentario 2016; Sistema de Información Agroalimentaria y Pesquera: México City, Mexico, 2016.
- Aboites, J. Industrialización y Desarrollo Agrícola en México; Plaza y Valdés: México City, Mexico, 1989. [Google Scholar]
- Harvey, D. A Brief History of Neoliberalism; Oxford University Press: New York, NY, USA, 2007. [Google Scholar]
- Fitting, E. Importing corn, exporting labor: The neoliberal corn regime, GMOs, and the erosion of Mexican biodiversity. Agric. Hum. Values 2006, 23, 15–26. [Google Scholar] [CrossRef]
- Yúnez-Naude, A.; Paredes-Barceinas, F. The Agriculture of México after Ten Years of NAFTA Implementation; Documentos de Trabajo; Banco Central de Chile: Santiago, Chile, 2004; Volume 277, pp. 1–39. [Google Scholar]
- Perales-Rivas, M. Los campesinos de Cantabria, ¿Hombres de maíz? In Ciencia y Paciencia Campesina: El Maíz en Michoacán; Seefoó-Luján, J.J., Keilbach, N., Eds.; Colmich-Gobierno del Estado de Michoacán: Zamora, Mexico, 2010; pp. 161–190.
- Nadal, R.; Wise, T.A. The Environmental Costs of Agriculture Trade Liberalization: México-US Maize Trade under NAFTA; Working Group on Development and Environment in the Americas; Discussion Paper Number 4; Global Development and Environment Institute, Tufts University: Medford, MA, USA, 2004. [Google Scholar]
- Appendini, K. Reconstructing the maize market in rural México. J. Agrar. Chang. 2014, 14, 1–25. [Google Scholar] [CrossRef]
- Van de Wouw, M.; Kik, C.; van Hintum, T.; van Treuren, R.; Visser, B. Genetic erosion in crops: Concept, research results and challenges. Plant Genet. Resour. 2010, 8, 1–15. [Google Scholar] [CrossRef]
- Brush, S.B. Farmers’ Bounty: Locating Crop Diversity in the Contemporary World; Yale University Press: New Haven, CT, USA, 2004. [Google Scholar]
- Perales, H.R.; Aguirre, J.R. Biodiversidad humanizada. In Capital Natural de México, Vol. I: Conocimiento Actual de la Biodiversidad; Soberón, J., Halffer, G., Llorente-Bousquets, J., Eds.; CONABIO: Mexico City, Mexico, 2008; pp. 565–603. [Google Scholar]
- Matsuoka, Y.; Vigouroux, Y.; Goodman, M.M.; Sanchez, J.; Buckler, E.; Doebley, J. A single domestication for maize shown by multilocus microsatellite genotyping. Proc. Natl. Acad. Sci. USA 2002, 99, 6080–6084. [Google Scholar] [CrossRef] [PubMed]
- Kato, T.; Mapes, C.; Mera, L.; Serratos, J.; Bye, R. Origen y Diversificación del Maíz: Una Revisión Analítica; Universidad Nacional Autónoma de México: México City, Mexico, 2009. [Google Scholar]
- Watts, W.A.; Bradbury, J.P. Paleoecological studies at Lake Patzcuaro on the westcentral Mexican Plateau. Quat. Res. 1982, 17, 56–70. [Google Scholar] [CrossRef]
- Orozco-Ramírez, Q.; Barrera-Bassols, N.; Astier, M.; Masera, O. El sistema maíz-tortilla en el estado de Michoacán. In Ciencia y Paciencia Campesina: El maíz en Michoacán; Seefoó-Luján, J.J., Keilbach, N., Eds.; Colmich-Gobierno del Estado de Michoacán: Zamora, Mexico, 2010; pp. 119–136. [Google Scholar]
- CONABIO. Bases de Datos de Maíz. Available online: http://www.biodiversidad.gob.mx/genes/genes.html#NULL (accessed on 6 February 2017).
- Sánchez, J.; Goodman, M.; Stuber, C. Isozymatic and morphological diversity in the races of maize of México. Econ. Bot. 2000, 54, 43–59. [Google Scholar] [CrossRef]
- Carrera-Valtierra, J.A.; Ron-Parra, J.; Sánchez, G.J.J.; Sahagún, C.L.; Márquez, S.F. Diversidad y conservación in situ de los maíces de Michoacán. In Ciencia y Paciencia Campesina: El Maíz en Michoacán; Seefoó-Luján, J.J., Keilbach, N., Eds.; Colmich-Gobierno del Estado de Michoacán: Zamora, Mexico, 2010; pp. 57–71. [Google Scholar]
- Barragán-López, E. Campos de Michoacán. In Frutos del Campo Michoacano; Barragán-López, E., Ed.; El Colegio de Michoacán AC: Zamora, Mexico, 1999; pp. 17–38. [Google Scholar]
- Instituto Nacional de Estadística y Geografía. Anuario Estadístico y Geográfico de Michoacán de Ocampo 2014; INEGI: Aguascalientes, Mexico, 2014. [Google Scholar]
- Carranza-González, E. Vegetación. In La Biodiversidad en Michoacán: Estudio de Estado; Villaseñor-Gómez, L., Ed.; Comisión Nacional Para el Conocimiento y Uso de la Biodiversidad; Gobierno del Estado de Michoacán; Secretaría de Urbanismo y Medio Ambiente; Universidad Michoacana San Nicolás de Hidalgo: Morelia, Michoacán, Mexico, 2005; pp. 38–46. [Google Scholar]
- Cervantes-Zamora, Y.; Cornejo-Olguín, S.L.; Lucero-Márquez, R.; Espinosa-Rodríguez, J.M.; Miranda-Víquez, E.; Pineda-Velásquez, A. Clasificación de Regiones Naturales de México, Atlas Nacional de México; Catálogo de Metadatos Geográficos; Comisión Nacional para el Conocimiento y Uso de la Biodiversidad: México City, Mexico, 1990; Volume II.
- Unger, K.; Verduzco, G. El desarrollo de las regiones de origen de los migrantes: Experiencias y perspectivas. In Migración México-Estados Unidos Opciones de Política; Tuirán, R., Ed.; Consejo Nacional de Población: México City, Mexico, 2000; pp. 204–225. [Google Scholar]
- Corona, R.; Tuirán, R. Medición directa e indirecta de la migración mexicana hacia Estados Unidos 1990–1995. In Migración México-Estados Unidos Opciones de Política; Tuirán, R., Ed.; Consejo Nacional de Población: México City, Mexico, 2000; pp. 63–76. [Google Scholar]
- Dirección General de Estadística. Tercer Censo Agrícola, Ganadero y Ejidal. 1950. Estado de Michoacán; Secretaria de Economía/Dirección General de Estadística: México City, Mexico, 1957.
- Dirección General de Estadística. IV Censos Agrícola, Ganadero y Ejidal. 1960. Michoacán; Secretaria de Industria y Comercio/Dirección General de Estadística: México City, Mexico, 1965.
- Dirección General de Estadística. V Censos Agrícola, Ganadero y Ejidal. 1970. Michoacán; Secretaria de Industria y Comercio/Dirección General de Estadística: México City, Mexico, 1975.
- Sistema de Información Agroalimentaria y Pesquera. Anuario estadístico de la Producción Agrícola. Sistema de Información Agroalimentaria y Pesquera, México. Available online: http://www.gob.mx/siap/acciones-y-programas/produccion-agricola-33119 (accessed on 31 January 2016).
- Instituto Nacional de Estadística y Geografía. Michoacán. Resultados Definitivos. VII Censo Agrícola Ganadero 1991; INEGI: Aguascalientes, Ags., Mexico, 1994. [Google Scholar]
- R Development Core Team. R: A Language and Environment for Statistical Computing; R Foundation for Statistical Computing: Vienna, Austria, 2016; Available online: http://www.r-project.org (accessed on 12 December 2016).
- Gutiérrez-Contreras, M.; Lara-Chávez, M.B.N.; Guillén-Andrade, H.; Chávez-Bárcenas, A.T. Agroecología de la franja aguacatera en Michoacán, México. Interciencia 2010, 35, 647–653. [Google Scholar]
- Contreras-Castillo, J.M. La competitividad de las exportaciones mexicanas de aguacate: Un análisis cuantitativo. Rev. Chapingo Ser. Hortic. 1999, 5, 393–400. [Google Scholar]
- Stout, J.; Huang, S.W.; Calvin, L.; Lucier, G.; Perez, A.; Pollack, S. NAFTA trade in fruits and vegetables. In Global Trade Patterns in Fruits and Vegetables; Wu, H.S., Ed.; Agriculture and Trade Report Number: WRS-04-06; United States Department of Agriculture: Washington, DC, USA, 2004; pp. 39–51. [Google Scholar]
- Peterson, E.B.; Orden, D. Avocado pests and avocado trade. Am. J. Agric. Econ. 2008, 90, 321–335. [Google Scholar] [CrossRef]
- Sánchez, R.G. La Red de Valor de la Zarzamora, El Cluster de Los Reyes, Michoacán un Ejemplo de Reconversión Competitiva; Fundación Produce Michoacán AC: Morelia, Mich, Mexico, 2008. [Google Scholar]
- Food and Agriculture Organization of the United Nations. FAOSTAT Data. Available online: http://www.fao.org/faostat/en/#home (accessed on 12 September 2017).
- International Trade Center. International Trade Statistics 2001–2017. Available online: http://www.intracen.org/itc/market-info-tools/trade-statistics/ (accessed on 12 September 2017).
- Bravo-Espinosa, M.; Mendoza, M.E.; Carlón-Allende, T.; Medina, L.; Sáenz-Reyes, J.T.; Páez, R. Effects of converting forest to avocado orchards on topsoil properties in the Trans-Mexican Volcanic system, Mexico. Land Degrad. Dev. 2014, 25, 452–467. [Google Scholar] [CrossRef]
- Schierhorn, F.; Gittelson, A.K.; Müller, D. How the collapse of the beef sector in post-soviet Russia displaced competition for ecosystem services to the Brazilian Amazon. In Land Use Competition. Ecological, Economic and Social Perspectives; Niewöhner, J., Bruns, A., Hostert, P., Krueger, T., Nielsen, J.Ø., Haberl, H., Lauk, C., Lutz, J., Müller, D., Eds.; Springer International Publishing: Cham, Switzerland, 2016; pp. 165–182. [Google Scholar]
- González, H. Specialization on a global scale and agrifood vulnerability: 30 years of export agriculture in Mexico. Dev. Stud. Res. 2014, 1, 295–310. [Google Scholar] [CrossRef]
- Galvan-Miyoshi, Y.; Walker, R.; Warf, B. Land change regimes and the evolution of the maize-cattle complex in neoliberal Mexico. Land 2015, 4, 754–777. [Google Scholar] [CrossRef]
- Sweeney, S.; Steigerwald, D.G.; Davenport, F.; Eakin, H. Mexican maize production: Evolving organizational and spatial structures since 1980. Appl. Geogr. 2013, 39, 78–92. [Google Scholar] [CrossRef]
- Barkin, D. The reconstruction of a modern Mexican peasantry. J. Peasant Stud. 2002, 30, 73–90. [Google Scholar] [CrossRef]
- Ortiz-Hernández, L.; Delgado-Sánchez, G.; Hernández-Briones, A. Cambios en factores relacionados con la transición alimentaria y nutricional en México. Gac. Méd. Mex. 2006, 142, 181–193. [Google Scholar] [PubMed]
- Orozco-Ramírez, Q.; Astier, M. Socio-economic and environmental changes related to maize richness in México’s central highlands. Agric. Hum. Values 2017, 34, 377–391. [Google Scholar] [CrossRef]
- De Janvry, A.; Sadoulet, E. Income strategies among rural households in Mexico: The role of off-farm activities. World Dev. 2001, 29, 467–480. [Google Scholar] [CrossRef]
- Aquino, P.; Carrión, F.; Calvo, R.; Flores, D. Selected Maize Statistics. In Meeting World Maize Needs: Technological Opportunities and Priorities for the Public Sector; Pingali, P.L., Ed.; International Maize and Wheat Improvement Center (CIMMYT): México City, Mexico, 2001. [Google Scholar]
- Donnet, M.L.; López, D.; Arista, J.; Carrión, F.; Hernández, V.; González, A. El Potencial de Mercado de Semillas Mejoradas de Maíz en México; CIMMYT: México City, Mexico, 2012. [Google Scholar]
Figure 1.
Natural regions and main cities of the state of Michoacán [22].
Figure 1.
Natural regions and main cities of the state of Michoacán [22].

Figure 2.
Harvest area by crop with significant (positive or negative) changes from 1950 to 2015, the red line is lowess smoother. (a) Avocado, (b) Blackberry, (c) Fodder oats, (d) Guava, (e) Lime, (f) Mango, (g) Onion, (h) Beans, and (i) Chickpea.
Figure 2.
Harvest area by crop with significant (positive or negative) changes from 1950 to 2015, the red line is lowess smoother. (a) Avocado, (b) Blackberry, (c) Fodder oats, (d) Guava, (e) Lime, (f) Mango, (g) Onion, (h) Beans, and (i) Chickpea.

Figure 3.
Mexican exports in tons for avocados, lemons and limes, mangoes, guavas, blackberries, and raspberries from 1961 to 2016 [36,37].

Figure 4.
Maize planted area trends from 1950 to 2015 and maize race collections. Trends are expressed by tau coefficient from a Kendall correlation.
Figure 4.
Maize planted area trends from 1950 to 2015 and maize race collections. Trends are expressed by tau coefficient from a Kendall correlation.


Table 1.
Sources of data by year and scale.
| Year | Source | Scale |
|---|---|---|
| 1950 | DGE 1957 [25] | Municipality and State |
| 1960 | DGE 1965 [26] | Municipality and State |
| 1970 | DGE 1975 [27] | Municipality and State |
| 1980 | SIAP 2016b [28] | State |
| 1990 | SIAP 2016b [28] | State |
| 1991 | INEGI 1994 [29] | Municipality |
| 2000 | SIAP 2016b [28] | State |
| 2003 | SIAP 2016b [28] | Municipality |
| 2010 | SIAP 2016b [28] | Municipality and State |
| 2015 | SIAP 2016b [28] | Municipality and State |
Table 2.
List of main crops in Michoacán state by planted area and value in 2010.
| Crop | Harvested Area (ha) | Rank by Harvested Area | Market Value (Mexican Currency $) | Rank by Market Value |
|---|---|---|---|---|
| Avocado 1,2 | 103,303 | 3 | 12,640,768,396 | 1 |
| Banana 2 | 4065 | 17 | 284,903,161 | 17 |
| Beans 1 | 9280 | 11 | 109,664,227 | 21 |
| Blackberry 1,2 | 6118 | 15 | 1,357,880,016 | 3 |
| Chickpea 1 | 7390 | 13 | 53,353,049 | 22 |
| Fodder oat 1,2 | 24,848 | 6 | 300,737,147 | 16 |
| Fodder sorghum 1 | 15,742 | 9 | 189,651,286 | 20 |
| Grain sorghum 1,2 | 114,173 | 2 | 1,224,984,116 | 5 |
| Grass 1,2 | 80,975 | 4 | 442,059,796 | 11 |
| Green chili pepper 2 | 2568 | 21 | 400,943,587 | 12 |
| Guaba 1,2 | 9239 | 12 | 525,721,199 | 10 |
| Lime 1,2 | 36,120 | 5 | 1,340,405,338 | 4 |
| Maize 1,2 | 463,566 | 1 | 4,288,468,774 | 2 |
| Mango 1,2 | 20,265 | 8 | 397,316,453 | 13 |
| Melon 2 | 3326 | 19 | 356,781,482 | 14 |
| Onio 2 | 3766 | 18 | 342,309,621 | 15 |
| Papaya 2 | 1508 | 23 | 243,527,148 | 19 |
| Potato 2 | 1822 | 22 | 616,912,500 | 9 |
| Strawberry 1,2 | 3253 | 20 | 692,534,829 | 7 |
| Sugar cane 1,2 | 14,102 | 10 | 781,180,225 | 6 |
| Tomato 2 | 5059 | 16 | 669,652,934 | 8 |
| Vetch 1 | 6263 | 14 | 49,532,341 | 23 |
| Wheat 1,2 | 20,337 | 7 | 269,596,196 | 18 |
| Total | 957,087.18 | 27,578,883,820.84 | ||
| Percentage of the state | 93% | 92% |
1 Important for planted area; 2 Important for market value.
Table 3.
Harvested area trends for each crop in Michoacán state from 1950 to 2015.
| Crop | Tau Estimate | p-Value |
|---|---|---|
| Avocado | 1.000 | 0.000 |
| Banana | 0.571 | 0.061 |
| Beans | −0.786 | 0.006 |
| Blackberry | 0.949 | 0.023 |
| Chickpea | −0.714 | 0.030 |
| Fodder oats | 1.000 | 0.003 |
| Fodder sorghum | 0.524 | 0.136 |
| Grain sorghum | −0.067 | 1.000 |
| Grass | 1.000 | 0.083 |
| Green Chili Pepper | 0.733 | 0.056 |
| Guava | 0.810 | 0.011 |
| Lime | 1.000 | 0.000 |
| Maize | 0.286 | 0.399 |
| Mango | 0.905 | 0.003 |
| Melon | −0.048 | 1.000 |
| Onion | 0.867 | 0.017 |
| Papaya | 0.600 | 0.233 |
| Potato | 0.067 | 1.000 |
| Strawberry | 0.619 | 0.069 |
| Sugar cane | 0.429 | 0.179 |
| Tomato | 0.600 | 0.136 |
| Vetch | 0.000 | 1.000 |
| Wheat | −0.357 | 0.275 |
Table 4.
Races collected in the state of Michoacán, percentage, period of collection, location, and main crops substituting planted maize area.
Table 4.
Races collected in the state of Michoacán, percentage, period of collection, location, and main crops substituting planted maize area.
| Maize Race | Frequency | Percentage | Collection Period |
|---|---|---|---|
| Ancho | 24 | 2.8% | 2006–2010 |
| Arrocillo Amarillo | 16 | 1.9% | 1979–2010 |
| Azul | 1 | 0.1% | NA |
| Bolita | 1 | 0.1% | NA |
| Cacahuacintle | 3 | 0.4% | NA |
| Celaya | 100 | 11.7% | 1943–2010 |
| Chalqueño | 76 | 8.9% | 1944–2010 |
| Conejo | 28 | 3.3% | 2006–2008 |
| Cónico | 60 | 7.0% | 1943–2010 |
| Cónico Norteño | 2 | 0.2% | 1979–1979 |
| Dulce | 17 | 2.0% | 1944–2008 |
| Elotero de Sinaloa | 34 | 4.0% | 2007–2010 |
| Elotes Cónicos | 40 | 4.7% | 1944–2010 |
| Elotes Occidentales | 33 | 3.9% | 1944–2008 |
| Mountain Yellow | 4 | 0.5% | 1952–2008 |
| Mushito | 152 | 17.8% | 1943–2005 |
| Olotillo | 8 | 0.9% | 1952–1952 |
| Olotón | 11 | 1.3% | 2008–2008 |
| Onaveño | 18 | 2.1% | 2007–2010 |
| Pepitilla | 26 | 3.0% | 1944–2010 |
| Ratón | 1 | 0.1% | 1960–1960 |
| Reventador | 28 | 3.3% | 1952–2010 |
| Tabloncillo | 26 | 3.0% | 1944–2008 |
| Tabloncillo Perla | 17 | 2.0% | 2008–2010 |
| Tuxpeño | 56 | 6.5% | 1947–2010 |
| Vandeño | 38 | 4.4% | 1952–2008 |
| Zamorano Amarillo | 36 | 4.2% | 1943–2008 |
© 2017 by the authors. Licensee MDPI, Basel, Switzerland. This article is an open access article distributed under the terms and conditions of the Creative Commons Attribution (CC BY) license (http://creativecommons.org/licenses/by/4.0/).
Share and Cite
MDPI and ACS Style
Orozco-Ramírez, Q.; Astier, M.; Barrasa, S. Agricultural Land Use Change after NAFTA in Central West Mexico. Land 2017, 6, 66. https://0-doi-org.brum.beds.ac.uk/10.3390/land6040066
AMA Style
Orozco-Ramírez Q, Astier M, Barrasa S. Agricultural Land Use Change after NAFTA in Central West Mexico. Land. 2017; 6(4):66. https://0-doi-org.brum.beds.ac.uk/10.3390/land6040066
Chicago/Turabian StyleOrozco-Ramírez, Quetzalcóatl, Marta Astier, and Sara Barrasa. 2017. "Agricultural Land Use Change after NAFTA in Central West Mexico" Land 6, no. 4: 66. https://0-doi-org.brum.beds.ac.uk/10.3390/land6040066
Note that from the first issue of 2016, this journal uses article numbers instead of page numbers. See further details here.