Land Use Scenario Modeling Based on Local Knowledge for the Provision of Ecosystem Services in Northern Ghana


1
Department of Ecology and Natural Resources Management, Center for Development Research (ZEF), University of Bonn, Walter-Flex-Straße 3, 53113 Bonn, Germany
2
Department of Sustainable Landscape Development, Institute for Geosciences and Geography, Martin Luther University Halle-Wittenberg, Von-Seckendorff-Platz 4, 06120 Halle, Germany
*
Author to whom correspondence should be addressed.
Land 2018, 7(2), 59; https://0-doi-org.brum.beds.ac.uk/10.3390/land7020059
Submission received: 31 March 2018
/
Revised: 24 April 2018
/
Accepted: 3 May 2018
/
Published: 4 May 2018
(This article belongs to the Special Issue Understanding the Patterns, Drivers and Consequences of Agricultural Land Use Change and Land-Use Intensity)
Abstract
:The understanding of multiple effects by possible future development is essential for adapted land use planning. This study assessed the potential of land use scenarios for the provision of ecosystem services using local knowledge in two districts of northern Ghana. Local knowledge was gathered through surveys with extension officers, who are regarded as eligible knowledge holders for agricultural land use. Firstly, ecosystem services that were perceived as important by the stakeholders were identified, namely food, fodder, energy, construction materials, marketable products, water provision, and erosion control. Quantitative indicators were then determined to analyze the capacity of land use types to supply the ecosystem services. Land use scenarios were developed based on their applicability and capacity to mitigate climate change impacts. The perception of stakeholders was applied to evaluate changes in ecosystem services provision by the scenarios. A modeling approach for a spatially explicit simulation was used to assess the potential to provide ecosystem services at a district level. The results reflected the different trade-offs and synergies between ecosystem services of each scenario, depending on the district. Along with the local perception, characteristics of land use patterns also influenced the regional potential of ecosystem services provision.
1. Introduction
In West Africa, the majority of farmers rely on small-scale subsistence farming that produces most of the staple crops through rain-fed agriculture [1,2,3]. The high dependence on climate-sensitive agriculture increases the vulnerability of poor communities to the consequences of increasing climate variability and extreme weather events, such as droughts and floods [4]. Therefore, adapted land use planning and resource management for avoiding unfavorable environmental conditions becomes important [5]. The Ghana Environmental Protection Council (1988) formerly expressed the necessity for coordinated and comprehensive land management and planning strategies [6]. It stipulated principles of land management as increasing crop yields while maintaining ecosystems and ecological processes, and encouraging public participation in decision-making, in order to address challenges in environmental and resource management due to land pressure. However, land use planning in Ghana is authorized and led by the local government as the basic administrative unit that has been criticized to implement overly general and haphazard schemes to solve pressing issues, rather than fostering proactive and adaptive planning [7,8,9]. The lack of public awareness of land management programs has also hampered the successful implementation of adapted land management strategies [10]. An approach is, thus, required to formulate land use schemes with a clear assessment component considering human–environmental relations, and applying participative processes tailored to regional conditions [11,12,13]. An instrument for assessing land use schemes should be particularly able to address impacts of human intervention (land use activities) on ecosystems, and the consequential changes in human benefits to which they are coupled. Incorporating the concept of ecosystem services (ES) into land use planning has received attention as a means to perform such an assessment [14,15,16]. An assessment approach also needs to deal with impacts of potential future land use options considering regional conditions. The integration of scenarios in planning is increasingly propagated to envisage different pathways of future landscapes, thereby allowing the exploration of options to reach specific targets [17,18]. The involvement of stakeholders in designing land use scenarios helps to identify acceptable land use alternatives by reflecting local preferences in land use decisions. It facilitates the understanding of the multifaceted nature of land use issues from the perspective of stakeholders who are directly affected by land use decisions, but limited to participate in science and policy discourses [19]. Scenarios that include the ES concept need to consider especially behaviors of ES beneficiaries (e.g., land users) and responses of ES providers (e.g., land use and landscape systems) [20,21]. Such attempts to determine the relationship between human activities and ES provision are, however, still scarce in many regions of West Africa [22]. Several studies in West Africa have so far focused on potential consequences of climate change scenarios on crop yield, rather than analyzing the influence of modified environmental conditions by human activities on land use-related human benefits (e.g., [4,23,24]). Stakeholder involvement was missing in the few studies that have assessed the impacts of land use patterns using the ES concept (e.g., [25,26]).
This study analyzes locally adapted and acceptable land use planning options based on the notion that human activities modify ecosystems and environmental conditions and, consequently, change the potential provision of ES. Specifically, this study aims at assessing the influence of future land use decisions on local ES provision using a participative approach in northern Ghana. By acknowledging local differences in perception, ES provision was analyzed separately for two adjoining districts. In the following sections, we describe the study areas, the land use types, the selection of local knowledge holders and ES, and the development of scenarios. The potential of the developed scenarios on the regional ES provision considering trade-offs and synergies between the ES are presented as results. In the discussion, differences between the districts in ES provision and limitations of this study are addressed.
2. Materials and Methods
2.1. Case Study Area
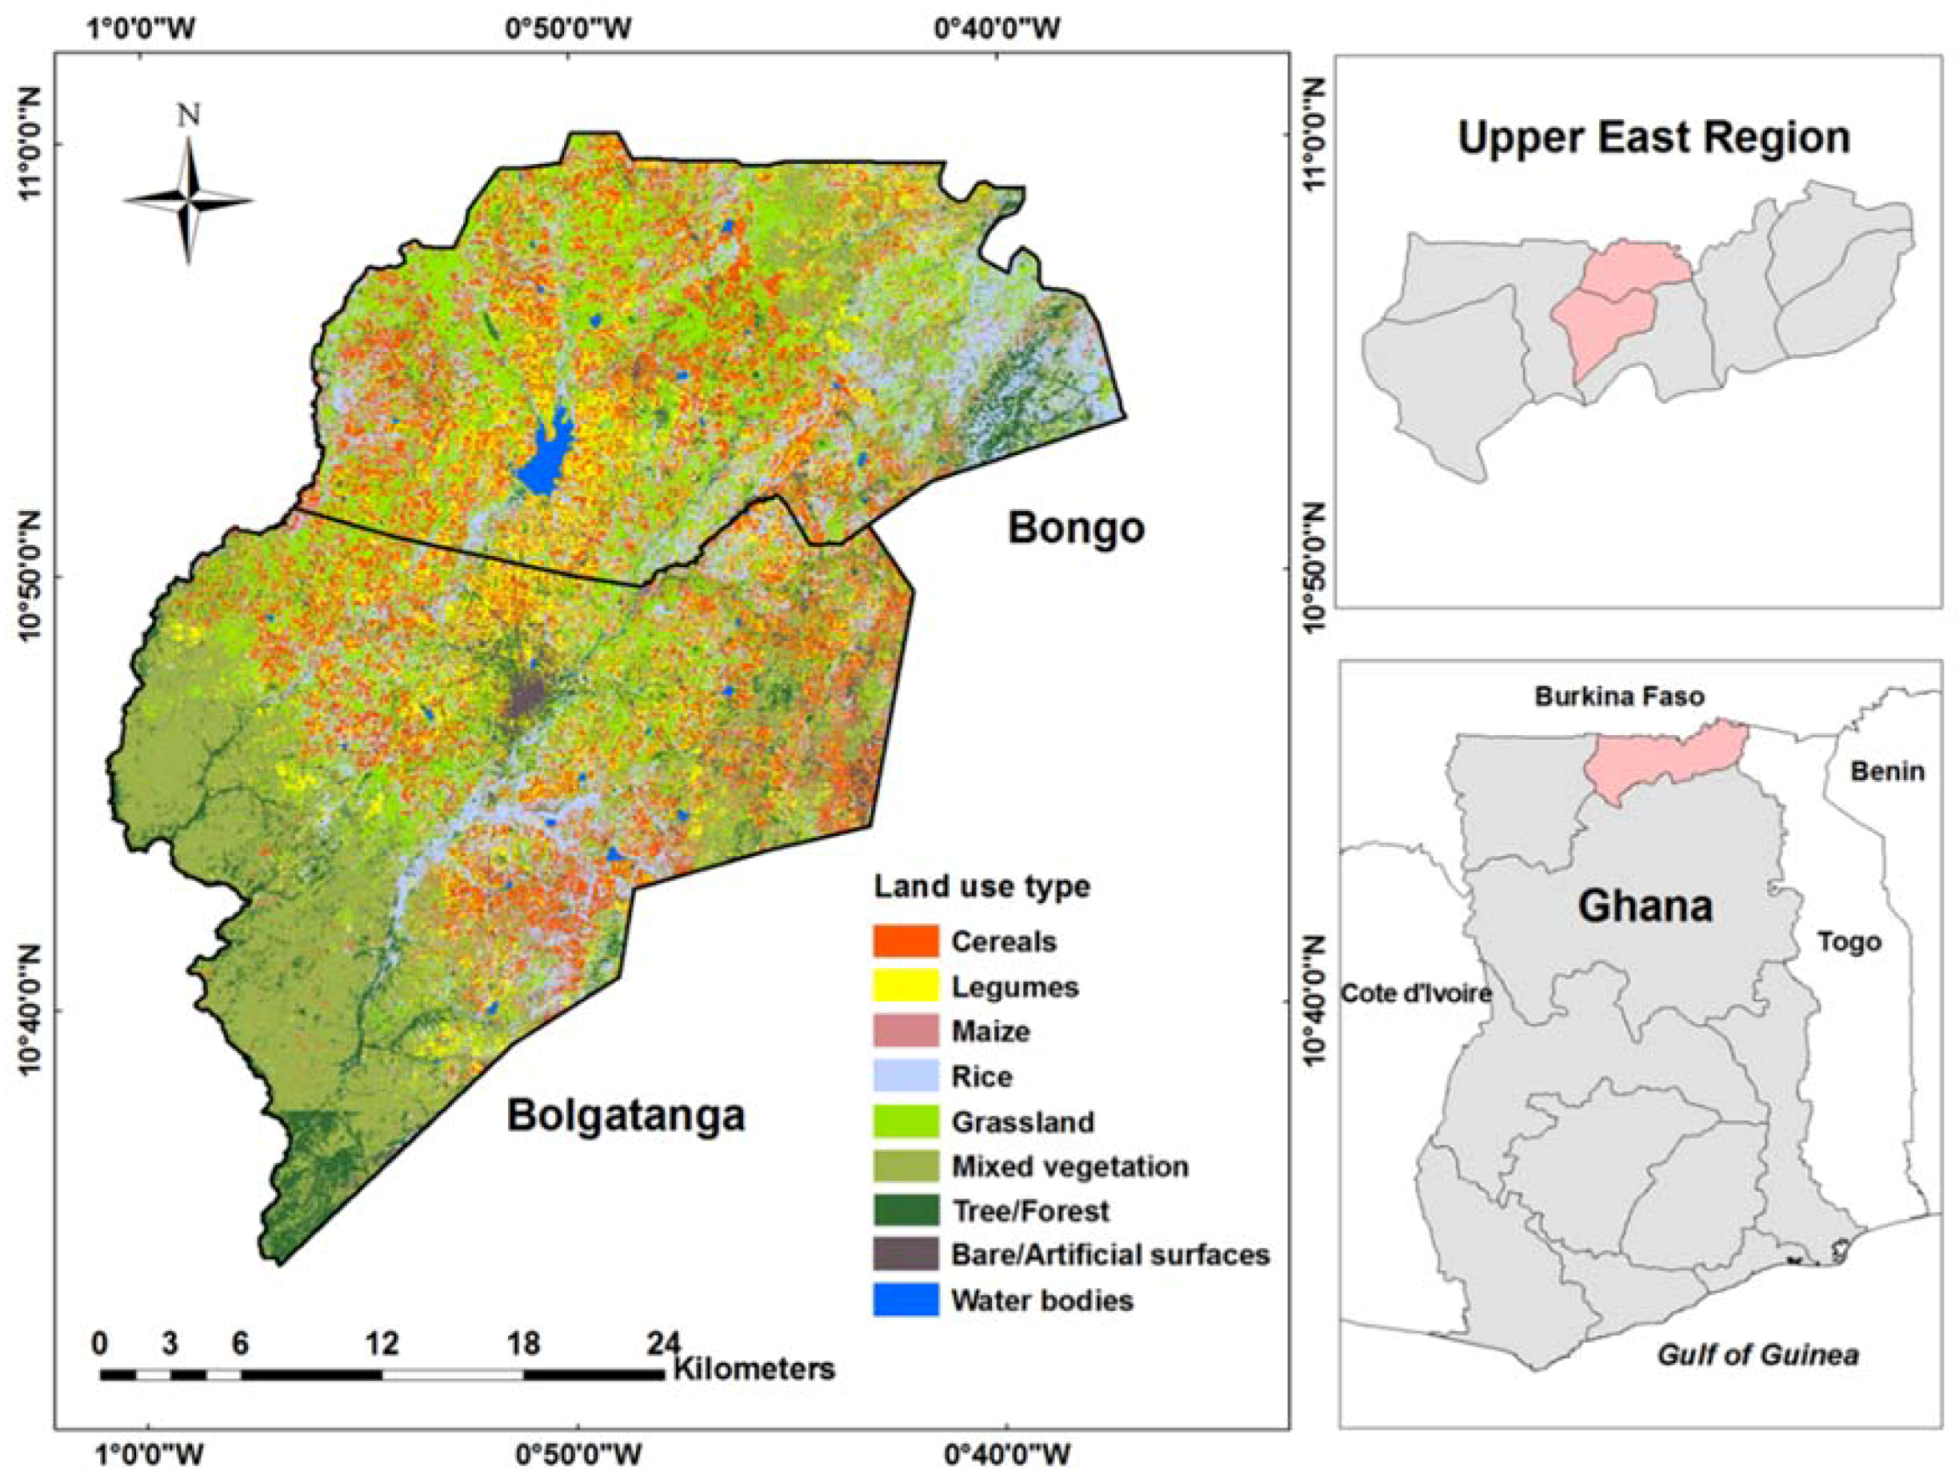
The study area is located in the Upper East Region (UER) of northern Ghana, and covers two districts, Bolgatanga Municipal (hereafter “Bolgatanga”) and Bongo (Figure 1). Bolgatanga is located in the center of the UER, and covers a total area of 729 km2. Bongo shares boundaries with Bolgatanga to the south, covering a total area of 460 km2 [27]. Both districts belong to the Guinea Savannah Ecological Zone with two distinct seasons: a wet season from May to October, and a dry season from October to April. The average annual rainfall is approximately between 700 and 1010 mm, with a peak occurring in late August or early September [28,29]. The two districts are characterized by 1% to 5% of slopes, including granite rocky outcrops [30,31]. Their soil types are Lixisol, Leptosol, Luvisol, Gleysol, and Fluvisol, as classified by the Soil Research Institute of Ghana (2008). The two districts have similar environmental conditions and share the Vea watershed, whereas they have a different socio-political condition. Bolgatanga is more urbanized than Bongo, due to the fact that Bolgatanga is the administrative capital of the UER. About 55.4% of households in Bolgatanga are residents of urban areas, while only 7.5% of households in Bongo live in urban areas [27]. Each district has individual political, administrative, and developmental decision-making power, according to a decentralization program initiated in 1988 [32].
2.2. Dataset for Ecosystem Service Assessment
2.2.1. Land Use Pattern
In northern Ghana, only limited land is available for dry season irrigation farming, due to improper construction of small dams, technical constraints, and credit availability of farmers to use mineral fertilizer [33,34]. Furthermore, farmers with low income cannot afford the money for irrigated areas [35]. Therefore, this study only deals with land use patterns of the wet season. The study area is classified by nine land use types [33]. A definition of each land use type and its share in Bolgatanga and Bongo is shown in Table 1. Considering the potential use of grassland for the cultivation of herbaceous forage crops [31,36], more than 65% of the area in Bolgatanga and 88% of the area in Bongo is assumed to be utilized for agriculture. According to the classification of Forkuor (2014), artificially constructed areas and granite outcrops are defined as bare/artificial surfaces. Dense tree/forest cover on a large scale is mainly established as forest reserve. Scattered trees are mostly fruit trees, and often located around houses. Grassland and mixed vegetation is composed of short deciduous and indigenous trees and shrubs that are normally located on communal land. The Vea dam is considered as the main water body in the region. The dam is located in Bongo with 4 km2 of surface area and 136 km2 of catchment area covering nine communities in Bolgatanga and Bongo [37]. On the grounds that agriculture is the main land use activity in this region, we focused on the impact of agricultural land use scenarios on the distribution of land use types and the provision of ES.
2.2.2. Local Knowledge
Local knowledge is shaped by the involved stakeholder group. The selection of the appropriate stakeholder group is therefore crucial in a participative approach [38,39]. Participants should be selected in light of representativeness of the broader stakeholder community, their capacity and willingness to constructively share their opinions, and ability to disseminate information and ideas to other relevant stakeholders [40]. Their relevance should be also considered by the level of influence and interest in land use decisions at a pertinent spatial scale [41]. Agricultural extension agents (hereafter, “extension officers” or “stakeholders”) of the Ministry of Food and Agriculture of Ghana (MOFA) were selected among various stakeholder groups in this respect. They are highly decisive for the implementation of agricultural practices in this region [42,43]. Their main task is the provision of technical advice and the introduction of new farming techniques and policies to farmers. Each extension officer is assigned to specific communities and responsible to monitor and report field conditions and crop performance to the district office of MOFA [44]. All extension officers in this region meet and discuss agriculture-related issues, such as adjustment of farming schedules or a new cultivation practice through regular district meeting. As a liaison between farmers (direct land users) and policy makers (indirect land users), their opinions significantly influence the farmers’ land use decisions and their role is crucial for the implementation of agricultural policies and strategies of MOFA. In consideration of extension officers’ knowledge, field experience, and cooperation with farmers, they also play an important role in the initialization and monitoring of new agricultural programs that are supervised by NGOs, other governmental authorities, and agribusinesses [44]. Thus, the extension officers are considered as the most appropriate and representative knowledge holders regarding agricultural land use at district level, compared to other stakeholder groups who may have more specific knowledge and interest at plot or program level. There were fifteen extension officers in Bolgatanga and eleven in Bongo who are currently working in the study area and participated in data generation through stakeholder surveys. The following methodological chapters show the usage of collected local knowledge in terms of the selection of locally important ES, input data for ES indicators, the potential impact of individual land use scenarios, and the application conditions of land use scenarios in simulation.
2.2.3. Ecosystem Services and Indicators
A specific set of locally relevant ES for this study was identified together with the stakeholders among the suggested ES in previous studies (e.g., [45]). The ES selection criterion was based on its importance related to agricultural activities. The stakeholders were asked for their perception on the importance of suggested ES with a five-point Likert scale. ES with an average value of 4 or higher were selected (Table S1 in Supplementary). The perceptibility of the differences in the status of ES provision between land use types was regarded as the second selection criterion. The stakeholders were asked to compare the capacity of land use types to provide ES from 0 (no provision potential) to 10 (highest provision potential), in order to identify differences in ES provision by the respective land use type (Table S2 in Supplementary). The selected ES included the provision of food, fodder, energy, construction materials, marketable products, water, and erosion control (Table 2). Indicators to assess benefits that are directly obtained from land use activities, such as food, fodder, energy, construction materials, and marketable products, were determined to reflect the consumptive patterns of the stakeholders regarding land use products (e.g., grains, stalks, straws, branches, fruits, and leaves). For example, fodder provision delivered by legumes was identified as livestock feed in proportion to the entire products from legumes as perceived by the stakeholders. Data for the indicators were obtained by a stakeholder survey (details in [44], Table S3 in Supplementary). Such indicators allow the identification of multiple ES supplied by one land use type without ignoring or double-counting potential benefits (e.g., [46,47]). Water provision and erosion control as indirect benefits from land use activities were difficult to be determined by such a perception on the provision level. We adopted, thus, proxies applied in existing studies [26,48,49,50,51], which defined the quantity of surface water for direct use by households and the extent of surface run-off generated by each land use type.
2.3. Development of Land Use Scenarios
Scenarios combined with the ES concept need to handle assumptions which are manageable and comprehensible for stakeholders and decision-makers of land use associated with future ES provision [52,53]. In this study, land use scenarios were developed as potential change of land use activities and land use intensities in order to cope with climate change impacts on land use, which are adoptable by the stakeholders in the near future.
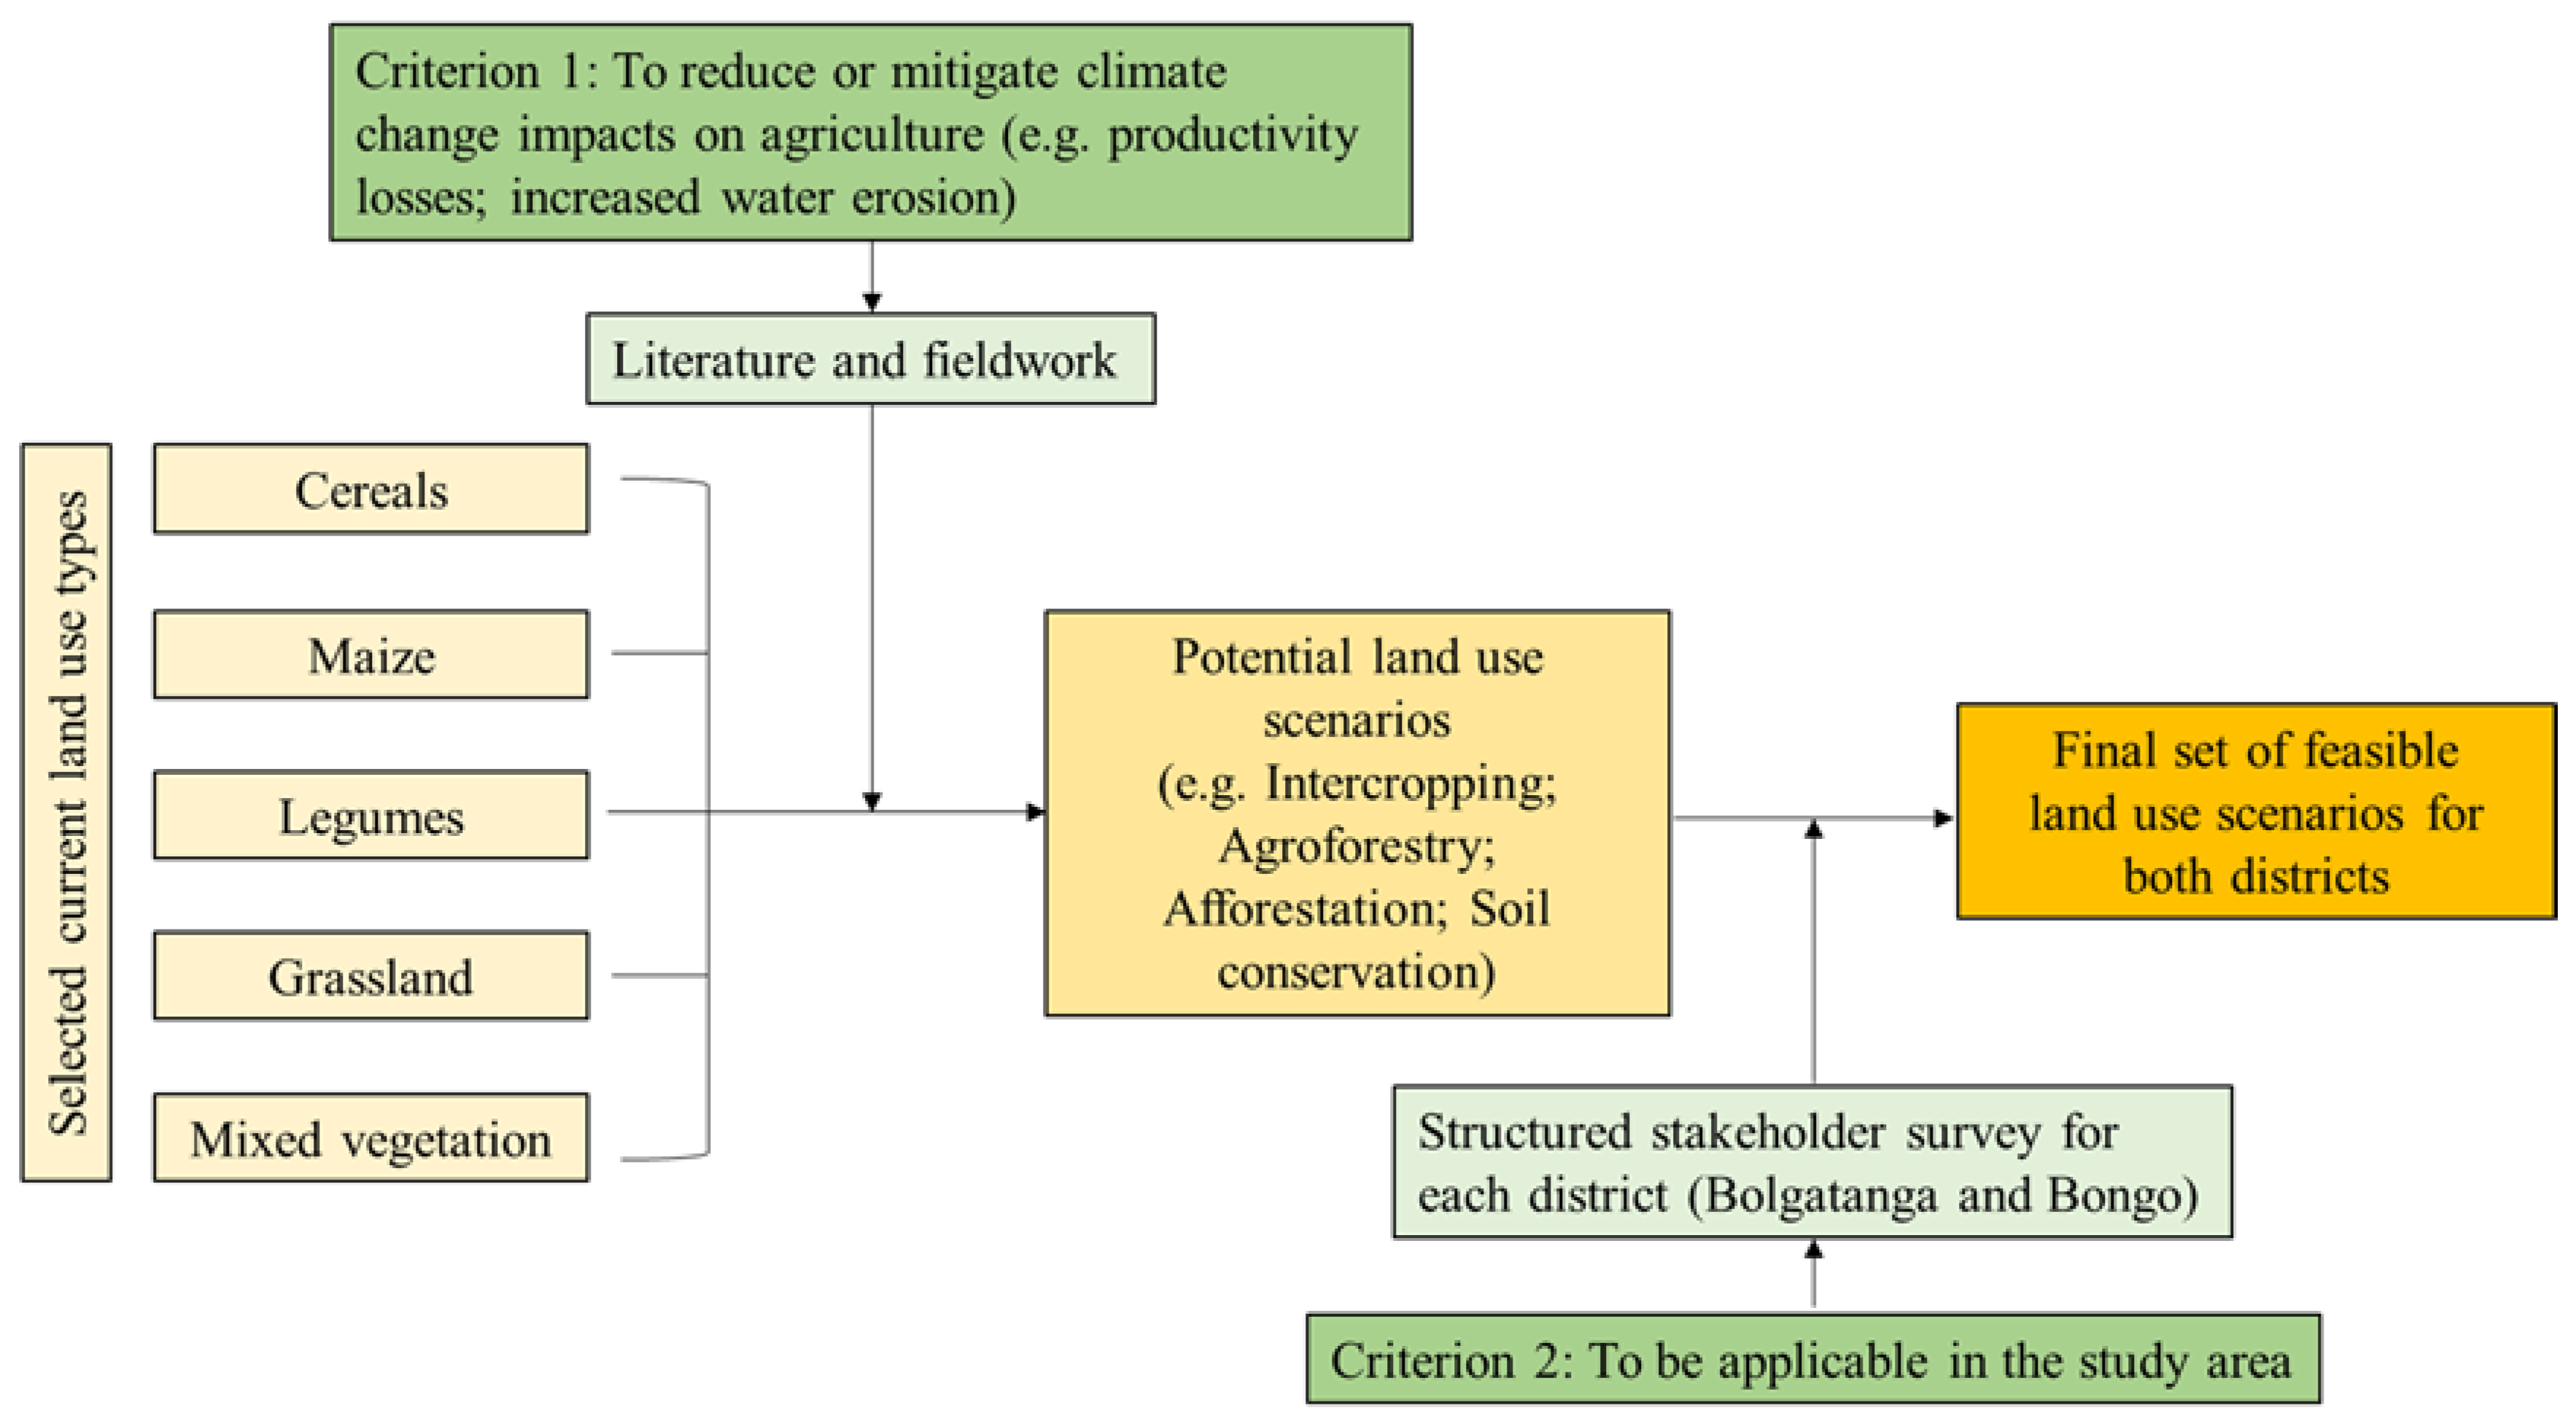
Among the current land use types shown in Table 1, the five agriculture-related land use—cereals, maize, legumes, grassland, and mixed vegetation—were used to formulate land use scenarios in consideration of their high likelihood of land use change [54]. Customary land use rights of local people and communities are mainly related to agricultural areas, while water bodies, urban areas, and tree/forest cover are largely influenced by statutory land use rights of the Town and Country Planning Department, whose likelihood of land use change is relatively low [8]. Rice, as an excluded agriculture-related land use type, has more restricted farming conditions associated with specific water demand and soil types than other staple crops, and is primarily cultivated in lowland valleys [55,56]. Besides that, the probability of converting a rice paddy is low, because rice is regarded as valuable income opportunity for households in this region [57]. Figure 2 shows the development process of locally feasible land use scenarios. At first, potential land use scenarios were generated based on literature and fieldwork in consideration of alleviating negative climate change impacts on agricultural land, such as the decline of land productivity and the increase of water erosion (Criterion 1 in Figure 2). The conversion of current crop monoculture to intercropping practices, for instance, can be one of the potential scenarios, because it diversifies land use products and improves surface stability due to a mixed rooting system [58,59]. An increase of tree cover through afforestation and agroforestry can be suggested in order to facilitate restoration of degraded land by protecting surface soil [60,61,62]. The potential land use scenarios of criterion 1 were examined by the local stakeholders, focusing on applicability (Criterion 2 in Figure 2). The stakeholders of each district were inquired regarding the feasibility of the scenarios in practice (yes or no). The result of the questionnaire was used as a basis for the determination of a final set of land use scenarios that could be feasible in the study area, whose applicability was perceived by more than 90% of the respondents.
2.4. Integration of Ecosystem Services and Land Use Scenarios
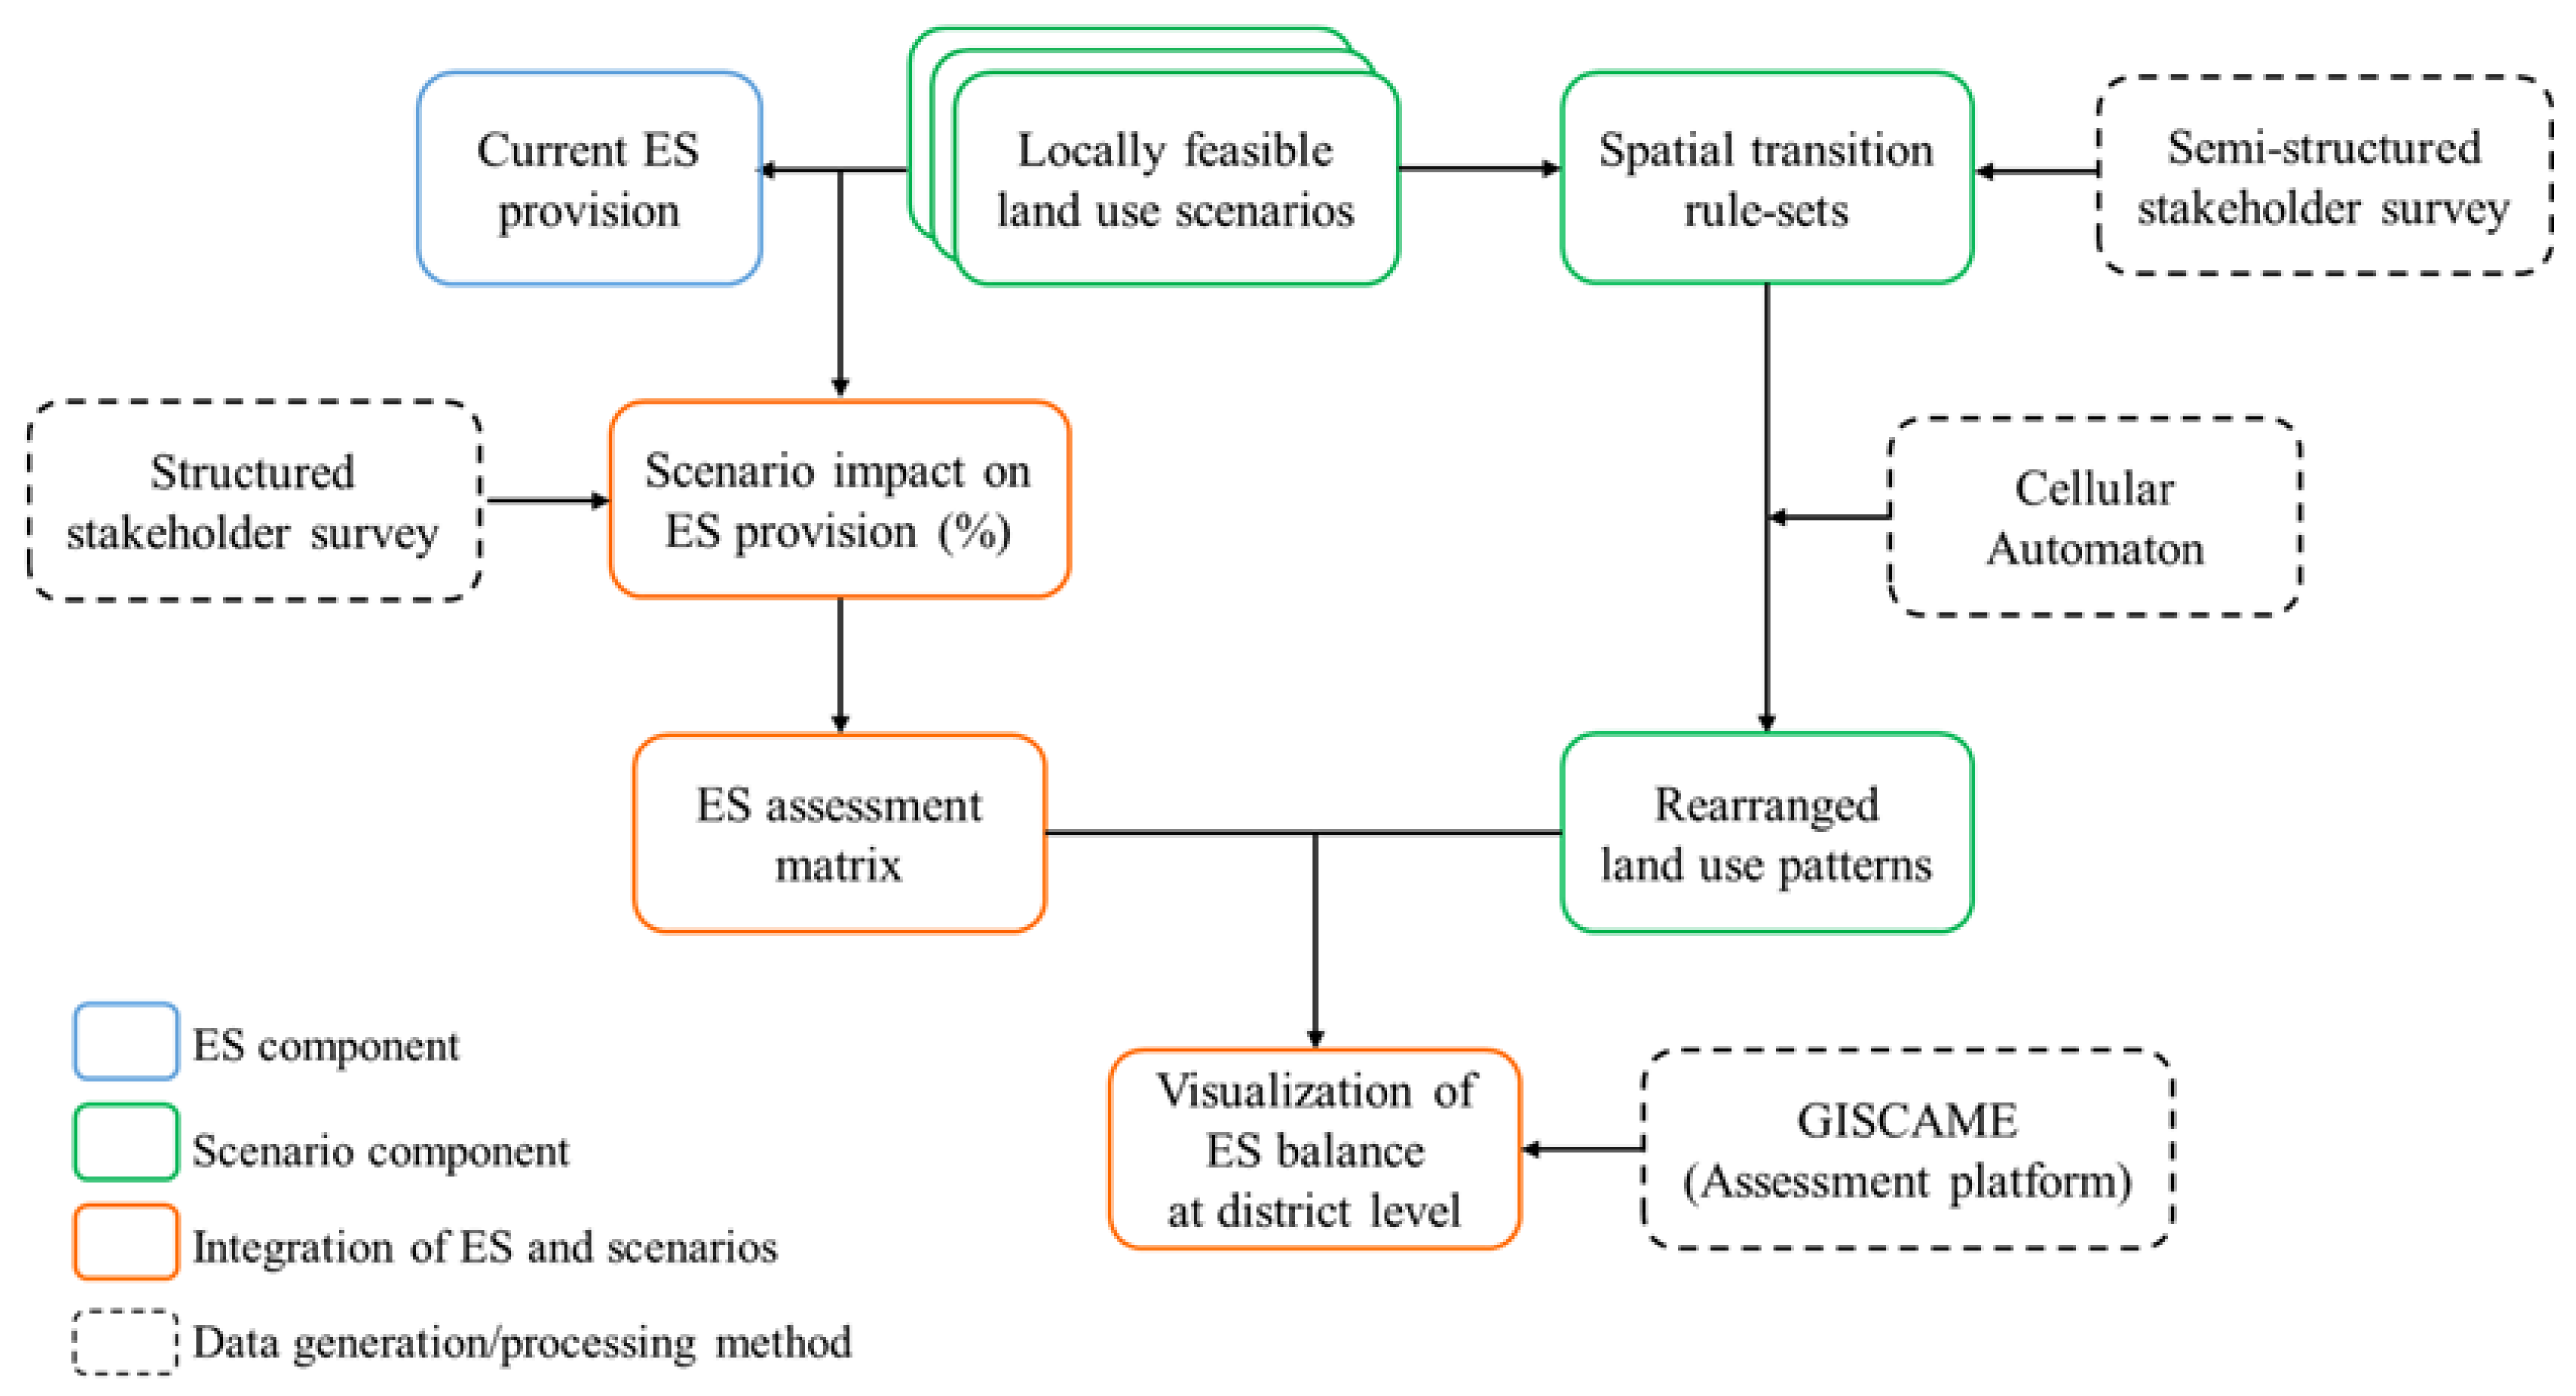
As the next step, locally relevant ES were coupled with the final set of feasible land use scenarios (Figure 3). A conversion of land use types could have positive and negative effects on ES on account of the linkage between ES and land use types [63,64]. Therefore, land use scenarios have to be assessed from the perspective of what benefits can replace those supplied by previous land use [65]. The integration of trees into crops as agroforestry, specifically, facilitates the provision of multiple benefits depending on the intercropped tree species (synergy). Mango intercropping provides fruit, firewood, poles, and fence material, and leucaena intercropping produces organic matter for soil fertility and forage. Both practices decrease surface run-off by the branched root system [62,66,67,68]. However, a negative effect of agroforestry could be the reduction of crop yield due to the competition for space, soil nutrients, and water (trade-off) [66,69].
The stakeholders were asked for each land use scenario if they expect any change in ES provision (increase/decrease/constant) in order to identify trade-offs and synergies of ES provision of the potential land use (Table S4 in Supplementary). The level of change was specifically asked as percentage change in relation to current ES provision, e.g., 20% potential increase in food provision by agroforestry. All ES values were standardized in a range from 0 (the minimum potential to provide ES) to 100 (the maximum potential to provide ES), that expressed the extent of ES contribution by the specific land use type with a comparable scale [70,71]. The standardized values were used for an assessment matrix that displays the relationship between land use types and their capacity to supply the ES. In order to simulate and assess potential impacts of the developed scenarios, a web-based modeling platform called GISCAME that consists of a cellular automaton (CA) and GIS modules was used. The CA module allows for the implementation of scenarios by reflecting locally specific characteristics. The CA is a spatially discrete dynamic gridded system where the development of an individual cell at the time t + 1 depends primarily on the cell states in a given neighborhood at the time t [72]. The CA module in GISCAME updates land use types of all cells in a map synchronously based on a rule-set for transition, thereby formulating new land use patterns according to future scenarios [73]. The rule-set was determined based on information from the stakeholders regarding transition probabilities of land use types, the neighborhood of land use types (proximity effects), and environmental attributes [74]. For instance, the stakeholders were asked regarding the likelihood (%) of land use change from maize monocropping to maize intercropping with legumes, by different conditions of neighboring land use types and environmental attributes (e.g., soil type and slope). The land use patterns that were generated by the CA were combined with the ES assessment matrix, which allows the evaluation of impacts of the simulated land use patterns on the provision of ES at district level [70,73]. The assessed results were displayed in a spider chart and an ES balance table that were derived as the mean values for the ES supplied by each land use cell of rearranged land use patterns.
3. Results
3.1. Locally Feasible Land Use Scenarios
In total, fifteen land use scenarios were identified together with the stakeholders as feasible options, which were categorized as crop intercropping, afforestation/agroforestry, and soil conservation (Table 3). Scenarios were expressed on the basis of the currently existing land use types (e.g., from cereal monocropping to cereal-dominant intercropping), since the stakeholders perceived a complete change of land use types as unlikely (e.g., from cereal monocropping to maize monocropping). “Being dominant” implied that a land use type occupies over 50% of the investigation cell unit (25 × 25 m2). This detail ensured higher applicability and facilitated a better perception of future consequences for the stakeholders. The developed scenarios were implemented with transition conditions (transition probabilities, neighboring land use types, soil types, and slope) that were determined by the perspectives of the stakeholders (Table S5 in Supplementary). Taking “a cereal-dominant intercropping scenario” as an example, the stakeholders regarded a conversion from cereal monocropping to cereal-dominant intercropping with a probability of 90% or higher. A specific condition of the conversion was provided for cereals or legumes as neighboring land use types, due to the fact that farmers tend to be more likely to conduct intercropping when the respective crop is already cultivated near the field, with sandy loamy/sandy soil as soil types, and there is a moderate or higher risk of surface runoff (10 based on [49]).
3.2. Capacity of Land Use Types to Provide Ecosystem Services
The ES capacity of current and future land use types that were influenced by different scenarios (Table S6 in Supplementary) are presented in Table 4 and Table 5. In Bolgatanga, future land use types related to crop intercropping showed higher potential to provide food than other land use types (Table 4). Particularly, legume-dominant intercropping showed the highest value for food provision. The afforestation of grassland was identified to have the highest capacity to provide fodder. The afforestation of mixed vegetation was most effective for the provision of energy and construction materials. Future land use types associated with legumes scored relatively higher for the ES provision of marketable products than other land use types. Erosion control as ES was effectively provided by afforestation and legume-related agroforestry. All future land use types indicated lower values in water provision, compared to other ES that presented at least a slight increase or consistency to current land use types.
With respect to Bongo (Table 5), future land use types associated with cereals had higher potential to provide food than other types. Cereal-dominant intercropping was especially identified to be most effective for food provision. Similar to Bolgatanga, the afforestation of grassland scored highest in fodder provision. The afforestation of mixed vegetation was identified to have the highest potential in the provision of energy and construction materials. Legume-related future land use types showed high potential in the provision of marketable products, and legume-dominant intercropping was most effective to supply the ES among the future land use types. For Bongo, erosion control as ES presented the similar provisioning patterns as for Bolgatanga, which was highly provided by afforestation and legume-related future land use types. In contrast to water provision in Bolgatanga, cereal-dominant intercropping and maize-dominant intercropping showed the possibility to improve water provision.
3.3. Impact of Land Use and Land Management Scenarios to Provide Ecosystem Services at District Level
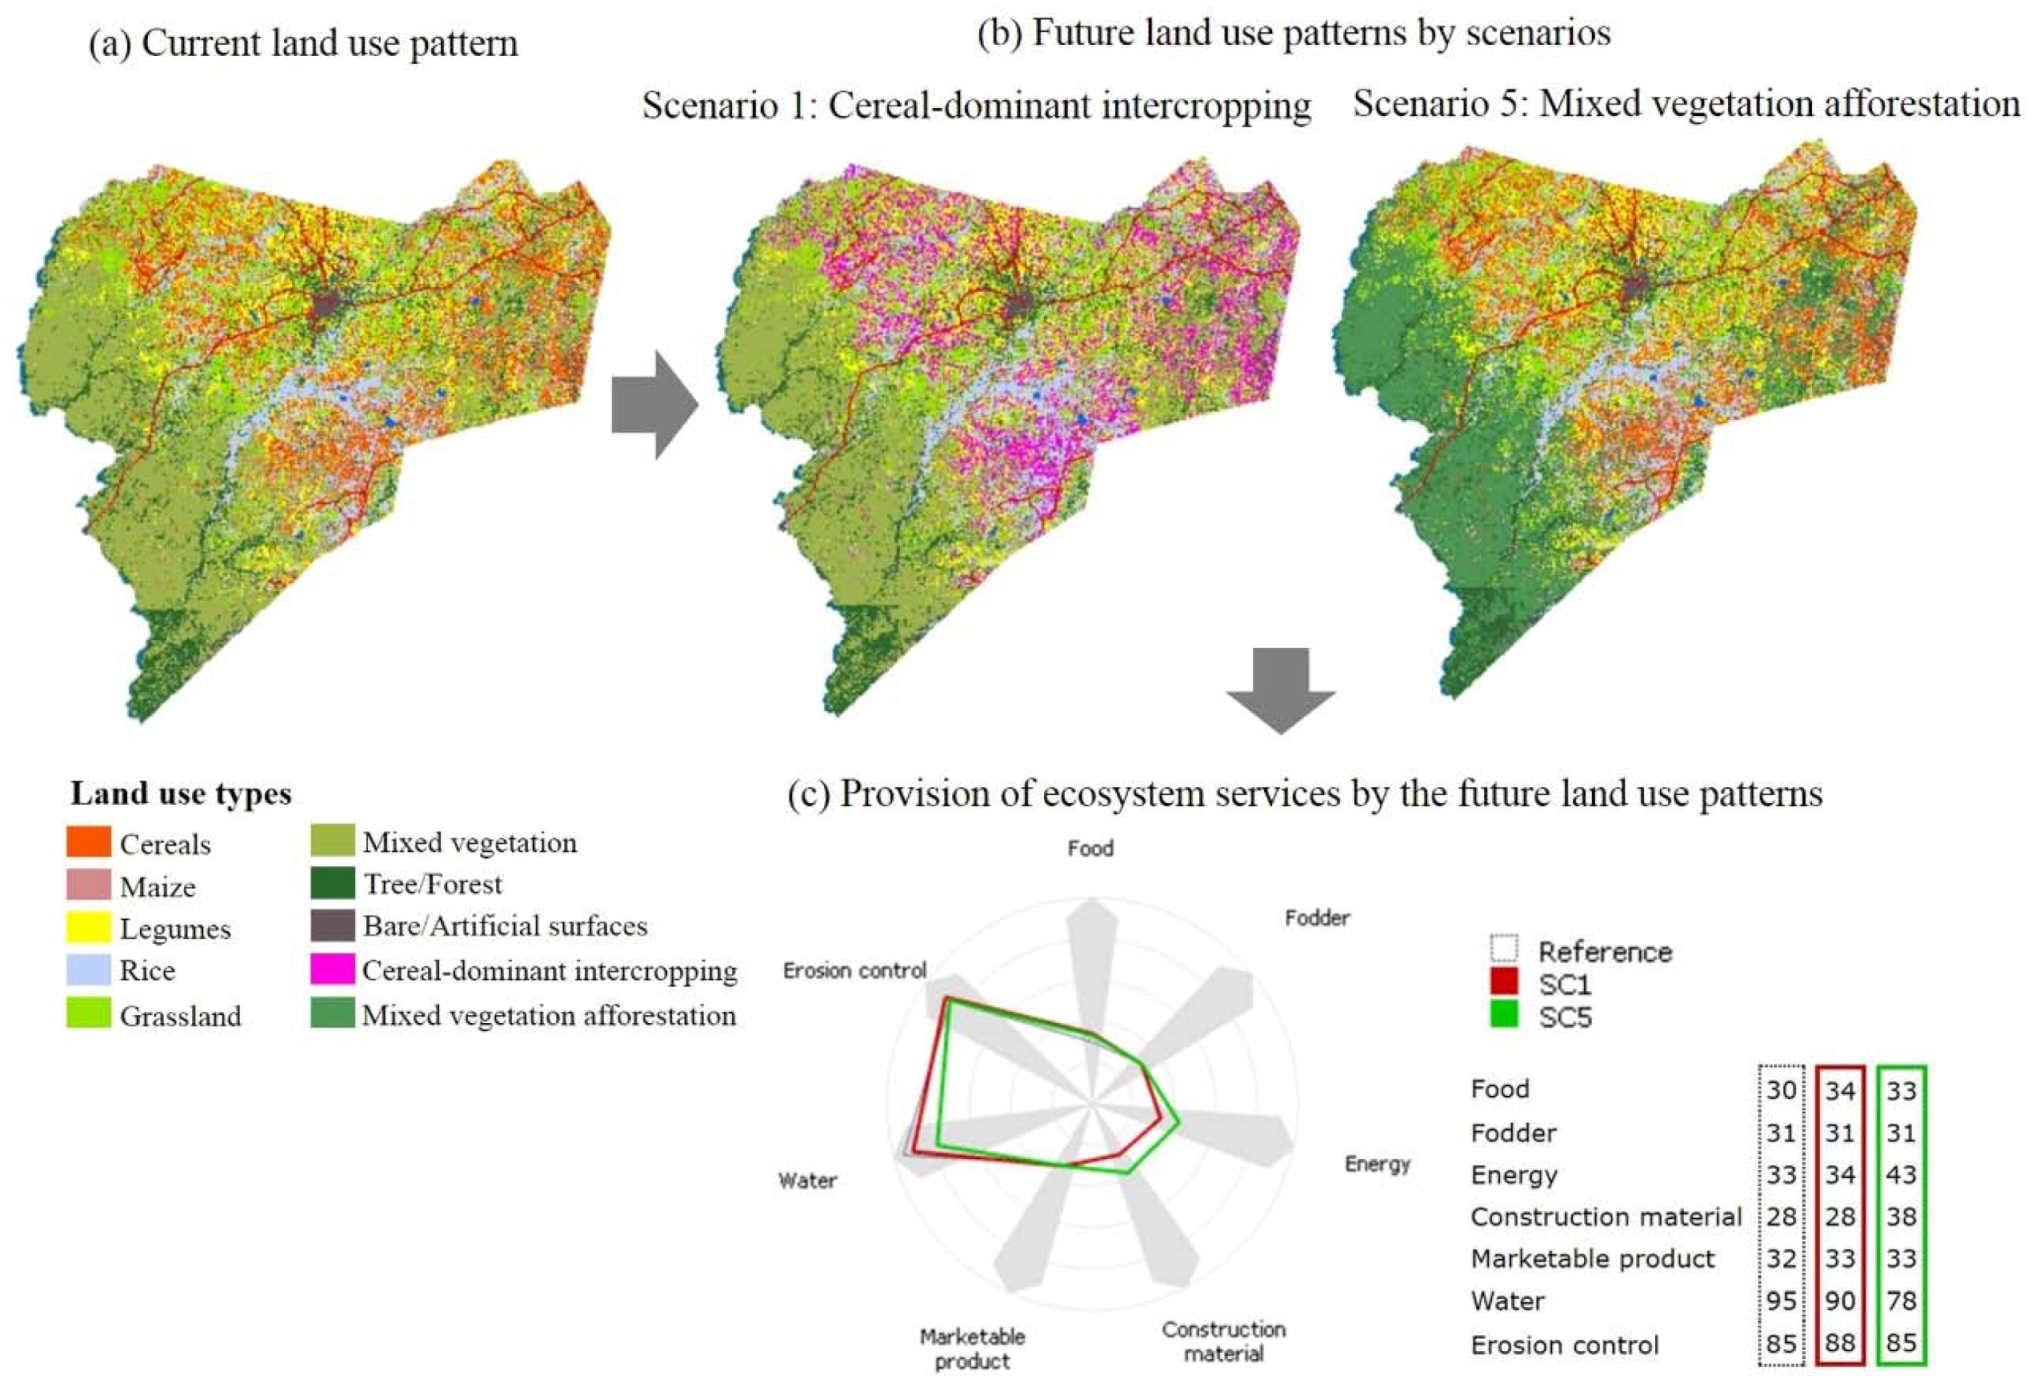
The application of the assessment matrices (Table 4 and Table 5) with the rule-sets for transition probabilities in GISCAME resulted in changes of land use patterns (examples in Figure 4b and Figure 5b), and, consequently, changes of ES provision at district level (examples in Figure 4c and Figure 5c). The GISCAME output of ES provision for all fifteen land use scenarios in Bolgatanga are shown in Table 6. All alternatives to current land use led to a positive effect on food provision, except the scenarios associated with cereal/maize intercropping with mango (Scenarios 6 and 7). Cereal-dominant intercropping (Scenario 1) and soil or stone bunds on cereals (Scenario 12) were most effective to supply food among the scenarios. None of the scenarios, on the other hand, influenced the status of fodder provision. Scenarios related to afforestation (Scenarios 4 and 5) were identified to be more effective to provide biomass for energy provision than other scenarios. However, the cereal-related scenarios (Scenarios 1, 6, 9, 12, and 14) also presented the possibility of improving energy provision. Only the scenarios related to afforestation (Scenarios 4 and 5) marked an increase in the provision of construction materials. Afforestation of mixed vegetation had more potential to provide construction materials than grassland afforestation. Regarding the provision of marketable products and erosion control, the majority of the scenarios were assumed to enhance the supply of these ES. On the contrary, all scenarios of future land use showed a negative effect on water provision for human direct use.
The GISCAME output of ES provision for all fifteen land use scenarios in Bongo are shown in Table 7. Cereal-dominant intercropping (Scenario 1) and soil or stone bunds on cereals (Scenario 12) were most effective to supply food. Contrary to the effect of scenarios on fodder provision in Bolgatanga, all future land use types reflected an increase in fodder provision. Scenarios related to the conversion of cereals (Scenarios 1, 6, 9, 12, and 14) and afforestation (Scenarios 4 and 5) had the potential to enhance energy provision. Scenarios of afforestation (Scenarios 4 and 5) were observed to improve the provision of construction materials. However, the afforestation of grassland was more effective than the afforestation of mixed vegetation in contrast to Bolgatanga. All scenarios improved the provision of marketable products, except the mixed vegetation afforestation scenario (scenario 5). All scenarios except cereal-dominant intercropping and maize-dominant intercropping (Scenarios 1 and 2) led to a decrease in water provision. The most negative effect on water provision was caused by grassland afforestation (Scenario 4). Scenarios associated with cereals (Scenarios 1, 6, 9, 12, and 14) were identified to be effective to positively influence erosion control. The establishment of soil or stone bunds on cereal fields was especially shown as the best scenario for erosion control.
4. Discussion
4.1. Local Perception on the Land Use and Land Management Scenarios
The consideration of context- and site-specific knowledge from a particular group based on their actual experiences and observations can provide a differentiated view compared to conventional approaches in natural sciences [75]. The integration of local knowledge in scenario development and land use assessments that was presented in this study is a new attempt in the West African context. Prior impact assessments of future scenarios were rather scientist-oriented (e.g., [76,77,78,79,80]). Ideally, most relevant stakeholders in the investigated area should be identified, their roles to contribute to the assessment need to be clarified, and they should be involved from the early stage of the process in a participatory assessment [12]. Even though the number of the stakeholders who participated in this study seems small (26 in total), they represent interests of farmers as well as local government, since they serve as a bridge between the two actors. They also showed a strong relationship with other actors in the agricultural sector as a cooperator and an advisor, thereby influencing agricultural land use activities at district level. The stakeholders were involved from the beginning of the ES assessment by identifying locally relevant ES and developing future land use scenarios.
The results of this study help to understand how the stakeholders perceive potential impacts of future options, i.e., why a certain practice is expected to be more effective or not to improve the current status of ES in this region. In accordance with the capacity of ES provision by land use types (Table 4 and Table 5), local perception focused more on positive aspects of intercropping between staple crops in terms of diversity of land use products, efficiency of land use, and stability of root systems as proven in existing studies (e.g., [81,82]). There could also be negative aspects related to interference in crop growth, due to the competition between component crops for nutrients, moisture, and sunlight in intercropping (e.g., [83,84]), which might not have been considered by the stakeholders. Impacts of incorporating mango trees into cereals/maize were observed as being different between the districts. The stakeholders in Bolgatanga perceived the presence of mango trees as hindrance to the growth of cereals/maize due to shade and nutrient competition, thereby reducing food provision. The stakeholders in Bongo, on the other hand, valued mango trees as a source of food for household, which led to an increase in food provision by the mango agroforestry scenario. This fact reflects the importance in considering regional differences. Intercropping with leucaena was perceived to bring potentially positive synergies between multiple ES by using the decomposed leaves for improving soil fertility, and consequently, to enhance land productivity in both districts. The formation of bunds or windbreaks as scenarios, which are specifically aimed to prevent erosion, did not enhance erosion control significantly, compared to other scenarios. Considering that the erosion problem is mainly caused by the poor vegetative or degraded land cover in this area [85], the stakeholders regarded the expansion of cover crops and scenarios with vegetation on bare soil as effective measures against erosion control.
There is a noticeable trend in local perception regarding the impact of the land use alternatives on water provision, which showed a decrease in most of the scenarios. As water provision in this study indicated the potential amount of surface water flowing to water bodies, which is utilized for direct human use, the level of water requirement by land use types was considered as a critical factor to determine water availability for household consumption. Most of the intercropping scenarios were understood to increase water demand of land surface because of the diverse water requirements by different plant species. The expansion of tree cover by afforestation and agroforestry was considered to increase water stress on agricultural area due to the expected high water demand of trees. Furthermore, the formation of bunds was regarded to enhance water absorption efficiency of the crops, which reduced surface water availability for human use. These scenarios, thus, were identified to negatively influence water provision for households. A number of previous studies are in line with this local perception: the total water consumption by intercropping was higher than by monocropping [86,87], and densely vegetated cover consumed more water than agricultural areas, which resulted in a loss of stream flow [88,89,90].
4.2. District Capacity of Ecosystem Services Provision Characterized by Land Use Scenarios
Previously, Leh et al. (2013) [26] presented how to map the variation of regulating services depending on the spatial changes of existing land use types in West Africa. Our study goes beyond the mapping of ES by identifying the practicability and likelihood of land use scenarios. We presented how land use scenarios can influence spatial distribution of current land use patterns with introducing new land use types, and how those altered land use patterns can generate different provisioning and regulating services relevant to the region. First, a change in distribution of the land use types, besides local perception, accounts for similarity and dissimilarity of the capacity to provide ES between the two districts (Table 6 and Table 7). Cereals were most largely cultivated among staple crops in both districts (Table 1). Consequently, the changes in cereals were expected to generate a great effect on provisioning ES, as seen in higher levels of improved food provision by cereal-related scenarios (Scenarios 1, 6, 9, 12, and 14) than by other crop scenarios. Maize-related scenarios (Scenarios 2, 7, 10, 13, and 15), on the contrary, produced relatively marginal effects on overall ES provision, due to the fact that the share of maize is low in both districts. Grassland and mixed vegetation was the main land use type among the afforestation scenarios, but its share differed between the districts and caused a discrepancy in the provision of construction material. The area of mixed vegetation is twice as large as grassland in Bolgatanga, whereas Bongo has more grassland than mixed vegetation. It explains different impacts of the afforestation scenarios due to distributional effects of grassland and mixed vegetation, although local perception regarding the impacts of the scenarios on the provision of construction materials is similar between these two districts. In this study, land use changes were determined by the surrounding environment, i.e., there were impacted plots and non-impacted plots within a same land use type, depending on their location. These results emphasize that regional planning should consider the influence of spatial configuration of land use types in a region.
One of the crucial roles of scenarios in environmental assessment is to link science with land use policy by illuminating consequences of land use changes, and thereby suggest future land use strategies [17]. The spatially explicit visualization of future effects is especially helpful to communicate between different actors, and to convince them of the necessity for appropriate land use planning and management [91]. The stakeholders can easily understand the impacts on ES provision, such as trade-offs and synergies, that could be generated by a specific future choice, as shown in this study (Figure 4 and Figure 5). The stakeholders were able to identify the best land use scenarios that would be most suitable for the region with regard to increasing the provision of multiple ES or minimizing trade-offs based on the results. In Bolgatanga, for instance, the scenarios of cereal-dominant intercropping, cereal intercropping with leucaena, stone or soil bunds on cereals, and windbreak on cereals, can be considered as the best scenarios for synergies between the most diverse ES. These scenarios increased the provision of food, energy, and marketable products, and erosion control compared to current land use. As best scenarios that can reduce trade-offs between ES, maize-dominant intercropping and windbreak on maize can be suggested, which had the lowest impact on water provision. In terms of best scenarios that deliver synergies between multiple ES in Bongo, cereal-dominant intercropping, soil, or stone bunds on cereals, and windbreak on cereals can be considered, which displayed an increase in six different ES. With respect to the best scenarios related to the lowest trade-off effect between ES, cereal-dominant intercropping and maize-dominant intercropping can be regarded as most suitable, because they did not negatively influence any ES. The stakeholders can also set priorities to address different land use concerns, and seek for management and planning options to improve the condition. For instance, the formation of bunds on cereals can be suggested for Bolgatanga if the stakeholders focus on improved food provision and marketable products. When the stakeholders in Bongo prefer an increase in overall ES provision in future, cereal-dominant intercropping can be recommended as the most effective option to enhance the provision of food, marketable products, and water.
4.3. Limitations of a Stakeholder-Based Modeling Approach
Although this stakeholder-based approach allows the identification of relationships between the provision of locally important ES and future land use alternatives, limitations exist related to intangible ES. Regarding atmospheric regulation as ES, for instance, it was difficult for the stakeholders to appreciate dissimilarities among the impacts of different land use types and scenarios on the ES. Therefore, atmospheric regulation was not included in this study, regardless of its significance in the African context (e.g., [14,26,92]). Local stakeholders prefer future land use options as modifications based on ongoing farm practices, which is, as a strategy to avoid failure that could be potentially caused by a totally new technique or measure [93]. New farming methods that are proven to enhance ES provision, but that are not familiar to local stakeholders, accordingly, are likely to be disregarded in stakeholder-based scenario development [94]. There are also limitations in using such a scenario modeling approach. Firstly, complex dynamics of interaction between land use decisions and ES were inevitably simplified in the process of quantification of local knowledge, due to the scarcity of field data and the lack of modeling capacity to deal with all feedback loops. In addition, unlike the immediate response in the modeling platform, a time lag to observe ecological and socio-economic consequences of land use decisions in reality needs to be considered [95].
Some of the limitations need to be resolved and improved as a further step. Impacts on intangible but important ES can be incorporated by finding an equivalent and understandable local definition or a benefit transfer method. The modeled results of ES trade-offs and synergies become more transferrable to policies when they can be quantified in monetary terms or percentages [96,97]. Further than focusing on the angle of local stakeholders, the reflection of perceptions by scientists or experts and the integration of field experiments could broaden the context and could improve the assessment of ES provision of different land use types and land use scenarios.
5. Conclusions
This study presented an assessment of potential impacts of land use scenarios on the provision of ES using local knowledge in northern Ghana. The involvement of stakeholders allowed for the identification of locally feasible land use options which are expected to mitigate climate change impacts on agriculture. The role of stakeholders was also important in ES assessment in terms of understanding the perspectives of an ES beneficiary on the capacity of land use system as an ES supplier. The integration of local knowledge, and the ES concept in a modeling process facilitated the spatially explicit simulation of local perceptions on the influence of different land use decisions related to ES provision. Identified trade-offs or synergies between locally important ES as potential scenario impacts can contribute to the suggestion of future land use strategies. Challenges in a stakeholder-oriented approach are related to ES where links between provision potential and land use types are difficult to be identified by stakeholders. In addition, simplification in a modeling approach is unavoidable, due to the lack of data and the insufficient capacity of the platform to address all interactions between humans and ecosystems. However, this context-based approach helps to give an insight into how to design viable land use alternatives and strategies to improve the current ES status in a local context.
Supplementary Materials
The following are available online at https://0-www-mdpi-com.brum.beds.ac.uk/2073-445X/7/2/59/s1, Table S1: Template of the stakeholder survey to select ecosystem services based on the importance related to agricultural land use, Table S2: Template of the stakeholder survey to identify the perceptibility of the differences on the provision of ecosystem services between land use types, Table S3: Template of the stakeholder survey for data generation, Table S4: Part of a stakeholder survey template for the identification of scenario impacts, Table S5: Application conditions of land use scenarios, Table S6: Impact of land use scenarios on the ecosystem services provision based on a stakeholder survey. Each percentage implies the extent of potential increase or decrease from the supply capacity of the current land use types when a scenario is applied.
Author Contributions
H.K. conceived and designed the study. H.K. also collected data through fieldwork and stakeholder surveys, and analyzed the data. H.K. and J.K. conducted a literature review and wrote the paper. C.F. developed a modeling platform for analysis and reviewed the paper.
Funding
This study was undertaken under the auspices of the West African Science Service Center on Climate Change and Adapted Land Use (WASCAL) project, funded by the German Federal Ministry of Education and Research (BMBF) grant numbers [ZEF 0100218] and [KIT 5260.0109.3288].
Acknowledgments
The authors gratefully acknowledge the agricultural extension officers in Bolgatanga and Bongo districts who contributed considerably to the results as stakeholders, and to directors of the districts who helped to organize meetings with the officers.
Conflicts of Interest
The authors declare no conflict of interest.
References
- Ingram, K.T.; Roncoli, M.C.; Kirshen, P.H. Opportunities and constraints for farmers of west Africa to use seasonal precipitation forecasts with Burkina Faso as a case study Agricultural Systems. Agric. Syst. 2002, 74, 331–349. [Google Scholar] [CrossRef]
- Morton, J. The impact of climate change on smallholder and subsistence agriculture. Proc. Natl. Acad. Sci. USA 2007, 104, 19680–19685. [Google Scholar] [CrossRef] [PubMed]
- Cooper, P.J.M.; Dimes, J.; Rao, K.P.C.; Shapiro, B.; Shiferawa, B.; Twomlow, S. Coping better with current climatic variability in the rain-fed farming systems of sub-Saharan Africa: An essential first step in adapting to future climate change? Agric. Ecosyst. Environ. 2008, 126, 24–35. [Google Scholar] [CrossRef] [Green Version]
- Roudier, P.; Sultan, B.; Quirion, P.; Berg, A. The impact of future climate change on West African crop yields: What does the recent literature say? Glob. Environ. Chang. 2011, 21, 1073–1083. [Google Scholar] [CrossRef]
- Gesellschaft für Internationale Zusammenarbeit (GIZ). Land Use Planning—Concept, Tools and Applications. 2012, pp. 1–267. Available online: http://www.giz.de/expertise/downloads/Fachexpertise/giz2012-en-land-use-planning-manual.pdf (accessed on 16 September 2016).
- Ghana Environmental Protection Council. Ghana Environmental Action Plan. 1988, Volume 1, pp. 1–106. Available online: http://documents.worldbank.org/curated/en/278211468751766859/pdf/multi-page.pdf (accessed on 9 September 2016).
- Wardell, D.A.; Lund, C. Governing access to forests in northern Ghana: Micro-politics and the rents of non-enforcement. World Dev. 2006, 34, 1887–1906. [Google Scholar] [CrossRef]
- Ubink, J.M. In the Land of the Chiefs: Customary Law, Land Conflicts, and the Role of the State in Peri-Urban Ghana. Ph.D. Thesis, Leiden University, Leiden, The Netherlands, 2008; pp. 1–255. [Google Scholar]
- Yeboah, E.; Obeng-Odoom, F. ‘We are not the only ones to blame’: District Assemblies’ perspectives on the state of planning in Ghana. Commonw. J. Local Gov. 2010, 7, 78–98. [Google Scholar] [CrossRef]
- Kasanga, R.K.; Kotey, N.A. Land Management in Ghana: Building on Tradition and Modernity; International Institute for Environment and Development: London, UK, 2001; pp. 1–42. [Google Scholar]
- Lambin, E.F.; Geist, H.J.; Lepers, E. Dynamics of land use and land cover change in tropical regions. Annu. Rev. Environ. Resour. 2003, 28, 205–241. [Google Scholar] [CrossRef]
- Ridder, D.; Pahl-Wostl, C. Participatory integrated assessment in local level planning. Reg. Environ. Chang. 2005, 5, 188–196. [Google Scholar] [CrossRef]
- Soliva, R.; Hunziker, M. Beyond the visual dimension: Using ideal type narratives to analyse people’s assessments of landscape scenarios. Land Use Policy 2009, 26, 284–294. [Google Scholar] [CrossRef]
- Egoh, B.N.; Reyers, B.; Rouget, M.; Richardson, D.M. Identifying priority areas for ecosystem service management in South African grasslands. J. Environ. Manag. 2011, 92, 1642–1650. [Google Scholar] [CrossRef] [PubMed]
- Goldstein, J.G.; Caldarone, G.; Kaeo Duarte, T.; Ennaanay, D.; Hannahs, N.; Mendoza, G.; Polasky, S.; Wolny, S.; Daily, G.C. Integrating ecosystem service tradeoffs into land-use decisions. Proc. Natl. Acad. Sci. USA 2012, 109, 7565–7570. [Google Scholar] [CrossRef] [PubMed]
- Gómez-Baggethun, E.; Barton, D. Classifying and valuing ecosystem services for urban planning. Ecol. Econ. 2013, 86, 235–245. [Google Scholar] [CrossRef]
- Alcamo, J.; Ribeiro, T. Scenarios as Tools for International Environmental Assessments (No. 5). 2001, pp. 1–31. Available online: https://www.eea.europa.eu/publications/environmental_issue_report_2001_24/file (accessed on 02 April 2016).
- Kok, K.; Biggs, R.O.; Zurek, M. Methods for developing multiscale participatory scenarios: Insights from southern Africa and Europe. Ecol. Soc. 2007, 13, 8. [Google Scholar] [CrossRef]
- Reed, M.S.; Dougill, A.J.; Taylor, M.J. Integrating local and scientific knowledge for adaptation to land degradation: Kalahari rangeland management options. Land Degrad. Dev. 2007, 18, 249–268. [Google Scholar] [CrossRef]
- Rounsevell, M.D.A.; Dawson, T.P.; Harrison, P.A. A conceptual framework to assess the effects of environmental change on ecosystem services. Biodivers. Conserv. 2010, 19, 2823–2842. [Google Scholar] [CrossRef]
- Boumans, R.; Roman, J.; Altman, I.; Kaufman, L. The multiscale integrated model of ecosystem services (MIMES): Simulating the interactions of coupled human and natural systems. Ecosyst. Serv. 2015, 12, 30–41. [Google Scholar] [CrossRef]
- Seppelt, R.; Dormann, C.F.; Eppink, F.V.; Lautenbach, S.; Schmidt, S. A quantitative review of ecosystem service studies: Approaches, shortcomings and the road ahead. J. Appl. Ecol. 2011, 48, 630–636. [Google Scholar] [CrossRef]
- Jones, P.G.; Thornton, P.K. The potential impacts of climate change on maize production in Africa and Latin America in 2055. Glob. Environ. Chang. 2003, 13, 51–59. [Google Scholar] [CrossRef]
- Laux, P.; Jäckel, G.; Tingem, R.M.; Kunstmann, H. Impact of climate change on agricultural productivity under rainfed conditions in Cameroon—A method to improve attainable crop yields by planting date adaptations. Agric. For. Meteorol. 2010, 150, 1258–1271. [Google Scholar] [CrossRef]
- Marks, E.; Aflakpui, G.K.S.; Nkem, J.; Poch, R.M.; Khouma, M.; Kokou, K.; Sagoe, R.; Sebastià, M.-T. Conservation of soil organic carbon, biodiversity and the provision of other ecosystem services along climatic gradients in West Africa. Biogeosciences 2009, 6, 1825–1838. [Google Scholar] [CrossRef]
- Leh, M.D.K.; Matlock, M.D.; Cummings, E.C.; Nalley, L.L. Quantifying and mapping multiple ecosystem services change in West Africa. Agric. Ecosyst. Environ. 2013, 165, 6–18. [Google Scholar] [CrossRef]
- Ghana Statistical Service. District Analytical Report: Bolgatanga Municipality and Bongo. 2010. Available online: http://www.statsghana.gov.gh/docfiles/2010_District_Report/Upper%20East/Bolga.pdf . http://www.statsghana.gov.gh/docfiles/2010_District_Report/Upper%20East/Bongo.pdf (accessed on 02 December 2016).
- Agyemang, I.; McDonald, A.; Carver, S. Application of the DPSIR framework to environmental degradation assessment in northern Ghana. Nat. Resour. Forum 2007, 31, 212–225. [Google Scholar] [CrossRef]
- Mdemu, M. Water Productivity in Medium and Small Reservoirs in the Upper East Region (UER) of Ghana. Ph.D. Thesis, University of Bonn, Bonn, Germany, 2008; pp. 1–143. [Google Scholar]
- Ministry of Food and Agriculture. Agricultural Development Plan: Bongo District Agricultural Development Unit Report; Ministry of Food and Agriculture: Bongo, Ghana, 2007.
- Schindler, J. A Multi-Agent System for Simulating Land-Use and Land-Cover Change in the Atankwidi Catchment of Upper East Ghana. Ph.D. Thesis, University of Bonn, Bonn, Germany, 2009; pp. 1–292. [Google Scholar]
- Fiankor, D.K.; Akussah, H. Information use and policy decision making by district assembly members in Ghana. Inf. Dev. 2012, 28, 32–42. [Google Scholar] [CrossRef]
- Forkuor, G. Agricultural Land Use Mapping in West Africa Using Multi-Sensor Satellite Imagery. Ph.D. Thesis, University of Würzburg, Würzburg, Germany, 2014; pp. 1–175. [Google Scholar]
- Callo-Concha, D.; Gaiser, T.; Ewert, F. Farming and Cropping Systems in the West African Sudanian Savanna, WASCAL Research Area: Northern Ghana, Southwest Burkina Faso and Northern Benin; ZEF Working Paper Series 100; Center for Development Research, University of Bonn: Bonn, Germany, 2012; pp. 1–40. [Google Scholar]
- Hjelm, L.; Dasori, W. Comprehensive Food Security and Vulnerability Analysis—Focus on Northern Ghana; VAM Food Security Analysis; United Nations World Food Programme Headquarters: Rome, Italy, 2012; pp. 1–144. Available online: http://documents.wfp.org/stellent/groups/public/documents/ena/wfp257009.pdf (accessed on 17 March 2018).
- Dietz, T.; Millar, D. Coping with Climate Change in Dryland Ghana: The Case of Bolgatanga; Netherlands Research Programme on Climate Change Impact of Climate Change in Drylands (ICCD); Impact of Climate Change in Drylands (ICCD): Amsterdam, The Netherlands, 1999; pp. 1–89. [Google Scholar]
- Ampadu, B.; Akurugu, B.A.; Zango, M.S.; Abanyie, S.K.; Ampofo, S. Assessing the impact of a dam on the livelihood of surrounding communities: A case study of Vea dam in the Upper East Region of Ghana. J. Environ. Earth Sci. 2015, 5, 20–26. [Google Scholar]
- Futaki, K. Danube FloodRisk Project: Stakeholder Selection Strategy. International Commission for the Protection of the Danube River, 2010; pp. 1–23. Available online: https://www.danube-floodrisk.eu/download/stake/SH_SelectionStrategy_V1_0.pdf (accessed on 16 November 2016).
- Lamarque, P.; Tappeiner, U.; Turner, C.; Steinbacher, M.; Bardgett, R.D.; Szukics, U.; Schermer, M.; Lavorel, S. Stakeholder perceptions of grassland ecosystem services in relation to knowledge on soil fertility and biodiversity. Reg. Environ. Chang. 2011, 11, 791–804. [Google Scholar] [CrossRef]
- Prell, C.; Hubacek, K.; Reed, M. Stakeholder analysis and social network analysis in natural resource management. Soc. Nat. Resour. 2009, 22, 501–518. [Google Scholar] [CrossRef]
- Hein, L.; van Koppen, K.; de Groot, R.; van Ierland, E.C. Spatial scales, stakeholders and the valuation of ecosystem services. Ecol. Econ. 2006, 57, 209–228. [Google Scholar] [CrossRef]
- Gyasi, A.E.; Kranjact-Berisavljevic, G.; Oduro, W. Sustainable Land Management for Mitigating Land Degradation: Lessons from the SLaM PROJECT Experience in Ghana; United Nations University: Tokyo, Japan, 2011; pp. 1–202. [Google Scholar]
- Emmanuel, D.; Owusu-Sekyere, E.; Owusu, V.; Jordaan, H. Impact of agricultural extension service on adoption of chemical fertilizer: Implications for rice productivity and development in Ghana. NJAS Wagening. J. Life Sci. 2016, 79, 41–49. [Google Scholar] [CrossRef]
- Koo, H.; Fürst, C. Using local knowledge on ecosystem services for land use impact assessment in Sub-Saharan Africa. Ecol. Indic. 2017. under review. [Google Scholar]
- Haines-Young, R.; Potschin, M. Common International Classification of Ecosystem Services (CICES): 2011 Update; European Environmental Agency: Nottingham, UK, 2011; pp. 1–14. [Google Scholar]
- Raudsepp-Hearne, C.; Peterson, G.D.; Bennett, E.M. Ecosystem service bundles for analyzing tradeoffs in diverse landscapes. Proc. Natl. Acad. Sci. USA 2010, 107, 5242–5247. [Google Scholar] [CrossRef] [PubMed]
- Davies, J.; Poulsen, L.; Schulte-Herbrüggen, B.; Mackinnon, K.; Crawhall, N.; Henwood, W.D.; Dudley, N.; Smith, J.; Gudka, M. Conserving Dryland Biodiversity. International Union for Conservation of Nature and Natural Resources (IUCN): Kenya, 2012; pp. 1–84. Available online: https://www.iucn.org/sites/dev/files/import/downloads/conserving_dryland_biodiversity.pdf (accessed on 2 April 2016).
- Renard, K.G.; Foster, G.R.; Weesies, G.A.; Porter, J.P. Rusle: Revised universal soil loss equation. J. Soil Water Conserv. 1991, 46, 30–33. [Google Scholar]
- Millward, A.A.; Mersey, J.E. Adapting the RUSLE to model soil erosion potential in a mountainous tropical watershed. Catena 1999, 38, 109–129. [Google Scholar] [CrossRef]
- Zhang, L.; Dawes, W.R.; Walker, G.R. Response of mean annual evapotranspiration to vegetation changes at catchment scale. Water Resour. Res. 2001, 37, 701–708. [Google Scholar] [CrossRef]
- Angima, S.D.; Stott, D.E.; O’Neill, M.K.; Ong, C.K.; Weesies, G.A. Soil erosion prediction using RUSLE for central Kenyan highland conditions. Agric. Ecosyst. Environ. 2003, 97, 295–308. [Google Scholar] [CrossRef]
- Carpenter, S.R.; Bennett, E.M.; Peterson, G.D. Scenarios for ecosystem services: An overview. Ecol. Soc. 2006, 11, 29. [Google Scholar] [CrossRef]
- Rosenberg, M.; Syrbe, R.U.; Vowinckel, J.; Walz, U. Scenario methodology for modelling of future landscape developments as basis for assessing ecosystem services. Landsc. Online 2014, 33, 1–20. [Google Scholar] [CrossRef]
- Kleemann, J.; Baysal, G.; Bulley, H.N.; Fürst, C. Assessing driving forces of land use and land cover change by a mixed-method approach in north-eastern Ghana, West Africa. J. Environ. Manag. 2017, 196, 411–442. [Google Scholar] [CrossRef] [PubMed]
- Peter, G.; Runge-Metzger, A. Monocropping, intercropping or crop rotation? An economic case study from the West African Guinea savannah with special reference to risk. Agric. Syst. 1994, 45, 123–143. [Google Scholar] [CrossRef]
- Yiridoe, E.K.; Langyintuo, A.S.; Dogbe, W. Economics of the impact of alternative rice cropping systems on subsistence farming: Whole-farm analysis in northern Ghana. Agric. Syst. 2006, 91, 102–121. [Google Scholar] [CrossRef]
- Akramov, K.; Malek, M. Analyzing Profitability of Maize, Rice, and Soybean Production in Ghana: Results of PAM and DEA Analysis; Ghana Strategy Support Program (GSSP) Working Paper #28; International Food Policy Research Institute (IFPRI): Washington, DC, USA, 2012; pp. 1–28. [Google Scholar]
- Sullivan, P. Intercropping Principles and Production Practices: Agronomy Systems Guide. ATTRA Sustainable Agriculture Program. 2003, pp. 1–12. Available online: http://pctanzania.org/repository/Environment/-%20Agriculture/Intercropping_A.pdf (accessed on 2 April 2016).
- Malézieux, E.; Crozat, Y.; Dupraz, C.; Laurans, M.; Makowski, D.; Ozier-Lafontaine, H.; Rapidel, D.; de Tourdonnet, S.; Valantin-Morison, M. Mixing plant species in cropping systems: Concepts, tools and models: A review. Agron. Sustain. Dev. 2009, 29, 43–62. [Google Scholar] [CrossRef]
- Jama, B.; Elias, E.; Mogotsi, K. Role of agroforestry in improving food security and natural resource management in the drylands: A regional overview. J. Drylands 2006, 1, 206–211. [Google Scholar]
- Hu, Y.L.; Zeng, D.H.; Fan, Z.P.; Chen, G.S.; Zhao, Q.; Pepper, D. Changes in ecosystem carbon stocks following grassland afforestation of semiarid sandy soil in the southeastern Keerqin Sandy Lands, China. J. Arid Environ. 2008, 72, 2193–2200. [Google Scholar] [CrossRef]
- Jose, S. Agroforestry for ecosystem services and environmental benefits: An overview. Agrofor. Syst. 2009, 76, 1–10. [Google Scholar] [CrossRef]
- Burkhard, B.; Kroll, F.; Müller, F.; Windhorst, W. Landscapes’ capacities to provide ecosystem services—A concept for land-cover based assessments. Landsc. Online 2009, 15, 1–22. [Google Scholar] [CrossRef]
- Haines-Young, R.; Potschin, M.; Kienast, F. Indicators of ecosystem service potential at European scales: Mapping marginal changes and trade-offs. Ecol. Indic. 2012, 21, 39–53. [Google Scholar] [CrossRef]
- Sanon, S.; Hein, T.; Douven, W.; Winkler, P. Quantifying ecosystem service trade-offs: The case of an urban floodplain in Vienna, Austria. J. Environ. Manag. 2012, 111, 159–172. [Google Scholar] [CrossRef] [PubMed]
- Musvoto, C.; Campbell, B.M. Mango trees as components of agroforestry systems in Mangwende, Zimbabwe. Agrofor. Syst. 1995, 33, 247–260. [Google Scholar] [CrossRef]
- Swinkels, R.; Franzel, S. Adoption potential of hedgerow intercropping in maize-based cropping systems in the highlands of Western Kenya 2. Economic and farmers’ evaluation. Exp. Agric. 1997, 33, 211–223. [Google Scholar] [CrossRef]
- Akinnifesi, F.K.; Chirwa, P.W.; Ajayi, O.C.; Sileshi, G.; Matakala, P.; Kwesiga, F.R.; Harawa, H.; Makumba, W. Contributions of agroforestry research to livelihood of smallholder farmers in Southern Africa: 1. Taking stock of the adaptation, adoption and impact of fertilizer tree options. Agric. J. 2008, 3, 59–75. [Google Scholar]
- Franzel, S.; Denning, G.L.; Lillesø, J.P.B.; Mercado, A.R., Jr. Scaling up the impact of agroforestry: Lessons from three sites in Africa and Asia. Agrofor. Syst. 2004, 61, 329–344. [Google Scholar]
- Fürst, C.; Lorz, C.; Makeschin, F. Integrating land management and land-cover classes to assess impacts of land use change on ecosystem services. Int. J. Biodivers. Sci. Ecosyst. Serv. Manag. 2011, 7, 168–181. [Google Scholar] [CrossRef]
- Koschke, L.; Fürst, C.; Frank, S.; Makeschin, F. A multi-criteria approach for an integrated land-cover-based assessment of ecosystem services provision to support landscape planning. Ecol. Indic. 2012, 21, 54–66. [Google Scholar] [CrossRef]
- Shiffman, D. The Nature of Code. 2012, pp. 1–498. Available online: http://wtf.tw/ref/shiffman.pdf (accessed on 22 April 2018).
- Fürst, C.; Pietzsch, K.; Witt, A.; Frank, S.; Koschke, L.; Makeschin, F. How to better consider sectoral planning information in regional planning: Example afforestation and forest conversion. J. Environ. Plan. Manag. 2012, 55, 855–883. [Google Scholar] [CrossRef]
- Fürst, C.; König, H.; Pietzsch, K.; Ende, H.; Makeschin, F. Pimp your landscape—A generic approach for integrating regional stakeholder needs into land use planning. Ecol. Soc. 2010, 15, 34. [Google Scholar] [CrossRef]
- Sutherland, W.J.; Gardner, T.A.; Jamila Haider, L.; Dicks, L.V. How can local and traditional knowledge be effectively incorporated into international assessments? Oryx 2013, 48, 1–2. [Google Scholar] [CrossRef]
- Butt, T.A.; McCarl, B.A.; Angerer, J.; Dyke, P.T.; Stuth, J.W. The economic and food security implications of climate change in Mali. Clim. Chang. 2005, 68, 355–378. [Google Scholar] [CrossRef]
- Paeth, H.; Capo-Chichi, A.; Endlicher, W. Climate change and food security in tropical West Africa—A dynamic-statistical modelling approach. Erdkunde 2008, 62, 101–115. [Google Scholar] [CrossRef]
- Hassan, R.M. Implications of climate change for agricultural sector performance in Africa: Policy challenges and research agenda. J. Afr. Econ. 2010, 19, 77–105. [Google Scholar] [CrossRef]
- Salack, S.; Sarr, B.; Sangare, S.K.; Ly, M.; Sanda, I.S.; Kunstmann, H. Crop-climate ensemble scenarios to improve risk assessment and resilience in the semi-arid regions of West Africa. Clim. Res. 2015, 65, 107–121. [Google Scholar] [CrossRef]
- Ahmed, K.F.; Wang, G.; You, L.; Yu, M. Potential impact of climate and socioeconomic changes on future agricultural land use in West Africa. Earth Syst. Dyn. 2016, 7, 151–165. [Google Scholar] [CrossRef]
- Matusso, J.M.M.; Mugwe, J.N.; Mucheru-Muna, M. Potential role of cereal-legume intercropping systems in integrated soil fertility management in smallholder farming systems of Sub-Saharan Africa. Res. J. Agric. Environ. Manag. 2014, 3, 162–174. [Google Scholar]
- Midega, C.A.; Salifu, D.; Bruce, T.J.; Pittchar, J.; Pickett, J.A.; Khan, Z.R. Cumulative effects and economic benefits of intercropping maize with food legumes on Striga hermonthica infestation. Field Crop. Res. 2014, 155, 144–152. [Google Scholar] [CrossRef]
- Reddy, M.S.; Willey, R.W. Growth and resource use studies in an intercrop of pearl millet/groundnut. Field Crop. Res. 1981, 4, 13–24. [Google Scholar] [CrossRef]
- Ghosh, P.K. Growth, yield, competition and economics of groundnut/cereal fodder intercropping systems in the semi-arid tropics of India. Field Crop. Res. 2004, 88, 227–237. [Google Scholar] [CrossRef]
- Adongo, T.A.; Kugbe, J.X.; Gbedzi, V.D. Siltation of the reservoir of Vea irrigation dam in the Bongo district of the Upper East Region, Ghana. Int. J. Sci. Technol. 2014, 4, 1–7. [Google Scholar]
- Wang, Z.; Zhao, X.; Wu, P.; Chen, X. Effects of water limitation on yield advantage and water use in wheat (Triticum aestivum L.)/maize (Zea mays L.) strip intercropping. Eur. J. Agron. 2015, 71, 149–159. [Google Scholar] [CrossRef]
- Chimonyo, V.G.P.; Modi, A.T.; Mabhaudhi, T. Water use and productivity of a sorghum-cowpea-bottle gourd intercrop system. Agric. Water Manag. 2016, 165, 82–96. [Google Scholar] [CrossRef]
- Farley, K.A.; Jobbágy, E.G.; Jackson, R.B. Effects of afforestation on water yield: A global synthesis with implications for policy. Glob. Chang. Biol. 2005, 11, 1565–1576. [Google Scholar] [CrossRef]
- Giertz, S.; Junge, B.; Diekkrüger, B. Assessing the effects of land use change on soil physical properties and hydrological processes in the sub-humid tropical environment of West Africa. Phys. Chem. Earth 2005, 30, 485–496. [Google Scholar] [CrossRef]
- Li, K.Y.; Coe, M.T.; Ramankutty, N.; de Jong, R. Modeling the hydrological impact of land-use change in West Africa. J. Hydrol. 2007, 337, 258–268. [Google Scholar] [CrossRef]
- Frank, S.; Fürst, C.; Koschke, L.; Witt, A.; Makeschin, F. Assessment of landscape aesthetics—Validation of a landscape metrics-based assessment by visual estimation of the scenic beauty. Ecol. Indic. 2013, 32, 222–231. [Google Scholar] [CrossRef]
- Lindeskog, M.; Arneth, A.; Bondeau, A.; Waha, K.; Seaquist, J.; Olin, S.; Smith, B. Implications of accounting for land use in simulations of ecosystem services and carbon cycling in Africa. Earth Syst. Dyn. Discuss. 2013, 4, 235–278. [Google Scholar] [CrossRef]
- OECD. Organisation for Economic Co-Operation and Development. Farmer Behaviour, Agricultural Management and Climate Change. OECD Publishing, 2012; pp. 1–83. Available online: http://0-dx-doi-org.brum.beds.ac.uk/10.1787/9789264167650-en (accessed on 14 April 2017).
- United Nations Environment Programme(UNEP). Indigenous Knowledge in Disaster Management in Africa; Mwaura, P., Ed.; United Nations Environment Programme: Nairobi, Kenya, 2008; pp. 1–117. Available online: https://pdfs.semanticscholar.org/6307/9f76629e2bda9ac421d1087baf8e626c6e7a.pdf?_ga=2.246878532.1194577200.1522486081-244805388.1522486081 (accessed on 4 April 2017).
- Liu, J.; Dietz, T.; Carpenter, S.R.; Alberti, M.; Folke, C.; Moran, E.; Pell, A.N.; Deadman, P.; Kratz, T.; Lubchenco, J.; et al. Complexity of coupled human and natural systems. Science 2007, 317, 1513–1516. [Google Scholar] [CrossRef] [PubMed]
- Polasky, S.; Nelson, E.; Pennington, D.; Johnson, K.A. The impact of land-use change on ecosystem services, biodiversity and returns to landowners: A case study in the state of Minnesota. Environ. Resour. Econ. 2011, 48, 219–242. [Google Scholar] [CrossRef]
- Pennington, D.N.; Dalzell, B.; Nelson, E.; Mulla, D.; Taff, S.; Hawthorne, P.; Polasky, S. Cost-effective land use planning: Optimizing land use and land management patterns to maximize social benefits. Ecol. Econ. 2017, 139, 75–90. [Google Scholar] [CrossRef]
Figure 1.
Location of Bolgatanga and Bongo districts and their land use patterns based on RapidEye images of 2013 and field calibration (25 × 25 m2).
Figure 1.
Location of Bolgatanga and Bongo districts and their land use patterns based on RapidEye images of 2013 and field calibration (25 × 25 m2).

Figure 2.
Development process of locally feasible land use scenarios.

Figure 3.
Integrative assessment process of ecosystem services and land use scenarios.

Figure 4.
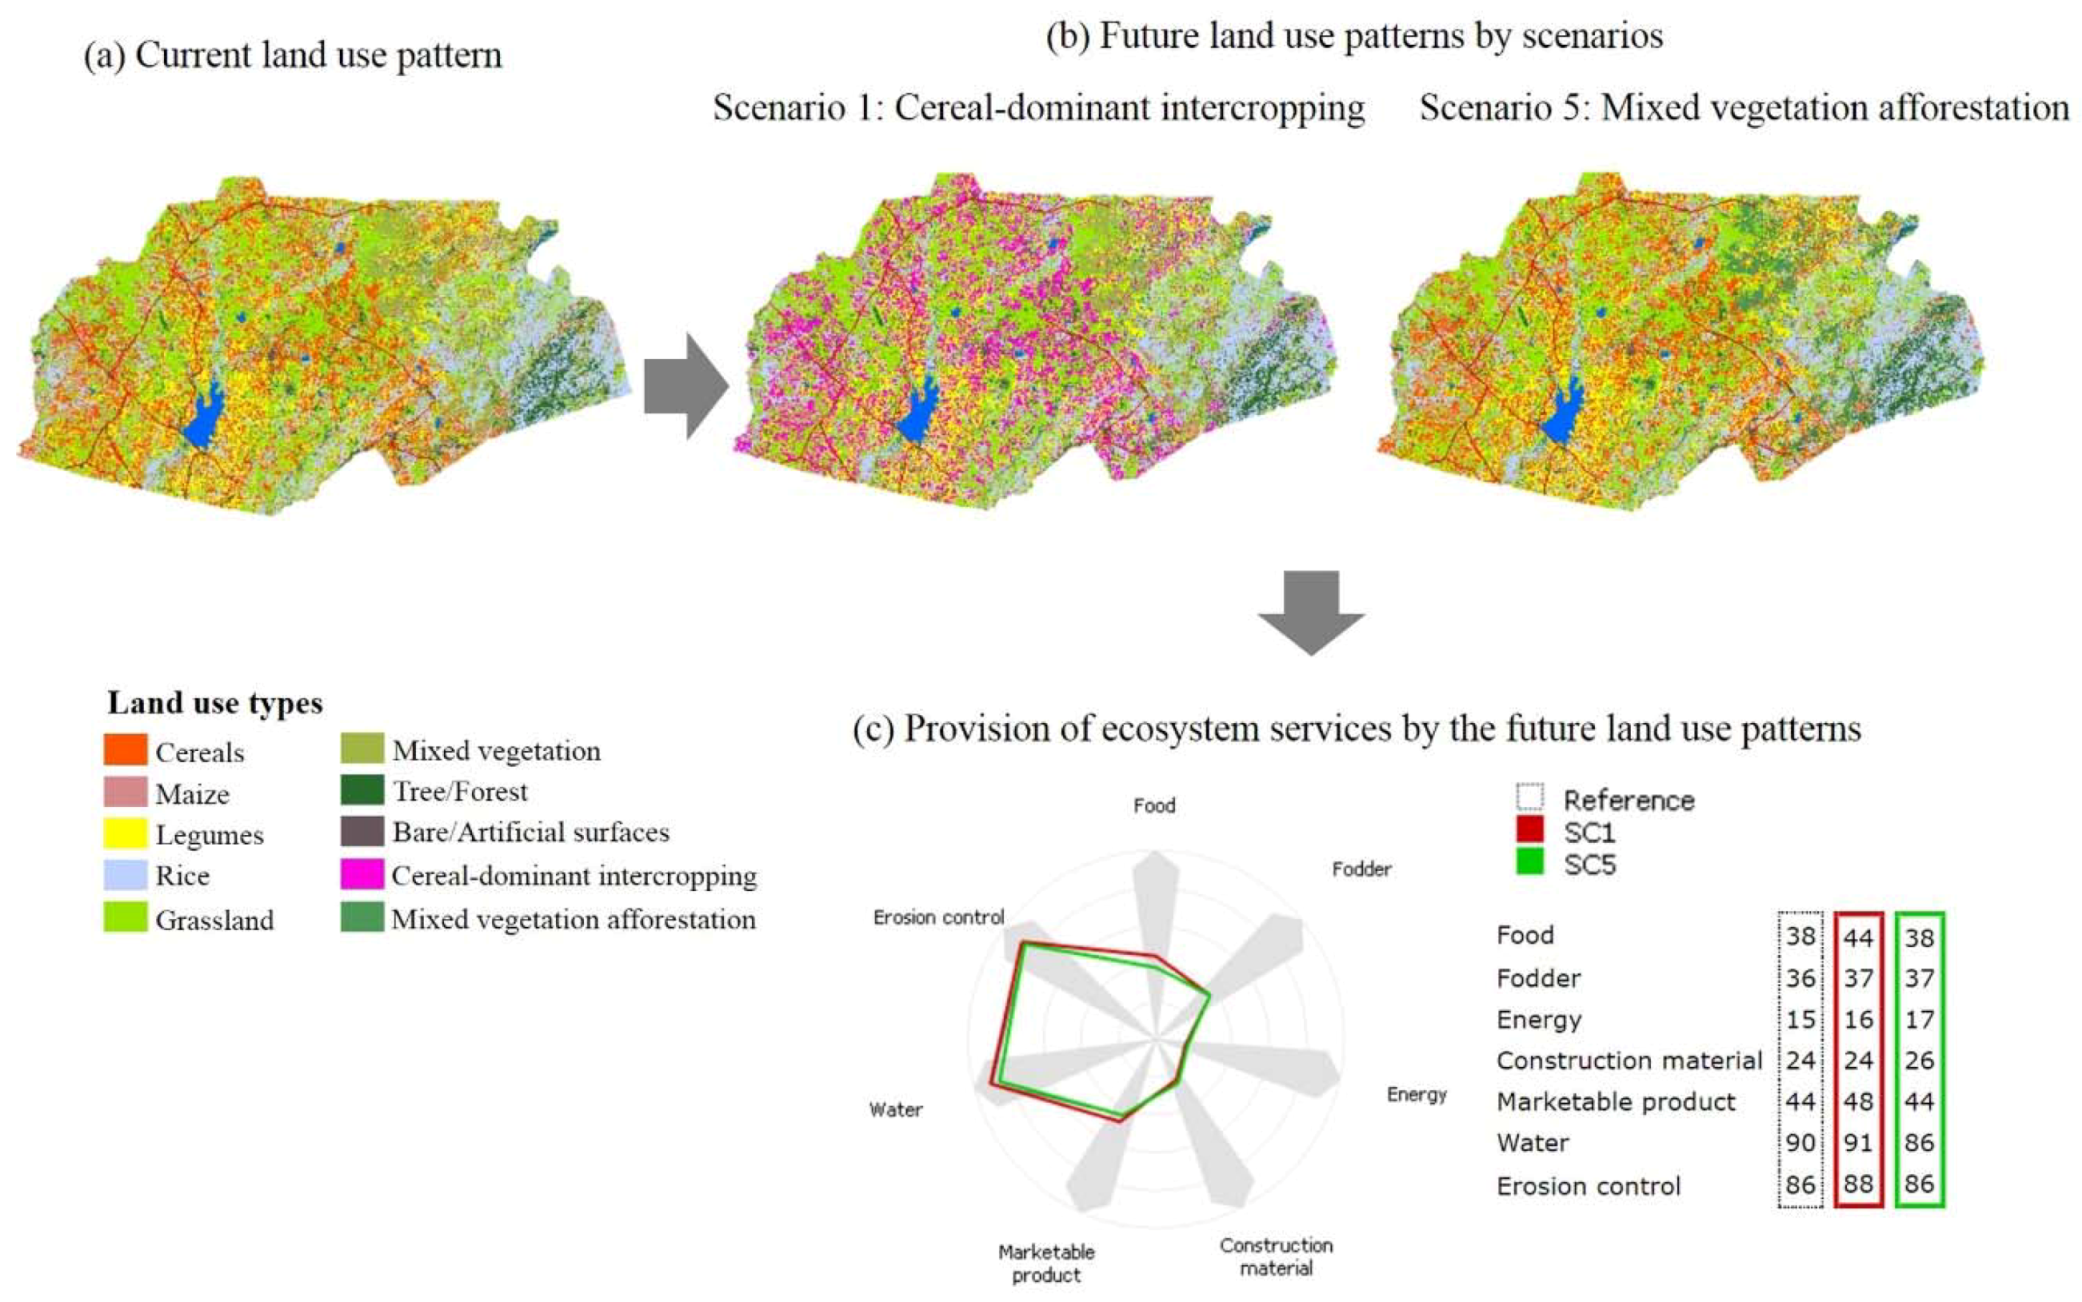
Future land use patterns of selected scenarios and spider charts for the ecosystem services balance supplied by the model output for Bolgatanga. As an example, influences of cereal-dominant intercropping (SC 1) and mixed vegetation afforestation (SC 5) on the current land use pattern were generated by cellular automaton (b). In the spider chart (c), changes in the provision of ecosystem services compared to the current provision of ecosystem services as reference are displayed for SC1 and SC5. The values of ecosystem services of the two scenarios corresponding to the spider chart are presented in the table.
Figure 4.
Future land use patterns of selected scenarios and spider charts for the ecosystem services balance supplied by the model output for Bolgatanga. As an example, influences of cereal-dominant intercropping (SC 1) and mixed vegetation afforestation (SC 5) on the current land use pattern were generated by cellular automaton (b). In the spider chart (c), changes in the provision of ecosystem services compared to the current provision of ecosystem services as reference are displayed for SC1 and SC5. The values of ecosystem services of the two scenarios corresponding to the spider chart are presented in the table.

Figure 5.
Future land use patterns of selected land use scenarios and spider charts for the values of ecosystem services supplied by the model output for Bongo. The example shows the impacts of cereal-dominant intercropping (SC 1) and mixed vegetation afforestation (SC 5) on the current land use patterns (b), and resulting changes in ecosystem services provision (c).


Table 1.
Definition of land use types for the wet season in the study area and the percentage of the area occupied by each land use type corresponding with the district land use map [33].
Table 1.
Definition of land use types for the wet season in the study area and the percentage of the area occupied by each land use type corresponding with the district land use map [33].
| Land Use Type | Definition | Bolgatanga (%) | Bongo (%) |
|---|---|---|---|
| Cereals | Single or mixed cropping of millet and sorghum | 13.5 | 17.5 |
| Legumes | Groundnuts or the intercropping of groundnuts and bambara beans | 10.5 | 13.5 |
| Maize | Single cropping of maize | 4 | 5.6 |
| Rice | Single cropping of rice | 13.4 | 20.8 |
| Grassland | Grassland including pastures | 14.3 | 26.5 |
| Mixed vegetation | Mixture of shrubs, trees, savanna, and herbs | 29.4 | 5.5 |
| Tree/Forest | Tree cover ≥70% or single trees on farm plots | 9.3 | 5 |
| Bare/Artificial surfaces | Bare areas, laterite and tarred roads, buildings, hamlets, and rocks | 5.3 | 4.3 |
| Water bodies | Small reservoirs, dams, and rivers | 0.3 | 1.3 |
Note: We regarded that one land use cell includes one land use type, i.e., all crop land use types were here defined as monoculture.
Table 2.
Selected ecosystem services, indicators, and data generation methods for indicator values.
| Ecosystem Service | Definition | Proxy Indicator | Data Generation |
|---|---|---|---|
| Food provision | Benefits of agricultural land use related to food | Proportion of land use products consumed as food by households (%) | Stakeholder survey |
| Fodder provision | Benefits of agricultural land use related to livestock feed | Proportion of land use products used for animal feed (%) | Stakeholder survey |
| Energy provision | Benefits of agricultural land use related to fuel for households (biomass) | Proportion of land use products used for fuel (%) | Stakeholder survey |
| Construction material provision | Benefits of agricultural land use related to construction materials | Proportion of land use products used for construction purposes (e.g., roofs, pillars) (%) | Stakeholder survey |
| Marketable product provision | Benefits of agricultural land use related to economic value | Proportion of land use products sold on the market for income (%) | Stakeholder survey |
| Water provision | Surface water yield to contribute to water bodies for direct use | Potential water yields determined by subtracting evapotranspiration from precipitation ( | Water yield equation (a, b) |
| Erosion control | Surface run-off prevention | Potential soil erosion level according to the RUSLE model | RUSLE equation (c, d, e) |
Table 3.
Locally feasible land use scenarios and their descriptions.
| Land Use Scenario | Description | ||
|---|---|---|---|
| Crop intercropping | 1 | Cereal-dominant intercropping | Conversion of cereal monocropping into cereal-dominant intercropping with legumes |
| 2 | Maize-dominant intercropping | Conversion of maize monocropping into maize-dominant intercropping with legumes | |
| 3 | Legume-dominant intercropping | Conversion of legume monocropping into legume-dominant intercropping with cereals and maize | |
| Afforestation and agroforestry | 4 | Grassland afforestation | Conversion of grassland into afforested land |
| 5 | Mixed vegetation afforestation | Conversion of mixed vegetation into afforested land | |
| 6 | Cereal intercropping with mango (fruit tree) | Conversion of cereal monocropping into cereal-dominant intercropping with mango | |
| 7 | Maize intercropping with mango (fruit tree) | Conversion of maize monocropping into maize-dominant intercropping with mango | |
| 8 | Legume intercropping with mango (fruit tree) | Conversion of legume monocropping into legume-dominant intercropping with mango | |
| 9 | Cereal intercropping with leucaena (fodder tree) | Conversion of cereal monocropping into cereal-dominant intercropping with leucaena | |
| 10 | Maize intercropping with leucaena (fodder tree) | Conversion of maize monocropping into maize-dominant intercropping with leucaena | |
| 11 | Legume intercropping with leucaena (fodder tree) | Conversion of legume monocropping into legume-dominant intercropping with leucaena | |
| Soil conservation | 12 | Stone or soil bunds on cereals | Establishment of bunds on cereal monocropping fields |
| 13 | Stone or soil bunds on maize | Establishment of bunds on maize monocropping fields | |
| 14 | Windbreak on cereals | Establishment of windbreak though planting trees on cereal monocropping fields | |
| 15 | Windbreak on maize | Establishment of windbreak though planting trees on maize monocropping fields | |
Table 4.
Assessment matrix for Bolgatanga to display the relationship between current and future land use types and their potential to provide the selected ecosystem services within a scale from 0 (no provision, in white) to 100 (highest level of provision, in dark blue).
Table 4.
Assessment matrix for Bolgatanga to display the relationship between current and future land use types and their potential to provide the selected ecosystem services within a scale from 0 (no provision, in white) to 100 (highest level of provision, in dark blue).
| Land Use Type | Food | Fodder | Energy | Construction Materials | Marketable Products | Water | Erosion Control | |
|---|---|---|---|---|---|---|---|---|
| Current | Cereal-monocropping | 58 | 7 | 29 | 4 | 30 | 97 | 60 |
| Maize-monocropping | 52 | 12 | 7 | 4 | 43 | 98 | 62 | |
| Legume-monocropping | 60 | 4 | 3 | 4 | 65 | 97 | 95 | |
| Rice-monocropping | 44 | 1 | 3 | 0 | 70 | 83 | 88 | |
| Grassland | 1 | 100 | 32 | 37 | 11 | 95 | 98 | |
| Mixed vegetation | 19 | 47 | 63 | 63 | 12 | 98 | 100 | |
| Tree/Forest | 28 | 7 | 57 | 31 | 54 | 97 | 100 | |
| Bare/Artificial surfaces | 0 | 0 | 0 | 0 | 0 | 100 | 0 | |
| Water body | 0 | 0 | 0 | 0 | 0 | 100 | 100 | |
| Future | Cereal-dominant intercropping | 96 | 12 | 34 | 4 | 46 | 30 | 90 |
| Maize-dominant intercropping | 89 | 19 | 8 | 4 | 71 | 31 | 86 | |
| Legume-dominant intercropping | 100 | 6 | 4 | 4 | 100 | 28 | 97 | |
| Grassland afforestation | 2 | 100 | 53 | 60 | 18 | 20 | 99 | |
| Mixed vegetation afforestation | 27 | 49 | 100 | 100 | 17 | 31 | 100 | |
| Cereal intercropping with mango | 51 | 7 | 32 | 4 | 36 | 0 | 77 | |
| Maize intercropping with mango | 46 | 11 | 8 | 4 | 52 | 1 | 78 | |
| Legume intercropping with mango | 86 | 5 | 4 | 4 | 95 | 6 | 97 | |
| Cereal intercropping with leucaena | 71 | 11 | 39 | 4 | 38 | 8 | 83 | |
| Maize intercropping with leucaena | 64 | 19 | 10 | 4 | 55 | 9 | 84 | |
| Legume intercropping with leucaena | 70 | 7 | 4 | 4 | 85 | 20 | 98 | |
| Soil or stone bunds on cereals | 94 | 11 | 42 | 4 | 52 | 20 | 87 | |
| Soil or stone bunds on maize | 85 | 18 | 11 | 4 | 75 | 7 | 87 | |
| Windbreak on cereals | 89 | 11 | 43 | 4 | 44 | 32 | 84 | |
| Windbreak on maize | 80 | 18 | 11 | 4 | 63 | 33 | 85 | |
Table 5.
Assessment matrix for Bongo to display the relationship between current and future land use types and their potential to provide the selected ecosystem services within a scale from 0 (no provision, in white) to 100 (highest level of provision, in dark blue).
Table 5.
Assessment matrix for Bongo to display the relationship between current and future land use types and their potential to provide the selected ecosystem services within a scale from 0 (no provision, in white) to 100 (highest level of provision, in dark blue).
| Land Use Type | Food | Fodder | Energy | Construction Materials | Marketable Products | Water | Erosion Control | |
|---|---|---|---|---|---|---|---|---|
| Current | Cereal-monocropping | 63 | 6 | 28 | 6 | 42 | 88 | 71 |
| Maize-monocropping | 56 | 11 | 6 | 6 | 60 | 89 | 63 | |
| Legume-monocropping | 53 | 16 | 0 | 5 | 71 | 88 | 96 | |
| Rice-monocropping | 51 | 15 | 0 | 0 | 69 | 92 | 92 | |
| Grassland | 11 | 97 | 11 | 65 | 20 | 89 | 99 | |
| Mixed vegetation | 21 | 53 | 68 | 68 | 20 | 94 | 100 | |
| Tree/Forest | 33 | 13 | 62 | 24 | 60 | 94 | 100 | |
| Bare/Artificial surfaces | 0 | 0 | 0 | 0 | 0 | 89 | 0 | |
| Water body | 0 | 0 | 0 | 0 | 0 | 100 | 100 | |
| Future | Cereal-dominant intercropping | 100 | 9 | 32 | 6 | 65 | 94 | 85 |
| Maize-dominant intercropping | 90 | 15 | 6 | 6 | 92 | 100 | 78 | |
| Legume-dominant intercropping | 75 | 19 | 0 | 5 | 100 | 14 | 97 | |
| Grassland afforestation | 15 | 100 | 17 | 99 | 30 | 0 | 100 | |
| Mixed vegetation afforestation | 29 | 70 | 100 | 100 | 27 | 15 | 100 | |
| Cereal intercropping with mango | 79 | 7 | 32 | 7 | 61 | 0 | 79 | |
| Maize intercropping with mango | 70 | 13 | 7 | 7 | 86 | 0 | 73 | |
| Legume intercropping with mango | 76 | 20 | 0 | 6 | 94 | 30 | 97 | |
| Cereal intercropping with leucaena | 75 | 10 | 37 | 7 | 52 | 19 | 83 | |
| Maize intercropping with leucaena | 67 | 16 | 8 | 7 | 73 | 20 | 78 | |
| Legume intercropping with leucaena | 69 | 25 | 0 | 6 | 90 | 3 | 97 | |
| Soil or stone bunds on cereals | 99 | 10 | 38 | 8 | 63 | 28 | 91 | |
| Soil or stone bunds on maize | 88 | 16 | 8 | 8 | 89 | 28 | 88 | |
| Windbreak on cereals | 88 | 9 | 39 | 9 | 55 | 28 | 84 | |
| Windbreak on maize | 78 | 15 | 9 | 9 | 78 | 28 | 80 | |
Table 6.
The fifteen land use scenarios and their potential changes in ecosystem services provision for Bolgatanga. The increase from the current status is expressed by green color, whereas the decrease is indicated by red color. White means no change in the provision of ecosystem services compared to current land use.
| Land Use Scenario | Food | Fodder | Energy | Construction Materials | Marketable Products | Water | Erosion Control | |
|---|---|---|---|---|---|---|---|---|
| Current Status | 30 | 31 | 33 | 28 | 32 | 95 | 85 | |
| 1 | Cereal-dominant intercropping | 35 | 31 | 34 | 28 | 34 | 87 | 89 |
| 2 | Maize-dominant intercropping | 32 | 31 | 33 | 28 | 33 | 93 | 86 |
| 3 | Legume-dominant intercropping | 34 | 31 | 33 | 28 | 36 | 88 | 86 |
| 4 | Grassland afforestation | 31 | 31 | 36 | 30 | 33 | 85 | 85 |
| 5 | Mixed vegetation afforestation | 33 | 31 | 44 | 37 | 34 | 76 | 85 |
| 6 | Cereal intercropping with mango | 30 | 31 | 34 | 28 | 33 | 83 | 88 |
| 7 | Maize intercropping with mango | 30 | 31 | 33 | 28 | 32 | 92 | 86 |
| 8 | Legume intercropping with mango | 33 | 31 | 33 | 28 | 35 | 86 | 86 |
| 9 | Cereal intercropping with leucaena | 32 | 31 | 35 | 28 | 33 | 84 | 88 |
| 10 | Maize intercropping with leucaena | 31 | 31 | 33 | 28 | 32 | 92 | 86 |
| 11 | Legume intercropping with leucaena | 31 | 31 | 33 | 28 | 34 | 88 | 86 |
| 12 | Soil or stone bunds on cereals | 35 | 31 | 35 | 28 | 35 | 85 | 89 |
| 13 | Soil or stone bunds on maize | 32 | 31 | 33 | 28 | 33 | 92 | 86 |
| 14 | Windbreak on cereals | 34 | 31 | 35 | 28 | 34 | 87 | 88 |
| 15 | Windbreak on maize | 31 | 31 | 33 | 28 | 33 | 93 | 86 |
Table 7.
The fifteen land use scenarios and their potential changes in ecosystem services provision for Bongo. The increase from the initial (current) status is expressed by green color, while the decrease is displayed by red color. White means no change in the provision of ecosystem services compared to current land use.
| Land Use Scenario | Food | Fodder | Energy | Construction Materials | Marketable Products | Water | Erosion Control | |
|---|---|---|---|---|---|---|---|---|
| Initial Status | 38 | 36 | 15 | 24 | 44 | 90 | 86 | |
| 1 | Cereal-dominant intercropping | 44 | 37 | 16 | 24 | 48 | 91 | 88 |
| 2 | Maize-dominant intercropping | 39 | 36 | 15 | 24 | 46 | 90 | 87 |
| 3 | Legume-dominant intercropping | 40 | 37 | 15 | 24 | 48 | 80 | 86 |
| 4 | Grassland afforestation | 39 | 37 | 16 | 33 | 46 | 67 | 86 |
| 5 | Mixed vegetation afforestation | 38 | 37 | 17 | 26 | 44 | 86 | 86 |
| 6 | Cereal intercropping with mango | 40 | 36 | 16 | 24 | 47 | 75 | 87 |
| 7 | Maize intercropping with mango | 38 | 36 | 15 | 24 | 45 | 86 | 86 |
| 8 | Legume intercropping with mango | 40 | 37 | 15 | 24 | 47 | 82 | 86 |
| 9 | Cereal intercropping with leucaena | 40 | 37 | 16 | 24 | 46 | 78 | 88 |
| 10 | Maize intercropping with leucaena | 38 | 36 | 15 | 24 | 45 | 87 | 87 |
| 11 | Legume intercropping with leucaena | 40 | 37 | 15 | 24 | 46 | 79 | 86 |
| 12 | Soil or stone bunds on cereals | 44 | 37 | 17 | 25 | 47 | 80 | 89 |
| 13 | Soil or stone bunds on maize | 39 | 36 | 15 | 24 | 45 | 87 | 87 |
| 14 | Windbreak on cereals | 42 | 37 | 17 | 25 | 46 | 79 | 88 |
| 15 | Windbreak on maize | 39 | 36 | 15 | 24 | 45 | 87 | 87 |
© 2018 by the authors. Licensee MDPI, Basel, Switzerland. This article is an open access article distributed under the terms and conditions of the Creative Commons Attribution (CC BY) license (http://creativecommons.org/licenses/by/4.0/).
Share and Cite
MDPI and ACS Style
Koo, H.; Kleemann, J.; Fürst, C. Land Use Scenario Modeling Based on Local Knowledge for the Provision of Ecosystem Services in Northern Ghana. Land 2018, 7, 59. https://0-doi-org.brum.beds.ac.uk/10.3390/land7020059
AMA Style
Koo H, Kleemann J, Fürst C. Land Use Scenario Modeling Based on Local Knowledge for the Provision of Ecosystem Services in Northern Ghana. Land. 2018; 7(2):59. https://0-doi-org.brum.beds.ac.uk/10.3390/land7020059
Chicago/Turabian StyleKoo, Hongmi, Janina Kleemann, and Christine Fürst. 2018. "Land Use Scenario Modeling Based on Local Knowledge for the Provision of Ecosystem Services in Northern Ghana" Land 7, no. 2: 59. https://0-doi-org.brum.beds.ac.uk/10.3390/land7020059
Note that from the first issue of 2016, this journal uses article numbers instead of page numbers. See further details here.