The Use of Community Greenways: A Case Study on A Linear Greenway Space in High Dense Residential Areas, Guangzhou


1
South China University of Technology, School of Architecture, Department of Landscape Architecture, Guangzhou 510641, China
2
State Key Laboratory of Subtropical Building Science, Guangzhou 510641, China
3
Guangzhou Municipal Key Laboratory of Landscape Architecture, Guangzhou 510641, China
*
Author to whom correspondence should be addressed.
Land 2019, 8(12), 188; https://0-doi-org.brum.beds.ac.uk/10.3390/land8120188
Submission received: 31 October 2019
/
Revised: 5 December 2019
/
Accepted: 6 December 2019
/
Published: 8 December 2019
(This article belongs to the Special Issue Selected Papers from the 6th Fábos Conference on Landscape and Greenway Planning: Adapting to Expanding and Contracting Cities)
Abstract
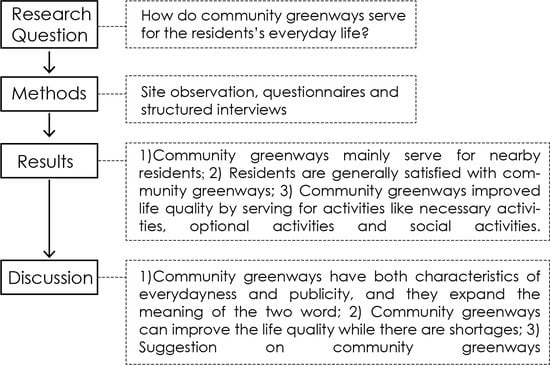
:The community greenway is a kind of greenway that goes through high-density residential areas in the city and is closely related to residents’ life. However, few scholars focus on how this type of greenways serves the everyday life of the community as an integrated resource. This aspect is important because the everyday life in the public space involves multiple activities. How to coordinate and satisfy these activities relates to the benefits of community greenways. Therefore, this paper takes a representative community greenway in Haizhu District of Guangzhou as an example, to study whether community greenways match the needs of necessary activities, optional activities and social activities. The usage patterns, the evaluation of the current status, the impact on everyday activities, and the importance of different construction factors were surveyed. The applied methods include site observation, questionnaires and interviews. The results show that more than 90% of users are from communities within 1 mile from the community greenway. More than half of the users (55%) are satisfied with the community greenways. Furthermore, the community greenways benefit the everyday activities of residents, such as transportation, recreation, social interaction and also other minor but important everyday activities. However, from the perspective of residents’ requirements for construction factors, the status of service facilities needs to be improved. The characteristics, overall benefits, and construction implications of community greenways are therefore discussed. Community greenways can be important open space for residents and this paper is significant on community greenways meeting the needs of residents’ everyday activities, thus, to provide a better community living environment and to build a better urban open space system.
1. Introduction
The greenway movement has been recognized worldwide since its inception in the 1990s. The Greenway, which can be considered as “a linear open space established along either a natural corridor, such as a riverfront, stream valley, or ridgeline, or overland along railroad right-of-way converted to recreational use, a canal, a scenic road, or other route” [1], has unique advantages as open space when the land becomes less and less in city areas. It is a part of urban infrastructure and forms connected networks that support both ecological and social activities and process [2]. Although the urban greenways have developed into various forms according to different physical environments, its essence is to connect the residential area and neighborhoods with open space through a network-like linear landscape corridor [3,4,5], so that the leisure space is expanded in urban areas. In summary, urban greenways can not only adapt to the situation to the shortage of urban construction land, but also meet the increasing demand of outdoor leisure, adapting to the expansion of urbanization [6]. However, as the city areas become more and more densified, there has been a lack of space for new urban green space [7,8], including greenways. Issues have arisen, for example, many greenways cannot match the needs of the users [9]. On one hand, some greenways in built areas are based on the sidewalks and are too narrow to support the outdoor exercises [10]. On the other hand, to improve the ecological value of greenways, many of them are built outside the city [11], increasing the distance between city users and green spaces. The development of the society has led to even higher demands for open spaces [12]. Thus for urban greenways, a big challenge is that how to better serve residents instead of being a waste public sources.
Urban greenways usually have multi-functions [13], such as ecological services, recreation, commuting, and economic development [5]. To meet the challenge, the first step is to get a deep understanding of the greenway functions. One of the most important functions of urban greenways is to improve biodiversity [5]. More native species would inhabit greenways especially the urban stream corridors when the environment is renovated [14]. For recreational use, urban greenways are built to serve the urban residents by improving the natural and physical environment [15], helping people to get more outdoor activities such as physical exercise, recreation and enjoying the scenery [16,17,18,19], thus improving their physical and mental health [17]. A study indicates that people who use the greenways to exercise are more likely to meet national health standards [20]. The health benefits of greenways are impacted by the distance between greenways and residential areas, which especially increase first and then decrease in a certain distance [21]. The social benefit is also one of the important influences of greenways. On one hand, residents seek to improve community relationships in greenways [22] as the greenways near residential areas attract people to go outdoors, which can increase the frequency of neighbors’ meeting [22,23]. Meanwhile, the greenways can be used as a place for community residents and their families to have fun and communicate. Through participating in these collective activities, the neighborhood interaction and community cohesion would be enhanced [15,23,24]. On the other hand, greenways help to improve social equity by serving users of a diverse sociodemographic background, especially in developing countries [9]. Urban greenways also bear important traffic functions. Many urban greenways are the essential roads for people to go to work and do shopping, which also connect communities, parks and important urban service facilities. In this way, people can reach their destinations such as shops, restaurants and transportation stations through greenways in a short time, which will improve people’s travel efficiency [25,26,27]. In addition to the above functions, other functions of urban greenways have been further expanded recently. Some urban greenways can be used as places for urban commercial activities, allowing small vendors to enter the greenway space through time-sharing. This phenomenon is especially concentrated in the greenways close to residents or within the residential areas [28]. What’s more, urban greenways also have certain impacts on the economy of residential areas. For example, urban greenways can improve the property value of nearby owners [23]. Of all the above functions, recreation is the one that the users care about the most, and satisfaction for greenways would decline if the economy function is too strong [22].
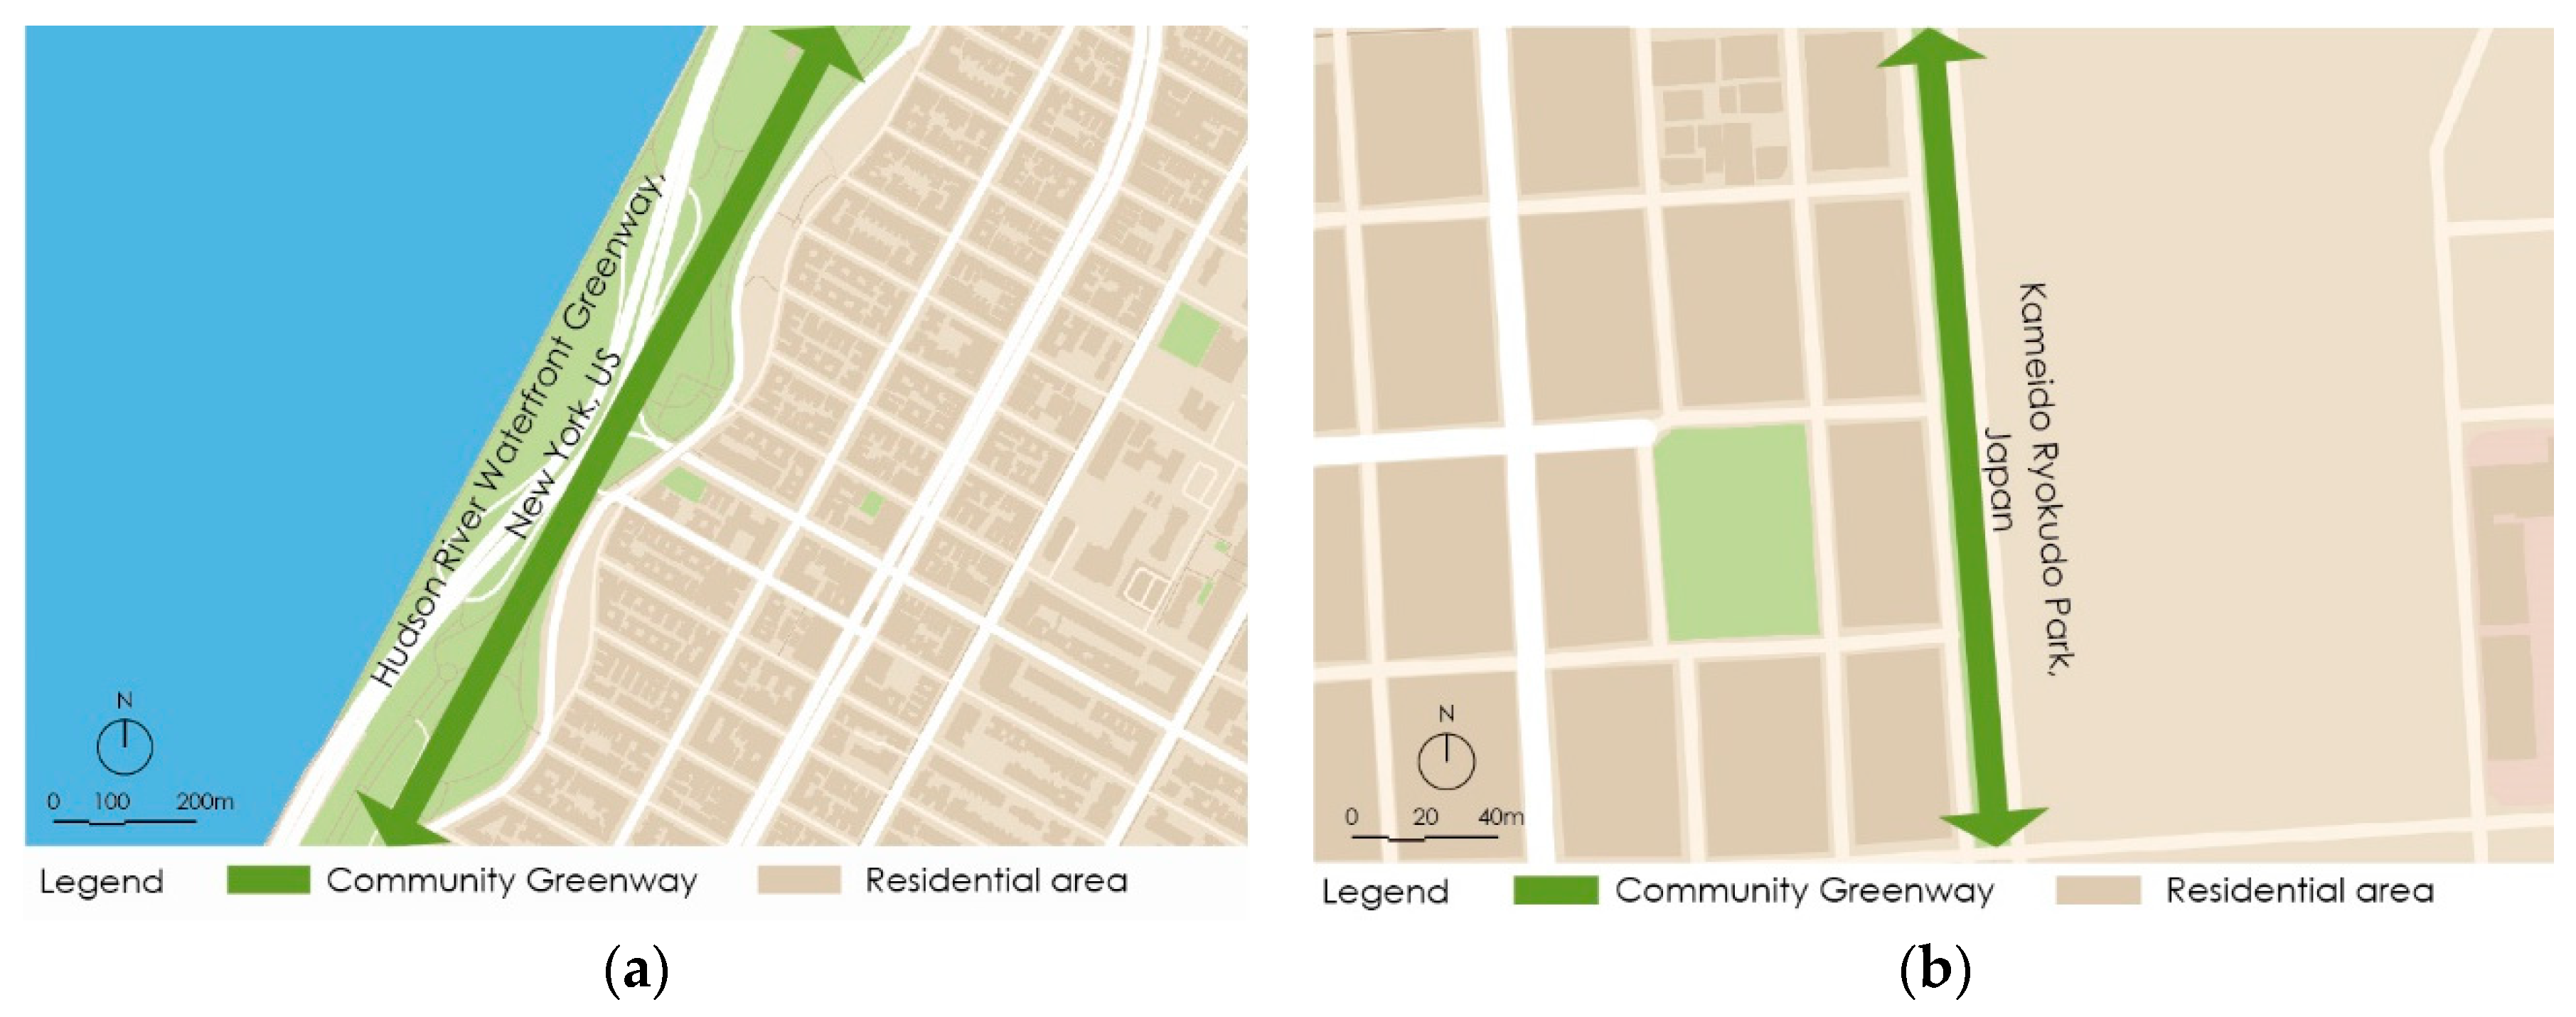
In previous studies, scholars often regarded urban greenways as a whole, while the functions of a certain greenway may be affected by its location. Greenways can show different characteristics according to different environments [5]. For example, the waterfront greenway owns better natural environment, while the greenway next to the city road has more convenient transportation. The biodiversity and recreation functions of different urban greenways will affect people’s usage modes [14], which in turn affect the main functions of greenways. Among all the influencing factors, accessibility and the distance between greenways and residential areas are the most important ones [29,30]. This is because whether the greenway is easy to reach or leave directly affects the frequency of people visiting the greenway [5,31]. Greenways close to residential areas are accessed more frequently by nearby residents [15,29], and can perform various functions [23]. Through literature research, the characteristics of such greenways can be summarized: they are next to urban communities or go through residential areas, and mainly serve nearby communities [13,15,29,32], so they can be defined as “community greenways”. There have been plenty cases of community greenways, such as Hudson River waterfront Greenway in New York and Kameido Ryokudo Park in Japan (Figure 1). In Nanshan District of Shenzhen, China, the community greenway density reaches 1.08 km/km2 [33] because there is requirement for constructing greenways near residential area in Pearl River Delta. Though community greenways have been common in many places, there is not yet an academic consensus on community greenways.
In the authors’ opinion, the community greenway can be regarded as branch “urban greenways” or “local trails” by the classification of greenways in the previous literature. Urban greenways include higher levels of development and have high levels of access to densely populated areas [5] and local trails were trails where more than 50% of the respondents are from a distance of 5 miles or less [29]. Community greenways can be subdivided from the above two categories because community greenways are even closer to residential areas and serve a smaller area. This could lead to different characteristics in the daily interactions between residents and community greenways. Some studies have focused on community greenways. For example, Akpinar studied the use patterns and factors influencing the use of Kosuyolu Urban Greenway (KUG) in Turkey, which is located within 1000 m for 30,000 inhabitants [13] and Wang did research on the construction of Furong greenway in Shenzhen, which is beside seven communities [34]. Community greenways have the main functions of urban greenways: providing leisure space and alternative transportation paths and connecting communities with nearby parks and service facilities. The main characteristics of community greenways is the location, which is close to or deep inside communities and extends to people’s everyday living space. The interaction between residents and community greenways may not only affect aspects of recreation and exercise, but also in daily transportation, communication and even in the everyday activities in front of the house. A previous study has shown that greenways can improve the quality of lives [15]. Nevertheless, there is still a lack of research that focus on the activities happening in community greenways and the integrated benefits of such space. So, the question is: how do community greenways serve for the everyday activities of residents as an overall resource instead of just a recreational resource? Scholars have regarded greenways in communities as leisure space, while overlooked the multi-functions of greenways as an integrated resource to the community [5]. This leads to the isolation of greenways from the everyday lives of the residents, thus ignoring the potential benefits of the greenways.
This study takes community greenways as a specific type of urban greenways and analyzes how community greenways serve the residents from the perspective of everyday life in public space. This life is continuous in time and also public in space [35]. Applying ideas in “life between buildings”, the activities in communities can be divided into necessary activities, optional activities and social activities [36], including all public activities in open space. Recreation is only a part of the optional activities. As the public space “beside the house”, community greenways shorten the distance between public space and residents’ life. From the perspective of everyday life, a vibrant public space can performs the pre-designed function, but also allows residents to creatively expand the functions of the space [37]. The public space should be related to the lives of the residents. Therefore, this study focuses on the relationship of community greenways and residents’ daily life. The three specific questions include: (1) How do residents use community greenways in their daily life? (2) How do residents evaluate community greenways in everyday activities? (3) What are the key elements that residents consider in the construction of community greenways? From the above three aspects, the authors study on the questions how community greenways serve for residents’ daily life and seek to build a better community environment.
2. Materials and Methods
2.1. Site Selection
The following principles were referenced when selecting the study site: (1) The community greenways should be part of the urban greenway networks instead of isolated trails; (2) the community greenways should be constructed in recent years to ensure that the greenways are in normal use; (3) the surrounding communities and residential groups should be diverse, ensuring that users cover a wide range of people.
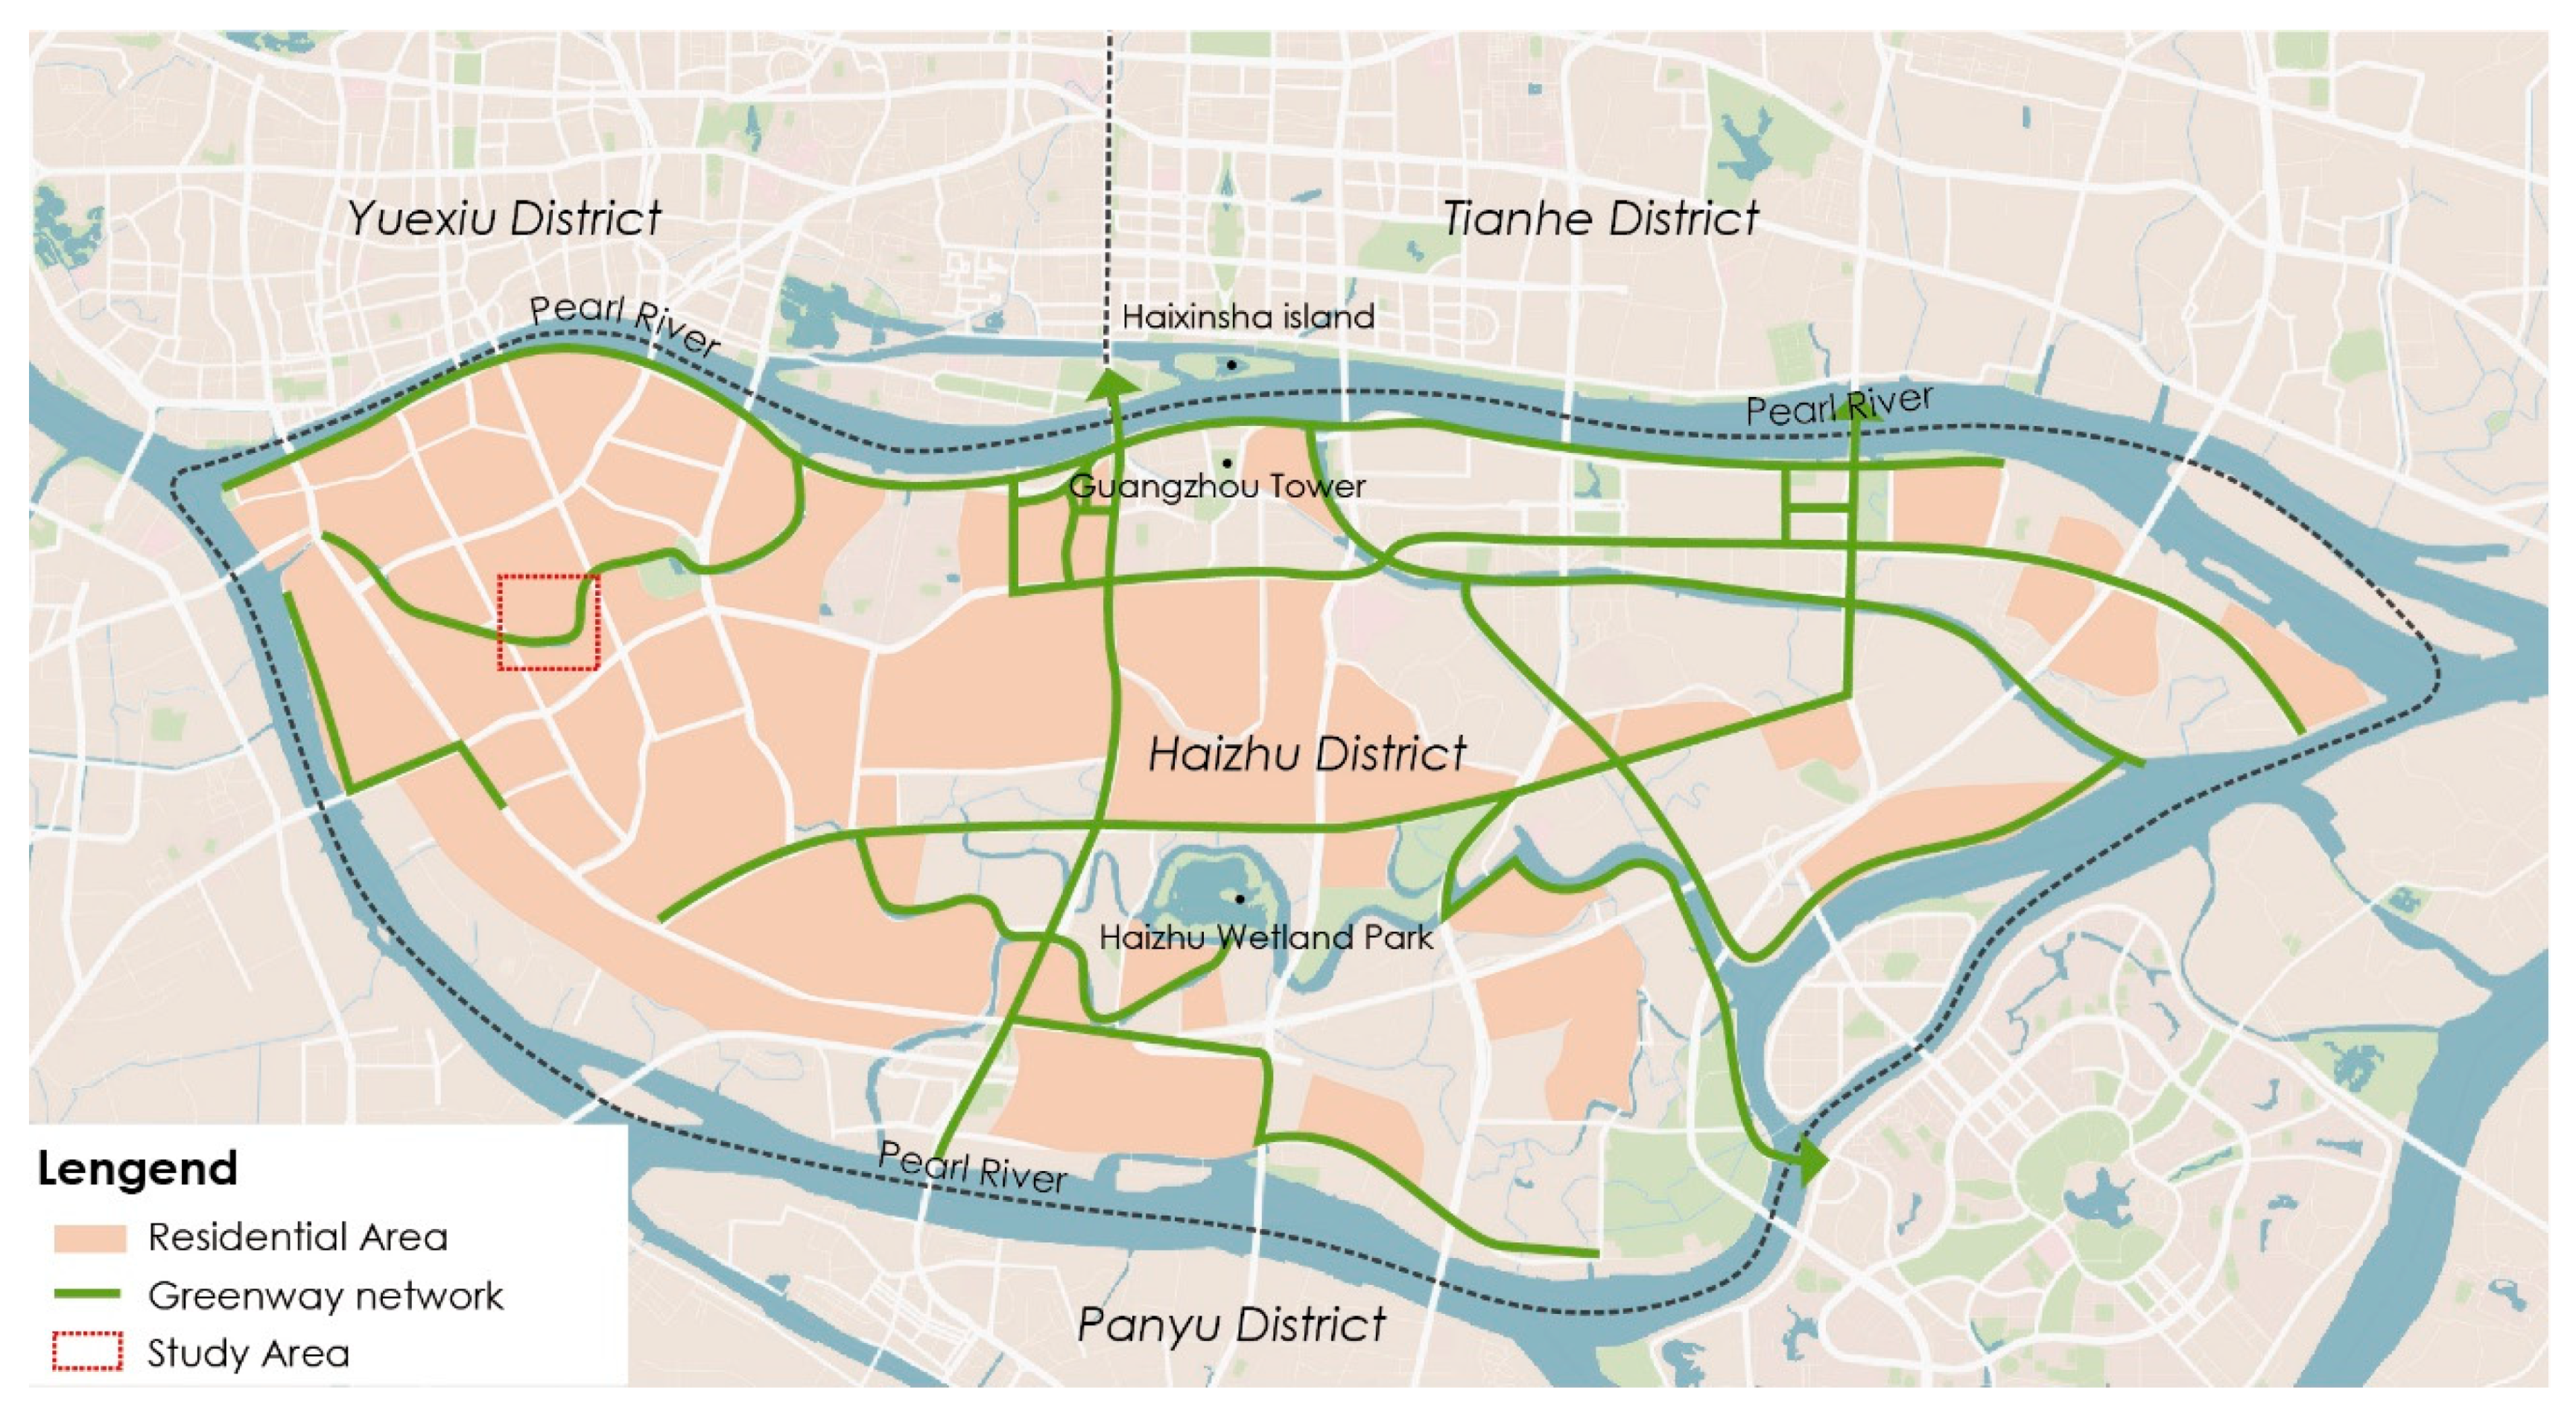
Based on the above three principles, the authors conducted a pre-study on a number of community greenways in Guangzhou, China. In the end, a community greenway along Ma River, Haizhu District, Guangzhou was selected as the research site. Haizhu District is the downtown of Guangzhou, located in the south of the Pearl River. Since 2010, Haizhu District has built a relatively complete greenway network with 170 km long [38] and is a representative area of Guangzhou Greenway. From the overlay of the Greenway Network and the residential area map, the community greenway in Haizhu district is about 34.5 km long. The density of community greenway is 0.38 km/km2. As most of the community greenways are located in the west of Haizhu District, the density in the west is 0.82 km/km2.
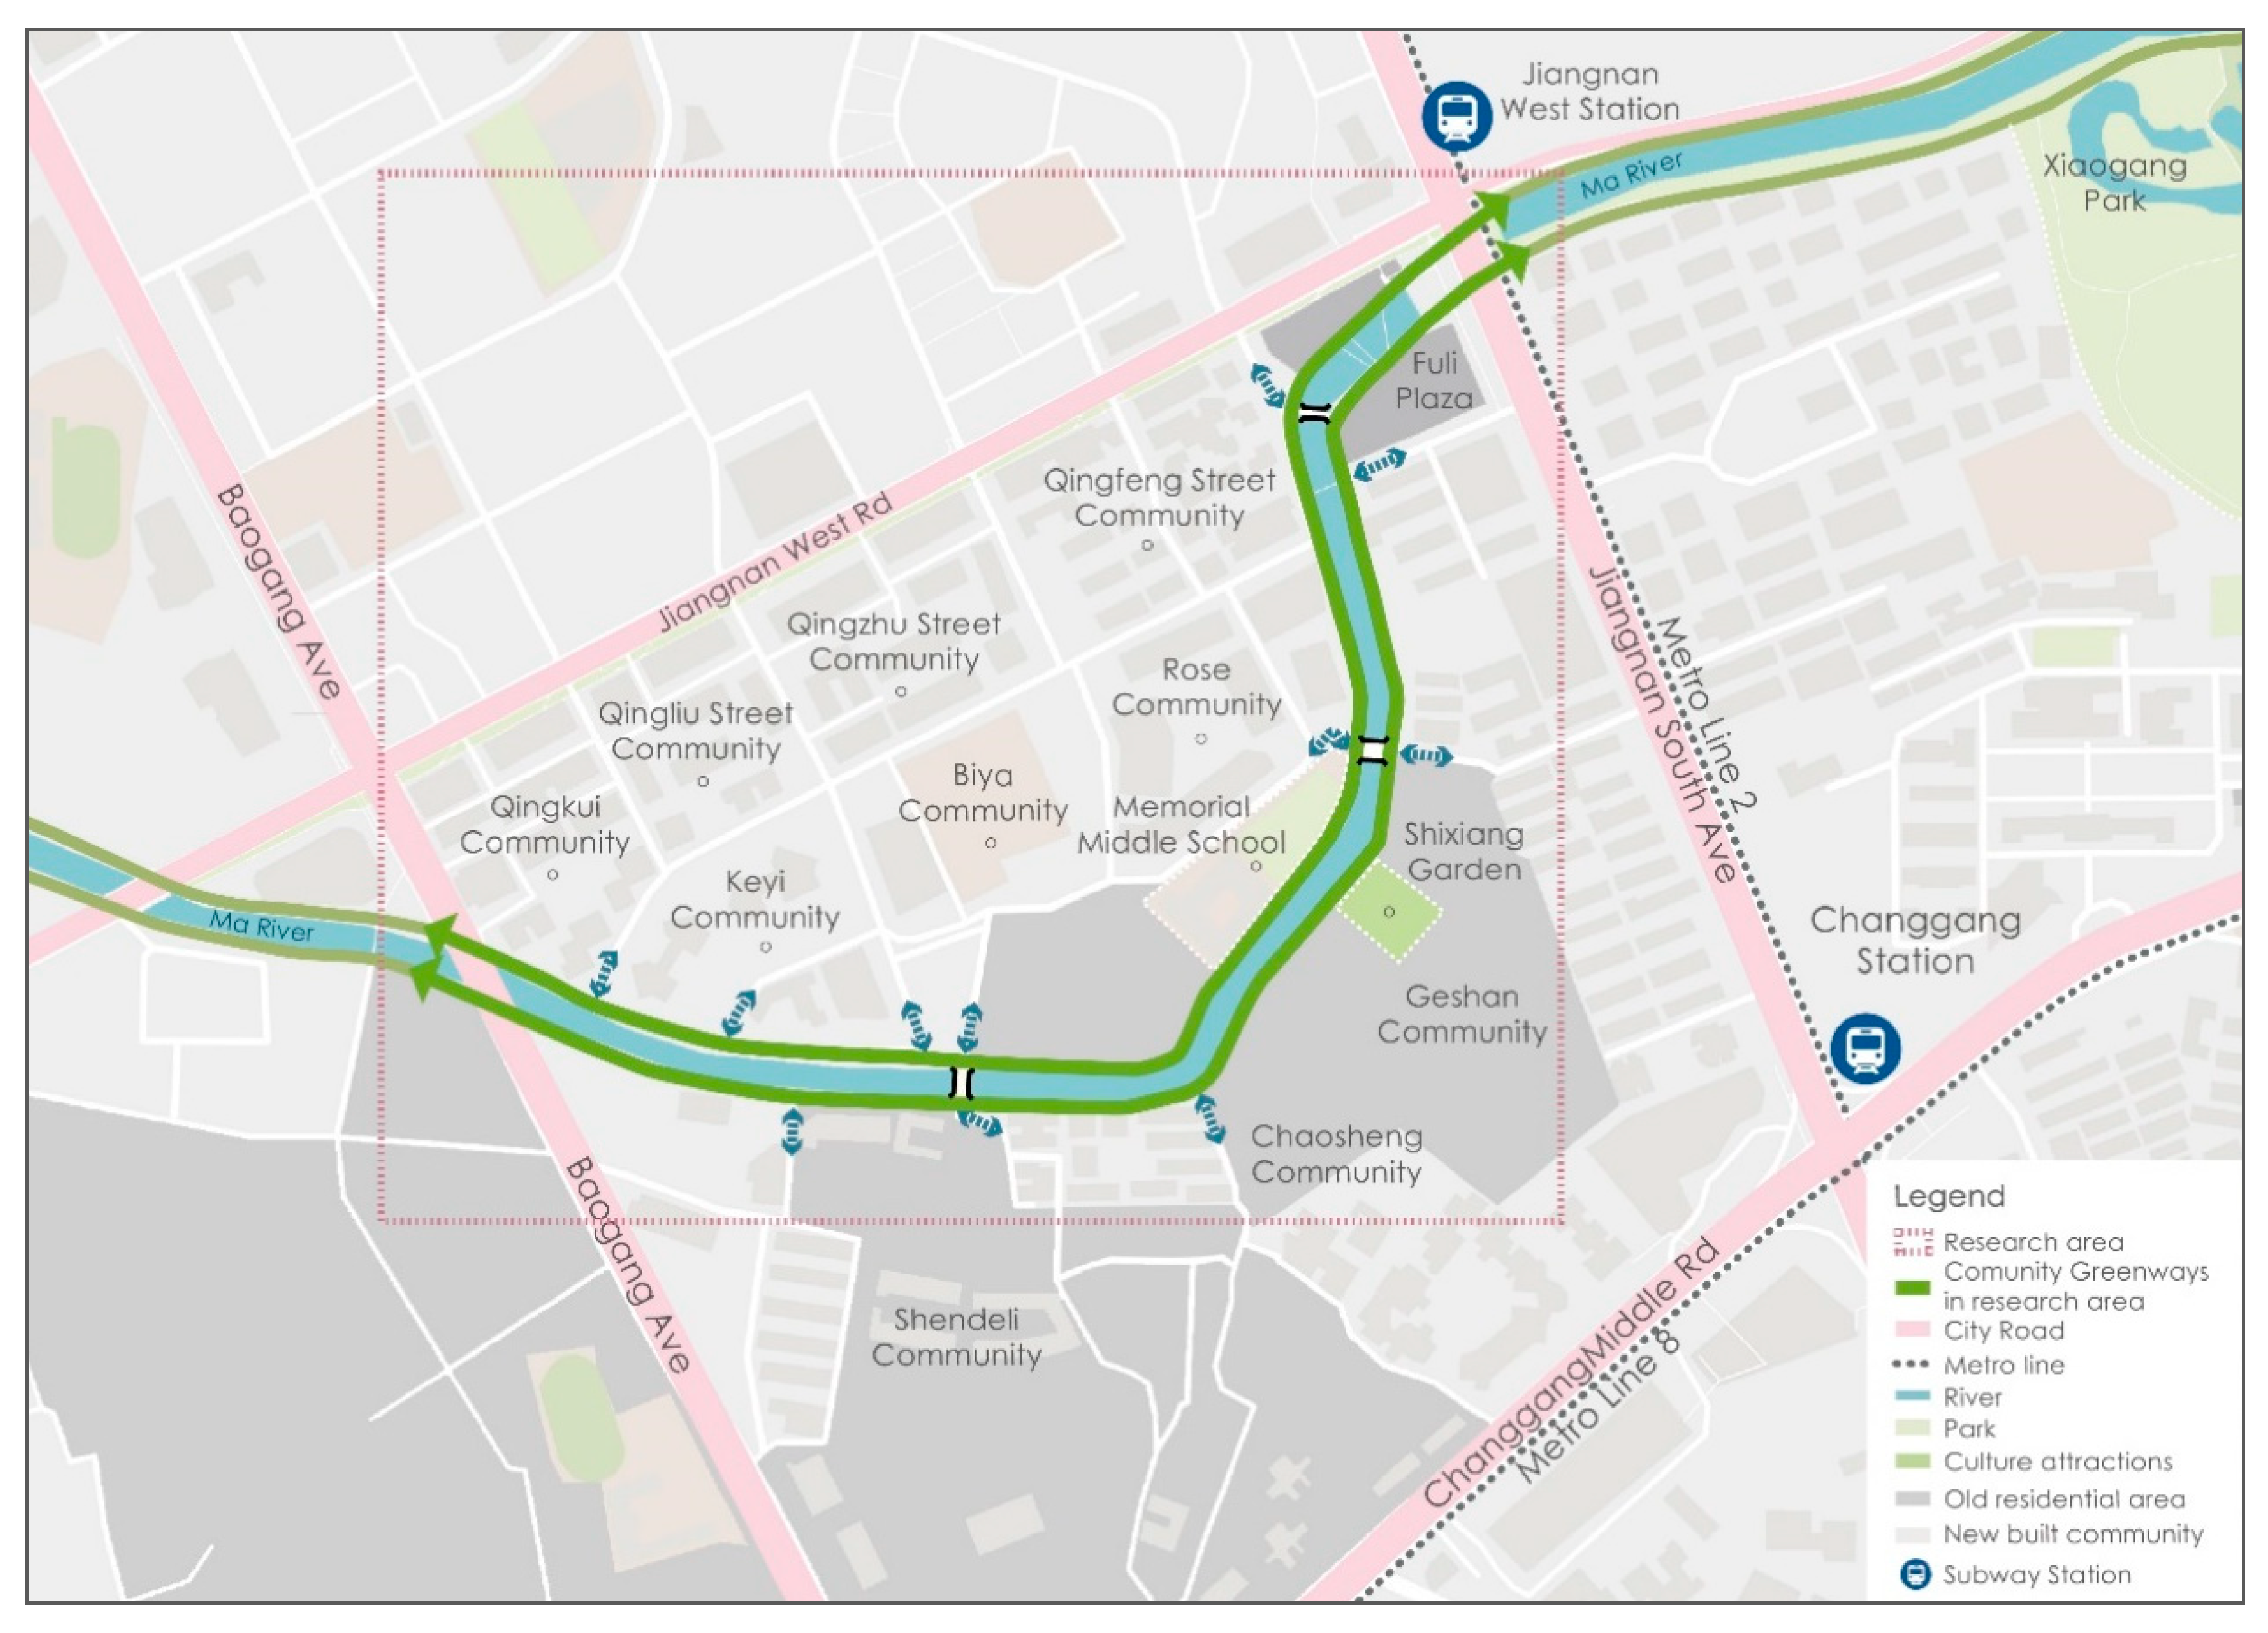
The community greenway was selected due to its connection with the Guangzhou Urban Greenway Network, its relatively recent construction (the last construction was in 2017), and its location in dense communities (Figure 2). As Figure 3 illustrates, the selected area is between two urban avenue, about 1.5 miles with a width of 1.5–5 m. Located along Ma River, the Pearl River tributary, the original vegetation is preserved well and the natural environment is in good condition. On the south bank, the residential areas are mainly crowded communities which were built on the basis of old villages, namely ‘urban village’ in China. There are five entrances for the communities. On the north bank, the communities are mainly newly built ones. The greenway is separated from the communities by walls and there are six entrances along the greenway. A parking lot was built on the north bank, serving the nearby community and with a free classical garden, the functions of the community greenway is enriched. Besides there is diverse land use around the community greenway. The greenway connects city parks, shopping malls, transportation sites and other service facilities. The community greenway was selected mainly for the reason that the nearby areas are densely populated, about 19,300 people per square mile, which makes the greenway one of the liveliest linear open space areas in the high density urban center.
2.2. Data Collection
The study started with site observation, guided by POE (Post Occupancy Evaluation) method [39]. The authors aimed to record the diverse activities on site and the relationship between activities and spaces. After that, questionnaires and structured interviews were conducted several times in January, September and October 2019, covering the daytime of both workdays and weekends by using intercept surveys. The intercept survey has been proved to be practical in previous studies on greenway research [32,40]. Two questionnaires were used during the survey. The first one was to study site demographics and usage patterns as adapted from Gehl’s theory [36]. According to the analysis and summary of the results of this questionnaire, the second questionnaire was designed for the evaluation of the community greenway. We collected data along the community greenway on October 2 and 4, 2019 respectively for the two questionnaires. The users were randomly instructed to cover diverse groups of people.
For the study instrument, the two questionnaires were used to study the demographic information, use patterns, evaluation and opinions on different construction elements. For use patterns, residents were asked how they came to the community greenway, how long it took by walking, how often they used it, how long they usually stayed and what kind of activities they did (commuting/recreation/exercising/shopping/interacting with neighbors and family members). The evaluation included the conditions of construction elements (accessibility, traffic environment, facilities, activity space, connectivity with other urban living facilities, and overall satisfaction with the community greenway) and the impact of community greenway on the daily life (transportation, leisure activity, neighborhood activity, family activity and shopping). The options provided are ‘very satisfied’, ‘satisfied’, ‘general’, ‘dissatisfied’, ‘very dissatisfied’. The items are based on previous research on greenways [13,15,24,32,41,42] and the results of observations. To learn residents’ evaluation on the importance of different construction elements, participants were asked to score the importance of factors in construction (very important/important/general/unimportant/very unimportant). Besides, the results were combined with structural interviews, recording other concerning factors.
2.3. Data Analysis
All data was analyzed with SPSS 23.0. Multivariate regression analysis was used to investigate the relationship between demographic information, time to reach the greenway, transportation and frequency of community greenway use, and also the relationship between the evaluation of status of the greenway construction and overall satisfaction, and the impact of greenways on different activities of residents’ respectively. Cross-analysis was used to study the preferences of everyday activities of different groups of community residents. In terms of residents’ evaluation of the greenway and the opinions of construction factors, first, the residents’ evaluation of the current status of the community greenway and the impact level of the greenway on everyday activities were analyzed through descriptive analysis. In addition, the descriptive analysis was used to study on how residents are concerned with construction elements, through the mean and the proportion of “very important” and “important”. The results were presented through unstandardized coefficients, SE and 95% confidence intervals (CI). P-values of 0.05, 0.01 and 0.001 were used to indicate statistical significance. Descriptive analysis was performed with reliability analysis to ensure the credibility of the results of the questionnaire.
3. Result
3.1. Site Observation
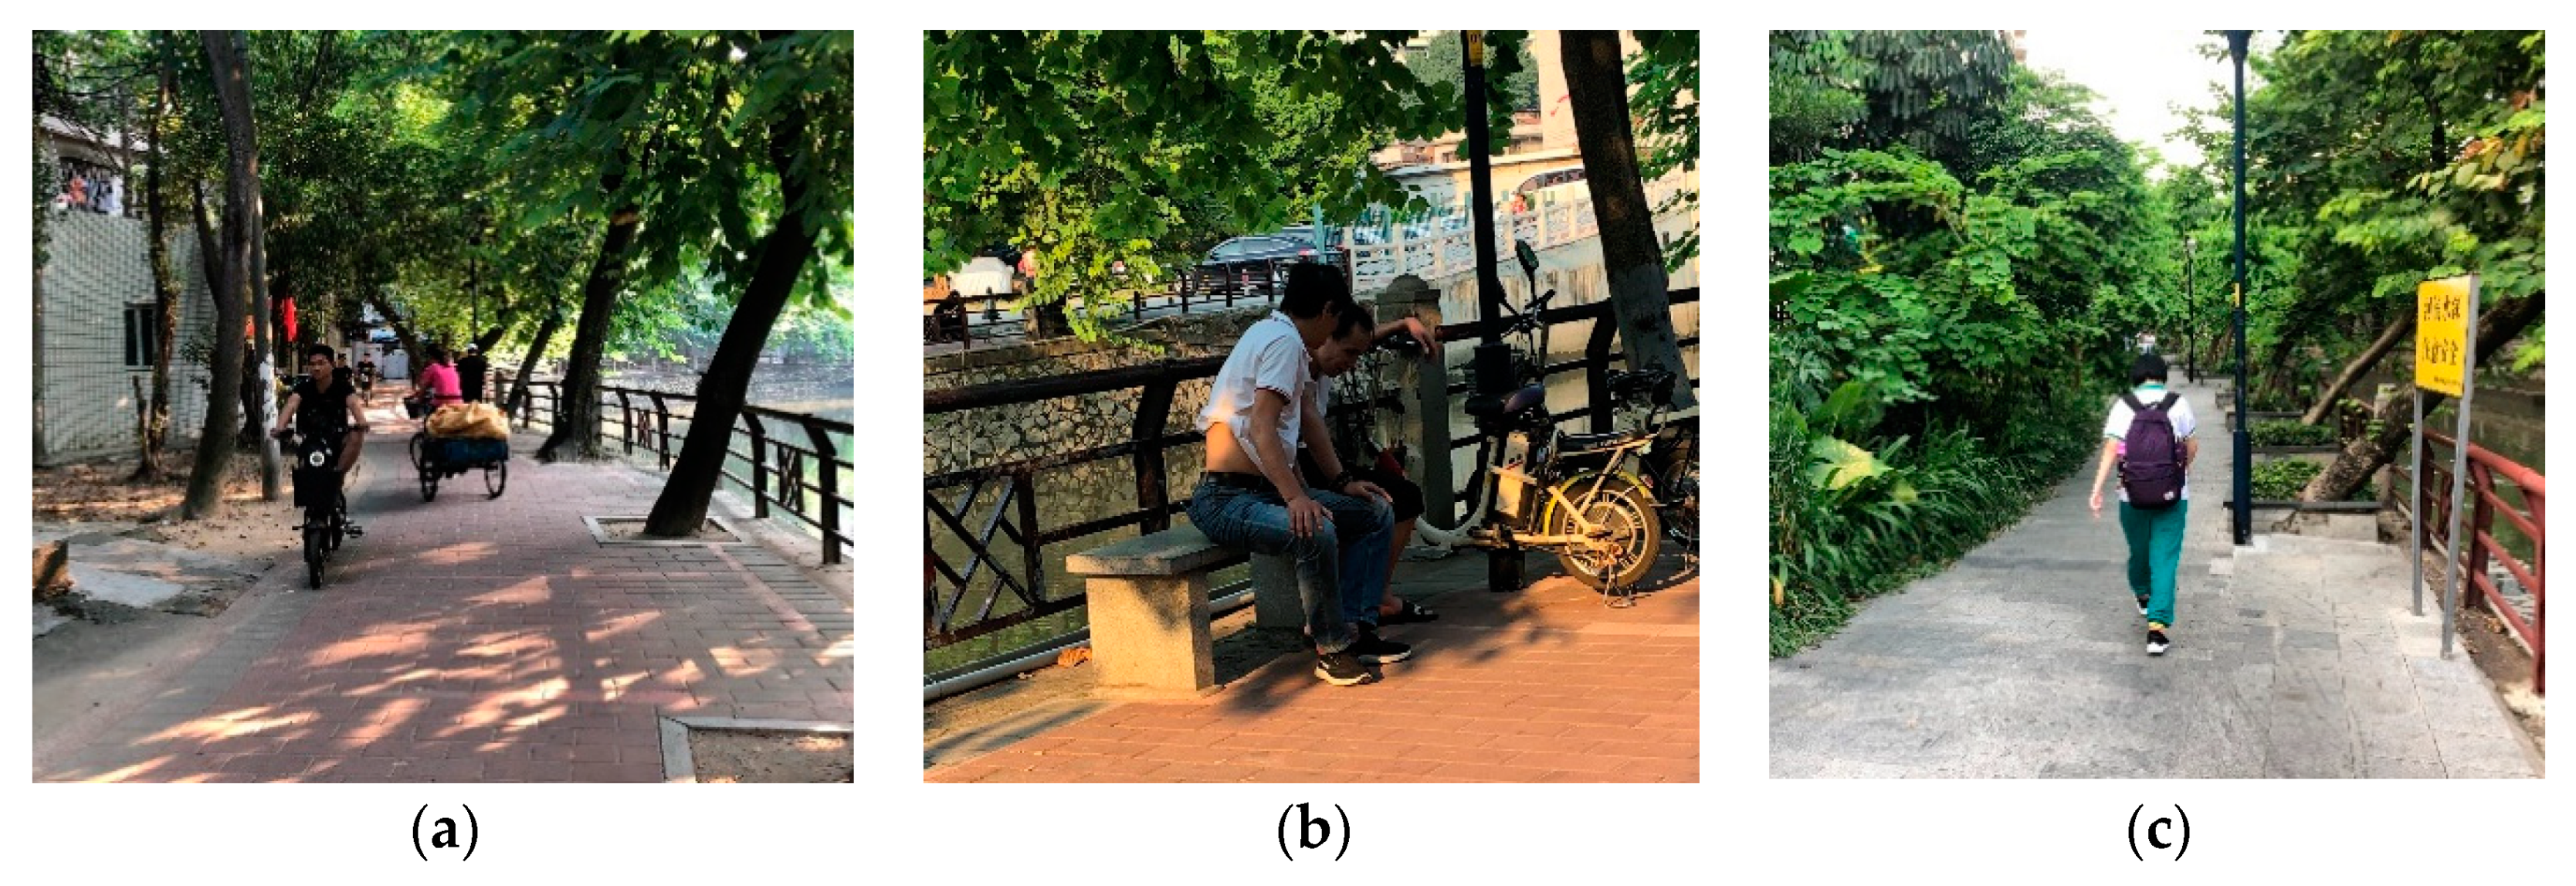
The ped and bike system is a path shared by non-motor vehicles and pedestrian, about 1.5–7 m wide (Figure 4a). There were about 20 cyclists passing in 10 min during the peak time in the afternoon, including 8 deliverymen passing with fast speed. No extra space for recreation is left for pedestrians in the narrow section where there was only 2 m width. There is no clear bicycle parking area along the greenway. Two roads cross the survey section. There are a few stone seats along the river. These seats are lack maintenance (Figure 4b). During the peak period, the seats can be used by a percentage of 100%. The greening system can be divided into two parts. The most important vegetation is the original trees kept on the banks of the river, which are lush (Figure 4c). In addition, some of the surrounding community walls are separated from the greenway by 1–2 m wide vegetation. There are very few streetlights. Neither physical exercise facility nor public toilet was found.
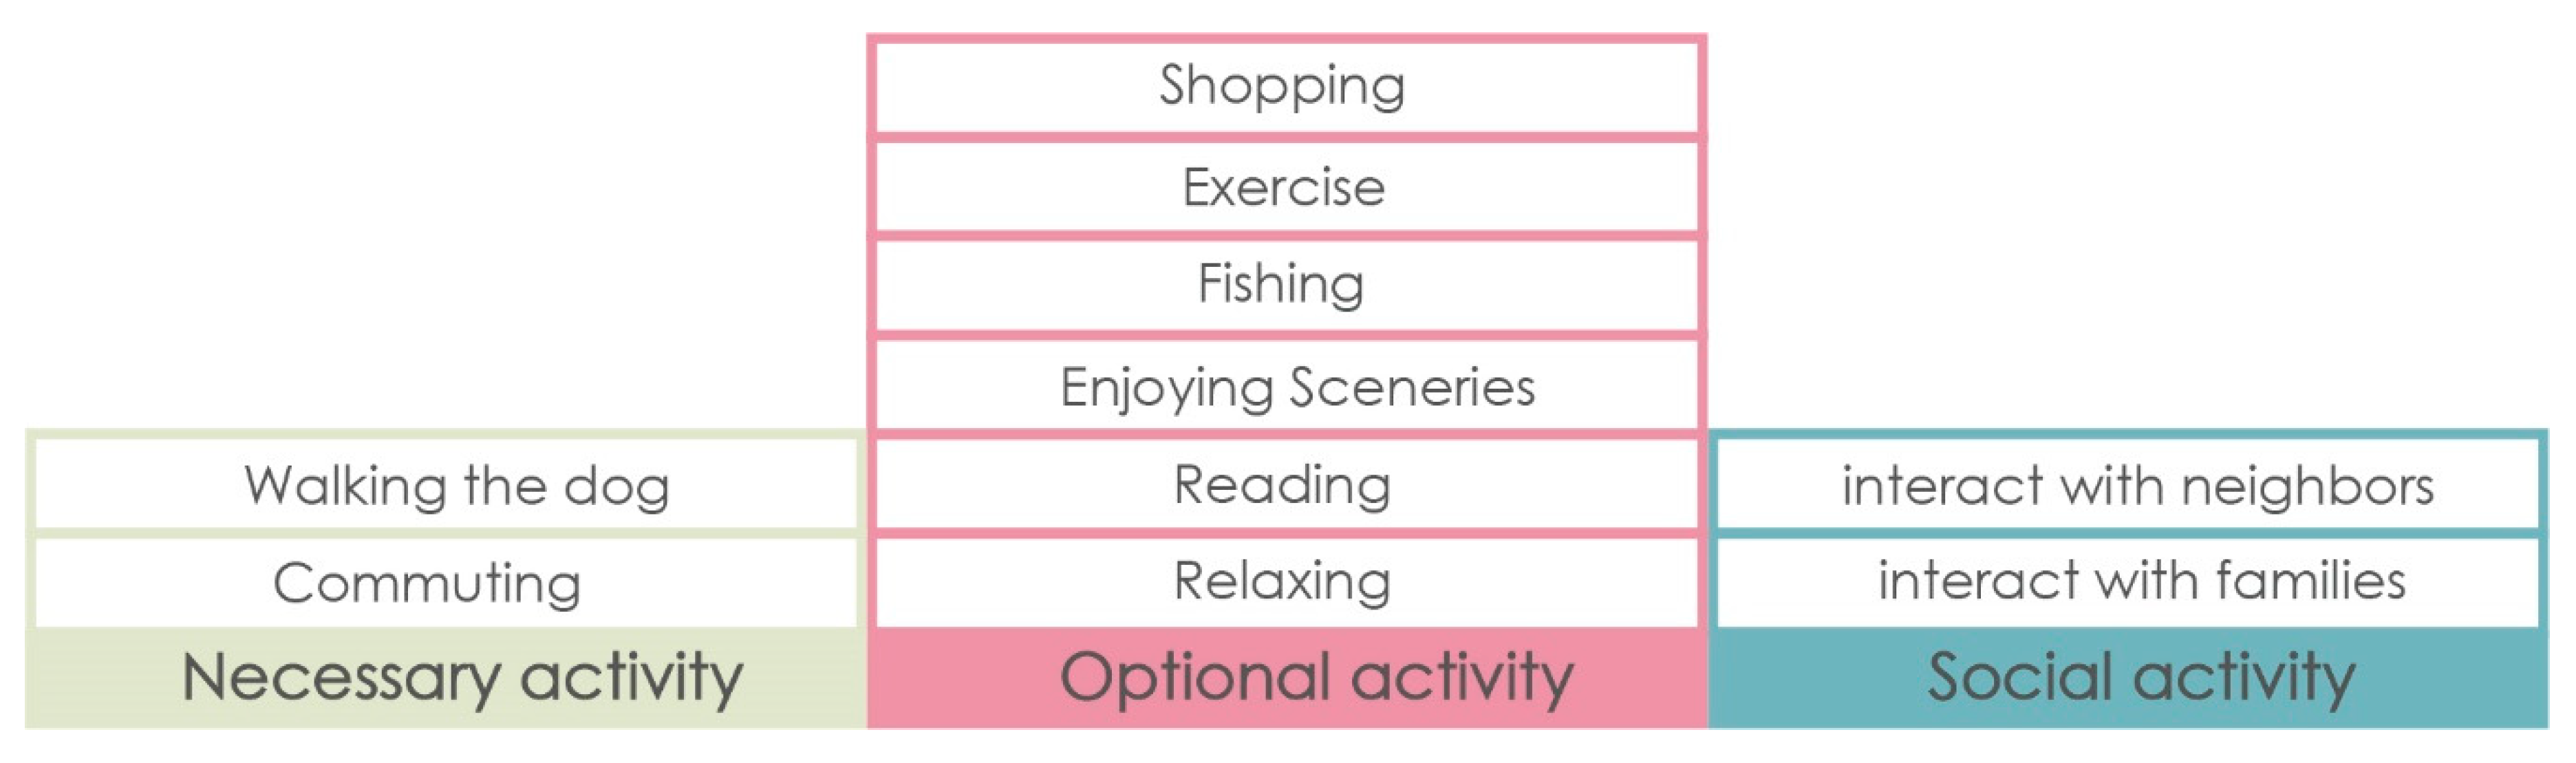
Through observation, it was found that the common activities carried out by residents were in accordance with ‘life between buildings’, which can be summarized as (1) necessary activities: commuting, walking dogs; (2) optional activities: Relaxing, reading, enjoying scenery, fishing, physical exercise and shopping at the vendors along the greenway; (3) Social activities: interacting with neighbors and family members (Figure 5).
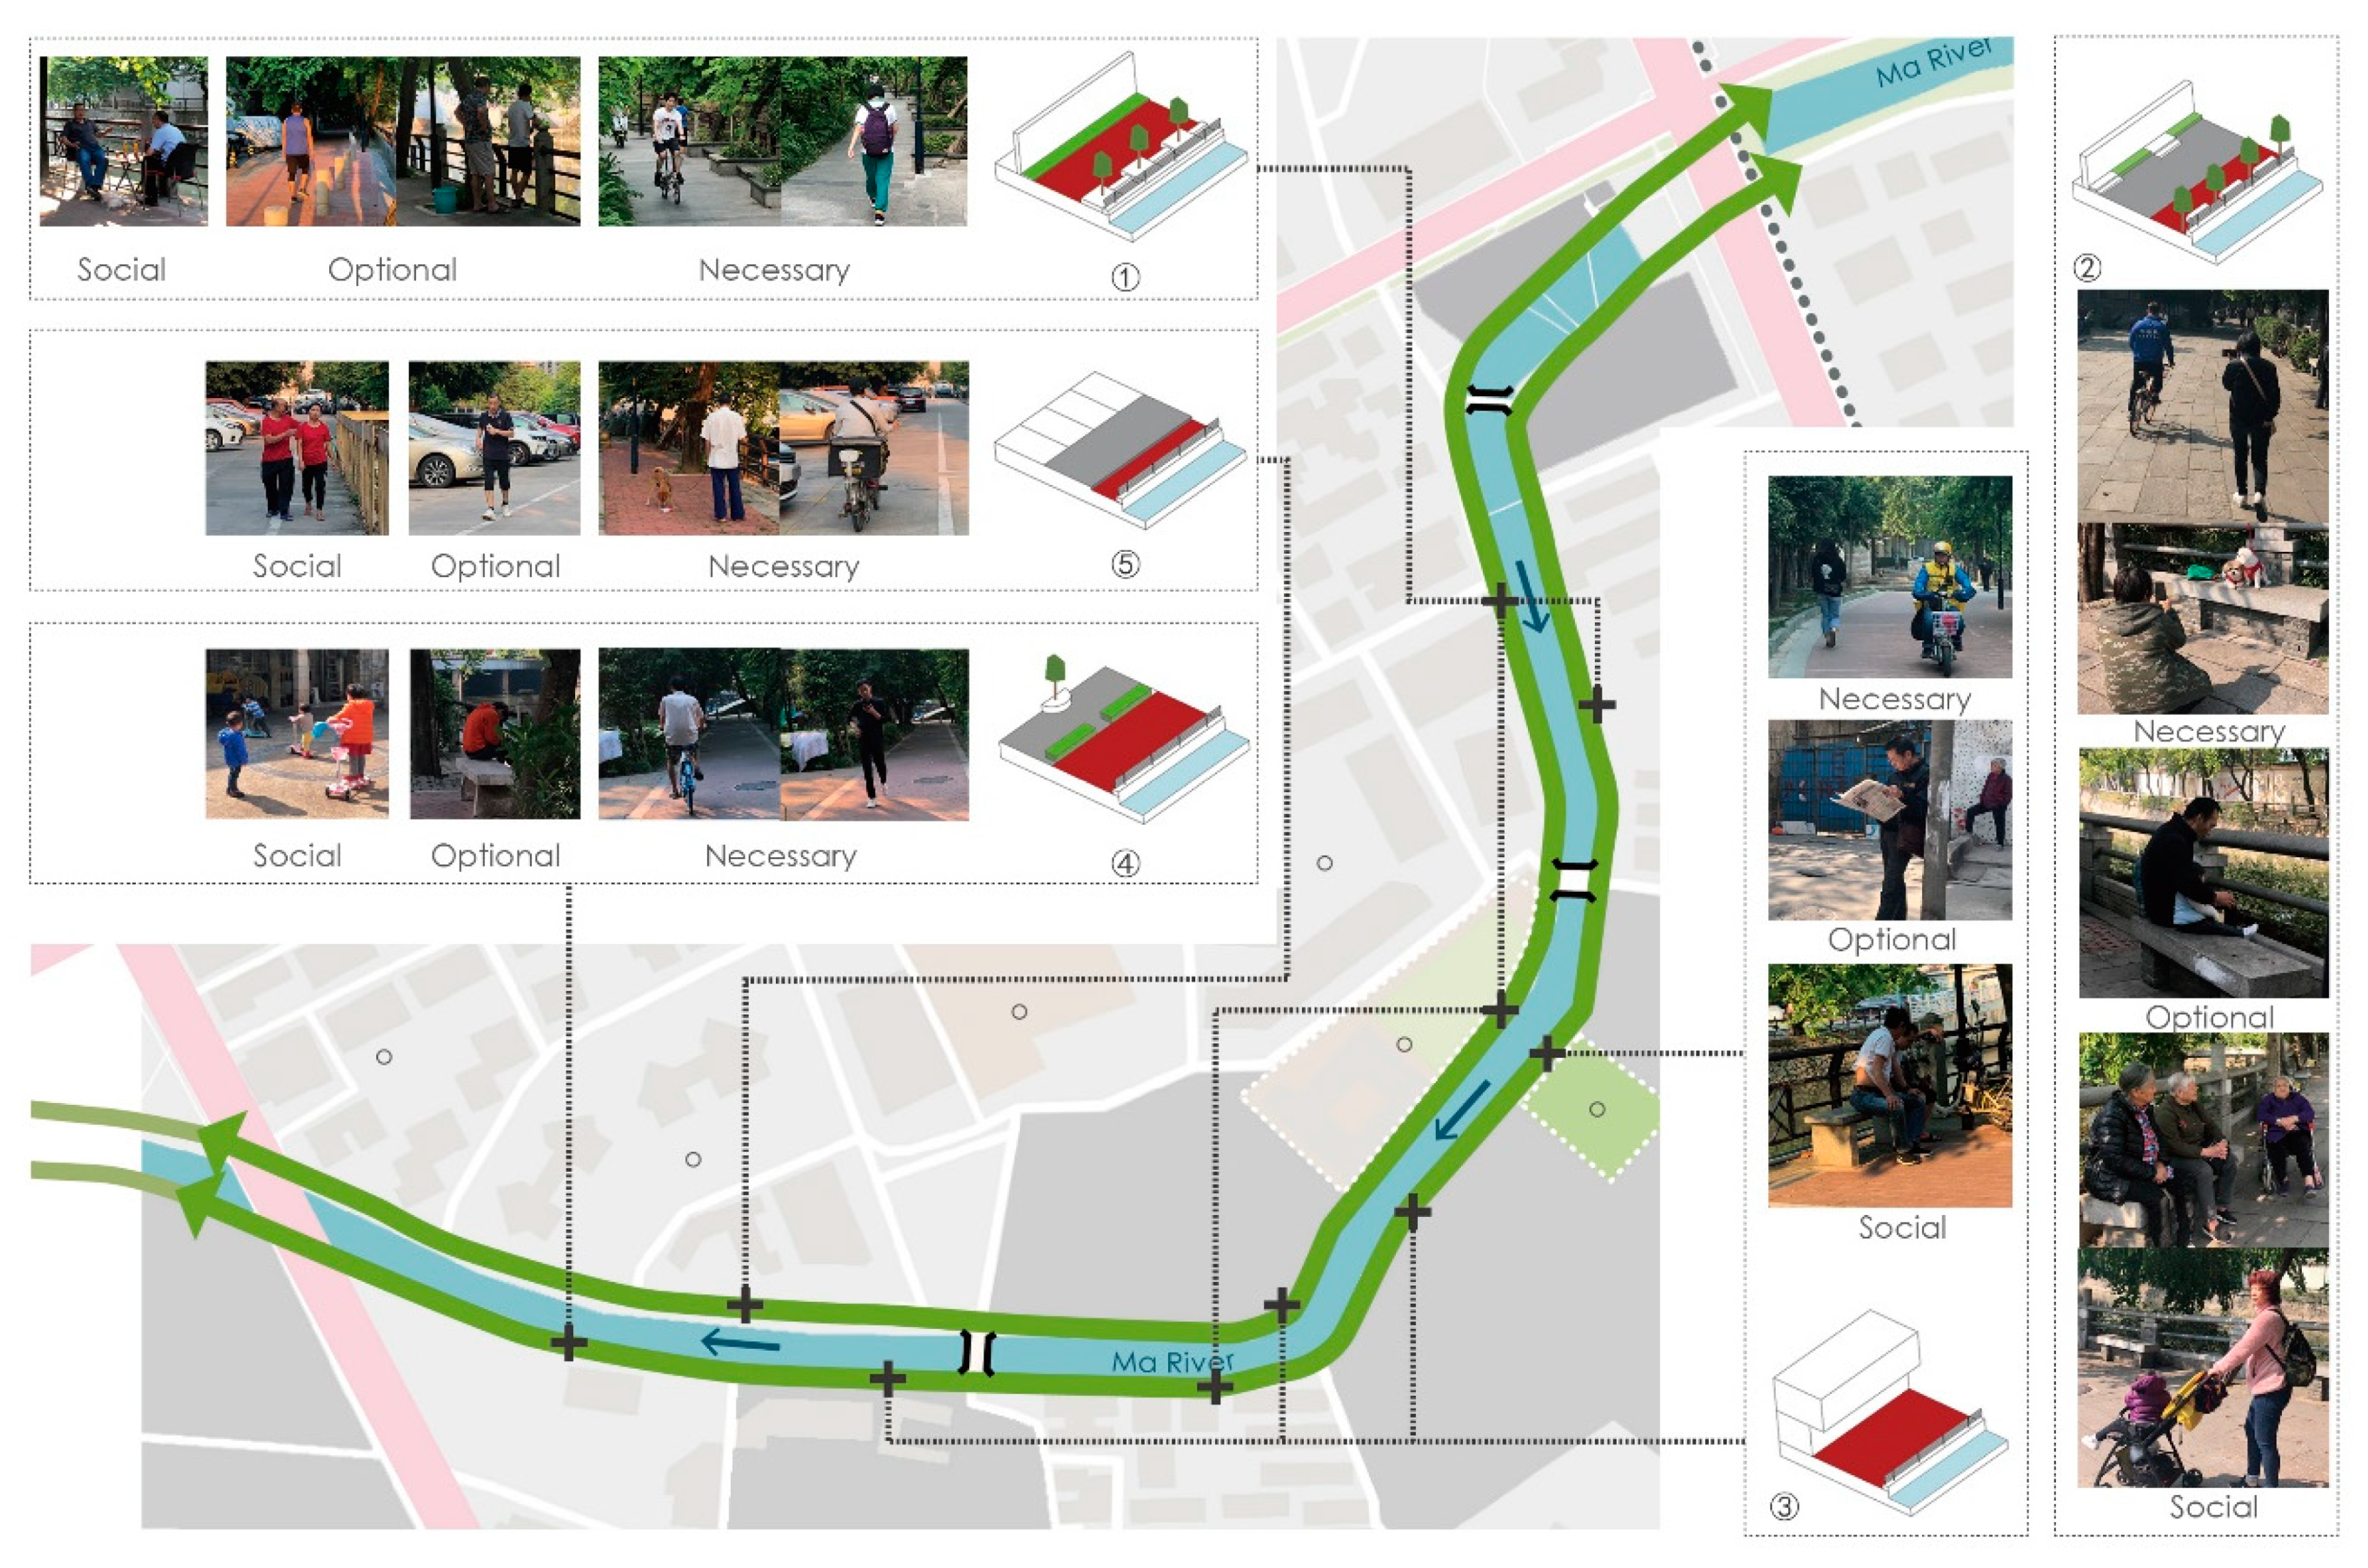
Although the space of the community greenway is limited, it can be summarized into several different types (Figure 6). The first type is the greenway space adjacent to the outer wall of the community. The greenway is 2 m wide. There is no extra space. Most people just passed by or took a walk. A few people would do physical exercise or fishing along the river. Some people chatted with neighbors by the river. The second type is the greenway crossing a small square, with a width of 7 m. People tended to do social activities here, such as being with children and chatting with neighbors. It is also a good place to sit alone, read books, or enjoy the scenery. The third type is the green space close to the open residential buildings, that is, the entrance and exit of the residential building directly facing the greenway. The greenway is 5 m wide. Most people would not stay here and they just passed by, and some sat on the bench by the river to chat with the neighbors. The fourth type is the greenway with a small garden. The vegetation in the greenway and in the garden is relatively closed, so the space is quiet. Residents liked to sit with family members or let the children play here. The fifth type is the greenway combined with the parking lot. The greenway is 1.5 m wide. However, some parking space is used as recreational space. Most people took physical exercise and walked the dog here.
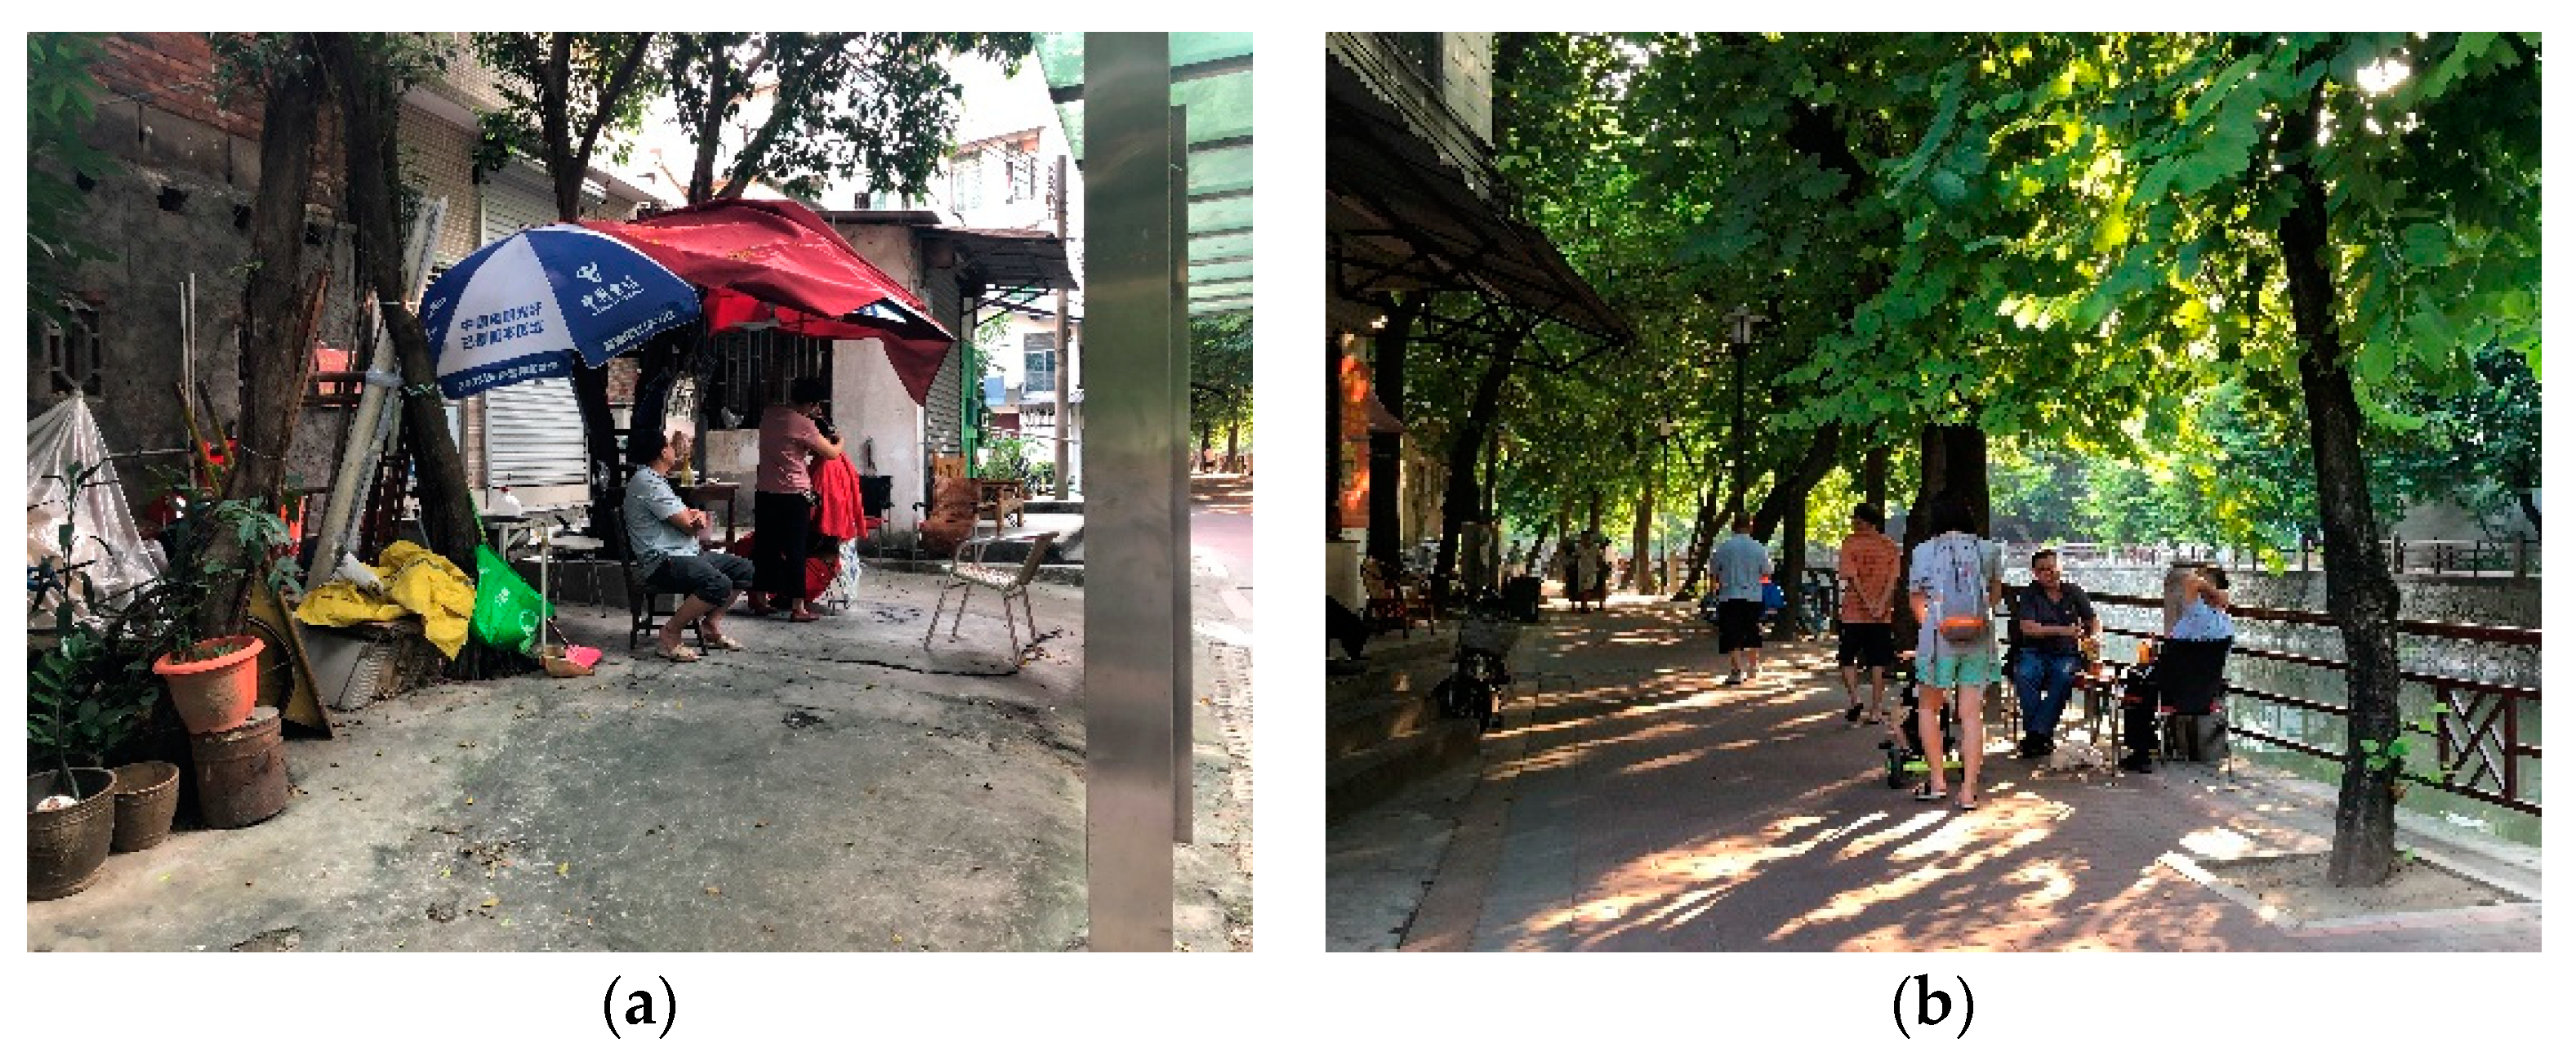
In addition to the above activities, there were also some self-organized activities along the community greenway (Figure 7), such as small vendors in the corner, clothes drying on the fence, old furniture shared by neighbors, etc. These self-organized activities showed that the community greenway, in addition to being a public space, is also a space that residents like to share private life. It is because of these creative activities that blur the boundaries between space and private life and make the space more livable.
3.2. The Daily Use of the Community Greenway
A total of 103 questionnaires were distributed in this round, resulting a 96% valid response rate (depending on the completion of all the questions and whether the respondents were nearby residents). We try to avoid the non-response bias through random sampling during the survey.
3.2.1. Demographics
From Table 1, the male to female residents participating in the survey was close to 1:1, which reflected to some extent that there was no significant difference in gender among the community greenway users. We observed that users of the greenway were diverse in age distribution. It should be noted that the proportion of people aged 56 and over was relatively large, accounting for 45.4%. In China, the legal retirement age for most people is between 50 and 60 years old [43,44], therefore, it can be initially determined that such people represented the retirement group. For the job status, the proportion of students was smallest (4%), and there were no significant differences of other groups. In the education level, the number of users with junior high school, high school, secondary technical school and vocational education level was 48.5%, and that of junior college and undergraduate students was 31.1%. The income level of most greenway users was 2001~10000 RMB (70.7%). According to the National Bureau of Statistics’ interpretation of 2018, this interval can be understood as a medium level. From the statistics of residential streets, the vast majority of participants (91.8%) come from areas that are no more than 0.5 mile away from the community greenway, further indicating that the users of the community greenways are mainly surrounding residents.
3.2.2. Use Patterns
From Table 2, walking was the most common way to come to the community greenway for everyday activities (84.9%). It was observed that quite a few people ride bicycles, but these people usually would not stay. Overall, 74.7% of the users lived within a 10-min walk, and 11.2% of the users lived in communities more than 20 min’ walk from the greenway. 59.6% of users reported that they came to the community greenway at least once a day for leisure or other activities. About one-fifth of the users would not stay in the community greenway, and 78.8% of the users stayed in the community greenway for a period of time. In terms of user activities, 40.4% of users used community greenways for necessary activities, mainly as a traffic road. At the same time, most users (91%) used community greenways for optional activities such as leisure activities (36.4%) and physical exercise (54.6%), and some residents (8.1%) chose to shop at small vendors in the community greenway. In addition, in social activities, users interacted with family and neighborhoods.
Multivariate regression analysis was used to study the relationship between gender, age, job status, education level, monthly income, transportation, time to reach the greenway, duration of use and the frequency of use (Table 3). According to the judgment basis of p < 0.05, the findings indicate a significant relationship between the frequency of use and age (β = −0.383, 95% CI is −0.399–0.092, p = 0.002), transportation (β= −0.207, 95% CI is −0.675–0.005, p = 0.047) and the time to reach the greenway (β = 0.411, 95% CI 0.205–0.538, p = 0.000). The regression results showed a negative correlation between age and frequency of use, that the older the person, the less frequently they used the community greenway. There was a negative correlation between transportation and frequency of use. Somehow there was a positive correlation between time to reach and the frequency of use. No significant correlation was found between the above factors and the duration of use (p = 0.68 > 0.05).
3.2.3. Activity Preferences of Different Groups of People
From the results of the cross-analysis (Table 4), we can see the diversity of activities of different groups of people in the community greenway. In terms of gender, the proportion of males who exercised in community greenways (60%) was relatively high, while the proportion of women interacting with family, neighbors and friends (14.29%) was significantly higher than that of males (4%). From the perspective of age, young people tended to use the greenway for daily traffic (62.5%) while seldom for other activities (25%). A larger proportion of middle-aged and elderly people used the community greenway for optional and social activities. The elderly who were over 66 years old in the community greenway tended to do more optional (52% leisure activities, 68% physical exercise) and social activities (12% interaction with family and neighbors). While only 24% of elderly people took the greenway as traffic paths. The activities taken by residents in different job status verified the analysis of the age groups. The students mainly used the community greenway as daily passages, and the employers used it mainly for both necessary and optional activities. Retired people mainly carried out optional activities, while those who were unemployed had the highest proportion of social activities (20%). The housewives in this group accounted for a high proportion, and the main activity was to care for kids. From the influence of education level on activity, the choice of social activities (20%) mainly came from the primary school and below, mainly unemployed female and elderly people, corresponding to the above analysis of job status. For the influence of income, the users of the community greenway are mainly medium-level (2000~10000 RMB), among which the higher proportion of people in the income level of 5001~10000 RMB (59.26%) chose sports activities, and also this group had the highest proportion to shop at the vendors along the greenway (18.52%).
3.3. The Evaluation of the Community Greenway
The residents’ evaluation of the community greenway included three parts, which were the residents’ evaluation of the current status of different factors of the community greenway, the impact level of the community greenway on the residents’ daily life and the importance level of the community greenway construction factors. The total reliability of the questionnaire was 0.797, which was relatively high.
The Evaluation of the Current Community Greenway and Its Impact on the Residents’ Everyday Life
From Table 5, we can see accessibility scored the highest (4.19) in the status quo evaluation, and most people expressed satisfaction with the accessibility of the greenway (88%). The most dissatisfying factors was service facilities (2.97), and 76% of residents chose ‘generally’ or ‘dissatisfied’. “There are no benches to sit and no shelter for rain. You know, the elderly need benches” “I think there is a need for public toilets here, otherwise it is very inconvenient to come here for exercise.” “The lights are too dark at night, I can’t see the rubbish on the road, and I would not take my kids here.” Residents were relatively satisfied with other aspects. The results were 3.83 for the connection with the urban living facilities, 3.58 for the traffic environment, 3.33 for the type and amounts of the activity space. The overall satisfaction was 3.65, and 55% of residents expressed ‘satisfied’ with the community greenway. From the evaluation of various factors and the overall satisfaction of community greenways (Table 6), there is a positive correlation between the type and quantity of activity space and overall satisfaction (β = 0.443, 95% C.I. = −0.222–0.631, p = 0.000).
The results of Table 5 indicate that the community greenway has significantly improved transportation (3.78) and leisure activities (3.66), and the results show that the community greenway increases the chance of interacting with neighbors (3.26) and family (3.31). The business activities in the greenway were a minority, but they also improved the lives of community residents to a certain extent (2.92). Through multiple regression analysis (Table 7), the construction status of some aspects of the greenway were related to the improvement of the daily life. When the greenway was connected to the surrounding market, shopping malls or parks, the greenway had more obvious improvement for daily transportation (β = 0.504, 95% C.I. = 0.411–0.862). Service facilities were associated with more neighborhood interactions (β = 0.332, 95% CI = −0.096–0.631) and family interactions (β = 0.391, 95% CI = 0.186–0.761), while the community greenway traffic environment had a negative correlation with family interactions (β = −0.257, 95% CI = −0.654–0.073).
3.4. The Scoring of Importance Level of the Community Greenway Construction Factors
In the evaluation of the importance of different factors relating to everyday activities in the construction of the community greenway (Table 8), sufficient service facilities scored the highest (4.11), and 81.66% of the residents considered this aspect ‘very important’ and ‘important’. Accessibility (3.58), separation of walking trails and bicycle trails (3.66), diverse activity spaces (3.60), and the connection of urban living facilities (3.78) were not much different. Residents generally believe that these construction factors all had an important position in the construction of community greenways.
In addition to scoring by scales, residents also expressed some opinions on the community greenway and the construction suggestions, including the deep discussion of the issues involved in the questionnaire, as well as the content not covered by the questionnaire.
The natural environment was an issue of concern:
“The river needs to be cleaned up, because sometimes it smells bad, and it attracts a lot of mosquitoes.”
(A retired old man, 60 years, about 5 min from home to the community greenway)
“The greening is very lush, but it takes up too much space. I think some vegetation can be reduced so that there would be more space for activities.”
(A staff, 48 years, about 5 min from home to the community greenway)
Although the current space for activities is limited, residents understood this condition. At the same time, they tried to expand the space through innovative use and time-sharing of the community greenway:
“I would exercise in the parking lot before 6:00 in the morning. The space is relatively spacious and there is no vehicle interference at that time”
(A retired old man, 81 years, only 3 min from home to the community greenway)
For the daily activity environment of the greenway, residents generally believe that the greenway needs a safe and comfortable environment. Many residents complained about the current situation:
“The flatbed trucks that transport goods back and forth are too noisy and threaten the safety of passers-by.”
(Housewife, 53 years, 8 min from home to the community greenway)
4. Discussion
4.1. The Service of Community Greenways for Different Activities
Like other urban greenways, the community greenway serves various activities. In this study, daily traffic (40.4%), leisure activities (36.4%) and physical exercises (54.6%) are the major activities. From the classification of the activities (Figure 5), it is concluded that necessary activities and optional activities are more important in the community greenway. To further analyze, different groups of people showed specific preference for activities. For example, males prefer exercise while females choose social activities more than males. This result is contrary to the previous study, which concludes that exercising was a stronger motivation for female [32]. The reason could be that in China, a large part of females prefer group dancing as a kind of exercise while in community greenways, there is limited space for this kind of activity. The social activity is an important activity for females because most retired females in China would take care of their grandsons and granddaughters, and the community greenway is a convenient open space for childcare. Different from other groups, young people mainly take the community greenway for commuting (62.5%) rather than leisure activity (18.75%) and physical exercise (37.5%). It is likely because of the lack of recreation facilities [27]. This could be an issue to be considered when constructing community greenways.
From Table 5, the most obvious improvement of the community greenway lies in necessary activity (3.78). Optional activity and social activity rank the second and the third respectively. The ranking corresponds to the status evaluation of the community greenway (Table 7). As there is positive relationship between the connectivity with other urban living facilities and transportation convenience (β = 0.504, 95% C.I. = 0.411–0.862) and between the service facility and neighborhood communication (β = −0.257, 95% CI = −0.654–0.073). It reflects to some extent that the convenient transportation is due to the connectivity with other urban living facilities. While the relatively weak improvement of social interactions is because of the lack of service facilities. Public space is the carrier of social interaction [45,46], as residents have shown intentions to connect with others in open spaces [47]. From this result, the improvement of service facility could be a way to increase social connections.
4.2. The Service of Community Greenways: Everydayness and Public Nature
The functions of a greenway have a lot to do with its location [29,32]. As a type of urban greenways near the residential area and even deep into the community space, community greenways are closely related to the everyday life of residents. The “everydayness” aspect is reflected in that community greenways mainly serve nearby neighborhood and residents tend to travel shorter distance, resulting a high-frequency use of the space. From the result of the study, we can infer that at least 90% of the users are from the surrounding communities within 1 mile. This result is consistent with a study of Denmark which showed that 84.7% of the users lived within 1000 m of green spaces [48], and the study of Turkey showing that 79.8% of the users live within 1000 m of the greenway [13]. Compared with “local trails”, the data means community greenways have a smaller serving area, which shows that for nearby residents, community greenways tend to be the best choice for outdoor recreation [29]. For the frequency of use, more than half of the participants (59.6%) use 7 or more community greenways a week, consistent to Akpinar’s result include that 55.4% of the users use the greenway daily [13]. Compared to a study of greenways in Shenzhen, which results that 41.5% of the users come from a distance within 1000 m and only 32.9% of the users use the greenway daily [9], community greenways promote more frequent use and activate the urban greenway network. “Public nature” is reflected in that the community greenway carries public activity, including the necessary activities (commuting, walking dogs, etc.), optional activities (enjoying the scenery, relaxing, fishing, reading, running, cycling, walking) etc.) and social activities (be with family members or neighbors, etc.) (Figure 5). In previous studies, demographic variables like gender, age, income, education level could be constraints of the use patterns of greenways [13,24]. The results of this study showed that in community greenways, users of different groups of people did not have much difference in demography information, although specific groups chose activities with their own preferences. That is to say, in general, community residents can enjoy the community greenway equally. The reason could be that as community greenways mainly serve the surrounding residential areas, residents don’t differ much in social class. Another reason is that, in developing countries, all residents could freely visit and share the public spaces [9]. That is to say, community greenways promote social equity, especially in developing countries. On the other hand, community greenways also enrich the meaning of “everydayness” and “public nature” by holding everyday activities. For example, the residents use the fence in the greenway to dry clothes, or to take the furniture out to form a space gathering with neighborhood. These private activities interpret the “everydayness” from the perspective of everyday life, while the business activities in the corner add functions for leisure space, expanding the meaning of ‘public nature’ of community greenways. Above are the self-organized tactics of residents, showing the creativity in the community greenway, making up for the designer’s strategy for the public space [37]. This shows the community greenways are closely related to the everyday life of the residents. The community greenway should not be simply regarded as leisure space, or many potential functions would be neglected.
4.3. The Service of Community Greenways: Improving the Quality of Everyday Life
The results show that it is widely believed that the easy accessibility of community greenways increase use, consistent with the conclusions of previous papers on greenways near the residential areas [13,15,49]. Better accessibility attracts people to use the greenway with more frequency, thereby improving people’s quality of life by providing a good natural environment and social environment. In this study, users take transportation improvement and more outdoor recreation activities as the two main impacts on life. That is because, community greenways connect neighbors with shopping malls, workplaces so that the daily traffic becomes more convenient. Health benefit brought by leisure activities, physical exercise has been proved to be the most significant contribution to the users [15], and that explains why recreation use is considered one of the important functions by residents [22]. Urban greenways can be seen as the best public spaces for daily leisure, alternative transportation, and for face-to-face communication between residents [15], and from the above analysis, we can say that community greenways play a bigger role in the residents’ life.
However, there are some limits of community greenways contributing to the life of residents. The community greenways are often reconstructed on the basis of the original trails. They have limited space but have complex functions at the same time. Therefore, conflicts in activities are prone to occur. For example, the transportation conflicts reflected by residents in the interview. In previous study, residents also expressed concern about community greenways, such as noise and interference caused by people walking the dog [23]. On the other hand, the use of parking lots for residents to exercise also reflects the lack of space for activities. In addition, the lack of facilities has also become a factor limiting residents to use community greenways [18].
Balancing artificial and natural environments in a high-density built environment is a huge challenge [18]. Therefore, the construction of community greenways should take into account the relationship between different activities and meet the needs of residents’ activities through the transformation of space and new innovations, so as to give full play to the contribution of community greenways to residents’ lives.
4.4. Limitations of the Study
We acknowledge several limitations for this study. First, the study focused on a representative community greenway in Haizhu District of Guangzhou. The results should be verified in more case studies in other regions. Future research should sample community greenways in other regions and compare the results to get a better understanding of how community greenways serve residents in different social contexts. In addition, investigation time was between 9:00 am and 18:00 pm during the day, not including the morning and evening time. Although the previous research on the greenway or public space did not indicate the impact of the research time on the research results [15,32,46,50]. In the interviews, the author found that a considerable number of residents like to go to the greenway in the morning or evening, so the survey may ignore people at these times.
The study classified the service of community greenways into three aspects: respectively for necessity activities, optional activities and social activities, and studied how community greenways serve the three types of activities through self-report of residents. Whether there is any correlation among these aspects still needs more research. The future research can quantify the relationship of community greenways and residents’ life by constructing the relationship model with the three aspects, and to study the weight coefficient of each aspect in the overall relationship between community greenway and the resident life.
5. Conclusions
Community greenways, which is next to or pass through high-density residential areas, is one kind of greenways that is most closely related to people’s life. This study attempts to identify the use of community greenways. The activities in community greenways include commuting, walking the dog, shopping, exercise, fishing, enjoying sceneries, reading, relaxing, interacting with neighbors or family members, which can be divided into necessary activities, optional activities and social activities. From the results, necessary activities and optional activities are the main activities, and are also the most obvious improvements that the community greenway brings to residents’ life. Community greenways have two main characteristics: everydayness and public nature. The everydayness is due to its convenience to the nearby communities and high frequency of use. The public nature means that community greenways are inclusive for different users and activities. The results show that, demographically, there is not much difference in the proportion of various groups of users. Community greenways contribute to social equity especially in developing counties as residents can equally enjoy the open space. The users are relatively satisfied with the community greenway as a space for daily transportation, recreation, social interaction and so on, while some lacks also arise from the evaluation from the users. The main lack is service facilities. The results imply that it is a reason that constrains social connections. Therefore, to give full play to the advantages of the community greenway, urban planners and landscape designers should give more attention to the above aspects. If these problems can be effectively communicated and resolved, community greenways will better serve the life of residents.
Author Contributions
W.C. and G.L.; Data curation, W.C.; Formal analysis, W.C.; Funding acquisition, G.L.; Investigation, W.C.; Project administration, G.L.; Software, W.C.; Writing—original draft, W.C.; Writing—review and editing, G.L.
Funding
This research is supported by the National Natural Science Foundation of China (Grant No. 51678242 and No. 51761135025).
Acknowledgments
Many thanks to the help from Jiacheng, Li who majors in mathematics, and Jing, Wu, and Tianyu, Gao, friends who give suggestions to clarify and improve the paper. Their effort was highly appreciated.
Conflicts of Interest
The authors declare no conflicts of interest.
References
- Little, C.E. Greenways for America; Johns Hopkins University Press: Baltimore, MD, USA, 1990; p. 1. [Google Scholar]
- Kambites, C.; Owen, S. Renewed prospects for green infrastructure planning in the UK. Plan. Pract. Res. 2006, 21, 483–496. [Google Scholar] [CrossRef]
- Fabos, J.G. Introduction and overview: The greenway movement, uses and potentials of greenways. Landsc. Urban Plan. 1995, 33, 1–13. [Google Scholar] [CrossRef]
- Ahern, J. Greenways as a planning strategy. Landsc. Urban Plan. 1995, 33, 131–155. [Google Scholar] [CrossRef]
- Shafer, C.S.; Scott, D.; Mixon, J. A Greenway Classification System: Defining the Function and Character of Greenways in Urban Areas. J. Park Recreat. Adm. 2000, 18, 88–106. [Google Scholar]
- Searns, R.M. The evolution of greenways as an adaptive urban landscape form. Landsc. Urban Plan. 1995, 33, 65–80. [Google Scholar] [CrossRef]
- Haaland, C.; Van Den Bosch, C.K. Challenges and strategies for urban green-space planning in cities undergoing densification: A review. Urban For. Urban Green. 2015, 14, 760–771. [Google Scholar] [CrossRef]
- Brunner, J.; Cozens, P. Where have all the trees gone? Urban consolidation and the demise of urban vegetation: A case study from Western Australia. Plan. Pract. Res. 2013, 28, 231–255. [Google Scholar] [CrossRef]
- Chen, Y.; Gu, W.; Liu, T.; Yuan, L.; Zeng, M. Increasing the use of urban greenways in developing countries: A case study on Wutong Greenway in Shenzhen, China. Int. J. Environ. Res. Public Health 2017, 14, 554. [Google Scholar] [CrossRef] [Green Version]
- Liu, Z.; Lin, Y.; De Meulder, B.; Wang, S. Can greenways perform as a new planning strategy in the Pearl River Delta, China? Landsc. Urban Plan. 2019, 187, 81–95. [Google Scholar] [CrossRef]
- Lai, S.H.; Zhu, J. Community greenway: A new trend of greenway practice in compact cities. Landsc. Archit. 2012, 34, 77–82. [Google Scholar]
- Thompson, C.W. Urban open space in the 21st century. Landsc. Urban Plan. 2002, 60, 59–72. [Google Scholar] [CrossRef]
- Akpinar, A. Factors influencing the use of urban greenways: A case study of Aydın, Turkey. Urban For. Urban Green. 2016, 16, 123–131. [Google Scholar] [CrossRef]
- Asakawa, S.; Yoshida, K.; Yabe, K. Perceptions of urban stream corridors within the greenway system of Sapporo, Japan. Landsc. Urban Plan. 2004, 68, 167–182. [Google Scholar] [CrossRef]
- Shafer, C.S.; Lee, B.K.; Turner, S. A tale of three greenway trails: User perceptions related to quality of life. Landsc. Urban Plan. 2000, 49, 163–178. [Google Scholar] [CrossRef]
- West, S.T.; Shores, K.A. The impacts of building a greenway on proximate residents’ physical activity. J. Phys. Act. Health 2011, 8, 1092–1097. [Google Scholar] [CrossRef] [PubMed]
- West, S.T.; Shores, K.A. Does building a greenway promote physical activity among proximate residents? J. Phys. Act. Health 2015, 12, 52–57. [Google Scholar] [CrossRef] [PubMed]
- Liu, K.; Siu, K.W.M.; Gong, X.Y.; Gao, Y.; Lu, D. Where do networks really work? The effects of the Shenzhen greenway network on supporting physical activities. Landsc. Urban Plan. 2016, 152, 49–58. [Google Scholar] [CrossRef] [Green Version]
- Auchincloss, A.H.; Michael, Y.L.; Kuder, J.F.; Shi, J.; Khan, S.; Ballester, L.S. Changes in physical activity after building a greenway in a disadvantaged urban community: A natural experiment. Prev. Med. Rep. 2019, 15, 100941. [Google Scholar] [CrossRef]
- Price, A.E.; Reed, J.A.; Muthukrishnan, S. Trail user demographics, physical activity behaviors, and perceptions of a newly constructed greenway trail. J. Commun. Health 2012, 37, 949–956. [Google Scholar] [CrossRef]
- Frank, L.D.; Hong, A.; Ngo, V.D. Causal evaluation of urban greenway retrofit: A longitudinal study on physical activity and sedentary behavior. Prev. Med. 2019, 123, 109–116. [Google Scholar] [CrossRef]
- Lin, J.L.; Gan, Q.L.; Wei, S.; Zhang, T.J. Guang Zhou Greenway Function Perception of IPA Assessment and Analysis. Yunnan Geogr. Environ. Res. 2012, 3, 14–18. [Google Scholar]
- Corning, S.E.; Mowatt, R.A.; Charles Chancellor, H. Multiuse trails: Benefits and concerns of residents and property owners. J. Urban Plan. Dev. 2012, 138, 277–285. [Google Scholar] [CrossRef]
- Palardy, N.P.; Boley, B.B.; Gaither, C.J. Resident support for urban greenways across diverse neighborhoods: Comparing two Atlanta BeltLine segments. Landsc. Urban Plan. 2018, 180, 223–233. [Google Scholar] [CrossRef]
- Tan, K.W. A greenway network for Singapore. Landsc. Urban Plan. 2006, 76, 45–66. [Google Scholar] [CrossRef]
- Larson, L.R.; Keith, S.J.; Fernandez, M.; Hallo, J.C.; Shafer, C.S.; Jennings, V. Ecosystem services and urban greenways: What’s the public’s perspective? Ecosyst. Serv. 2016, 22, 111–116. [Google Scholar] [CrossRef]
- Sims-Gould, J.; Race, D.L.; Vasaya, N.; McKay, H.A. A New Urban Greenway in Vancouver, British Columbia: Adolescents’ Perspectives, Experiences and Vision for the Future. J. Transp. Health 2019, 15. [Google Scholar] [CrossRef]
- Wang, F. The Research on Guangzhou Community Greenway’s Development and Usage from the Perspective of Everyday Life. Master’s Thesis, South China University of Technology, Guangzhou, China, 2015. [Google Scholar]
- Gobster, P.H. Perception and use of a metropolitan greenway system for recreation. Landsc. Urban Plan. 1995, 33, 401–413. [Google Scholar] [CrossRef]
- Zoellner, J.; Hill, J.L.; Zynda, K.; Sample, A.D.; Yadrick, K. Environmental perceptions and objective walking trail audits inform a community-based participatory research walking intervention. Int. J. Behav. Nutr. Phys. Act. 2012, 9, 6. [Google Scholar] [CrossRef] [Green Version]
- Senes, G.; Rovelli, R.; Bertoni, D.; Arata, L.; Fumagalli, N.; Toccolini, A. Factors influencing greenways use: Definition of a method for estimation in the Italian context. J. Transp. Geogr. 2017, 65, 175–187. [Google Scholar] [CrossRef]
- Keith, S.J.; Larson, L.R.; Shafer, C.S.; Hallo, J.C.; Fernandez, M. Greenway use and preferences in diverse urban communities: Implications for trail design and management. Landsc. Urban Plan. 2018, 172, 47–59. [Google Scholar] [CrossRef]
- Liu, J.Y. Research on POE and Optimization Strategies of the Community Greenways in Nanshan, Shenzhen. Master’s Thesis, Harbin Institute of Technology, Harbin, China, 2014. [Google Scholar]
- Wang, J.; Li, Q.W.; Peng, L.Q. The Enlightenments on the Construction of Community Greenway of Guangdong—Based on the Example of Furong Grennway in Shenzhen. Chin. Landsc. Archit. 2014, 5, 22. [Google Scholar]
- Ma, R.J. Conception Analysis of Urban Heritage of Everydaynes. Huazhong Archit. 2015, 33, 27–31. [Google Scholar]
- Gehl, J. Life between Buildings: Using Public Space; Island Press: Washington, DC, USA, 2011. [Google Scholar]
- Chase, J.L.; Crawford, M.; Kaliski, J. Everyday Urbanism; The Monacelli Press: New York, NY, USA, 2008; p. 224. [Google Scholar]
- Guangdong Greenway. Available online: http://www.gzlyyl.gov.cn/slyylj/gzld/201811/39613b6e08cd44989513b0dc178868c1.shtml (accessed on 1 December 2019).
- Marcus, C.C.; Francis, C. People Places: Design Guidelines for Urban Open Space; John Wiley & Sons: New York, NY, USA, 1997; p. 369. [Google Scholar]
- Troped, P.J.; Whitcomb, H.A.; Hutto, B.; Reed, J.A.; Hooker, S.P. Reliability of a brief intercept survey for trail use behaviors. J. Phys. Act. Health 2009, 6, 775–780. [Google Scholar] [CrossRef] [PubMed]
- Kaźmierczak, A. The contribution of local parks to neighbourhood social ties. Landsc. Urban Plan. 2013, 109, 31–44. [Google Scholar] [CrossRef]
- Gobster, P.H.; Westphal, L.M. The human dimensions of urban greenways: Planning for recreation and related experiences. Landsc. Urban Plan. 2014, 68, 147–165. [Google Scholar] [CrossRef]
- State Council. Interim Measures of the State Council on the Resettlement of Old, Weak, Sick and Disabled Cadres; Government of China: Beijing, China, 1978.
- State Council. Interim Measures of the State Council on the Retirement and Resignation of Workers; Government of China: Beijing, China, 1978.
- Nasution, A.D.; Zahrah, W. The Space is not ours, the life of public open space in gated community in Medan, Indonesia. Procedia Soc. Behav. Sci. 2015, 202, 144–151. [Google Scholar] [CrossRef] [Green Version]
- Whiting, J.W.; Larson, L.R.; Green, G.T.; Kralowec, C. Outdoor recreation motivation and site preferences across diverse racial/ethnic groups: A case study of Georgia state parks. J. Outdoor Recreat. Tour. 2017, 18, 10–21. [Google Scholar] [CrossRef]
- Dwyer, J.F.; Barro, S.C. Outdoor recreation behaviors and preferences of urban racial/ethnic groups: An example from the Chicago area. In Proceedings of the 2000 Northeastern Recreation Research Symposium, Bolton Landing, NY, USA, 2–4 April 2000; Kyle, G., Ed.; General Technical Report NE-276. US Department of Agriculture, Forest Service, Northeastern Research Station: Newtown Square, PA, USA; pp. 159–164. [Google Scholar]
- Schipperijn, J.; Stigsdotter, U.K.; Randrup, T.B.; Troelsen, J. Influences on the use of urban green space–A case study in Odense, Denmark. Urban For. Urban Green. 2010, 9, 25–32. [Google Scholar] [CrossRef]
- Fan, S.; Chen, X.; Ren, H.; Shen, W.; Xiao, R.; Zhang, Q.; Wu, Z.; Su, Y. Landscape structure and network characteristics of the greenway system in Guangzhou City, South China. Landsc. Ecol. Eng. 2019, 15, 25–35. [Google Scholar] [CrossRef]
- Weber, S.; Boley, B.B.; Palardy, N.; Gaither, C.J. The impact of urban greenways on residential concerns: Findings from the Atlanta BeltLine Trail. Landsc. Urban Plan. 2017, 167, 147–156. [Google Scholar] [CrossRef]
Figure 1.
Mappings of the cases of community greenways ((a) Hudson River waterfront Greenway in New York; (b) Kameido Ryokudo Park in Japan) (Source: the authors redrawing of the base map in mapbox).
Figure 1.
Mappings of the cases of community greenways ((a) Hudson River waterfront Greenway in New York; (b) Kameido Ryokudo Park in Japan) (Source: the authors redrawing of the base map in mapbox).

Figure 2.
The greenway network of Haizhu District, Guanghzou (Source: the author’s self-drawing).

Figure 3.
Maps of the Changgang Community Greenway, part of the Greenway in Haizhu District, Guangzhou (Source: the author’s self-drawing).
Figure 3.
Maps of the Changgang Community Greenway, part of the Greenway in Haizhu District, Guangzhou (Source: the author’s self-drawing).

Figure 4.
The depiction of the community greenway ((a) the bike and ped path; (b) a stone seat; (c) lush vegetation) (Source: Author’s own photographs).
Figure 4.
The depiction of the community greenway ((a) the bike and ped path; (b) a stone seat; (c) lush vegetation) (Source: Author’s own photographs).

Figure 5.
The activities in the community greenway (Source: The author’s own drawing).

Figure 6.
Mapping of the greenway space and public activities (Source: The author’s own drawing and photographs).
Figure 6.
Mapping of the greenway space and public activities (Source: The author’s own drawing and photographs).

Figure 7.
The self-organized activities in the community greenways ((a) Haircut in the corner; (b) furniture shared by the neighbors) (Source: The author’s own photograph).
Figure 7.
The self-organized activities in the community greenways ((a) Haircut in the corner; (b) furniture shared by the neighbors) (Source: The author’s own photograph).


Table 1.
Characteristics of the study population (N = 99).
| Sociodemographic and Socioeconomic Variables | Items | No. | % of the Users |
|---|---|---|---|
| Gender | Male | 50 | 50.5 |
| Female | 49 | 49.5 | |
| Age | 18~28 years | 16 | 16.2 |
| 29~40 years | 21 | 21.2 | |
| 41~55 years | 17 | 17.2 | |
| 56~65 years | 20 | 20.2 | |
| 66+ years | 25 | 25.2 | |
| Job status | Employed | 45 | 45.4 |
| Students | 4 | 4.0 | |
| Retired | 35 | 35.4 | |
| Unemployed | 15 | 15.2 | |
| Education (highest level) | Elementary school or less | 19 | 19.2 |
| Secondary school, High school, Secondary technical school/vocational high school | 48 | 48.5 | |
| college/Bachelor’s or more | 32 | 32.3 | |
| Income | RMB: <2000 monthly | 20 | 20.2 |
| RMB:2001~5000 monthly | 43 | 43.4 | |
| RMB:5001~10000 monthly | 27 | 27.3 | |
| RMB:>10001 monthly | 9 | 9.1 | |
| Area of residence | Changgang Street | 29 | 53.7 |
| Geshan Street | 9 | 16.7 | |
| Jiangnan Street | 11 | 20.4 | |
| Other places | 5 | 9.2 | |
| Totals | 99 | 100 | |
Table 2.
Use patterns of the community greenway.
| Categories | Items | No. | % of the Users |
|---|---|---|---|
| Transportation | Walking | 84 | 84.9 |
| Bicycling | 10 | 10.1 | |
| Public transportation | 5 | 5.0 | |
| Time to reach | <5 min | 44 | 44.4 |
| 5–10 min | 30 | 30.3 | |
| 10–20 min | 14 | 14.1 | |
| >20 min | 11 | 11.2 | |
| Frequency of use | >= 7 times per week | 59 | 59.6 |
| 3–6 times per week | 22 | 22.2 | |
| 1–2 times per week | 12 | 12.1 | |
| Seldom | 6 | 6.1 | |
| Duration of use | Would not stay | 21 | 21.2 |
| <30 min | 31 | 31.3 | |
| 0.5–1 h | 30 | 30.3 | |
| 1–2 h | 11 | 11.1 | |
| >2 h | 6 | 6.1 | |
| Activities | Daily traffic, go to destinations such as shopping malls, parks, etc. | 40 | 40.4 |
| Leisure activities such as rest, reading, enjoying the scenery, etc. | 36 | 36.4 | |
| Physical exercise such as walking, running, dance, cycling, etc. | 54 | 54.6 | |
| Consumption, such as haircuts, purchase of fruits and vegetables | 8 | 8.1 | |
| Be with family, neighbors, friends, such as watching children, playing chess, gatherings, etc. | 9 | 9.1 | |
| Others | 4 | 4.04 | |
| Total | 103 | 100 | |
Table 3.
Multivariate regression analysis on the relationship between demographics, transportation, time to arrive and use frequency.
Table 3.
Multivariate regression analysis on the relationship between demographics, transportation, time to arrive and use frequency.
| Use Frequency (R2 = 0.272) | ||||
|---|---|---|---|---|
| β | SE | 95% C.I. | p | |
| Gender | 0.106 | 0.169 | −0.143–0.530 | 0.256 |
| Age | −0.383 | 0.077 | −0.399–0.092 | 0.002 ** |
| Job status | 0.116 | 0.084 | −0.082–0.251 | 0.314 |
| Education | 0.068 | 0.147 | −0.206–0.377 | 0.563 |
| Income(monthly) | −0.119 | 0.122 | −0.365–0.119 | 0.315 |
| transportation | −0.207 | 0.169 | −0.675–0.005 | 0.047 * |
| Time to reach | 0.411 | 0.084 | 0.205–0.538 | 0.000 *** |
* p < 0.05, ** p < 0.01, *** p < 0.001.
Table 4.
Cross-analysis of demographics and activities (N = 99).
| Categories | Items | No. (Proportion%) (N = 99) | |||||
|---|---|---|---|---|---|---|---|
| Transportation | Leisure Activity | Physical Exercise | Shopping | Be with Family and Neighbors | Others | ||
| Gender | Male | 17(34) | 17(34) | 30(60) | 5(10) | 2(4) | 3(6) |
| Female | 23(46.94) | 19(38.78) | 24(48.98) | 3(6.12) | 7(14.29) | 1(2.04) | |
| Age | 18~28 years | 10(62.5) | 3(18.75) | 6(37.5) | 4(25) | 0(0.00) | 0(0.00) |
| 29~40 years | 8(38.10) | 9(42.86) | 13(61.90) | 2(9.52) | 4(19.05) | 1(4.76) | |
| 41~55 years | 8(47.06) | 6(35.29) | 7(41.18) | 0(0.00) | 1(5.88) | 2(11.76) | |
| 56~65 years | 8(40) | 5(25) | 11(55) | 1(5) | 1(5) | 1(5) | |
| 66+ years | 6(24) | 13(52) | 17(68) | 1(4) | 3(12) | 0(0.00) | |
| Job status | Employed | 20(47.62) | 15(35.71) | 20(47.62) | 5(11.90) | 4(9.52) | 4(9.52) |
| Students | 3(75) | 0(0.00) | 1(25) | 0(0.00) | 0(0.00) | 0(0.00) | |
| Retired | 12(34.29) | 16(45.71) | 24(68.57) | 1(2.86) | 2(5.71) | 0(0.00) | |
| Unemployed | 4(26.67) | 4(26.67) | 8(53.33) | 1(6.67) | 3(20) | 0(0.00) | |
| Education | Elementary school or less | 5(26.32) | 8(42.11) | 11(57.89) | 1(5.26) | 4(21.05) | 1(5.26) |
| Secondary school, High school, Secondary technical school/vocational high school | 23(47.92) | 13(27.08) | 23(47.92) | 4(8.33) | 2(4.17) | 3(6.25) | |
| college/Bachelor’s or more | 12(38.71) | 15(48.39) | 20(62.5) | 3(9.68) | 3(9.68) | 0(0.00) | |
| Income | RMB: <2000 monthly | 7(35) | 4(20) | 12(60) | 1(5) | 2(10) | 0(0.00) |
| RMB:2001~5000 monthly | 17(39.53) | 18(41.86) | 21(48.84) | 2(4.65) | 4(9.30) | 2(4.65) | |
| RMB:5001~10000 monthly | 14(51.85) | 10(37.04) | 16(59.26) | 5(18.52) | 3(11.11) | 2(7.41) | |
| RMB:>10001 monthly | 2(22.22) | 4(44.44) | 5(55.56) | 0(0.00) | 0(0.00) | 0(0.00) | |
Table 5.
The current status of the community greenway and its impact on the residents’ daily life by mean and the proportion of “very satisfied” and “satisfied”.
Table 5.
The current status of the community greenway and its impact on the residents’ daily life by mean and the proportion of “very satisfied” and “satisfied”.
| Mean | SD. | Proportion (%) (N = 109) | |||
|---|---|---|---|---|---|
| Very Satisfied | Satisfied | ||||
| The residents’ evaluation of the current status of different factors of the community greenway | Accessibility | 4.19 | 0.659 | 32.11 | 55.96 |
| Transportation environment | 3.58 | 0.785 | 10.09 | 45.87 | |
| Service facilities like benches and physical facilities | 2.97 | 0.918 | 5.5 | 22.02 | |
| The types and amounts of activity space | 3.33 | 0.817 | 7.34 | 32.11 | |
| The connectivity with other urban living facilities | 3.83 | 0.788 | 19.27 | 45.54 | |
| The overall evaluation of the community greenway | 3.65 | 0.786 | 14.68 | 40.37 | |
| The impact of the community greenway on the daily life | It’s more convenient for transportation | 3.78 | 0.994 | 24.77 | 42.20 |
| I take more outdoor activities alone | 3.66 | 0.993 | 20.18 | 40.28 | |
| I interact with neighbors more | 3.26 | 1.004 | 8.26 | 36.7 | |
| I take more outdoor activities with my family members | 3.31 | 1.111 | 14.68 | 32.11 | |
| The small vendors make life easier | 2.92 | 1.211 | 11.93 | 20.18 | |
Table 6.
Multivariate regression analysis on the relationship between the evaluation of current status of the construction factors and the overall satisfaction of the community greenway.
Table 6.
Multivariate regression analysis on the relationship between the evaluation of current status of the construction factors and the overall satisfaction of the community greenway.
| The Overall Evaluation of the Community Greenway (R2 = 0.388) | ||||
|---|---|---|---|---|
| β | SE | 95% C.I. | p | |
| Accessibility | 0.128 | 0.103 | −0.051–0.357 | 0.140 |
| Transportation environment | 0.039 | 0.090 | −0.138–0.217 | 0.661 |
| Service facilities like benches and physical facilities | 0.151 | 0.089 | −0.046–0.305 | 0.146 |
| The types and amounts of activity space | 0.443 | 0.103 | 0.222–0.631 | 0.000 *** |
| The connectivity with other urban living facilities | 0.056 | 0.085 | –0.112–0.224 | 0.510 |
*** p < 0.001.
Table 7.
Multivariate regression analysis on the relationship between the evaluation of current status of the construction factors and the impact level of the community greenway on the daily life.
Table 7.
Multivariate regression analysis on the relationship between the evaluation of current status of the construction factors and the impact level of the community greenway on the daily life.
| It’s More Convenient for Transportation | I Interact with Neighbors More | I Take more Outdoor Activities with My Family Members | ||||
|---|---|---|---|---|---|---|
| β | SE | β | SE | β | SE | |
| Transportation environment | −0.257 * | 0.146 | ||||
| Service facilities like benches and physical facilities | 0.332 ** | 0.135 | 0.391 ** | 0.145 | ||
| The connectivity with other urban living facilities | 0.504 *** | 0.114 | ||||
* p < 0.05, ** p < 0.01, *** p < 0.001.
Table 8.
The importance level of the community greenway construction factors by mean and the proportion of “very important” and “important”.
Table 8.
The importance level of the community greenway construction factors by mean and the proportion of “very important” and “important”.
| Items | Mean | SD. | Proportion (N = 109) | |
|---|---|---|---|---|
| Very Important (%) | Important (%) | |||
| Accessibility | 3.58 | 0.913 | 12.84 | 43.12 |
| Separation of Walking trails and bicycle trails | 3.66 | 0.976 | 20.18 | 37.61 |
| Enough service facilities | 4.11 | 0.753 | 30.28 | 51.38 |
| Various activity space | 3.60 | 0.878 | 14.68 | 42.2 |
| Connection with other urban living facilities | 3.78 | 0.862 | 19.27 | 43.12 |
© 2019 by the authors. Licensee MDPI, Basel, Switzerland. This article is an open access article distributed under the terms and conditions of the Creative Commons Attribution (CC BY) license (http://creativecommons.org/licenses/by/4.0/).
Share and Cite
MDPI and ACS Style
Chi, W.; Lin, G. The Use of Community Greenways: A Case Study on A Linear Greenway Space in High Dense Residential Areas, Guangzhou. Land 2019, 8, 188. https://0-doi-org.brum.beds.ac.uk/10.3390/land8120188
AMA Style
Chi W, Lin G. The Use of Community Greenways: A Case Study on A Linear Greenway Space in High Dense Residential Areas, Guangzhou. Land. 2019; 8(12):188. https://0-doi-org.brum.beds.ac.uk/10.3390/land8120188
Chicago/Turabian StyleChi, Wenxiu, and Guangsi Lin. 2019. "The Use of Community Greenways: A Case Study on A Linear Greenway Space in High Dense Residential Areas, Guangzhou" Land 8, no. 12: 188. https://0-doi-org.brum.beds.ac.uk/10.3390/land8120188
Note that from the first issue of 2016, this journal uses article numbers instead of page numbers. See further details here.