Comparison of Cash Crop Suitability Assessment Using Parametric, AHP, and FAHP Methods


1
Remote Sensing and GIS field of study, School of Engineering and Technology, Asian Institute of Technology, P.O. Box 4, Klong Luang, Pathumthani 12120, Thailand
2
Natural Resources Management field of study, School of Environment, Resources and Development, Asian Institute of Technology, P.O. Box 4, Klong Luang, Pathumthani 12120, Thailand
*
Author to whom correspondence should be addressed.
Land 2019, 8(5), 79; https://0-doi-org.brum.beds.ac.uk/10.3390/land8050079
Submission received: 16 April 2019
/
Revised: 28 April 2019
/
Accepted: 6 May 2019
/
Published: 8 May 2019
Abstract
:Cash crops, which include eucalyptus, play an important role in Thailand in wood utilization. Consequently, cash crops have become a significant driving force in land use changes and low crop yield; thus, the development of an accurate cash crop suitability model is needed. The aim of this study is to evaluate the land suitability of cash crops, such as eucalyptus, which is based on Multi Criteria Decision Making (MCDM) in Nakhon Ratchasima Province in Thailand. Parametric, classical Analytical Hierarchy Process (AHP), and fuzzy AHP (FAHP) approaches integrated with Geographic Information Systems (GIS) are compared to accomplish this. Parametric approaches equally allocate importance to all factors. AHP assigns the distribution of important factors using expert opinions. FAHP accounts for the uncertainty in expert opinions, and the triangular (Tri) and trapezoidal (Tra) approaches are compared. The results demonstrated that Trapezoidal Fuzzy AHP (TraFAHP) could classify and map cash crop suitability with 90.16% accuracy, which is a higher overall accuracy than the other approaches that are based on reference map validation. Therefore, we recommend the TraFAHP method for accurately identifying cash crop suitability.
1. Introduction
In the past decade, the Food and Agriculture Organization (FAO) of the United Nations has estimated that approximately 1.2% of natural forests worldwide have been lost [1]. The tree plantation of cash crops, and especially eucalyptus, have replaced deforestation [1]. Globally, the demand for eucalyptus is very high, and the crop plays an important role in the pulp and paper industry, as well as for many other uses, such as particleboard and wood packing [2]. Consequently, the demand for eucalyptus has become a significant driving force in land use changes, especially in Thailand [3], which has very limited agricultural land. Eucalyptus in Thailand is a “Camaldulensis Dehnh.” species, which was imported for cultivation in 1946. The eucalyptus plantations in the study area covered 26,414.37 ha in 2002, and expanded by more than 100% to cover 45,004.75 ha in 2007 [4]. In prior years, only farmers who owned larger plots of land grew eucalyptus; however, farmers with small plots have also shifted crops to be able to grow eucalyptus. Heavy promotion and campaigns from vendors convinced these farmers. Moreover, the commitment price from factories is motivation enough for farmers to plant the crop in widespread areas without control. However, most farmers’ decision making around eucalyptus cultivation is based on the price that it garners in the market and not on the suitability of their land for eucalyptus. Consequently, if the crop yield does not reach the maximum or the quality does not meet the factories’ requirements, then the price that is obtained by the farmers is lower than the market price. This leads to a loss of income for the farmers, who are then unable to sustain eucalyptus cultivation. For this reason, eucalyptus land suitability is an important designation in determining the best location for plantation.
This study employs Geographic Information System (GIS) integrated fuzzy theory [5] with analytical hierarchy process (AHP) to develop a model of land suitability evaluation for cash crops, namely eucalyptus, which are increasingly used by the pulp and paper industry and as biofuels in Thailand [6]. Chang’s (1996) extent analysis method has been widely employed in the fuzzy AHP, because the steps of this approach are easier than other fuzzy AHP approaches and are similar to the conventional AHP [7,8,9]. This evolutionary algorithm was employed to calculate the weights with the triangular fuzzy numbers and trapezoidal fuzzy numbers, and it was widely used with AHP as fuzzy AHP for solving uncertainty in multi-criteria decision making. On the other hand, the research on the eucalyptus suitability was rarely found. There were only in Central America and Middle East of Asia, but not in Southeast Asia. These are the motivation to take fuzzy AHP to evaluate land for the eucalyptus suitability. This study has two main objectives: (a) to compare physical factor suitability among parametric, AHP, and FAHP approaches, and (b) to evaluate the land suitability for cash crop plantation.
2. Literature Review
2.1. Multi Criteria Decision Making
Multi criteria decision making (MCDM) is a current trend, which enables the formal incorporation of multiple conflicting criteria into the management planning process, as defined by the International Society on Multiple Criteria Decision Making [10]. MCDM has been applied to many areas of science. For example, Ziemba et al. (2017) used MCDA with the PROMETHEE for the Sustainability Assessment (PROSA) method to find the best location for a wind farm in the Polish economic zone in the Baltic Sea. This study found that that the PROSA method recommends more sustainable decision-making variants, and that the ranking that it builds is less sensitive to changes in criteria weights [11]. Tsolaki-Fiaka et al. (2018) used the PROMETHEE method to rank alternative scenarios to identify the impacts of abandoned quarries that are located in the Evros Region in northeastern Greece [12]. Liao et al. (2018) integrated fuzzy logic while using a hesitant fuzzy linguistic term set (HFLTS) and PROMETHEE in MCDM to study the process of evaluating the green levels of cold-chain logistics providers [13]. Zhao et al. (2018) used MCDM by integrating Fuzzy–Delphi, namely, the best-worst method (BWM), the entropy weight calculation approach, and the VIKOR method to investigate the performances of five selected provincial electricity grid corporations in China [14]. Interestingly, MCDM has been used in many medical studies; for example, Pan et al. (2018) used the probabilistic linguistic ELECTREII method to evaluate the therapeutic schedule for brain-metastasized non-small cell lung cancer at Sichuan Cancer Hospital [15].
2.2. Parametric Methods
Many parametric methods have been developed to solve complex issues using MCDM; such methods are often a mix of qualitative and quantitative methods and they are derived from the numerical inferred effects of various characteristics. These methods allocate a numerical value to the most significant characteristics, and the interactions between such significant factors are expressed through simple multiplication or through the addition of single-factor indexes. Any important factor controls the rating, and the overall rating cannot be a negative number, although it may be considerably lower than the ratings of each one of the individual factors [16]. For example, the parametric method, as the Storie Index rating (SIR), can be calculated by multiplying separate ratings:
where SIR is the suitability index, A is the rating value of the first factor, B is the rating value of the second factor, and C, …, X are the rating values for the other factors.
SIR = A*B*C*X,
The Storie Index has been applied in a method of soil rating that is based on the nature of the soil in land use and the potential of the land. This is independent of other physical or economic factors that may determine the desirability of planting certain crops in the designated location. For example, four or five parameters are evaluated, such as soil depth and texture, soil permeability, soil chemical characteristics, drainage and surface runoff, and climate. The index is calculated as:
SIR = (soil depth and texture) * (soil permeability) * (soil chemical characteristics) * (drainage, surface runoff) * (climate).
The advantage of this approach is that the evaluation is easily realized, and it is only comprised of a few categories. The disadvantage is that, if we have a value of zero in any category, it will not be calculated as suitable [17].
2.3. Analytical Hierarchy Process (AHP)
The most well-known use for MCDM is the analytical hierarchy process (AHP), as proposed by Thomas Saaty in the early 1980s [10]. AHP can be used as a consensus building tool in situations that involve a committee or for group decision making [18]. AHP is more than a criteria-weighting method, as it provides an additive hierarchical aggregation of criteria [19]. It addresses the importance of every factor in a complex system, which includes multiple factors and uses “pairwise comparisons” and matrix algebra to weight criteria, basing its decision on the weights from the evaluation criteria. It distinguishes the factors into different levels that are related to each other based on the judgment of relative importance among the factors on the same level while using the calculated weights of every factor.
AHP has many advantages, such as combining the tangible and intangible characteristics of questions, a focus on group objectives rather than individual ones, and continuous brainstorming to obtain better responses [20]. However, the method also has some disadvantages, such as the expression of the problem of environmental uncertainty [21], deuce deficiency that results from hierarchies [22], and the possibility of linguistic errors in responding to the AHP questionnaire [23]. Moreover, rank reversal is due to the modification of the relative values between the local priorities, which is a different and independent cause of rank reversal due to the right and left inconsistencies. Thus, the rank reversal phenomenon is independent of the consistency of the matrix and the derivation method of the priorities [24].
Although AHP is popular and frequently used in MCDA, it is not sufficient to eliminate any uncertainty in the data, because the characteristics of the data used play a role in whether the data is certain or uncertain [25,26]. The certain data (deterministic) are expressed in discrete forms, whereas the uncertain data (nondeterministic) are represented by distributions (continuous or discrete) [26,27,28].
2.4. Fuzzy Analytical Hierarchy Process (FAHP)
In this section, the fuzzy sets and fuzzy numbers are briefly introduced to AHP as fuzzy AHP.
2.4.1. Fuzzy Sets and Fuzzy Numbers
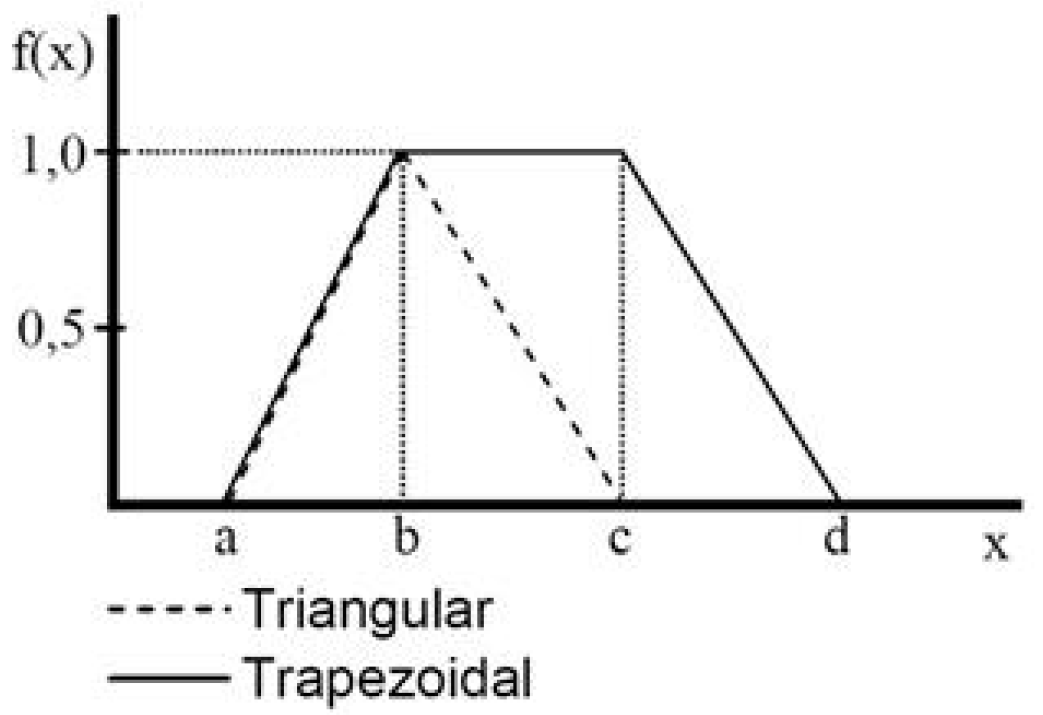
Zadeh (1965) was the first to introduce fuzzy set theory to express the ambiguity of human thought in decision making to improve the precision [29]. A fuzzy set is a class of objects that has a continuity of membership grades. A membership function characterizes a set, which assigns a grade of membership between zero and one to each object [30]. It is often used to capture this variation in the level of importance. The membership functions can be defined in several ways, for example, using linear, S-curve, triangular, or trapezoidal representations [31]. Fuzzy set theory is similar to human reasoning in its use of approximate information and uncertainty to make decisions, which frequently occurs in criteria analysis. Its advantage is mathematically representing uncertainty and vagueness, and providing tools for dealing with the ambiguity that is inherent in solving many problems. Moreover, it is a powerful mathematical tool for modeling uncertain systems in the natural and human sciences and facilitating commonsense reasoning in decision making in the absence of complete and precise information [30]. Fuzzy logic has many algorithms and it has been used in many areas of science. For example, Medina and Ojeda-Aciego (2010) used non-commutative fuzzy logic to solve the fuzzy relation between an object and its attributes in complex decisions as multi-adjoint t-concept lattices [32]. Nowakova et al. (2016) used fuzzy signatures and applied fuzzy S-trees in fuzzy medical image retrieval (FMIR) to classify the images for interpretation for mammography [33]. Kumar et al. (2017) developed a hybrid algorithm that is based on improved artificial bee colony (ABC) and fuzzy c-means (FCM) to assist the FCM clustering escape from local optima to classify the images [34]. The triangular and trapezoidal fuzzy numbers are often used to deal with the ambiguity of decisions that are related to the efficiency levels of choice options that are associated with each criterion [35]. Using fuzzy numbers, which can be determined to mathematical operation in the fuzzy domain, can represent the vague data. Thus, fuzzy numbers can be represented by its membership grade ranging between 0–1. Figure 1 shows the triangular fuzzy set membership function and trapezoidal fuzzy set membership function.
A set of triangular fuzzy number is simply denoted as (a, b, c) to represent the smallest possible value, the most promising value, and the largest possible value, respectively. The triangular fuzzy number having linear representation on the left and right side can be defined in terms of its membership function as:
The trapezoidal fuzzy membership function is represented as (a, b, c, and d).
2.4.2. Fuzzy AHP
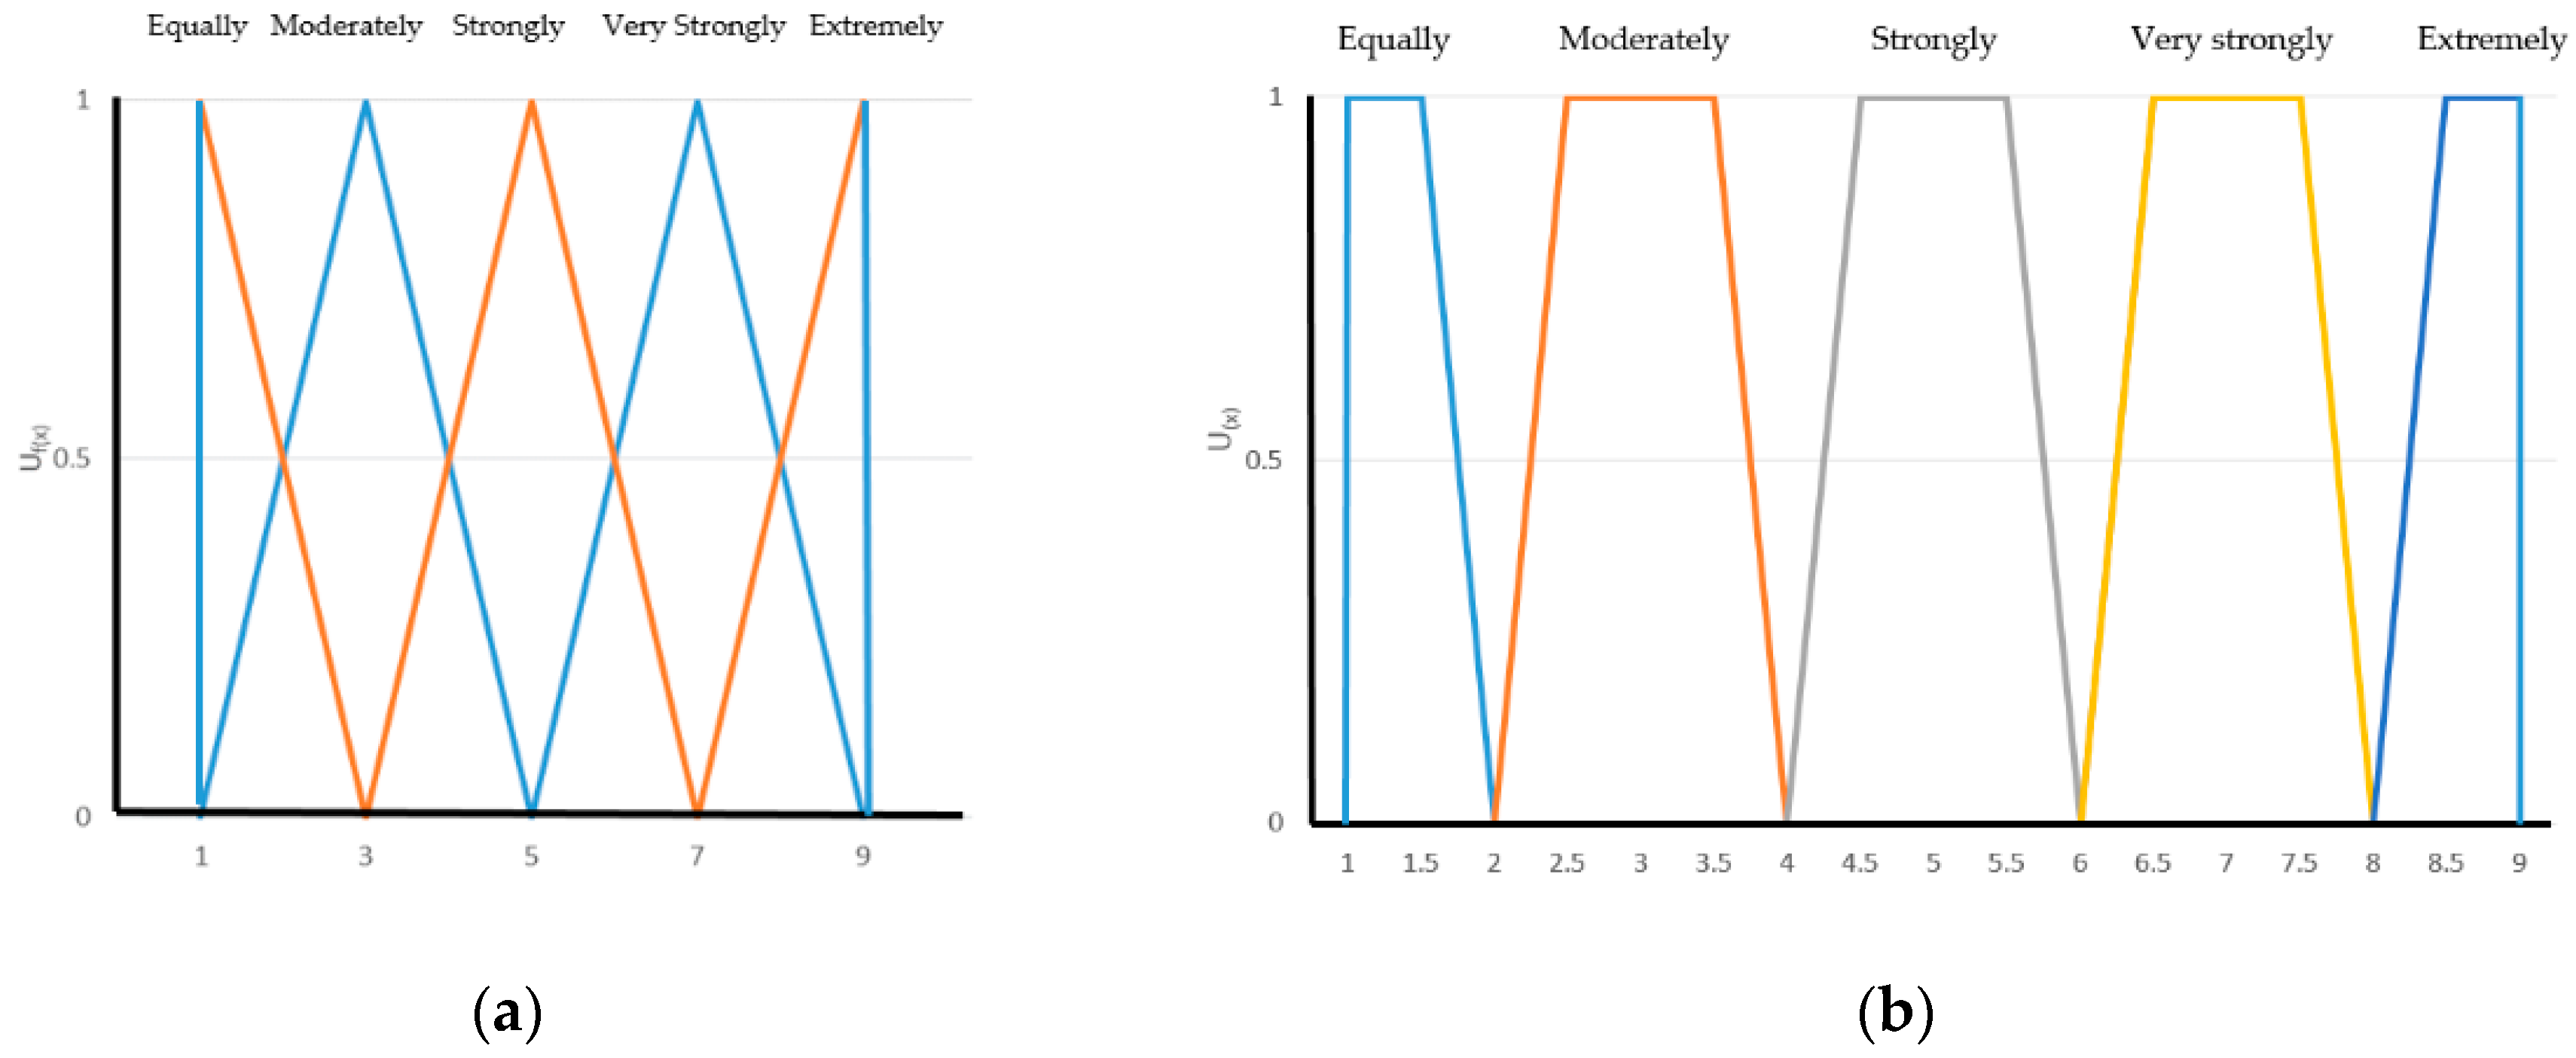
Although AHP is more widely used for multi criteria decision making to solve the problem of uncertainty of human, but it is still inadequate in handling the inherent uncertainty and imprecision related with the mapping of the decision makers’ perception to actual numbers. Zadeh (1965) developed fuzzy set theory to address uncertainty and vagueness owing to the deficiencies of AHP [29,36]. Fuzzy set theory makes it possible to express uncertain data in a fuzzy form. The data type refers to both the scale on which the criterion performance of the variants is presented, as well as to the weights of the criteria [26]. Van Laarhoven and Pedrycz (1983) designed the first fuzzy extension of the AHP method to extend the Saaty’s AHP method with triangular fuzzy numbers. Buckley (1985) developed trapezoidal fuzzy numbers and used the geometric mean method to calculate the fuzzy weight for each fuzzy matrix. Chang (1996) developed triangular fuzzy numbers for a pairwise comparison of fuzzy AHP and estimated the weight vectors under each criterion [30]. These are combined in a normal way to determine the final fuzzy weights for the alternative. Zadeh (1965) introduced the concept of linguistic variables to express human thinking in terms of fuzzy sets instead of crisp numbers [37]. The fuzzy extent analysis by Chang [5] used a nine-point scale (1–9) and indicates that, for a triangular fuzzy number (a, b, c), the greater the value of the c − a, the fuzzier the degree, when c − a = 0, the judgment is a non-fuzzy number, whereas Zhu et al. [38] states that the degree of fuzziness assumes that the value of į is constant and is considered to be an absolute distance from the lower bound value (aij) to the modal value (bij) or the modal value (bij) to the upper bound value (cij). Zhu et al. indicated that the value of į should be between 0.5 and 1 in the modified extent analysis. In this study, using degree of fuzziness (δ) as 1 followed many study as Dinh L.C. & Duc T. T. [39], Ibrahim E. H. et al. [40], Elomda B.M. et al. [41], and Paktinat M. & Danaei A. [42]. The fuzzified Saaty’s scale is used to represent the numerical values and linguistic variables as triangular fuzzy numbers in Figure 2a and trapezoidal fuzzy numbers, as in Figure 2b.
2.5. Land Suitability Assessment
The FAO has created a framework for land suitability. The principle that underlies this framework is the ability of physical environments, such as climate, relief, soil, hydrology, and vegetation, to support land use. The results of land evaluations are determined in terms of productivity from various factors, such as climate, topography, and soil characteristics [49,50]. The land suitability procedure uses the concept of MCDM to achieve its objectives. MCDM, using AHP and FAHP integrated with GIS, is a well-known method in agriculture science, especially for land suitability and location selection. For example, Teniwut et al. (2018) applied AHP and FAHP approaches with GIS for suitable site selection of a seaweed farming center in the Southeast Maluku district in Indonesia [51], and Ioannou et al. (2018) combined MCDM AHP with fuzzy system elements to determine the weight coefficients of the participating criteria to select a site for biomass energy production [52]. MCDM works efficiently in terms of land suitability; for example, Mokarram and Mirsoleimani (2018) applied a fuzzy method and the order weight average (OWA) methods to prepare a fuzzy map of each factor in GIS to determine the land suitability for citrus cultivation [53].
Several studies have extended such methods to cash crop suitability, including for eucalyptus. Bustillos-Herrera et al. (2007) studied land suitability for eucalyptus plantation in Mexico, with three main criteria factors (climate, soil, and topography), and found that the most influential factor was climate [54]. Armin and Mahiny (2010) [55] studied land suitability for eucalyptus “grandis” in the Gharnaveh watershed in Iran, and found that close to 58% of the total study area was suitable in Eucalyptus grandis plantation.
3. Materials and Methods
3.1. Conceptual Framework
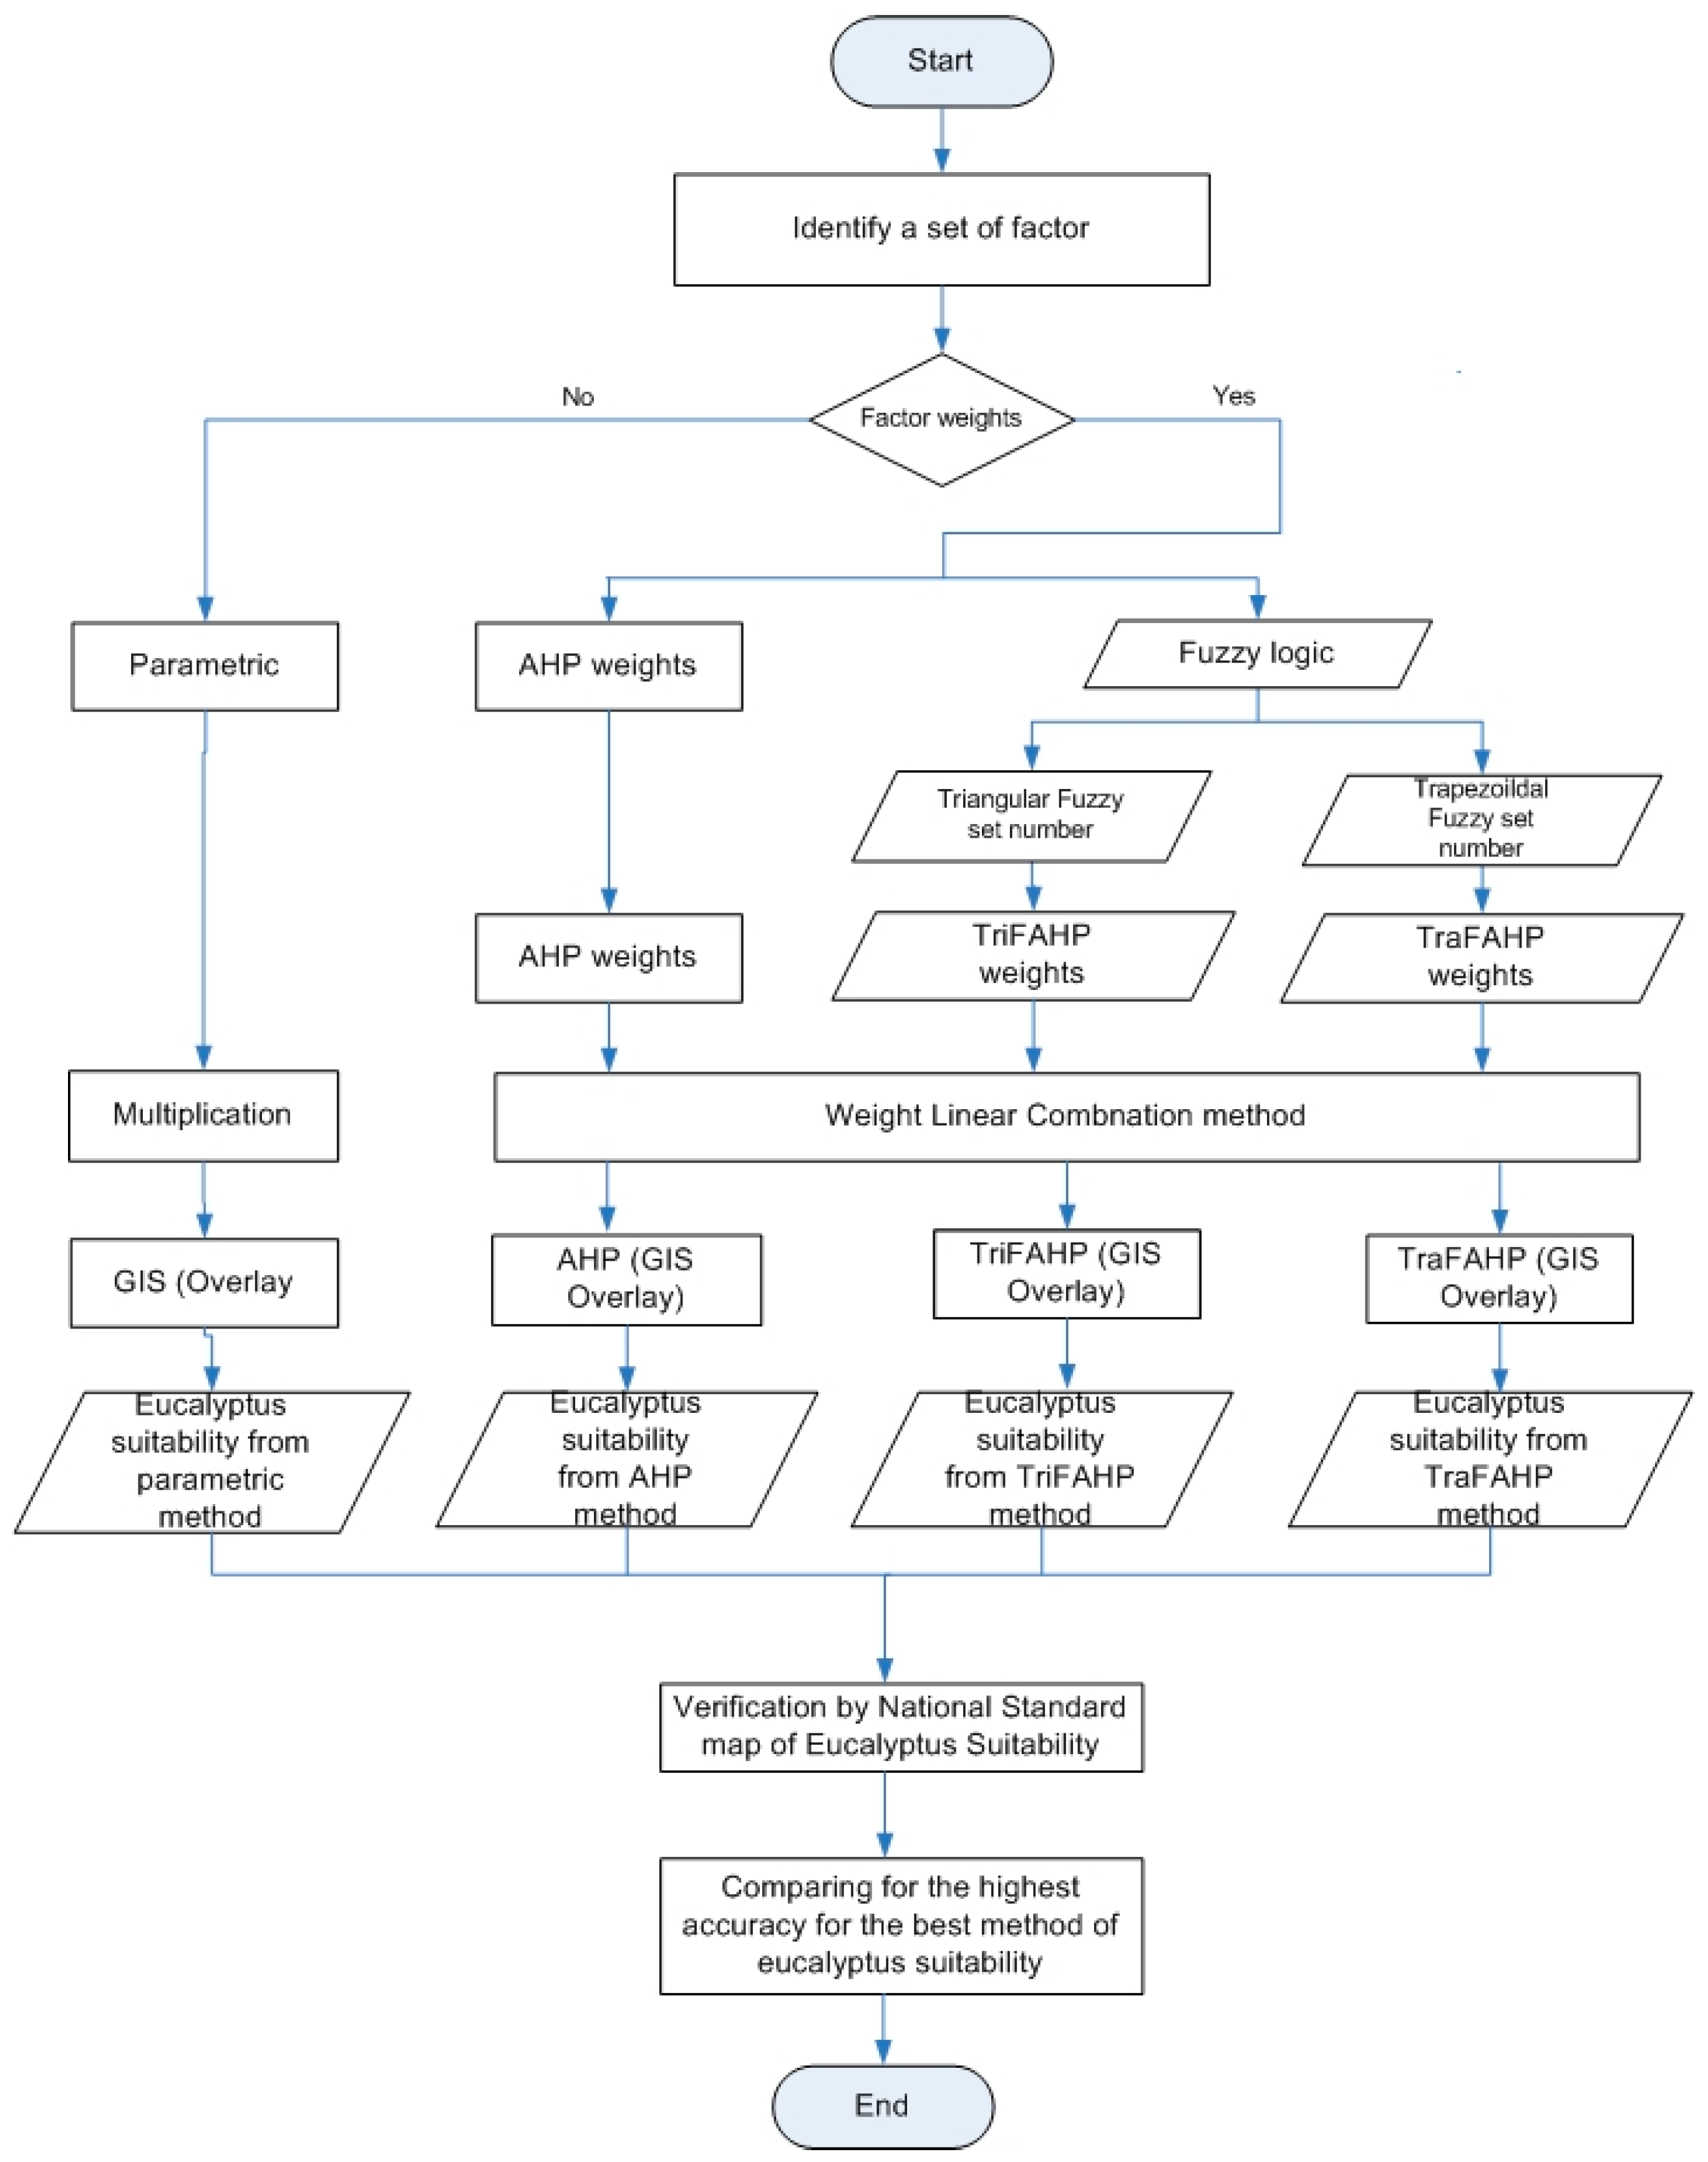
Our study primarily utilizes GIS based MCDM for the land suitability evaluation of cash crops, such as eucalyptus. The methods (Figure 3) can be explained as comparing MCDM between no weight factors as a parametric approach and the weight factors as AHP and Fuzzy AHP approaches, with fuzzy
AHP divided into triangular (Tri) and trapezoidal (Tra) fuzzy set numbers. GIS is integrated with the four approaches to determine the eucalyptus suitability while using the outputs from each approach. The outputs are validated with a national standard map to choose the best approaches for eucalyptus suitability.
3.2. Study Area
This study was conducted in Nakhon Ratchasima Province, which is located in northeastern Thailand (14°58′28″ N and 102°5′53″ E). The area covers approximately 2.04 million ha; its topography includes a high/middle terrace, a low terrace, a peneplain, a flood plain, and a basin. A major portion of the area lies in the flood plain (39.78%), and another portion lies in the high/middle terrace (37.03%). The flood plain and basin have a flat topography, while the terraces and the peneplain have gently undulating topography. In addition, a portion of the area consists of an alluvial complex. The altitude of the study area ranges from 170 to 210 m above mean sea level [56]. Alluvium and colluvium are the main parent soil materials in this area, and they were later identified as the weathered mantle of bedrock and the finer matrix of a gravel bed. These materials shift over a relatively short distance due to elements, such as wash, creep, and wind action. The materials consist of identified soil units with associated soil series, phases, and variants. The soil texture of the series varies from loamy sand to clayey [57]. Soil classification of the study area is comprised of five main soil groups: acrisols, which are soils with clay-enriched subsoil with low-activity clays and low base status; cambisols, which are soils with little or no profile differentiation that are moderately developed; ferralsols, which are soils that are distinguished by ferritic/alic chemistry and the dominance of kaolinite and oxides; luvisols, which are soils with clay-enriched subsoil, high-activity clays, and high base status; and, solonetz, which are soils with limitations in root growth and a high content of exchangeable natric [58]. The average amount of rainfall between 1991 and 2009 varied. It was less than 1000 mm in some years and it exceeded 1000 mm in others. This large fluctuation renders it difficult to predict the exact amount of rainfall for each year and it is one cause of inaccurate crop suitability predictions. Conversely, the temperature in the region has rarely changed. In general, this area mainly engages in growing diverse crops, such as rice, sugarcane, cassava, corn, and fruits.
Eucalyptus camaldulensis Dehnh. is resistant to temperatures from −5–45 °C. It can withstand drought for 6–8 months and retain water for 2–3 months, and it grows at altitudes of up to 600 m above mean sea level with rainfall of less than 400 mm per year. The crop can grow well in almost all types of soil, including saline soils, and it prefers soil with a pH of 6.5–7.5; however, it cannot tolerate highly acidic soil, such as limestone [4].
3.3. Data
Three main datasets were used in the study: climate, soil, and topography (Table 2 and Figure 3). Each factor is divided into four categories: highly suitable (S1), moderately suitable (S2), marginally suitable (S3), and not suitable (N). These are overlaid, and the results of land suitability are also divided into the same four levels: highly suitable (S1), moderately suitable (S2), marginally suitable (S3), and not suitable (N).
3.4. Methods
The steps that are taken to derive the weight factors for both AHPs are as follows.
Step 1. Seven experts on eucalyptus plantation are invited to construct a weight for each criterion. A questionnaire is formulated to compare the different criteria pairwise in terms of their contributions to achieving eucalyptus suitability and then to compare the detailed criteria pairwise in terms of their contributions to attaining their upper-level criteria based on the proposed hierarchy. As eleven criteria are used, nine different levels of evaluation are employed. Table 1 presents the linguistic values [59,60].
Step 2. The FAHP algorithm is based on the Buckley’s FAHP method [61] and Chang’s FAHP extent analysis method [5,62]. The fuzzy numbers are set up in all of the hierarchies based on the linguistic values and the extent to the triangular fuzzy membership function [5] and the trapezoidal fuzzy membership function [63] are given in Equations (2) and (3), as shown in Table 1.
Step 3. The opinion of each expert is converted into a matrix.
Subsequently, the opinions of the seven experts are synthesized. Let h be the number of decision makers k, where k is 1, 2, 3, …, h. Afterwards, using the geometric mean method that is given below, the experts’ opinions can be generalized. The mean of is calculated for each decision maker. The geometric mean method must be adopted instead of the arithmetic mean in order to preserve the reciprocal property [24]. A new judgment matrix with these elements is given by:
Step 4. Buckley [63] suggested that the geometric mean technique be applied to define the fuzzy geometric mean and fuzzy weight of each criterion. Afterwards, normalize each row of the fuzzy matrix for the fuzzy number to get the fuzzy number vector as a new judgment matrix.
Step 5. Normalize the row of the fuzzy number vector of for the triangular fuzzy number to obtain the fuzzy synthetic extent value of vector for the fuzzy number [64].
where is the derivation of the sum of the fuzzy number vector for the triangular fuzzy number and it is calculated by:
Step 6. Perform the defuzzification that is derived from the membership function to obtain non-fuzzy numbers for each criterion. represents the set of non-fuzzy numbers derived from the triangular membership function using the following equation [60,65,66]:
and represents the set of non-fuzzy numbers that are derived from the trapezoidal membership function using the following equation [54,55]:
Step 7. Define the final non-fuzzy normalization weight for the fuzzy number.
Step 8. Determine whether the comparisons are consistent or inconsistent while using a consistency ratio (CR), as calculated by the following formula:
where CI is the consistency index.
when λav is the average value of the consistency vector and n is the number of criteria.
CR is calculated from the ratio between CI, which is derived from the comparison matrix and the random consistency index (RI). The RI is the consistency index of a randomly generated pairwise comparison matrix, simply obtained from the random inconsistency indices that are shown in Table 3.
If CR < 0.10, the ratio indicates a reasonable level of consistency. However, if CR > 0.10, then the value of the ratio indicates inconsistent judgments.
The consistency ratio related to a comparison matrix is referred to as consistent if for all . However, the consistency would not be forced. Saaty proved that, for a consistent reciprocal matrix, the largest eigenvalue is equal to the size of the comparison matrix or . Saaty [67] then determined a measure of consistency, which is called the CI, as a deviation or degree of consistency [68].
Step 9 Integration in GIS
After obtaining the weights for the AHP and the FAHP, they are integrated using the Boolean operations and the weighted linear combination (WLC).
where is the number of factors, is the weight value of the i factor, and is the score of the i factor.
WLC has been typically applied to the map overlay approach for land use suitability analysis [69]. However, GIS implementations of WLC are often used without duly delineating and verifying the underlying assumptions in suitability criteria [70,71]. Recently, researchers [69,72,73,74] proposed integrating the GIS and MCDM methods. This method utilizes a combination and manipulation of geographical data and decision maker preferences according to specified decision rules, whereas the parametric method only uses the multiplication for the score of all factors, as shown in Equation (1).
All of the factors described in Table 1 are diagnostic factors. They differ based on crop requirements. The different weight priority of each criterion is calculated while using the AHP and FAHP approaches, including both the triangular fuzzy set and the trapezoidal fuzzy set. All of the factors are converted as layers to be mathematically overlaid using the GIS functions to identify eucalyptus suitability by each approach.
4. Results
A land suitability map for the eucalyptus plantation is produced based on eucalyptus requirements, as shown in Table 1. Each factor is divided into four categories: highly suitable, moderately suitable, marginally suitable, and not suitable.
A matrix of the AHP and the FAHP is created based on the analysis of priority ratings from the seven experts as a pairwise comparison matrix. The geometric mean method is applied to the priority indications, as discussed in step 4. The factors of eucalyptus suitability are constructed for the AHP, the triangular fuzzy number, and the trapezoidal fuzzy number, as shown in Table 4, Table 5 and Table 6, respectively.
The consistency of the pairwise judgment of each comparison matrix is checked while using the CI and CR equations. The CR values should be less than 0.1 for the results to be acceptable. The main criteria using AHP are λav = 3.0011, CI = 0.0005, and CR = 0.0009; the main criteria using the triangular fuzzy number are λav = 3.009, CI = 0.0045, and CR = 0.0077; and, the main criteria using the trapezoidal fuzzy number are λav = 3.0083, CI = 0.0042, and CR = 0.0072. In addition, sub criterion using AHP shows that climate λav = 2.0000, soil characteristic λav = 7.0522, CI = 0.0087, CR = 0.0057, and topography λav = 2.000. The sub criterion for triangular fuzzy number shows that climate λav = 1.016, soil characteristics λav = 7.1596, CI = 0.0266, CR = 0.0175, and topography λav = 2.0000. The trapezoidal fuzzy number shows that λav for climate = 2.0041, soil characteristics λav = 7.2020, CI = 0.0337, CR = 0.0221, and topography λav = 2.000. These values are all acceptable, and therefore, consistent. Remarkably, there is no possibility of checking the CR, because there are only two factors; RI is 0 as the sub main criterion of climate and topography.
The final weights are computed through the main criteria weights and sub-criteria weights for AHP and both fuzzy numbers. The final weights of each criterion while using AHP, triangular FAHP, and trapezoidal FAHP are shown in Table 7, Table 8 and Table 9, respectively. The weights of AHP are stronger than both FAHPs, whereas the smallest fraction weights belong to the trapezoidal FAHP. The FAHP is not only a small fraction, but each factor has little difference. It is gradually closed to be smoother than AHP.
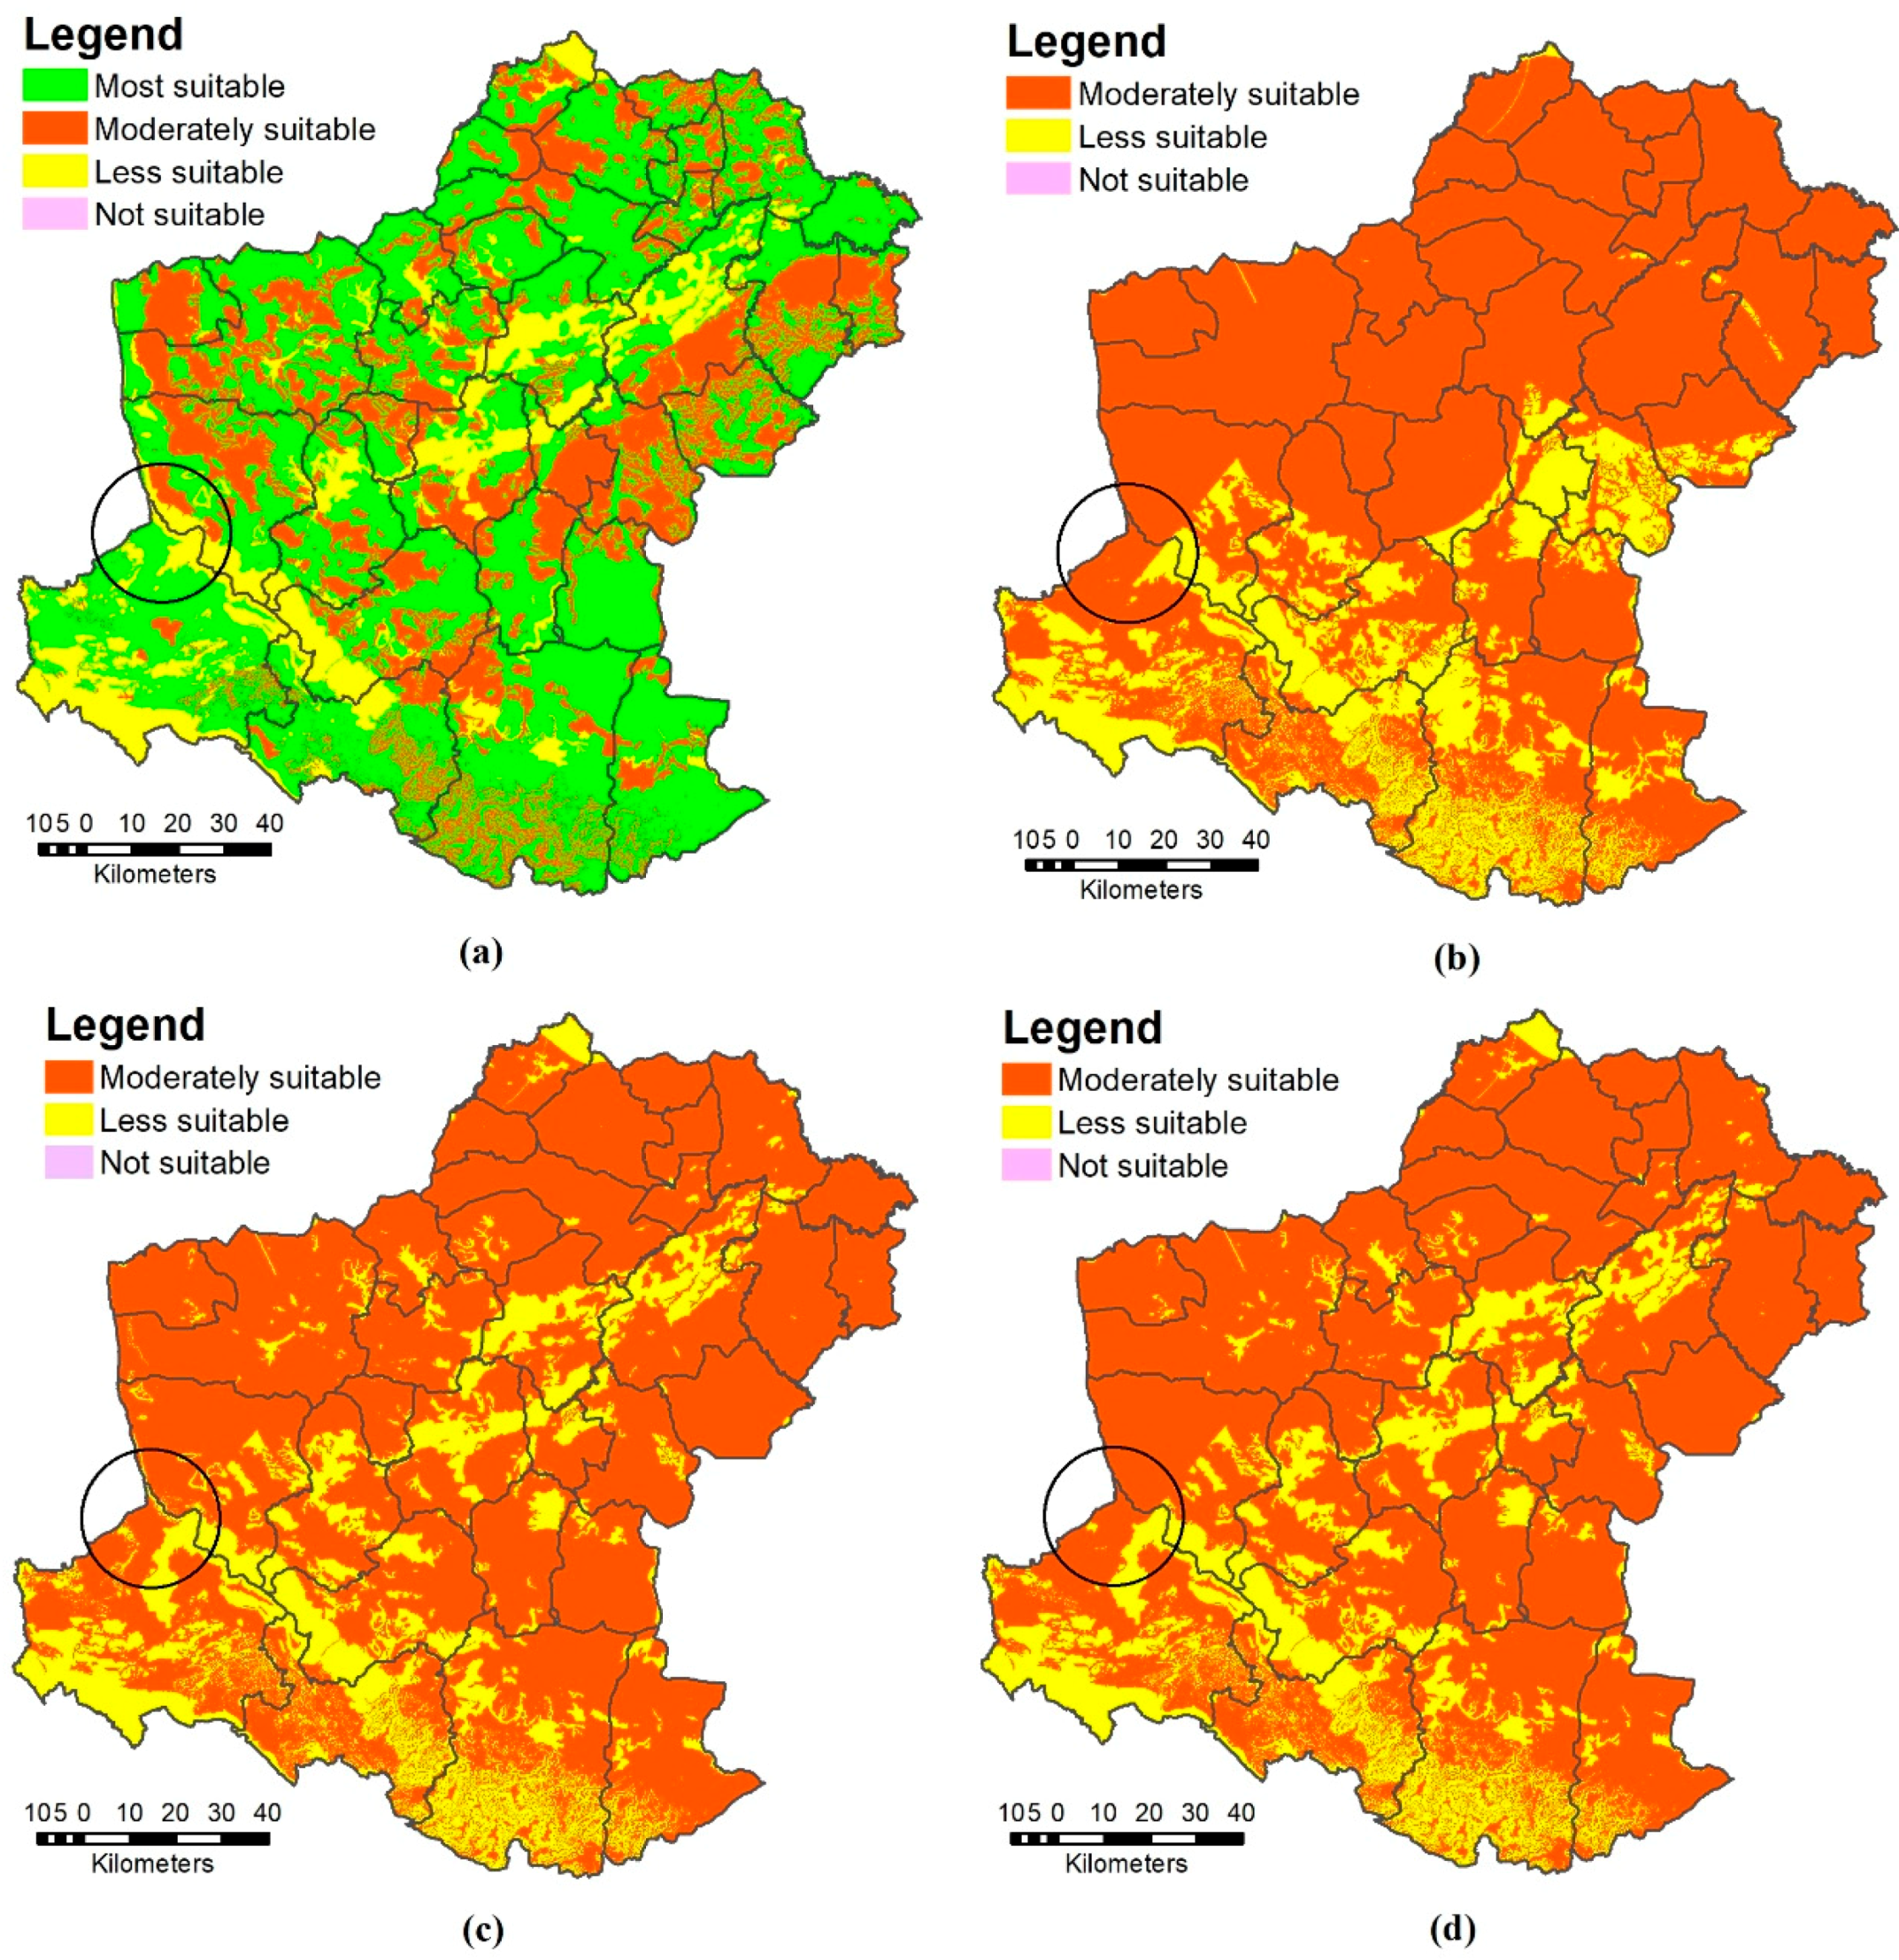
Finally, integrating the criteria weights from the AHP and the FAHP, the triangular fuzzy set and the trapezoidal fuzzy set, and the non-integrating weight from the parametric method generates the eucalyptus suitability classification. The results present a ranking as: highest, moderate, and lowest. The rankings are overlaid and the results of eucalyptus suitability are divided into four levels: highly suitable, moderately suitable, marginally suitable, and not suitable. For the parametric method, the highly suitable area (S1) is approximately 45.38% of the total area, while the moderately suitable area is 46.06%, the marginally suitable area is 8.55%, and the not suitable area is 0.02% of the total area, respectively. AHP and FAHP do not have areas of high suitability, but they do have large areas of moderately suitability: AHP is 78.78%, triangular FAHP is 77.94%, and trapezoidal FAHP is 78.26%. The marginally suitable areas are 21.22% for AHP, 22.06% for triangular FAHP, and 21.74% for trapezoidal FAHP; very little area is not suitable for all of the methods, as shown in Table 10. The suitable areas of each method are different; for example, the highly suitable (S1) area and moderately suitable (S2) area for the parametric method are nearly equal, whereas AHP and FAHP have no highly suitable areas, because the parametric method has no expert opinions, like AHP and FAHP.
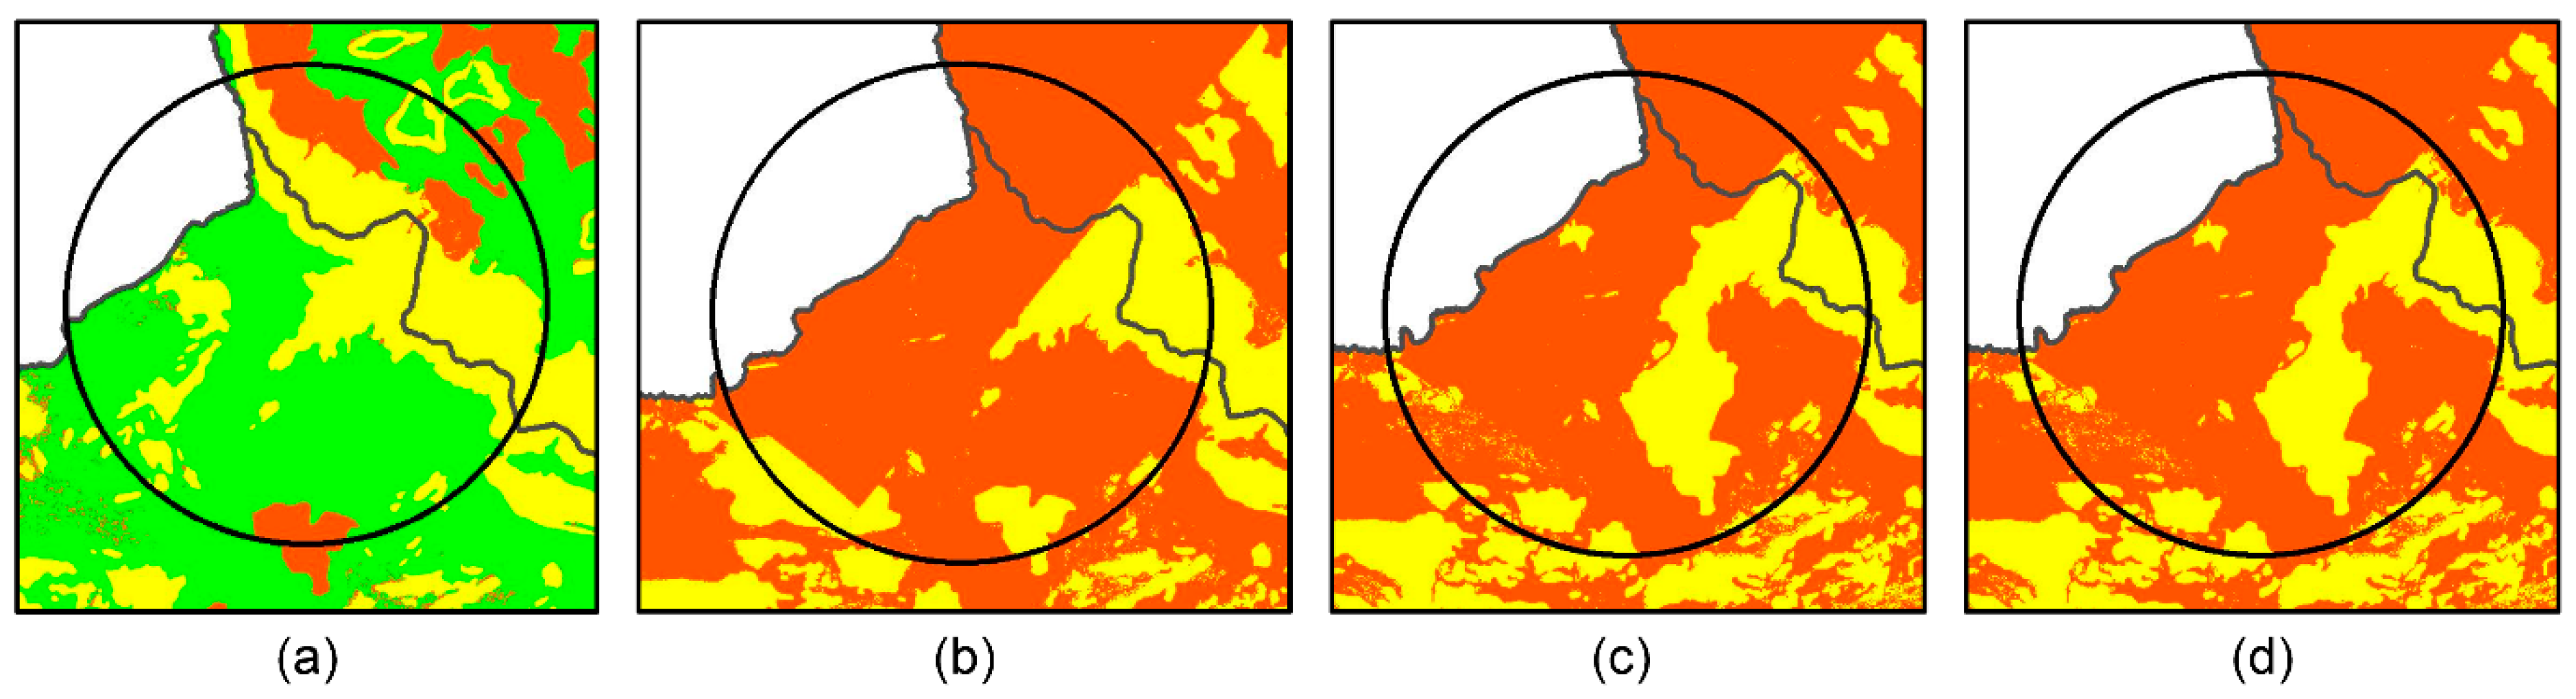
The results of overlaying the physical land suitability classification for eucalyptus show that most of the area is suitable for growing eucalyptus. There is only a few areas that are not suitable, and some are limited for such growth due to slope complex or other factors. The areas are classified for eucalyptus, as shown in Figure 4. The categories of different classes of eucalyptus suitability include suitable (S1), moderately suitable (S2), marginally suitable (S3), and not suitable (N). Figure 5 shows a few different results for very small pieces of land for the extended area of the results for each method.
Small fractions are the different classifications between TriFAHP and TraFAHP. For example, the circle highlights the differences in the two methods. The TriFAHP is drawn as less suitable, whereas the TraFAHP is drawn as moderately suitable.
4.1. Verification of Results
The results of eucalyptus land suitability under the four methods (parametric, AHP, TriFAHP, and TraFAHP) were compared to the results of the eucalyptus suitability assessment that was conducted by the Land Development Department (LDD) of Thailand as a benchmark, while using the land suitability national standard map of Thailand. Kappa analysis was carried out to check the accuracy of the results from the four methods; the results are available at http://tiny.cc/7hq13y. (It includes two sheets, where sheet 1 is showing result from each method to compare with the suitable area using ArcGIS, and sheet 2 presents the accuracy assessment using Kappa analysis.) A discrete multivariate technique was used for accuracy assessment to statistically determine whether one error matrix is significantly different from another [75]. The result of performing a Kappa analysis is a KHAT statistic, which is another measure of agreement or accuracy [76]. This measure of agreement is based on the difference between the actual agreements in the error matrix [77]. To check for accuracy, the suitable areas for each method are compared with the national standard map. For example, how many S1 values derived from the model matched with S1 values from the national standard map; these values were compared in a matrix. Finally, the Kappa analysis of this study shows that the trapezoidal FAHP was found to be the most accurate, which indicates an overall accuracy of 90.16% and a KHAT of 90%; the moderate accuracy results were from the triangular FAHP, which indicates an overall accuracy of 80.03% and a KHAT of 80%. The AHP was less accurate, with an overall accuracy of 71.08% and a KHAT of 71%; even less accurate was the parametric method, with an overall accuracy of 67.52% and a KHAT of 68% (Table 11). The verification compares the four methods while using the Land Development Department’s method. It clearly shows that the trapezoidal FAHP method was the most accurate in identifying eucalyptus plantation suitability. It is calculated from physical and socioeconomic approaches (the Land Development Department uses the parametric method plus a socio-economic approach to make the standard map of land suitability), and it uses more factors than were used in this study, but the results of the study are in concordance with the standard map.
4.2. Comparison of the Results
Table 12 shows the comparison among the four methods for the weighting of 11 factors from three methods (except for the parametric method, where there is no weight); AHP, TriFAHP, and TraFAHP vary slightly in the number of factors used; both weights from the FAHP methods are very different. Consequently, the suitability using the parametric method shows that the proportion of the suitable area is not different between S1 and S2, with 45.38% and 46.06%, respectively, whereas S3 and N are 8.55% and 0.02%, respectively. The suitability area that was derived from the weighting methods using AHP and FAHP show that the suitability results fall into only S2 and S3 as AHP 78.78% and 21.22%, TriFAHP 77.94% and 22.06%, and TraFAHP 78.26% and 21.74%, respectively. The suitability areas for those weighting methods are not very different, but the accuracy from the validation shows that TraFAHP has the highest accuracy among them. The comparison proves that the efficiency of FAHP is more accurate than the other methods, especially for TraFAHP, which maintains the best accuracy of 90% for eucalyptus suitability in this area. Remarkably, the suitable areas using the parametric method fall into every degree of suitability, because the parametric method uses a score from nature without expert opinions. In fact, in nature, the requirements of each plant are different, and experts can identify the degree of important factors; thus, the suitable areas using the weighting factors only fall into S2 and S3 using ordinary AHP, while the uncertainty of the expert opinions remains. Fuzzy logic can mitigate the problem of expert uncertainty. FAHP solves both the uncertainty in nature from crop requirements and uncertainty from expert knowledge.
Bustillos-Herrera et al. (2007) evaluated Grandis eucalyptus suitability in Mexico while using linear, J form, and sigmoidal methods with seven factors; they found that the eucalyptus plantation in that area was unsuitable due to the climate, which was the most importance factor. Armin and Mahiny (2010) assessed eucalyptus suitability using similar criteria for a similar species of eucalyptus and similar fuzzy logic approaches and factors, but in the region of Iran. They found that Iran is more suitable for eucalyptus than Mexico. This study uses fuzzy logic as triangular and trapezoidal fuzzy set numbers, with 11 factors in Thailand. The results showed that the area suitable to grow eucalyptus is more than 70%.
5. Discussion
We found that the FAHP can improve the uncertainty of weighting by expert opinions while using the AHP method. The FAHP solves the uncertainty of the bias of expert opinions. Its results show smaller fractions in the real area in terms of the differences in levels of suitability. The results of the triangular and the trapezoidal FAHPs are rarely different on the map, but they are different in the real area and in terms of the level of suitability. Furthermore, the FAHP can optimize the number of factors and also present the most remarkable evaluation approach for eucalyptus suitability, as in the study of Wang and Lin (2003), who showed that the fuzzy majority can be developed to rank the candidates into a partial order or a complete order according to their importance [78]. This saves the time and costs in deriving the data that are needed for each factor in the model for crop evaluation.
The FAHP can reasonably improve the accuracy of the eucalyptus suitability assessment, and the trapezoidal FAHP approach was found to be the most suitable, as it provided the most accurate results when compared to the other methods. Expert opinions using FAHP differ more than the expert opinions using the parametric method; thus, the factors were calculated without the opinions of experts, or every factor had equal importance. The results of this method show that the study area is suitable. In fact, in nature, the different factors that a plant may need for its growth are not equally important. Similar to the opinion of Bagaram et al. (2016), the AHP method is the best way of solving the problem of unequal important factors in nature by giving weight to the experts, but expert opinions remain uncertain due to human behavioral bias or even because of experts’ backgrounds [79].
This study could address this land use problem. Moreover, it could be very useful for organizations that are responsible for land evaluation or land use zoning, and those looking to optimize land utilization and enhance crop yield. Finally, if a crop is located on land that is suitable, it can sustain the farmers and help ensure their ability to occupy those lands. The farmers can use this data at a practical level on their lands. The FAHP provides better predictive accuracy than the parametric and AHP methods, because the fuzzy scale does not use integer values and it has small fractions between 0–1; this advantage came to valuate land as the spatial predictions in the model of land suitability classification. Although the different weights among them are small in theory, they affect the predicted spatial areas, as most of the areas fall in to highly suitable areas while using the parametric method, as shown in the map in Figure 4a, whereas, while using AHP and FAHP, large areas fall in to moderately suitable areas, as shown in the map in Figure 4b–d. This is concordant to the situation in the real world, in which factors that a plant needs in terms of growth should have different importance. Farmers, and especially those with small farms, can make better decisions about growing cash crops using the results of this study.
6. Conclusions
This study addressed the problem of determining cash crop suitability in Nakhon Ratchasima Province in Thailand. Four decision approaches (parametric, AHP, TriFAHP, and TraFAHP) that were integrated with GIS were applied based on three main decision criteria describing factors, such as climate, topography, and soil characteristics to determine cash crop suitability. The solution of this MCDM problem, like the uncertainty of humans’ opinions, requires the use of the appropriate MCDA method and it should be based on land suitability assessment.
The methodological contribution of this study was to develop an integrated method of FAHP with GIS based on the degree of certainty for all criteria for cash crop suitability assessment. For this purpose, the foundations of the parametric, AHP, and FAHP methods were presented. Additionally, a WLC method that was integrated with GIS was used for comparison purposes. Two methods, AHP and FAHP, recommended the same decision-making options, which were that the Nakhon Ratchasima Province has moderate cash crop suitability. Thus, this area contains abundant land for cash crop plantation.
In addition, for the parametric method applied to determining cash crop suitability, it is important to note that no one factor was more important than other factors, whereas some factors were given more importance than other factors for AHP and FAHP. Only FAHP solved the uncertainty of important factors. The validation using Kappa statistical analyses was compared to the reference map and it presented as being relatively simple and transparent for use by decision makers. The results demonstrated that the decision problem solution that was obtained with TraFAHP was more accurate and less sensitive with respect to the criteria weights than the solution that was obtained using other methods.
Highlights of the study include the following:
- It was confirmed that the TraFAHP approach is suitable for cash crop assessment.
- The performances of the parametric, AHP, TriFAHP, and TraFAHP approaches in classifying cash crop suitability classes were different; both FAHP methods performed relatively better than the other methods.
- Nakhon Ratchasima Province has high potential of land suitability for cash crop plantation.
- If there are many factors in the model, the degree of weight for each factor is nearly equal, and there are more differences in the first order and the last order.
- Some factors can be eliminated due to their decreased significance without any effect on the results; thus, individual studies can determine the number of factors to use in the model.
In future studies, it would be interesting to account for the natural imprecision of the model’s input data. For example, another potential direction of the development of the proposed method is to extend the main criteria, e.g., policy, economic, social, or environmental (currently there is only the physical aspect), for strong sustainability. This study can be extended to study a time series to improve the model accuracy, because the opinions of experts can change at any time. Thus, the experiment should be periodically repeated and evaluated until the model is stable, and then validated while using a sampling plot in the field. In addition, the model can be developed to apply Machine Learning Programing (MLP), such as the Genetic Algorithm or Artificial Neural Network (ANN). Moreover, it can also be applied to other cash crops, such as acacia.
Author Contributions
Conceptualization, R.R., N.K.T., and R.P.S.; Writing-Review and editing, R.R., N.K.T., and R.P.S.; Visualization, R.R., N.K.T., and R.P.S.; Methodology, R.R.; Software, R.R.; Validation, R.R.; Formal Analysis, R.R.; Investigation, R.R.; Resources, R.R.; Data Curation, R.R.; Writing-Original Draft Preparation, R.R.; Project administration and funding acquisition, R.R.
Funding
This research was funded by the Ministry of Agriculture and Cooperatives, Thailand.
Acknowledgments
The authors would like to express their gratitude to the Agricultural Land Reform Office and Ministry of Agriculture and Cooperatives in Thailand for their valuable contributions to the manuscript. Laor Boongasame is sincerely appreciated for providing valuable feedback. Raw data can be provided by the Asian Institute of Technology in response to officially submitted requests to the first author.
Conflicts of Interest
The authors declare no conflicts of interest.
References
- Ball, J.B. Development of Eucalyptus plantations—An overview. In Proceedings of the Regional Expert Consultation on Eucalyptus, Bangkok, Thailand, 4–8 October 1993; White, K., Ball, J., Kashio, M., Eds.; FAO Regional Office for Asia and Pacific: Rome, Italy, 1996. [Google Scholar]
- Khattabi, A. Socio-Economic Importance of Eucalyptus Plantations in Morocco. In Global Concerns for Forest Resource Utilization: Sustainable Use and Management; Yoshimoto, A., Yukutake, K., Eds.; Springer: Dordrecht, The Netherlands, 1999; pp. 73–82. ISBN1 978-0-7923-5968-5. ISBN2 978-90-481-5320-6. [Google Scholar]
- Pruchapruth, S. The Role of Eucalyptus—Current Problems in Thailand. In Proceedings of the Regional Expert Consultation on Eucalyptus, Bangkok, Thailand, 4–8 October 1993; Kashio, M., White, K., Eds.; FAO Regional Officer for Asia and Pacific: Rome, Italy, 1996. Available online: http://www.fao.org/docrep/005/AC772E/ac772e0q.htm#bm26 (accessed on 17 December 2017).
- Nonghanphitak, N.; Kanjanalai, W. Land Use Zoning for Economic Crops: Eucalytus; Land Development Department: Bangkok, Thailand, 2005.
- Chang, D.Y. Applications of the extent analysis method on fuzzy AHP. Eur. J. Oper Res. 1996, 95, 649–655. [Google Scholar] [CrossRef]
- Bell, D.R.; Silalertruksa, T.; Gheewala, S.H.; Kamens, R. The net cost of biofuels in Thailand—An economic analysis. Energy Policy 2011, 39, 834–843. [Google Scholar] [CrossRef]
- Erensal, Y.C.; Demircan, M.L. Determining key capabilities in technology management using fuzzy analytic hierarchy process: A case study of Turkey. Inf. Sci. (Ny) 2006, 176, 2755–2770. [Google Scholar] [CrossRef]
- Gumus, A.T. Evaluation of hazardous waste transportation firms by using a two step fuzzy-AHP and TOPSIS methodology. Expert Syst. Appl. 2009, 36, 4067–4074. [Google Scholar] [CrossRef]
- Heo, E.; Kim, J.; Boo, K.-J. Analysis of the assessment factors for renewable energy dissemination program evaluation using fuzzy AHP. Renew. Sustain. Energy Rev. 2010, 14, 2214–2220. [Google Scholar] [CrossRef]
- Malczewski, J. GIS and Mulicriteria Decision Analysis; John Wiley & Sons: New York, NY, USA, 1999; p. 182. ISBN 978-0-471-32944-2. [Google Scholar]
- Ziemba, P.; Wątróbski, J.; Zioło, M.; Karczmarczyk, A. Using the PROSA Method in Offshore Wind Farm Location Problems. Energies 2017, 10, 1755. [Google Scholar] [CrossRef]
- Tsolaki-Fiaka, S.; Bathrellos, G.D. Multi-Criteria Decision Analysis for an Abandoned Quarry in the Evros Region (NE Greece). Land 2018, 7, 43. [Google Scholar] [CrossRef]
- Liao, H.; Wu, D.; Huang, Y.; Ren, P.; Xu, Z.; Verma, M. Green Logistic Provider Selection with a Hesitant Fuzzy Linguistic Thermodynamic Method Integrating Cumulative Prospect Theory and PROMETHEE. Sustainability 2018, 10, 1291. [Google Scholar] [CrossRef]
- Zhao, H.; Zhao, H.; Guo, S. Comprehensive Performance Evaluation of Electricity Grid Corporations Employing a Novel MCDM Model. Sustainability 2018, 10, 2130. [Google Scholar] [CrossRef]
- Pan, L.; Ren, P.; Xu, Z. Therapeutic Schedule Evaluation for Brain-Metastasized Non-Small Cell Lung Cancer with A Probabilistic Linguistic ELECTRE II Method. Int. J. Environ. Res. Public Health 2018, 15, 1799. [Google Scholar] [CrossRef] [PubMed]
- De la Rosa, D.; van Diepen, C.A. Qualitative and Quantitative Land Evolution. In 1.5. Land Use and Land Cover, Encyclopedia of Life Support System (EOLSS-UNESCO); Eolss Publishers: Oxford, UK, 2002; Available online: http://digital.csic.es/bitstream/10261/38194/1/Qualitative%20and%20quantitative%20land%20evaluations.pdf (accessed on 16 February 2015).
- Storie, R.E. Storie index soil rating (revised). In Special Publication 3203; Division of Agricultural Science, University of California: Berkeley, CA, USA, 1978; Available online: http://anrcatalog.ucanr.edu/pdf/3203.pdf (accessed on 2 October 2017).
- Saaty, T.L. Making and Validating Complex Decisions with the AHP / ANP 2. J. Syst. Sci. Syst. Eng. 2005, 14, 1–36. [Google Scholar] [CrossRef]
- Feizizadeh, B.; Jankowski, P.; Blaschke, T. A GIS based spatially-explicit sensitivity and uncertainty analysis approach for multi-criteria decision analysis. Comput. Geosci. 2014, 64, 81–95. [Google Scholar] [CrossRef]
- Dyer, R.; Forman, E.; Mustafa, M. Decision Support for Media Selection Using the Analytic Hierarchy Process. J. Advert. 1992, 21, 59–72. [Google Scholar] [CrossRef]
- Belton, V.; Gear, T. On a short-coming of Saaty’s method of analytic hierarchies. Omega 1983, 11, 228–230. [Google Scholar] [CrossRef]
- Millet, I.; Harker, P.T. Globally effective questioning in the Analytic Hierarchy Process. Eur. J. Oper. Res. 1990, 48, 88–97. [Google Scholar] [CrossRef]
- Ra, J.W. Hierarchy Decision Process. In Technology Management: The New International Language, Proceedings of the 1991 Portland International Conference on Management of Engineering and Technology -PICMET’91, Portland, OR, USA, 27–31 October 1991; IEEE: Piscataway, NJ, USA, 1991. [Google Scholar]
- Ishizaka, A.; Labib, A. Review of the main developments in the Analytic Hierarchy Process. Expert Syst. Appl. 2011, 38, 14336–14345. [Google Scholar] [CrossRef]
- Öztürké, M.; Tsoukiàs, A.; Vincke, P. Preference Modelling. In Multiple Criteria Decision Analysis: State of the Art Surveys; Figueira, J., Greco, S., Ehrogott, M., Eds.; Springer: New York, NY, USA, 2005. [Google Scholar] [CrossRef]
- Wątróbski, J.; Jankowski, J.; Ziemba, P.; Karczmarczyk, A.; Zioło, M. Generalised framework for multi-criteria method selection. Omega 2018, 86, 107–124. [Google Scholar] [CrossRef]
- Guitouni, A.; Martel, J.-M.; Bélanger, M.; Hunter, C. Managing a Decision Making Situation in the Context of the Canadian Airspace Protection; Document de Travail 1999-021; Faculté des Sciences de L’administration, Laval University: Quebec, QC, Canada, 1999; Available online: http://www.fsa.ulaval.ca/sirul/1999-021.pdf (accessed on 15 May 2018).
- Guitouni, A.; Martel, J.M. Tentative guidelines to help choosing an appropriate MCDA method. Eur. J. Oper. Res. 1998, 109, 501–521. [Google Scholar] [CrossRef]
- Zadeh, L.A. Fuzzy Sets. Inf. Control 1965, 8, 338–353. [Google Scholar] [CrossRef]
- Reddy, G.M. Trapezoidal fuzzy numbers in extent analysis method in fuzzy AHP. Int. J. Concept. Comput. Inf. Technol. 2015, 3, 69–71. [Google Scholar]
- Ishizaka, A. Comparison of Fuzzy logic, AHP, FAHP and Hybrid Fuzzy AHP for new supplier selection and its performance analysis. Int. J. Integr. Supply Manag. 2014, 9, 1–22. [Google Scholar] [CrossRef]
- Medina, J.; Ojeda-Aciego, M. Multi-adjoint t-concept lattices. Inf. Sci. (Ny) 2010, 180, 712–725. [Google Scholar] [CrossRef]
- Nowakov, J.; Prilepokl, M.; Snasel, V. Medical Image Retrieval Using Vector Quantization and Fuzzy S-tree. J. Med. Syst. 2016, 41, 18. [Google Scholar] [CrossRef] [PubMed]
- Kumar, A.; Kumar, D.; Jarial, S.K. A Hybrid Clustering Method Based on Improved Artificial Bee Colony and Fuzzy C-Means Algorithm. Int. J. Aritif. Intell. 2017, 15, 40–60. [Google Scholar]
- Hsieh, H.N.; Chen, J.F.; Do, Q. Applying TRIZ and Fuzzy AHP Based on Lean Production to Develop an Innovative Design of a New Shape for Machine Tools. Information 2015, 6, 89–110. [Google Scholar] [CrossRef]
- Lermontov, A.; Yokoyama, L.; Lermontov, M.; Augusta, M.; Machado, S. A fuzzy water quality index for watershed quality analysis and management. In Environmental Management in Practice; Broniewicz, E., Ed.; InTech Publishers: Rijeka, Croatia, 2011; p. 458. ISBN 978-953-307-358-3. [Google Scholar]
- Hefny, H.A.; Elsayed, H.M.; Aly, H.F. Fuzzy multi-criteria decision making model for different scenarios of electrical power generation in Egypt. Egypt. Inf. J. 2013, 14, 125–133. [Google Scholar] [CrossRef]
- Zhu, K.J.; Jing, Y.; Chang, D.Y. A discussion on extent analysis method and applications of fuzzy AHP. Eur. J. Oper. Res. 1999, 116, 450–456. [Google Scholar] [CrossRef]
- Dinh, L.C.; Duc, T.T. GIS and Analytic Hierarchy Process for Land Evaluation; Asia Geospatial Digest: New Delhi, India, 2012; Available online: https://www.geospatialworld.net/article/gis-and-analytic-hierarchy-process-for-land-evaluation (accessed on 16 March 2015).
- Ibrahim, E.H.; Mohamed, S.E.; Atwan, A.A. Combining fuzzy analytic hierarchy process and GIS to select the best location for a wastewater lift station in El-Mahalla El-Kubra, North Egypt. Int. J. Eng. Technol. 2011, 11, 44–50. [Google Scholar]
- Elomda, B.M.; Hefny, H.A.; Hassan, H.A. An extension of fuzzy decisi on maps for multi-criteria decision-making. Egypt. Inf. J. 2013, 14, 147–155. [Google Scholar] [CrossRef]
- Paktinat, M.; Danaei, A. An application of fuzzy AHP for ranking human resources development indices. Manag. Sci. Lett. 2014, 4, 993–996. [Google Scholar] [CrossRef]
- Srdjevic, B.; Medeiros, Y.D.P. Fuzzy AHP assessment of water management plans. Water Resour. Manag. 2008, 22, 877–894. [Google Scholar] [CrossRef]
- Önüt, S.; Efendigil, T.; Kara, S.S. A combined fuzzy MCDM approach for selecting shopping center site: An example from Istanbul, Turkey. Expert Syst. Appl. 2010, 37, 1973–1980. [Google Scholar] [CrossRef]
- Daniel, E.; Friday, E. A fuzzy AHP model for selection of university academic staff. Int. J. Comput. Appl. 2016, 141, 19–26. [Google Scholar] [CrossRef]
- Zheng, G.; Zhu, N.; Tian, Z.; Chen, Y.; Sun, B. Application of a trapezoidal fuzzy AHP method for work safety evaluation and early warning rating of hot and humid environments. Saf. Sci. 2012, 50, 228–239. [Google Scholar] [CrossRef]
- Do, Q.H.; Chen, J.; Hsieh, H. Trapezoidal fuzzy AHP and fuzzy comprehensive evaluation approaches for evaluating academic library service. WSEAS Trans. Comput. 2015, 14, 607–619. [Google Scholar]
- Abdullah, L.; Najib, L. Integration of interval Type-2 fuzzy sets and analytic hierarchy process: Implication to computational procedures. In Proceedings of the 23rd Malaysian National Symsposium of Mathematical Sciences (SKSM23), Johor Bahru, Malaysia, 24–26 November 2015; Salleh, S., Aris, N., Maan, N., Yusof, Y., Bahar, A., Zainuddin, Z.M., Lee, M.H., Ahmed, T., Eds.; AIP Publishing: New York, NY, USA, 2016. [Google Scholar]
- George, H. An Overview of Land Evaluation and Land Use Planning at FAO. 2000. Available online: https://nanopdf.com/download/land-evaluation-at-fao-food-and-agriculture-organization-of-the_pdf (accessed on 31 October 2017).
- McDowell, R.W.; Snelder, T.; Harris, S.; Lilburne, L.; Larned, S.T.; Scarsbrook, M.; Curtis, A.; Holgate, B.; Phillips, J.; Taylor, K. The land use suitability concept: Introduction and an application of the concept to inform sustainable productivity within environmental constraints. Ecol. Indic. 2017, 91, 212–219. [Google Scholar] [CrossRef]
- Teniwut, W.A.; Djatna, T. GIS-Based multi-criteria decision making model for site selection of seaweed farming information centre: A lesson from small islands, Indonesia. Decis. Sci. Lett. 2019, 8, 137–150. [Google Scholar] [CrossRef]
- Ioannou, K.; Tsantopoulos, G.; Arabatzis, G. A Spatial Decision Support System Framework for the Evaluation of Biomass Energy Production Locations: Case Study in the Regional Unit of Drama, Greece. Sustainability 2018, 10, 531. [Google Scholar] [CrossRef]
- Mokarram, M.; Mirsoleimani, A. Using Fuzzy-AHP and order weight average (OWA) methods for land suitability determination for citrus cultivation in ArcGIS (Case study: Fars province, Iran). Phys. A Stat. Mech. Appl. 2018, 508, 506–518. [Google Scholar] [CrossRef]
- Bustillos-Herrera, J.A.; Valdez-Lazalde, J.R.; Aldrete, A.; de Jesús González Guillén, M. Land suitability for eucalyptus (Eucalyptus grandis Hill ex Maiden) plantations: definition through the analytic hierarchy process and GIS. Agrociencia 2007, 41, 787–796. [Google Scholar]
- Armin, M.; Mahiny, A.S. A fuzzy multi-criteria assessment of land suitability for land plantation with Eucalyptus grandis. J. Appl. Biol. Sci. 2010, 4, 47–53. [Google Scholar]
- Nakhon Ratchasima Provincial Office. Summary Report of Nakhon Ratchasima Province, Thailand, 2012; Nakhon Ratchasima Provincial Office: Nakhon Ratchasima, Thailand, 2012. Available online: http://www.nakhonratchasima.go.th/korat2528/index.php/2016-08-28-06-25-33/2016-08-28-06-36-13 (accessed on 16 March 2015).
- Tamura, T. Landform Development and Related Environmental Changes in the Chi River Basin, Northeast Thailand. Sci. Rep. Tohoku Univ. 7th Ser. Geogr. 1992, 42, 107–127. (In Japanese). Available online: http://hdl.handle.net/10097/45198 (accessed on 7 May 2019).
- IUSS Working Group WRB World reference base for soil resources 2014, update 2015 International soil classification system for namin soils and creating legends for soil maps. In World Soil Resources Reports No. 106; FAO: Rome, Italy, 2015; Available online: http://www.fao.org/3/i3794en/I3794en.pdf (accessed on 10 August 2018).
- Demirel, T.; Çetin Demirel, N.; Kahraman, C. Fuzzy Analytic Hierarchy Process and its Application. In Fuzzy Multi-Criteria Decision Making, Springer Optimization and Its Applications; Kahraman, C., Ed.; Springer: Boston, MA, USA, 2008; Volume 16, pp. 53–83. ISBN1 978-0-387-76812-0. ISBN2 978-0-387-76813-7. [Google Scholar]
- Gumus, A.; Yayla, A.; Çelik, E.; Yildiz, A. A combined fuzzy-AHP and fuzzy-GRA methodology for hydrogen energy storage method selection in Turkey. Energies 2013, 6, 3017–3032. [Google Scholar] [CrossRef]
- Wang, Y.M.; Chin, K.S. Fuzzy analytic hierarchy process: A logarithmic fuzzy preference programming methodology. Int. J. Approx. Reason 2011, 52, 541–553. [Google Scholar] [CrossRef]
- Sari, I.U.; Behret, H.; Kahraman, C. Risk Governance of Urban Rail Systems Using Fuzzy AHP: the case of Istanbul. Int. J. Uncert. Fuzz. Knowl.-Based Syst. 2012, 20, 67–79. [Google Scholar] [CrossRef]
- Buckley, J.J. Fuzzy hierarchical analysis. Fuzzy Sets Syst. 1985, 17, 233–247. [Google Scholar] [CrossRef]
- Zhang, L. Comparison of Classical Analytic Hierarchy Process (AHP) Approach and Fuzzy AHP Approach in Multiple-criteria Decision Making for Commercial Vehicle Information Systems and Networks (CVISN) Project. Master’s Thesis, University of Nebraska, Lincoln, NE, USA, 2010. [Google Scholar]
- Hsieh, T.Y.; Lu, S.T.; Tzeng, G.H. Fuzzy MCDM approach for planning and design tenders selection in public office buildings. Int. J. Proj. Manag. 2004, 22, 573–584. [Google Scholar] [CrossRef]
- Sun, C.C. A performance evaluation model by integrating fuzzy AHP and fuzzy TOPSIS methods. Expert Syst. Appl. 2010, 37, 7745–7754. [Google Scholar] [CrossRef]
- MacCormac, E.R. Review of: ‘Decision making for leaders: The analytical hierarchy process for decisions in a complex world’ by Thomas L. Saaty. Eng. Econ. 1983, 29, 74–75. [Google Scholar] [CrossRef]
- Saaty, T.L. Decision making with the analytic hierarchy process. Int. J. Serv. Sci. 2008, 1, 83–98. [Google Scholar] [CrossRef]
- Heywood, I.; Oliver, J.; Tomlinson, S. Building an exploratory multi-criteria modelling environment for spatial decision support. Int. J. Geogr. Inf. Sci. 1995, 7, 127–136. [Google Scholar]
- Hopkins, L.D. Methods for Generating Land Suitability Maps: A Comparative Evaluation. J. Am. Inst. Plan. 1977, 43, 386–400. [Google Scholar] [CrossRef]
- Pereira, J.M.C.; Duckstein, L. A multiple criteria decision-making approach to GIS-based land suitability evaluation. Int. J. Geogr. Inf. Syst. 1993, 7, 407–424. [Google Scholar] [CrossRef]
- Hobbs, B.F. A Comparision of weighting methods in power plant sitting. Decis. Sci. 1980, 11, 725–737. [Google Scholar] [CrossRef]
- Lai, S.-K.; Hopkins, L.D. The Meanings of Trade-Offs in Multiattribute Evaluation Methods: A Comparison. Environ. Plan. B Plan Des. 1989, 16, 155–170. [Google Scholar] [CrossRef]
- Malczewski, J. Review Article on the Use of Weighted Linear Combination Method in GIS: Common and Best Practice Approaches. Trans. GIS 2000, 4, 5–22. [Google Scholar] [CrossRef]
- Bishop, Y.M.M.; Fienberg, S.; Holland, P.W.; Light, R.J.; Mosteller, F. Discrete Multivariate Analysis: Theory and Practice. Appl. Psychol. Meas. 1977, 1, 297–306. [Google Scholar] [CrossRef]
- Cohen, J. A Coefficient of Agreement for Nominal Scales. Educ. Psychol. Meas. 1960, 20, 37–46. [Google Scholar] [CrossRef]
- Congalton, R.G.; Green, K. Assessing the Accuracy of Remotely Sensed Data; CRC Press: New York, NY, USA, 1989; p. 104. ISBN 978-1-4200-5512-2. [Google Scholar]
- Wang, J.; Lin, Y.I. A fuzzy multicriteria group decision making approach to select configuration items for software development. Fuzzy Sets Syst. 2003, 134, 343–363. [Google Scholar] [CrossRef]
- Bagaram, B.M.; Mounir, F.; Lahssini, S.; Ponette, Q. Site suitability analysis for cork oak regeneration using GIS based multicriteria evaluation techniques in Maamora forest-Morocco. OALib 2016, 3, 1–9. [Google Scholar] [CrossRef]
Figure 1.
Graph to show the characteristic of triangular and trapezoidal fuzzy number [36].
Figure 1.
Graph to show the characteristic of triangular and trapezoidal fuzzy number [36].

Figure 2.
Graph to show trinangular fuzzy numbers (a) and trapezoidal fuzzy numbers (b) corresponding to linguistic varaibles representing levels of prefernece.
Figure 2.
Graph to show trinangular fuzzy numbers (a) and trapezoidal fuzzy numbers (b) corresponding to linguistic varaibles representing levels of prefernece.

Figure 3.
Methodology framework.

Figure 4.
Map of eucalyptus site suitability using the (a) parametric method, (b) AHP method, (c) triangular fuzzy AHP method, and (d) trapezoidal fuzzy AHP method.
Figure 4.
Map of eucalyptus site suitability using the (a) parametric method, (b) AHP method, (c) triangular fuzzy AHP method, and (d) trapezoidal fuzzy AHP method.

Figure 5.
The extended area of the results for each method using the (a) parametric method, (b) AHP method, (c) triangular AHP method, and (d) trapezoidal AHP method.
Figure 5.
The extended area of the results for each method using the (a) parametric method, (b) AHP method, (c) triangular AHP method, and (d) trapezoidal AHP method.


Table 1.
Linguistic variables and values for pairwise matrix for triangular and trapezoidal members.
Table 1.
Linguistic variables and values for pairwise matrix for triangular and trapezoidal members.
| Linguistic Variables | Fuzzy Number (or Crisp Value) | Triangular Fuzzy Scale | Triangular Reciprocal Fuzzy Scale | Trapezoidal Fuzzy Scale | Triangular Reciprocal Fuzzy Scale |
|---|---|---|---|---|---|
| Just Equal | 1 | (1,1,1) | (1,1,1) | (1,1,1,1) | (1,1,1,1) |
| Equally Important | (1,1,1+x) | (1/(1+x),1,1) | (1,1,0.5+x,1+x) | (1/(1+x),1/(0.5+x),1,1) | |
| Moderately Important | 3 | (3−x,3,3+x) | (1/(3+x),1/3,1/(3−x)) | (3−x,3.5−x,2.5+x,3+x) | (1/(3+x),1/(2.5+x),1/(3.5−x),1/(3−x)) |
| Strongly important | 5 | (5−x,5,5+x) | (1/(5+x),1/5,1/(5−x)) | (5−x,5.5−x,4.5+x,5+x) | (1/(5+x),1/(4.5+x),1/(5.5−x),1/(5−x)) |
| Very Strongly Important | 7 | (7−x,7,7+x) | (1/(7+x),1/7,1/(7−x)) | (7−x,7.5−x,6.5+x,77+x) | (1/(7+x),1/(6.5+x),1/(7.5−x),1/(7−x)) |
| Extremely Important | 9 | (9−x,9,9) | (1/9,1/9,1/(9−x)) | (9−x,9.5−x,9,9) | (1/9,1/9,1/(9.5−x),1/(9−x)) |
| Intermediate values | 2,4,6,8 | (x−1,x,x+1) x=2,4,6,8 | (1/(x+1),1/x,1/(x−1)) | (x−1,x−0.5,x+0.5,x+1) | (1/(x+1),1/(x+0.5),1/(x−0.5),1/(x−1)) |
Table 2.
Diagnostic factors for eucalyptus suitability classification.
| Factor Rating | ||||||
|---|---|---|---|---|---|---|
| Land Quality | Diagnostic Factor | Unit | S1 | S2 | S3 | N |
| Temperature | Mean temp. in growing period (A1) | °C | 20–30 | 30–34 17–20 | >34 | <14 |
| Moisture availability | Annual rainfall (A2) | mm | 1500–2000 | 2000–4000 1000–1500 | >4000 750–1000 | <750 |
| Potential for mechanization | Rock outcrop 2 (B1) | class | A,B,C | D | E | >E |
| Erosion hazard | Slope 3 (B2) | class | A,B,C | D | E | >E |
| Oxygen availability | Soil drainage (C1) | class | 4,5,6 | 3 | 2 | 1 |
| Nutrient availability | Nutrient status 1 (C2) | class | H,M | L | ||
| Nutrient retention | Cation exchange capacity 4 (C3) | cmol, kg−1 | >15 | 3–15 | <3 | |
| Nutrient retention | Base saturation 5 (C4) | % | >35 | <35 | ||
| Rooting condition | Effective soil depth (C5) | cm | >100 | 50–100 | <50 | |
| Excess of salt | Electric conductivity (EC) (C6) | mS m−1 | <4 | 4–8 | >8 | |
| Soil toxicity | Depth of jarosite 6 (C7) | cm | >100 | 80–100 | 40–80 | <40 |
1 Nutrient status: H: organic matter > 3%; M: organic matter 2–3%; L: organic matter 1–2%
2 Rock outcrop: A: little (maximum 1%); B: slight (maximum 4%); C: moderate (maximum 10%);
D: high (maximum 25%); E: very high (> 25%)
3 Slope: A: 0–2% (flat or almost flat); B: 2–5% (gentle slope); C: 5–12% (slope, undulating),
D: 12–20% (moderate); E: 20–35% (steep); F: 35–50% (very steep); G: > 50% (excessive slope)
4 Cation exchange capacity (CEC) is a measure of how many cations can be retained on soil particle surfaces.
5 Base saturation (BS) is defined as the percentage of the soil exchange sites (CEC) occupied by basic cations.
6 Jarosite is a basic hydrous sulfate of potassium and iron and is often produced as a byproduct during the purification and refining of zinc; it is also commonly associated with acid mine drainage and acid sulfate soil environments.
Note: The ranking score is calculated from the range 0–10 to define to values for S1, S2, S3, and N.
Table 3.
Random index (RI).
| N | 1 | 2 | 3 | 4 | 5 | 6 | 7 | 8 | 9 | 10 | 11 |
|---|---|---|---|---|---|---|---|---|---|---|---|
| RI | 0 | 0 | 0.58 | 0.9 | 1.12 | 1.24 | 1.32 | 1.41 | 1.45 | 1.49 | 1.51 |
Table 4.
AHP pairwise comparison matrix for the main factors.
| Factors | Climate | Soil Characteristics | Topography |
|---|---|---|---|
| Climate | 1.000 | 1.170 | 0.906 |
| Soil Characteristics | 0.855 | 1.000 | 0.855 |
| Topography | 1.104 | 1.170 | 1.000 |
Table 5.
Triangular fuzzy number pairwise comparison matrix for the main factors.
| Factors | Climate | Soil Characteristics | Topography |
|---|---|---|---|
| Climate | 1.000,1.000,1.000 | 1.104,1.170,1.294 | 0.744,0.906,1.219 |
| Soil Characteristics | 0.820,0.855,0.906 | 1.000,1.000,1.000 | 0.820,0.855,0.906 |
| Topography | 0.906,1.104,1.292 | 1.104,1.170,1.219 | 1.000,1.000,1.000 |
Table 6.
Trapezoidal fuzzy number pairwise comparison matrix for the main factors.
| Factors | Climate | Soil Characteristics | Topography |
|---|---|---|---|
| Climate | 1.000,1.000,1.000,1.000 | 1.104,1.140,1.196,1.219 | 0.744,0.836,0.990,1.104 |
| Soil Characteristics | 0.820,0.836,0.877,0.906 | 1.000,1.000,1.000,1.000 | 0.820,0.836,0.877,0.906 |
| Topography | 0.906,1.010,1.196,1.292 | 1.104,1.140,1.196,1.219 | 1.000,1.000,1.000,1.000 |
Table 7.
Weights of all criteria using analytical hierarchy process (AHP).
| Main Criterion | Weights of Main Criterion | CR of Main Criterion | SUB CRITERION | Weight of Sub Criterion | CR of Sub Creierion | Final Weight of Each Sub Criterion |
|---|---|---|---|---|---|---|
| Climate (A) | 0.339 | 0.0009 | Mean temp. in growing period (A1) | 0.564 | 0 * | 0.191 |
| Annual rainfall (A2) | 0.436 | 0.148 | ||||
| Topography (B) | 0.362 | Rock outcrop (B1) | 0.525 | 0 * | 0.190 | |
| Slope (B2) | 0.475 | 0.172 | ||||
| Soil characteristics (C) | 0.299 | Soil drainage (C1) | 0.092 | 0.0057 | 0.028 | |
| Nutrient status (C2) | 0.061 | 0.018 | ||||
| Cation exchange capacity (C3) | 0.130 | 0.039 | ||||
| Base saturation (C4) | 0.162 | 0.048 | ||||
| Effective soil depth (C5) | 0.128 | 0.038 | ||||
| Electric conductivity (C6) | 0.197 | 0.059 | ||||
| Depth of jarosite (C7) | 0.230 | 0.069 |
Table 8.
Weights of all criteria using triangular fuzzy numbers.
| Main Criterion | Weights of Main Criteria | CR of Main Criterion | Sub Criteria | Weight of Sub Criteria | CR of Sub Creierion | Final Weight of Each Sub Criterion |
|---|---|---|---|---|---|---|
| Climate (A) | 0.351 | 0.0077 | Mean temp. in growing period (A1) | 0.559 | 0 * | 0.196 |
| Annual rainfall (A2) | 0.441 | 0.155 | ||||
| Topography (B) | 0.320 | Rock outcrop (B1) | 0.527 | 0 * | 0.169 | |
| Slope (B2) | 0.473 | 0.151 | ||||
| Soil characteristics (C) | 0.329 | Soil drainage (C1) | 0.100 | 0.01751 | 0.033 | |
| Nutrient status (C2) | 0.062 | 0.020 | ||||
| Cation exchange capacity (C3) | 0.138 | 0.046 | ||||
| Base saturation (C4) | 0.167 | 0.055 | ||||
| Effective soil depth (C5) | 0.125 | 0.041 | ||||
| Electric conductivity (C6) | 0.203 | 0.067 | ||||
| Depth of jarosite (C7) | 0.205 | 0.068 |
Table 9.
Weights of all criteria using trapezoidal fuzzy numbers.
| Main Criterion | Weights of Main Criteria | CR of Main Criterion | Sub Criteria | Weight of Sub Criteria | CR of Sub Creierion | Final Weight of Each Sub Criterion |
|---|---|---|---|---|---|---|
| Climate (A) | 0.358 | 0.0072 | Mean temp. in growing period (A1) | 0.560 | 0 * | 0.200 |
| Annual rainfall (A2) | 0.440 | 0.158 | ||||
| Topography (B) | 0.317 | Rock outcrop (B1) | 0.527 | 0 * | 0.167 | |
| Slope (B2) | 0.473 | 0.150 | ||||
| Soil characteristics (C) | 0.326 | Soil drainage (C1) | 0.099 | 0.0221 | 0.032 | |
| Nutrient status (C2) | 0.062 | 0.020 | ||||
| Cation exchange capacity (C3) | 0.138 | 0.045 | ||||
| Base saturation (C4) | 0.168 | 0.055 | ||||
| Effective soil depth (C5) | 0.124 | 0.041 | ||||
| Electric conductivity (C6) | 0.203 | 0.066 | ||||
| Depth of jarosite (C7) | 0.206 | 0.067 |
*: There is no possibility of checking the CR because there are only two factors; RI is 0, and therefore, CR is 0.
Table 10.
Results for land suitability of all methods.
| Suitability | Parametric | AHP | Triangular FAHP | Trapezoidal FAHP | |
|---|---|---|---|---|---|
| Highly suitable | Area (ha) | 943,345.95 | - | - | - |
| (S1) | (%) | 45.38 | |||
| Moderately | Area (ha) | 957,453.31 | 1,637,778.92 | 1,620,153.79 | 1,626,948.82 |
| suitable (S2) | (%) | 46.06 | 78.78 | 77.94 | 78.26 |
| Marginally | Area (ha) | 177,691.55 | 441,023.27 | 458,569.88 | 451,864.98 |
| suitable (S3) | (%) | 8.55 | 21.22 | 22.06 | 21.74 |
| Not suitable | Area (ha) | 334.60 | 23.22 | 101.74 | 11.61 |
| (N) | (%) | 0.02 | 0 | 0 | 0 |
| Total | Area (ha) | 2,078,825.41 | 2,078,825.41 | 2,078,825.41 | 2,078,825.41 |
| (%) | 100 | 100 | 100 | 100 |
Table 11.
Error matrix comparing the results of the Land Development Department in Thailand (LDD) and the results from the study by each method.
Table 11.
Error matrix comparing the results of the Land Development Department in Thailand (LDD) and the results from the study by each method.
| Parametric VS LDD 1 | ||||
| LDD (%) | ||||
| Parametric | S1 | S2 | S3 | Total |
| S1 | 0.00 | 22.68 | 5.57 | 28.25 |
| S2 | 0.00 | 67.52 | 0.96 | 68.48 |
| S3 | 0.00 | 3.27 | 0.00 | 3.27 |
| Total | 93.47 | 6.53 | 100.00 | |
| Omission | Commission | Overall Accuracy | ||
| S1 | 0.00 | 0.00 | 67.52 | |
| S2 | 72.24 | 98.60 | ||
| S3 | 0.00 | 0.00 | ||
| KHAT | 68.00 | |||
| AHP 2 VS LDD 1 | ||||
| LDD (%) | ||||
| AHP | S1 | S2 | S3 | Total |
| S1 | 0.00 | 0.00 | 0.00 | 0.00 |
| S2 | 0.00 | 70.66 | 6.08 | 76.74 |
| S3 | 0.00 | 22.84 | 0.42 | 23.26 |
| Total | 93.50 | 6.50 | 100.00 | |
| Omission | Commission | Overall Accuracy | ||
| S1 | 0.00 | 0.00 | 71 | |
| S2 | 75.57 | 92.08 | ||
| S3 | 6.46 | 1.81 | ||
| KHAT | 71.00 | |||
| Triangular AHP 2 VS LDD 1 | ||||
| LDD (%) | ||||
| Triangular FAHP 3 | S1 | S2 | S3 | Total |
| S1 | 0.00 | 0.00 | 0.00 | 0.00 |
| S2 | 0.00 | 79.75 | 6.11 | 85.86 |
| S3 | 0.00 | 13.86 | 0.28 | 14.14 |
| Total | 93.61 | 6.39 | 100.00 | |
| Omission | Commission | Overall Accuracy | ||
| S1 | 0.00 | 0.00 | 80.03 | |
| S2 | 85.19 | 92.88 | ||
| S3 | 4.38 | 1.95 | ||
| KHAT | 80.00 | |||
| Trapezoidal AHP 2 VS LDD | ||||
| LDD (%) | ||||
| TrapezoidalFAHP 3 | S1 | S2 | S3 | Total |
| S1 | 0.00 | 0.00 | 0.00 | 0.00 |
| S2 | 0.00 | 90.05 | 6.28 | 96.33 |
| S3 | 0.00 | 3.56 | 0.11 | 3.67 |
| Total | 93.61 | 6.39 | 100.00 | |
| Omission | Commission | Overall Accuracy | ||
| S1 | 0.00 | 0.00 | 90.16 | |
| S2 | 96.20 | 93.48 | ||
| S3 | 1.72 | 2.99 | ||
| KHAT | 90.00 | |||
1 LDD, Land Development Department, Thailand; 2 AHP, analytical hierarchy process; 3 FAHP, fuzzy analytical hierarchy process
Table 12.
Comparison of the results from parametric, AHP, Triangular fuzzy AHP (TriFAHP) and Trapezoidal FAHP (TraFAHP) methods.
Table 12.
Comparison of the results from parametric, AHP, Triangular fuzzy AHP (TriFAHP) and Trapezoidal FAHP (TraFAHP) methods.
| Methods | Weight of Factors | Suitable Area (%) | Accuracy Assessment using KHAT (%) | |||||||||||||
|---|---|---|---|---|---|---|---|---|---|---|---|---|---|---|---|---|
| Mean Temperature in Growing Period (A1) | Annual Rainfall (A2) | Rock out Crop (B1) | Slope (B2) | Soil Drainage (C1) | Nutrient Status (C2) | Cat ion Exchange Capacity (C3) | Base Saturation (C4) | Effective Soil Depth (C5) | Electric Conductivity (C6) | Depth of Jarosite (C7) | Highly Suitable (S1) | Moderately Suitable (S2) | Marginally Suitable (S3) | Not Suitable (N) | ||
| Parametric | No weights | 45.38 | 46.06 | 8.55 | 0.02 | 68 | ||||||||||
| AHP | 0.191 | 0.148 | 0.190 | 0.172 | 0.028 | 0.018 | 0.039 | 0.048 | 0.038 | 0.059 | 0.069 | 0.00 | 78.78 | 21.22 | 0.00 | 71 |
| TriFAHP | 0.196 | 0.155 | 0.169 | 0.151 | 0.033 | 0.020 | 0.046 | 0.055 | 0.041 | 0.067 | 0.068 | 0.00 | 77.94 | 22.06 | 0.00 | 80 |
| TraFAHP | 0.200 | 0.158 | 0.167 | 0.150 | 0.032 | 0.020 | 0.045 | 0.055 | 0.041 | 0.066 | 0.067 | 0.00 | 78.26 | 21.74 | 0.00 | 90 |
© 2019 by the authors. Licensee MDPI, Basel, Switzerland. This article is an open access article distributed under the terms and conditions of the Creative Commons Attribution (CC BY) license (http://creativecommons.org/licenses/by/4.0/).
Share and Cite
MDPI and ACS Style
Rodcha, R.; K. Tripathi, N.; Prasad Shrestha, R. Comparison of Cash Crop Suitability Assessment Using Parametric, AHP, and FAHP Methods. Land 2019, 8, 79. https://0-doi-org.brum.beds.ac.uk/10.3390/land8050079
AMA Style
Rodcha R, K. Tripathi N, Prasad Shrestha R. Comparison of Cash Crop Suitability Assessment Using Parametric, AHP, and FAHP Methods. Land. 2019; 8(5):79. https://0-doi-org.brum.beds.ac.uk/10.3390/land8050079
Chicago/Turabian StyleRodcha, Rujee, Nitin K. Tripathi, and Rajendra Prasad Shrestha. 2019. "Comparison of Cash Crop Suitability Assessment Using Parametric, AHP, and FAHP Methods" Land 8, no. 5: 79. https://0-doi-org.brum.beds.ac.uk/10.3390/land8050079
Note that from the first issue of 2016, this journal uses article numbers instead of page numbers. See further details here.