Article

Land Use Change, Spatial Interaction, and Sustainable Development in the Metropolitan Urban Areas, South Sulawesi Province, Indonesia

by
Batara Surya
1,*,
Despry Nur Annisa Ahmad
2,
Harry Hardian Sakti
3 and
Hernita Sahban
4
1
Department of Urban and Regional Planning, Faculty of Engineering, University Bosowa, Makassar 90231, Indonesia
2
Department of Urban and Regional Planning, Faculty of Science and Technology of Alauddin State Islamic University, Makassar 92133, Indonesia
3
Department of Urban and Regional Planning, Faculty of Engineering, University of Muhammadiyah Bulukumba, South Sulawesi 92511, Indonesia
4
Departement of Economic, STIM Lasharan Jaya, Makassar 90231, Indonesia
*
Author to whom correspondence should be addressed.
Submission received: 20 February 2020 / Revised: 22 March 2020 / Accepted: 23 March 2020 / Published: 24 March 2020
(This article belongs to the Section Urban Contexts and Urban-Rural Interactions)

Abstract

:
Metropolitan Urban Mamminasata South Sulawesi, Indonesia as the object of study is explored in the core-peripheral spatial interaction towards the formation of suburban service centers. The problems raised in this study are (i) is there a relationship/correlation between spatial integration, spatial interaction, and urban agglomeration to the formation of urban activity systems and (ii) how the formation of urban activity systems works as a determinant of economic growth, land use change and environmental quality degradation towards sustainable development in the metropolitan city of Mamminasata. Comparative studies of suburban areas have been carried out over three time periods (2001, 2015 and 2019). Data elaboration on observations, surveys and documentation is done to describe urban dynamics in terms of economic, social and environmental aspects. Path analysis is used to address direct effects, indirect effects, differences, and dependencies between urban elements. The gravity model is used to analyze the spatial interactions of the core city with the periphery. The study results show that spatial integration, spatial interaction and urban agglomeration have a positive effect on the system of urban activity and economic growth in the outskirts of the Mamminasata Metropolitan area. The results of this study recommend policy makers and urban planners that land use change, spatial integration and urban spatial interactions on the spatial scale of metropolitan cities to require the implementation of sustainable development concepts oriented towards saving the environment, ensuring fairness in economic access and creating social cohesion, in line with meeting national Metropolitan city development targets by 2030.

1. Introduction

Urbanization is a process related to economic growth and expansion of the core metropolitan city towards urban growth in the periphery. Migrant workers moving to urbanized areas constitute a floating labor pool that provides flexible and cheap labor for urbanization processes [1,2]. Urbanization is identical to the development of the main cities in developing countries which are dominated by workers with low wages, for the purpose of getting a job and welfare. Capital accumulation in the main city which dominantly tends to lean on the economic growth triggers over-urbanization, maximum compaction and land use change. Cities are characterized by a growing proportion of knowledge workers and by the service orientation of economic activity [3].
City urbanization towards mega urbanization has penetrated the second layer of cities in a country [4]. The second city category is cities with a smaller status than the main city. The development of the city which dominantly is in meeting the needs of housing and infrastructure, becomes the determinant of the increasing accessibility, land use change and the conversion of productive agricultural land. The policy strategy and housing prices are the main factors affecting accessibility and several factors that do not dominate are also identified from the surrounding land use patterns [5].
Economic growth and the diverse needs of urban communities have an impact on the increasing pollution and decreasing environmental quality. In the last three decades, urban developments in many global cities, such as Shanghai in China, Singapore, and Jakarta, Indonesia, are marked by the proliferation of high-rise buildings [6,7]. The pressure from the population on space that tends to increase due to urbanization, migration and suburbanization of urban suburbs causes changes in land use, conversion of productive agricultural land, use of open land, and other ecology and threatens the culture and values of community life [8]. The orientation of regional development, both urban and rural, is no longer based on economic development alone, but is based on sustainable development [9]. In urban areas, the spatial configuration of urban elements is vital to the sustainable development of cities [10]. The meaning of sustainable development lies in the issue of how the natural environment should be treated in order to play a role in economic sustainability as a resource and to improve the living standards [11]. Furthermore, the key to sustainable development of the metropolitan city in the future is oriented to the utilization of renewable resources for the purpose of maintaining environmental balance.
The unification of spatial and metropolitan urban spatial interactions is basically a fairly complex problem in terms of spatial use and land use change for the development needs of socio-economic activities. The problem brought about by the compact form of the city is the mismatch between physical space and socio-economic activities [12]. Agricultural land conversion that is quite intensive towards economic growth causes a decrease in the quality of the environment. City Region is seen as a driving force for regional development and economic growth of a country [13]. Metropolitan urban areas of Mamminasata in South Sulawesi are designated as national strategic areas in terms of the economy and regional development center in Eastern Indonesia. Changes in land use and urban agglomeration that tend to develop in the metropolitan city have caused various problems that are quite complex in terms of spatial, economic, social and environmental aspects. The growth of cities leads a lot of problems like environmental degradation, traffic congestion, poverty, crime and other social conflicts [14,15].
The spatial integration and metropolitan urban agglomeration caused changes in spatial structure, spatial patterns, typology and morphology towards the formation of quite complex social area structures [16]. Service centers and global-oriented economic growth became the driving force of population migration and suburbanization in the suburban of Metropolitan Mamminasata. While cities atop the global hierarchy of the world’s urban places attract wealth, glamour, and prestige, they are also said to be socially polarized to a greater degree than other cities and to attract international migrants disproportionately [17]. Conversion of productive agricultural land that continues to increase and the complexity of spatial use due to urban agglomeration has an impact on spatial segregation and changes in people’s lifestyles [18,19,20,21].
Land use change is an increase in land use or a change in the function of a land at different time periods. In this case the land which was originally used for agricultural activities in the suburban urban area of Metropolitan Mamminasata has been converted into housing and settlements, industry, trade and services, offices and other urban activities. [22], mentioned that integrated multi-level stakeholder assessment of the framework can comprehensively assess the impact of land use actions on sustainable development and support of regional land use decision making. [23], asserted that the distribution of land use change is basically grouped into sections, namely (i) elongated patterns following the road, (ii) elongated patterns following the river, (iii) radial patterns, (iv) scattered patterns, (v) elongated patterns following the coastline, and (vi) elongated patterns following the coastline and railroad tracks. he driving factors for land use change in the Mamminasata Metropolitan suburbs are influenced by three main factors, namely (i) an increase in population due to urban urbanization, (ii) the value and price of land in the suburbs is quite low, (iii) government policies in terms of meeting people’s needs for housing and settlements and other urban activities and (iv) allocation of space for functions industry, trade and education that require a large enough area of land and the choice is located in the outskirts of the Mamminasata Metropolitan area.
Spatial integration is the integration of city and region systems into a unified whole. Spatial integration in this study is interpreted as a process of adjustment between different elements into a pattern of activity in cities and regions that have a harmonious function. [24], states that the density of the structure built is a prerequisite for spatial proximity individuals and actors—residents, employees, inventors, entrepreneurs or creative people—and closeness in turn has a complex influence on urban behavior patterns and economic processes and social interaction. Thus spatial integration is a middle ground between a centralized approach that emphasizes growth in metropolitan urban areas and decentralization which emphasizes the spread of investment in development resources in small and rural cities. [25], advocated the establishment of a spatial system that integrates urban and rural development.
In the case of the Mamminasata Metropolitan City, it has a tendency to grow dynamically in line with the dynamics of demographic, economic and physical-spatial development. The authors of [26] confirmed that exurban development is defined a discontinuous, low-density expansion into fringe land, emphasizing dependency on private mobility, soil consumption, and depolarized economic structures. Physically, Metropolitan Mamminasata urban areas are growing expansively towards the outskirts, even beyond the administrative boundaries of their territories. If related to the limited carrying capacity, especially land and water resources, the increasing need for basic urban infrastructure becomes an increasingly serious problem to be addressed. Furthermore, when viewed from the spatial aspects, the spatial structure, and the pattern of urban space utilization formed tend to be expansive and show symptoms of urban sprawl that are increasingly out of control and convert fertile agricultural lands in the periphery with various environmental impacts. On that basis it is very important to formulate sustainable development of the Mamminasata Metropolitan urban suburbs.
Interaction between regions and between cities is a mechanism that describes the dynamics that occur in an area due to human activities. The activities referred to in this study include work mobility, migration, information flows and commodity flows, student mobility and other urban activities. The authors of [27] mention the spatial interaction among city clusters is one of the main drivers of urban growth. The spatial interaction in this study is contextualized in the pattern of physical, economic and social relations between the Makassar core city and the location of the periphery as a unity of the Metropolitan Mamminasata urban system, in this case the interplay of mutual influence. The core-periphery relationship is characterized by a pattern of population mobility and highly intensive circular migration. The authors of [28] stated that migration trends among countries in the five categories are described, and a tentative explanation of these patterns is offered. The phenomenon of spatial expansion in the core city of Makassar results in a movement of activities in the form of people, goods and services from the core city to the periphery. This condition occurs due to the availability of opportunities for the development of various functions of urban activities, which then develops towards the spatial interaction of the core city of Makassar and the urban suburbs of Metropolitan Mamminasata.
Urban agglomeration is understood as a number of cities in the Metropolitan Mamminasata urban system which are integrated into physical and economic, social and cultural unity. The urban agglomeration referred to in this study is the unification of the core city of Makassar to several surrounding cities, among others; urban Gowa Regency, Maros Regency Urban, Takalar Regency Urban, and surrounding suburbs. The unification was then formulated in the development concept of the Mamminasata Metropolitan City. The concept of comprehensive agglomeration is not easily understood by the people, even though they have actually experienced interdependence and interdependence in and between the entire Metropolitan Mamminasata urban area. Thus, the periphery is experiencing continuous urbanization. Urban agglomeration that continues to increase then develops towards urban conurbation. This condition is marked by the Makassar City development center zone as the core city connected with Maros City, Sungguminasa City and Takalar City which continue to grow and their influence on the surrounding urban suburbs. The structure of urban agglomeration space has been considered important factors affecting regional functions and sustainable development [29].
Sustainable development is understood as development that meets the needs of the present without having to reduce its ability to meet the needs of future generations. Implementation of the concept of sustainable development in the context of this study is oriented to optimizing the use of environmental resources and environmental sustainability for the purpose of maintaining environmental quality. The affirmation of the concept of sustainable development in this study is focused on several actions, namely (i) preserving the functions and capabilities of suburban urban ecosystems, (ii) optimizing the use of technologies that do not damage the environment, (iii) preserving the capabilities and functions of suburban urban ecosystems, (iv) using procedures and procedures that pay attention to the preservation of the functions and abilities of ecosystems to support life, (v) sustainability and increase resources by creating and expanding employment, preservation and efficient use of energy, prevention of pollution (water and air), and (vi) policy formulation in terms of efficient use of energy at the cost of production minimal and use the maximum energy possible. The authors of [30] mention that infrastructure modernization and sustainable economic development through rational use of resources, implementation eco-technology, and technology modernization from all industrial sectors.
Spatial integration and urban agglomeration characterized by economic growth have an impact on changes in spatial attributes and the driving force of spatial interaction towards the formation of the urban system of the Mamminasata metropolitan urban suburbs. The argument then becomes the basis in the formulation of the concept of this study. Departing from the arguments built, the research questions that will be answered in this study are (i) is there a relationship/correlation between spatial integration, spatial interaction, and urban agglomeration to the formation of urban activity systems in suburban Metropolitan Mamminasata and (ii) how does the formation of the urban activity system work as a determinant of economic growth, land use change and environmental degradation towards sustainable development in the suburban Metropolitan Mamminasata urban area?

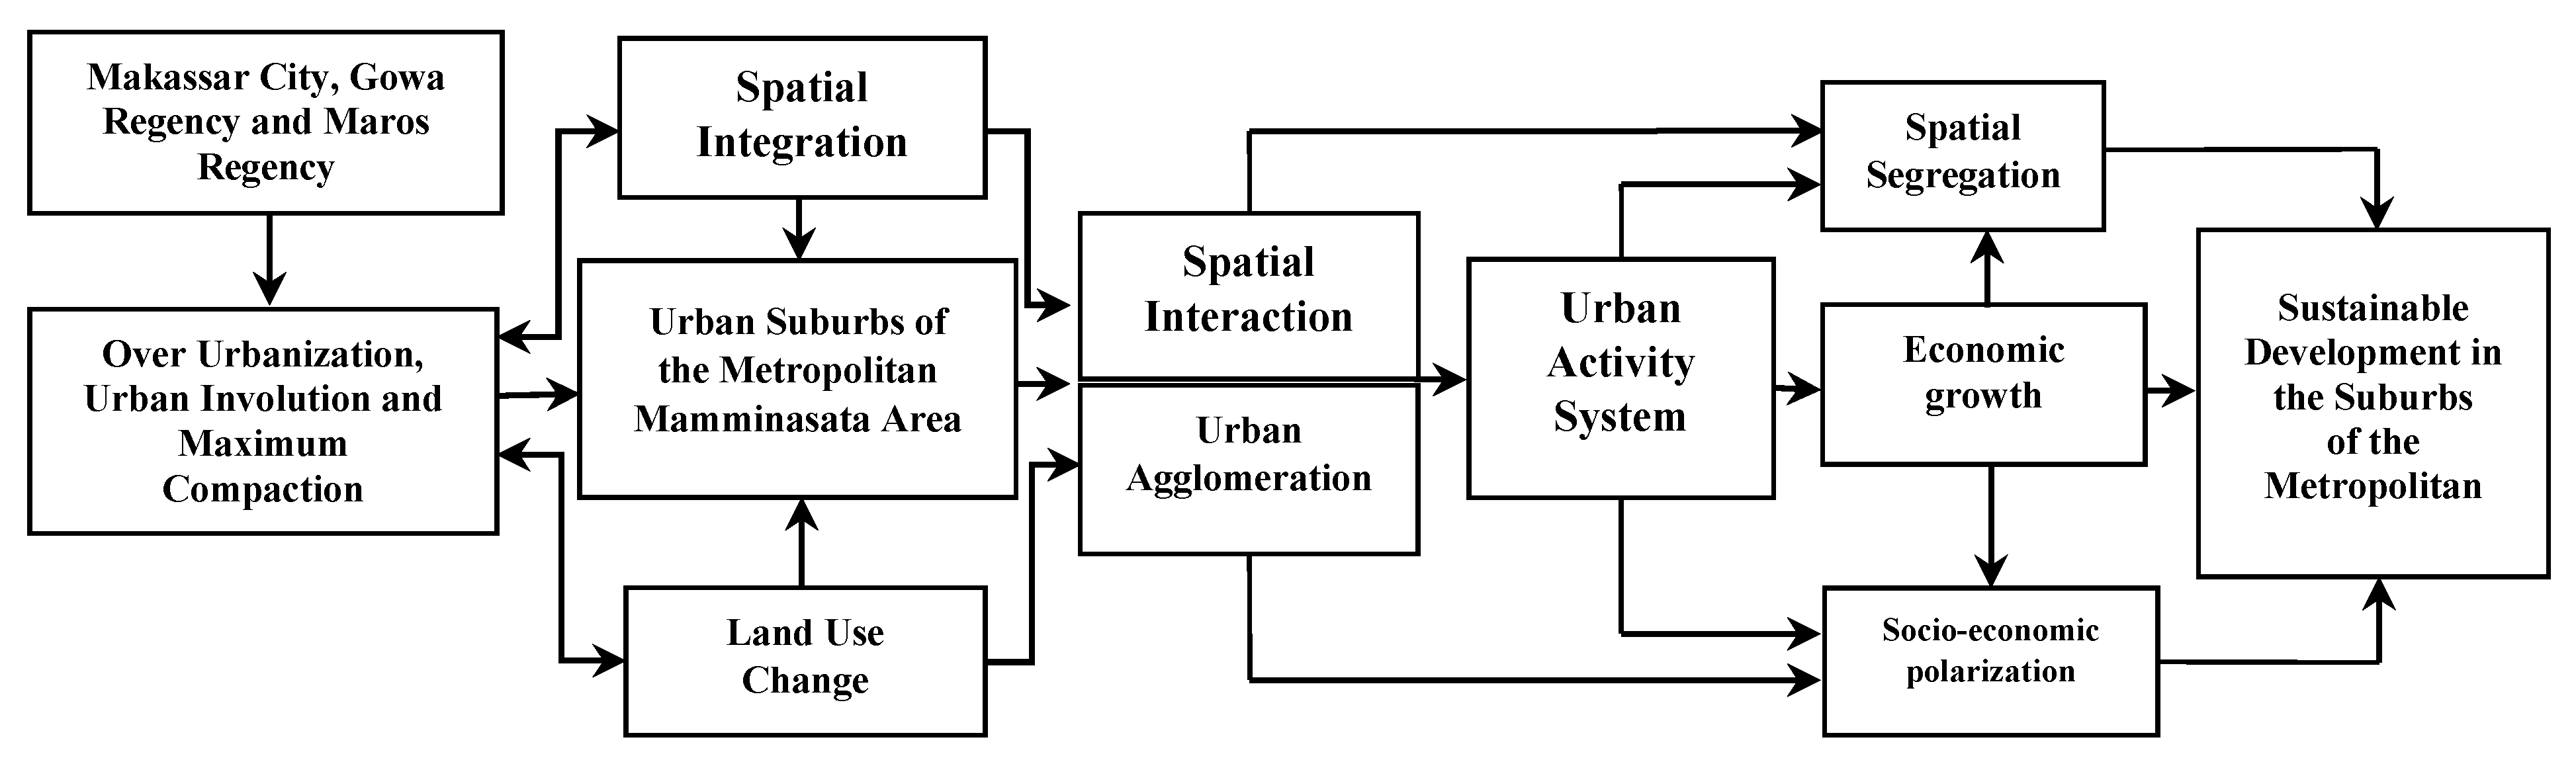
2. Conceptual Framework

Urban urbanization which tends to increase and maximum compaction in the core cities in the Mamminasata Metropolitan urban system, causes spatial expansion and polarization of socioeconomic activities towards the periphery (see Figure 1). The role of urban planning and management, population, policy, and distance to the capital city emerge as driving forces for the expansion of towns [31]. Urbanization is a process of shifting dominance between three modes of urban growth: fill, expand edges and jump over [32]. Furthermore, most of the rural settlements were located close to the urban construction land, and changes in the rural settlement area were more pronounced with decreasing distance to the closest urban construction land, illustrating the effect of urban sprawl on rural settlement changes [33].
Excessive urbanization of the core city of Makassar has led to changes in land use towards the spatial integration of the core city and the outskirts of the Mamminasata Metropolitan area. Trends in global urbanization and a booming world population, demand for urban and rural construction, land has increased dramatically [34]. Spatial integration that runs parallel with urban agglomeration causes spatial interaction towards the formation of the Metropolitan Mamminasata urban activity system. The understanding of the spatial interaction among cities will help to strengthen the functional linkage within urban agglomeration, optimize the spatial layout of industries, promote the competitiveness of urban agglomeration, and provide policy implications for regional sustainable development [35]. Furthermore, spatial interaction associated with rural–urban migration, information, capital, and commodity flows among cities across space in a city cluster affects the growth and spatial patterns of hierarchical cities [36]. The conceptual framework of this study, in the following figure.

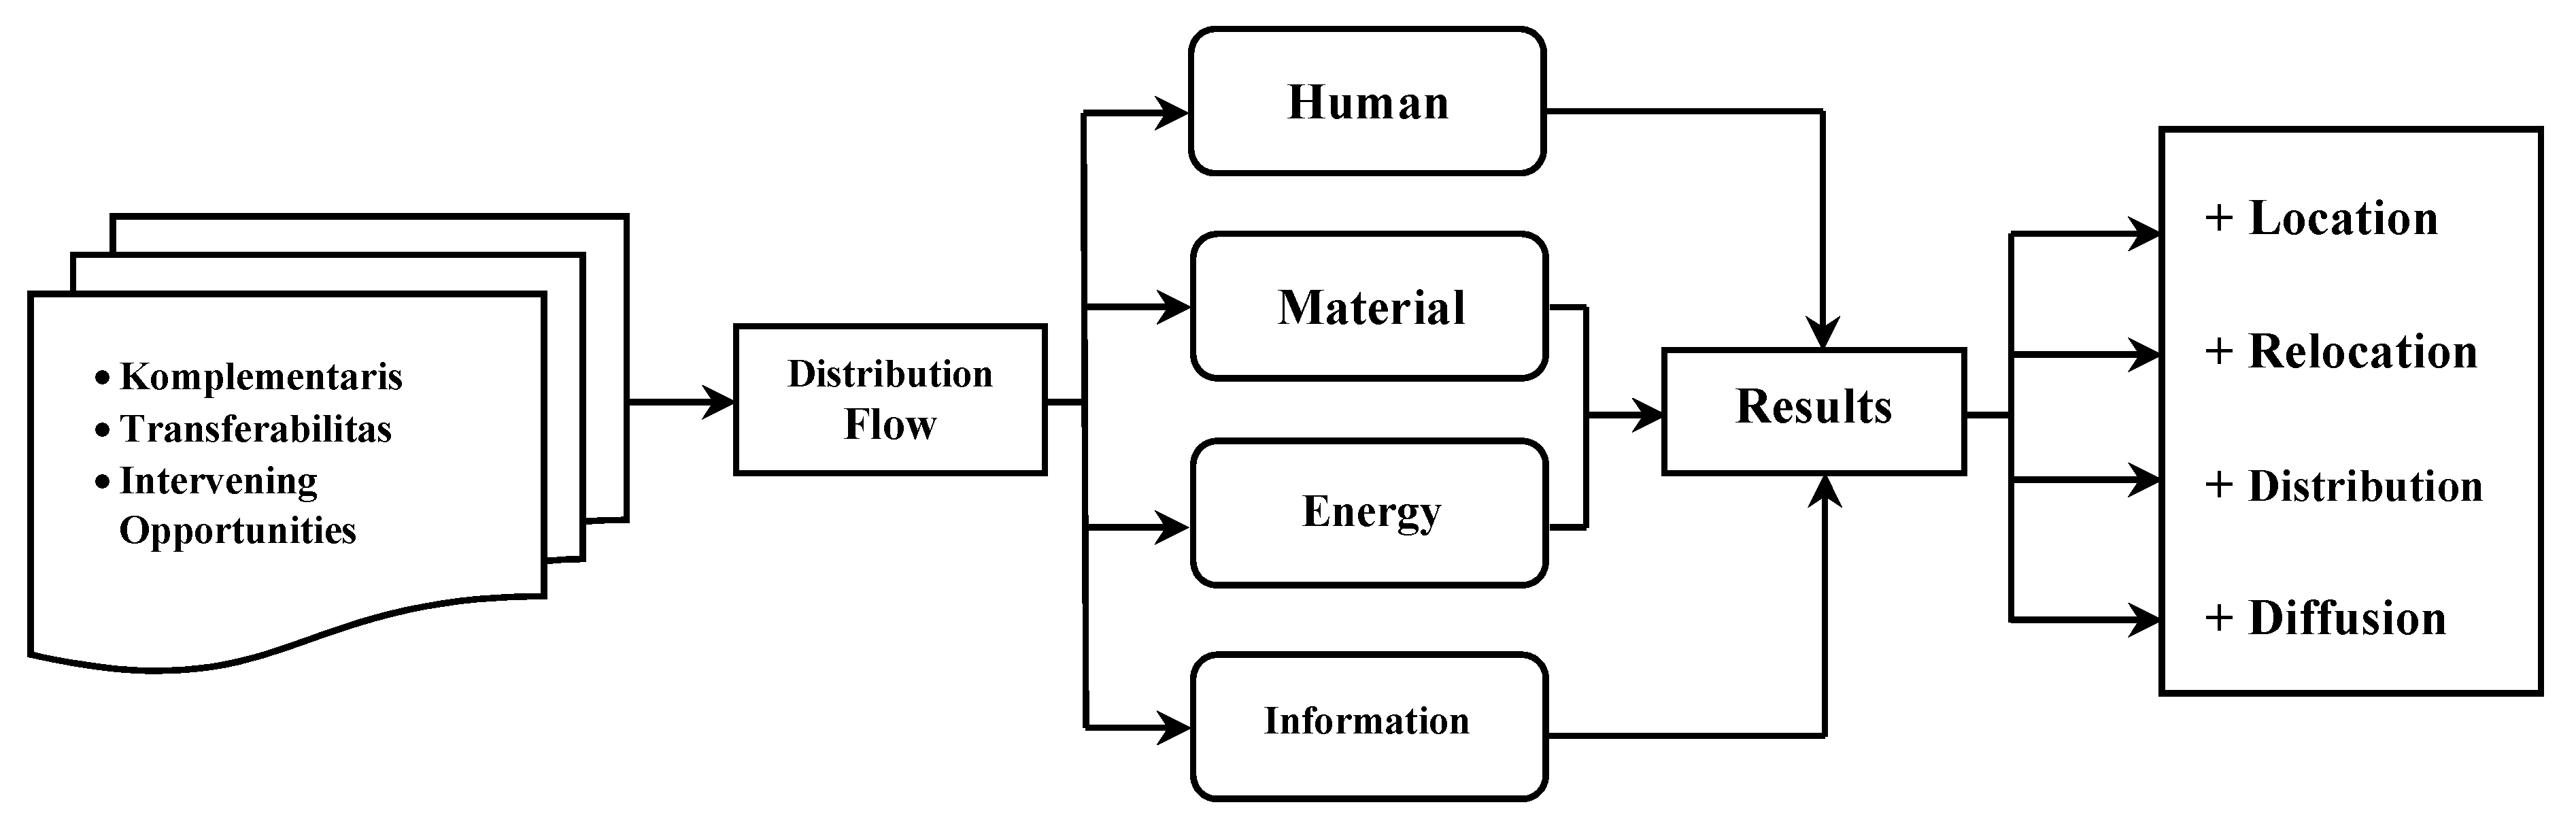
2.1. Spatial Interaction and Urban Agglomeration

Spatial interaction is understood as a regional dynamic that shows the movement of humans in relation to natural resources between two or more cities. The relationship is shown by the population mobility, circular migration, information flow and commodity flow. Urban growth driven by migration occurs closer to the central metropolitan area where peri-urban areas transition to peripheral land so that they emerge as an expansion of urban parts [37]. Spatial interactions are influenced by three main factors, namely: First, complementary areas, in this case are different areas of resources which cause very large flows and generate high spatial interactions [38]. The spatial interactions between the settlement network, as the basic representation of human activity, the natural landscape, as a crucial element of the natural system, and the dynamic zones of economic activities, as a parameter that encompasses crucial attributes of both human and natural systems [39].
Second, the opportunity to react, namely the possibility of an area that blocks the flow of commodities between regions to interact. As modern society emerged, and the human population condensed into urban areas, industrialisation freed many people from reliance on direct consumptive interactions with nature [40]. Third, ease of transfer in space, in this case the distance function measured by cost and time factors, including the special character of the commodity being transferred. Transfer flows that are likely to occur, namely economic flow, social flow, political flow, and communication flow. Displacement occurs between origin and destination underlines that the costs incurred by spatial interactions are lower than the benefits derived from those interactions [41].
These three factors have a direct relationship with Newton’s law of gravity, in this case socioeconomic interaction. This means that there is a parallel relationship between migration and population mobility. Furthermore, the interaction between the two places is influenced by the amount of social activity and production produced by the community in the two places, the distance between the two places, and the magnitude of the effect of the distance on the two places. The authors of [42] stated that transportation accessibility is one of the most significant location factors for households and companies, and as such is a potential driver of urban development that has the potential to strengthen itself. Furthermore, accessibility is a measure of the convenience or ease of location and land use that interact with each other, and the ease or difficulty of the location is achieved through transportation [43].
The more network systems available, the easier accessibility is obtained, and vice versa the lower the level of accessibility, the more difficult the area is reached from other regions [44]. Spatial interaction and transportation models are used to facilitate the explanation and prediction of patterns of human and economic interaction over geographic space [45]. Furthermore, over time, particularly since improved accessibility conditions have enabled much faster travelling, more people have come to travel more frequently (although a suppressed demand is still present and inequalities are considerable) to more distant destinations, major cities in particular, for mainly social motives [46]. The strength of economic linkages between cities is closely related to distance, population, and levels of economic development [47]. Furthermore, urban land laws in the post-revolutionary era can be considered as one of the most influential factors in the expansion of the city [48].
Urban agglomeration is understood as the union of several cities into one physical, economic and social cultural unit. An urban agglomeration comprises not only the central city, but also its suburbs that form a functional area of unity with the city concerned [49]. In this study, it is contemplated that the urban agglomeration of Metropolitan Mamminasata is the physical, economic, and social integration of the core city of Makassar, the urban area of Gowa Regency and the urban area of Maros Regency. Agglomeration economics arising from market processes used to explain urban growth [50]. Furthermore, the intensity of development in the periphery areas is due to the relatively low land value when compared to the land value in the core city and limited land for the development of various socio-economic activities. In core metropolitan areas where land is scarce, and land values are usually much higher than in non-core peripheral areas [51]. The urban agglomeration of the Mamminasata Metropolitan suburbs is characterized by the grouping of socioeconomic activities towards community segmentation and socio-economic segregation. Spatial segregation has an enormous impact on poverty [52]. Segregated areas of settlements having complex social-economic problems [53].
Conversion of productive agricultural land in suburban Metropolitan Mamminasata urban areas oriented to economic activities, services, transportation infrastructure, and large-scale settlements is positively associated with an increase in population. The large urban population forces cities to be bigger and more complex than before, which leads to increased demand for transportation and meeting housing needs [54]. The location with dense urban form was more likely to contain more facilities for activities and services than a low-density built environment [55]. Urbanization increases the concentration of people and critical services in cities, which also upscale their exposure to acute shocks and long-term stresses such as floods, earthquakes, climate change or social dynamics [56], and reveal the interaction of migration and level of development, suggesting the importance of geographic location besides the socio-economic factors [57]. Furthermore, ecological degradation gradually exhibits a restrictive effect on socioeconomic subsystem, further restricting the improvement of the coordinated development [58]. Accessibility to main roads, cities and services had a positive impact while proximity to industrial lands had the most negative effect on growth patterns [59]. Urban growth, related to its physical configuration, population and the socio-economic composition of its population [60]. The relationship between urban depreciation and economic development and provides important information for the government in formulating urban development policies [61].

2.2. Establishment of Urban Activity System and Sustainable Development

The city system formed in the Metropolitan Mamminasata urban case is a combination of a group of cities that are functionally interdependent in one area and affect the surrounding area. The city system includes the distribution of city services, business indexes, and the virtues of the city and the function of the city as a single metropolitan urban system. Urban agglomeration that tends to increase has an impact on the formation of the Metropolitan Maminasata urban activity system and the triggering factor is the support of the main road corridor that functions to connect the City of Maros, Maros Regency and Sungguminasa City, Gowa Regency which is a supporting city and hinterland of the core city of Makassar. The city center has a considerable potential role in regional and rural development [62]. The road network is one indicator to measure the sustainability of urban deployment for urban areas and for new urban development areas [63]. This uncoordinated and unplanned urban growth along the periphery of the metropolitan area causes shrinkage of agricultural land and environmental resources [64]. Transportation infrastructure system connectivity has an impact on increasing mobility and circular migration from the periphery to the core city of Makassar. Functional socio-economic transport system that accommodates the mobility, safety, comfort and convenience of all inhabitants [65]. Spatial strategic planning of the city is an important factor in coordinating activities of organizations, individuals, groups and the private sector and physical organization of the city [66].
Infrastructure system connectivity and population mobility from the periphery to the core city of Makassar have an impact on the integration of the urban system and economic growth in the Mamminasata Metropolitan area towards the change in typology and morphology of the periphery. The form of urban area development that occurs in the built area along the main road corridor has a tendency to form a concentration of urban activity and its focal point is characterized by the presence of a residential area, a shopping center, services, and economic activities that are compactly integrated. The rapid process of urbanization and suburbanization, ad hoc and unplanned spatial distribution and allocation of spatial activities will have an impact on decreasing environmental quality [67]. Differences between city centers and peripheral locations indicate that location plays at least some important roles, in combination with income and governance factors [68]. The importance of population characteristics in understanding population-environmental relations and interactive value generated from the meeting point of motivation then develops towards social relations [69,70].
Spatial integration in the direction of economic growth is positively associated with the intensity of the construction of business centers, large-scale settlements, services, offices, education, and other socio-economic activities in the outskirts of the Mamminasata Metropolitan area. The framework and arrangement of retail planning will require the support of political decision making [71]. The potential sprawl is based on the comparison between the rate of population growth and that of built-up areas [72]. Furthermore, planning aspects of its retrofit (de-sprinkling), a true challenge for land management, arguing that the even partial inversion of many negative effects is basically impossible in the short term; whereas, in a medium-long term, organized and politically coordinated programs can tackle the various issues [73]. Thus, accelerating the growth of the Metropolitan suburbs of Mamminasata in the future, it is very important to be oriented towards sustainable development. The local improvement of ecosystem services provided by constructing green infrastructure, or the rigid spatial restraint created by urban growth boundary and infrastructure will require holistic comprehension and actionable approaches to the city as the nexus of environmental context, built infrastructure, and human communities [74,75].

3. Materials and Methods

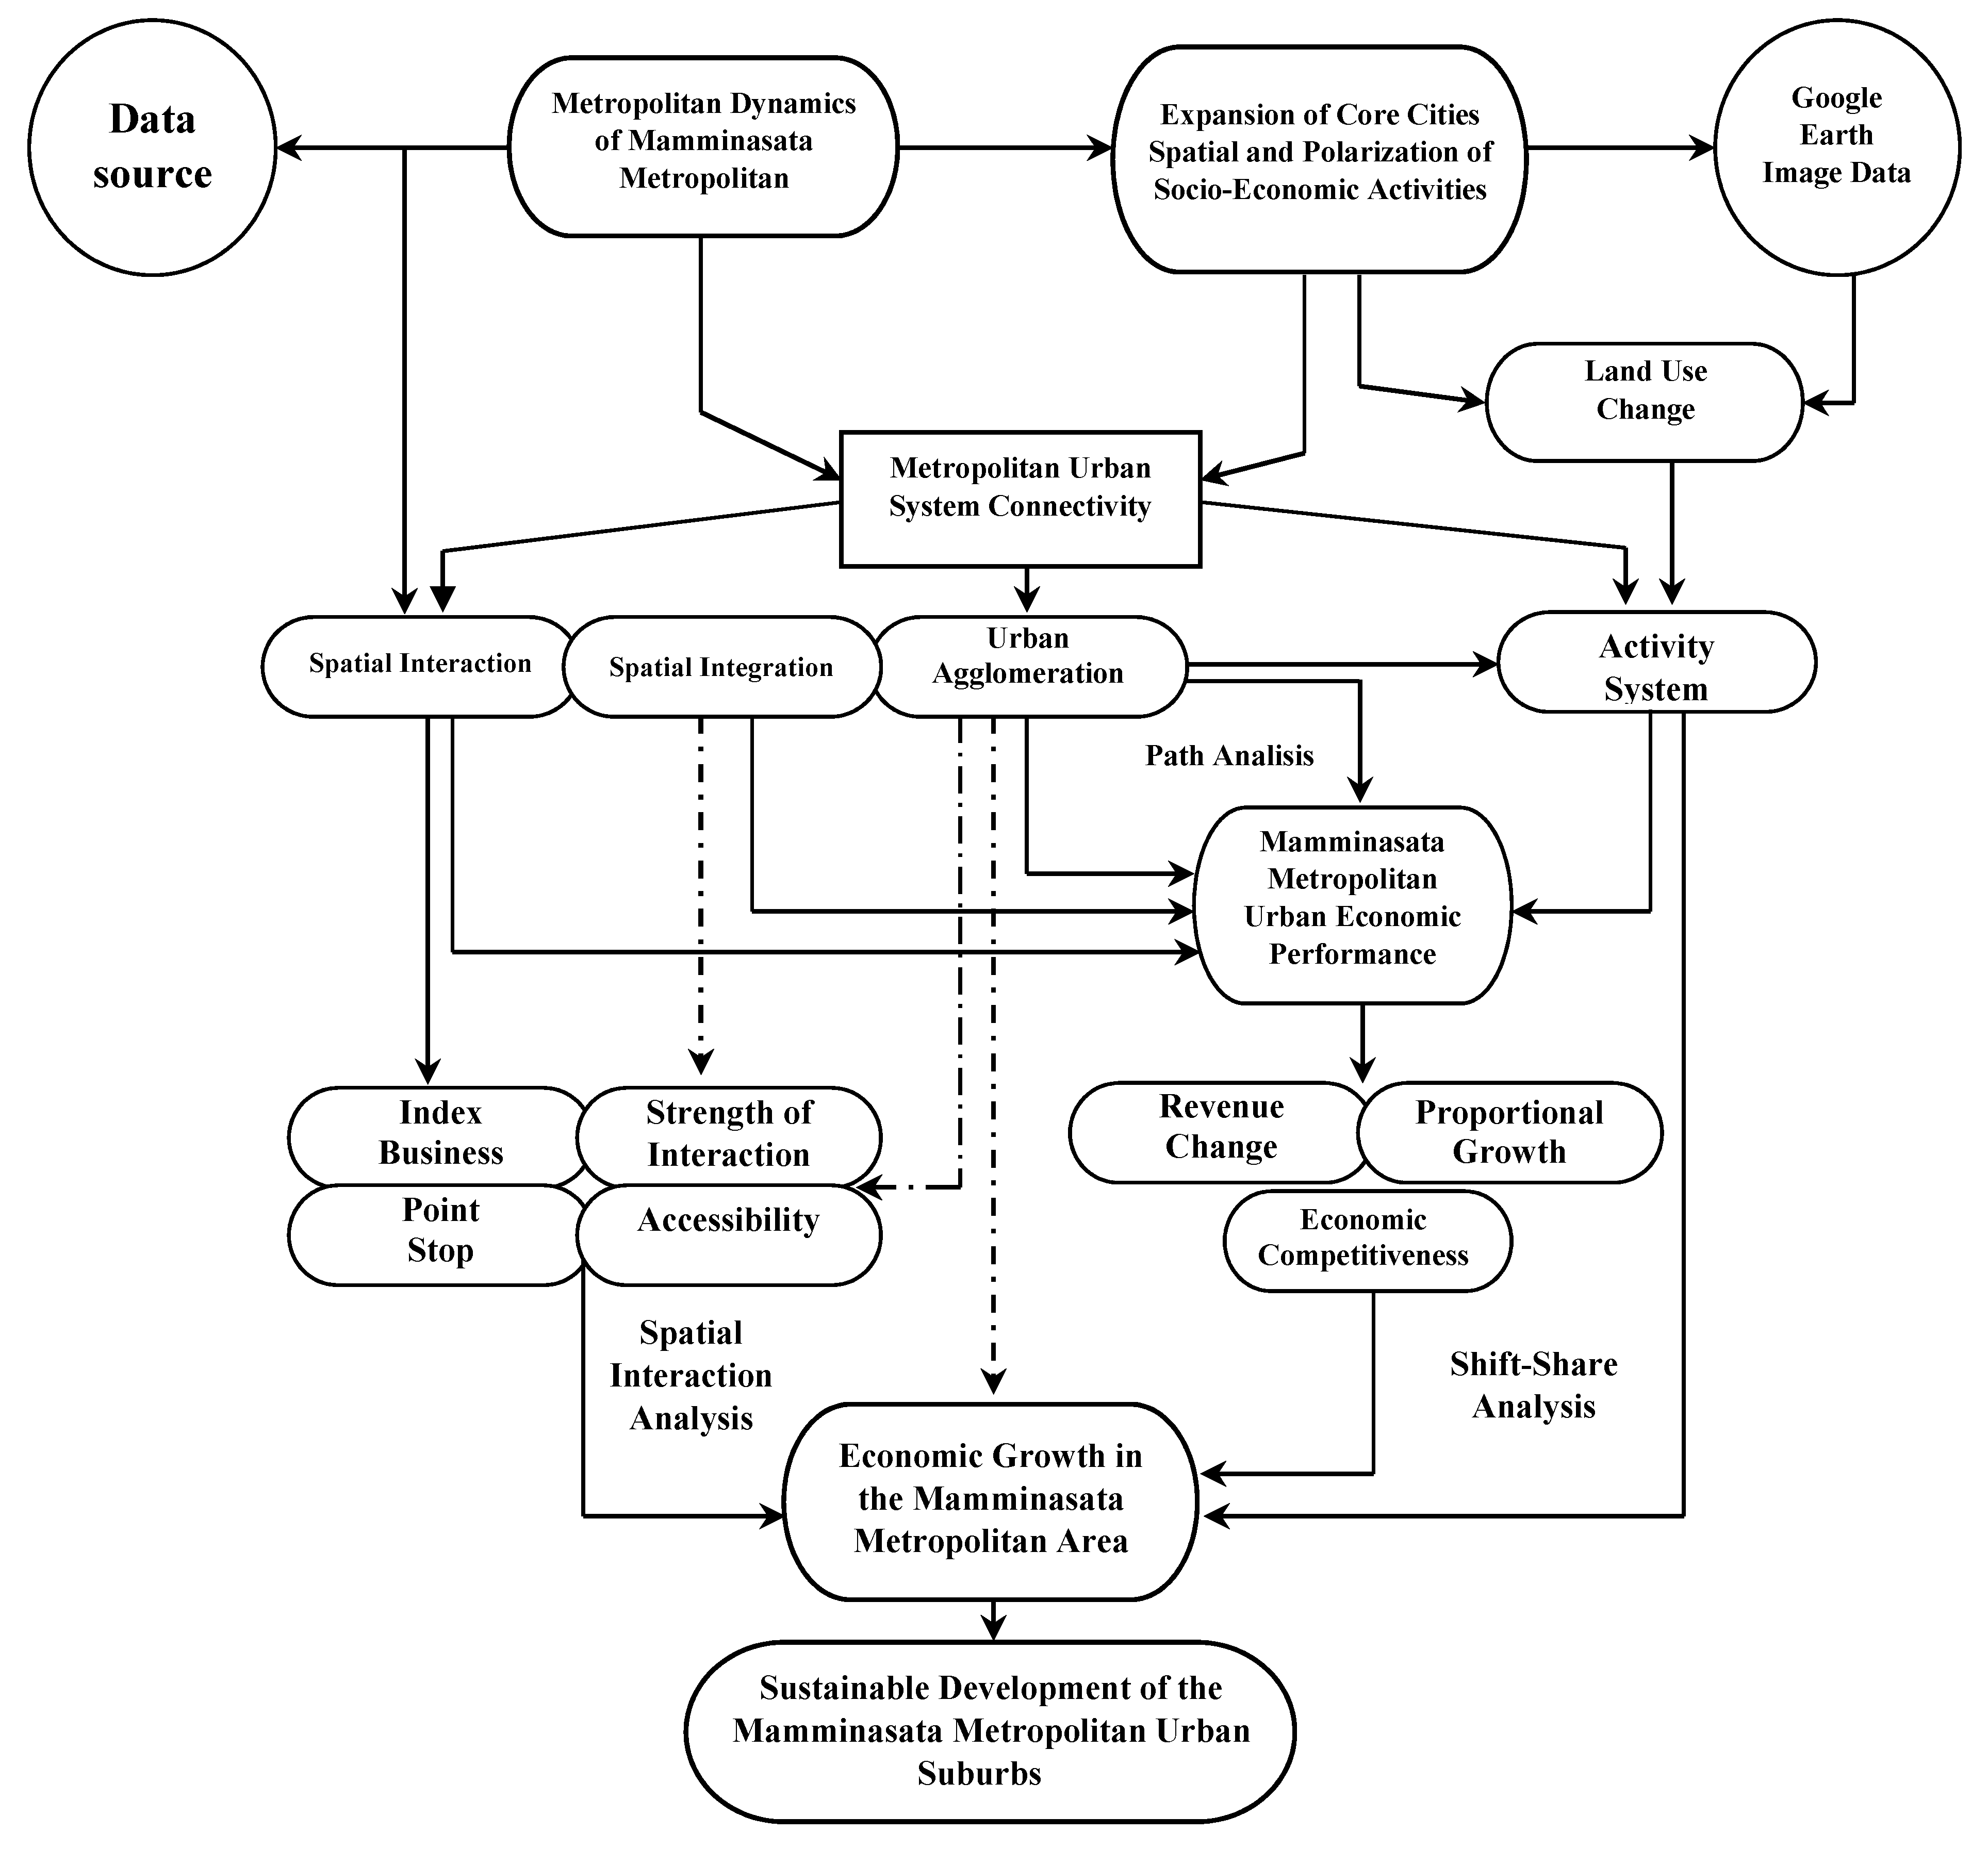
3.1. Methodological Framework
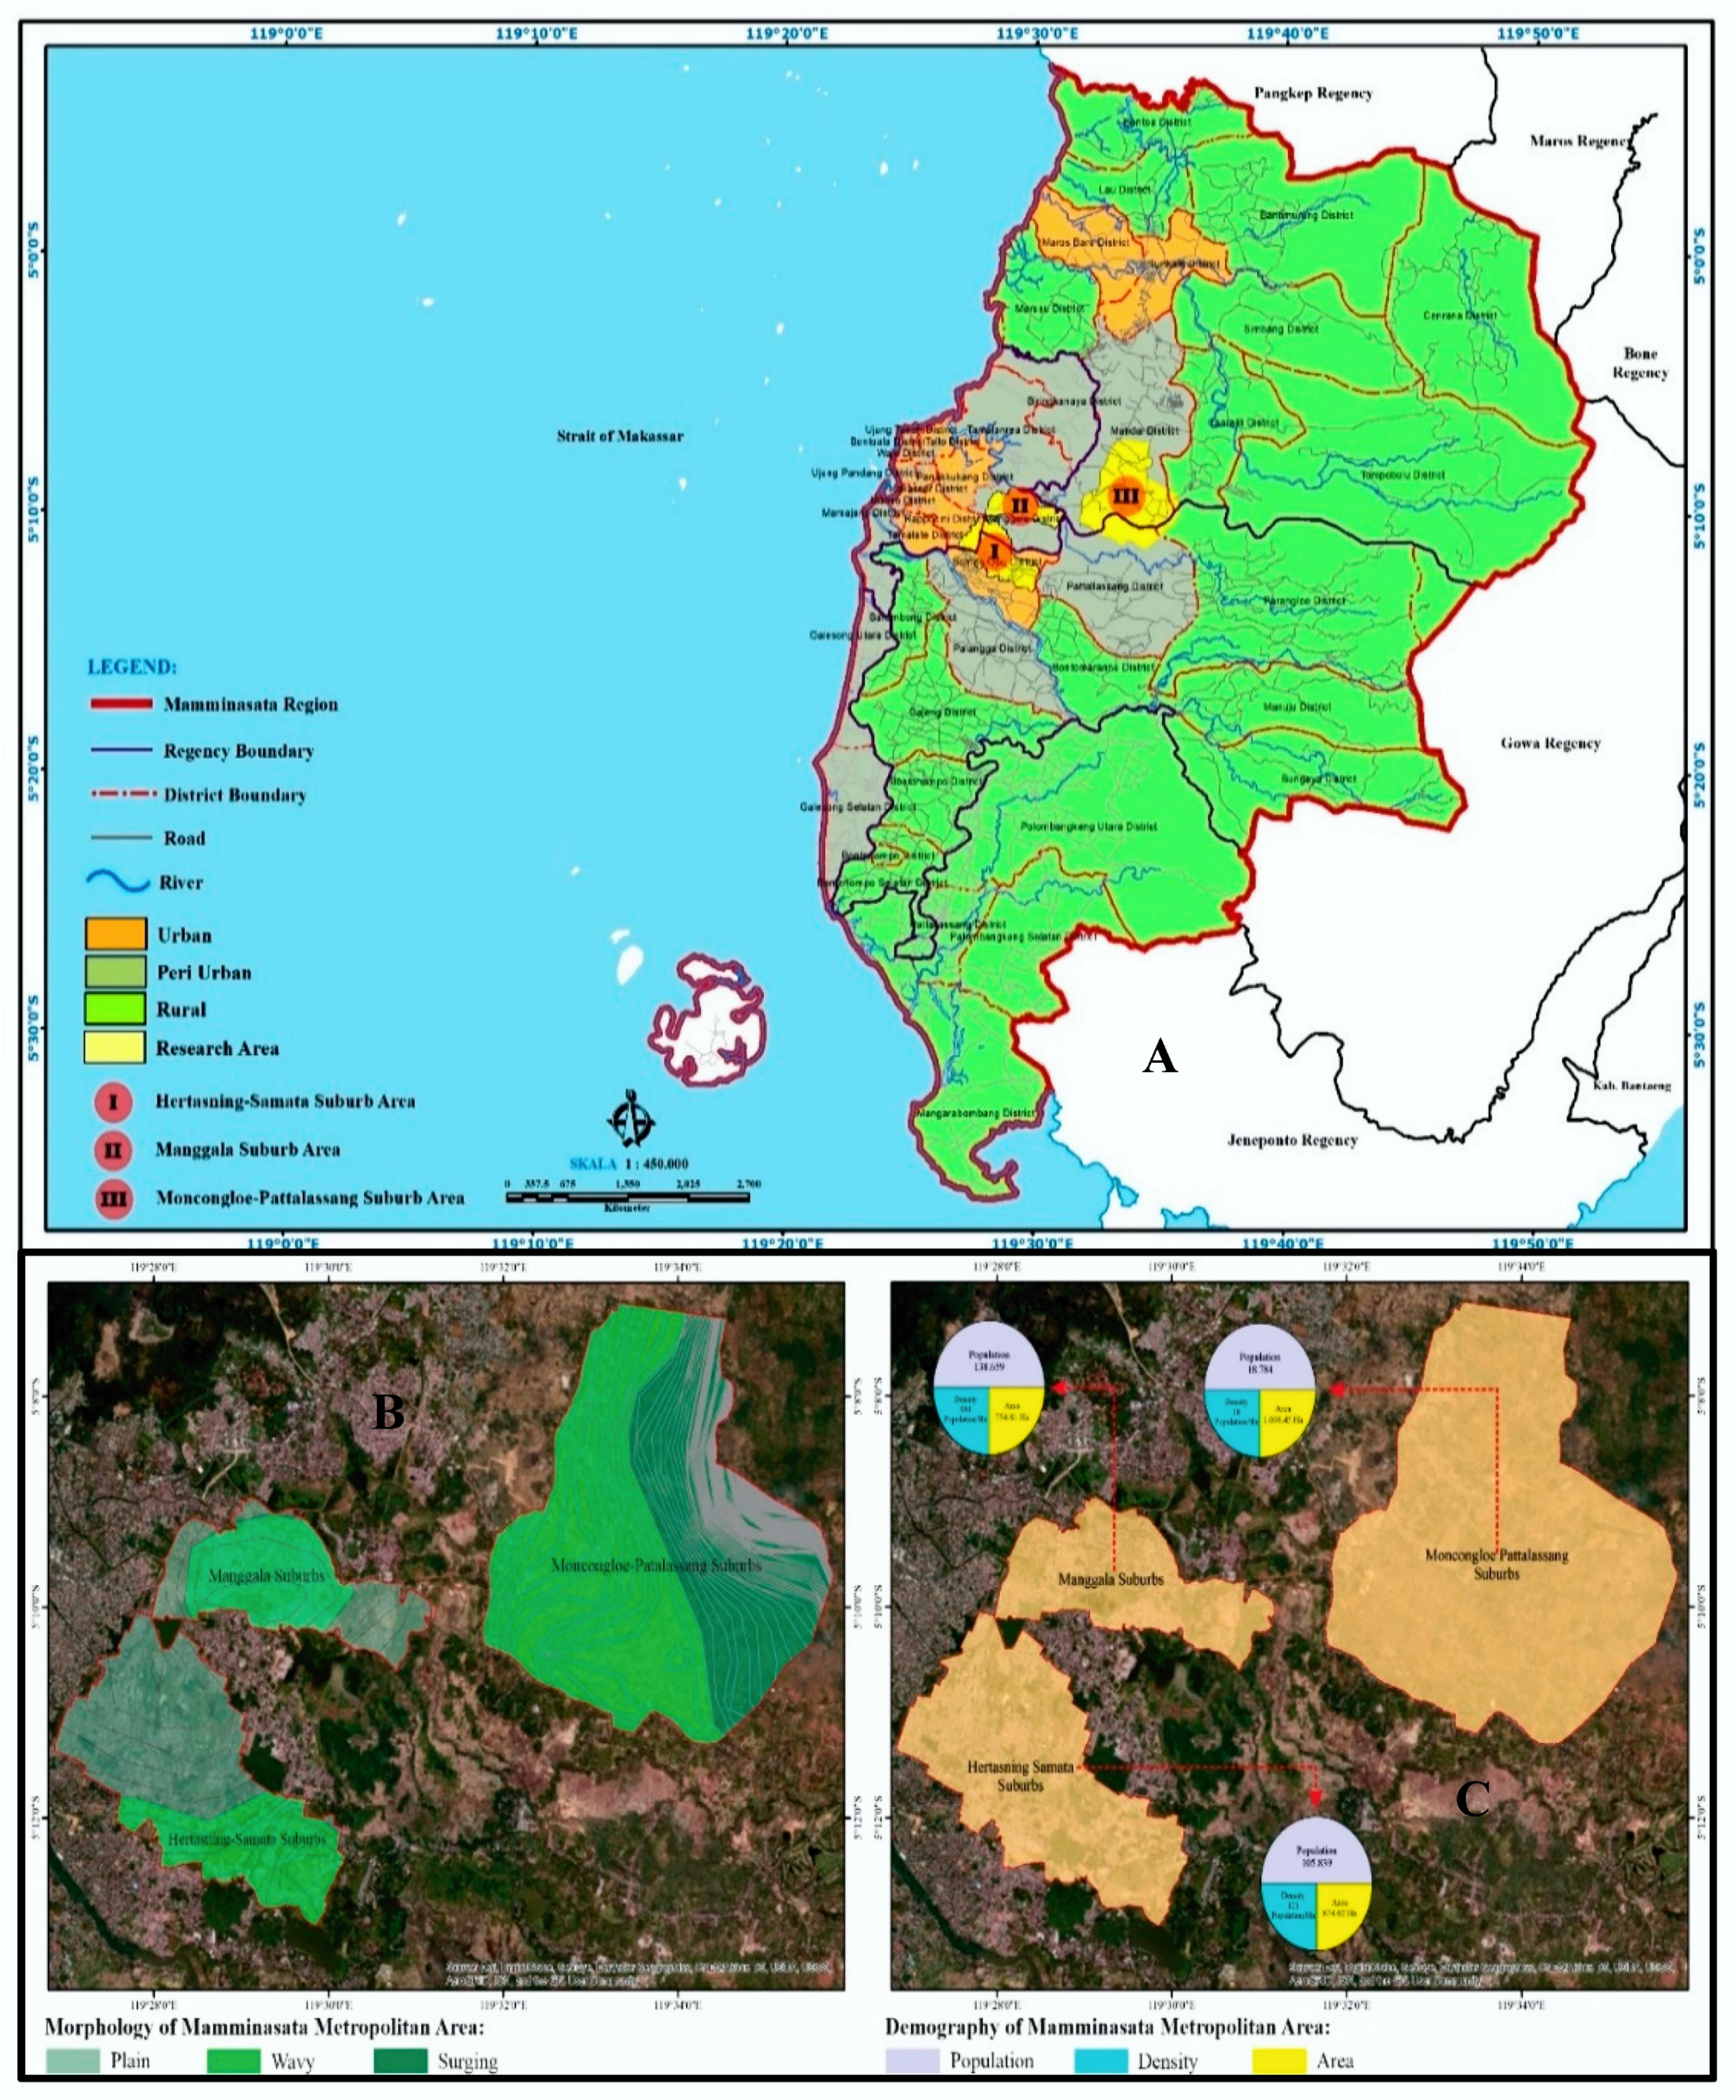
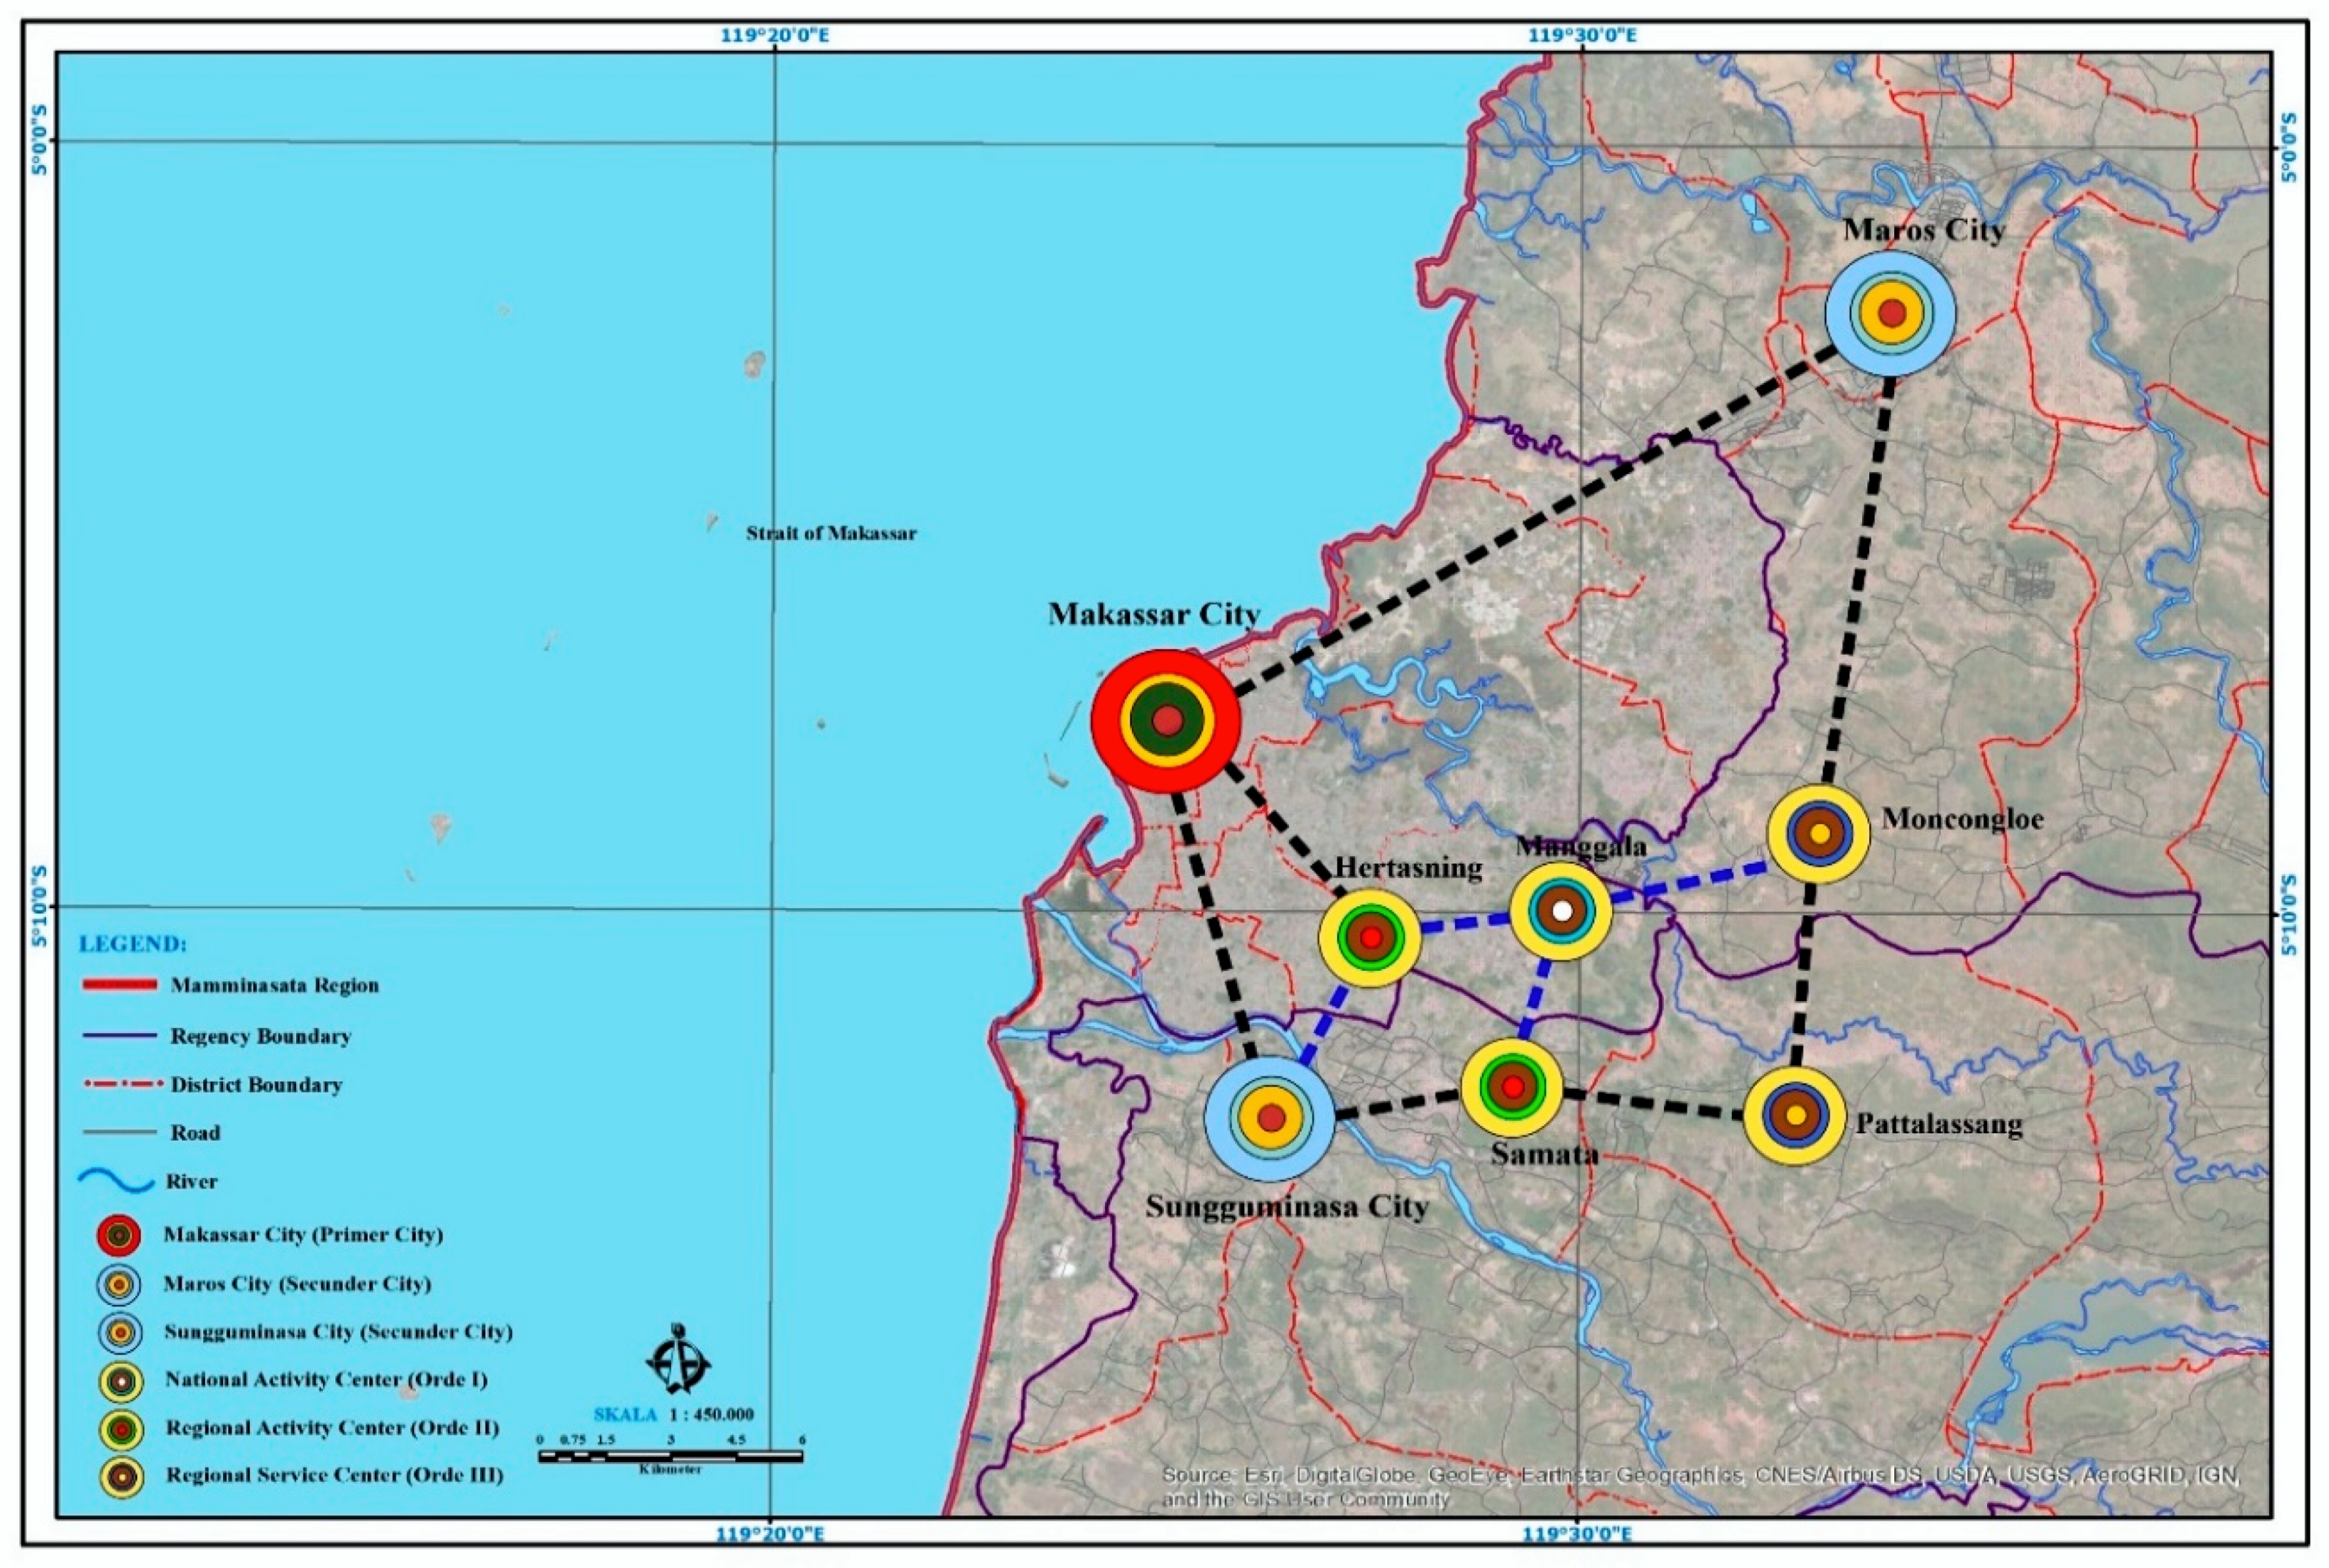
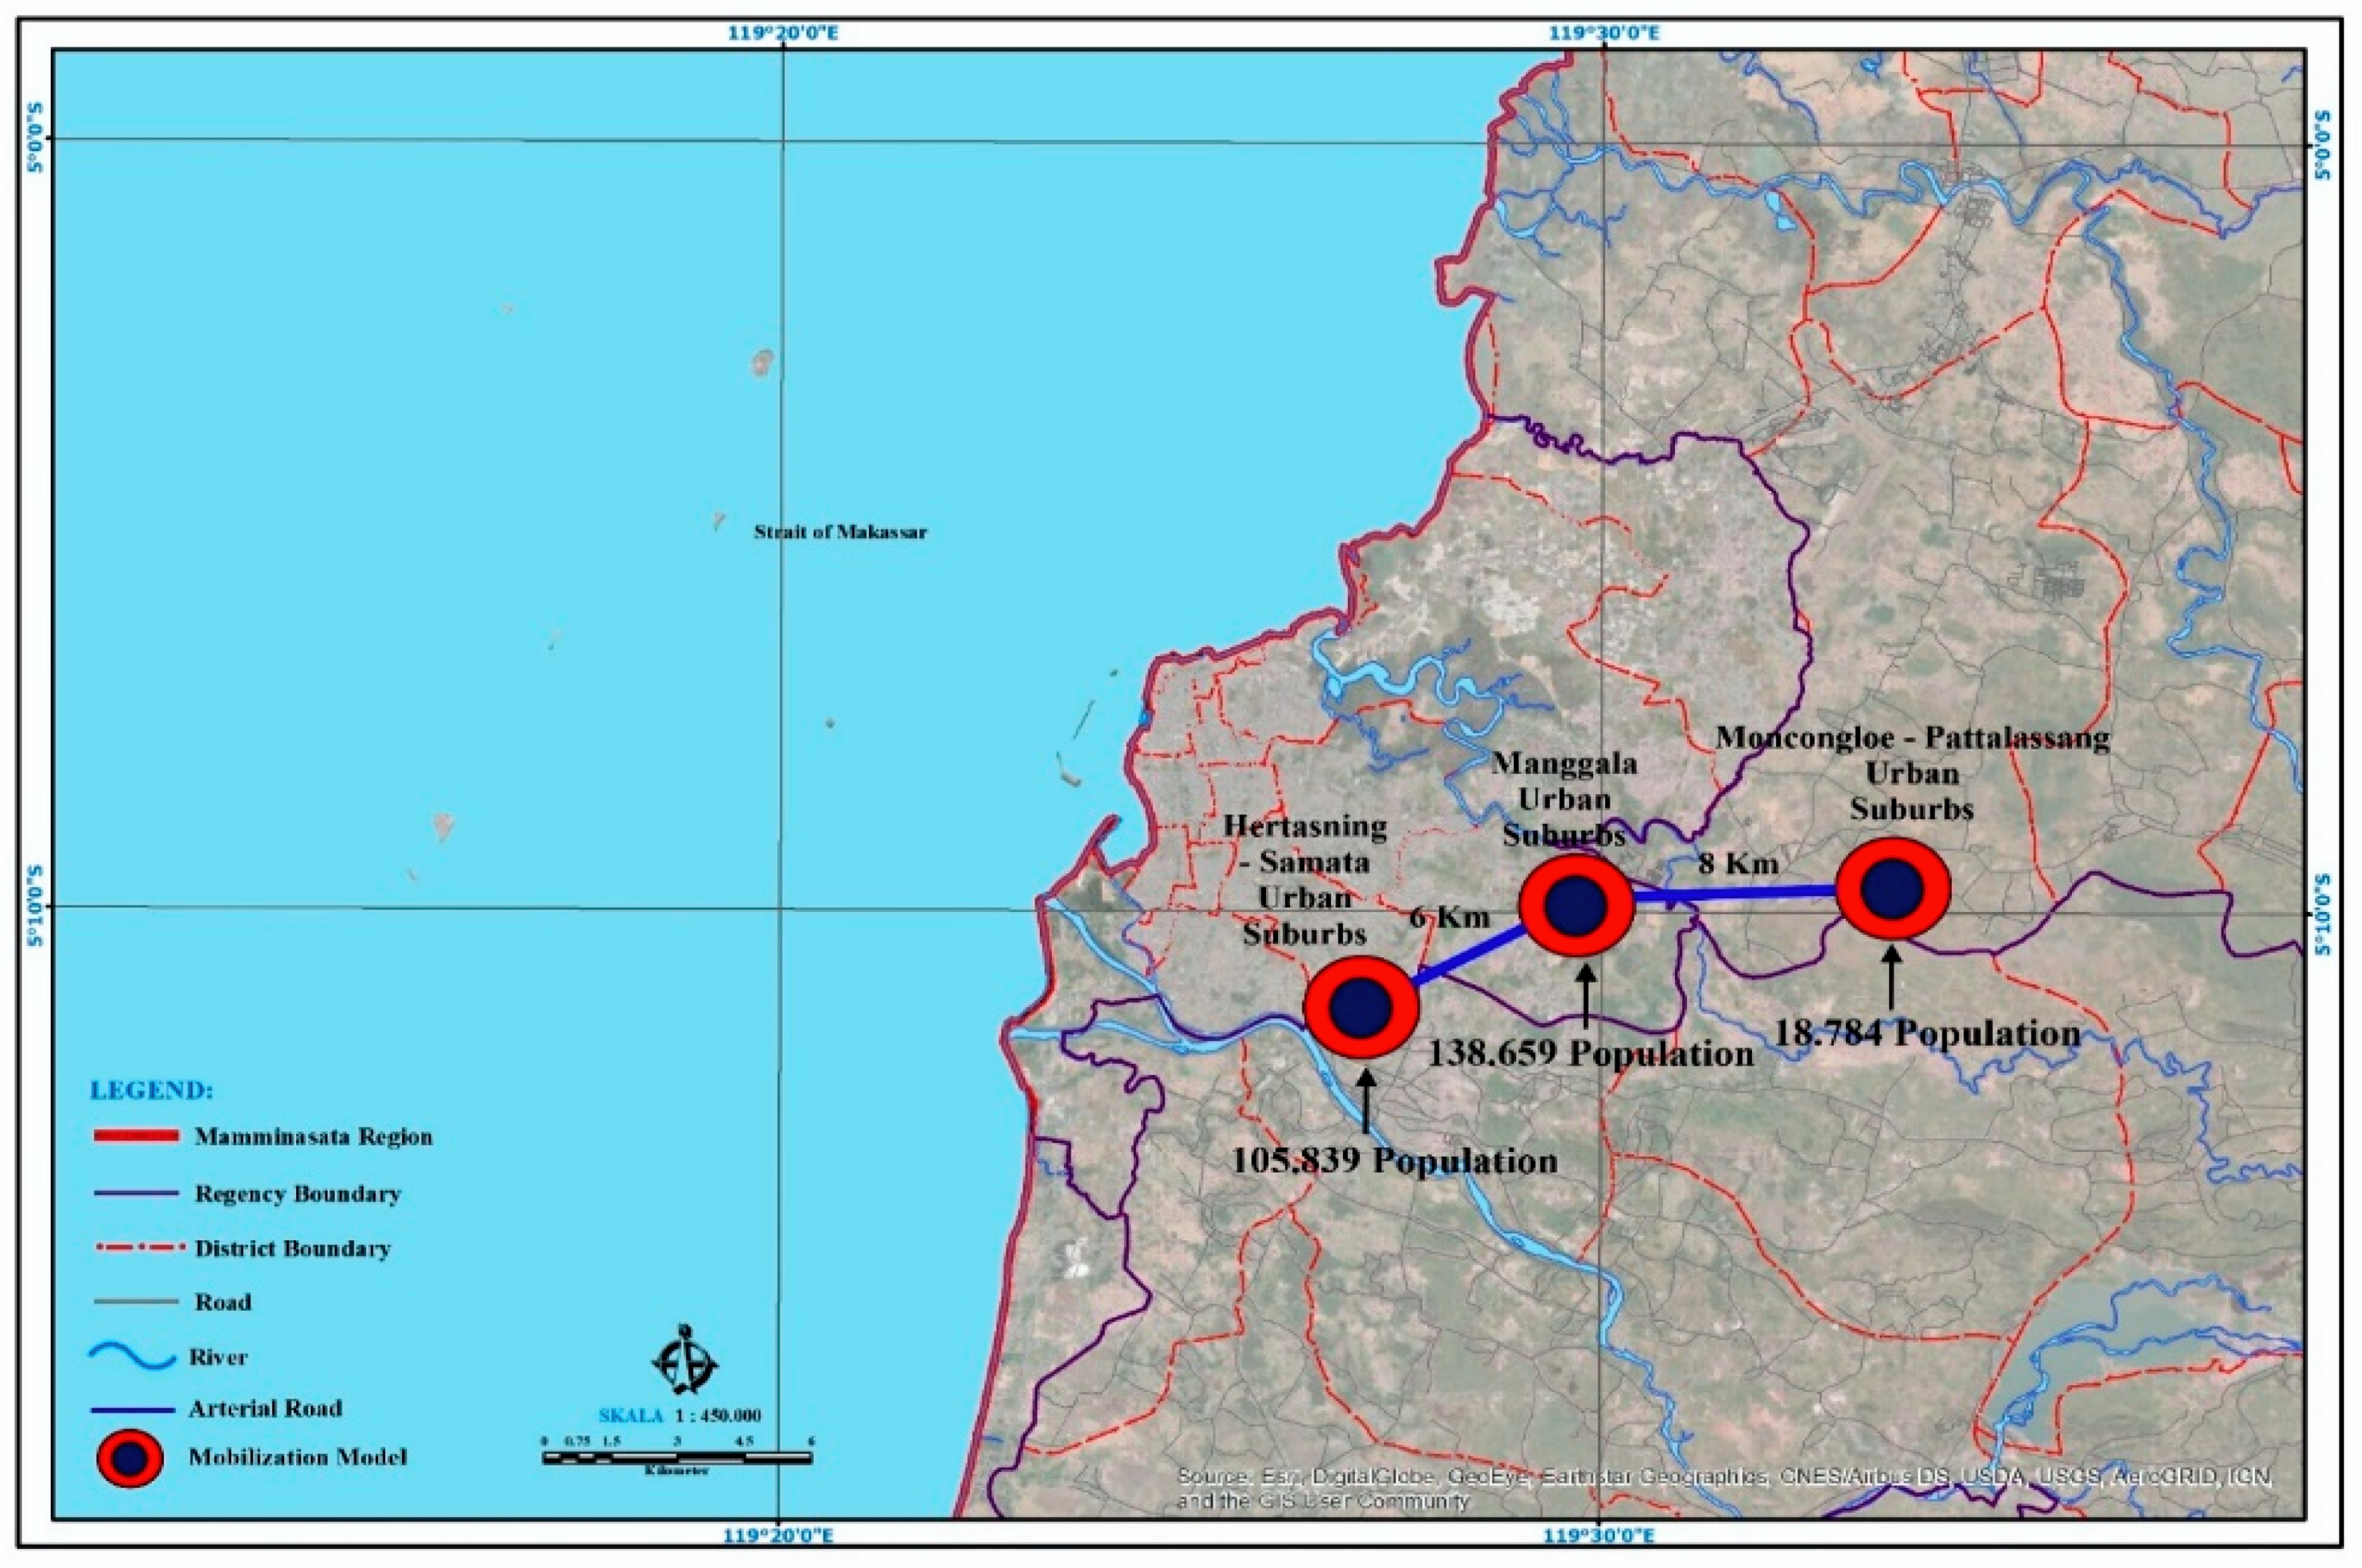
This study uses a sequential explanatory approach, which is a combination of quantitative and qualitative approaches in sequence. The qualitative method, used to construct hypotheses based on phenomena that develop in the field. While quantitative methods are descriptive, comparative, and associative and test hypotheses based on the results of qualitative studies using path analysis. The works relevant to this study include: (a) a research by [76] which established rapid urban expansion during the pre-crisis period, mainly in the manufacturing and housing development were converted from significant proportions of agricultural land; (b) a study by Gradinaru et al., [77] which asserted that the shape of the urban areas changed from being compact to the city with “more dispersed patterns. However, specific processes of urban expansion, such as sub-urbanization or peri-urbanization, affect the vast majority of the analyzed cities influenced by the development level of the urban area; (c) in Indonesia, a study by [78] indicated suburb transportation in metropolitan areas increased migrant proportion, change in job structure, number of formal and informal economic activities, and income. This process resulted in transformation of social-economic structure from agrarian characteristics to urban industries and created job orientation difference and spatial segregation. The three results of the studies are associated with spatial transformation in development of suburb of Mamminasata Metropolitan located in intersection. This confirms the change in suburb land-use due core city expansion and spatial transformation process caused differences in economic interest and spatial segregation in suburb of Mamminasata Metropolitan.

3.2. Study Area

This research was carried out in the Mamminasata Metropolitan urban suburbs by establishing three study sites, namely (i) the suburban area of Hertaning-Samata, (ii) the suburban area of Manggala, and (iii) the suburban area of Moncongloe-Pattalassang. The study location is chosen based on consideration; (a) Spatial patterns and urban activity systems developed in the three study sites are very complex and varied (b) Spatial integration and spatial interaction have a tendency towards socio-economic polarization, (c) The three suburban areas are connected with the urban transportation system of the Mamminasata Metropolitan City, and (d) Differentiation of socioeconomic patterns of activity has a tendency towards urban agglomeration and the formation of quite complex social territory structures.
Excessive urbanization and maximum compaction are determinants factor that influence changes in land use and spatial interactions towards the formation of a system of activity and economic growth in the urban suburbs of the Metropolitan Mamminasata (see Figure 2). The first part begins with an analysis of aspects of spatial integration and land use change. These two aspects are then examined using a qualitative approach, for the purpose of constructing research hypotheses. The hypothesis is then tested using Path Analysis. The regional economic approach is examined to analyze the economic growth of the Mamminasata Metropolitan Area. The next step is to categorize the research variables, they are spatial integration (X1), spatial interactions (X2), urban agglomeration (X3), urban activity systems (Y), and economic growth (Z). The measurement of variables using an interval scale is based on indicators of spatial patterns, population movement systems based on travel destinations for economic and social interests. The field process carried out was to validate the data through focus group discussion activities.

3.3. Method of Collecting Data

Quantitative data collection was carried out in two stages, namely (a) field observations, aimed at observing changes in land use, distribution of flows of goods and human, economic growth, urban activity systems, urban agglomeration, and the patterns of urban spatial linkages of Metropolitan Mamminasata, and (b) surveys, which is used to understand the characteristics of the population based on socio-economic conditions and the travelling patterns of the population from the area of origin to the destination. Respondents determine by random sampling. The number of respondents is 400, with the consideration such as (i) intensity of population movements, (ii) patterns of socioeconomic activities, and (iii) a system of urban activities that are established. The results of observations and surveys were then elaborated using the results of documentation studies related to the Metropolitan Mamminasata urban development plan. Documentation study uses content analysis and spatial interaction analysis for the purpose of describing spatial patterns and the distribution of urban activity locations in the three study locations (see Figure 2).
Referring to the research objectives to be achieved, the data requirements in this study consist of (a) observation and survey, including data; (i) spatial integration data related to infrastructure network systems and urban transportation systems, spatial activity patterns, spatial use, and urban spatial functions. Data sources obtained through field observations and satellite imagery. The aim is to map land cover and thematic maps, landscape configuration, typology and morphology of the suburban Metropolitan Mamminasata urban area, (ii) spatial interactions, including data; Metropolitan Mamminasata urban road network system, patterns of economic linkages between core cities and suburbs, population mobility includes migration patterns and travel destinations, (iii) urban agglomeration includes; data on the characteristics of settlements, trade and services, education, and urban socio-economic activities of the Metropolitan Mamminasata, (iv) urban activity systems, including data, spatial patterns, spatial functions, and transportation network system connectivity, (v) economic growth data including; the development trend of the Metropolitan Mamminasata urban economic activity sector (2016–2019), and the gross regional domestic product (GRDP) data of Makassar City, Gowa Regency, and Maros Regency. (b) Domuntation data includes the Metropolitan Mamminasata urban development policy and the Mamminasata Metropolitan Urban Spatial Plan.

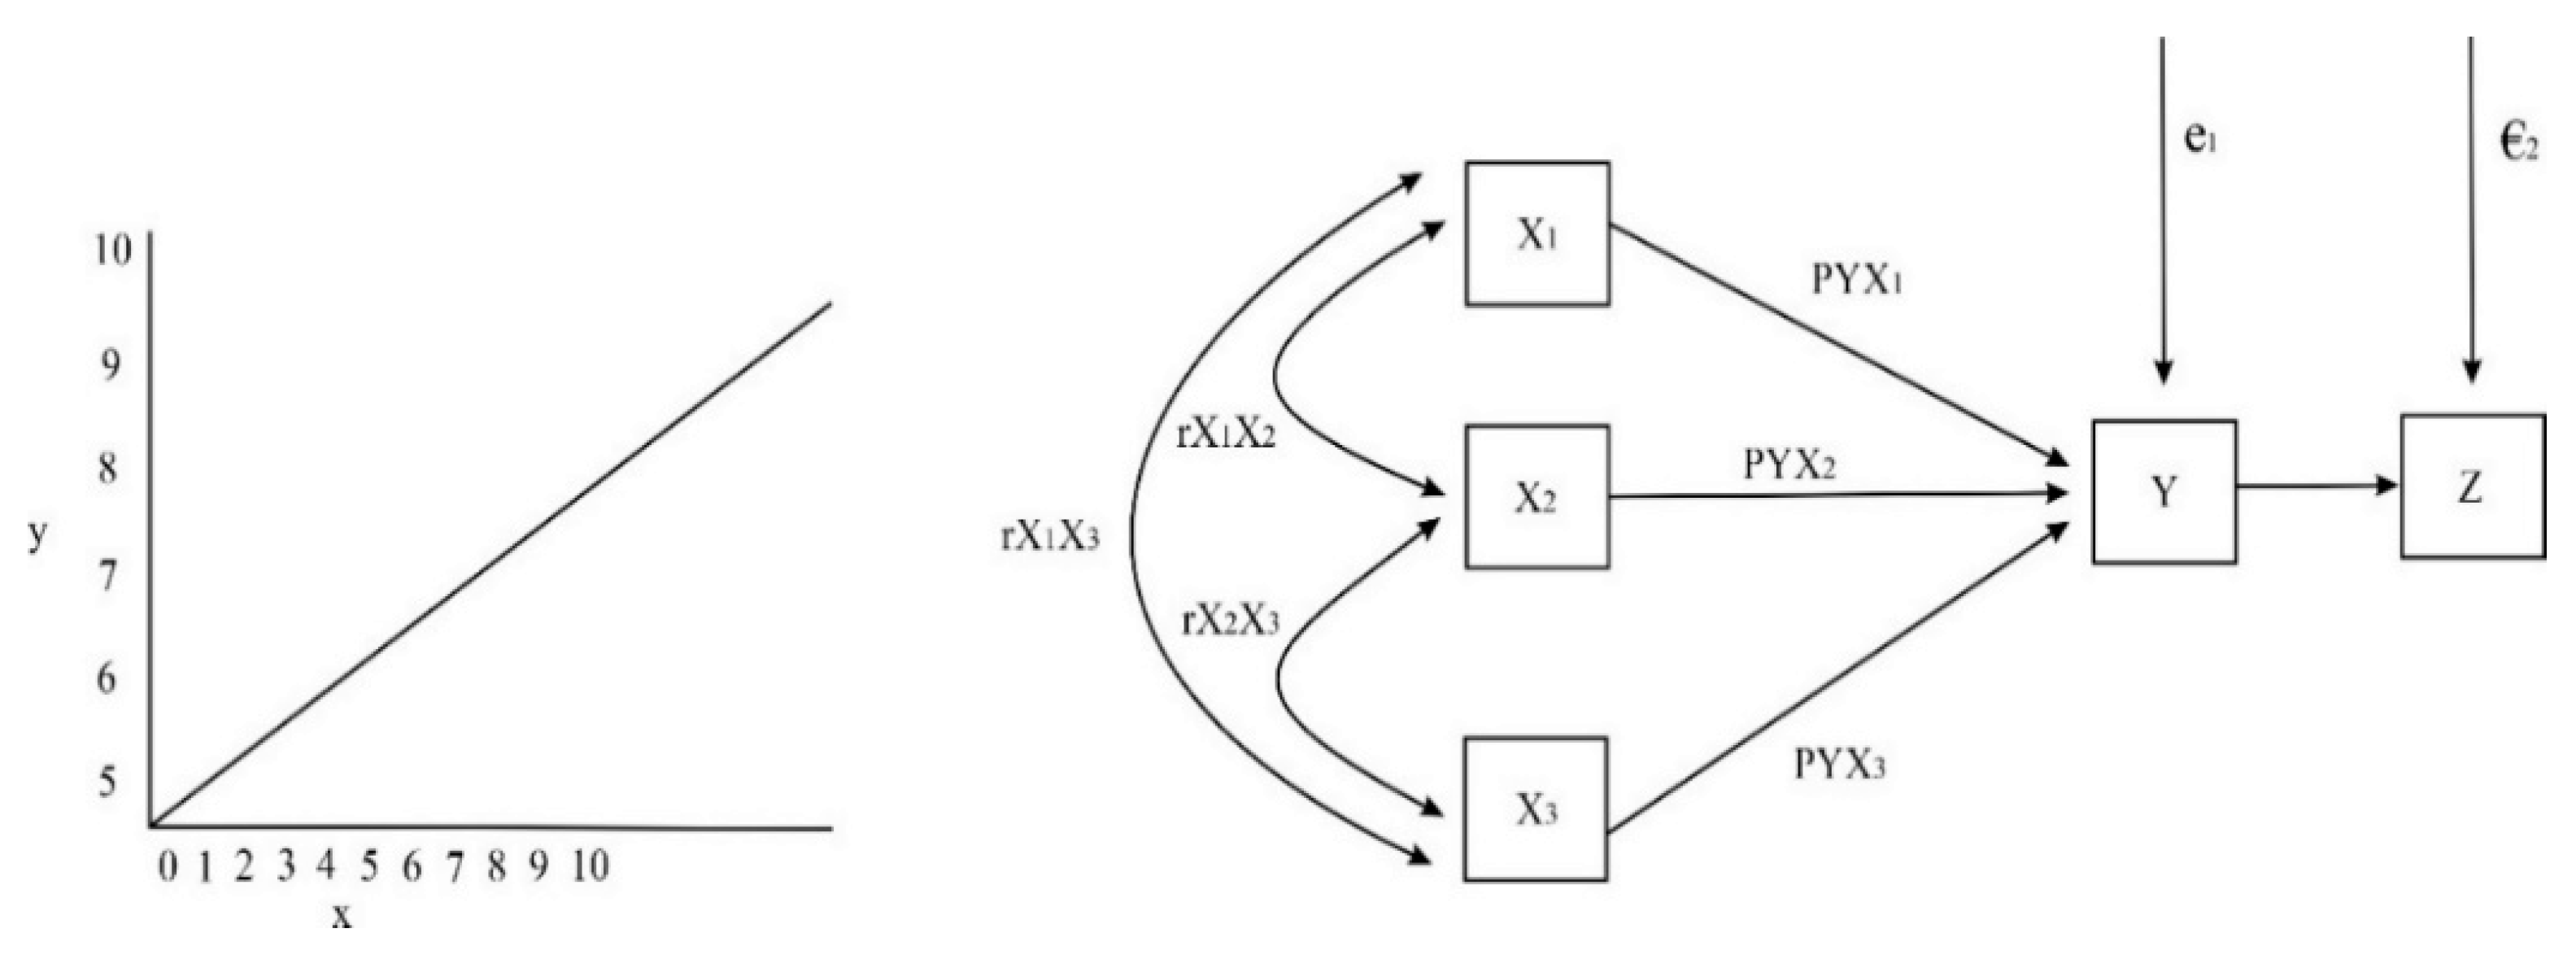
3.4. Data Analysis Method

The acceleration of development towards economic growth is positively associated with changes in the transportation system of the suburban area Metropolitan Mamminasata. This condition is characterized by the existence of road corridors; (i) Hertasning-Samata as long as 9 km, which functions to connect Makassar City with Gowa Regency and Maros Regency, (ii) Road corridor Tamangapa Raya as long as 6 km, functions to connect Manggala urban area of Makassar City towards urban area of Gowa Regency and urban area of Maros Regency, and (iii) Moncongloe-Pattalassang urban area from the direction of Makassar City to Gowa Regency and Maros Regency is connected through the 8 km Yasin Limpo corridor. Those three road corridors lead to urban and area spatial integration and urban areas to the spatial interaction direction physically, economically and socially. Spatial interaction and transportation models are used to facilitate the explanation and prediction of patterns of human and economic interaction over geographic space [45]. Over time, particularly since improved accessibility conditions have enabled much faster travelling, more people have come to travel more frequently (although a suppressed demand is still present and inequalities are considerable) to more distant destinations, major cities in particular, for mainly social motives [79]. The dynamics of the suburban area of Mamminasata Metropolitan is marked by the changes in the use of space for various urban functions, such as housing and settlement covering an area of 2333.25 Ha, trade and services covering an area of 181.84 Ha, education covering an area of 15.75 Ha and other urban activities covering an area of 12,472.86 Ha. The diversity of activities developed has caused spatial interactions in the direction of the distribution of the flow of goods and people.
This research departs from the phenomenon of the development of suburban Metropolitan Mamminasata urban areas very quickly and revolutionarily, marked by changes in land use, conversion of agricultural land that is quite intensive, changes in spatial structure and spatial patterns towards the formation of social complex structures that are very complex. Changes in land use are characterized by the allocation of space for trade and service development, large-scale settlements, recreational facilities, shopping centers, educational facilities and other urban activities. Spatial integration and urban agglomeration lead to spatial interactions, the formation of a system of activities towards economic growth. Path analysis is an extension of multiple linear regression, and which allows the analysis of more complex models [80]. Path analysis in this study is used with the following considerations: (i) analyzing the relationship between variables based on a priori models, (ii) explaining why the variables are correlated using a sequential model temporarily, (iii) drawing and testing a mathematical model with using the underlying equation, (iv) identifying the pathway that causes a particular variable to other variables that it affects, and (v) calculating the magnitude of the effect of one or more exogenous independent variables on other endogenous dependent variables.
The path analysis in this study is based on variables, namely (i) X1 exogenous independent variable (spatial integration) with the indicator being assessed; transportation systems, spatial diffusion, and distribution of the flow of goods and services, (ii) X2 exogenous independent variables (spatial interactions) with the indicators being assessed; human and goods flow, movement of ideas and information movement, and transportation related to material and energy flows, (iii) X3 exogenous independent variable (urban agglomeration) with indicators assessed as grouping activities of settlements, trade, services, education, health, industry, tourism and offices, (iv) Y endogenous dependent variable (urban activity system) with assessed indicators; economic space function, social space function, the relationship between spaces, and the hierarchy of service centers, and (v) Z endogenous dependent variable (economic growth), with indicators assessed; sectors of economic activity, regional income, and level of income per capita of the community.
Path analysis in this study uses linear regression method (see Figure 3). Assumptions that are built, namely (i) the regression model must be feasible. This feasibility is known if the significance value on ANOVA of < 0.05, (ii) predictors used as independent variables must be feasible. This feasibility is known if the Standard Error of Estimate < Standard Deviation, (iii) regression coefficients must be significant. Tests carried out by the T Test. Coefficient regression is significant if T arithmetic > T table (critical value), (iv) multicollinearity may not occur, meaning that a very high correlation may not occur between independent variables, and (v) autocorrelation does not occur. Autocorrelation occurs if the Dubin and Watson numbers are < 1 and > 3. The path diagram uses structural equations:
Y = PYX1 + PYX2 + PYX3 + e1
Path analysis is used with consideration of: (i) interval scale research metric data, (ii) there are endogenous and endogenous dependent variables for multiple regression models and intermediate variables for mediation models and combined mediation and multiple regression models and complex models, (iii) size a sample of 400 respondents, (iv) the pattern of relationships between variables is only one direction, and (v) the causal relationship is based on the theory that is, there is a relationship or correlation between spatial integration, spatial interaction, urban agglomeration and urban activity systems on economic growth in urban suburbs metropolitan.
Spatial interaction analysis is intended to measure the suitability of the spatial structure conditions that are built based on the interaction between spatial units, namely (a) the relationship between economics and spatial interactions, (b) accessibility between the center and a stop in an area (c) barriers to interaction and (d) explain the symptoms of location, relocation, distribution and diffusion. This analysis considers several factors, namely (i) business index, (ii) strength of attraction, (iii) magnitude of interaction, (iv) urban accessibility and stopping points. Business indexes use valuation, which are; (a) interactions (I), (b) population of two urban areas (PA.PB), (c) population of another city, and (d) distance between two cities (km).
The strength of interaction between urban areas is assessed based on considerations: (i) empirical constant number with a value of 1, (ii) population of urban area A (PA), (iii) population of urban area B (PB) and (iv) distance of urban area A and urban area B (DAB). Next stop points are measured based on: (a) the distance between the two trade centers, and (b) 1 + roots of large urban dwellers divided by small urban dwellers. Furthermore, the accessibility analysis of urban areas is used to determine the level of mobility carried out by the community. The accessibility value is measured based on indicators: (i) accessibility value, (ii) road function, (iii) road construction, (iv) road conditions, and (v) distance to the activity location between two cities.
IB = P A   P B d
I AB = k   P A   P B ( d AB ) 2
D AB = d AB 1 + P A / P B
A = K   F   T d
The affirmation of formulation used, namely: (i) IB is a business index calculated based on the number of residents between two cities. PA and PB are representations of a larger population of city A (soul) and a smaller population of city B, and d is the distance between two cities (km), (ii) IAB is the strength of interaction between regions A and B, k is an empirical constant whose value is 1, PA is the number of inhabitants of region A (soul), PB is the number of residents of region B (soul), while dAB is the distance between region A and B (km), (iii) DAB is the location of the measured stop point based on the city/region which has a smaller population (in this case, city A), dAB is the distance between city A and city B (km), PA is the larger city A population (soul), PB is the population of city B which smaller (soul), (iv) A. is the value of accessibility, K. is the average number of trips of the population, F is the function of the road (primary = 3, secondary = 2, and local = 1), T is the condition of the road (good = 3, moderate = 2, bad = 1), and d distance between two cities (km).
Regional economic analysis is used in this study for the purpose of knowing the development of urban economic activity sectors in Metropolitan Mamminasata including Makassar City, Gowa Regency, and Takalar Regency, which are associated with economic growth in the South Sulawesi Province. The analytical method used is Shift-Share. This analysis aims to assess the shifts and roles of each economic sector and changes in the structure/economic performance of the Metropolitan Mamminasata region to higher economic structures (provincial or national) as a reference. Formulation used:
PEK = KPN + KPP + KPK
The indicators assessed are: (i) changes in district/city income, (ii) provincial growth component, (iii) proportional growth component, and (iv) district/city competitiveness growth component. PEK is a change in regency/city income (Makassar City, Gowa Regency and Maros Regency), KPN, is a component of economic growth in the province of South Sulawesi (Rp), KPP, is a component of proportional growth (Rp), and KPK, is a component of district competitiveness/city (Makassar City, Gowa Regency, and Maros Regency). Research analysis framework, in the following Figure 4.

4. Result

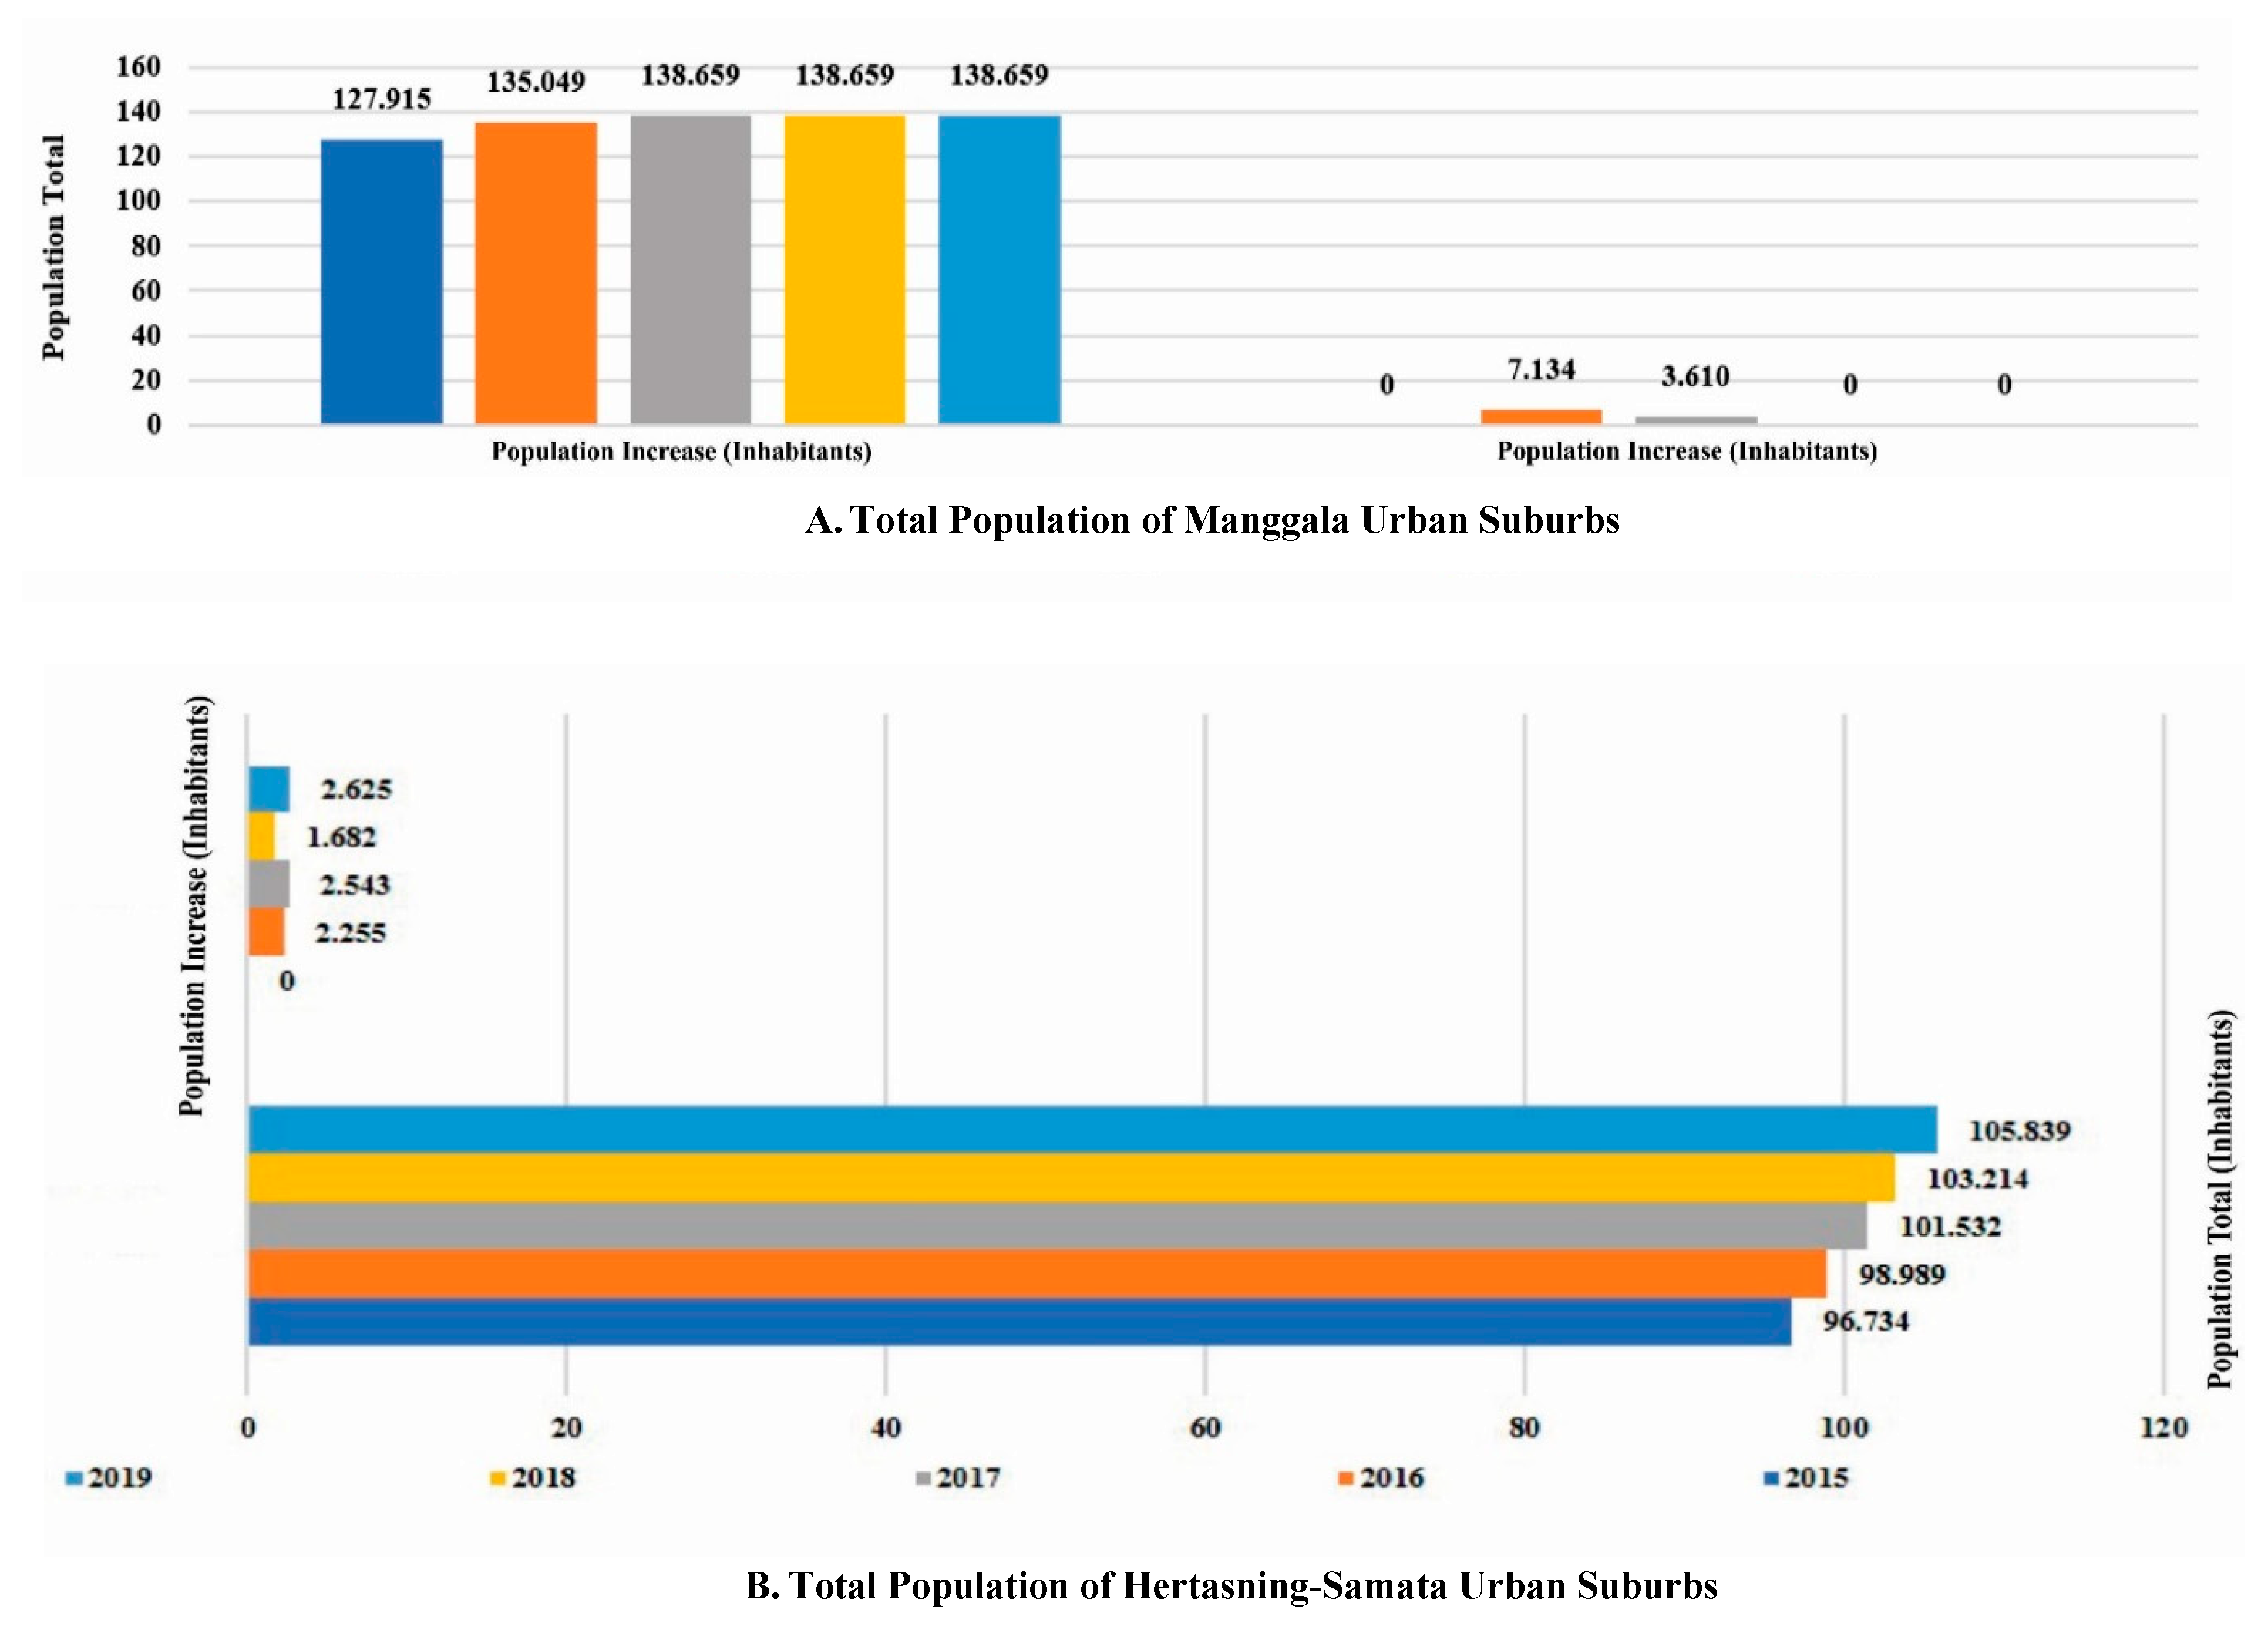
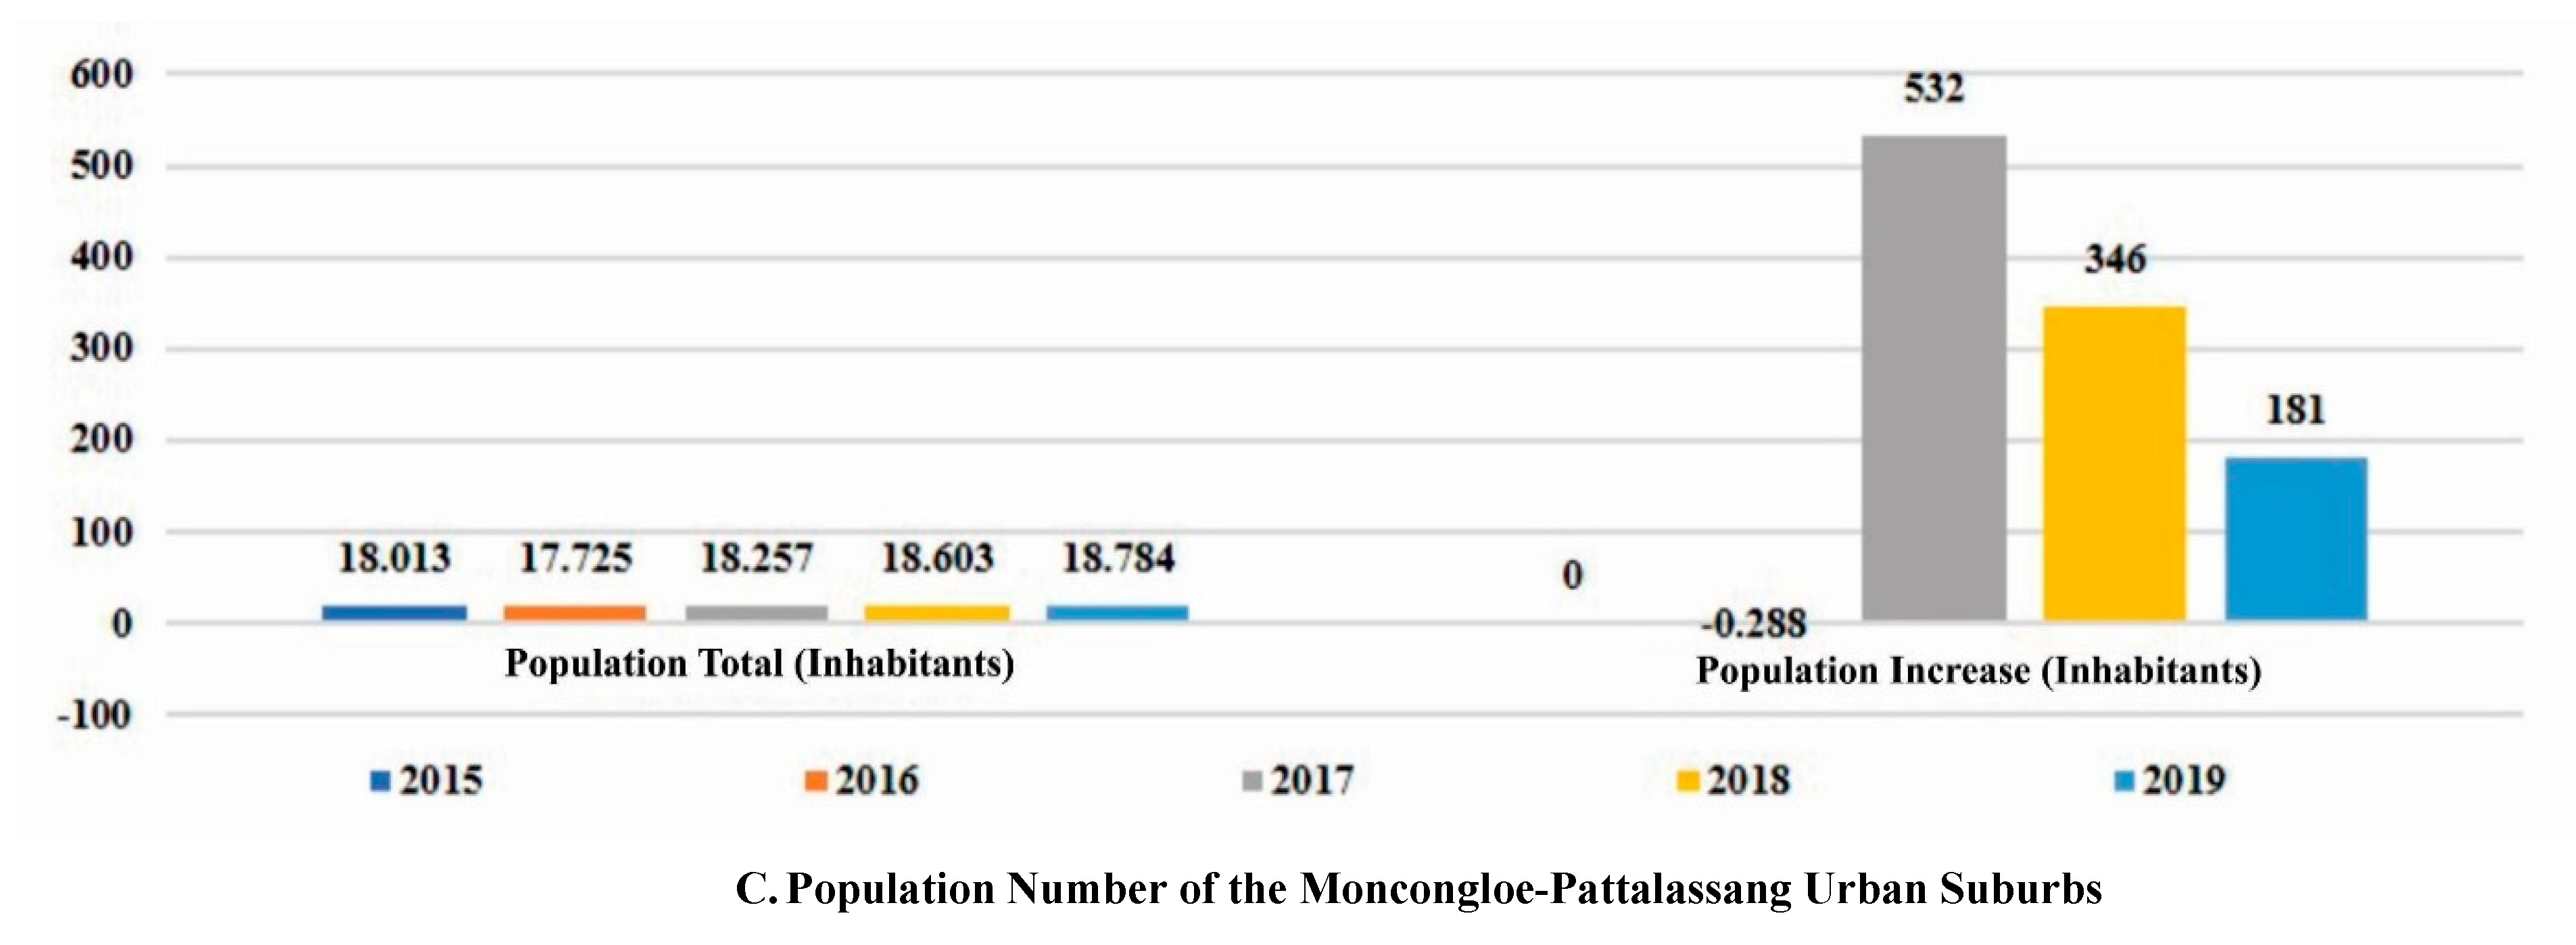
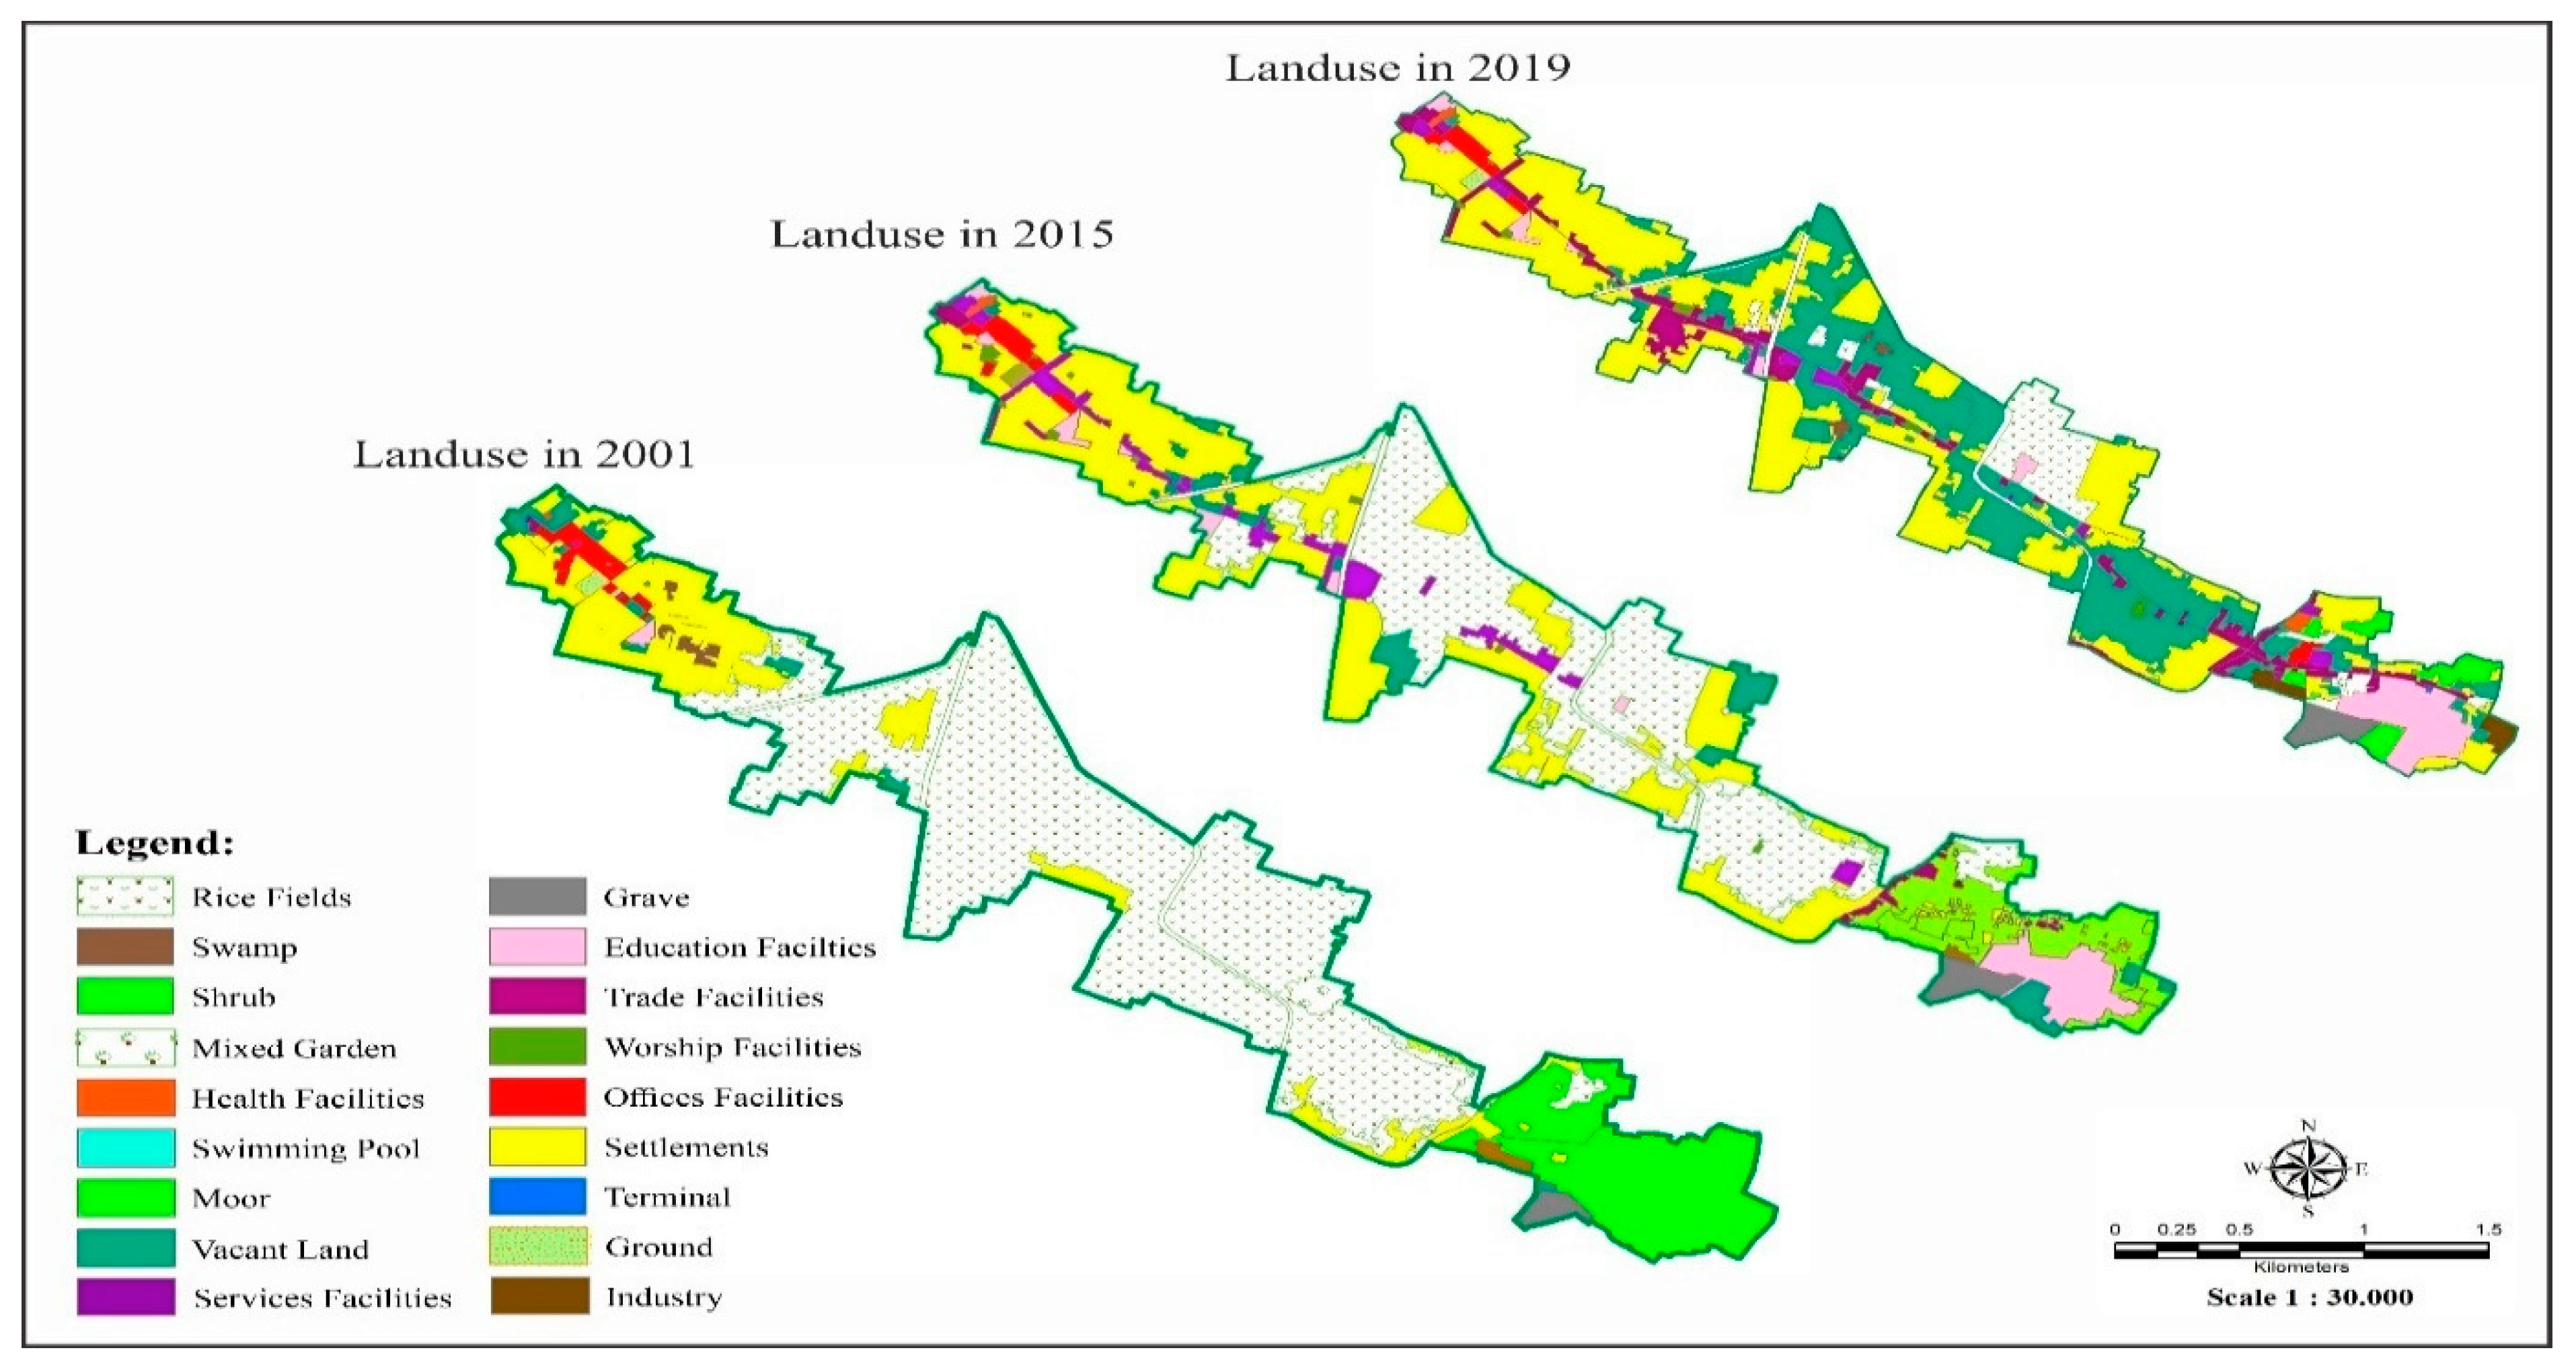
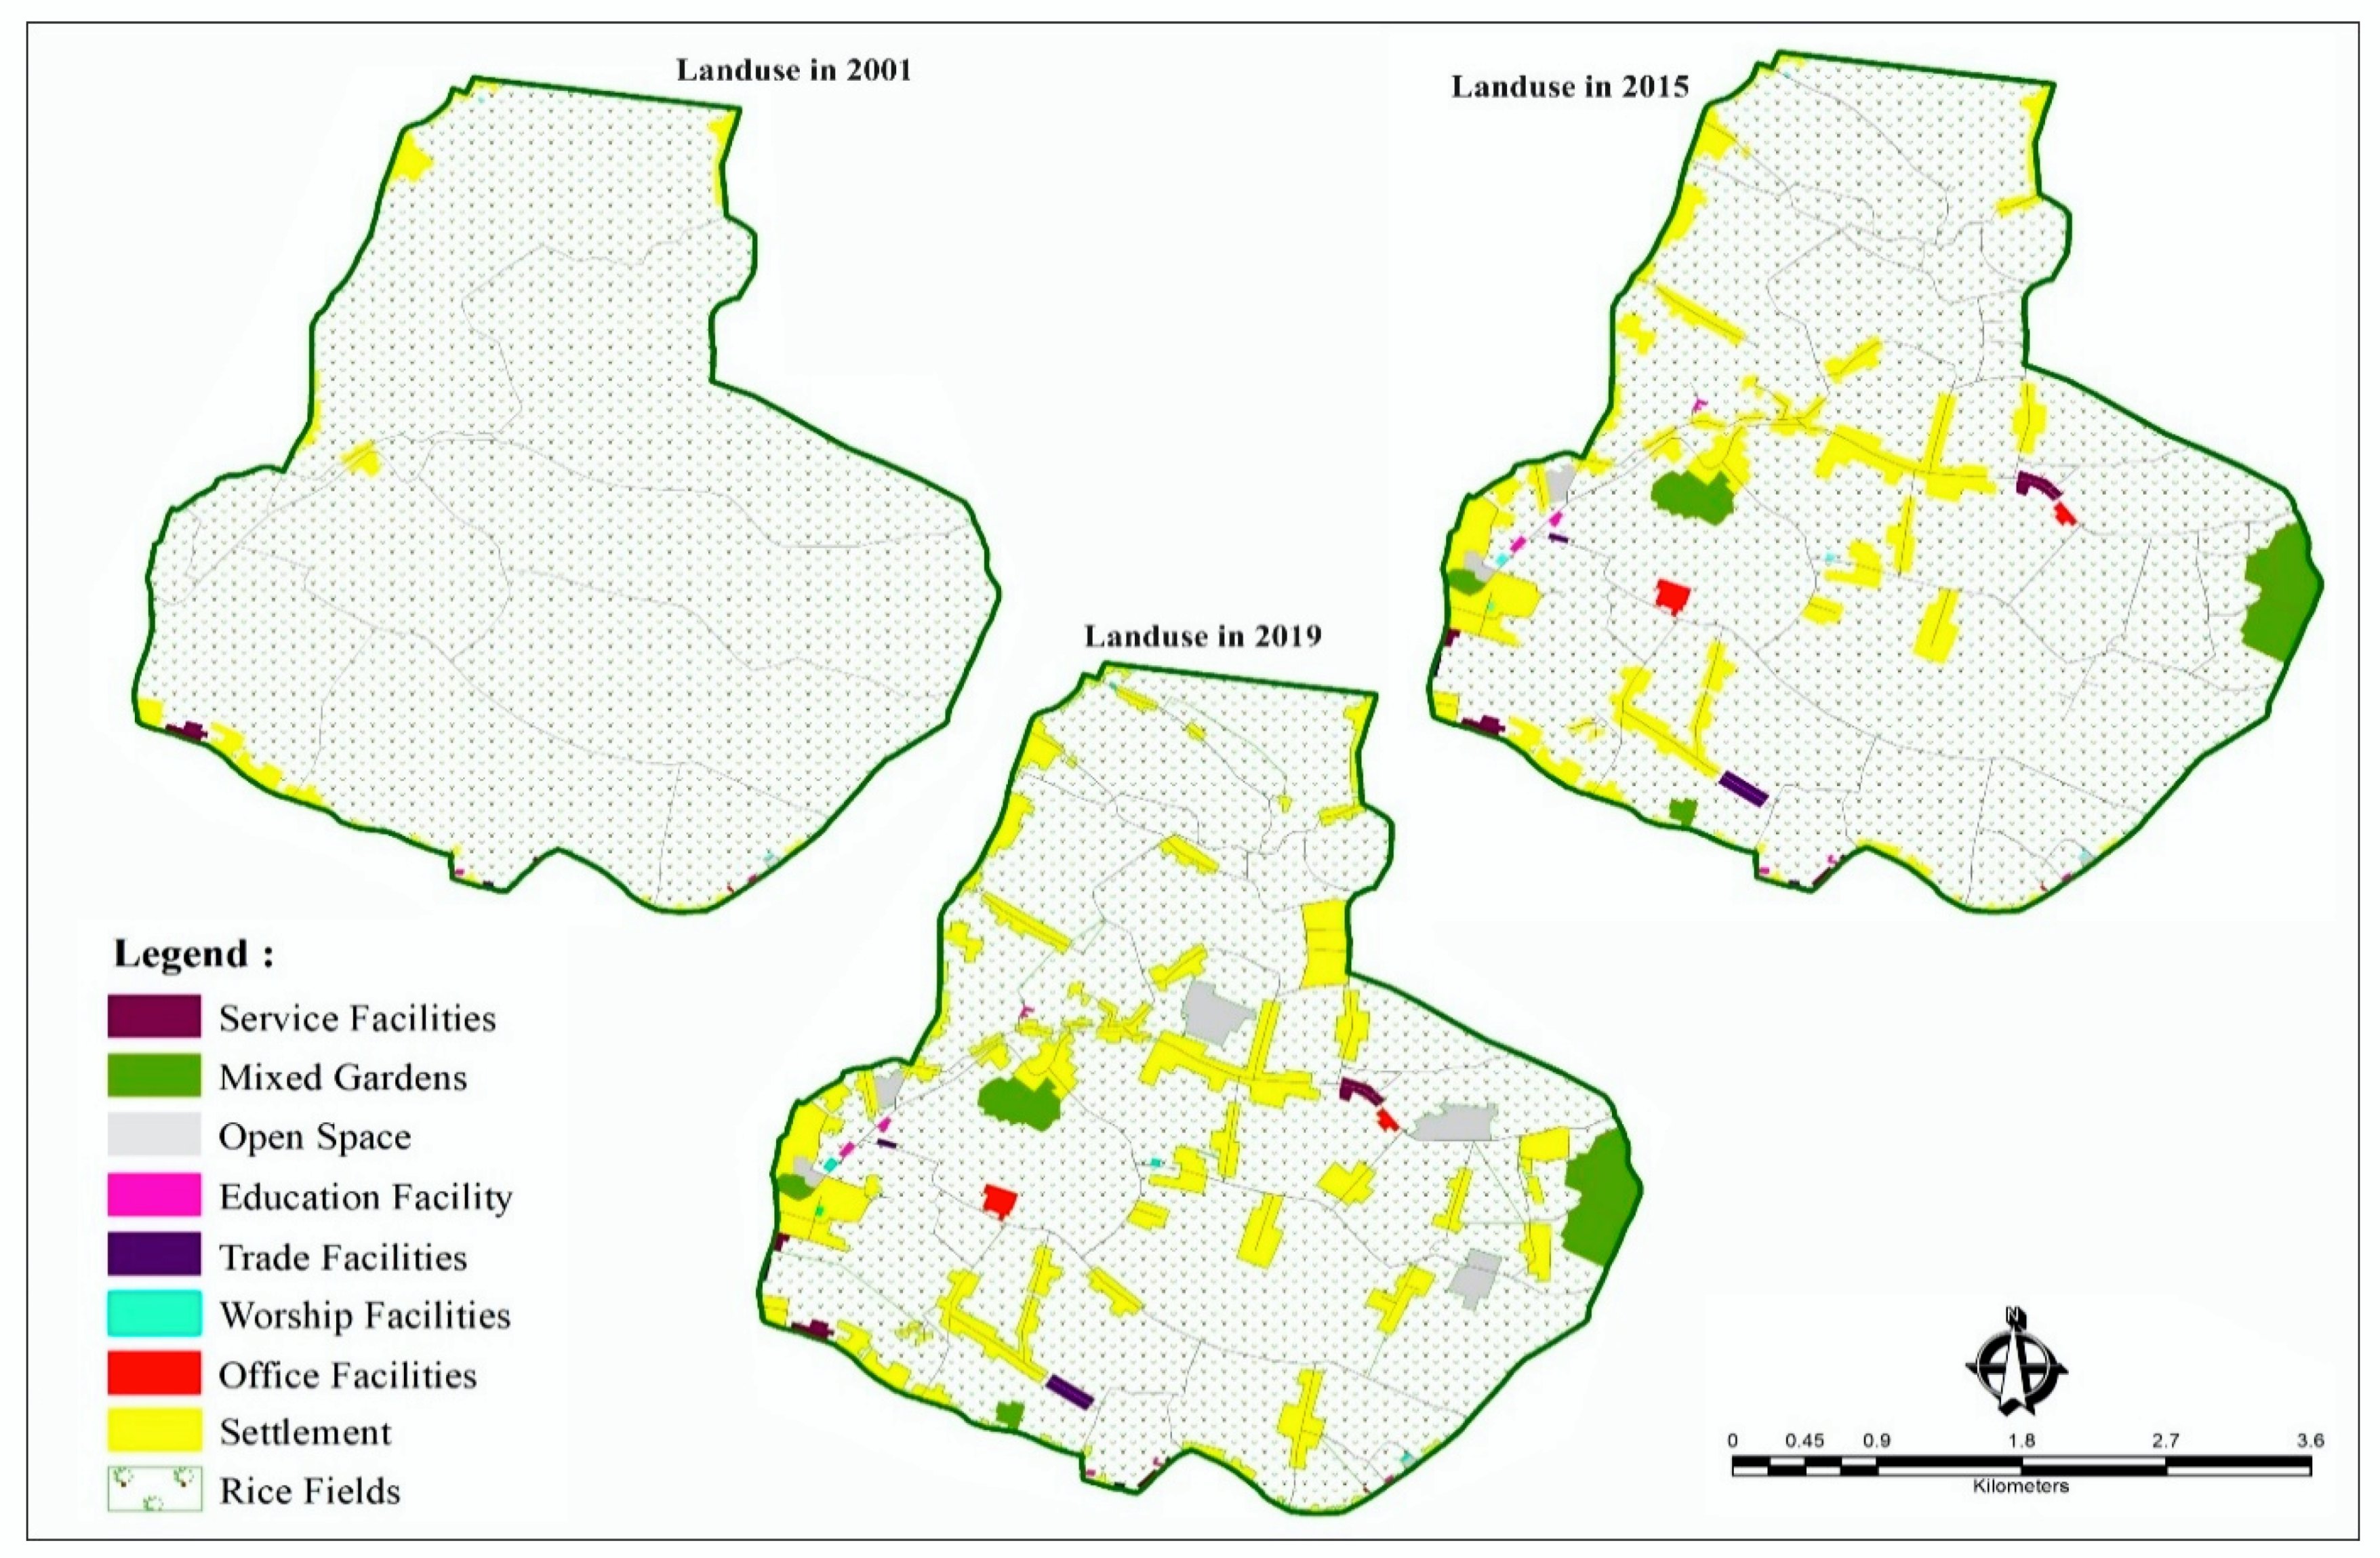
4.1. Increase in Population and Change in Land Use

The acceleration of development in the Metropolitan urban suburbs due to an increase in population has led to the conversion of productive agricultural land to the use of quite complex spaces [81]. Relevant environmental conditions differ greatly between regions and habitat types [82]. Urban agglomeration that is developing towards service centers has an impact on spatial dynamics and the formation of urban activity systems [83]. Urban service centers supported by the construction of transportation facilities and infrastructure have led to an increase in investment flows and mobility of goods and people for socio-economic interests. Relationships or connections between bus stations have a strong effect on transportation, intra-urban mobility, social justice, and sustainable city development [84].
The increasing development investment has had an impact on typology and morphology changes in the suburban of Mamminasata Metropolitan. The continuing economic polarization cause changes in land use towards the fulfilment of socioeconomic functions, connectivity of the surrounding urban and rural areas. Determine changes in urban morphology initiated when architectural and urban forms fulfilling specific economic and social functions are no longer acceptable by local people and other city users [85]. Development of large-scale settlements, shopping centers, shops, recreational facilities and education become a driving force for suburbanization, conversion of productive agricultural land and changes in environmental ecosystems. Rapid urbanisation has created the challenge of accommodating urban growth to local eco-environmental status [86]. Increasing urban population and community groupings based on income segmentation lead to service disparities, differences in spatial characteristics and typologies of settlements based on community welfare. The polarization of the core-periphery where one dominant region shows many different parameters, while the difference between the rest of the area too minimal or does not show other regularities in the form of several spatial gradients [87].
The population that keep on increasing, running in parallel to the conversion of productive agricultural land and changes in the characteristics of rural land use towards urban systems that are quite complex (see Figure 5). The suburban area of Hertasning-Samata is marked by an increase in population of 9105 people or 1.8 percent. The suburban area of Manggala is marked by an increase in the urban population of 10,744 people or an increase of 1.6 percent. Furthermore, in the outskirts of Moncongloe-Pattalassang region, it was marked by an increase in population of 771 people or 0.84 percent. The fact found shows that the increase in population towards urban expansion in the outskirts of the Mamminasata Metropolitan area is dominantly influenced by the growth of large-scale settlements and the development of socio-economic activities causing a reduction in the number of farmers and conversion of productive agricultural land. Urban expansion will inevitably lead to the loss of high-quality cultivated land, which will lead to a contradiction between urban expansion and farmland protection [88]. Thus, it can be concluded that the three urban suburbs of Metropolitan Mamminasata have experienced changes in land use and conversion of productive agricultural land, typology, morphology and service disparity towards urban industrial communities. The service disparity is measured based on the indicators of; (i) differences in housing characteristics, (ii) education and health services, (iii) employment opportunities, and (iv) accessibility levels. Development management policies do not pay attention to the problems of the local population, especially the socio-economic services problem [89].
The allocation of socio-economic activities that tends to increase has an impact on reducing land cover, environmental degradation, infrastructure service gaps and social conflicts. High population density in rural areas and rapid growth in urban industries and services each contributing environmental pressure [90]. Furthermore, the conversion of grasslands, arable land, forests and accompanying vegetation to closed surfaces include settlements and roads [91]. This trend will continue to increase in line with spatial integration and urban agglomeration towards economic growth. The use of sufficiently complex space causes an increase in pollution and environmental degradation in the suburban of Metropolitan Mamminasata. Factors influencing pollution in urban areas and will enable wetlands to be better designed and managed to minimize their environmental impacts and maintenance costs [92].
Changes in land use in the Hertasning-Samata suburb (see Figure 6 and Table 1), show a variety of urban activities that have developed with the area of land used until the end of 2019 covering an area of 564.01 Ha. The expansion of Makassar’s core urban space towards the periphery of the Hertasning-Samata region has led to a change in typology and morphology towards a change in the characteristics of rural areas towards industrial urban areas. Furthermore, the spatial integration that developed through the support of the existence of the Hertasning-Samata road corridor led to the connectivity of the Metropolitan Mamminasata urban transportation system to its hinterland area to urban agglomeration. Spatial integration that runs in line with urban agglomeration and transportation system connectivity causes very intensive spatial interactions. Field facts found show that transportation system connectivity has an impact on the intensity of population mobility and circular migration from the periphery to the core city of Makassar.
Changes in land use in the Manggala suburbs (see Figure 7 and Table 2), show a variety of urban activities that have developed until the end of 2019, utilizing an area of 859.61 Ha. The intensity of development in the outskirts of Manggala is not only influenced by factors in the urban transportation system, but also by the presence of integrated educational facilities with settlements and tourist facilities. The results of the field confirmation illustrate that the existence of these urban activities causes the flow of transportation to be quite high from the direction of the Manggala suburb towards the core city of Makassar and vice versa. The tendency of spatial integration which developed in the periphery has led to the expansion of the core city of Makassar towards Maros Regency and Gowa Regency.
Changes in land use in the Mongcongloe-Pattalassang suburbs (see Figure 8 and Table 3), show that the characteristics of rural areas that were initially dominant, then experienced significant changes in urban industrial direction, with utilized land area of 3632.96 Ha until the end of 2019. The Moncongloe-Pattalassang urban suburb is a new urban development area created for large-scale settlements to meet the needs of the urban population of Metropolitan Mamminasata which is integrated with the By Pas road network system leading to Hasanuddin International Airport and across the urban areas of Maros Regency and Gowa Regency. Furthermore, developing spatial integration has an impact on changes in spatial attributes in the surrounding rural areas.
Changes in land use due to the increased urban activity cause spatial physical changes, conversion of productive agricultural land, environmental degradation, and differentiation of lifestyle of urban communities in the suburban of Metropolitan Mamminasata (see Figure 6, Figure 7 and Figure 8 and Table 1, Table 2 and Table 3). Changes in land use for the periods of 2001, 2015 and 2019 in the Hertasning-Samata suburb have a tendency towards the large scaled settlement development by utilizing an area of 278.86 hectares, following behind is trade and services covering an area of 63.34 hectares, and education with an area of 39.21 hectares. In the outskirts of Manggala marked by the construction of large-scaled settlements covering an area of 365.89 hectares, recreational facilities covering an area of 7.69 hectares, educational facilities covering an area of 5.38 hectares and offices covering an area of 5.32 hectares. Furthermore, on the outskirts of the Mongcongloe-Pattalassang area as a new area, the same symptoms were also found, marked by the construction of large-scale settlements with an area of 499.45 hectares and trade and services covering an area of 20.65 hectares. Difference land use change in the three periphery areas lies in the urban growth embryo, location, land price, and transportation system. These factors determine the spatial integration, urban agglomeration and socio-economic differentiation in the outskirts of the Mamminasata Metropolitan area. The main factors affecting their site selection decisions were environmental quality, land price, transportation conditions and public facilities conditions [93].

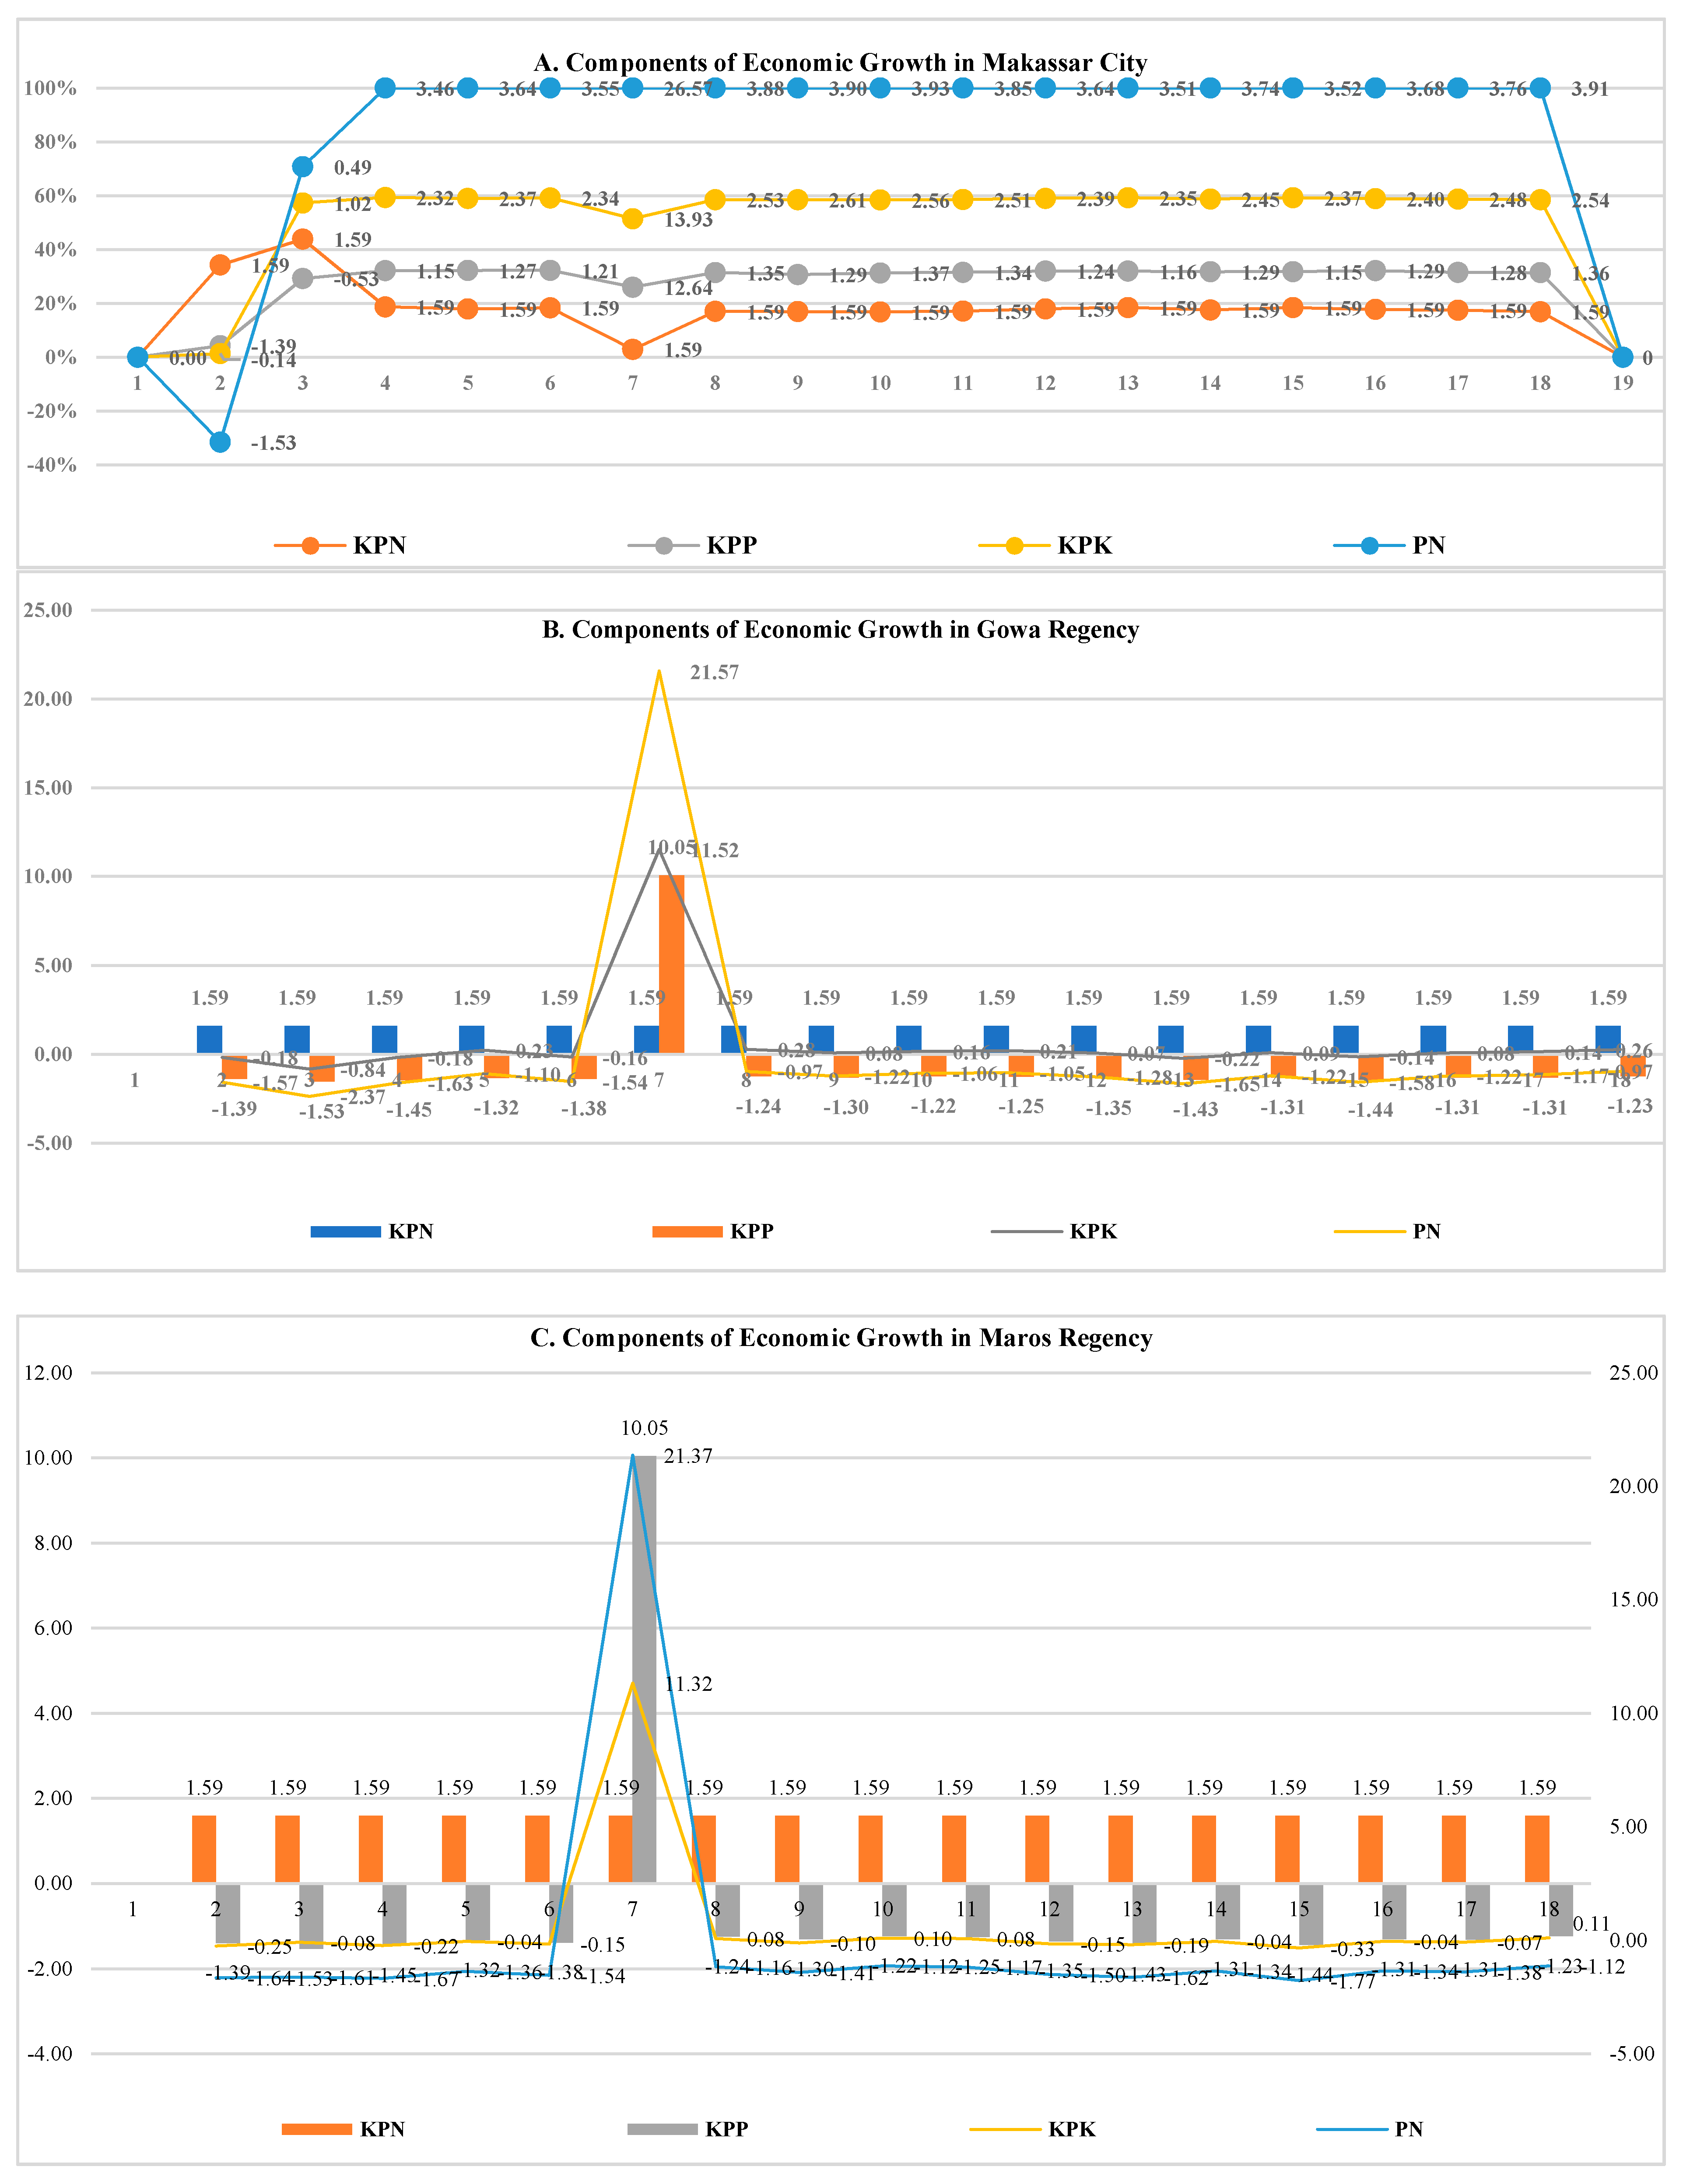
4.2. Urban Agglomeration and Economic Growth

Very complex socio-economic differentiation and urban agglomeration have an impact on the intensity of spatial interactions towards the formation of spatial structures and spatial patterns as well as the increase in formal and informal economic activities. Sustainable approaches have a positive impact on many aspects, such as social, economic and environmental aspects, and contribute to making the informal areas integrated into the city as one entity [94]. The dominant orientation of spatial use in commercial functions leads to differences in interests between migrants and local communities in terms of socio-economic capability, innovation, creativity and ownership of residential facilities based on their proximity to service centers. The character of immigrant entrepreneurship was used as an asset to find a niche for commercial activities that attracts mainstream society [95] Hierarchical service centers of the Mamminasata Metropolitan suburban in Figure 9.
The Metropolitan Mamminasata urban area was formed due to the interrelationships between the surrounding urban and rural spaces. These conditions occur due to the support of the potential of the periphery as a new development area, location factors, relatively low land values, spatial planning policies and connectivity of the transportation network system (see Figure 9). Transport or traffic services are very important factors that influence the socioeconomic status of a region and the spatial interactions of a society [96]. Field facts finding show that the linkages of the urban system based on their position and function are divided into three categories, namely (i) Makassar City as a distribution center for the flow of goods and services, (ii) Maros City and Sungguminasa City function as collecting centers, logistic distribution and commodity flows which function as nodes of different sizes and are highly dependent on urban size and the number of residents served. With economic development, the addition of new activities and transport infrastructure, spatial interactions tend to change very rapidly as flows adapt to a new spatial structure [41].
The increasing urban agglomeration in line with suburbanization has an impact on the physical integration of the region, the economy, social and culture of the periphery to economic growth and the Metropolitan Mamminasata urban service center system. The facts found in the field show that urban agglomeration is characterized by a grouping of several activities, namely (i) formal housing and settlements built by dominant developers located in strategic areas connected by main road corridors leading to the urban areas of Manggala, Hertasning-Samata, and Moncongloe-Pattalassang towards large-scale settlements, (ii) grouping of shopping centers and business centers on major road corridors causing uncontrolled urban sprawl, and (iii) the intensity of changes in spatial use have an impact on increasing population mobility and the distribution of goods and human flows towards spatial integration and physical, economic, and social spatial interactions and the formation of centers–waiter center. Hierarchical service centers that develop in the urban suburbs of Metropolitan Mamminasata in the following Figure 10.
Figure 10 shows the development of the Mamminasata Metropolitan suburbs space structure in both linear and concentric manner, as those that occur along the main road corridors, generally include residential areas, shopping centers, services, and economic activities. Field reports indicate the ease to carry out morphological control outside the built area, which currently has an empty land, with relatively flat topography [97,98]. The physical spatial development of centrifuges and concentricities was related to social, economic, and cultural changes, which occur in the life of infiltrative and expansive migrants, as well as local communities. Meanwhile, field reports show that the Mamminasata Metropolitan suburbs were in transition from rural to municipal, as a result of urbanization and suburbanization [65]. This rapid process, alongside ad hoc and unplanned spatial distribution and allocation of spatial activities, has an impact on decreasing the quality of the environment quality [99]. Furthermore, the spatial structure leads to alterations and formation of social territorial structures, due to differentiation and increasing scale of modern industrial society. However, there are three cases that underlie the process, which include (i) distribution, range, and intensity of the relationship between migrants and local communities, (ii) differentiation of space functions, and (iii) complexity of spatial organizations. Conversely, observed facts show these changes to possess a positive influence on the social relationship between migrants and local communities, towards economic alterations. Therefore, the scale of social transformation increases and is marked by the vicissitudes in the lifestyle of the urban community [100].
The developed relationship among the nodes is then develop towards the formation of the urban system and the pattern of distribution of the flow of goods and logistics in a network between the core cities, supporting cities, urban suburbs and surrounding villages. Logistics and freight distribution, as a transport paradigm, require a view of this multidimensional concept to include four core elements, namely the traditional transport costs, but also the organization of the supply chain, and the transactional and physical environments in which freight dis-distribution evolves [101]. Field facts finding show that service centers, investment development and distribution of goods flow and logistics cause the creation of market areas characterized by the accumulation of economic activity towards core-periphery relations and spatial interactions. In increasingly urban-centered international development policy, meanwhile, inclusion is now rhetorically central to the conception of better futures and appropriate ways of realizing them [102].
Spatial interaction in the urban suburbs of Metropolitan Mamminasata is influenced by four main factors, namely (i) spatial integration of core cities and supporting cities, (ii) differentiation and specialization of urban systems, (iii) organizing urban activities as a single spatial system, and (iv) distribution of goods and services from one node to another node. Circular economy is often seen as an environmental superior alternative to the take-make-dispose linear economy [103]. Thus, it can be concluded that urban systems that are built in the periphery are inseparable due to economic growth and spatial planning, both of which are interrelated and influence factors between one activity and another.
The economic structure of urban areas is closely related to the pattern of developing socio-economic activities. The accumulation of economic activities that tend to develop in Makassar City as a core city then spreads to the urban suburbs of Metropolitan Mamminasata. The urban areas of Gowa are dominant in the agriculture, forestry and fisheries sectors due to their dominance as productive agriculture. Furthermore, Maros Regency is dominant in the transportation and warehousing sector. This fact gives an understanding that the functions of the two cities are supporting cities and supporting urbanization for Makassar City. Identification of desired regional growth patterns, coordinated governance, economic and infrastructure development, and monitoring plans are key attributes of a framework that have generally resulted in acceptable regional outcomes [104]. Field facts finding shows that urban expansion of the dominant core city towards the development of large-scale settlement, trade and service functions, has an impact on increasing the productivity of formal economy businesses and urban informal economies.
The contribution of Metropolitan Mamminasata Metropolitan urban economic growth (see Appendix A, Table A1, Table A2, Table A3 and Table A4), divided into four categories, namely (i) the urban growth component of Makassar City is oriented towards the trade and services sector, (ii) the urban growth component of the dominant Gowa Regency in the sector is still dominant in the agricultural sector, (iii) the growth component of the Maros Regency is dominant in the transportation and warehouse services sector. A positive KPP value confirms that the economic sector is growing rapidly and a negative KPP means slow growth. Both of these categories directly affect the income of the Metropolitan Mamminasata region (see Figure 11). The difference in economic growth of the three urban areas is largely determined by factors of economic activity based on spatial scale, service systems and demand for goods and services. A national development approach that greatly emphasizes macroeconomic growth tends to ignore the great inter-regional development inequality that exists [105]. Thus, it can be concluded that economic growth is a determining factor for spatial interactions toward the distribution patterns of the flow of goods and services, scale of services and urban population. Shifting traditional economies to a circular economy requires a realization of eco-innovations and sustainable engineering solutions [106].

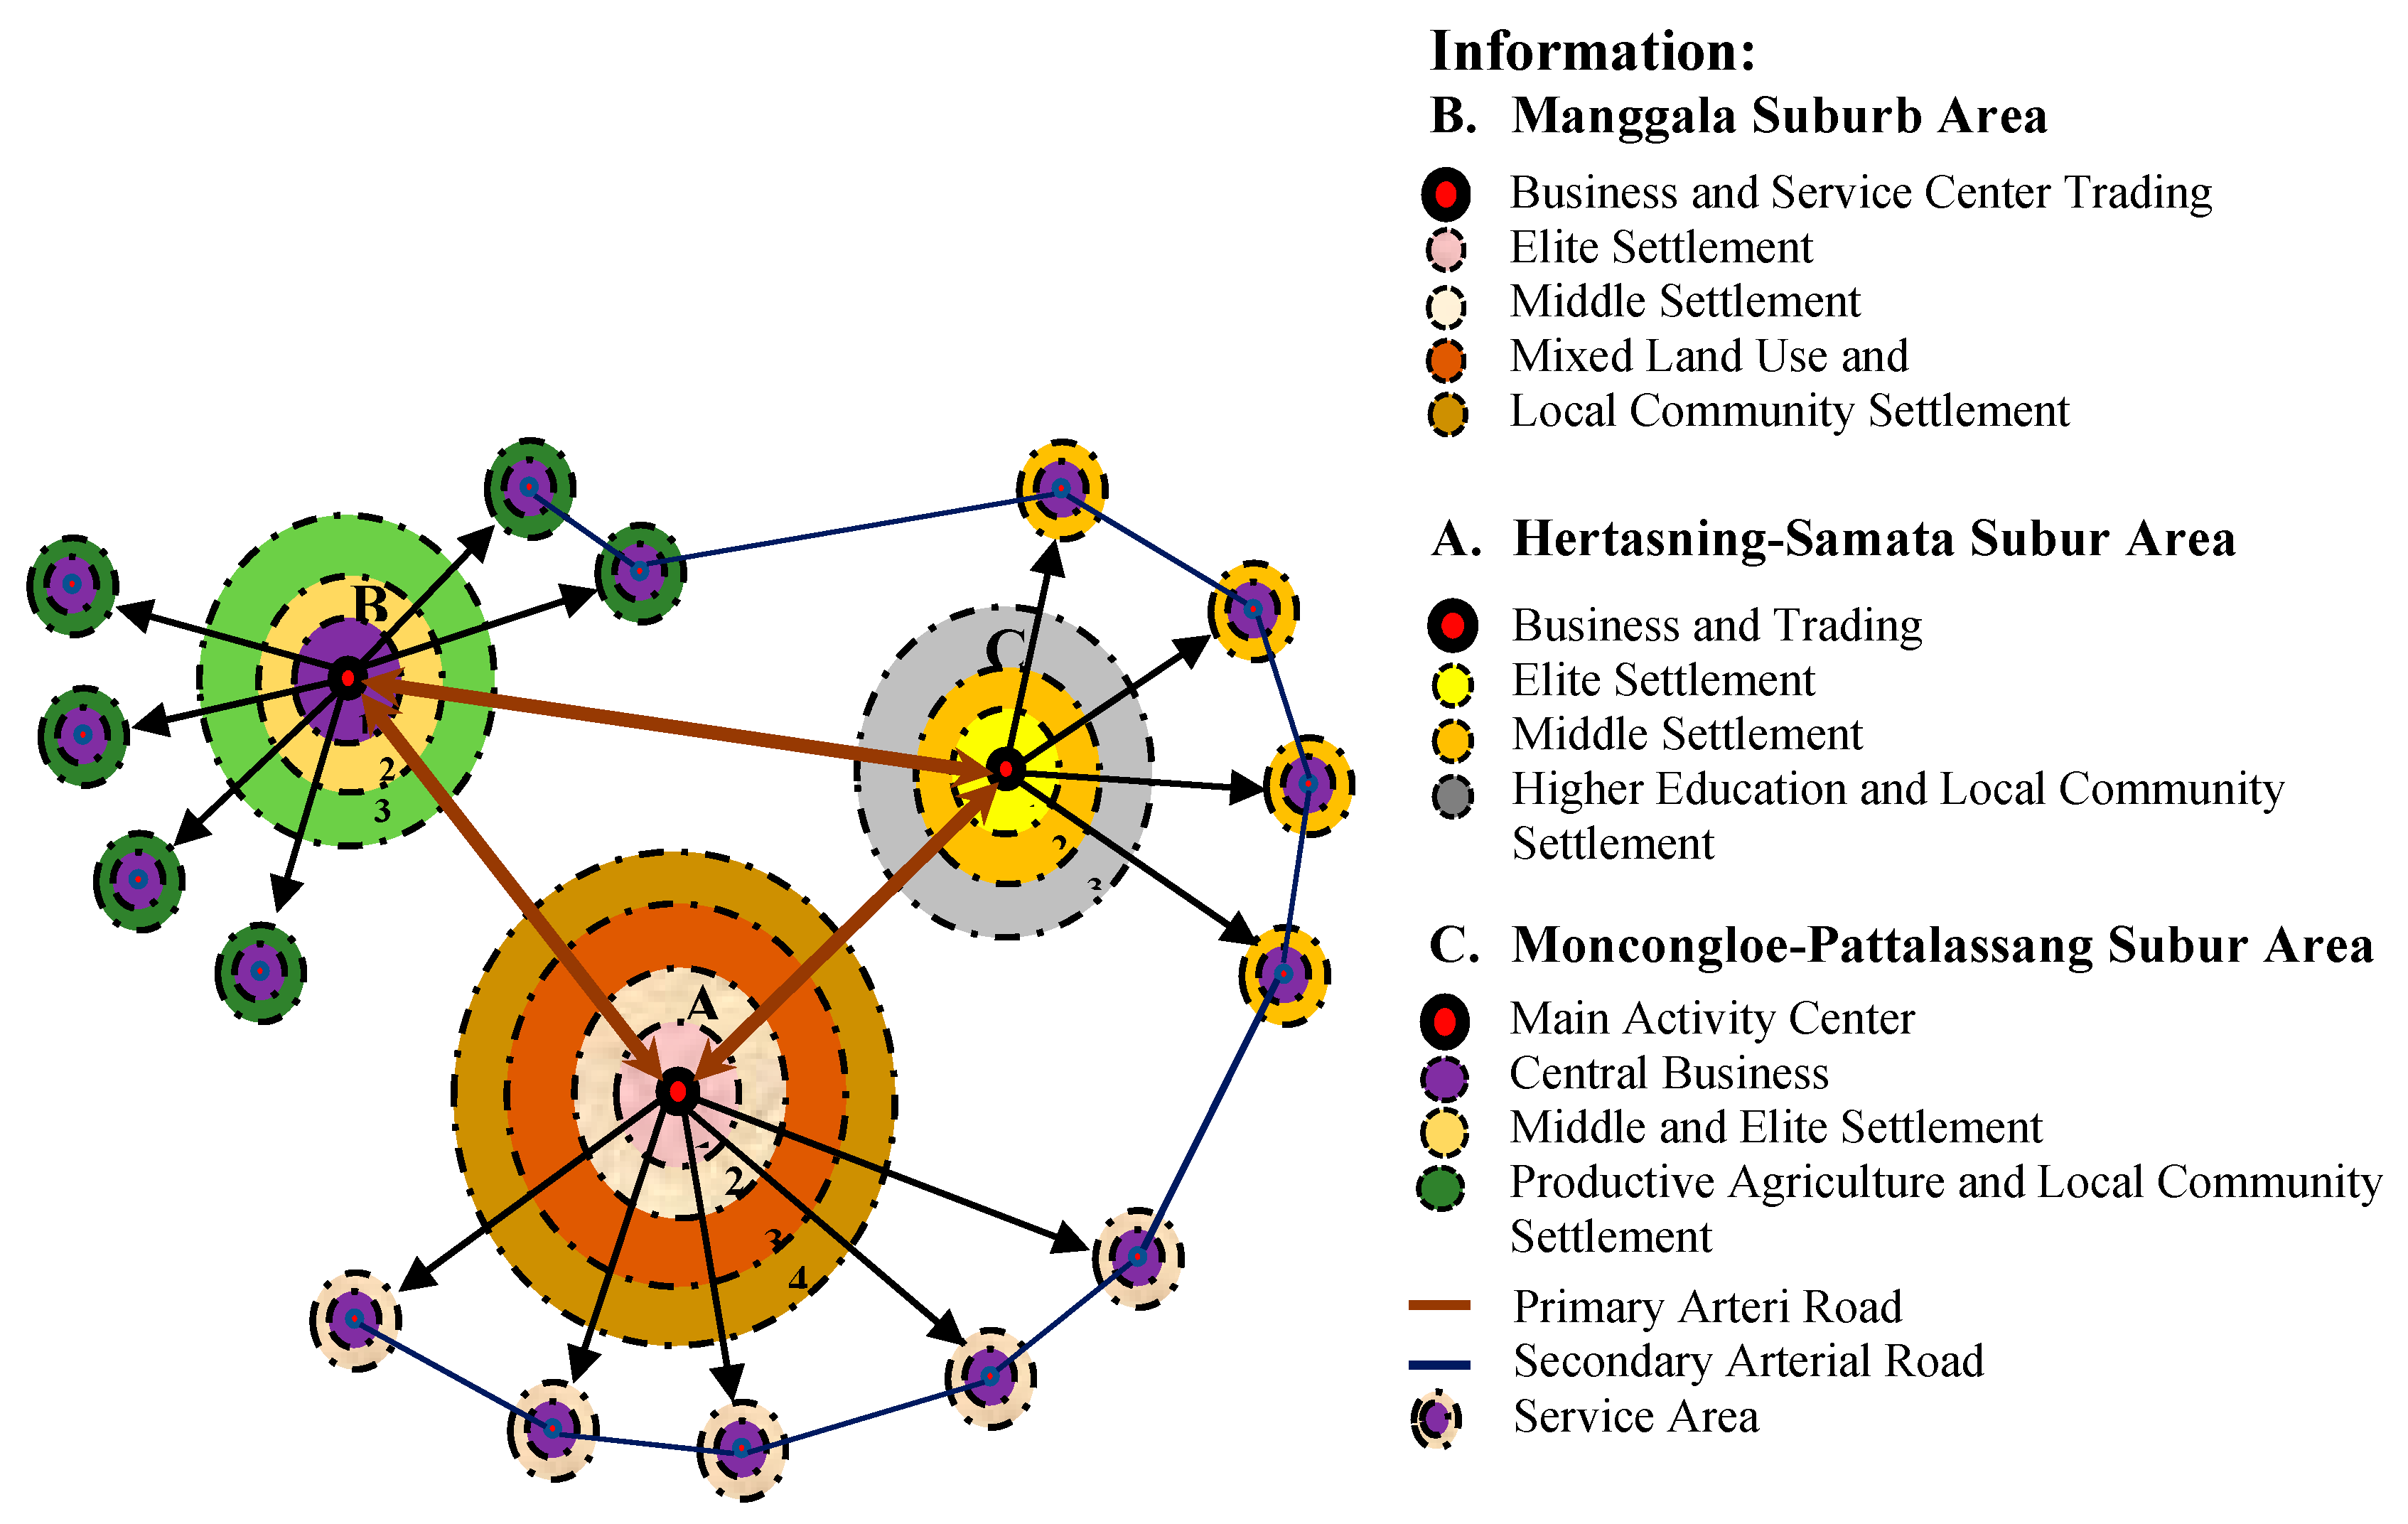
4.3. Spatial Interaction And Spatial Integration

The spatial interaction of the suburban of Mamminasa Metropolitan is influenced by several factors such as (i) dominant socio-economic activities that develop, (ii) patterns of population movement from origin to destination locations based on their intensity, (iii) distances related to physical, economic, and social spatial activity patterns between cities, (iv) allocation of spatial use. Spatial interactions are illustrated in Figure 12.
Spatial interaction in the periphery as an integrated Metropolitan Mamminasata urban system (see Figure 12) is influenced by factors; (i) suburbanization and migration of rural populations, (ii) the flow of information and communication is quite intensive, and (iii) transportation is related to the distribution of the flow of goods and services. Field facts finding show that, four things that cause the intensity of spatial interactions, namely (a) the demand for and transportation of certain commodities from the Gowa Regency and Maros Regency to meet the needs of the population of Makassar City and vice versa, (b) the demand and fulfilment of the population’s needs cause complementary flows and commodity flows to be quite high towards Makassar City, (c) the role transportation services and infrastructure support cause ease in terms of transferability and the more intensive the flow of commodities, and (d) the smaller the intervening opportunity, the smaller the commodity flow. Peri-urban areas refer to a transitional zone interconnecting rural and urban areas due to spatial transformation process [107].
Three factors cause the intensity of spatial interactions in the outskirts of the Mamminasata Metropolitan area, namely: First, complementarity, in this case is a complementary relationship between the periphery, supporting cities, and the core city of Makassar. The suburban urban area of Hertaning-Samata is directly connected with Makassar City and Sungguminasa City, Gowa Regency. The urban suburb of Moncongloe-Pattalassang is directly connected with the City of Maros, Maros Regency and Sungguminasa City, Gowa Regency. The outskirts of Manggala are directly connected with Makassar City, Maros Regency, and Sungguminasa City, Gowa Regency. Field facts found show that differences in city resources and population, cause the direction of interaction of peripheral areas are complementary that is controlled by the demand and supply of goods and services and the trigger factor is the existence of the main urban corridor of Metropolitan Mamminasata.
Second, transferability, in this case the ease of transfer of commodities and the distribution of goods and services flow that enables movement from Makassar City, Maros City Maros Regency, and Sungguminasa City Gowa Regency to the urban suburbs of Manggala, Hertaning-Samata, and Moncongloe-Pattalassang, which is supported by transportation facilities, choice of transportation modes and transport infrastructure. Furthermore, transportation costs also play an important role in the smooth delivery of goods in terms of commodity transfer speeds in the three urban suburbs. This means that the easier the transferability, the greater the flow of commodities to the urban suburb of Mamminasata Metropolitan, and the trigger factor is the connectivity of the transportation network system. Third, the intervening opportunity, in this case the spatial planning policy of the Mamminasata Metropolitan area in terms of spatial zoning arrangements, by establishing the urban suburbs of Hestaning-Samata and Manggala as centers of economic growth, as well as the Moncongloe-Pattalassang urban suburban area as a new urban development area for large-scale settlement development. These three things led to the intensity of spatial interaction towards the integration of the Metropolitan Mamminasata urban system. The average travel pattern of the population in the Metropolitan suburbs of Mamminasata is in the following Figure 13.
Spatial interactions in the Manggala suburb, the Hertasning-Samata suburb, and the Mongcongloe-Pattalassang suburb are reciprocal relationships based on proximity, location factors and urban service systems (see Figure 13). Field facts finding show that socio-economic activity and urban agglomeration that develops have an impact on the intensity of interaction between three urban suburbs. Furthermore, the strength of the interaction is influenced by two main factors, namely (i) the relationship of suburban areas is complementary, (ii) opportunities for intervention and opportunities for socio-economic activities to develop, and (iii) ease of transfer of goods and services in space due to the support of the transportation system. The movements of passengers or freight from an origin to a destination relying on several modes of transportation [108].
The intensity of Metropolitan Mamminasata urban spatial interactions is influenced by three main factors, namely (i) socio-economic conditions, level of education, livelihoods, population mobility, and socio-cultural conditions based on common interests, (ii) relatively similar topographic conditions, (iii) support of transportation facilities and infrastructure that function to connect the location of socio-economic activities are relatively similar but the function is different. The effect of urban facilities differs between different categories and sub-markets, and the effect of irreplaceable facilities is very dependent on accessibility in all sub-markets, while the effect of replaceable facilities depends on the accessibility and scarcity of these facilities [109]. Spatial interactions based on population travelling patterns in the Metropolitan suburbs of Mamminasata are shown in Table 4.
Baseline spatial interaction is basically influenced by the intensity of movement and function of socio-economic activities (see Table 4). Theoretically the power of attraction of the Moncongloe-Pattalasssang suburb to interact with the Manggala suburb is 7.38. This figure confirms that the attractiveness of the function of space to develop is more dominant when compared to the urban suburban area of Hertasning-Samata. Based on the spatial activity pattern that develops, a business index of the three suburban locations, namely (i) the highest dominant business index in the urban suburbs of Manggala to Hertasning-Samata with a value of 9468, (ii) the value of spatial interaction has a tendency toward urban Hertasning-Samata to the urban area of Manggala with a value of 7159, (iii) the highest accessibility value is in the Manggala urban area leading to the Hertasning-Samata urban area with a value of 2.0, and (v) the highest stop point is located in the Hertasning-Samata urban area leading to the Moncongloe-Pattalassang urban area with a value of 9.86.
These results confirm that population mobility, modes of transportation, infrastructure conditions and transportation barriers connecting the Hertasning-Samata urban suburbs to the Moncongloe-Pattalassang urban suburbs are far better compared to other urban areas. Likewise with other requirements, namely in terms of the flow of goods and services. The assertion is that the strength of spatial interaction and economic relations based on functions that develop between two places, is directly proportional to the number of inhabitants and to the distance between them. This means that the more the population of two places, the higher the chance of interaction. Furthermore, the further the distance between the two cities, the smaller the opportunity for interaction. Distance factors, modes of transportation, road infrastructure, and space functions that develop are positively associated with spatial interactions in the outskirts of the Mamminasata Metropolitan area. The spatial relationships between urban land use intensity and urban vitality require immediate attention so as to put forward decision-making support and suggestions for future urban development and planning [110].

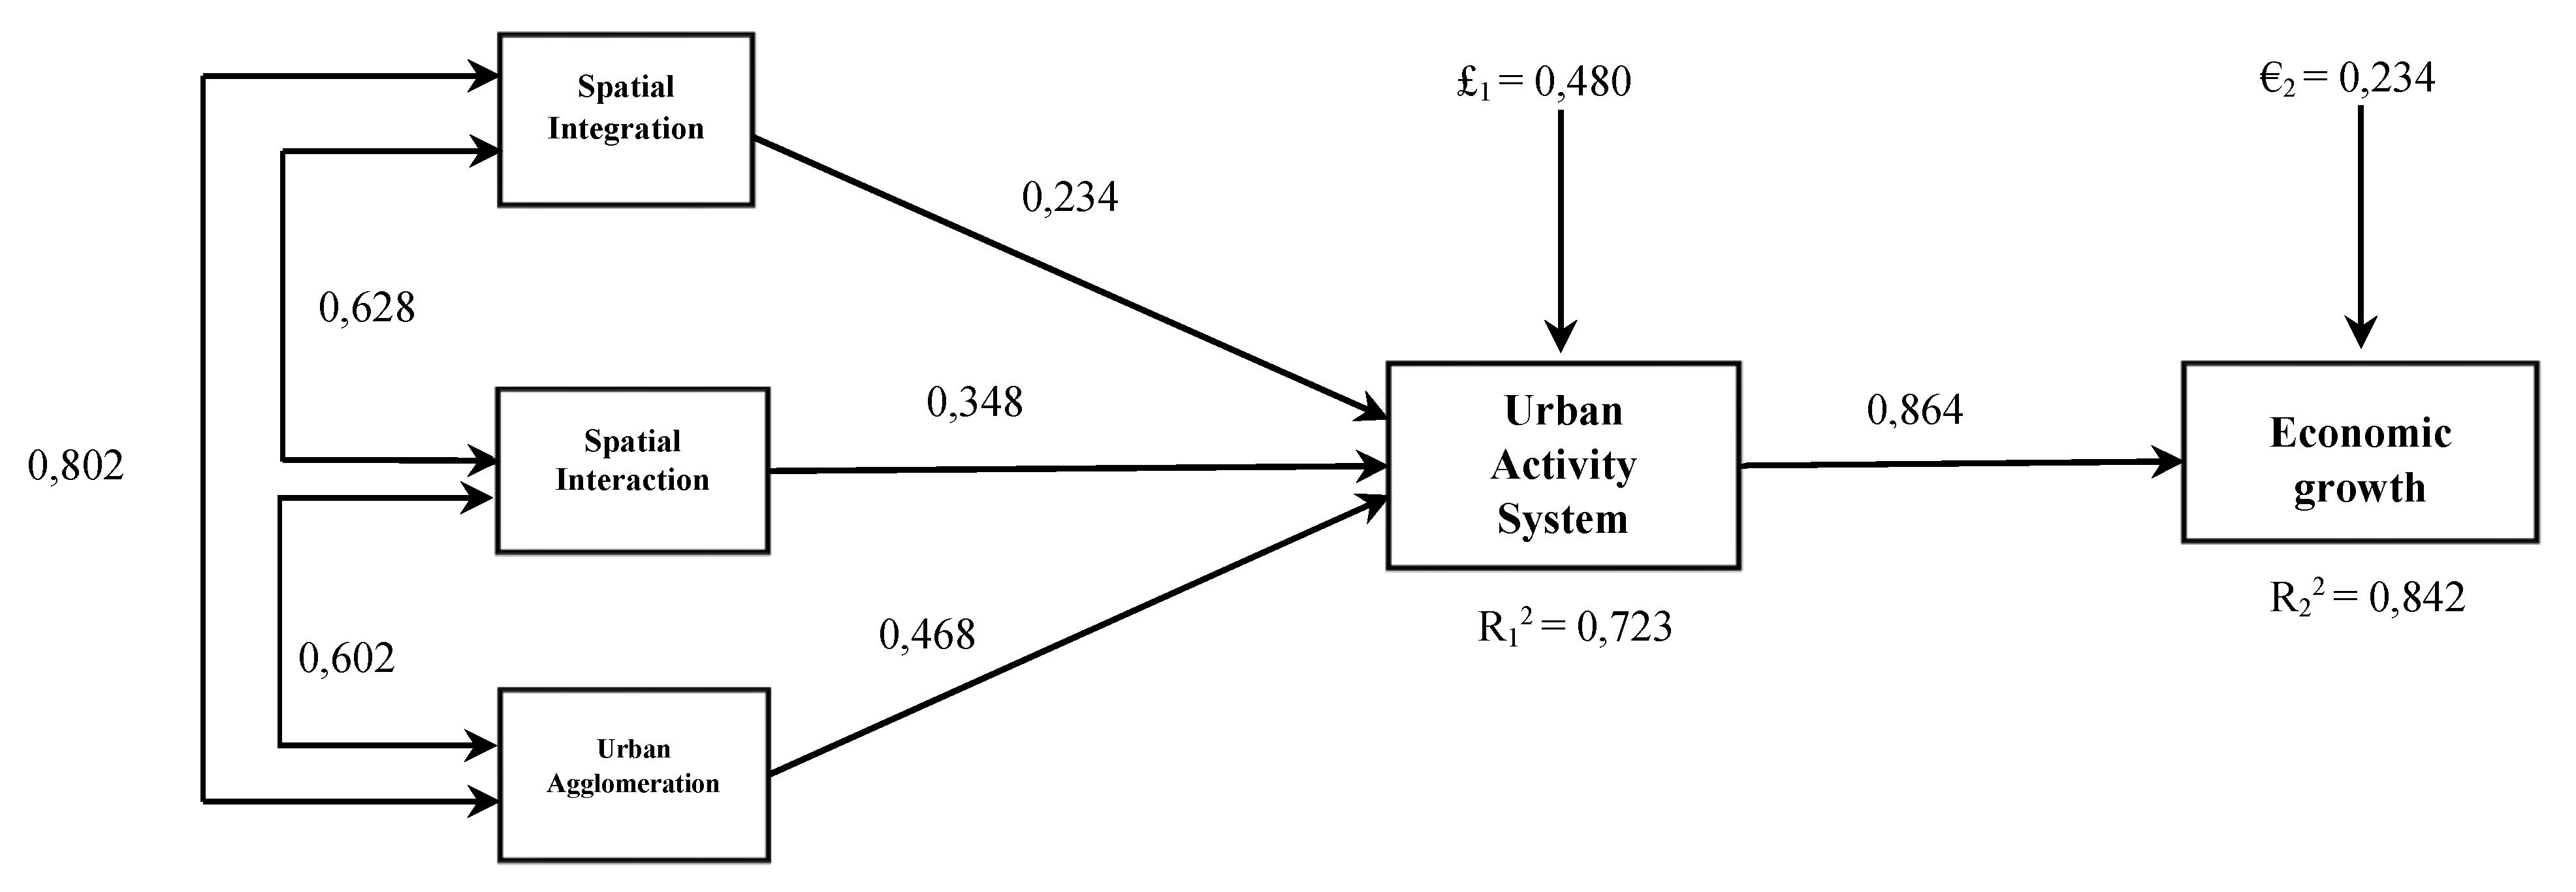
4.4. The Relationship of Spatial Integration, Spatial Interaction and Urban Agglomeration to Economic Growth

Spatial integration, spatial interaction, urban agglomeration and economic growth show the interplaying relationships as a whole of the Metropolitan Mamminasata urban system (see Appendix A, Table A5). The rapid and revolutionary development of suburban areas has led to changes in land use, increased mobility of goods and people. Urban agglomeration that continues to grow and is very intensive have an impact on unification of the urban areas of Makassar City, the urban areas of Gowa Regency and the urban districts of Maros become physical, economic, and social-cultural units within the Mamminasata Metropolitan City area. Urban agglomeration, influenced by several factors, namely (i) trade functions, (ii) service centers, (iii) urban infrastructure, (iv) education centers, (v) government centers, (vi) communication centers, and (vii) organized settlement locations. These seven factors trigger the mobility of freight and human transportation in the suburban Metropolitan Mamminata area.
Interpretation of analysis results (see Figure 14), which can be confirmed are (i) the relationship or correlation between spatial integration and spatial interaction of 0.628, (ii) the relationship or correlation between spatial integration and urban agglomeration of 0.802, (iii) the relationship or correlation between spatial interactions with urban agglomeration of 0.602. The direct effect of spatial integration on urban activity systems is 5.48 percent. The direct effect of spatial interactions on urban activity systems is 14.75 percent. The direct effect of urban agglomeration on the urban activity system is 21.90 percent. The difference in figures shows that urban agglomeration has a dominant influence on the formation of urban activity systems in the outskirts of Metropolitan Mamminasata. Urban agglomeration is the spatial concentration of economic activity in cities [111].
The indirect effect of spatial integration through spatial interactions on urban activity systems is 6.53 percent. The indirect effect of spatial interaction through spatial integration on urban activity systems is 5.11 percent. The indirect effect of spatial integration through urban agglomeration on urban activity systems is 6.6 percent. The indirect effect of urban agglomeration through spatial integration is 8.78 percent. The indirect effect of spatial interactions through urban agglomeration is 9.80 percent. The indirect effect of urban agglomeration through spatial interactions is 1.42 percent. The total effect is 81.3 percent. The residual influence or residue (the effect of other variables on the urban activity system that is not examined is 18.72 percent. These results illustrate that spatial integration towards the intensity of spatial interaction and urban agglomeration becomes a driving force for economic growth toward the complexity of spatial use and its impact on environmental degradation, namely the imbalance between the built and not built spaces in the suburban Metropolitan area of Mamminasata. The implementation of modern spatial planning policies and management practices regulating urban growth alongside broad socio-economic trends has led to radical shifts in the role of public spaces in the lives of many cities [112].
The direct effect of the urban activity system on economic growth was 74.64 percent. The remaining influence (residual effect of other variables on economic growth not examined) by 25.4 percent. These results illustrate that there is a strengthening urban activity system by 81.3 percent and the effect of the urban activity system on economic growth by 18.72 percent. This means that the urban activity system causes the strengthening from 74.64 percent to 81.30 percent (an increase of 6.66 percent. Thus it can be concluded that the urban activity system that is built towards economic growth has a positive effect on the increasing economic productivity on the one hand but on the other hand has an impact on increasing environmental pollution, ecosystem imbalances and disparity in socioeconomic services in the suburbs of the Mamminasata Metropolitan.

5. Discussion

5.1. Impacts of Changes in Land Use and Environmental Quality Decline

Changes in land use in the Metropolitan Maminasata urban periphery area which are very intensive, characterized by urban agglomeration have a direct influence on the formation of the urban activity system. The system of activity, then developed towards the formation of a hierarchy of service centers. The hierarchy of service centers that are built has an impact on urban expansion. This means that going forward to the three urban suburbs will experience the effect of spatial polarization towards the surrounding rural areas. Increased urban activity that continues to be positively associated with a decrease in the environmental quality of the Metropolitan Mamminasata urban suburbs.
The parameter of environmental quality degradation is assessed based on several things that have developed, namely (i) land reclamation, due to an increase in the construction of large-scale settlements specifically developing in the suburban area of Moncongloe-Pattalassang. If this is not regulated in the zoning of spatial use, then the potential for urban flooding, (ii) improving the system of transportation transportation service movements due to population mobility for economic and social interests. This means, that if this is not regulated in a traffic management system it will have an impact on the high level of air pollution going forward, including increased settlement activities, trade and social facilities that contribute positively to increasing the volume of waste generation in the future, (iii) land use will always change, in the sense that the dynamics of the three urban suburbs of the Mamminasata Metropolitan will have an impact on the population density which is quite high and positively associated with the capacity of the space capacity and the carrying capacity of the environment. This means that it is very important to consider the distribution of clean water services and the predicted energy demand will increase in line with increasing urban activity and increasing population in the future.

5.2. Urban Activities System As Determinants of Economic Growth

The pattern of spatial activities that continues to increase both those that develop linearly along the main road corridors of the periphery, and those that develop concentrically will have an impact on the expansion of the urban suburbs of Metropolitan Mamminasata. This condition is predicted to expand and develop in the future direction of megacities. This fact is supported by several things, namely (i) the construction of a 15 km Metropolitan Metropolitan Mamminasata bypass, which connects the Moncongloe-Pattalassang urban suburb to the Hasanuddin International Airport in Maros Regency, (ii) the development of a government center located in the Pattalassang suburb that is integrated with the development of an activity center the economy developed in the Hertasning-Samata suburb, and (iii) the development of a tourism activity center in the Manggala urban suburbs that is integrated with the business center and connected to the main urban road network system. These three things will be the determinants of economic growth in the Metropolitan suburbs of Mamminasata in the future.
Economic growth due to the existence of the function of strategic economic activities is associated with an increase in population mobility on two sides, namely (i) population mobility from the periphery towards the core city for work, business and social interests, (ii) circular migration, has a tendency to increase due to the conversion of productive agricultural land towards a shift in population activities towards urban industrial activities. These two positions will have an impact on increasing traffic volume along the main road corridor and positively associating with traffic congestion. Field confirmation, shows that along the main road corridor has a tendency towards urban sprawl. This means that the main Mamminasata Metropolitan urban road corridor has controlled the surrounding land use in the direction of changing the spatial use of rural areas around the Hertaning-Samata urban and Moncongloe-Pattalassang urban areas. This condition is assessed based on three main things, namely (i) increasing population growth, (ii) urbanization and suburbanization towards the periphery, (ii) people’s preference to choose residential facilities in the periphery due to cheaper land prices, affordable and healthy air conditions. This means that people who work in Makassar City, Sungguminasa City and Maros City, will choose to live in the urban suburbs of Metropolitan Mamminasata and the tendency is to use private vehicles to go to urban locations. Furthermore, the ongoing urban sprawl is positively associated with the inadequate condition of transportation facilities and infrastructure. In the next journey, it has an impact on the social gap between the lower middle class and upper middle class. Thus, it is very important to implement spatial zoning in the direction of sustainable development of the Metropolitan Mamminasata urban suburbs going forward.

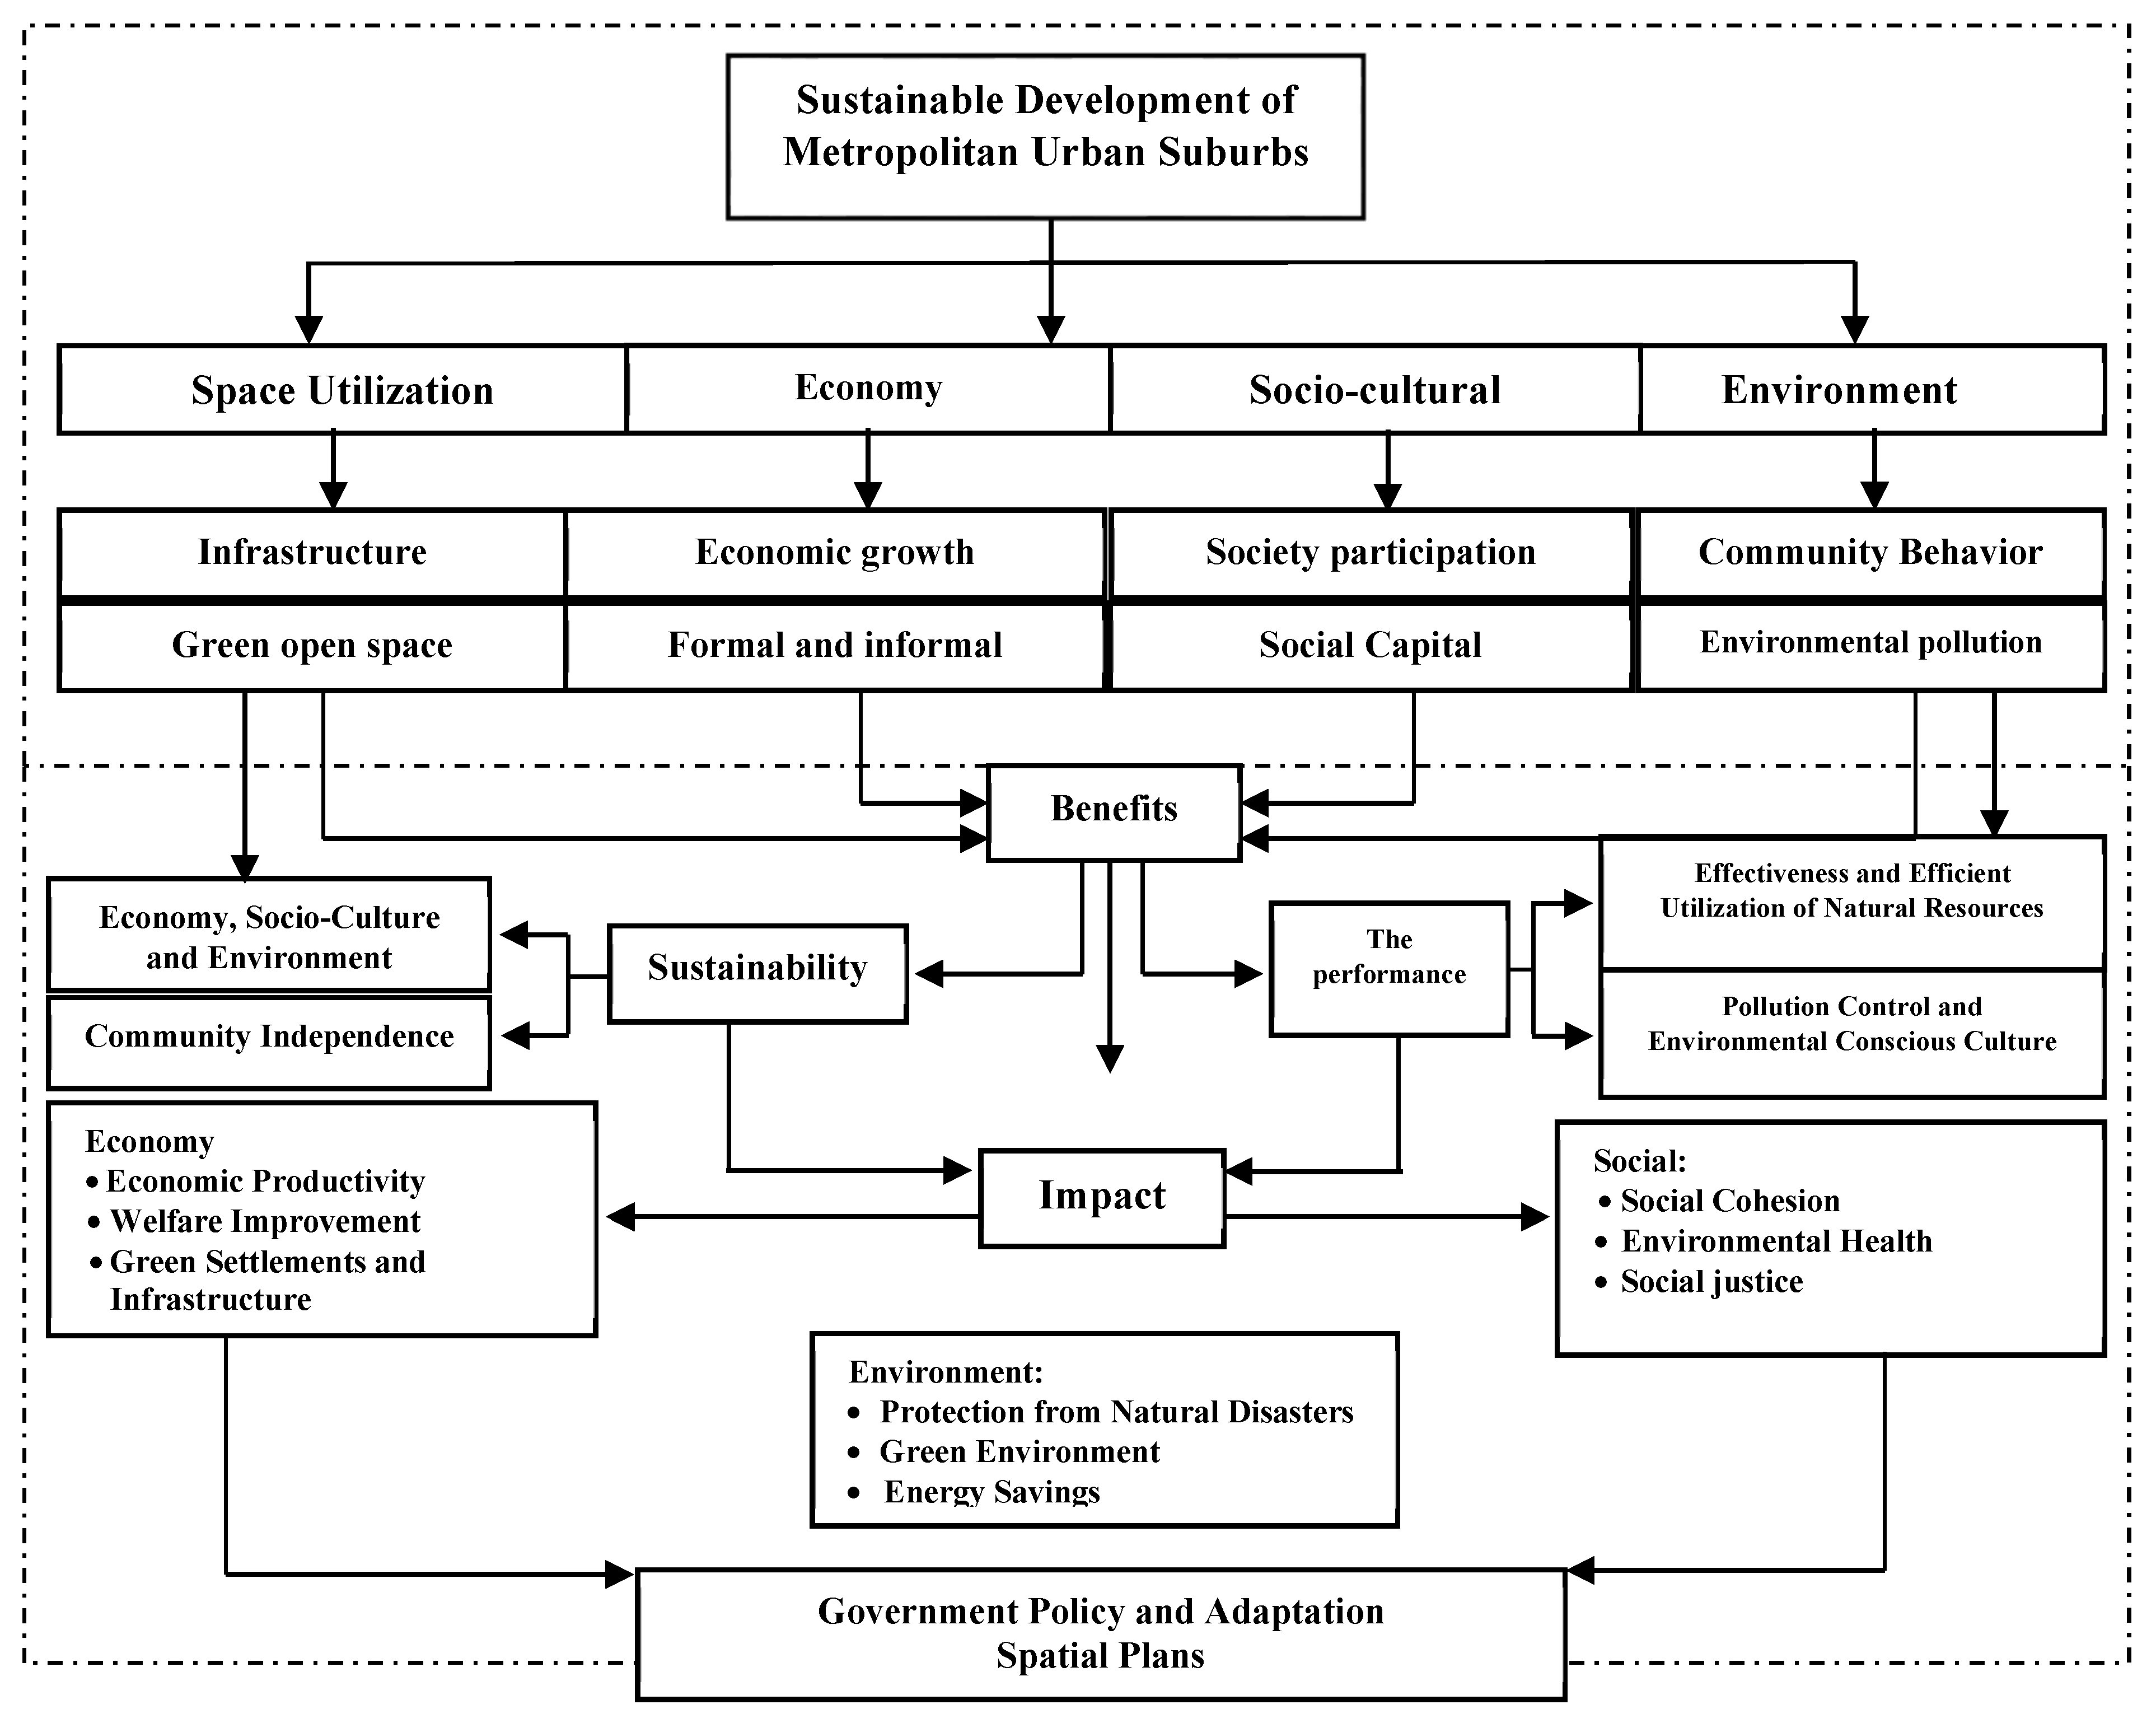
5.3. Sustainable Development of the Mamminasata Metropolitan Suburban

Sustainable development is a development process that is oriented towards meeting the current needs without compromising the needs of future generations. The formulation of the concept of sustainable development in the suburban area of Mamminasata Metropolitan considers several interrelated aspects of one another as a unified system, namely Environmental aspects. The development process of the suburban of the Mamminasata Metropolitan area in terms of the environment that needs to be considered includes; (a) controlling environmental pollution, (b) limiting excessive conversion of productive agricultural land, (c) securing river boundaries, and (d) preparing green open space (RTH) to maintain a balance between the use of built and non-built land and controlling potential the threat of natural disasters. The importance of conservation for maintaining biodiversity, or ecological functions and saving environmental ecosystems [108]. The growing involvement of cities in the fight against climate change is probably one of the most significant features of today’s environmental governance [113].
Economic aspects, which need to be considered in the future include; (i) equitable and wise access to economic resources for the community, (ii) developing productive economic efforts based on the local economy, (iii) reducing inequality by limiting land tenure dominance and economic productivity assets. These three things will require policy support from the government in terms of decision making oriented to the principle of conservation of natural resources. Conservation programs have a positive impact on environmental values and the involvement of government roles [114]. Conservation of renewable natural resources and promotion of economic growth are both sustainable development goals [115]. Urban agglomeration and ever-increasing changes in spatial use causes ecological environmental vulnerability and threaten social and economic development [116].
Social aspects, which need to be considered in the future includes (i) creating social cohesion, (ii) overcoming social conflict, (iii) encouraging active community participation, and (iv) establishing an environmental awareness culture. Community resilience has garnered attention from both practitioners and academia in recent years due to the intensifying consequences associated with natural hazards and their negative impacts on sustainable urban development [117]. Urbanization and migration that tend to increase in line with increasing economic productivity in the outskirts of the Mamminasata Metropolitan area have a direct impact on environmental degradation, evapotranspiration and groundwater replenishment. Urbanization induces an increase in run off volume and a decrease in evapotranspiration and groundwater replenishment [118].
Aspects of government policy are oriented to spatial use and control of spatial use. This aspect in its implementation requires strategic steps, namely (a) tightening the space use licensing in locations that must be protected, (b) reducing excessive use of water and energy resources, and (c) optimizing the wise use of natural resources. Despite all existing agreements and regulations related to cultural heritage, there is a significant gap between regulations and what is implemented in the real world [119]. Metropolitan urban development policy in the future will require the role and participation of the community in anticipating changes in land use towards sustainable development. Creators of the new strategic vision imagine large-scale citizen involvement, bottom-up community and private initiatives through empowerment and ownership, from the design phase to the implementation [120].
The Metropolitan suburb of Mamminasata towards sustainable development is an integral, dynamic and complex part of the natural physical environment, the artificial environment, and human and social systems. The meaning of sustainable development in the Mamminasata Metropolitan suburban is viewed on the concept of equitable, healthy and productive development balance, which is supported by conducive environmental conditions. On a global scale, most resources are currently consumed in cities, contributing to the economic importance of urban freight transport as well as its poor environmental performance [121]. Thus the concept of implementing a city plan is needed so that, it is capable of accommodating all the interests of the community in terms of disaster resilience, welfare improvement and the creation of social cohesion. Happiness, generativity and social preferences are pivotal factors for the betterment and sustainability of societies [122]. Urban system concept towards development sustainable Mamminasata Metropolitan suburban in the following Figure 15.
Strategic steps that need to be realized in sustainable development in the Metropolitan urban areas going forward (see Figure 14), i.e., (i) physical handling of the environment (ii) development of economic potential and (iii) creation of social cohesion. These three basic principles will require the support of development policies from the government. Managing community-based and historically sensitive urban landscapes is a very important social and professional task [123]. Globally, the balance of ecosystem services in urban agglomerations is increasingly influenced by coupled human and natural systems [124]. The dynamics of the development of the metropolitan periphery in the future is very important to maintain the balance of ecosystems as manipulation of human embodiments and the natural environment as a medium for the implementation of socio-economic development, spatial integration and sustainable urban agglomeration. Cities are highly integrated within an urban agglomeration, which renders the agglomeration one of the most important carriers for global economic development [125].
Metropolitan urban sustainable development orientation is realized through; (i) economic equality through the principle of justice towards increasing the productivity of community economic efforts, (ii) social justice through creating social cohesion by utilizing social capital owned by community groups as an integrated urban system, and (iii) managing the urban environment through controlling environmental pollution and develop an environmentally conscious culture. Diverse land uses are needed to provide a good balance between the provision and non-provision of ecosystem services [126].
Sustainability of the development of metropolitan suburban areas is oriented to a number of environmental, economic and social rescue measures, namely (i) to create a balance of green ecosystem-based development through the preparation of green open space and maintaining the existence of water catchment areas and securing river benefit areas, (ii) to maintain stable economic growth by restructuring productivity systems to save resources and energy, (iii) to ensure social justice in the distribution of wealth and social services, and (iv) to protect the living environment so that it is comfortable, safe and zero emission. Urban regions are important places of ecosystem service demands and, at the same time, are the primary sources of global environmental impacts [127]. With the development of ecological science, the demand to integrate ecosystem services into ecological management is increasing. Stakeholders are interested in comparing stocks and abilities to supply ecosystem services in different regions [128]. The success of sustainable development is not only placed in the economic sector but requires the support of power, in this case the government, for the purpose of equity and prosperity. The provision of ecosystem services from multifunctional landscapes has contributed to human well-being [129].

6. Conclusions

Land use changes due to urban expansion of the core city towards core-periphery spatial interactions. The triggering factors for Metropolitan Mamminasata urban spatial interactions are the Hertasning-Samata road corridor, which connects Makassar City with Gowa Regency and Maros Regency, Tamangapa Raya Street corridor that connects Makassar Manggala urban area towards urban Gowa Regency and Maros Regency road, and Yasin Limpo Road from directions Makassar City towards Gowa Regency and Maros Regency. The three road corridors lead to spatial integration between cities and urban areas of Metropolitan Mamminasata urban areas towards physical, economic, social, and spatial interaction as well as the distribution of goods and services. Spatial integration that runs parallel to spatial interaction and urban agglomeration has an impact on the formation of urban activity systems and the hierarchy of Metropolitan Mamminasata urban service centers.
The strength of spatial interaction and socio-economic relations between the core city and the periphery based on the developing spatial function, is directly proportional to the number of inhabitants based on the distance factor and the location of the activities between the core city and the periphery. The more the number of population, the higher the chance of interaction between urban areas, the farther the distance between two cities, the smaller the opportunity for interaction. Distance factors, modes of transportation, road infrastructure, and spatial functions that develop are positively associated with spatial interactions in the urban suburbs of Metropolitan Mamminasata.
Economic growth is positively associated with increasing economic productivity on the one hand but on the other hand it has an impact on increasing environmental pollution, ecosystem imbalances and disparity in socioeconomic services in the suburban urban areas of Mamminasata Metropolitan. Spatial integration towards the intensity of spatial intereaction and urban agglomeration is a driving force for economic growth towards the complexity of spatial use and its impact on environmental quality degradation, namely the imbalance between the built and unbuilt spaces in the urban suburbs of Metropolitan Mamminasata.
The future implementation of Metropolitan Maminasata’s urban sustainable development will be oriented towards handling actions, namely (1) Environmental aspects including actions; (a) controlling environmental pollution, (b) limiting excessive conversion of productive agricultural land, (c) securing river banks, and (d) preparing green open space. (2) Economic aspects, including action; (i) access to economic resources for the community fairly and wisely, (ii) developing productive economic enterprises based on local economies, (iii) reducing inequality by limiting the dominance of land tenure and assets of urban economic productivity. (3) Social aspects, including actions; (i) creating social cohesion, (ii) overcoming social conflict, (iii) encouraging active community participation, and (iv) building an environmentally conscious culture. (4) Aspects of government policy include policies, namely (a) tightening space use licensing in locations that must be protected, (b) reducing excessive use of water and energy resources, and (c) optimizing the wise use of land and natural resources. These four actions are in line with the national Metropolitan City development program in Indonesia and fulfillment of the SDGS 2030 target.
The results of this study contribute to the development of regional economics, built environment science, geography, and regional and city planning. This study explicitly has implications for government policy making to reduce urban service disparities on the spatial scale and imbalance of the Metropolitan Mamminasata urban ecosystem. The development disparity index can be improved going forward by considering several indicators from various dimensions, including development of government and community capacity, optimization of urban economic resources, global climate change and community social capital based on data availability, spatial scale and time periods.

Author Contributions

B.S., D.N.A.A. and H.S. compiled the research; B.S. and H.H.S. designed the methodology; D.N.A.A. data processing; H.H.S. and D.N.A.A. contributed materials/methods/analysis tools; B.S. analyzes data; D.N.A. contributes to the examination of data; B.S., D.N.A.A. and H.H.S. wrote and revised the draft. All authors have read and agreed to the published version of the manuscript.

Funding

We are grateful for the participation of stakeholders in contributing thoughts in the implementation of this study. Thank you to the Ministry of Research and Technology of the Republic of Indonesia for their support and financial assistance in carrying out this research.

Conflicts of Interest

The authors declare no conflict of interest.

Appendix A

Table A1. Economic Growth of the Mamminasata Metropolitan Area.
NumberEconomic SectorsMamminasata Metropolitan Urban AreaSouth Sulawesi
MakassarGowa RegencyMaros Regency
2014/20152018–20192014/20152018–20192014/20152017–20182014/20152018–2019
1Agriculture, forestry, and fishery663,715.90808,428.973,233,565.033,708,332.481,749,999.442,202,311.9254,099.1064,874.40
2Mining and excavation1591.971102.08295,061.68427,992.83736,330.961,142,053,7715,802.9516,778.09
3Processing Industry23,283,376.5329,380,566,39663,809.74811,124.762,337,241.312,733,882.1535,547.2140,788.01
4Procurement of electricity and gas32,518.9750,468,5618,914.9524,324.259661.1310,649,54230.44292.44
5Procurement of Water, garbage processing, waste and recycle252,232,59307,684.7514,076.391765.9110,807.3012,171.65302.86366.97
6Construction19,585,347.6528,760,382.821,093,063,531,390,947.66573,016.72735,098.2029,967.2837.8872.19
7Wholesale and retail trade, car and motorcycle repair20,909,471.4731,753,861.051,197,766.191,585,644.38354,445.70419,031,5934,915.4147,132,15
8Transportation and warehousing2,998,784.724,110,019.78151,312.01181,622.813,161,029.824,175,994.619142.461,177,768
9Provision of accommodation and food drinks2,671,179.863,698,770,59247,751.01329,238.0034,748.7041,548.673370.064612.02
10Information and communication10,142,002.4914,801,742.911,064,298.491,423,443.84143,700,52168,702.0615,712.6021,028.66
11Financial service and insurance6,831,498.949,706,799,51240,243.90289,657.77147,007.27169,505.458662.5410,754.89
12Real Estate4,944,278.205,957,040.88776,597.24963,116.85150,430.95178,653.949197.4210,695.90
13Corporate Service1,359,868.051,897,195,1312,181,93215,463.142621.643060.331,059,531363.67
14Government administration, defense and compulsive social security4,226,349.095,494,161,12570,415,52632,192.43373,169.04453,024.0011,362.1313,114,34
15Education service10,446,235.4014,484,266.38468,941.01594,121.44174,907,32193,918.3513,378.0017,217.12
16Health service and social activity3,092,320.384,483,768.91191,462.43237,653.1369,991.7384,108.674845.176208.38
17Other service2,991,353.504,470,399.45141,524.70190,537.1037,714.2044,603,513207.834366.71
Total114,432,125,9160,207,659.2810,380,218.6812,822,878.7810,066,823.7412,768,318,40250,802.99309,243.63
Source: author elaboration, input: reference [90].
Table A2. Absolute Value of Economic Growth in Makassar City.
NumberEconomic SectorsThe Absolute Value of Economic Growth in Makassar City
WhenKPPKPKPEK
1Agriculture, forestry, and fishery1,057,065.14−924,868.15(116,439.18)144,713.07
2Mining and excavation2535.45−2437.21(1335.13)(489.89)
3Processing Industry37,082,199.82−33,649,482.60(4,268,916.21)6,097,189.86
4Procurement of electricity and gas51,791.24−43,041.997426.5717,949.59
5Procurement of Water, garbage processing, waste and recycle401,717.48−348,324.39(40,639.64)55,452.16
6Construction31,192,545.21196,836,957.61225,597,340.439,175,035.17
7Wholesale and retail trade, car and motorcycle repair33,301,407.04−25,985,279.965,768,581.0910,844,389.58
8Transportation and warehousing4,776,005.49−3,911,636.66239,383.121,152,235.06
9Provision of accommodation and food drinks4,254,246.59−3,269,843.19428,927.401,027,590.73
10Information and communication16,152,629.86−12,721,275.802,080,467.114,659,740.42
11Financial service and insurance10,880,166.30−9,230,085.98476,713.532,875,300.57
12Real Estate7,874,489.85−7,068,948.51(1,111,907.63)1,012,762.68
13Corporate Service2,165,789.77−1,775,437.19121,757.94537,327.08
14Government administration, defense and compulsive social security6,731,082.21−6,079,316.11(585,154.99)1,267,812.03
15Education service16,637,165.49−13,639,381.72844,884.664,038,030.98
16Health service and social activity4,924,974.78−4,054,936.77428,832.141,391,448.53
17Other service 4,764,170.18−3,683,495.79786,903.661,479,045.95
Source: author elaboration, input: reference [90].
Table A3. Absolute Value of Economic Growth in Gowa Regency.
NumberEconomic Sector rsThe Absolute Value of Economic Growth in Gowa Regency
WhenKPPKPKPEK
1Agriculture, forestry, and fishery5,149,927.65−4,505,875.65(797,543.17)474,767.45
2Mining and excavation469,929.10−451,721.96(23,729.13)132,931.15
3Processing Industry1,057,214.59−959,347.72(148,222.96)147,315.02
4Procurement of electricity and gas30,124.84−25,035.76(711.51)5409.30
5Procurement of Water, garbage processing, waste and recycle22,418.72−19,439.00(2173.09)3189.52
6Construction1,740,864.3510,985,523.6512,376,471.31297,884.13
7Wholesale and retail trade, car and motorcycle repair1,907,618.73−1,488,525.9097,118.48387,878.19
8Transportation and warehousing240,986.62−197,372.49(15,749.68)30,310.80
9Provision of accommodation and food drinks394,579.90−303,276.8325,961.1781,486.99
10Information and communication1,695,051.80−1,334,966.6088,477.24359,145.35
11Financial service and insurance382,623.73−324,595.21(34,937.44)49,413.87
12Real Estate1,236,845.27−1,110,318.98(147,202.13)186,519.61
13Corporate Service19,401.52−15,904.67(441.53)3281.21
14Government administration, defense and compulsive social security908,470.57−820,503.98(188,311.55)61,776.91
15Education service746,857.49−612,284.25(18,162.81)125,180.43
16Health service and social activity304,932.07−251,063.26(13,410.13)46,190.70
17Other service225,398.89−174,270.8216,266.2849,012.40
Source: author elaboration, input: reference [90].
Table A4. Absolute Value of Economic Growth in Maros Regency.
NumberEconomic SectorsThe Absolute Value of Economic Growth in Maros Regency
WhenKPPKPKPEK
1Agriculture, forestry, and fishery2,787,131.36−2,438,571.61(236,259.69)452,312.48
2Mining and excavation1,172,715.30−390,948.15751,105.62405,722.81
3Processing Industry3,722,400.362,681,825.725,415,707.87396,640.84
4Procurement of electricity and gas15,386.7712,260.4622,910.00988.41
5Procurement of Water, garbage processing, waste and recycle17,212.2113,095.0125,266.661364.35
6Construction912,613.367,244,571.407,979,669.60162,081.48
7Wholesale and retail trade, car and motorcycle repair564,506.88478,464.61897,496.2064,585.89
8Transportation and warehousing5,034,404.664,072,164.138,248,158.741,014,964.79
9Provision of accommodation and food drinks55,342.4147,554.5589,103.226799.97
10Information and communication228,864.20192,318.86361,020.9225,001.54
11Financial service and insurance234,130.69182,515.41352,020.8622,498.18
12Real Estate239,583.40174,939.75353,593.6928,222.99
13Corporate Service4175.353374.196434.52438.69
14Government administration, defense and compulsive social security594,326.55430,717.27883,741.2779,854.96
15Education service278,565.62225,100.94419,019.2919,011.03
16Health service and social activity111,472.1289,684.21173,792.8814,116.94
17Other service60,065.4151,339.0695,942.576889.31
Source: author elaboration, infut: reference [90].
Table A5. Comparative Development of Mamminasata Metropolitan Urban Suburbs.
NoAspects/Urban ConditionsManggala SuburbanHertasning-Samata SuburbanMoncongloe-Pattalassang Suburban
CharacteristicsIndicator
1Physical BaseDomination of space utilization (Ha)Commercial centers, large-scale settlements and recreational facilitiesTrade Centers and Large Scale SettlementsLarge Scale Settlements
Typology of areaFlatFlatFlat
Conversion of farmland (Ha)High Enough (182.06 Ha)High Enough (351.25 Ha)High Enough (610, 92 Ha)
Land Use Change (Ha)High Enough (476.92 Ha)High Enough (297.5 Ha)High Enough (455.57 Ha)
Characteristics of early urban areasPlantation and Forest AreaWetland AgriculturePlantation and Wetland Agriculture
Spatial Structure and Administrative StatusRegional Service Center (Makassar City Part)Regional Service Center (Makassar City Part and Gowa Regency)Area Service Center (The area of Maros and Gowa Regency)
Developmental barriersThe existence of Balang Tonjong Lake (water resources potential)Watershed Area (Je’ne Berang River Stream)Watershed Area (Tallo River Stream) and Productive Agriculture
2InfrastructureMain Road Length (Km)6 Km9 Km8 Km
Drainage and Flood Control (% of Flood Potential Location)45%25%35%
Clean Water Service (% of Service)70%80%40%
Carry-on waste production (%)60%70%35%
Waste management (%)30%45%25%
Availability of Green Open Space (%)6%10%20%
3EconomicEconomic Growth Percentage51.83%39.65%39.48%
Dominant Economic ActivityShopping, trade, recreation facilities and the business centerShopping malls, Trade and Services, Higher EducationTrade and Services
Economic SystemDualistic (Formal and Informal)Dualistic (Formal and Informal)Dualistic (Formal and Informal)
Average Percentage of Income Per Capita1:5615.60%15.66%
4Social CulturePopulation Total (Soul)138,659105,83918,784
Population Density (Soul/Ha)1621904
% Social Conflict (Land Conflict)4865%70%
Population MobilityHigh EnoughHigh EnoughMedia
Social StructureDifference in stratification, Status and Social class based on wealth and ownership of residential facilitiesDifference in stratification, Status and Social class based on wealth and ownership of residential facilitiesDifference in stratification, Status and Social class based on wealth and ownership of residential facilities
Human Behavior to the EnvironmentRelatively low community awarenessRelatively low community awarenessRelatively low community awareness
Cultural PatternTraditional farming community towards urban industrialTraditional farming community towards urban industrialTraditional farming community towards urban industrial
5Government ResponseAir quality
Water quality
Soil Pollution
The monitoring instrument is available, but has not been optimally usedThe monitoring instrument is available, but has not been optimally usedThe monitoring instrument is available, but has not been optimally used
Clean Water SupplyThere are efforts to increase capacity and service distributionThere are efforts to increase capacity and service distributionThere are efforts to increase capacity and service distribution
Waste ManagementThere is a management effort but constraints are set up for the landfillThere is a management effort but constraints are set up for the landfillThere is a management effort but constraints are set up for the landfill
Green Open SpaceThere is an effort to add green open space but constrained land acquisitionThere is an effort to add green open space but constrained land acquisitionThere is an effort to add green open space but constrained land acquisition
Housing and SettlementsIntegration of infrastructure and facility has not been optimizedIntegration of infrastructure and facility has not been optimizedIntegration of infrastructure and facility has not been optimized
Control of Space UtilizationImplementation of spatial plan not optimizedImplementation of spatial plan not optimizedImplementation of spatial plan not optimized
Socialization of Planning ResultsAdaptations of spatial plan concepts not yet optimizedAdaptations of spatial plan concepts not yet optimizedAdaptations of spatial plan concepts not yet optimized
Source: author elaboration.

References

  1. Goldstein, A.; Goldstein, S.; Guo, S. Temporary migrants in Shanghai households, 1984. Demography 1991, 28, 275–292. [Google Scholar] [CrossRef] [PubMed]
  2. Mohabir, N.; Jiang, Y.; Ma, R. Chinese floating migrants: Rural-urban migrant laborers; intentions to stay or return. Habitat Int. 2017, 60, 101–110. [Google Scholar] [CrossRef]
  3. Penco, L.; Ivaldi, E.; Bruzzi, C.; Musso, E. Knowledge-based urban environments and entrepreneurship: Inside EU cities. Cities 2020, 96, 102443. [Google Scholar] [CrossRef]
  4. Firman, T. New Town Development in Jakarta Metropolitan Region: A Perspective of Spatial Segregation. Habitat Int. 2004, 28, 349–368. [Google Scholar] [CrossRef]
  5. Xing, L.; Liu, Y.; Wang, B.; Wang, Y.; Liu, H. An environmental justice study on spatial access to parks for youth by using an improved 2SFCA method in Wuhan, China. Cities 2020, 96, 102405. [Google Scholar] [CrossRef]
  6. Cervero, R.; Murakami, J. Rail and Property Development in Hong Kong: Experiences and Extensions. Urban Stud. 2009, 46, 19–43. [Google Scholar] [CrossRef]
  7. Kwon, Y. Sejong Si (City): Are TOD and TND Models Effective in Planning Korea’s New Capital? Cities 2015, 42, 242–257. [Google Scholar] [CrossRef]
  8. World Development Report. Sustainable Development in a Dynamic World-Transforming Institutions, Growth, and Quality of Life. 2003. Available online: https://openknowledge.worldbank.org/handle/10986/5985 (accessed on 22 February 2020).
  9. Hall, P.; Pfeiffer, U. Urban Future 21: A Global Agenda for Twenty-First Century Cities; Routledge: Abingdon, UK, 2000. [Google Scholar]
  10. Wang, Y.; Deng, Y.; Ren, F.; Zhu, R.; Wang, P.; Du, T.; Du, Q. Analysing the spatial configuration of urban bus networks based on the geospatial network analysis method. Cities 2020, 96, 102406. [Google Scholar] [CrossRef]
  11. Pearce, W.D.; Tunner, K.R. Economics of Natural Resources and the Environment; Harvester Wheatsheaf: London, UK, 1990. [Google Scholar]
  12. Xia, C.; Gar-OnYeh, A.; Zhang, A. Analyzing spatial relationships between urban land use intensity and urban vitality at street block level: A case study of five Chinese megacities. Landsc. Urban Plan. 2020, 193, 1–18. [Google Scholar] [CrossRef]
  13. Rana, I.A.; Rautray, J.K.; Yonas, Z.I. Spatiotemporal dynamics of development inequalities in Lahore City Region, Pakistan. Cities 2020, 96, 102418. [Google Scholar] [CrossRef]
  14. Sui, D.Z.; Zeng, H. Modeling the dynamics of landscape structure in Asia’s emerging desa kota regions: A case study in Shenzhen. Landsc. Urban Plan. 2001, 53, 37–52. [Google Scholar] [CrossRef]
  15. Wilonoyudho, S.; Rijanta, R.; Keban, Y.T.; Setiawan, B. Urbanization and Regional Imbalances in Indonesia. Indones. J. Geogr. 2017, 49, 125–132. [Google Scholar] [CrossRef]
  16. Surya, B.; Saleh, H. Transformation of metropolitan suburban area (a study on new town development in Moncongloe-Pattalassang Metropolitan Maminasata). In Proceedings of the IOP Conference Series: Earth and Environmental Science, Surabaya, Indonesia, 18 October 2017; Volume 202, pp. 1–10. [Google Scholar] [CrossRef] [Green Version]
  17. Timberlake, M.; Wei, Y.D.; Ma, X.; Hao, J. Global cities with Chinese characteristics. Cities 2014, 41, 162–170. [Google Scholar] [CrossRef]
  18. Sadorsky, P. The effect of urbanization and industrialization on energy use in emerging economies: Implications for sustainable development. Am. J. Econ. Sociol. 2014, 732, 392–409. [Google Scholar] [CrossRef]
  19. Surya, B. Change Phenomena of Spatial Physical in the Dynamics of Development in Urban Fringe Area. Indones. J. Geogr. 2016, 48, 118–134. [Google Scholar] [CrossRef] [Green Version]
  20. Peng, J.; Tian, L.; Liu, Y.; Zhao, M.; Wu, J. Ecosystem services response to urbanization in metropolitan areas: Thresholds identification. Sci. Total Environ. 2017, 607, 706–714. [Google Scholar] [CrossRef]
  21. Wang, H.; Qin, J.; Zhao, B.; Chen, J.; Dong, L.; Hu, Y. Spatio temporal dynamics of plant diversity in response to farmers’ evolved settlements in Shanghai. Urban For. Urban Green. 2017, 22, 64–73. [Google Scholar] [CrossRef]
  22. Surya, B. The Dynamics of Spatial Structure and Spatial Pattern Changes at the Fringe Area of Makassar City. Indones. J. Geogr. 2015, 47, 11–19. [Google Scholar] [CrossRef]
  23. Terfa, B.K.; Chen, N.; Zhang, X.; Niyogi, D. Urbanization in Small Cities and Their Significant Implications on Landscape Structures: The Case in Ethiopia. Sustainability 2020, 12, 1235. [Google Scholar] [CrossRef] [Green Version]
  24. Liu, Z.; He, C.; Wu, J. General Spatiotemporal Patterns of Urbanization: An Examination of 16 World Cities. Sustainability 2018, 8, 41. [Google Scholar] [CrossRef] [Green Version]
  25. Li, D.; Wang, D.; Li, H.; Zhang, S.; Zhang, X.; Tao, Y. The Effects of Urban Sprawl on the Spatial Evolution of Rural Settlements: A Case Study in Changchun, China. Sustainability 2016, 8, 736. [Google Scholar] [CrossRef] [Green Version]
  26. An, Y.; Tsou, J.Y.; Wong, K.; Zhang, Y.; Liu, D.; Li, Y. Detecting Land Use Changes in a Rapidly Developing City during 1990–2017 Using Satellite Imagery: A Case Study in Hangzhou Urban Area, China. Sustainability 2018, 10, 3303. [Google Scholar] [CrossRef] [Green Version]
  27. Han, J.; Liu, J. Urban Spatial Interaction Analysis Using Inter-City Transport Big Data: A Case Study of the Yangtze River Delta Urban Agglomeration of China. Sustainability 2018, 10, 4459. [Google Scholar] [CrossRef] [Green Version]
  28. Tan, R.; Zhou, K.; He, Q.; Xu, H. Analyzing the Effects of Spatial Interaction among City Clusters on Urban Growth—Case of Wuhan Urban Agglomeration. Sustainability 2016, 8, 759. [Google Scholar] [CrossRef] [Green Version]
  29. Hübl, F.; Cvetojevic, S.; Hochmair, H.; Paulus, G. Analyzing Refugee Migration Patterns Using Geo-Tagged Tweets. ISPRS Int. J. Geo-Inf. 2017, 6, 302. [Google Scholar] [CrossRef] [Green Version]
  30. Daldjoeni, N. Geografi Baru Organisasi Keruangan Dalam Teori Dan Praktek; Alumni: Bandung, Indonesia, 1992. [Google Scholar]
  31. Xue, Z.; Zhen, L. Impact of Rural Land Transfer on Land Use Functions in Western China’s Guyuan Based on a Multi-Level Stakeholder Assessment Framework. Sustainability 2018, 10, 1376. [Google Scholar] [CrossRef] [Green Version]
  32. Bintarto, R. Pengantar Geografi Kota; Spring: Yogyakarta, Indonesia, 1977. [Google Scholar]
  33. Krehl, A.; Siedentop, S.; Taubenböck, H.; Wurm, M. A Comprehensive View on Urban Spatial Structure: Urban Density Patterns of German City Regions. ISPRS Int. J. Geo-Inf. 2016, 5, 76. [Google Scholar] [CrossRef] [Green Version]
  34. Rondinelli, D.A.; Cheema, G.S. Decentralization and Development Policy Implementation in Developing Countries; Sage Publications: London, UK, 1983. [Google Scholar]
  35. Ciommi, M.M.; Chelli, F.; Carlucci, M.; Salvati, L. Urban Growth and Demographic Dynamics in Southern Europe: Toward a New Statistical Approach to Regional Science. Sustainability 2018, 10, 2765. [Google Scholar] [CrossRef] [Green Version]
  36. Vining, D.R., Jr.; Pallone, R. Migration between core and peripheral regions: A description and tentative explanation of the patterns in 22 countries. Geoforum 1982, 13, 339–410. [Google Scholar] [CrossRef]
  37. Lan, F.; Da, H.; Wen, H.; Wang, Y. Spatial Structure Evolution of Urban Agglomerations and Its Driving Factors in Mainland China: From the Monocentric to the Polycentric Dimension. Sustainability 2019, 11, 610. [Google Scholar] [CrossRef] [Green Version]
  38. Firoiu, D.H.; Ionescu, G.; Băndoi, A.; Florea, N.M.; Jianu, E. Achieving Sustainable Development Goals (SDG): Implementation of the 2030 Agenda in Romania. Sustainability 2019, 11, 2156. [Google Scholar] [CrossRef] [Green Version]
  39. Yiannakou, A.; Eppas, D.; Zeka, D. Spatial Interactions between the Settlement Network, Natural Landscape and Zones of Economic Activities: A Case Study in a Greek Region. Sustainability 2017, 9, 1715. [Google Scholar] [CrossRef] [Green Version]
  40. Keniger, L.E.; Gaston, K.J.; Irvine, K.N.; Fuller, R.A. What are the Benefits of Interacting with Nature? Int. J. Environ. Res. Public Health 2013, 10, 913–935. [Google Scholar] [CrossRef] [PubMed] [Green Version]
  41. Rodrigue, J.P. Spatial Interactions and the Gravity Model. The Geography of Transport Systems. In The Spatial Organization of Transportation and Mobility; Routledge: New York, NY, USA, 2020; p. 456. [Google Scholar]
  42. Wenner, F.; Dang, K.A.; Hölzl, M.; Pedrazzoli, A.; Schmidkunz, M.; Wang, J.; Thierstein, A. Regional Urbanisation through Accessibility?—The “Zweite Stammstrecke” Express Rail Project in Munich. Urban Sci. 2020, 4, 2. [Google Scholar] [CrossRef] [Green Version]
  43. Black, J. Urban Transport Planning, Theory and Practice; Routledge: Abingdon, UK, 1981; p. 252. [Google Scholar] [CrossRef]
  44. Bintarto, R. Interaksi Desa Kota dan Permasalahannya; Penerbit: Jakarta, Indonesia, 1989. [Google Scholar]
  45. Batten, D.F.; Boyce, D.E. Chapter 9 Spatial interaction, transportation, and interregional commodity flow models. Handb. Reg. Urban Econ. 1987, 1, 357–406. [Google Scholar] [CrossRef]
  46. Yea, C.; Zhub, J.; Lia, S.; Yangc, S.; Chen, M. Assessment and analysis of regional economic collaborative development within an urban agglomeration: Yangtze River Delta as a case study. Habitat Int. 2019, 83, 20–29. [Google Scholar] [CrossRef]
  47. Masoumi, H.E.; Hosseini, M.; Gouda, A.A. Drivers of urban sprawl in two large Middle-eastern countries: Literature on Iran and Egypt. Hum. Geogr. 2018, 12, 55–79. [Google Scholar] [CrossRef]
  48. Suzuki, S.; Nijkamp, P. Winners in the urban champions league—A performance assessment of Japanese cities by means of dynamic and super-efficient DEA. J. Urban Manag. 2018, 7, 6–20. [Google Scholar] [CrossRef]
  49. Wang, X.; Tomaney, J. Zhengzhou-Political economy of an emerging Chinese megacity. Cities 2019, 84, 104–111. [Google Scholar] [CrossRef]
  50. Mualam, N.; Salinger, E.; Max, D. Increasing the urban mix through vertical allocations: Public floorspace in mixed use development. Cities 2019, 87, 131–141. [Google Scholar] [CrossRef]
  51. Rochovská, A.; Rusnáková, J. Poverty, segregation and social exclusion of Roma communities in Slovakia. Bull. Geogr. Socio-Econ. Ser. 2018, 42, 195–212. [Google Scholar] [CrossRef] [Green Version]
  52. Balogh, A.; Bajmócy, P.; Makra, Z.I. Social and ethnic segregation amongst the smallest Hungarian villages. Geogr. Pannonica. 2018, 22, 208–218. [Google Scholar] [CrossRef]
  53. Huang, W.; Xu, S.; Yan, Y.; Zipf, A. An exploration of the interaction between urban human activities and daily traffic conditions: A case study of Toronto, Canada. Cities 2019, 84, 8–22. [Google Scholar] [CrossRef]
  54. Hernantes, J.; Maraña, P.; Gimenez, R.; Sarriegi, J.M.; Labaka, L. Towards resilient cities: A maturity model for operationalizing resilience. Cities 2019, 84, 96–103. [Google Scholar] [CrossRef]
  55. Lukić, V.; Stoilković, M.A. Interrelation of spatial disparities in development and migration patterns in transition economy: Serbia—Case study. Hum. Geogr. 2017, 11, 65–76. [Google Scholar] [CrossRef] [Green Version]
  56. Yang, Y.; Hu, N. The spatial and temporal evolution of coordinated ecological and socioeconomic development in the provinces along the Silk Road Economic Belt in China. Sustain. Cities Soc. 2019, 47, 101466. [Google Scholar] [CrossRef]
  57. Dadashpoor, H.; Azizi, P.; Moghadasi, M. Analyzing spatial patterns, driving forces and predicting future growth scenarios for supporting sustainable urban growth: Evidence from Tabriz metropolitan area, Iran. Sustain. Cities Soc. 2019, 47, 101502. [Google Scholar] [CrossRef]
  58. Olajide, O.A.; Agunbiade, M.E.; Bishi, H.B. The realities of Lagos urban development vision on livelihoods of the urban poor. J. Urban Manag. 2018, 7, 21–31. [Google Scholar] [CrossRef]
  59. Zhang, Y.; Fu, Y.; Kong, X.; Zhang, F. Prefecture-level city shrinkage on the regional dimension in China: Spatiotemporal change and internal relations. Sustain. Cities Soc. 2019, 47, 101490. [Google Scholar] [CrossRef]
  60. Rasoul, F. Managing service potentiality of small urban centers case study: City of Sardasht, south east of Iran. J. Urban Manag. 2017, 6, 3–18. [Google Scholar] [CrossRef]
  61. Ahmadzai, F.; Lakshmana Rao, K.M.; Ulfat, S. Assessment and modelling of urban road networks using Integrated Graph of Natural Road Network (a GIS-based approach). J. Urban Manag. 2019, 8, 109–125. [Google Scholar] [CrossRef]
  62. Nengroo, Z.A.; Bhat Nissar, M.S.; Kuchay, A. Measuring urban sprawl of Srinagar city, Jammu and Kashmir, India. J. Urban Manag. 2017, 6, 45–55. [Google Scholar] [CrossRef]
  63. Soyinka, O.; Michael Siu, K.W.; Lawanson, T.; Adeniji, O. Assessing smart infrastructure for sustainable urban development in the Lagos metropolis. J. Urban Manag. 2016, 5, 52–64. [Google Scholar] [CrossRef]
  64. Lalehpour, M. Recognition of management structure and spatial planning in Tehran metropolitan area. J. Urban Manag. 2016, 5, 3–15. [Google Scholar] [CrossRef] [Green Version]
  65. Qiu, R.; Xu, W.; Zhang, J. The transformation of urban industrial land use: A quantitative method. J. Urban Manag. 2015, 4, 40–52. [Google Scholar] [CrossRef] [Green Version]
  66. Acolin, A.; Hoek-Smit, M.C.; Eloy, C.M. High delinquency rates in Brazil’s Minha Casa Minha Vida housing program: Possible causes and necessary reforms. Habitat Int. 2019, 83, 99–110. [Google Scholar] [CrossRef]
  67. Ma, G.; Hofmann, E.T. Immigration and environment in the U.S.: A spatial study of air quality. Soc. Sci. J. 2019, 56, 94–106. [Google Scholar] [CrossRef]
  68. Mohamed, A.A.; Elebrashi, R.M.; Saad, M. A Test of the Functional Theory of Human Values in Egypt. Soc. Sci. J. 2019, 56, 118–126. [Google Scholar] [CrossRef]
  69. Brunetta, G.; Monaco, R.; Salizzoni, E.; Salvarani, F. Integrating landscape in regional development: A multidisciplinary approach to evaluation in Trentino planning policies, Italy. Land Use Policy 2018, 77, 613–626. [Google Scholar] [CrossRef]
  70. Buchori, I.; Sugiri, A.; Maryono, M.; Pramitasari, A.; Pamungkas, I.T. Theorizing spatial dynamics of metropolitan regions: A preliminary study in Java and Madura Islands, Indonesia. Sustain. Cities Soc. 2017, 35, 468–482. [Google Scholar] [CrossRef]
  71. Romano, B.; Zullo, F.; Fiorini, L.; Marucci, A.; Ciabò, S. Land transformation of Italy due to half a century of urbanization. Land Use Policy 2017, 67, 387–400. [Google Scholar] [CrossRef]
  72. Peng, J.; Pan, Y.; Liu, Y.; Zhao, H.; Wang, Y. Linking ecological degradation risk to identify ecological security patterns in a rapidly urbanizing landscape. Habitat Int. 2018, 71, 110–124. [Google Scholar] [CrossRef]
  73. Guan, X.; Wei, H.; Lu, S.; Dai, Q.; Su, H. Assessment on the urbanization strategy in China: Achievements, challenges and reflections. Habitat Int. 2018, 71, 97–109. [Google Scholar] [CrossRef]
  74. Li, N.; Chan, D.; Mao, Q.; Hsu, K.; Fu, Z. Urban sustainability education: Challenges and pedagogical experiments. Habitat Int. 2018, 71, 70–80. [Google Scholar] [CrossRef]
  75. Surya, B. Spatial Articulation and Co-Existence of Mode of Production in the Dynamics of Development at the Urban Fringe of Makassar City. J. Eng. Appl. Sci. 2015, 10, 214–222. [Google Scholar]
  76. Hakim, I.; Parolin, B. Spatial Structure and Spatial Impacts of the Jakarta Metropolitan Area: A Southeast Asian EMR Perspective. Int. J. Civ. Environ. Struct. Constr. Archit. Eng. 2008, 2, 227–235. [Google Scholar]
  77. Gradinaru, S.R. Do Post-Socialist Urban Areas Maintain their Sustainable Compact Form? Romanian Urban Areas as Case Study. J. Urban Reg. Anal. 2015, 7, 129–144. [Google Scholar]
  78. Winarso, H. Peri-urban transformation in the Jakarta metropolitan area. Habitat Int. 2015, 49, 221–229. [Google Scholar] [CrossRef]
  79. Olsson, J. Rural-Urban Spatial Interaction in the Global South: Long-Distance Mobility Changes, Desires and Restrictions Over Two Decades in Rural Philippines. Geogr. Ann. Ser. B Hum. Geogr. 2012, 94, 287–304. [Google Scholar] [CrossRef]
  80. Siegel, S. Statistik Non Parametrik Untuk Ilmu-Ilmu Sosial; Gramedia: Jakarta, Indonesia, 1997. [Google Scholar]
  81. Sydenham, M.A.K.; Moe, S.R.; Eldegard, K. When context matters: Spatial prediction models of environmental conditions can identify target areas for wild bee habitat management interventions. Landsc. Urban Plan. 2020, 193, 1–10. [Google Scholar] [CrossRef]
  82. Surya, B.; Saleh, H.; Remmang, H. Economic Gentrification and Socio-Cultural Transformation Metropolitan Suburban of Mamminasata. J. Eng. Appl. Sci. 2018, 13, 6072–6084. [Google Scholar]
  83. Surya, B.; Ruslan, M.; Abubakar, H. Inequility of Space Reproduction Control and Urban Slum Area Management Sustainability (Case Study: Slum Area of Buloa Urban Village in Makassar City). J. Eng. Appl. Sci. 2018, 13, 6033–6042. [Google Scholar]
  84. Kazimierczak, J.; Wrona, K. Regeneration and Demolition Vis-Á-Vis Disintegration of Urban Space: The Case of El Cabanyal-Canyamelar in Valencia. Geogr. Pol. 2019, 1, 121–139. [Google Scholar] [CrossRef]
  85. Mao, X.; Huang, X.; Song, Y.; Zhu, Y.; Tan, Q. Response to urban land scarcity in growing megacities: Urban containment or inter-city connection? Cities 2020, 96, 102399. [Google Scholar] [CrossRef]
  86. Kebza, M.; Nováček, A.; Popjaková, D. Socio-Economic Disparities in the Baltic States: Analytical Comparison and Categorisation of the Regions. Geogr. Pol. 2019, 92, 289–307. [Google Scholar] [CrossRef]
  87. Xie, H.; Zhang, Y.; Duan, K. Evolutionary overview of urban expansion based on bibliometric analysis in Web of Science from 1990 to 2019. Habitat Int. 2020, 95, 1–23. [Google Scholar] [CrossRef]
  88. Provinsi Sulawesi Selatan Dalam Angka. South Sulawesi in Figures. 2019. Available online: https://sulsel.bps.go.id/publication/2019/08/16/990caae13d6f4c5d743e852b/provinsi-sulawesi-selatan-dalam-angka-2019.html (accessed on 10 December 2019).
  89. Imene, D.; Bouzid, T.; Pech, P. What Strategies Make Compatible the Stakes of Nature Conservation and the Stakes of Economic Growth in Protected Area? Example of El Kala National Park, Algeria. Geogr. Pol. 2019, 92, 233–248. [Google Scholar] [CrossRef]
  90. Tomich, T.P.; Chomitz, K.; Francisco, H.; Izac, A.M.N.; Murdiyarso, D.; Ratner, B.D.; Thomas, D.E.; Noordwijk, M. Policy analysis and environmental problems at different scales: Asking the right questions. Agric. Ecosyst. Environ. 2004, 104, 5–18. [Google Scholar] [CrossRef]
  91. Förster, J.; Schmidt, S.; Bartkowski, B.; Lienhoop, N.; Albert, C.; Wittmer, H. Incorporating environmental costs of ecosystem service loss in political decision making: A synthesis of monetary values for Germany. PLoS ONE 2019, 14, 1–23. [Google Scholar] [CrossRef]
  92. Sharley, D.J.; Sharp, S.M.; Marshall, S.; Jeppe, K.; Pettigrove, V.J. Linking urban land use to pollutants in constructed wetlands: Implications for stormwater and urban planning. Landsc. Urban Plan. 2017, 162, 80–91. [Google Scholar] [CrossRef]
  93. Xia, M.; Zhang, Y.; Zhang, Z.; Liu, J.; Ou, W.; Zou, W. Modeling agricultural land use change in a rapid urbanizing town: Linking the decisions of government, peasant households and enterprises. Land Use Policy 2020, 90, 1–10. [Google Scholar] [CrossRef]
  94. Saad, O.A.; Fikry, M.A.; Hasan, A.E. Sustainable upgrading for informal areas. Alex. Eng. J. 2019, 58, 237–249. [Google Scholar] [CrossRef]
  95. Lilius, J.; Hewidy, H. Serving whom? Immigrant entrepreneurs in a new local context. Fenn. Int. J. Geogr. 2019, 215–231. [Google Scholar] [CrossRef]
  96. Chvátal, F. The Impact of Transport Availability and Transport Service Level on the Economic Development of Municipalities in the Czech Republic. Geographica 2015, 46, 19–36. [Google Scholar]
  97. Yunus, S.H. Dinamika Wilayah Peri-Urban Diterminan Masa Depan Kota; Pustaka Pelajar: Yogyakarta, Indonesia, 2008. [Google Scholar]
  98. Surya, B. Social Change, Spatial Articulation in the Dynamics of Boomtown Construction and Development (Case Satudy of Metro Tanjung Bunga Boomtown, Makassar). Mod. Appl. Sci. 2014, 8, 238–245. [Google Scholar] [CrossRef] [Green Version]
  99. Surya, B.; Saleh, H.; Syafri, D.N.A.A. Impact and Sustainability of New Urban Area Development in Moncongloe-Pattalassang, Mamminasata Metropolitan. J. Southwest Jiaotong Univ. 2019, 54, 1–22. [Google Scholar] [CrossRef]
  100. Surya, B. The Processes Analysis of Urbanization, Spatial Articulation, Social Change and Social Capital Difference in the Dynamics of New Town Development in the Fringe Area of Makassar City (Case Study: In Metro Tanjung Bunga Area, Makassar City). Procedia Soc. Behav. Sci. 2016, 227, 216–231. [Google Scholar] [CrossRef] [Green Version]
  101. Hesse, M.; Rodrigue, J. The transport geography of logistics and freight distribution. J. Transp. Geogr. 2004, 12, 171–184. [Google Scholar] [CrossRef]
  102. Bunnell, T. Inclusiveness in Urban Theory and Urban Centred International Development Policy. J. Reg. City Plan. 2019, 30, 89–101. [Google Scholar] [CrossRef] [Green Version]
  103. Bech, N.M.; Birkved, M.; Charnley, F.; Laumann Kjaer, L.; Pigosso, D.C.; Hauschild, M.Z.; Moreno, M. Evaluating the Environmental Performance of a Product/Service-System Business Model for Merino Wool Next-to-Skin Garments: The Case of Armadillo Merino. Sustainability 2019, 11, 5854. [Google Scholar] [CrossRef] [Green Version]
  104. Bajracharya, B.N.; Hastings, P. A Regional, Strategic Growth-Management Approach to Urban and Peri-Urban Development in South East Queensland, Australia. J. Reg. City Plan. 2018, 29, 210–233. [Google Scholar] [CrossRef]
  105. Latuconsina, Z.M.Y.; Rustiadi, E.; Sahara, S. An Analysis of the Level of Development in Malang Regency Based on a Typology of Development Regions. J. Reg. City Plan. 2018, 29, 1–17. [Google Scholar] [CrossRef] [Green Version]
  106. Vaskalis, I.; Skoulou, V.; Stavropoulos, G.; Zabaniotou, A. Towards Circular Economy Solutions for The Management of Rice Processing Residues to Bioenergy via Gasification. Sustainability 2019, 11, 6433. [Google Scholar] [CrossRef] [Green Version]
  107. Wagistina, S.; Wahab, F.R. Income Distribution between Local and Migrant Households in Pheri-Urban of Malang City, East Java Province, Indonesia. Wacana 2019, 22, 290–296. [Google Scholar]
  108. Rodrigue, J.; Slack, B. Intermodal Transportation and Containerization. In The Geography of Transport Systems; Routledge: Abingdon, UK, 2020. [Google Scholar]
  109. Yuan, F.; Wei, Y.D.; Wu, J. Amenity effects of urban facilities on housing prices in China: Accessibility, scarcity, and urban spaces. Cities 2020, 96, 102433. [Google Scholar] [CrossRef]
  110. William, C. Strange. Urban Agglomeration. In The New Palgrave Dictionary of Economics; Macmillan, P., Ed.; Springer: Berlin, Germany, 2016; pp. 146–154. [Google Scholar] [CrossRef]
  111. Mandeli, K. Public space and the challenge of urban transformation in cities of emerging economies: Jeddah case study. Cities 2019, 95, 102409. [Google Scholar] [CrossRef]
  112. Poikolainen, L.; Pinto, G.; Vihervaara, P.; Burkhard, B.; Wolff, F.; Hyytiäinen, R.; Kumpula, T. GIS and land cover-based assessment of ecosystem services in the North Karelia Biosphere Reserve, Finland. Fenn. Int. J. Geogr. 2019, 197, 249–267. [Google Scholar] [CrossRef]
  113. Scanu, E. Climate Change, Urban Responses and Sociospatial transformations: The Example of Quebec City. Can. J. Urban Res. 2019, 28, 1–15. [Google Scholar]
  114. Grillos, T.; Bottazzi, P.; Crespo, D.; Asquith, N.; Jones, J.P.G. In-kind conservation payments crowd in environmental values and increase support for government intervention: A randomized trial in Bolivia. Ecol. Econ. 2019, 166. [Google Scholar] [CrossRef]
  115. Riekhof, M.; Regnier, E.; Quaas, M.F. Economic growth, international trade, and the depletion or conservation of renewable natural resources. J. Environ. Econ. Manag. 2019, 97, 116–133. [Google Scholar] [CrossRef]
  116. Peng, B.; Huang, Q.; Elahi, E.; Wei, G. Ecological Environment Vulnerability and Driving Force of Yangtze River Urban Agglomeration. Sustainability 2019, 11, 6623. [Google Scholar] [CrossRef] [Green Version]
  117. Yang, Y.; Ng, S.T.; Zhou, S.; Xu, F.J.; Li, D.; Li, H. A federated pre-event community resilience approach for assessing physical and social sub-systems: An extreme rainfall case in Hong Kong. Sustain. Cities Soc. 2019, 52, 1–12. [Google Scholar] [CrossRef]
  118. Leimgruber, J.; Krebs, G.; Camhy, D.; Muschalla, D. Model-Based Selection of Cost-Effective Low Impact Development Strategies to Control Water Balance. Sustainability 2019, 11, 2240. [Google Scholar] [CrossRef] [Green Version]
  119. Daneshmandian, M.C.; Behzadfar, M.; Isadrabad, S.J. The efficiency of visual buffer zone to preserve historical open spaces in Iran. Sustain. Cities Soc. 2020, 52, 101856. [Google Scholar] [CrossRef]
  120. Szabolcs, P. Community Participation in Sustainable Urban Growth, Case Study of Almere, The Netherlands. Pollack Periodica Int. J. Eng. Inf. Sci. 2016, 1, 145–155. [Google Scholar] [CrossRef] [Green Version]
  121. Muñoz-Villamizar, A.; Santos, J.; Montoya-Torres, J.R.; Velázquez-Martínez, J.C. Measuring environmental performance of urban freight transport systems: A case study. Sustain. Cities Soc. 2020, 52, 101844. [Google Scholar] [CrossRef]
  122. Shahen, M.E.; Shahrier, S.; Kotani, K. Happiness, Generativity and Social Preferences in a Developing Country: A Possibility of Future Design. Sustainability 2019, 19, 5256. [Google Scholar] [CrossRef] [Green Version]
  123. Xie, S.; Gu, K.; Zhang, X. Urban conservation in China in an international context: Retrospect and prospects. Habitat Int. 2020, 95, 102098. [Google Scholar] [CrossRef]
  124. Chen, W.; Chi, G.; Li, J. The spatial aspect of ecosystem services balance and its determinants. Land Use Policy 2020, 90, 104263. [Google Scholar] [CrossRef]
  125. Fang, C.; Yu, D. Urban agglomeration: An evolving concept of an emerging phenomenon. Landsc. Urban Plan. 2017, 162, 126–136:. [Google Scholar] [CrossRef]
  126. Elalamy, Y.; Doyen, L.; Mouysset, L. Contribution of the land use allocation model for agroecosystems: The case of Torrecchia Vecchia. J. Environ. Manag. 2019, 252, 1–10. [Google Scholar] [CrossRef]
  127. Kroll, F.; Müller, F.; Haase, D.; Fohrer, N. Rural-urban gradient analysis of ecosystem services supply and demand dynamics. Land Use Policy 2012, 29, 521–535. [Google Scholar] [CrossRef]
  128. Li, J.; Jiang, H.; Bai, Y.; Alatalo, J.M.; Li, X.; Jiang, H.; Liu, G.; Xu, J. Indicators for spatial-temporal comparisons of ecosystem service status between regions: A case study of the Taihu River Basin, China. Ecol. Indic. 2016, 60, 1008–1016. [Google Scholar] [CrossRef]
  129. Zhang, Z.; Gao, J.; Fan, X.; Lan, Y.; Zhao, M. Response of ecosystem services to socioeconomic development in the Yangtze River Basin, China. Ecol. Indic. 2017, 72, 481–493. [Google Scholar] [CrossRef]
Figure 1. Conceptual Framework for Spatial Integration and Spatial Interaction in the Urban Suburbs of the Mamminasata Metropolitan Area. Source: author elaboration.
Land 09 00095 g001
Figure 2. (AC) Mamminasata Metropolitan Urban Study Area. Source: author elaboration; Folder © 2019 Google.
Land 09 00095 g002
Figure 3. Linearity and Path Chart.
Land 09 00095 g003
Figure 4. Relationship Between Spatial Integration, Spatial Interaction, Urban Agglomeration, and Activity System of the Suburbs of the Mamminasata Metropolitan Area. Source: author elaboration.
Land 09 00095 g004
Figure 5. (AC). The Development of the Population of Mamminasata Metropolitan Urban Suburbs. Source: author elaboration, input: reference [90].
Land 09 00095 g005aLand 09 00095 g005b
Figure 6. Change to Land Use in the Hertasning-Samata Suburbs. Source: author elaboration, Map© 2001, 2015, 2019 Google.
Land 09 00095 g006
Figure 7. Change to Land Use in the Manggala Suburbs. Source: author elaboration, Map© 2001, 2015, 2019 Google.
Land 09 00095 g007
Figure 8. Change to Land Use in the Moncongloe-Pattalassang Suburbs. Source: author elaboration, Map© 2001, 2015, 2019 Google.
Land 09 00095 g008
Figure 9. Mamminasata Metropolitan Suburbs Urban Service Centers. Source: author elaboration; Folder © 2019 Google.
Land 09 00095 g009
Figure 10. Comparison of the Mamminasata Metropolitan Suburbs Space Structure. Source: author elaboration.
Land 09 00095 g010
Figure 11. (AC), Components of Economic Growth in the Mamminasata Metropolitan Urban Area. Source: author elaboration, infut: reference [90].
Land 09 00095 g011
Figure 12. Spatial Interaction of Mamminasata Metropolitan Suburbs. Source: author elaboration.
Land 09 00095 g012
Figure 13. Example, Travel Model Average Population in the Mamminasata Metropolitan Urban Suburbs. Source: author elaboration; Folder © 2019 Google.
Land 09 00095 g013
Figure 14. The Relationship of Spatial Integration, Spatial Interaction and Urban Agglomeration to Economic Growth in the Mamminasata Metropolitan Suburban. Source: author elaboration.
Land 09 00095 g014
Figure 15. Sustainable Development of the Mamminasata Metropolitan Urban Suburbs. Source: author elaboration.
Land 09 00095 g015
Table 1. Change to Land Use in the Hertaning-Samata Suburbs.
NoUrban ActivitiesHertasning-Samata Suburbs
Land Use 2001 (Ha)Land Use 2015 (Ha)Land Use 2019 (Ha)Land Use Change 2001–2015 (Ha)Land Use Change 2015–2019 (Ha)
1Service Facilities0.2528.7597.7628.569.01
2Blank Land11.1225.349.8114.22−15.53
3Education Facilities1.518.6339.217.1230.58
4Trade Facilities0.542.2653.531.7251.27
5Worship Facilities0.282.885.462.62.58
6Office Facilities9.497.579.61−1.922.04
7Settlements113.5233.02278.86119.5245.84
8Mix Garden20.426.65.11−13.82−1.49
10Rice Field397.07234.2445.82−162.83−188.42
11Swamp3.07-2.55−3.072.55
12Field1.91.751.75−0.150
13Shrub4.654.654.6500
14Industry -7.277.277.270
15Health facilities0.211.052.620.841.57
Source: author elaboration, Map© 2001, 2015, 2019 Google.
Table 2. Change to Land Use in the Hertaning-Samata Suburbs.
NoUrban ActivitiesManggala Suburbs
Land Use 2001 (Ha)Land Use 2015 (Ha)Land Use 2019 (Ha)Land Use Change 2001–2015Land Use Change 2015–2019
1Service Facilities8.278.278.6700.4
2Blank Land138.86297.35200.98158.49−96.37
3Education Facilities0.233.495.383.261.89
4Trade Facilities4.875.095.090.220
5Worship Facilities0.310.820.990.510.17
6Office Facilities0.831.25.320.374.12
7Settlements132.76271.18365.89138.4294.71
8Mix Garden151.828.6728.67−123.130
9Cemetery27.0827.0827.0800
10Rice Field307.45130.31125.39−177.14−4.92
11Swamp86.1586.1586.1500
Source: author elaboration, Map© 2001, 2015, 2019 Google.
Table 3. Change to Land Use in the Hertaning-Samata Suburbs.
NoUrban ActivitiesMoncongloe Pattallassang Suburbs
Land Use 2001 (Ha)Land Use 2015 (Ha)Land Use 2019 (Ha)Land Use Change 2001–2015Land Use Change 2015–2019
1Service Facilities4.2912.1312.137.840
2Blank Land1.1111.4165.410.353.99
3Education Facilities0.473.883.873.41−0.01
4Trade Facilities0.858.528.527.670
5Worship Facilities0.632.182.181.550
6Office Facilities0.288.538.538.250
7Settlements69.64457.5587.56387.86130.06
8Mix Garden88.1188.1188.1100
9Rice Field3467.583040.72856.66−426.88−184.04
Source: author elaboration, Map© 2001, 2015, 2019 Google.
Table 4. Mamminasata Metropolitan Suburban Spatial Interaction.
NoMamminasata Metropolitan SuburbsBusiness IndexStrength of AttractionWeightMagnitude of InteractionAccessibilityStop Point (Km)
1Moncongloe-Pattalassang to ManggalaIBMP-M = 1.037GMP-M = 7,380,4IMP-M = 1.130AMP-M = 1,52,15
2Moncongloe-Pattalassang to Hertasning-SamataIBMP-HS = 712GMP-HS = 5,630,4IMP-HS = 693AMP-HS = 1,34,15
3Manggala to Hertasning-SamataIBM-HS = 9.468GM-HS = 0,760,4IM-HS = 7.159AM-HS = 2,03,21
4Manggala to Moncongloe-PattalassangIBM-MP = 1.037GM-MP = 0,130,4IM-MP = 1.130AM-MP = 1,55,84
5Hertasning-Samata to Moncongloe-PattalassangIBHS-MP = 712GHS-MP = 0,180,4IHS-MP = 693AHS-MP = 1,39,86
6Hertasning-Samata to ManggalaIBHS-M = 1.037GHS-M = 1,310,4IHS-M = 7.159AHS-M = 2,02,80
Source: author elaboration.

