Landslide Mapping and Susceptibility Assessment Using Geospatial Analysis and Earth Observation Data

 ,
, 
 ,
, 
Abstract
:1. Introduction
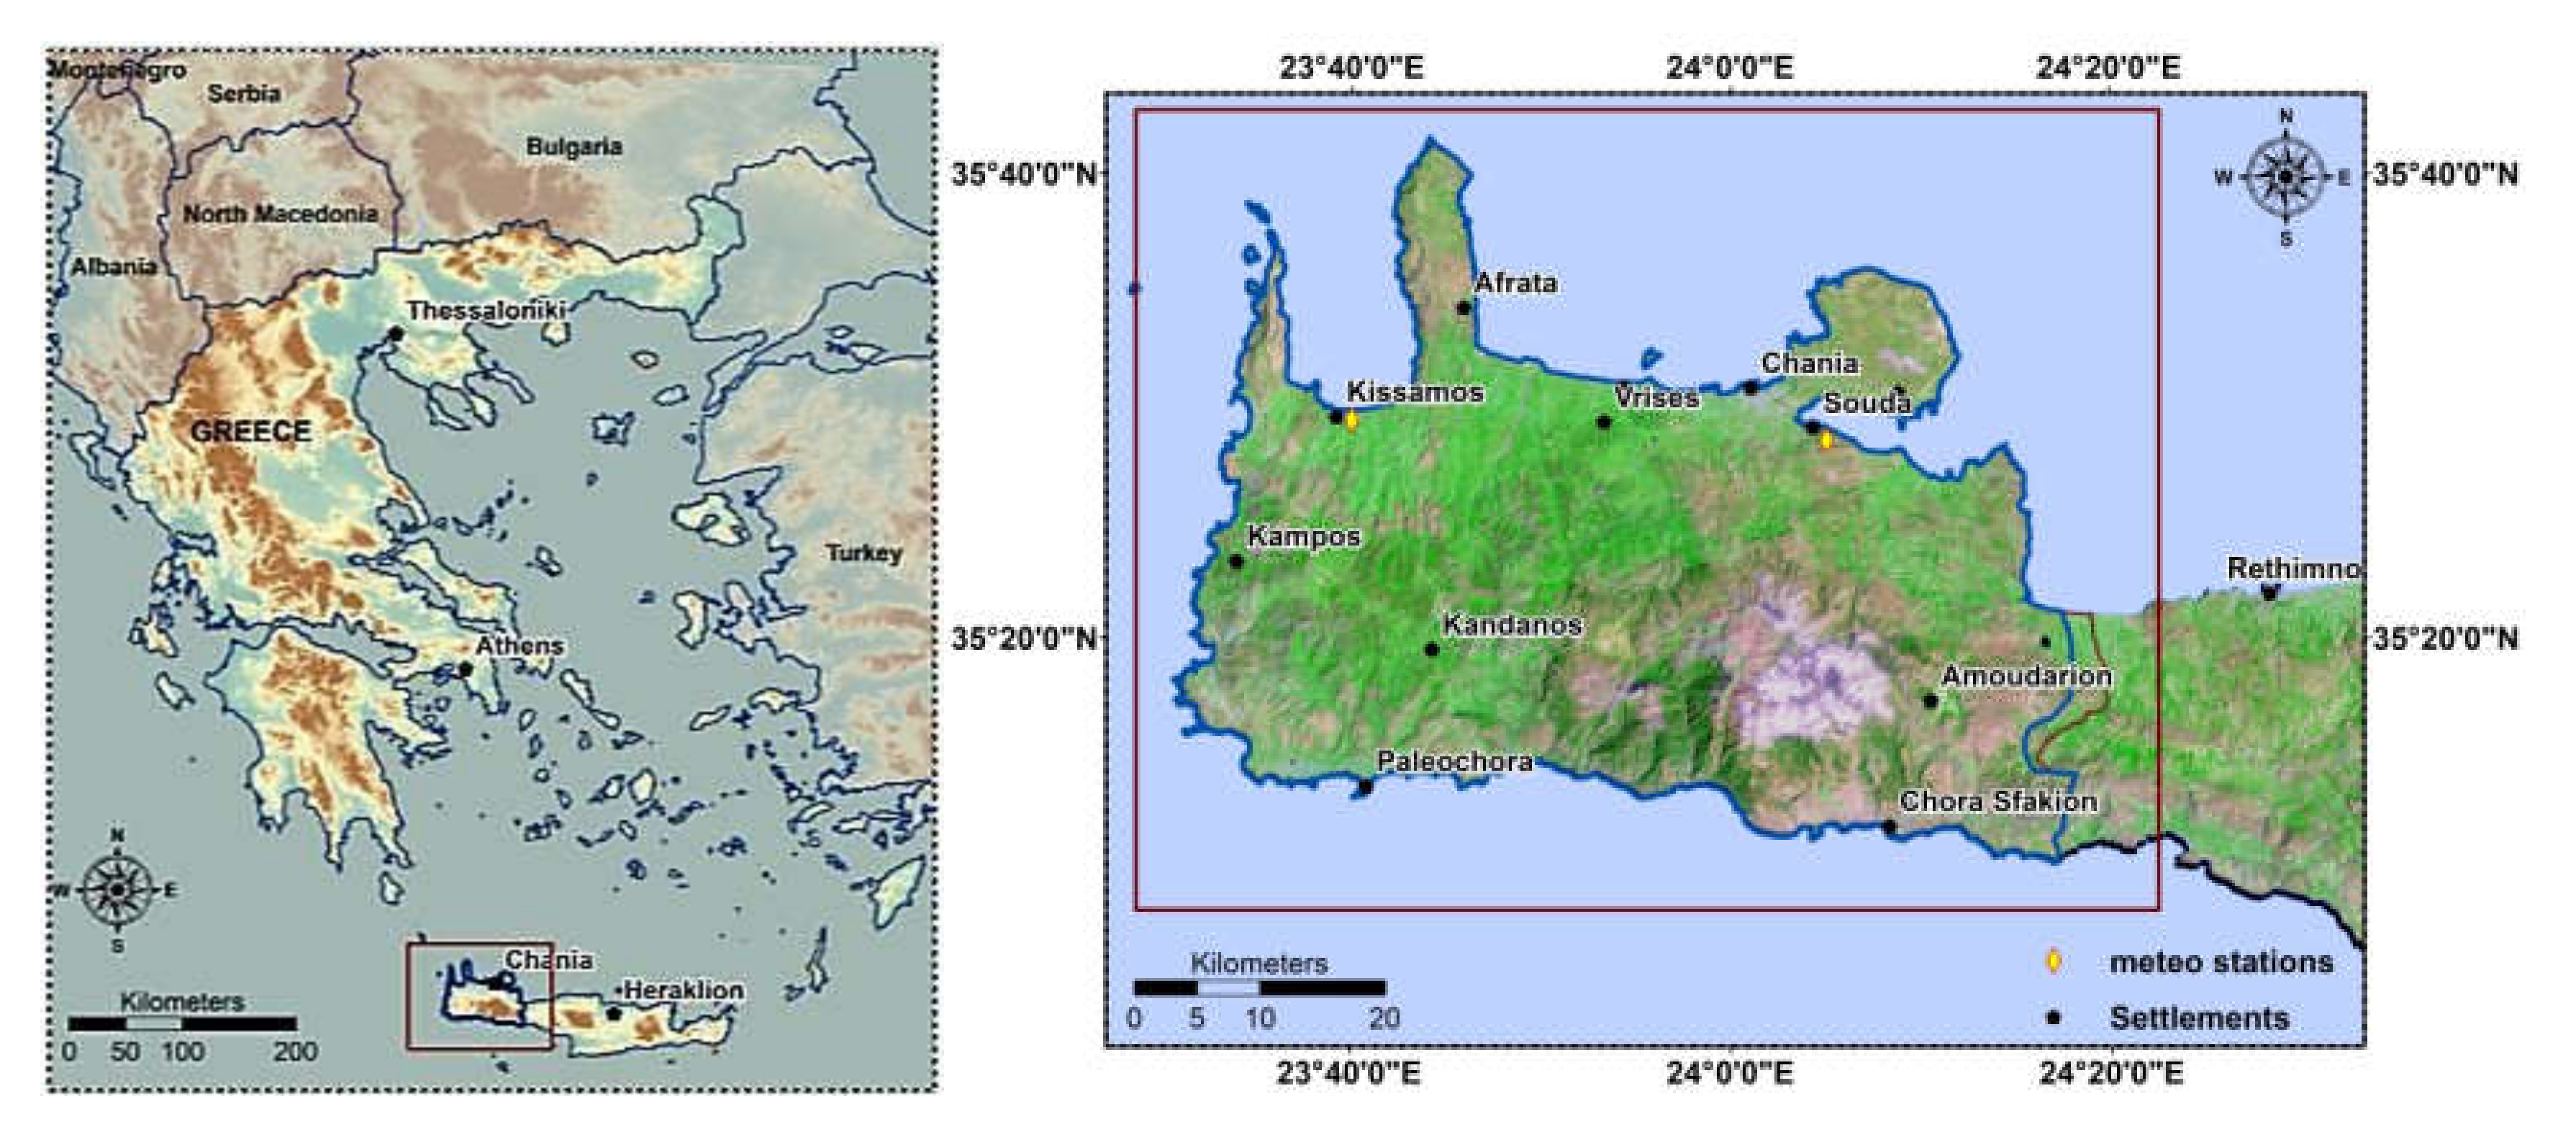
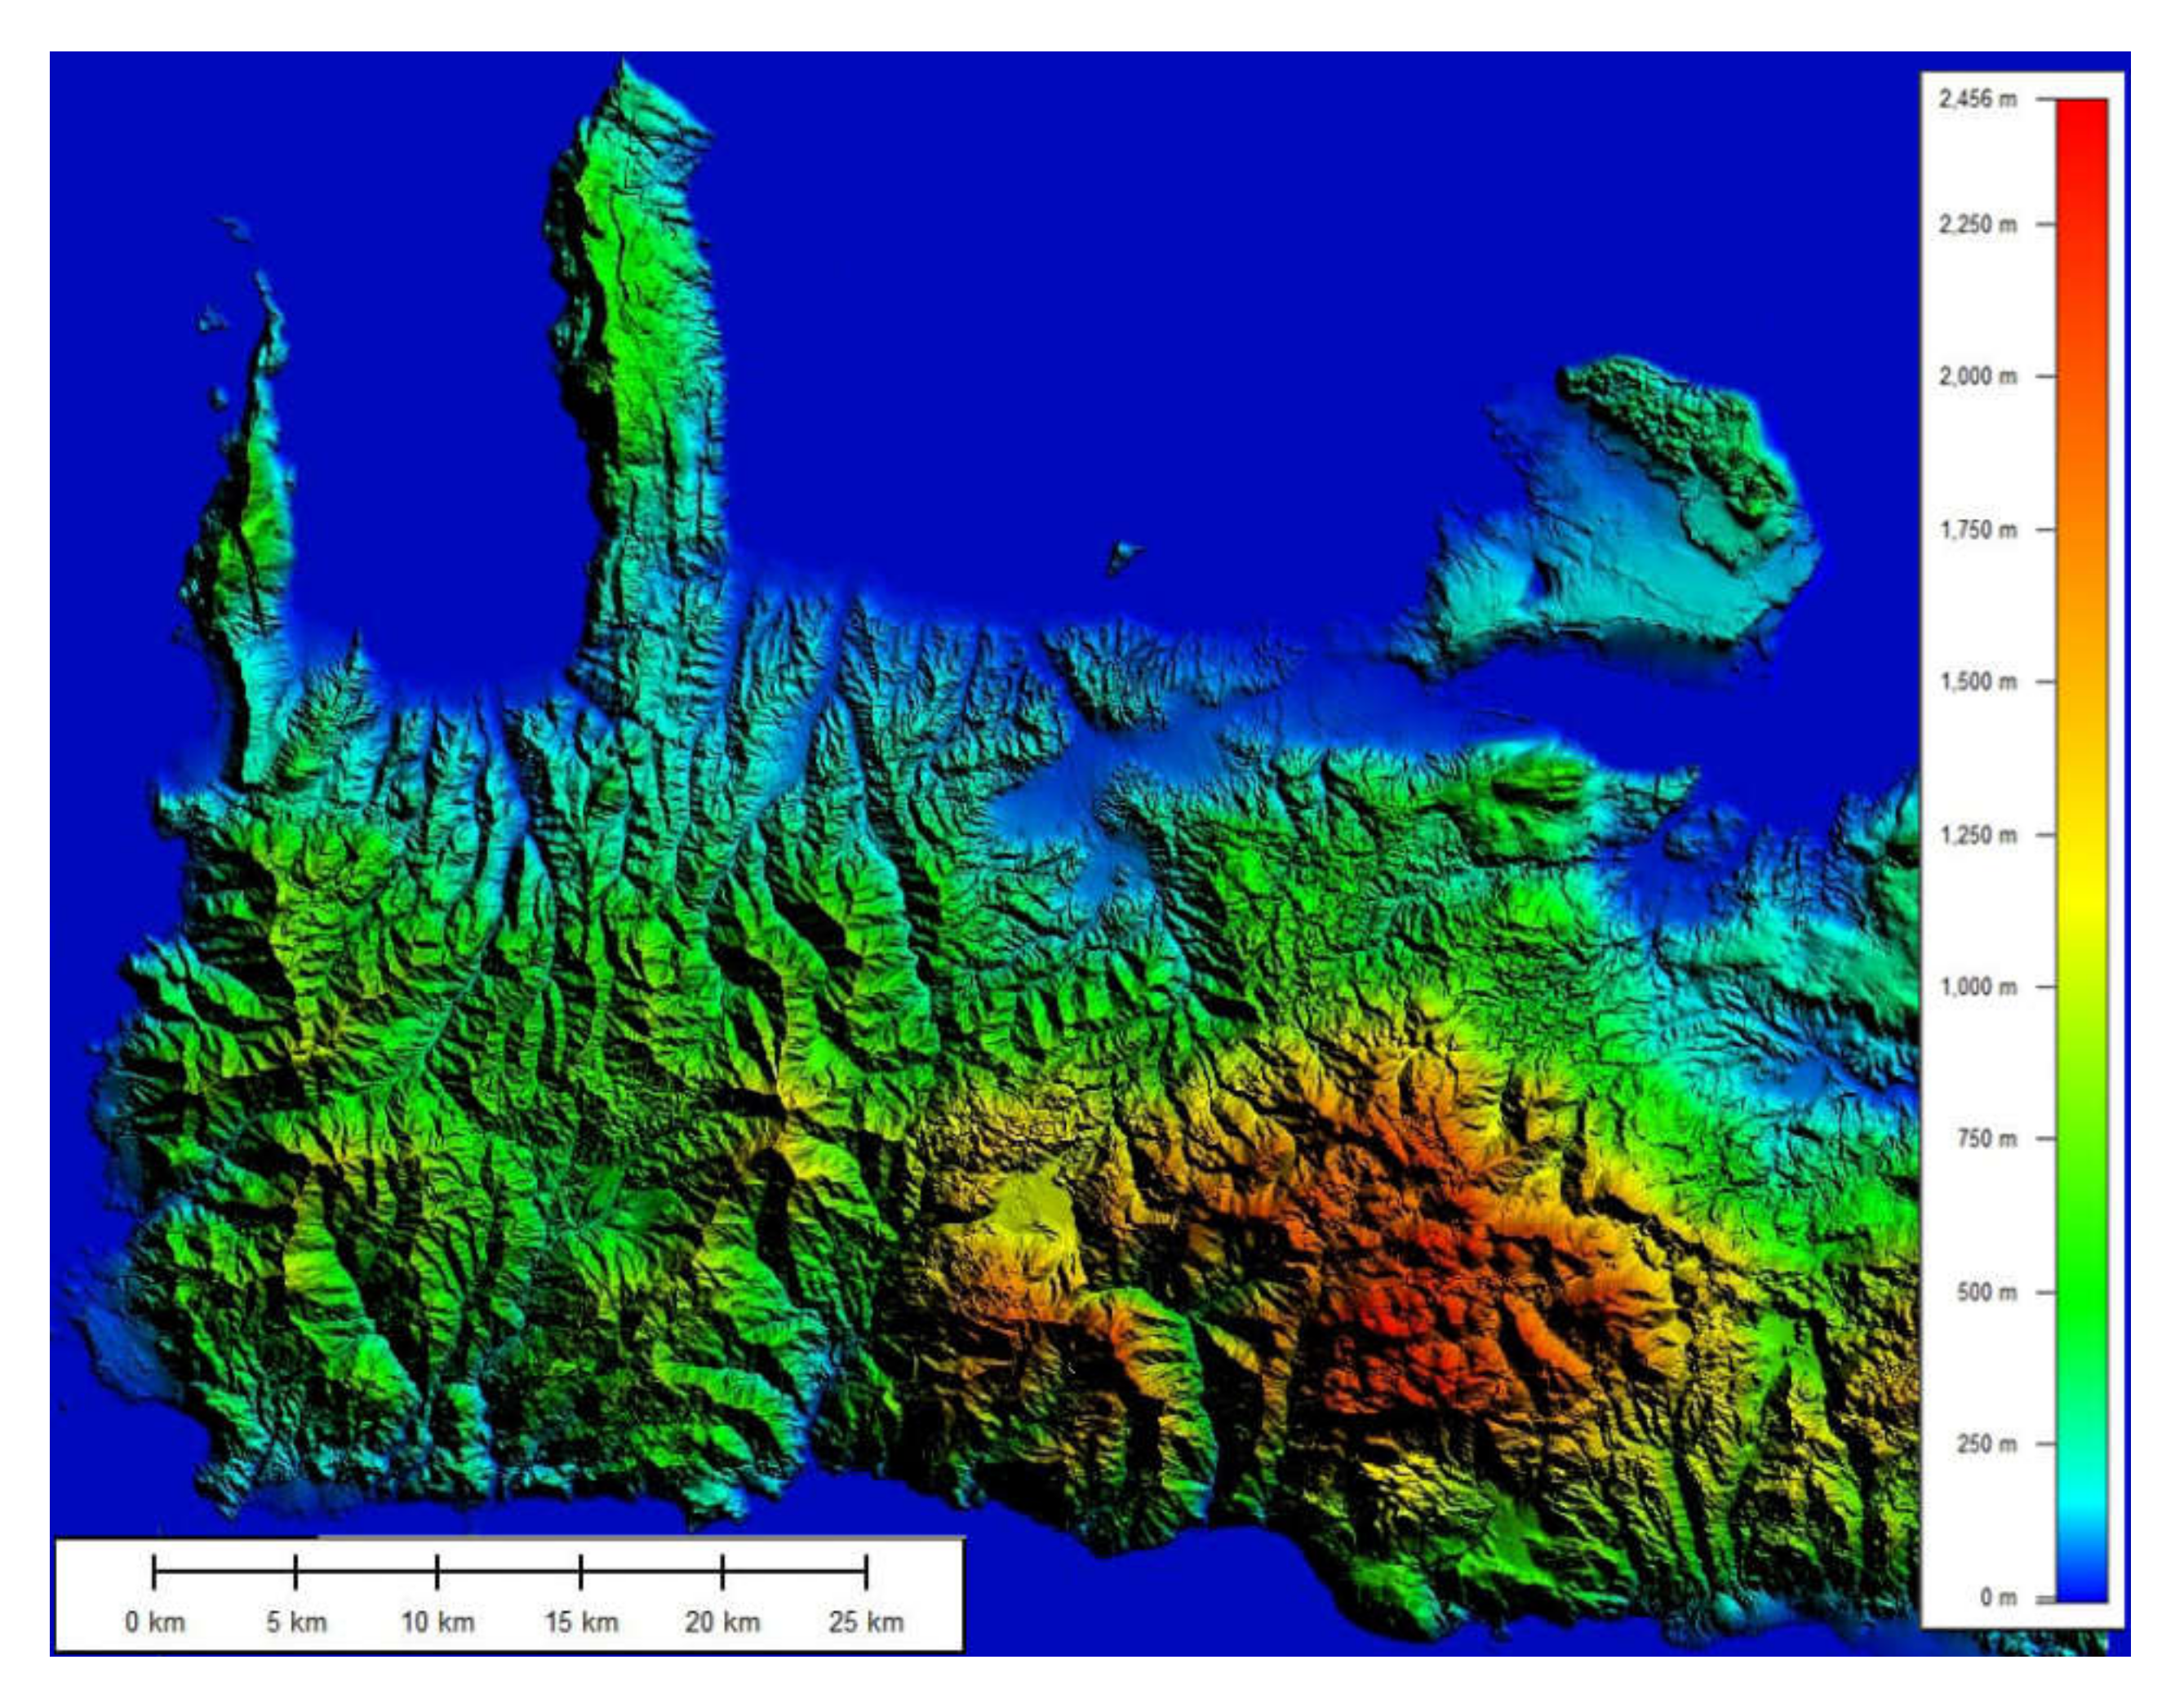
2. Study Area
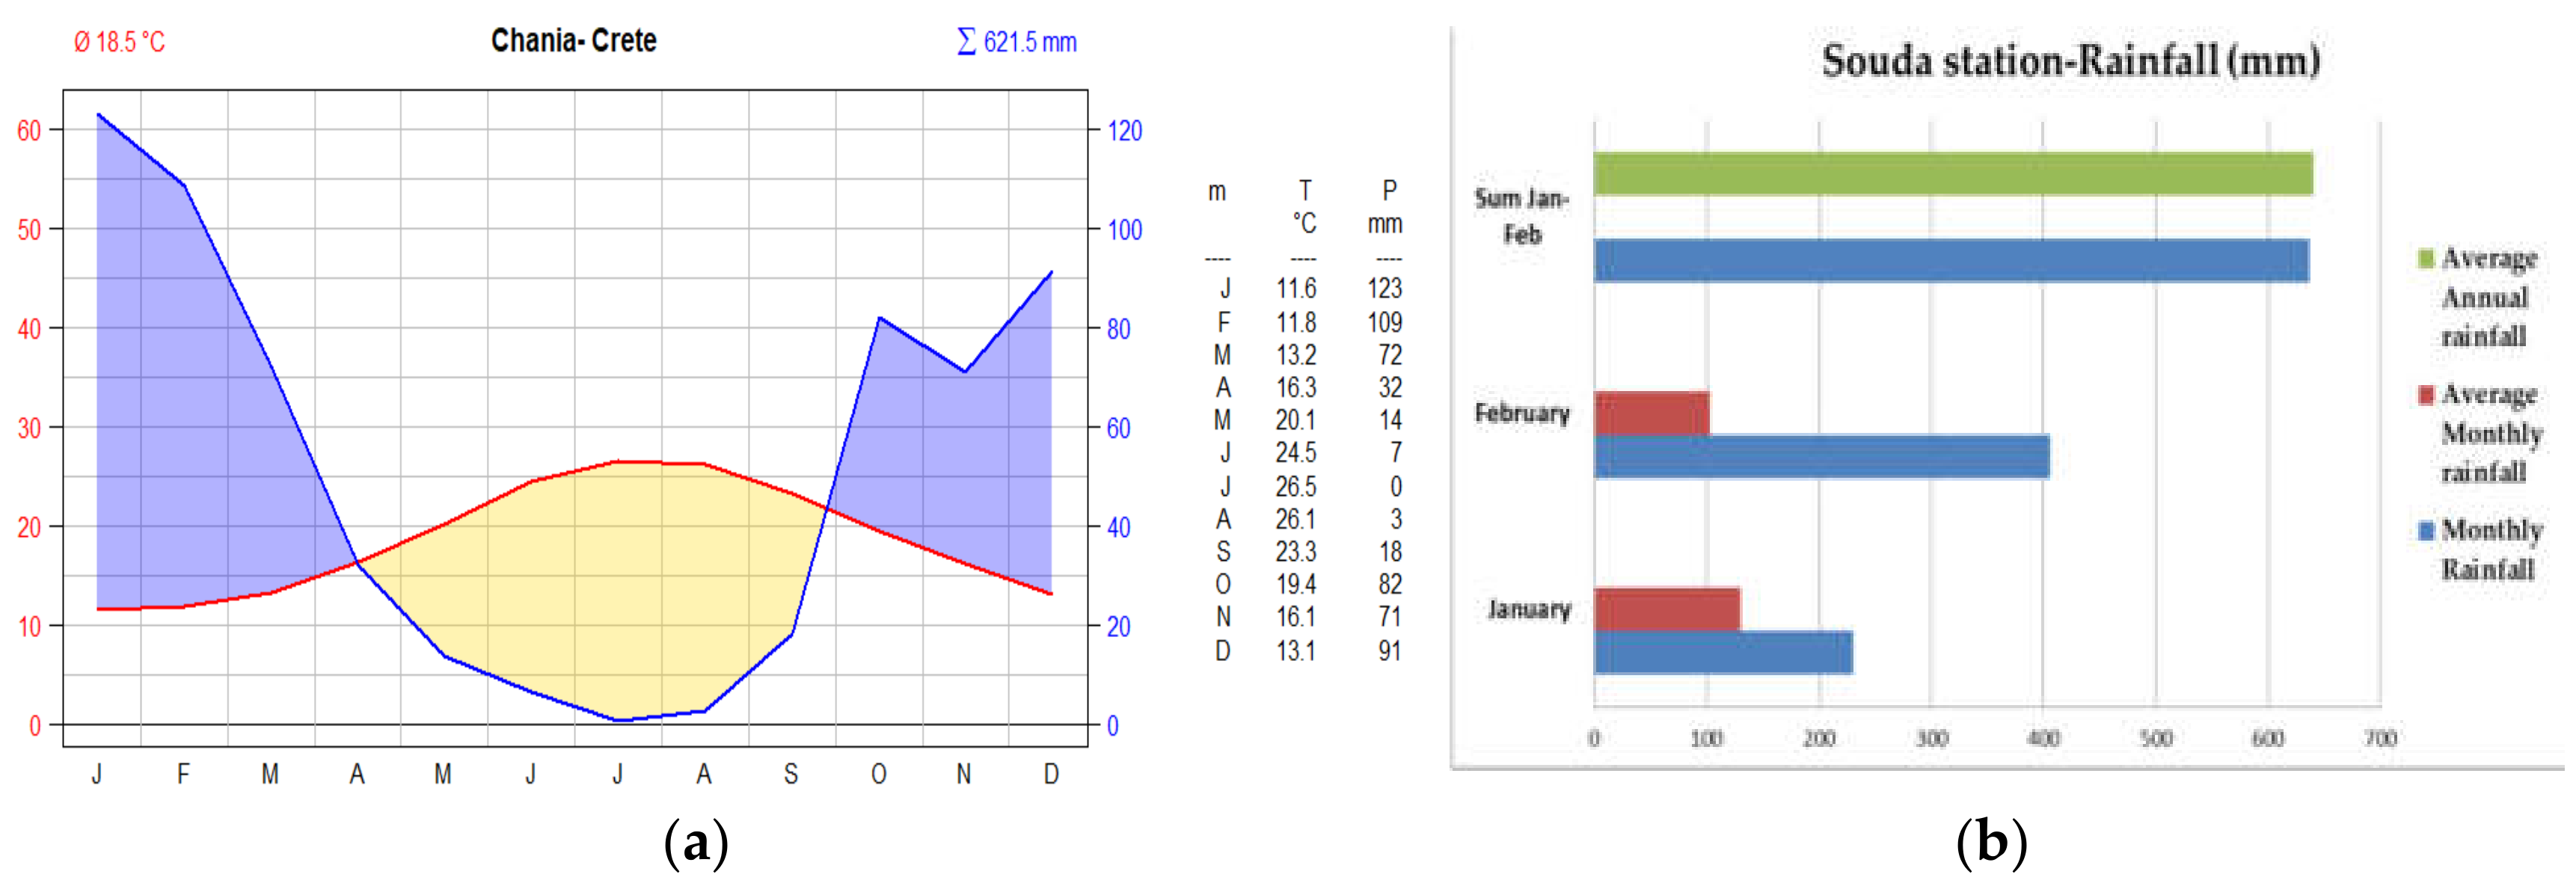
2.1. Intense Rainfall Period
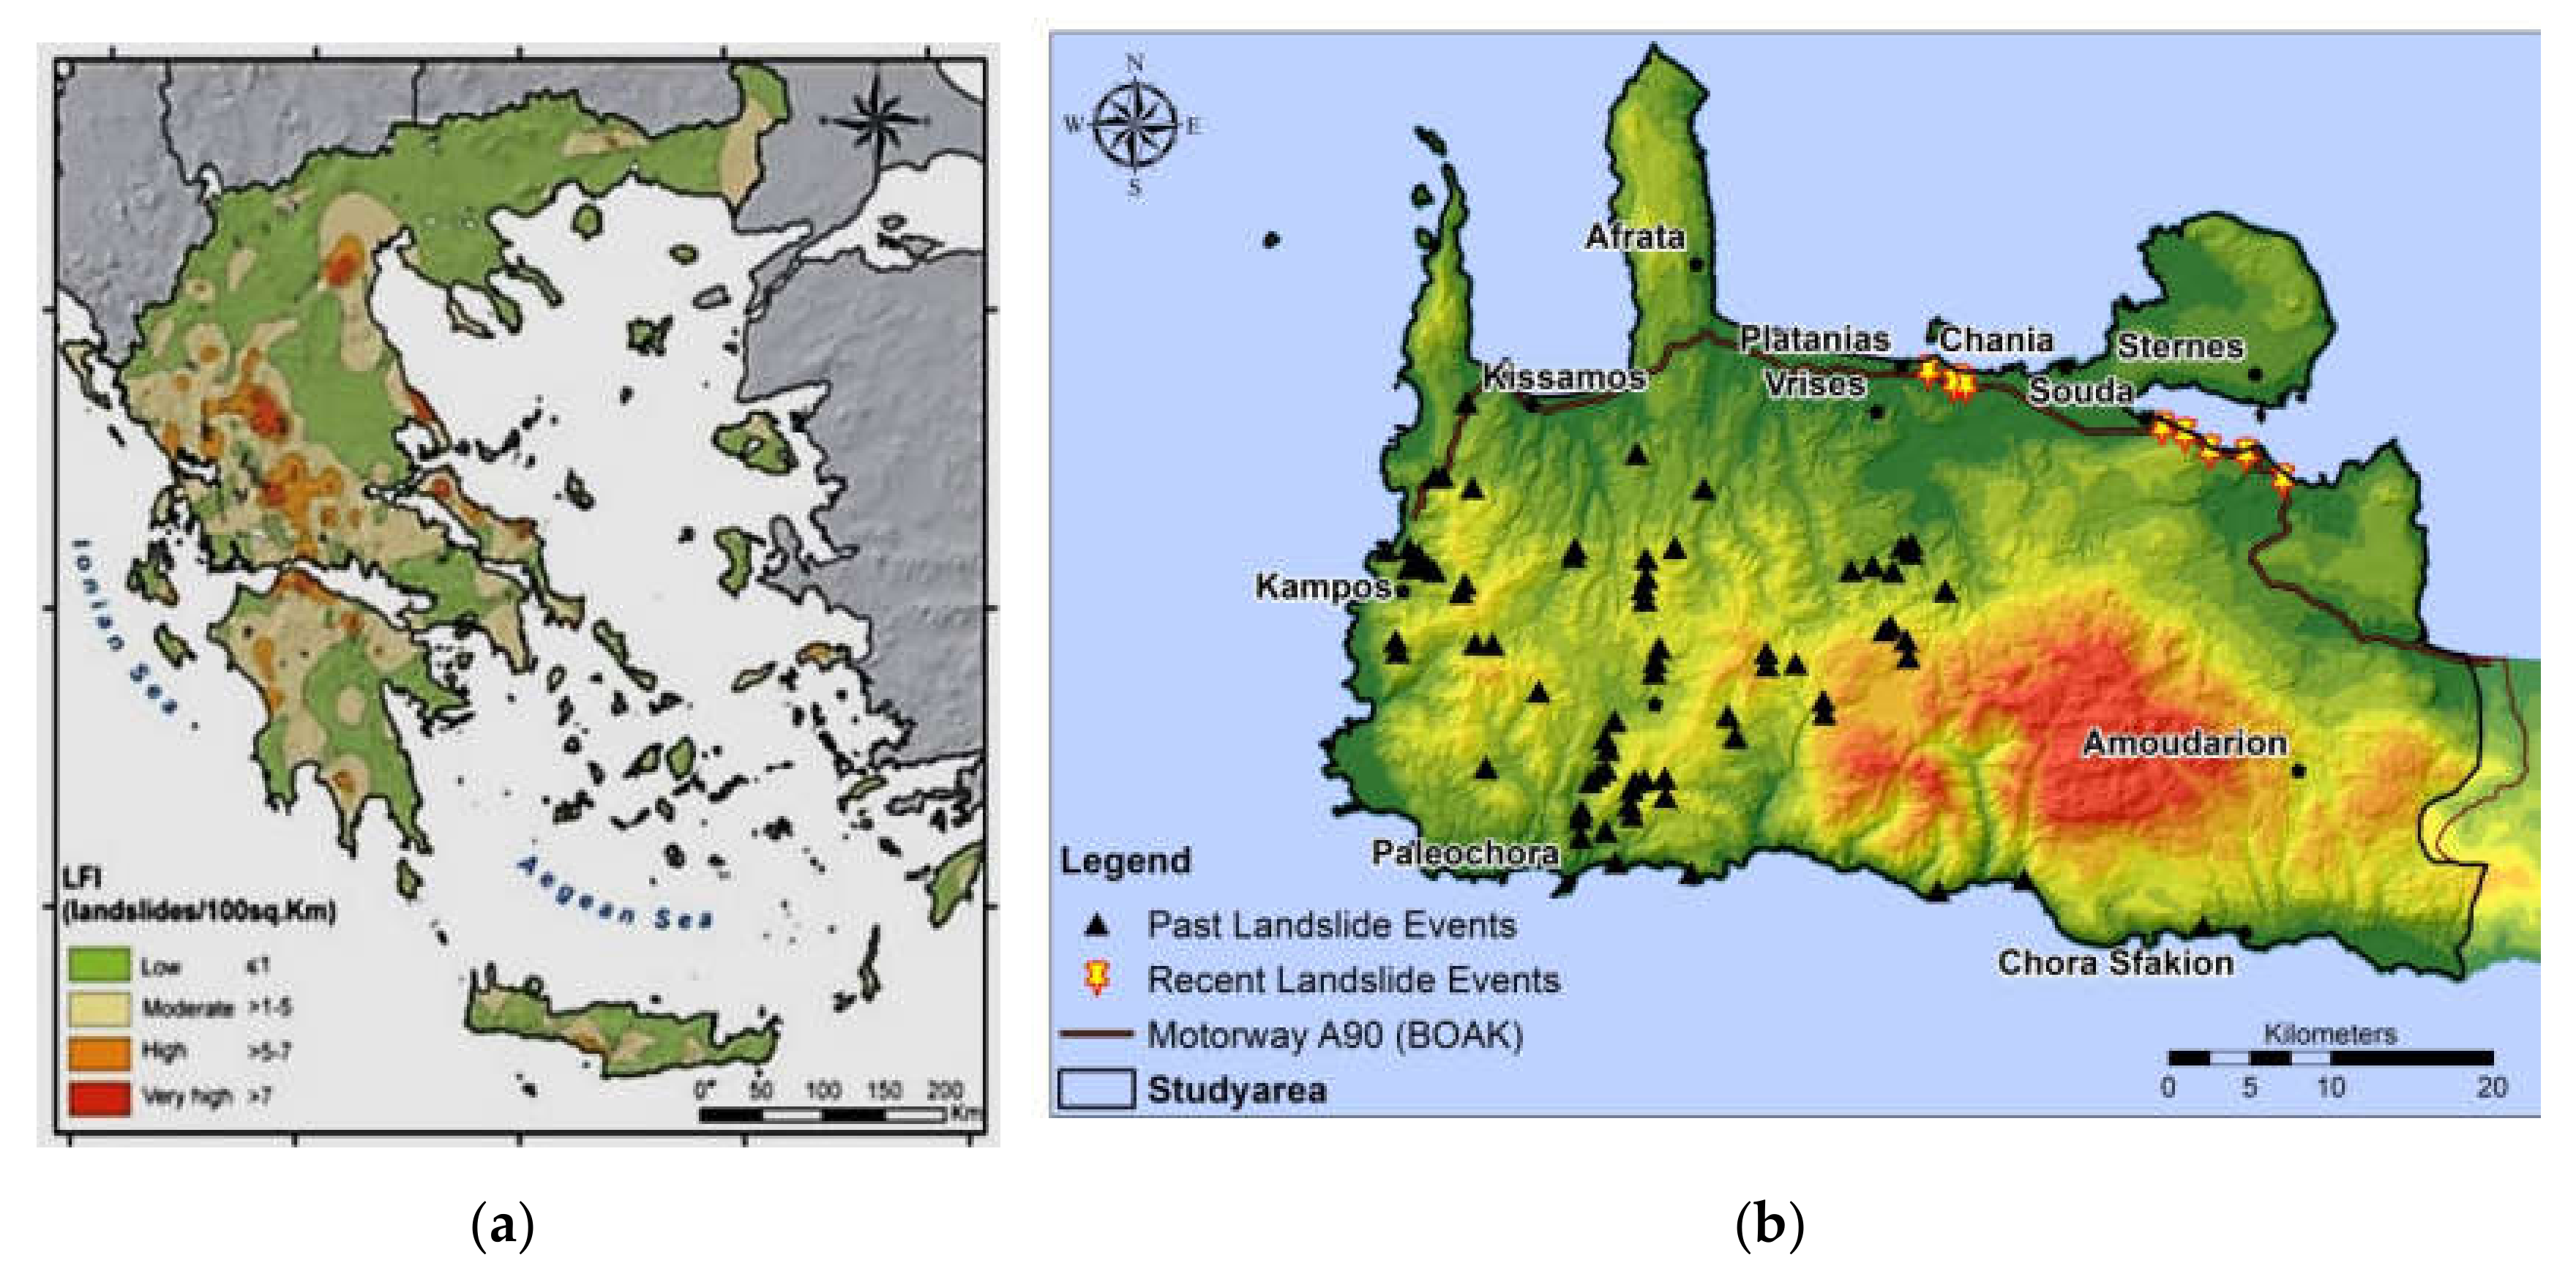
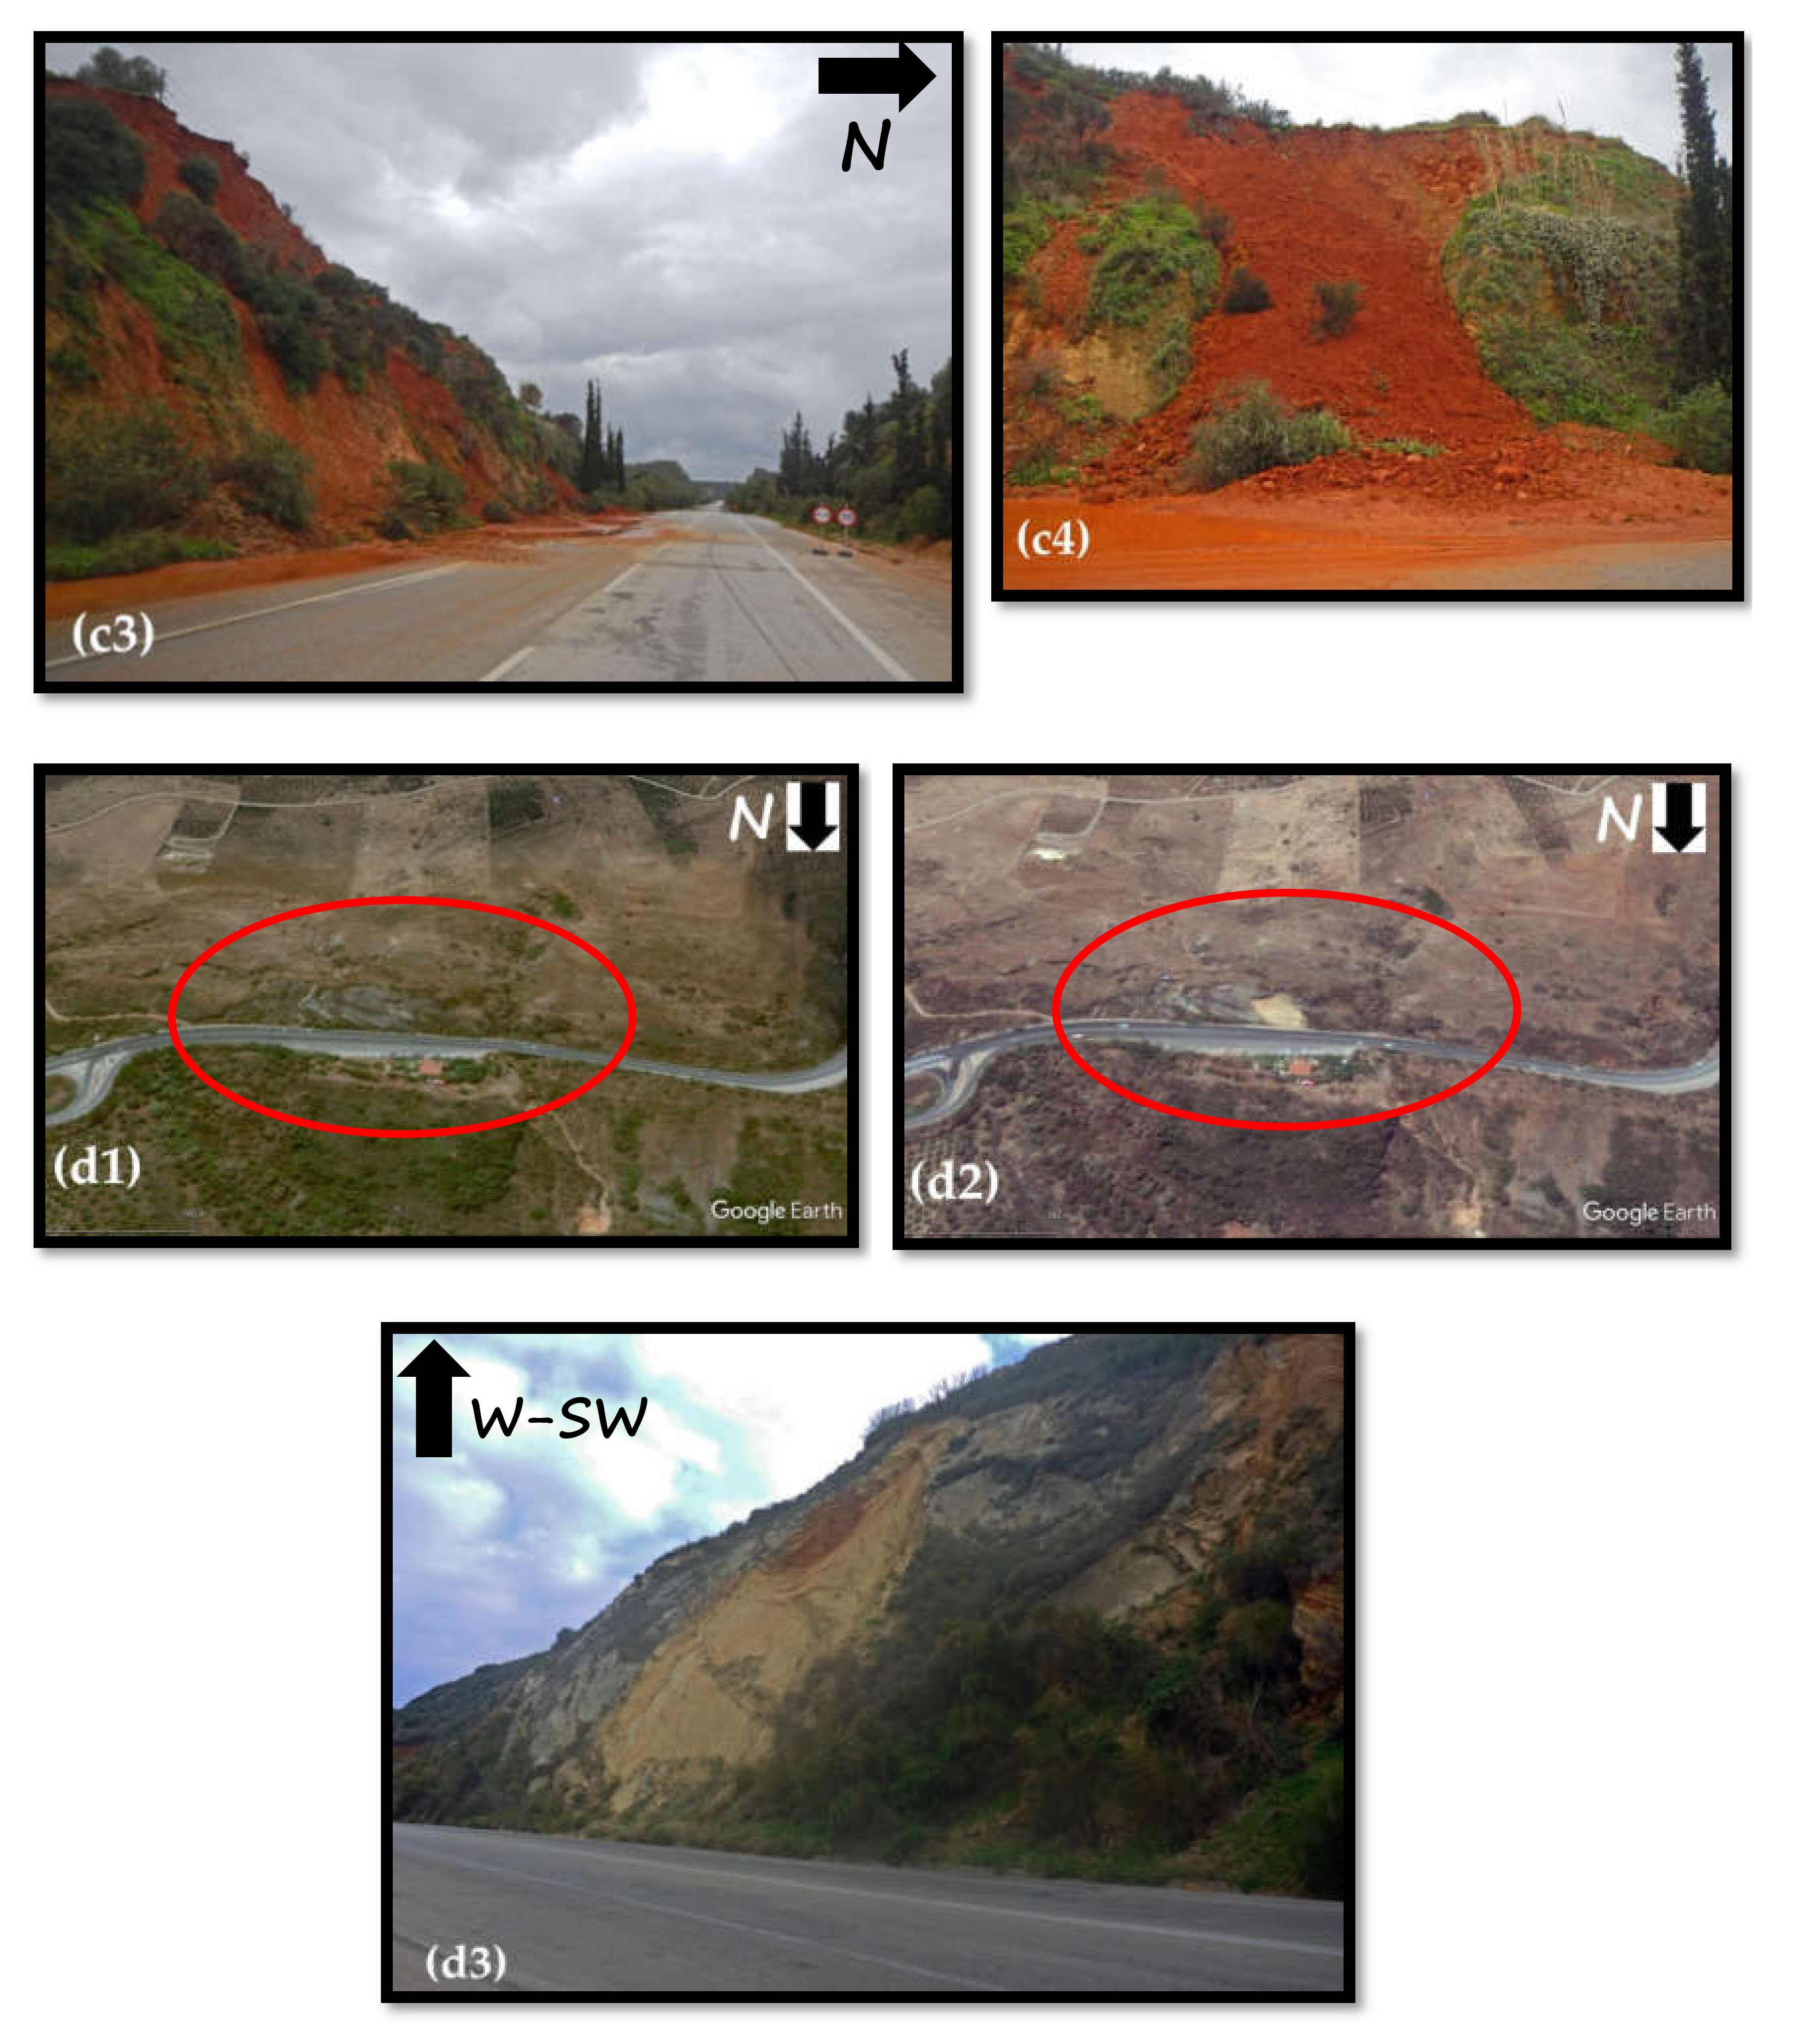
2.2. Landslides
3. Materials and Methods
3.1. Data
3.2. Methodology
3.2.1. Landslide Inventory Map
3.2.2. Satellite Images Processing
3.2.3. Digital Elevation Model
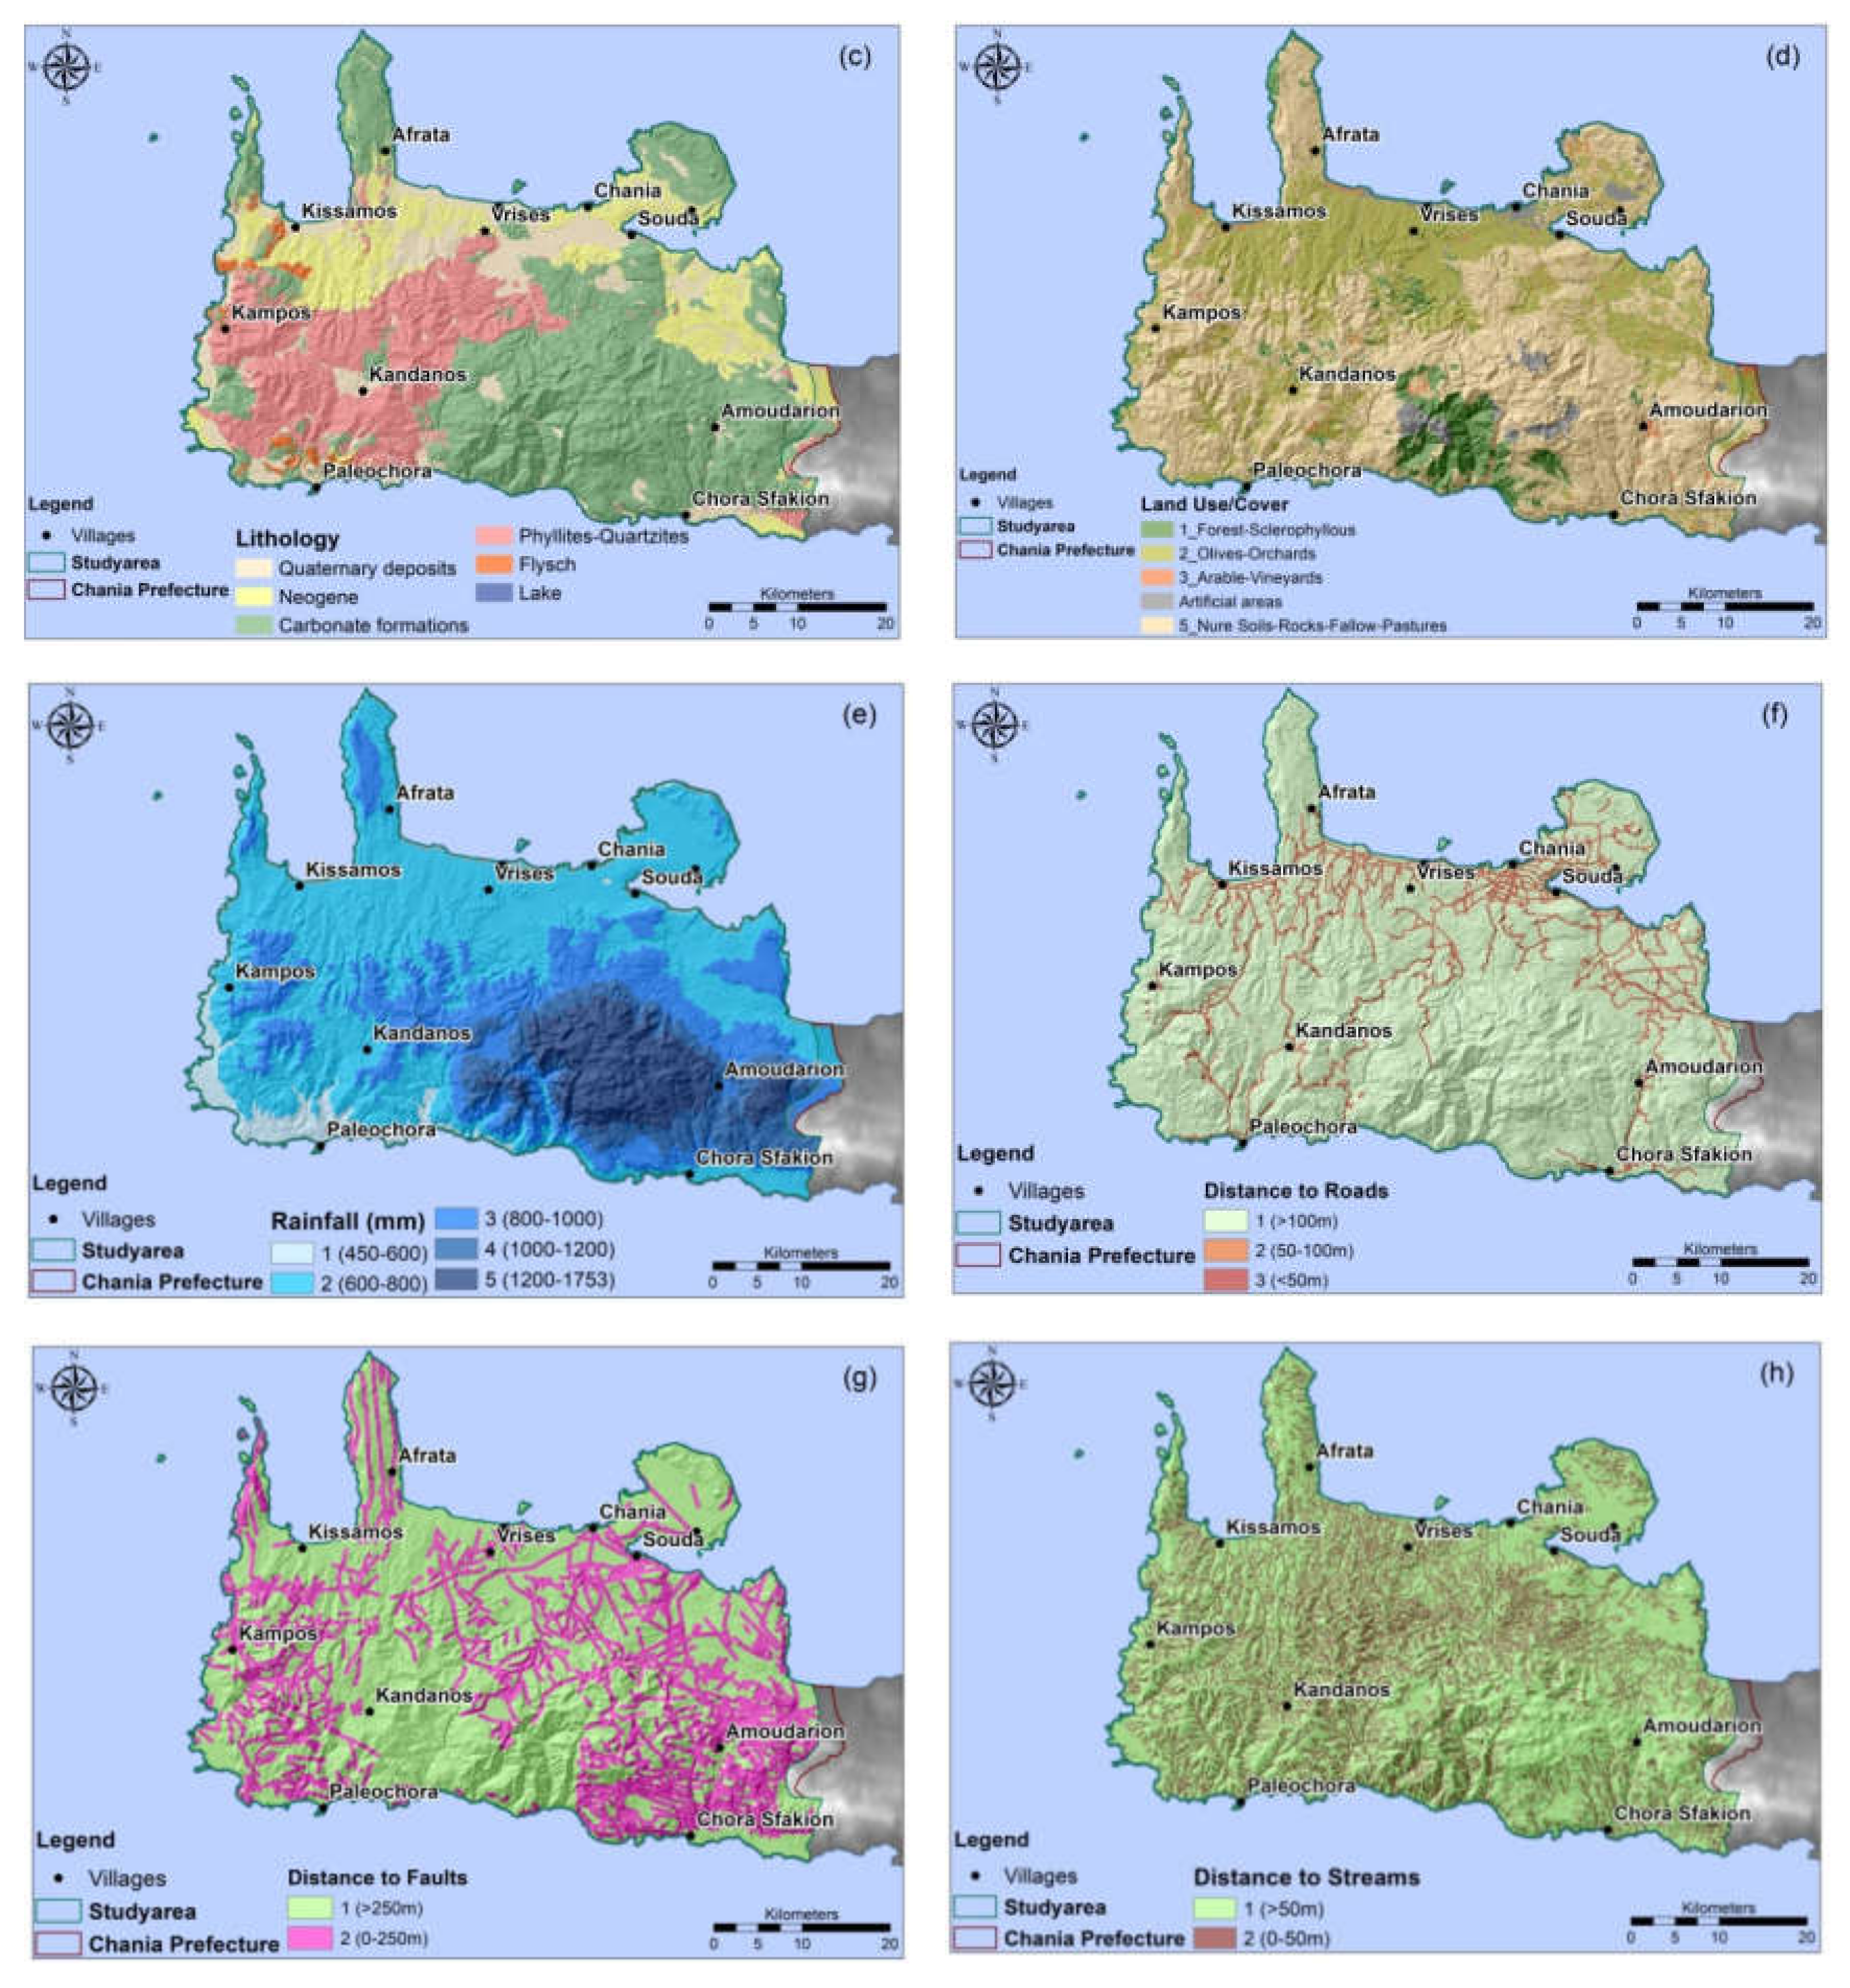
3.2.4. Causal Factors—Geospatial Database
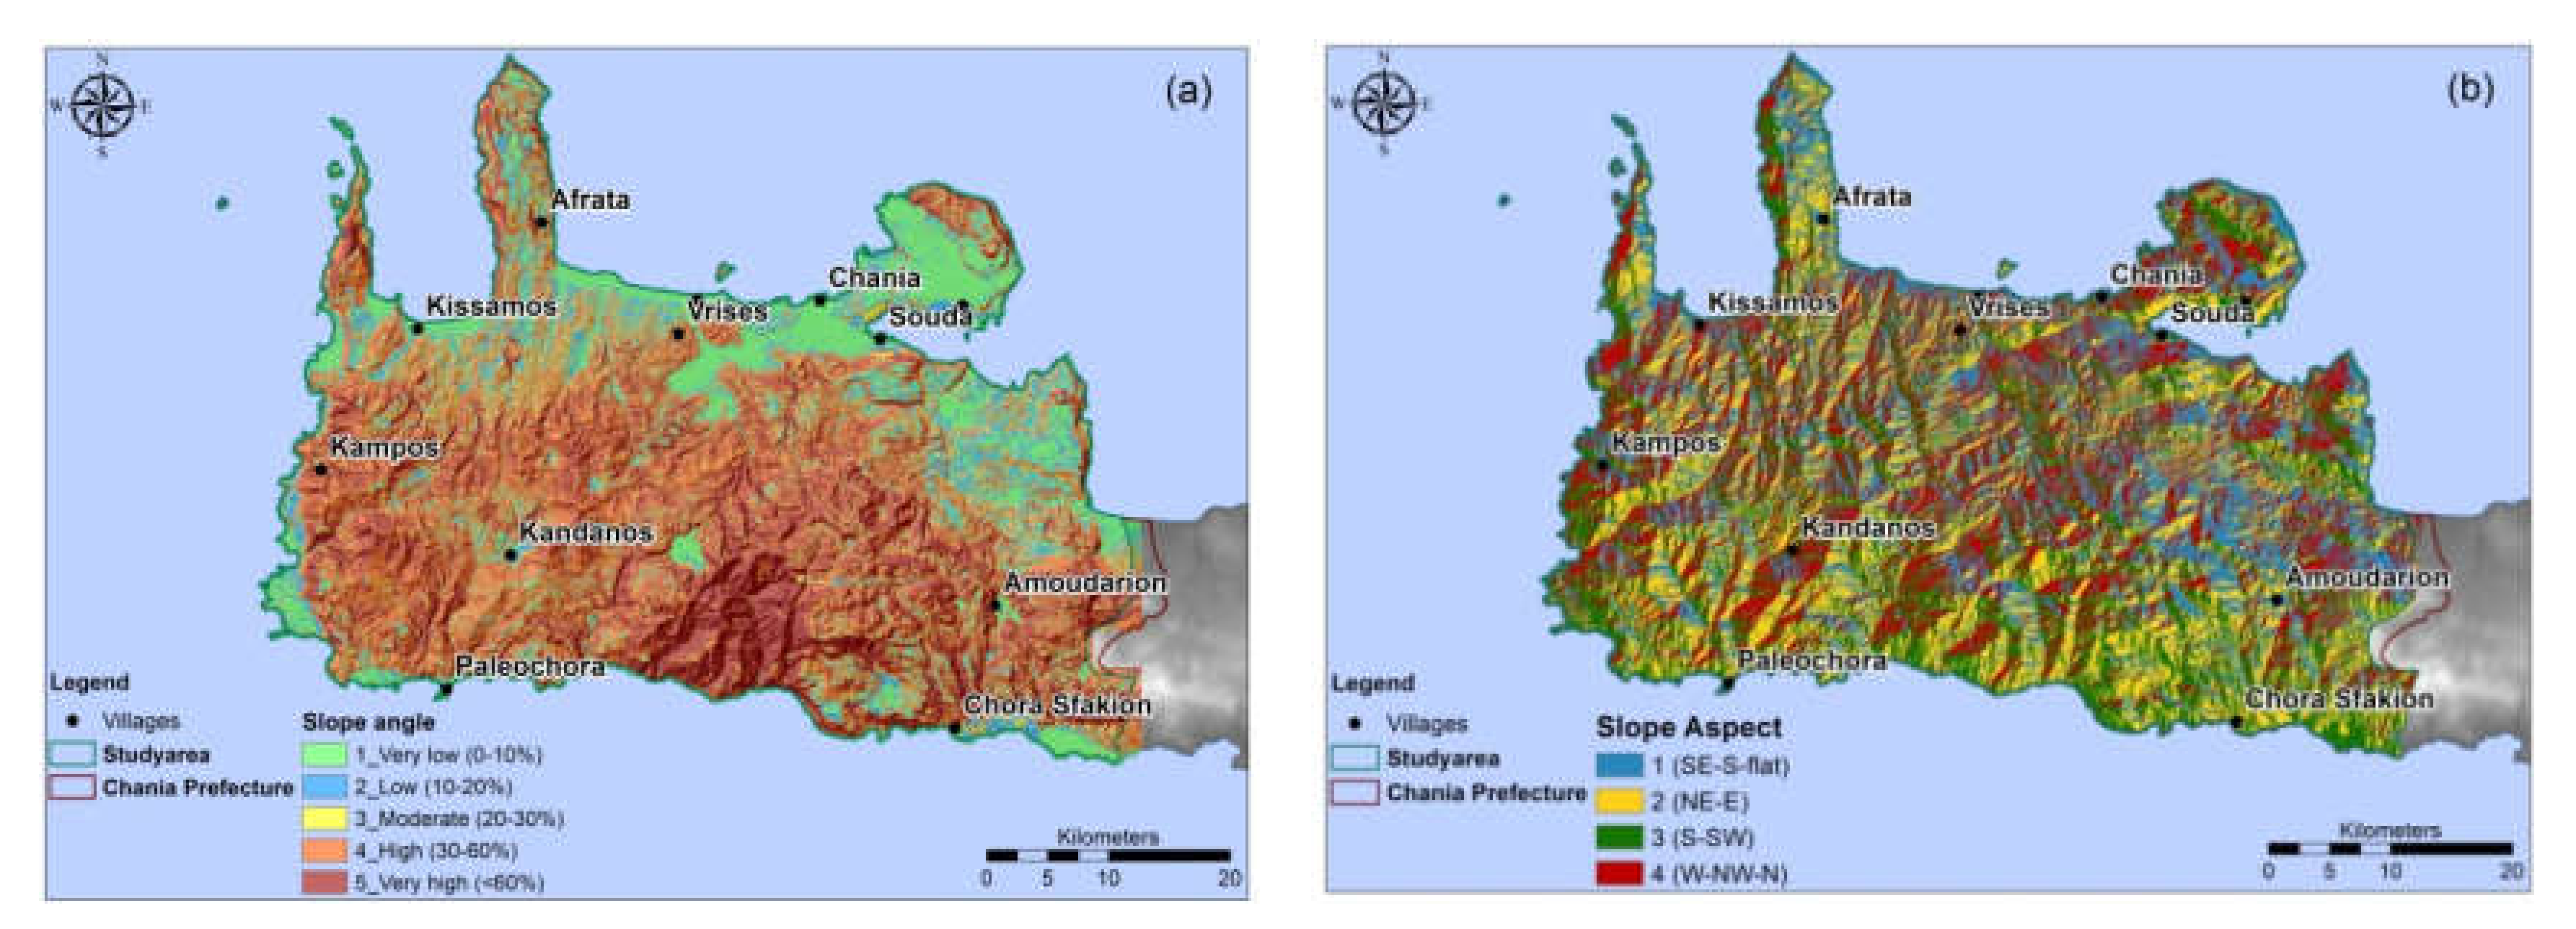
Topographic Factors
Geological Units and Land Cover Factors
Mean Annual Precipitation
Proximity Parameters
3.2.5. Weights Factor Analysis based on AHP
3.2.6. Landslide Susceptibility Index (LSI)
4. Results
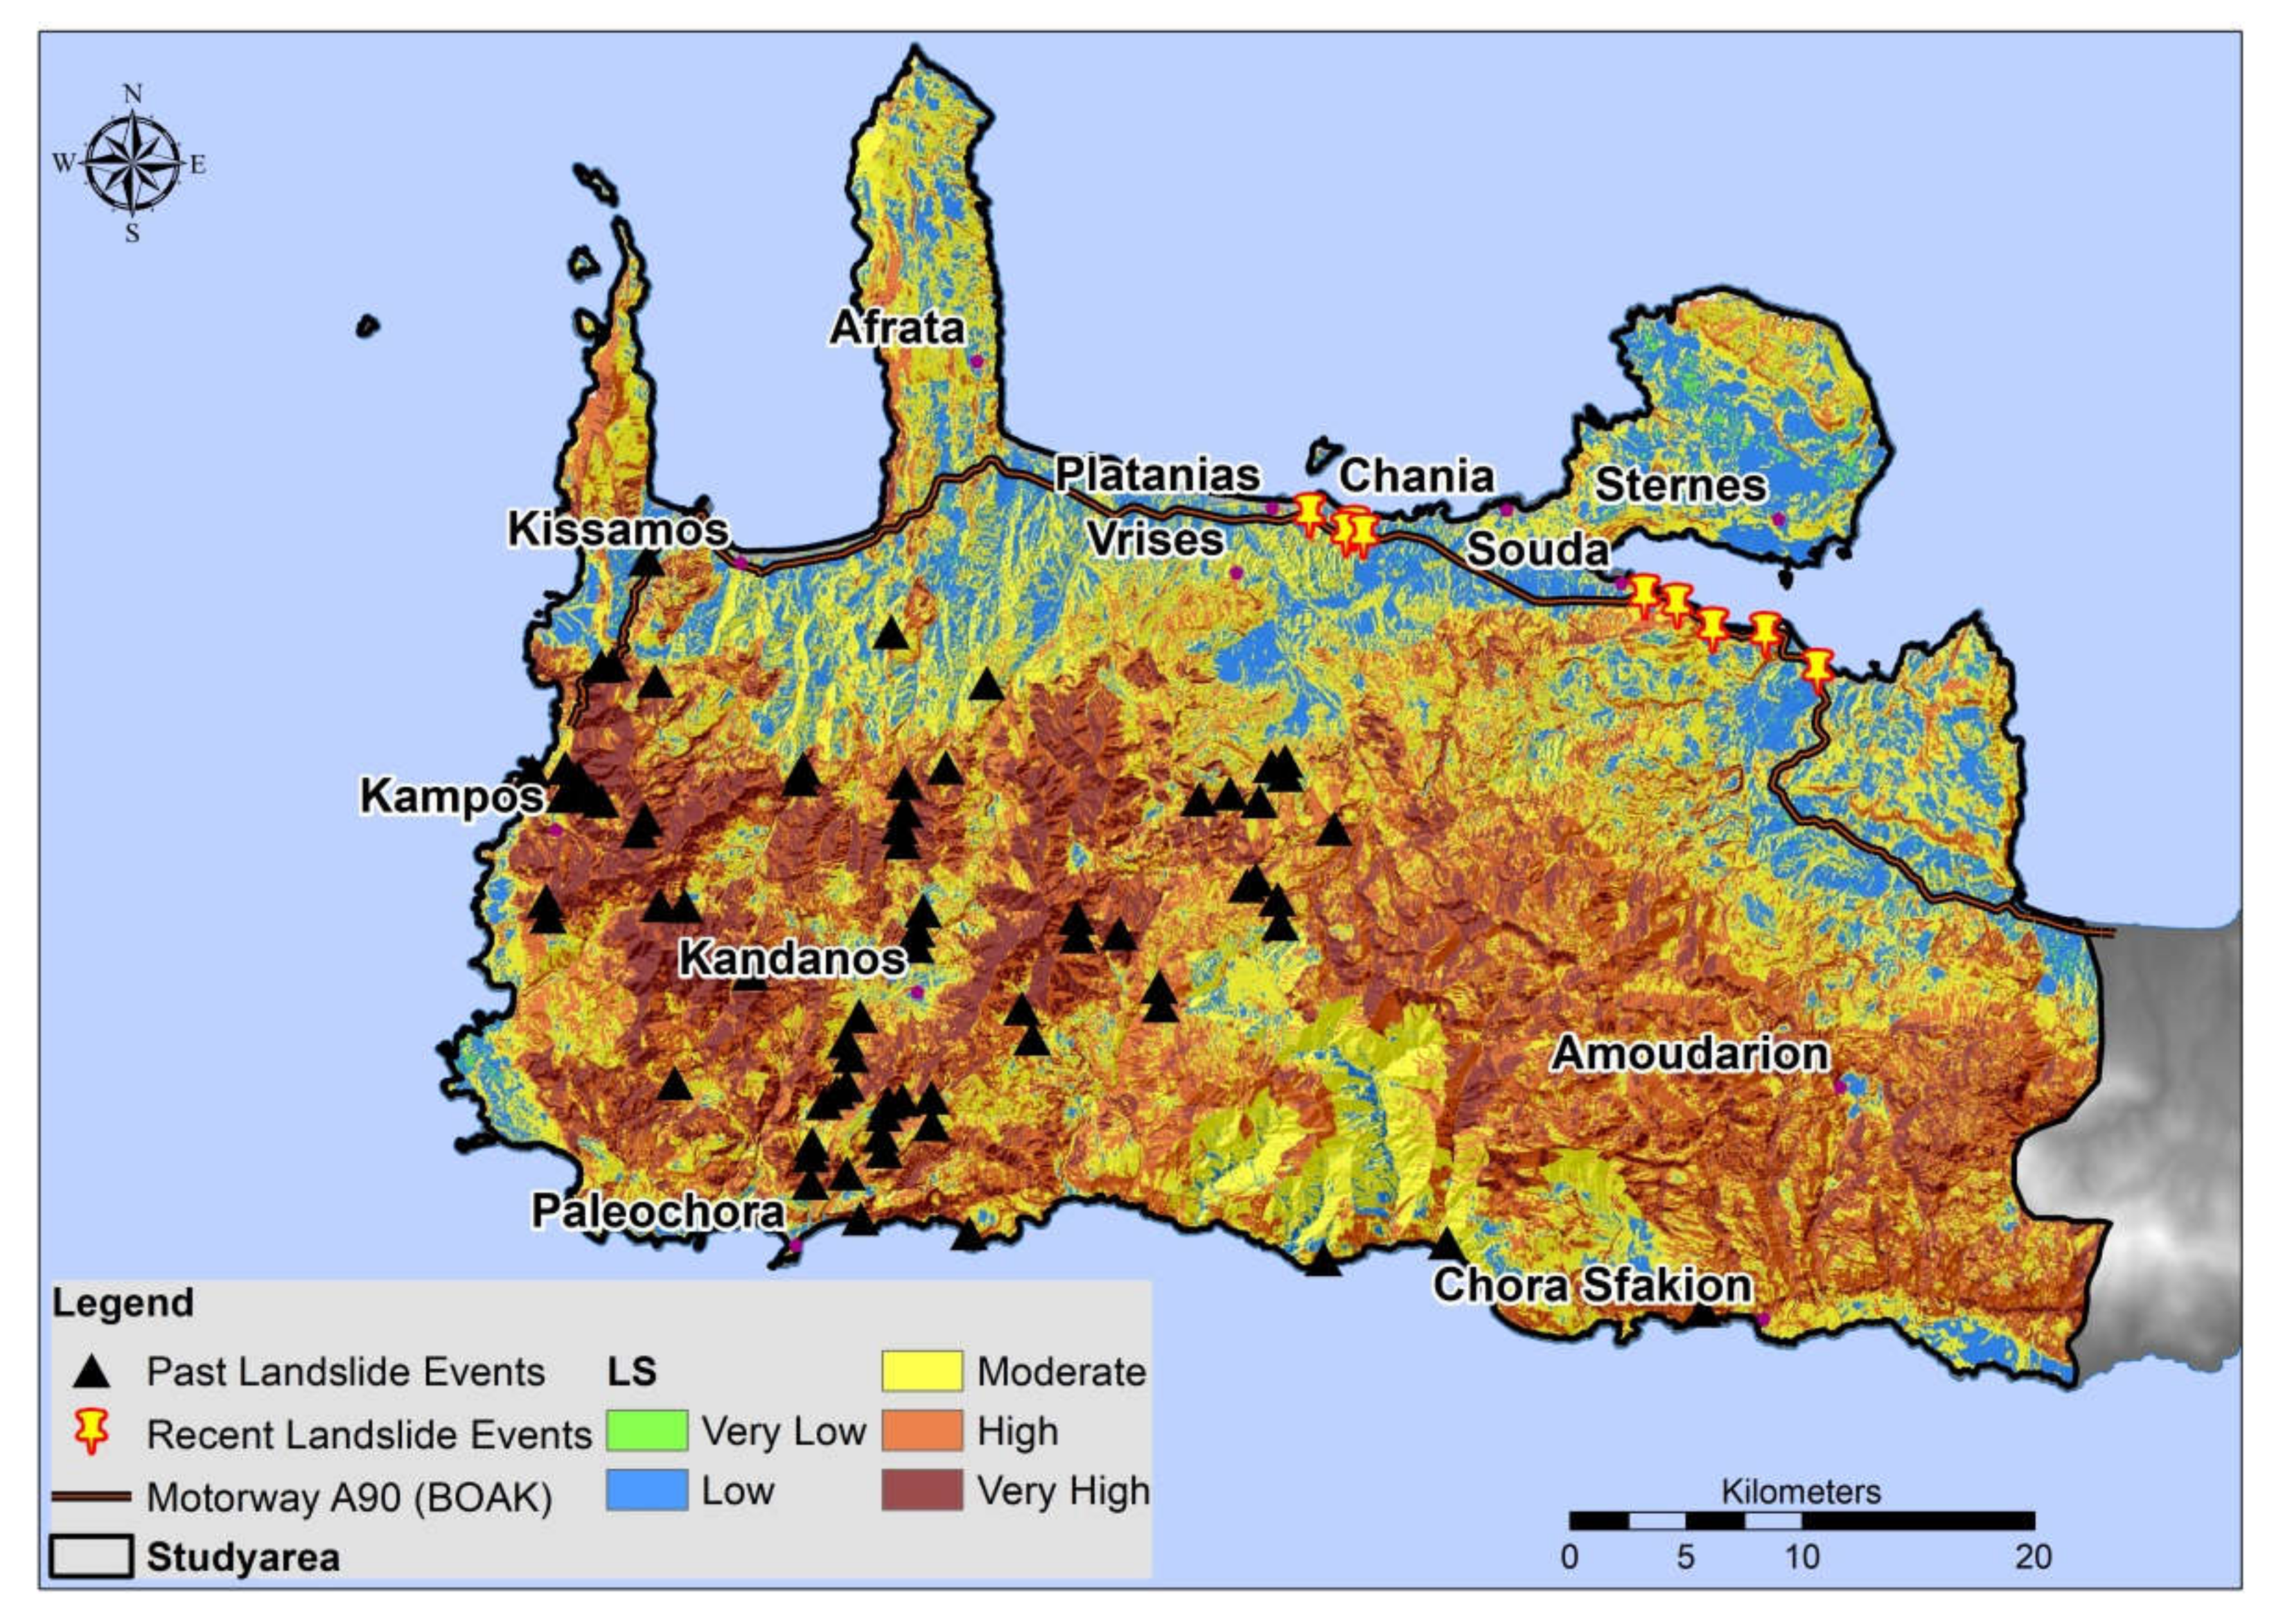
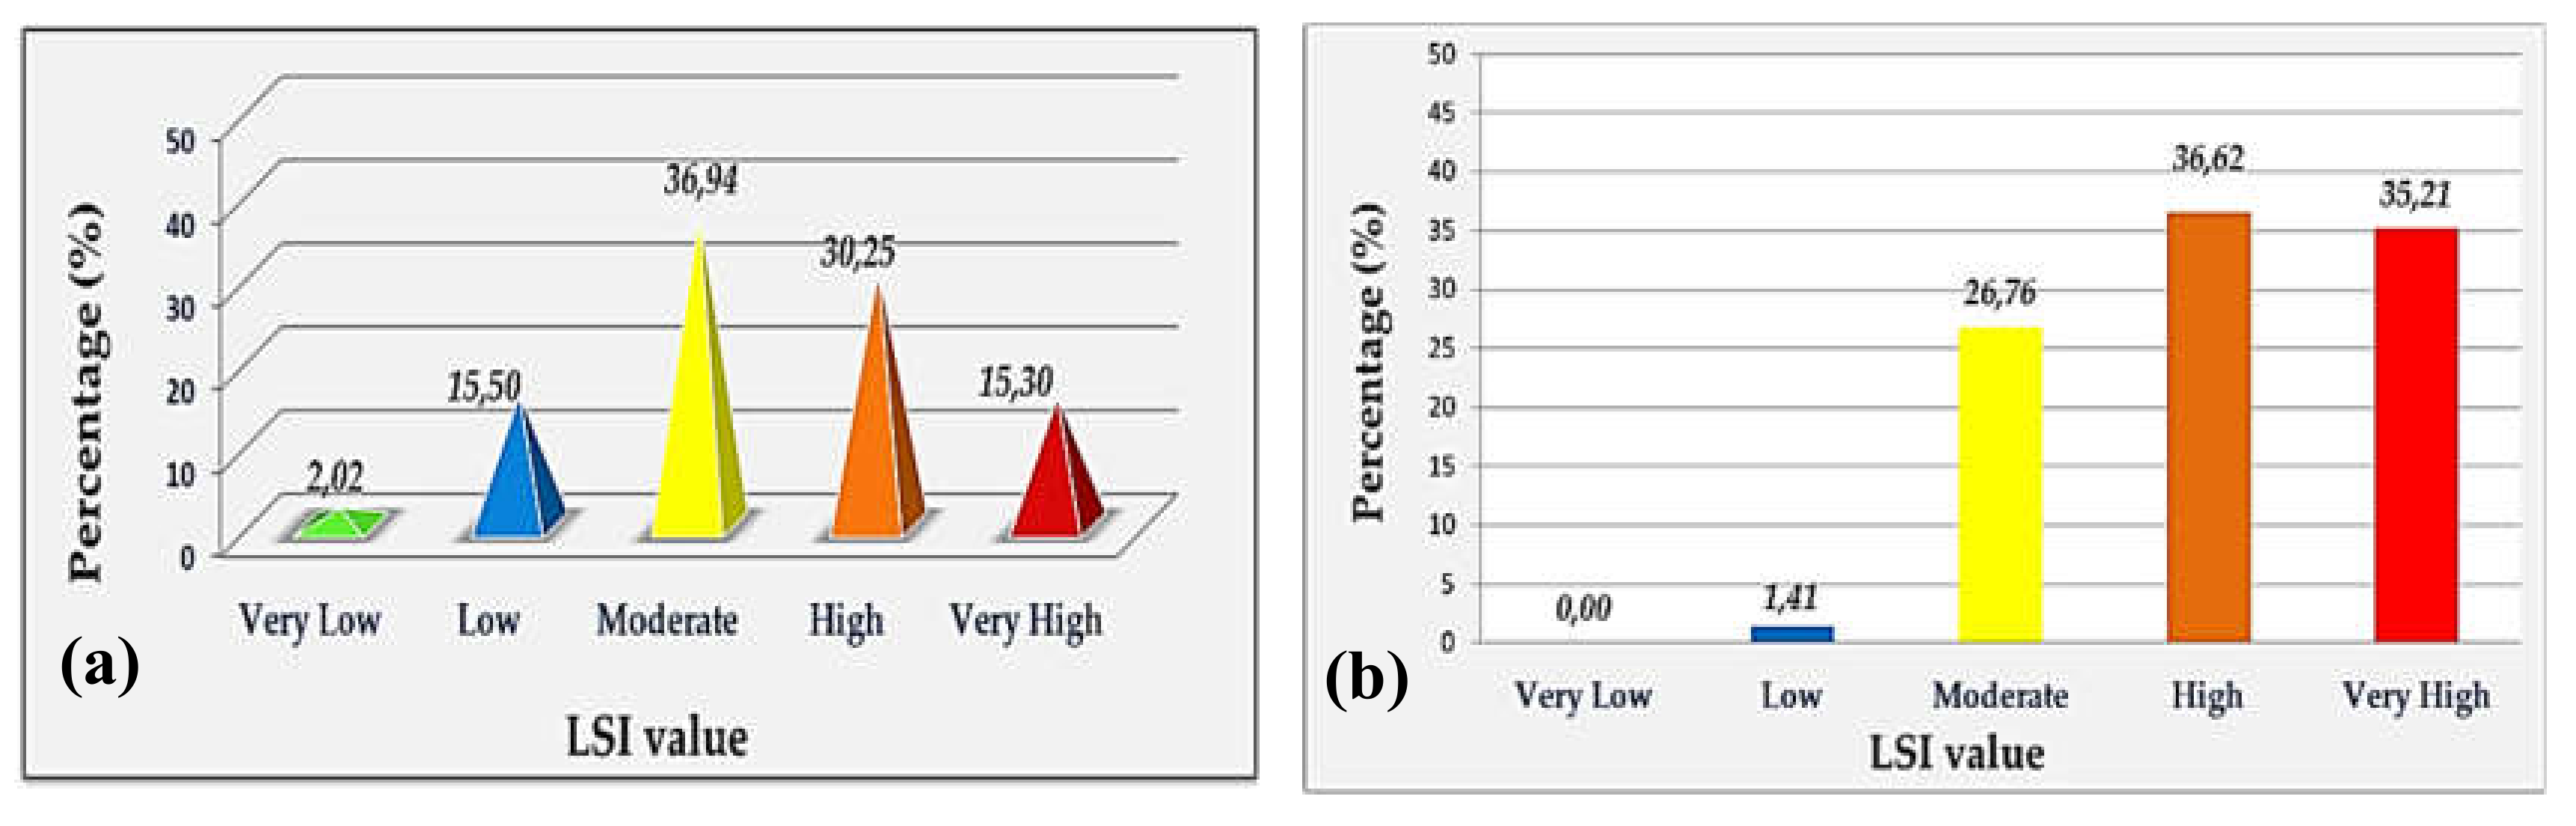
4.1. Landslide Susceptibility Index—Study Area (Chania Prefecture)
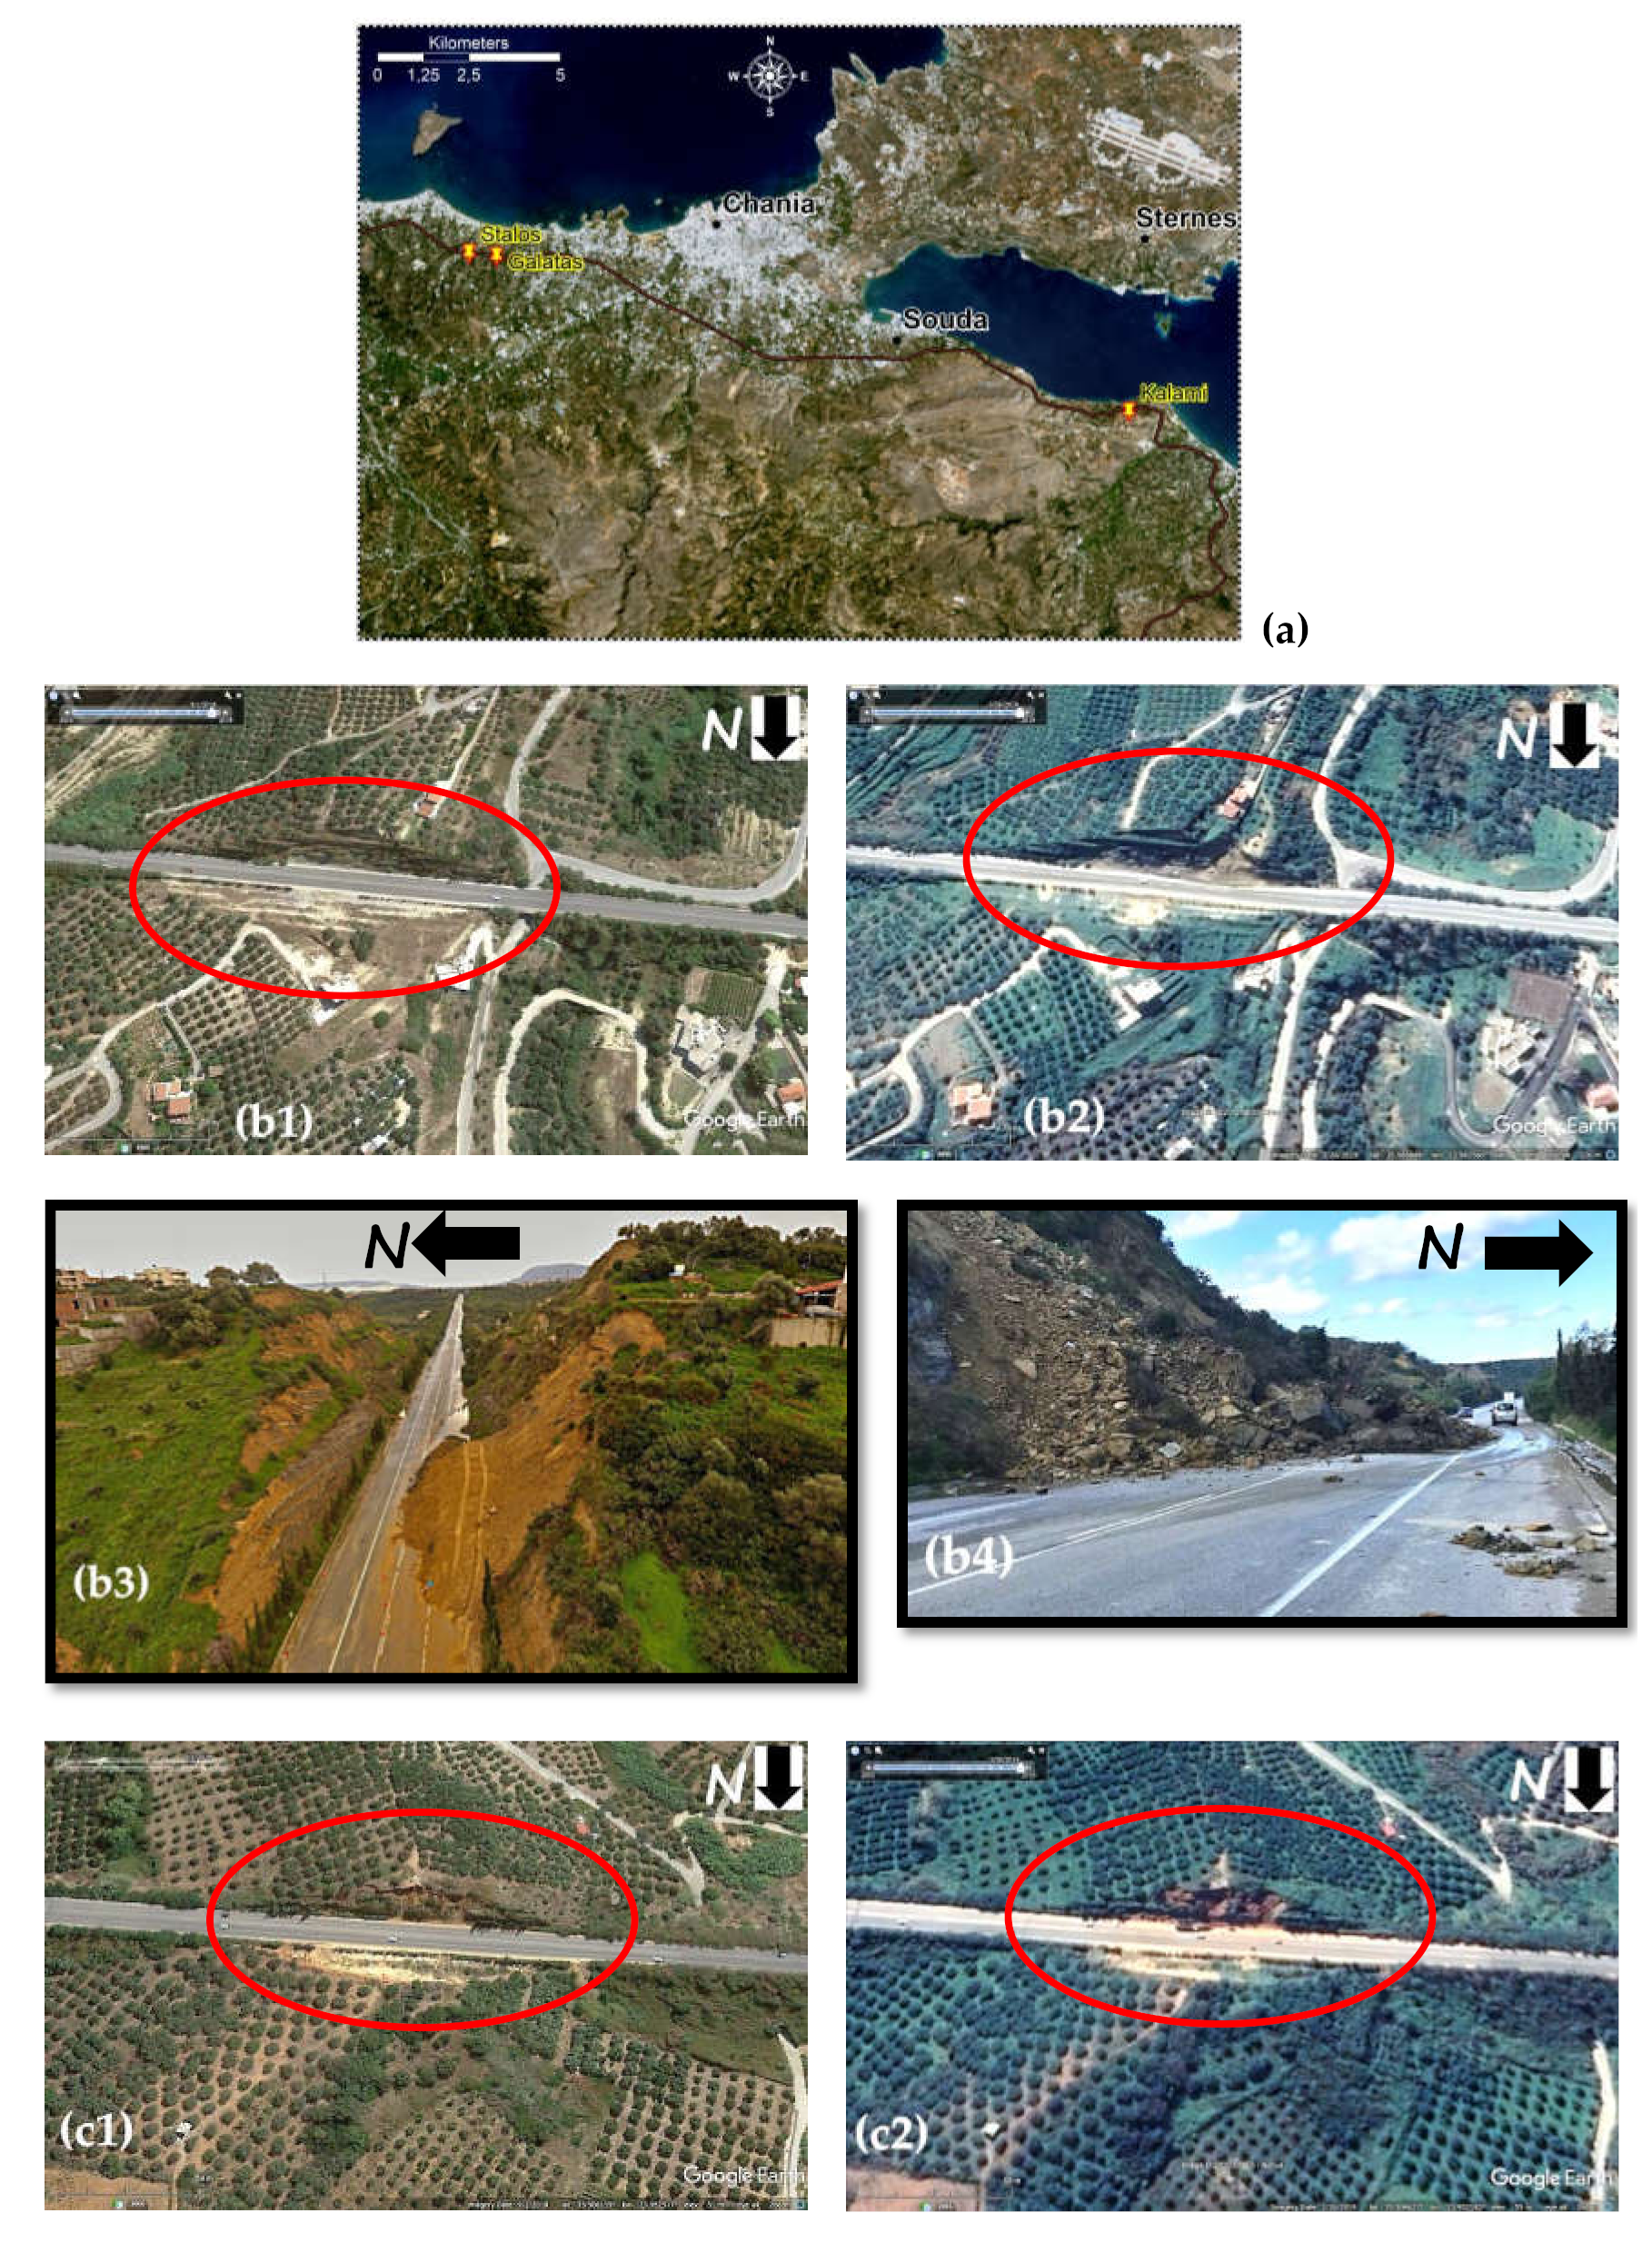
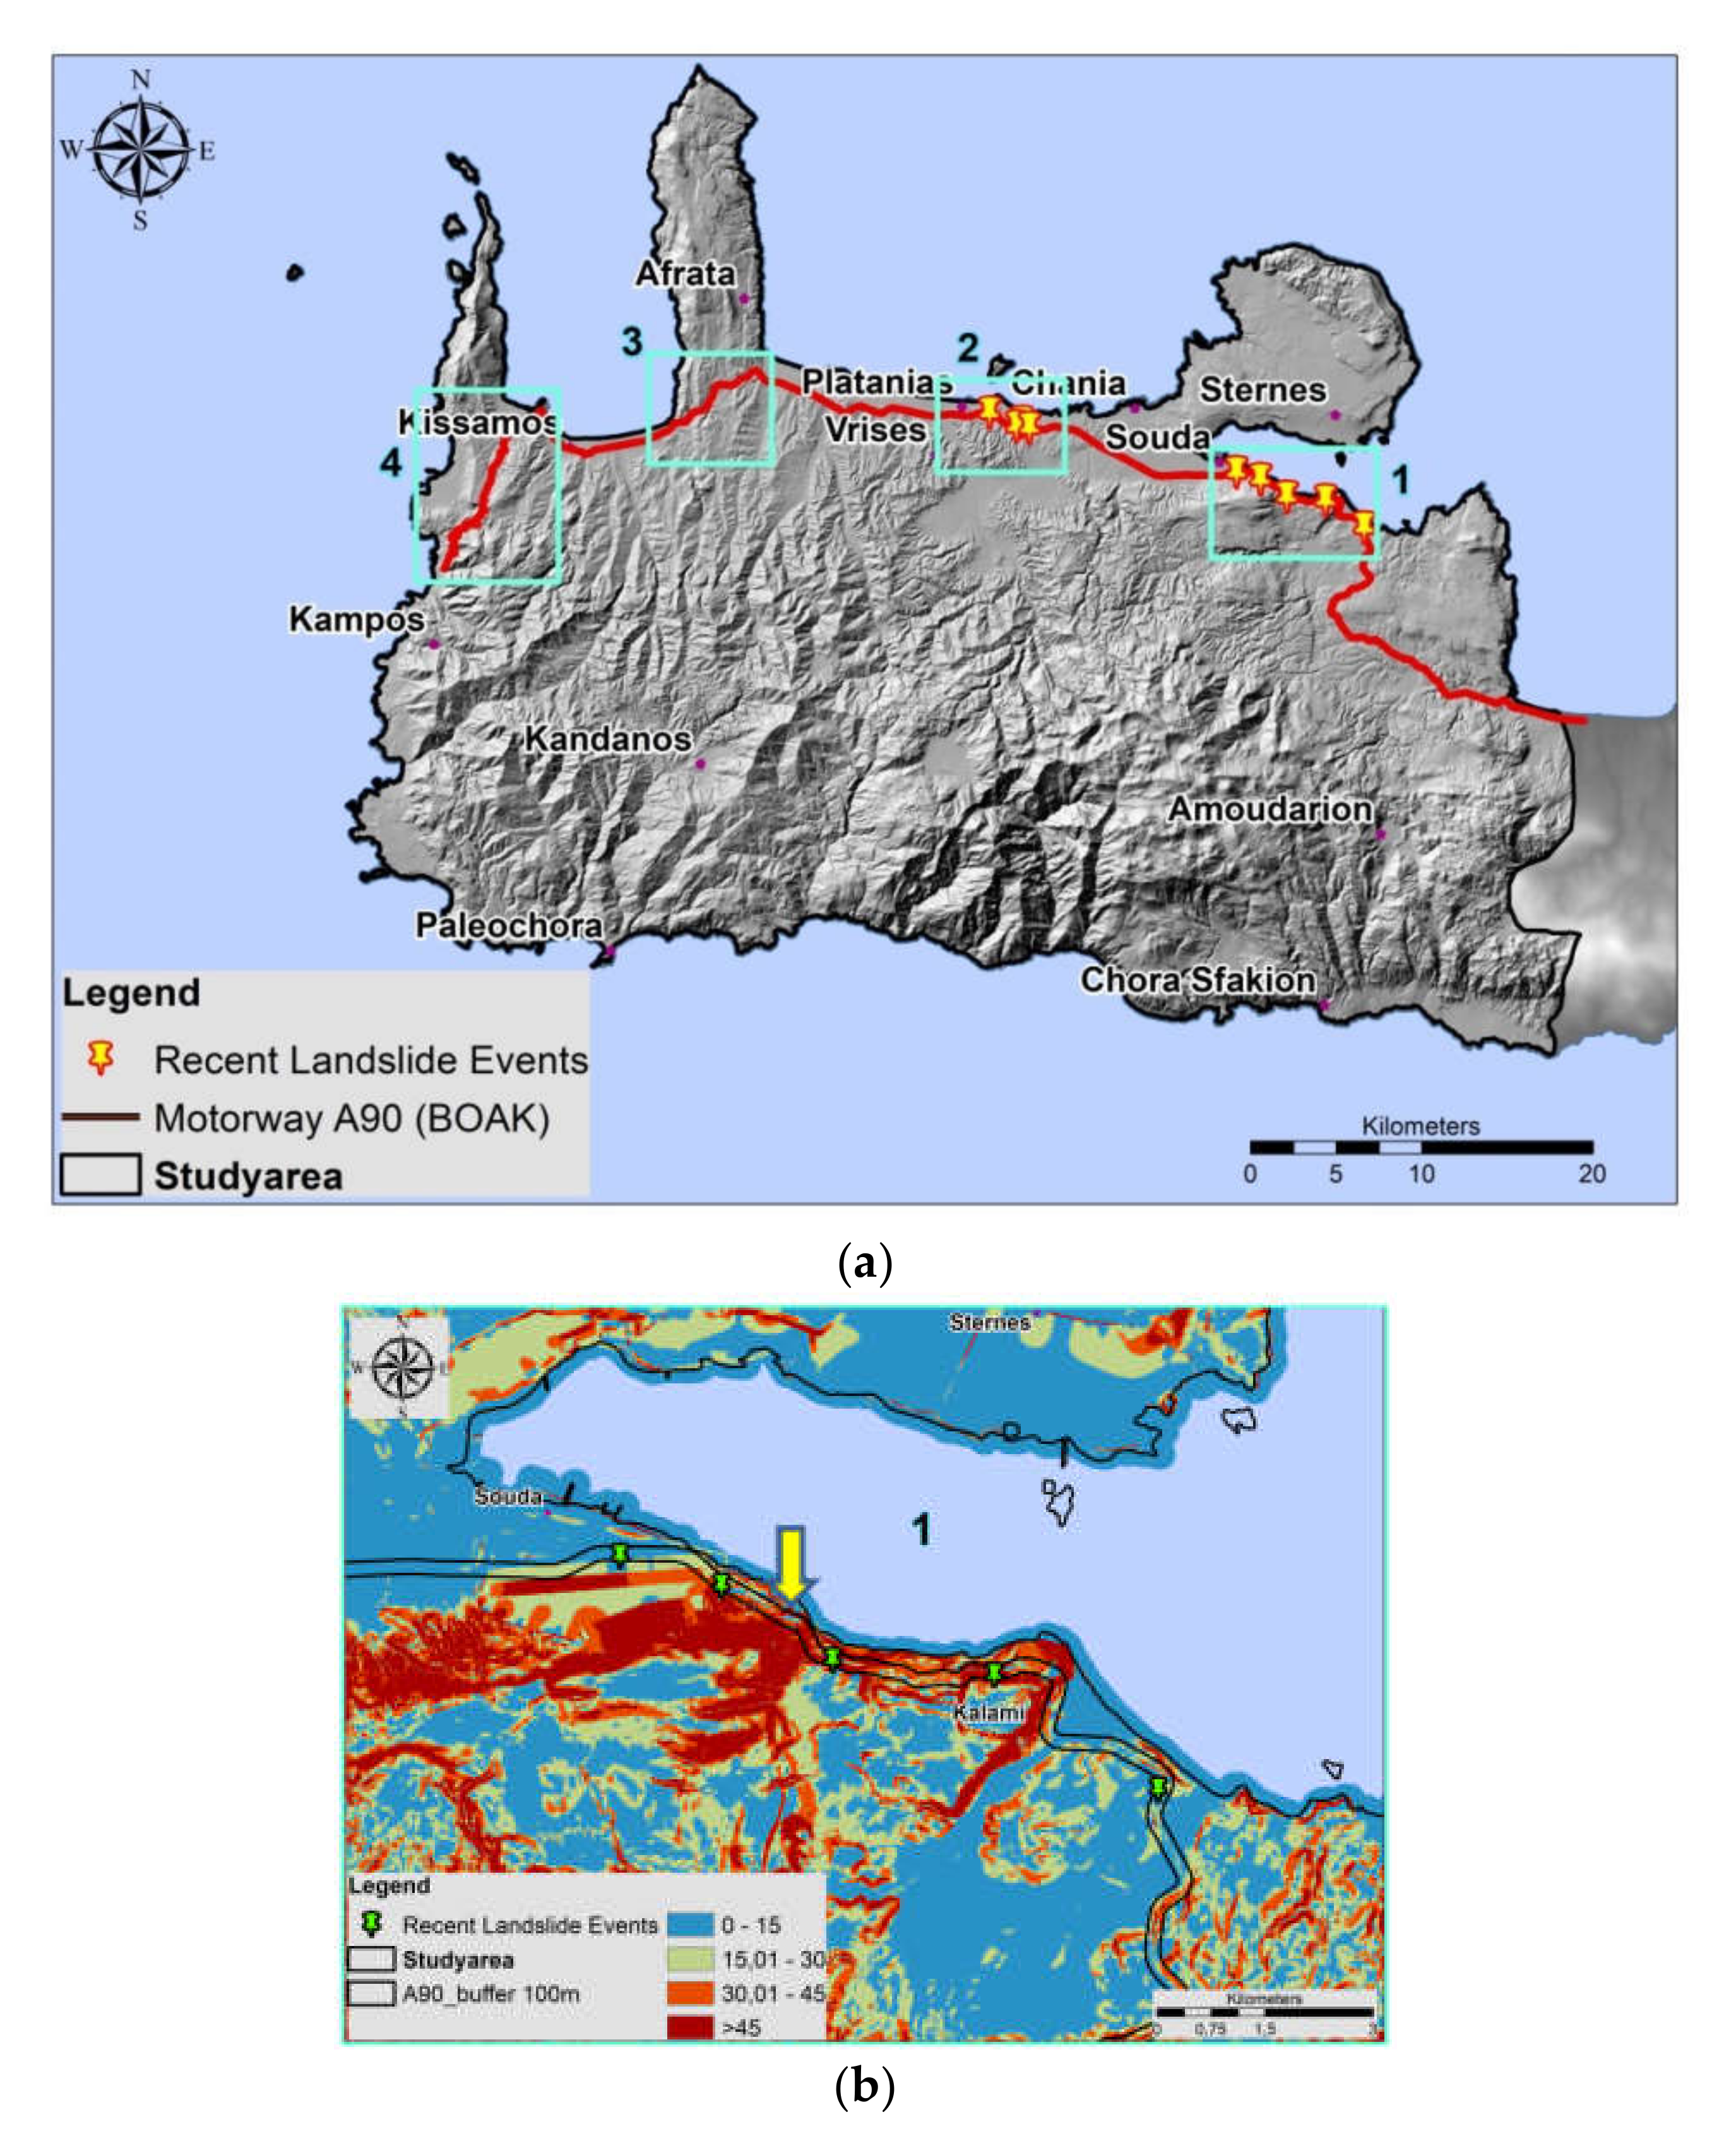
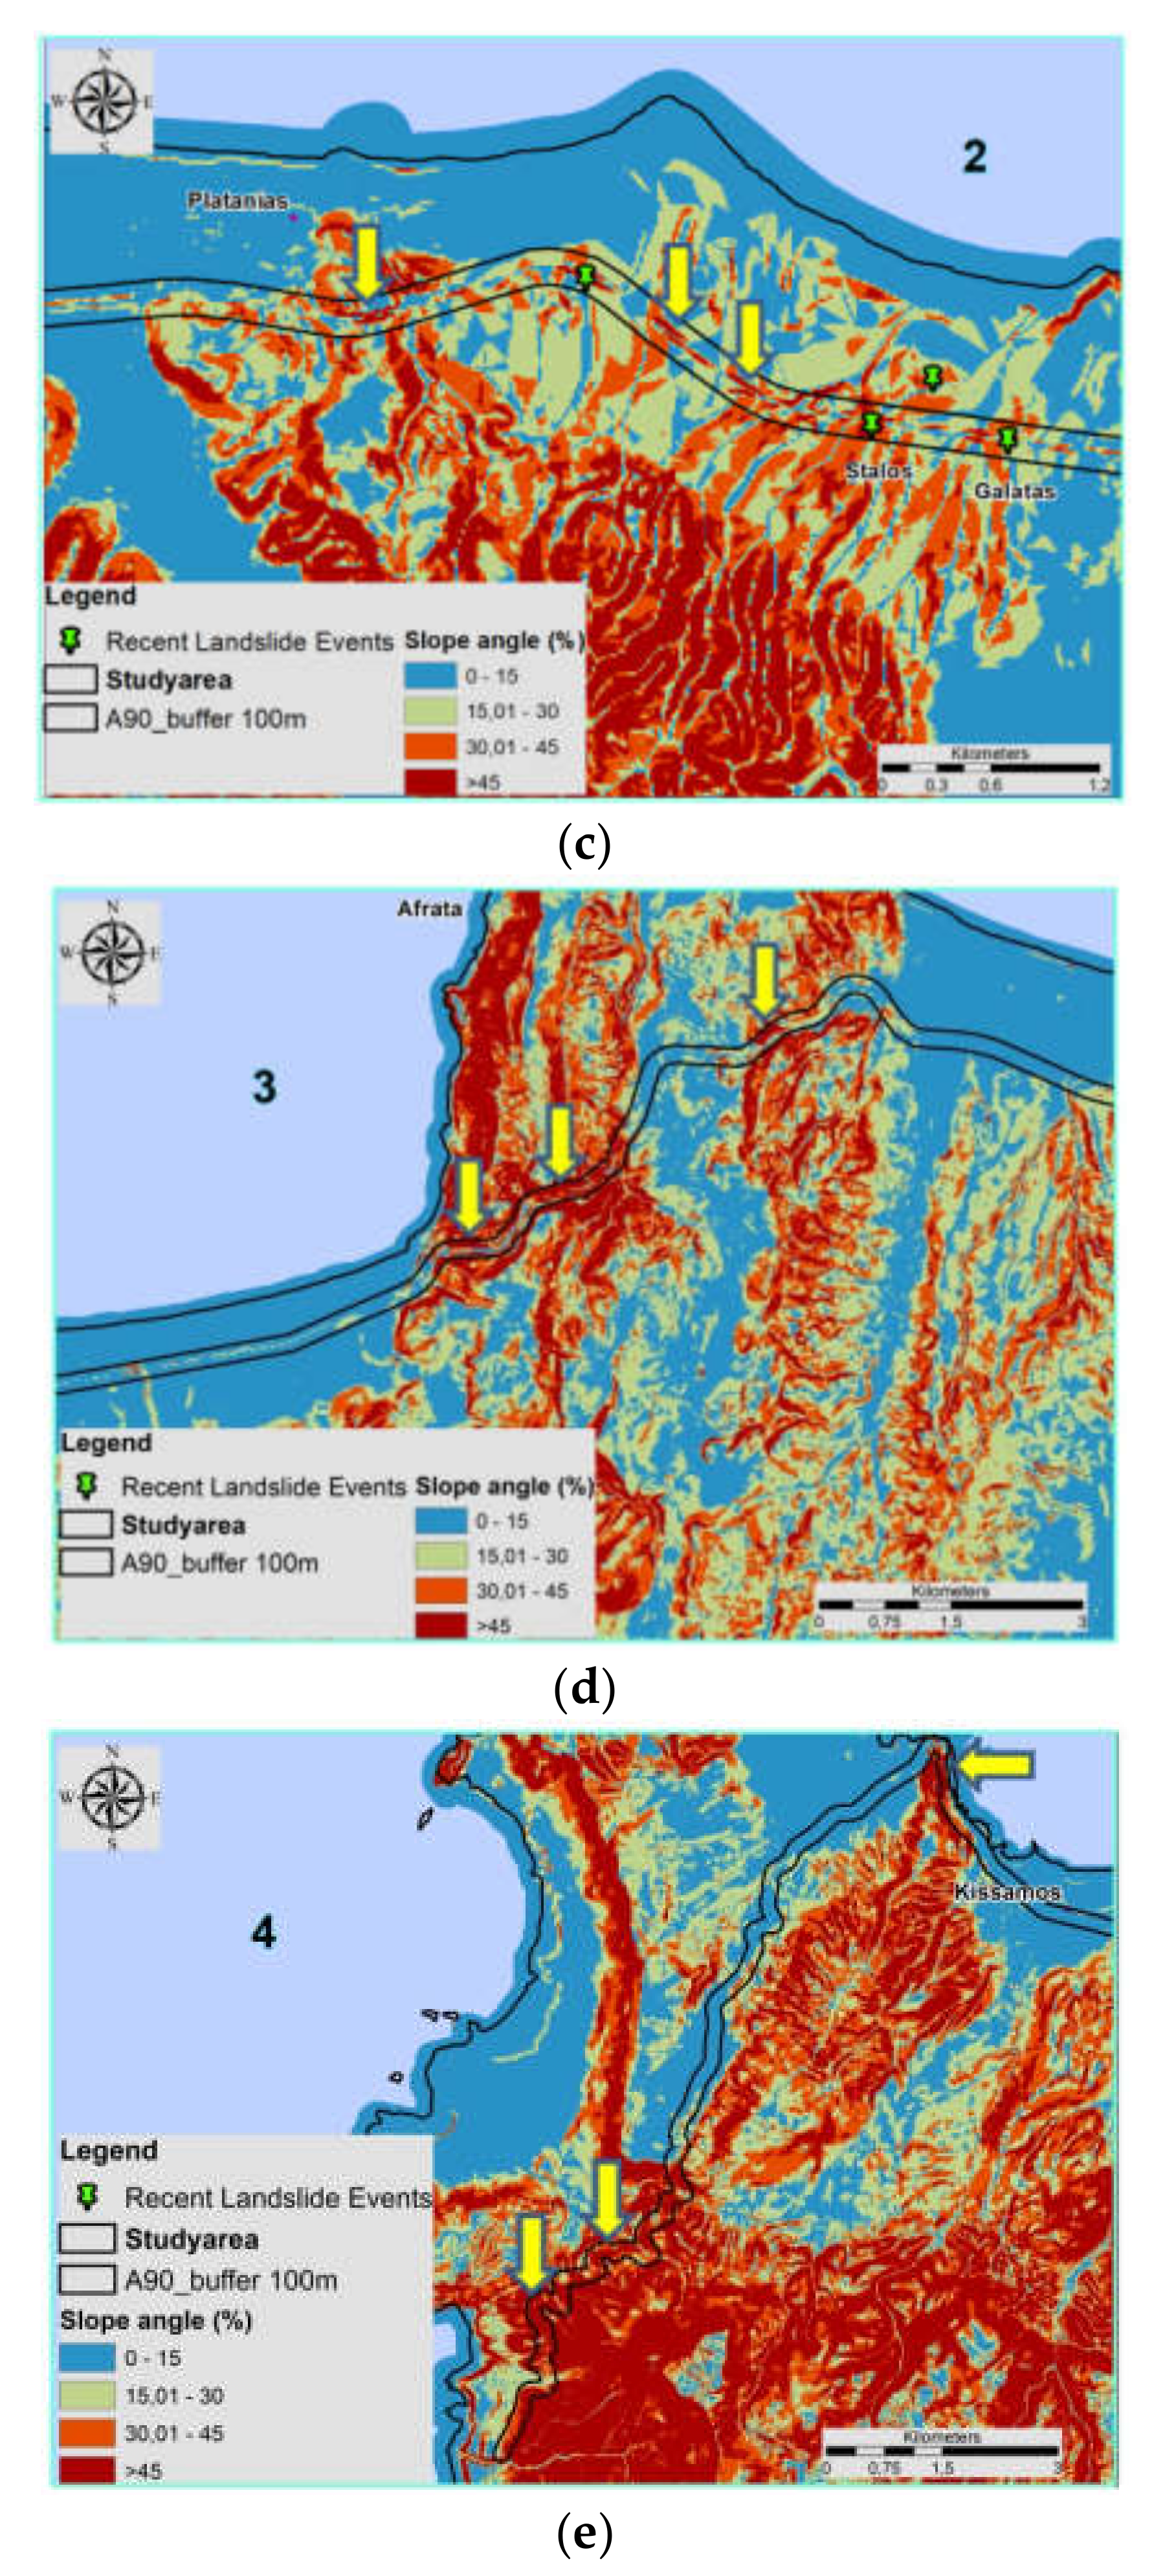
4.2. Landslide Susceptibility Index(LSIm)—A90 Motorway
4.3. EO Data in Landslide Detection
5. Discussion
6. Conclusions
Author Contributions
Funding
Conflicts of Interest
References
- Schuster, R.L.; Fleming, R.W. Economic Losses and Fatalities Due to Landslides. Environ. Eng. Geosci. 1986, 23, 11–28. [Google Scholar] [CrossRef]
- Rozos, D.; Bathrellos, G.D.; Skilodimou, H.D. Comparison of the implementation of rock engineering system and analytic hierarchy process methods, upon landslide susceptibility mapping, using GIS: A case study from the Eastern Achaia County of Peloponnesus, Greece. Environ. Earth Sci. 2011, 63, 49–63. [Google Scholar] [CrossRef]
- Chen, W.; Pourghasemi, H.R.; Naghibi, S.A. A comparative study of landslide susceptibility maps produced using support vector machine with different kernel functions and entropy data mining models in China. Bull. Eng. Geol. Environ. 2017, 77, 647–664. [Google Scholar] [CrossRef]
- Zhong, C.; Liu, Y.; Chen, W.; Li, H.; Hou, Y.; Nuremanguli, T.; Ma, H. Landslide mapping with remote sensing: Challenges and opportunities. Int. J. Remote Sens. 2020, 41, 1555–1581. [Google Scholar] [CrossRef]
- Froude, M.J.; Petley, D. Global fatal landslide occurrence from 2004 to 2016. Nat. Hazards Earth Syst. Sci. 2018, 18, 2161–2181. [Google Scholar] [CrossRef] [Green Version]
- Keefer, D.K.; Larsen, M.C. Assessing Landslide Hazards. Sci. Geol. 2007, 316, 1136–1138. [Google Scholar] [CrossRef]
- Kouli, M.; Loupasakis, C.; Soupios, P.; Vallianatos, F. Landslide hazard zonation in high risk areas of Rethymno Prefecture, Crete Island, Greece. Nat. Hazards 2010, 52, 599–621. [Google Scholar] [CrossRef]
- Skilodimou, H.D.; Bathrellos, G.D.; Koskeridou, E.; Soukis, K.; Rozos, D. Physical and anthropogenic factors related to landslide activity in the Northern Peloponnese, Greece. Land 2018, 7, 85. [Google Scholar] [CrossRef] [Green Version]
- Dahal, R.K.; Hasegawa, S.; Nonomura, A.; Yamanaka, M.; Masuda, T.; Nishino, K. GIS-based Weights-of-Evidence modelling of rainfall-induced landslides in small catchments for landslide susceptibility mapping. Environ. Geol. 2008, 54, 311–324. [Google Scholar] [CrossRef]
- Liu, C.N.; Wu, C.C. Mapping susceptibility of rainfall-triggered shallow landslides using a probabilistic approach. Environ. Geol. 2008, 55, 907–915. [Google Scholar] [CrossRef]
- Arnone, E.; Dialynas, Y.G.; Noto, L.V.; Bras, R.L. Accounting for soil parameter uncertainty in a physically based and distributed approach for rainfall-triggered landslides. Hydrol. Process. 2016, 30, 927–944. [Google Scholar] [CrossRef]
- Negi, H.S.; Kumar, A.; Narasimha Rao, N.; Thakur, N.K.; Shekhar, M.S. Susceptibility assessment of rainfall induced debris flow zones in Ladakh–Nubra region, Indian Himalaya. J. Earth Syst. Sci. 2020, 129, 30. [Google Scholar] [CrossRef]
- Wang, S.; Zhang, K.; Van Beek, L.P.H.; Tian, X.; Bogaard, T.A. Physically-based landslide prediction over a large region: Scaling low-resolution hydrological model results for high-resolution slope stability assessment. Environ. Model. Softw. 2020, 124, 104607. [Google Scholar] [CrossRef]
- Sabatakakis, N.; Koukis, G.; Mourtas, D. Composite landslides induced by heavy rainfalls in suburban areas: City of Patras and surrounding area, western Greece. Landslides 2005, 2, 202–211. [Google Scholar] [CrossRef]
- Mendes, R.M.; De Andrade, M.R.M.; Tomasella, J.; de Moraes, M.A.E.; Scofield, G.B. Understanding shallow landslides in Campos do Jordão municipality-Brazil: Disentangling the anthropic effects from natural causes in the disaster of 2000. Nat. Hazards Earth Syst. Sci. 2018, 18, 15–30. [Google Scholar] [CrossRef] [Green Version]
- Bozzano, F.; Cipriani, I.; Mazzanti, P.; Prestininzi, A. Displacement patterns of a landslide affected by human activities: Insights from ground-based InSAR monitoring. Nat. Hazards 2011, 59, 1377–1396. [Google Scholar] [CrossRef]
- Guzzetti, F.; Carrara, A.; Cardinali, M.; Reichenbach, P. Landslide hazard evaluation: A review of current techniques and their application in a multi-scale study, Central Italy. Geomorphology 1999, 31, 181–216. [Google Scholar] [CrossRef]
- Van Westen, C.J.; Castellanos, E.; Kuriakose, S.L. Spatial data for landslide susceptibility, hazard, and vulnerability assessment: An overview. Eng. Geol. 2008, 102, 112–131. [Google Scholar] [CrossRef]
- Reichenbach, P.; Rossi, M.; Malamud, B.D.; Mihir, M.; Guzzetti, F. A review of statistically-based landslide susceptibility models. Earth Sci. Rev. 2018, 180, 60–91. [Google Scholar] [CrossRef]
- Casagli, N.; Frodella, W.; Morelli, S.; Tofani, V.; Ciampalini, A.; Intrieri, E.; Raspini, F.; Rossi, G.; Tanteri, L.; Lu, P. Spaceborne, UAV and ground-based remote sensing techniques for landslide mapping, monitoring and early warning. Geoenviron. Dis. 2017, 4, 9. [Google Scholar] [CrossRef]
- Brabb, E.E. Innovative approaches to landslide hazard and risk mapping. In Proceedings of the 4th International Symposium on Landslides; Canadian Geotechnical Society: Toronto, Canada, 1984; Volume 1, pp. 307–324. [Google Scholar]
- Sabatakakis, N.; Koukis, G.; Vassiliades, E.; Lainas, S. Landslide susceptibility zonation in Greece. Nat. Hazards 2013, 65, 523–543. [Google Scholar] [CrossRef]
- Kouli, M.; Loupasakis, C.; Soupios, P.; Rozos, D.; Vallianatos, F. Comparing multi-criteria methods for landslide susceptibility mapping in Chania Prefecture, Crete Island, Greece. Nat. Hazards Earth Syst. Sci. Discuss 2013, 1, 73–109. [Google Scholar] [CrossRef] [Green Version]
- Kouli, M.; Loupasakis, C.; Soupios, P.; Rozos, D.; Vallianatos, F. Landslide susceptibility mapping by comparing the WLC and WofE multi-criteria methods in the West Crete Island, Greece. Environ. Earth Sci. 2014, 72, 5197–5219. [Google Scholar] [CrossRef]
- Dai, F.C.; Lee, C.F.; Ngai, Y.Y. Landslide risk assessment and management: An overview. Eng. Geol. 2002, 64, 65–87. [Google Scholar] [CrossRef]
- Tsangaratos, P.; Rozos, D. Producing landslide susceptibility maps by applying expert knowledge in a GIS—Based environment. Bull. Geol. Soc. Greece 2013, 47, 1539–1549. [Google Scholar] [CrossRef]
- Aleotti, P.; Chowdhury, R. Landslide hazard assessment: Summary review and new perspectives. Bull. Eng. Geol. Environ. 1999, 58, 21–44. [Google Scholar] [CrossRef]
- Pradhan, B. Landslide Susceptibility mapping of a catchment area using frequency ratio, fuzzy logic and multivariate logistic regression approaches. J. Indian Soc. Remote Sens. 2010, 38, 301–320. [Google Scholar] [CrossRef]
- Cruz, C.J. Assessing Landslide Susceptibility with GIS Using Qualitative & Quantitative Methods on Knox County, Nebraska. Theses & Dissertations in Geography, 30. 2017. Available online: http://digitalcommons.unl.edu/geographythesis/30 (accessed on 5 March 2020).
- Can, A.; Dagdelenler, G.; Ercanoglu, M.; Sonmez, H. Landslide susceptibility mapping at Ovacık-Karabük (Turkey) using different artificial neural network models: Comparison of training algorithms. Bull. Eng. Geol. Environ. 2019, 78, 89–102. [Google Scholar] [CrossRef]
- Kavoura, K.; Sabatakakis, N. Investigating landslide susceptibility procedures in Greece. Landslides 2020, 17, 127–145. [Google Scholar] [CrossRef]
- Carrara, A.; Cardinali, M.; Guzzetti, F. Uncertainty in assessing landslide hazard and risk. ITC J. 1992, 2, 172–183. [Google Scholar]
- Clerici, A.; Perego, S.; Tellini, C.; Vesconi, P. Landslide failure and runout susceptibility in the upper T. Ceno valley (Northern Apennines, Italy). Nat. Hazards 2010, 52, 1–29. [Google Scholar] [CrossRef]
- Tsangaratos, P.; Ilia, I. Comparison of a logistic regression and Naïve Bayes classifier in landslide susceptibility assessments: The influence of models complexity and training dataset size. Catena 2016, 145, 164–179. [Google Scholar] [CrossRef]
- Chauhan, S.; Sharma, M.; Arora, M.K. Landslide susceptibility zonation of the Chamoli region, Garhwal Himalayas, using logistic regression model. Landslides 2010, 7, 411. [Google Scholar] [CrossRef]
- Chalkias, C.; Kalogirou, S.; Ferentinou, M. Landslide susceptibility, Peloponnese Peninsula in South Greece. J. Maps 2014, 10, 211–222. [Google Scholar] [CrossRef]
- Hervás, J.; Bobrowsky, P. Mapping: Inventories, Susceptibility, Hazard and Risk. Chapter 19. In Landslides—Disaster Risk Reduction; Sassa, K., Canuti, P., Eds.; Springer: Berlin, Germany, 2009; p. 321349. [Google Scholar]
- Yalcin, A.; Reis, S.; Aydinoglu, A.C.; Yomralioglu, T. A GIS-based comparative study of frequency ratio, analytical hierarchy process, bivariate statistics and logistics regression methods for landslide susceptibility mapping in Trabzon, NE Turkey. Catena 2011, 85, 274–287. [Google Scholar] [CrossRef]
- Kayastha, P.; Dhital, M.R.; De Smedt, F. Application of the analytical hierarchy process (AHP) for landslide susceptibility mapping: A case study from the Tinau watershed, west Nepal. Comput. Geosci. 2013, 52, 398–408. [Google Scholar] [CrossRef]
- Achour, Y.; Boumezbeur, A.; Hadji, R.; Chouabbi, A.; Cavaleiro, V.; Bendaoud, E.A. Landslide susceptibility mapping using analytic hierarchy process and information value methods along a highway road section in Constantine, Algeria. Arab. J. Geosci. 2017, 10, 194. [Google Scholar] [CrossRef]
- Moon, A.T.; Olds, R.J.; Wilson, R.A.; Burman, B.C. Debris flow zoning at Montrose, Victoria. In Proceedings of the 6th International Symposium on Landslides; Bell, D.H., Ed.; Balkema Rotterdam: Rotterdam, The Netherlands, 1992; Volume 2, pp. 1015–1022. [Google Scholar]
- Fell, R.; Walker, B.F.; Finlay, P.J. Estimating the probability of landsliding. In Proceedings of the 7th Australian/New Zealand Conference on Geomechanics, Adelaide; Institution of Engineers: Canberra, Australia, 1996; pp. 304–311. [Google Scholar]
- Ayalew, L.; Yamagishi, H.; Marui, H.; Kanno, T. Landslides in Sado Island of Japan: Part II. GIS-based susceptibility mapping with comparison of results from two methods and verifications. Eng. Geol. 2005, 81, 432–445. [Google Scholar] [CrossRef]
- Saaty, T.L. The Analytic Hierarchy Process; McGraw-Hill: New York, NY, USA, 1980. [Google Scholar]
- Ladas, I.; Fountoulis, I.; Mariolakos, I. Using GIS & multicriteria decision analysis in landslide susceptibility mapping—A case study in Messinia Prefecture area (SW Peloponnesus, Greece). Bull. Geol. Soc. Greece 2007, 40, 1973–1985. [Google Scholar] [CrossRef]
- Papadakis, M.; Karimalis, A. Producing a landslide susceptibility map through the use of analytic hierarchical process in Finikas watershed, North Peloponnese, Greece. Am. J. GIS 2017, 6, 14–22. [Google Scholar] [CrossRef]
- Abey, A.; Barbieri, G.; Woldearegay, K. GIS-based landslide susceptibility evaluation using analytical hierarchy process (AHP) approach: The case of Tarmaber District, Ethiopia. Momona Ethiop. J. Sci. 2019, 1135, 14–35. [Google Scholar] [CrossRef] [Green Version]
- Pardeshi, S.D.; Autade, S.E.; Pardeshi, S. Landslide hazard assessment: Recent trends and techniques. Springer Plus 2013, 2, 523. [Google Scholar] [CrossRef] [PubMed] [Green Version]
- User Guides–Sentinel-2 MSI–Overview–Sentinel Online. 2017. Available online: https://earth.esa.int/web/sentinel/user-guides/sentinel-2-msi/overview (accessed on 2 August 2018).
- Chatziantoniou, A.; Petropoulos, G.P.; Psomiadis, E. Co-Orbital Sentinel 1 and Sentinel 2 for LULC Mapping with Emphasis in a Mediterranean Setting Based on Machine Learning. Remote Sens. 2017, 9, 1259. [Google Scholar] [CrossRef] [Green Version]
- Vinod Kumar, K.; Lakhera, R.C.; Martha, T.R.; Chatterjee, R.S.; Bhattacharya, A. Analysis of the 2003 VarunawatLandslide, Uttarkashi, India using Earth Observation data. Environ. Geol. 2008, 55, 789–799. [Google Scholar] [CrossRef]
- Brardinoni, F.; Slaymaker, O.; Hassan, M.A. Landslide inventory in a rugged forested watershed: A comparison between air-photo and field survey data. Geomorphology 2003, 54, 179–196. [Google Scholar] [CrossRef]
- Martha, T.R.; Kerle, N.; Jetten, V.; van Westen, C.J.; Kumar, K.V. Characterizing spectral, spatial and morphometric properties of landslides for semi-automatic detection using object-oriented methods. Geomorphology 2010, 116, 24–36. [Google Scholar] [CrossRef]
- Evans, S.G.; Guthrie, R.H.; Roberts, N.J.; Bishop, N.F. The disastrous 17 February 2006 rockslide-debris avalanche on Leyte Island, Philippines: A catastrophic landslide in tropical mountain terrain. Nat. Hazards Earth Syst. Sci. 2007, 7, 89–101. [Google Scholar] [CrossRef] [Green Version]
- Huang, R.; Pei, X.; Fan, X.; Zhang, W.; Li, S.; Li, B. The characteristics and failure mechanism of the largest landslide triggered by the Wenchuan earthquake, May 12, 2008, China. Landslides 2012, 9, 131–142. [Google Scholar] [CrossRef]
- Foumelis, M.; Lekkas, E.; Parcharidis, I. Landslide susceptibility mapping by GIS-based qualitative weighting procedure in Corinth area. Bull. Geol. Soc. Greece 2004, 36, 904–912. [Google Scholar] [CrossRef] [Green Version]
- Plank, S.; Twele, A.; Martinis, S. Landslide mapping in vegetated areas using change detection based on optical and polarimetric SAR data. Remote Sens. 2016, 8, 307. [Google Scholar] [CrossRef] [Green Version]
- Erener, A.; Sarp, G.; Duzgun, S.H. Use of GIS and Remote Sensing for Landslide Susceptibility Mapping. In Advanced Methodologies and Technologies in Engineering and Environmental Science; IGI Global Publisher of Timely Knowledge, Middle East Technical University: Ankara, Turkey, 2019; pp. 384–398. [Google Scholar] [CrossRef]
- Boon, M.A.; Greenfield, R.; Tesfamichael, S. Unmanned Aerial Vehicle (UAV) Photogrammetry Produces Accurate High-resolution Orthophotos, Point Clouds and Surface Models for Mapping Wetlands. S. Afr. J. Geomat. 2016, 5, 186–200. [Google Scholar] [CrossRef]
- DeWitt, J.D.; Warner, T.A.; Chirico, P.G.; Bergstresser, S.E. Creating high-resolution bare-earth digital elevation models (DEMs) from stereo imagery in an area of densely vegetated deciduous forest using combinations of procedures designed for lidar point cloud filtering. GISci. Remote Sens. 2017, 54, 552–572. [Google Scholar] [CrossRef]
- Varnes, D.J. Slope movement types and processes. In Special Report 176: Landslides: Analysis and Control TRB; Schuster, R.L., Krizek, R.J., Eds.; National Research Council: Washington, DC, USA, 1978; pp. 11–33. [Google Scholar]
- Fell, R.; Corominas, J.; Bonnard, C.; Cascini, L.; Leroi, E.; Savage, Z.W. Guidelines for landslide susceptibility, hazard and risk zoning for land use planning. Eng. Geol. 2008, 102, 85–98. [Google Scholar] [CrossRef] [Green Version]
- Ambrosi, C.; Strozzi, T.; Scapozza, C.; Wegmüller, U. Landslide hazard assessment in the Himalayas (Nepal and Bhutan) based on Earth-Observation data. Eng. Geol. 2018, 237, 217–228. [Google Scholar] [CrossRef]
- Corominas, J.; van Westen, C.; Frattini, P.; Cascini, L.; Malet, J.P.; Fotopoulou, S.; Catani, F.; Van Den Eeckhaut, M.; Mavrouli, O.; Agliardi, F.; et al. Recommendations for the quantitative analysis of landslide risk. Bull. Eng. Geol. Environ. 2014, 73, 209–263. [Google Scholar] [CrossRef]
- Papazachos, B.C.; Comninakis, P.E. Geophysical and tectonic features of the Aegean arc. J. Geophys. Res. 1971, 76, 8517–8533. [Google Scholar] [CrossRef]
- Makropoulos, K.C.; Burton, P.W. Greek tectonics and seismicity. Tectonophysics 1984, 106, 275–304. [Google Scholar] [CrossRef]
- Xydis, G.; Loizidou, M.; Koroneos, C.J. Multicriteria analysis of Renewable Energy Sources (RES) utilisation in waste treatment facilities: The case of Chania prefecture, Greece. Int. J. Environ. Waste Manag. 2010, 6, 197–213. [Google Scholar] [CrossRef]
- Tataris, A.; Christodoulou, C. The Geological structure of Leuca Mountains. Bull. Geol. Soc. Greece 1965, 6, 319–347. [Google Scholar]
- Bonneau, M. Les differentes series ophiolitiferes de la Crete: Une mise au point, C.R. Acad. Sci. 1972, 276, 1249–1252. [Google Scholar]
- Fitrolakis, S. The Geologic Structure of Crete, Lectureship Thesis, National Technical University of Athens; Department of Engineering and Metallurgy: Athens, Greece, 1980. [Google Scholar]
- Krahl, J.; Kaufmann, G.; Kozur, H.; Richter, D.; Forster, O.; Heinritzi, F. Neue Daten zur Biostratigraphie und zur tektonischen Lagerung der Phyllit-Gruppe und der Trypali Gruppe auf der Insel Kreta (Griechenland). Geol. Rundsch. 1983, 72, 1147–1166. [Google Scholar] [CrossRef]
- Bourounis, C.; Papazachariou, A.; Andrikopoulos, C. Slope protection research in the high-risk regions of A90 motorway (Souda-Kalyves part). In Road Safety Research—Technical Report; Ministry of Infrastructure and Transport: Athens, Greece, 2018; pp. 1–82. [Google Scholar]
- Soupios, P.M.; Kouli, M.; Vallianatos, F.; Vefidis, A.; Stavroudakis, G. Estimation of aquifer hydraulic parameters from surficial geophysical methods: A case study of Keritis Basin in Chania (Crete—Greece). J. Hydrol. 2007, 338, 122–131. [Google Scholar] [CrossRef]
- Kouli, M.; Soupios, P.; Vallianatos, F. Soil erosion prediction using the Revised Universal Soil Loss Equation (RUSLE) in a GIS framework, Chania, Northwestern Crete, Greece. Environ. Geol. 2009, 57, 483–497. [Google Scholar] [CrossRef]
- Papapetrou, A. Intense Rainfalls in Crete—February 2019. Report, Hellenic National Meteorological Service. Available online: http://www.emy.gr/emy/el/meteorology/meteorological_news?name=CreteFeb19 (accessed on 22 February 2020).
- Lagouvardos, K.; Kotroni, V.; Dafis, N. February 2019: Impressive Differences in Rainfall Distribution. National Observatory of Athens—METEO. 2019. Available online: https://meteo.gr/article_view.cfm?entryID=925 (accessed on 22 February 2020).
- Varnes, D.J. Landslide Hazard Zonation: A Review of Principles and Practice; UNESCO: Paris, France, 1984. [Google Scholar]
- Raghuvanshi, T.K.; Ibrahim, J.; Ayalew, D. Slope stability susceptibility evaluation parameter (SSEP) rating scheme—An approach for landslide hazard zonation. J. Afr. Earth Sci. 2014, 99, 595–612. [Google Scholar] [CrossRef]
- Soulis, K.X.; Kalivas, D.P.; Apostolopoulos, C. Delimitation of agricultural areas with natural constraints in Greece: Assessment of the dryness climatic criterion using geostatistics. Agronomy 2018, 8, 161. [Google Scholar] [CrossRef] [Green Version]
- Demir, G.; Aytekin, M.; Akgün, A.; İkizler, S.B.; Tatar, O. A comparison of landslide susceptibility mapping of the eastern part of the North Anatolian Fault Zone (Turkey) by likelihood-frequency ratio and analytic hierarchy process methods. Nat. Hazards 2013, 65, 1481–1506. [Google Scholar] [CrossRef]
- Pourghasemi, H.R.; Rahmati, O. Prediction of the landslide susceptibility: Which algorithm, which precision? Catena 2018, 162, 177–192. [Google Scholar] [CrossRef]
- Tsangaratos, P.; Ilia, I.; Hong, H.; Chen, W.; Xu, C. Applying Information Theory and GIS-based quantitative methods to produce landslide susceptibility maps in Nancheng County, China. Landslides 2017, 14, 1091–1111. [Google Scholar] [CrossRef]
- Nefeslioglu, H.A.; Sezer, E.; Gokceoglu, C.; Bozkir, A.S.; Duman, T.Y. Assessment of landslide susceptibility by decision trees in the metropolitan area of Istanbul, Turkey. Math. Probl. Eng. 2010, 901095. [Google Scholar] [CrossRef] [Green Version]
- Tsangaratos, P.; Loupasakis, C.; Nikolakopoulos, K.; Angelitsa, V.; Ilia, I. Developing a landslide susceptibility map based on remote sensing, fuzzy logic and expert knowledge of the Island of Lefkada, Greece. Environ. Earth Sci. 2018, 77, 363. [Google Scholar] [CrossRef]
- Psomiadis, E.; Dercas, N.; Dalezios, R.N.; Spyropoulos, N. Evaluation and cross-comparison of vegetation indices for crop monitoring from Sentinel-2 and WorldView-2 images. In Proceedings of SPIE (Remote Sensing for Agriculture, Ecosystems, and Hydrology XIX); Society of Photo-Optical Instrumentation Engineers (SPIE): Warsaw, Poland, 2017; Volume 10421. [Google Scholar] [CrossRef]
- Zoka, M.; Psomiadis, E.; Dercas, N. The complementary use of Optical and SAR data in monitoring flood events and their effects. Proceedings 2018, 2, 644. [Google Scholar] [CrossRef] [Green Version]
- Rouse, J.W.; Haas, R.H.; Schell, J.A.; Deering, D.W. Monitoring vegetation systems in the Great Plains with ERTS. In Proceedings of the Third ERTS Symposium, NASA SP-351, Washington, DC, USA, 10–14 December, 1973; p. 1008. [Google Scholar]
- Lillesand, T.M.; Kiefer, R.W.; Chipman, J.W. Remote Sensing and Image Interpretation, 5th ed.; John Wiley & Sons: New York, NY, USA, 2004. [Google Scholar]
- Efthimiou, N.; Psomiadis, E.; Panagos, P. Fire severity and soil erosion susceptibility mapping using multi-temporal Earth Observation data: The case of Mati fatal wildfire in Eastern Attica, Greece. Catena 2020, 187, 104320. [Google Scholar] [CrossRef] [PubMed]
- Qin, Y.; Lu, P.; Li, Z. Landslide inventory mapping from bitemporal 10 m Sentinel-2 images using change detection based Markov random field. Int. Arch. Photogramm. Remote Sens. Spat. Inf. Sci. 2018, 42, 1447–1452. [Google Scholar] [CrossRef] [Green Version]
- Yang, W.; Wang, Y.; Sun, S.; Wang, Y.; Ma, C. Using Sentinel-2 time series to detect slope movement before the Jinsha River landslide. Landslides 2019, 16, 1313–1324. [Google Scholar] [CrossRef]
- Psomiadis, E.; Soulis, K.; Zoka, M.; Dercas, N. Synergistic approach of remote sensing and GIS techniques for flash-flood monitoring and damage assessment in Thessaly plain area. Greece. Water 2019, 11, 448. [Google Scholar] [CrossRef] [Green Version]
- Hong, H.; Ilia, I.; Tsangaratos, P.; Chen, C.; Xu, C. A hybrid fuzzy weight of evidence method in landslide susceptibility analysis on the Wuyuan area, China. Geomorphology 2017, 290, 1–16. [Google Scholar] [CrossRef]
- Ercanoglou, M.; Gokceoglu, C. Use of fuzzy relations to produce landslide susceptibility map of a landslide prone area (West Black Sea Region, Turkey). Eng. Geol. 2004, 75, 229–250. [Google Scholar] [CrossRef]
- San, T.B. An evaluation of SVM using polygon-based random sampling in landslide susceptibility mapping: The Candir catchment area (western Antalya, Turkey). Int. J. Appl. Earth Obs. Geoinf. 2014, 26, 399–412. [Google Scholar] [CrossRef]
- Myronidis, D.; Papageorgiou, C.; Theophanous, S. Landslide susceptibility mapping based on landslide history and analytic hierarchy process (AHP). Nat. Hazards 2016, 81, 245–263. [Google Scholar] [CrossRef]
- Segoni, S.; Pappafico, G.; Luti, T.; Catani, F. Landslide susceptibility assessment in complex geological settings: Sensitivity to geological information and insights on its parameterization. Landslides 2020, 1–11. [Google Scholar] [CrossRef] [Green Version]
- Montgomery, D.R.; Schmidt, K.M.; Greenberg, H.M.; Dietrich, W.E. Forest clearing and regional landsliding. Geology 2000, 28, 311–314. [Google Scholar] [CrossRef]
- World Meteorological Organization. Guide to Meteorological Instruments and Methods of Observation, 6th ed.; WMO: Geneva, Switzerland, 1996. [Google Scholar]
- Grammatikogiannis, A.; Mamassis, N.; Baltas, E.; Mimikou, M. A meteorological telemetric network for monitoring of the Athens wider area (METEONET). A real time approach from point to areal measurements. In Proceedings of the Ninth International Conference on Environmental Science and Technology (9CEST), Rhodes Island, Greece, 1–3 September 2005. [Google Scholar]
- Chen, W.; Xie, X.; Peng, J.; Shahabi, H.; Hong, H.; Tien Bui, D.; Duan, Z.; Li, S.; Zhu, A.X. GIS-based landslide susceptibility evaluation using a novel hybrid integration approach of bivariate statistical based random forest method. Catena 2018, 164, 135–149. [Google Scholar] [CrossRef]
- Strahler, A.N. Quantitative geomorphology of drainage basins and channel networks. In Handbook of Applied Hydrology; Chow, V.T., Ed.; McGraw Hill: New York, NY, USA, 1964; p. 439476. [Google Scholar]
- Saaty, T.L.; Vargas, L.G. Prediction, Projection and Forecasting; Kluwer Academic Publishers: Dordrecht, The Netherlands, 1991. [Google Scholar]
- Saaty, T.L. A scaling method for priorities in hierarchical structures. J. Math. Psychol. 1977, 15, 234–281. [Google Scholar] [CrossRef]
- Saaty, T.L. Fundamentals of Decision Making and Priority Theory with the Analytic Hierarchy Process; RWS Publications: Pittsburgh, PA, USA, 2000. [Google Scholar]


| Data | Data Characteristic | Acquisition Date/ Date of Creation | Usage |
|---|---|---|---|
| Geological maps | Institute of Geology and Mineral Exploration (IGME) at 1:50,000 scale/map sheets: Chania, Kastellion, Perivolia (Platanias), Paleochora, Rethymno, Sellia, Vrisses, Alikianos | 1971, 1970, 1956, 2000, 1988, 1982, 1993, 1969 | Geological formations and faults |
| Topographic maps | Hellenic Military Geographical Service at 1:50.000 scale/map sheets: Chania, Kastellion (Kissamos), Perivolia, Paleochora, Rethymno, Sellia, Vrisses, Vatolakos | 1993–1994 | Drainage network |
| Meteorological data | Hellenic National Meteorological Service. | 1971–2000 | Rainfall distribution |
| Landsat 8 | Operational Land Imager (OLI)—11 spectral bands—geometrically and atmospherically corrected—15m spatial resolution, (path/row: 182/035 and 182/036) | 14/08/2019 | Land Cover/ Normalized Difference Vegetation Index |
| Sentinel-2 | MSI–13 spectral bands—geometrically and atmospherically corrected (2A)—10m spatial resolution | 06/01/2018 | Landslide detection |
| 11/01/2019 | |||
| 17/03/2019 | |||
| Orthophoto maps | Aerial photographs orthorectified—1m spatial resolution | 2014 | Drainage and road network integration / Point Cloud for DEM |
| (1) | (2) | (3) | (4) | (5) | (6) | (7) | (8) | Weights (*100) | |
|---|---|---|---|---|---|---|---|---|---|
| Slope angle (1) | 1 | 3 | 3 | 5 | 5 | 7 | 7 | 7 | 17.7 |
| Geology (2) | 1/3 | 1 | 1 | 2 | 5 | 7 | 7 | 9 | 6.0 |
| Mean annual precipitation (3) | 1/3 | 1 | 1 | 3 | 3 | 5 | 8 | 7 | 7.3 |
| Land Cover (4) | 1/5 | 1/2 | 1/3 | 1 | 3 | 5 | 9 | 7 | 5.4 |
| Distance to Roads (5) | 1/5 | 1/5 | 1/3 | 1/3 | 1 | 2 | 5 | 5 | 2.6 |
| Slope Aspect (6) | 1/7 | 1/7 | 1/5 | 1/5 | 1/2 | 1 | 2 | 2 | 0.8 |
| Distance to faults (7) | 1/7 | 1/7 | 1/8 | 1/9 | 1/5 | 1/2 | 1 | 2 | 1.2 |
| Distance to streams (8) | 1/7 | 1/9 | 1/7 | 1/7 | 1/5 | 1/2 | 1/2 | 1 | 1.1 |
| CR = 0,064 | |||||||||
| Factor | Class | Class Value Rating | Weight wt1 | Weight wt2 |
|---|---|---|---|---|
| i. Slope Angle (SA) (%) | 0–10 | 1 | 17.7 | 17,7*SA*(MAP*2,0) layer |
| 10–20 | 2 | |||
| 20–30 | 3 | |||
| 30–60 | 4 | |||
| >60 | 5 | |||
| ii. Aspect | Flat, S-SE | 1 | 0.8 | 0.8*SA*(MAP*2,0) layer |
| E-NE | 2 | |||
| SW | 3 | |||
| W-NW-N | 4 | |||
| iii. Geology | Limestone–marble | 1 | 6.0 | 6.0*SA*(MAP*2,0) layer |
| Neogene | 2 | |||
| Loose quaternary deposits | 3 | |||
| Phyllites–Quartzites | 4 | |||
| Flysch | 5 | |||
| iv. Land Cover | Forest and shrubs | 1 | 5.4 | 5.4*SA *(MAP*2,0) layer |
| Olive groves–Orchards | 2 | |||
| Arable crops | 3 | |||
| Urban areas | 4 | |||
| Nude soils and vineyards | 5 | |||
| v. Mean annual precipitation (MAP) (mm) | 0–600 | 1 | 7.3 | 7.3*SA *(MAP*2,0) layer |
| 600–800 | 2 | |||
| 800–1000 | 3 | |||
| 1000–1200 | 4 | |||
| >1200 | 5 | |||
| vi. Distance to Roads (m) | >100 | 1 | 2.6 | 2.6*SA *(MAP*2,0) layer |
| 50–100 | 2 | |||
| <50 | 3 | |||
| vii. Distance to faults (m) | >250 | 1 | 1.2 | 1.2*SA*(MAP*2,0) layer |
| <250 | 2 | |||
| viii. Distance to streams | >50 | 1 | 1.1 | 1.1*SA *(MAP*2,0) layer |
| <50 | 2 |
| Validation Sample | Target Class (Observed) | |
|---|---|---|
| Susceptible Areas (High and Very High Classes) | No Susceptible Areas (Moderate, Low, Very Low Classes) | |
| Landslide areas | 11 | 5 |
| Landslide-free areas | 2 | 14 |
© 2020 by the authors. Licensee MDPI, Basel, Switzerland. This article is an open access article distributed under the terms and conditions of the Creative Commons Attribution (CC BY) license (http://creativecommons.org/licenses/by/4.0/).
Share and Cite
Psomiadis, E.; Papazachariou, A.; Soulis, K.X.; Alexiou, D.-S.; Charalampopoulos, I. Landslide Mapping and Susceptibility Assessment Using Geospatial Analysis and Earth Observation Data. Land 2020, 9, 133. https://0-doi-org.brum.beds.ac.uk/10.3390/land9050133
Psomiadis E, Papazachariou A, Soulis KX, Alexiou D-S, Charalampopoulos I. Landslide Mapping and Susceptibility Assessment Using Geospatial Analysis and Earth Observation Data. Land. 2020; 9(5):133. https://0-doi-org.brum.beds.ac.uk/10.3390/land9050133
Chicago/Turabian StylePsomiadis, Emmanouil, Andreas Papazachariou, Konstantinos X. Soulis, Despoina-Simoni Alexiou, and Ioannis Charalampopoulos. 2020. "Landslide Mapping and Susceptibility Assessment Using Geospatial Analysis and Earth Observation Data" Land 9, no. 5: 133. https://0-doi-org.brum.beds.ac.uk/10.3390/land9050133