Reclassifying the Wildland–Urban Interface Using Fire Occurrences for the United States

USDA Forest Service, Rocky Mountain Research Station, Rapid City, SD 57702, USA
Land 2020, 9(7), 225; https://0-doi-org.brum.beds.ac.uk/10.3390/land9070225
Submission received: 3 June 2020
/
Revised: 8 July 2020
/
Accepted: 9 July 2020
/
Published: 11 July 2020
(This article belongs to the Special Issue Fire in the Earth System: Humans and Nature)
Abstract
:The wildland–urban interface (WUI) occurs at the intersection of houses and undeveloped wildlands, where fire is a safety concern for communities, motivating investment in planning, protection, and risk mitigation. Because there is no operational definition of WUI based on where fires in fact have occurred, I used fire occurrences to objectively establish a definition of WUI, while examining spatiotemporal changes, for the conterminous United States. I applied four classifiers, but focused on C5.0, which produced equivalent sensitivity (0.87 to 0.91 at prevalence = 0.67) and generated a ruleset that indicated housing density was the preferable basis for definitions. Fire occurrences overall were predicted for housing densities <100 houses/km2 with potentially low (≥10%) thresholds for percent vegetation cover, varying by housing densities and models. A generalized guideline according to classifications is continued use of existing definitions for wildlands of <6.17 houses/km2 and a low-density intermix class of 6.17 to 50 houses/km2. Departing from other definitions, the medium-density class encompasses 50 to 100 houses/km2 and the high-density class is 100 to 200 houses/km2. Interface, or suburban, communities are 200 to 400 houses/km2. Implications of refining the definition include a larger critical area classified as greater fire risk (low and medium-density WUI below 100 houses/km2) at 855,000 km2 during 2010, and; therefore, incorporation of more communities and homeowners into a high-risk status. The low-density class had greatest risk of fire exposure, but the medium-density class contained a greater concentration of houses. Classification of the wildland–urban interface or intermix based on realized fire occurrences provides an objective foundation for identifying residential densities at risk of fire exposure, which permits disclosure of risk, prioritization of resources to communities and homeowners with greater wildfire exposure, development of strategies for communities to coexist with fire, and responses to reduce vulnerability.
1. Introduction
Fire is an integral ecological process that has been fundamental in shaping many ecosystems and species life history strategies for about 350 to 400 million years, after terrestrial plants evolved [1,2]. Fire application by hominins likely started more than one million years ago, with evidence of more routine use by 300 to 800 thousand years ago [3]. Fire was an effective, labor-saving tool to clear vegetation for a variety of purposes, including food ways and travel. However, when human densities increased, fire became a liability to human lives and infrastructure. National campaigns of fire suppression, including messages of fire as disasters that are necessary to prevent, have obscured the information that fires are ecological disturbances that will occur when weather is severe and deferring fire will increase fire severity [2,4]. Although number or area of fires, or even severity, may not be increasing in most regions worldwide [2], area of human habitation with fire exposure has increased in recent decades in the United States, Canada, Australia, Europe, China, Russia, South America, and globally in areas with a Mediterranean climate [5,6]. Wildfires additionally are caused by ignitions from human activities in most locations, with ignition sites near secondary road networks [7,8].
Conceptually, the wildland–urban interface (WUI) is “where humans and their development meet or intermix with wildland fuel’’ [9] and consequently, the WUI is a focal area of concern for fire exposure and planning to mitigate risk to communities [10,11]. Where continuous cover of vegetation is in close proximity to structures, a high risk from wildfire to property, life, and community services arises. Fire risk incorporates the hazard of fire, exposure that increases in the WUI, and vulnerability that arises from multiple factors, such as limited structural resistance to fires and road access for fire suppression services and equipment. Additionally, due to dispersion of low-density housing, fires in the wildland–urban interface may exceed fire suppression capacity. About 10% of land area and about 33% of all housing units in the conterminous United States are located in the WUI [12]. Increasing trends in areal extent and fire occurrences in the WUI and suppression costs intensify the need to identify the extent and location of WUI communities to manage fire risk [5,10,11].
Operational definitions of WUI typically remain founded on the U.S. Federal Government’s initial and multiple definitions, with the policy intent of the definition to identify communities with greatest exposure and then prioritize wildfire fuel reduction activities [10,13,14]. The wildland–urban interface of communities at high risk from wildfire was defined as at least 6.17 houses per km2 for the intermix type, where structures are dispersed throughout wildlands and wildland fuels are continuous [9]. An alternative definition of intermix community was a population density of between 11 and 96 people per km2 [9]. For the interface type of wildland–urban interface, where demarcation occurs between structures and wildland fuels, density was at least 741 structures per km2 or a population density of 96 people per km2 [9]. The SILVIS WUI layers are the standard for the conterminous United States, and they are derived from decennial census data of population and housing density by census blocks [12]. In addition to the standard definitions of housing and population densities, the intermix WUI has >50% of the census block area in wildland vegetation, whereas interface WUI has <50% vegetation and is within 2.4 km of at least 75% wildland vegetation that is at least 5 km2 in area [12]. Percentage of vegetation in wildland vegetation, of forest, grass/shrub, and wetlands, from the 2015 version of the National Land Cover Database [13] was calculated for each census block.
Modifications of these definitions exist because of the wide range of both housing and population densities, data availability over time, intended purpose or application, decisions about vegetation cover and distances between settlements to wildland vegetation, and incorporation of ancillary variables, such as vegetation fuels [10,14,15,16]. Modified definitions therefore are unique and inconsistent depending on choices and data sources (e.g., [14,15,16,17]). Additionally, Theobald and Romme [18] reasoned that 741 structures per km2 was twice as dense as urban areas defined by the US Census (i.e., approximately 380 structures per km2), whereas 96 people per km2 better translated to housing densities of concern.
These previous definitions do not explicitly account for differences in fire risk. Nonetheless, data are available now to use the objective measure of fire occurrences to define the wildland–urban interface, thereby using fire to delineate the WUI rather than basing estimates on subjective decisions about a potential range of housing and population densities that may exceed densities where fire typically occurs and then assessing wildfire risk. The Fire Program Analysis fire occurrence database [19] currently contains about two million geo-referenced wildfire records during 1992–2015 in the United States, with locations at least as precise as 2.6 km2 (i.e., square mile) grids.
Many classifier methods can model big datasets that have complex and variable spatiotemporal relationships with unknown or incorrect responses. Classifier methods use training data with known classes (e.g., fire occurrence) and explanatory variables to develop a relationship (e.g., machine learning algorithm) that allows assignment of unknown observations into classes. Validation occurs on separate testing data, with withheld known classes, to determine how well the classifier assigned classes using explanatory variables. The true positive rate, also known as sensitivity or by other terms, is a measure of the number of predicted observations that were accurately assigned to a class, while the true negative rate is a measure of the number of predicted observations where the response variable of interest did not occur. To some extent, absences are never definite and pseudoabsences become surrogates for true absences when true absences are unknown [20]. It is possible to build a confusion matrix of true positives and negatives, and also false positives (Type I error) and false negatives (Type II error).
Statistical modeling with classifiers has advanced rapidly during the past five to ten years. Fernandez-Delgado et al. [21] examined performance of 179 classifiers arising from 17 families for 121 data sets, and the best classifiers were random forests, support vector machines with Gaussian and polynomial kernels, extreme learning machine with Gaussian kernel, C5.0 decision trees or rule-based model, and avNNet neural network. Since this 2014 evaluation, many other classifiers have been developed. One example is extreme gradient boosting, which reduces overfitting of models by other boosting classifiers, and has rarely been applied to ecological datasets [22]. In any event, analysis with multiple classifiers allows detection of better performing classifiers and selection of desirable features, such as computation speed, simplicity, ability to extrapolate, or visualization of a ruleset.
Definitions of the wildland–urban interface have implications for identification of communities at greater fire risk and consequent need for community planning and outreach to homeowners, prioritization of resources for fire mitigation and preparation, including investment and placement of fuel treatments and fire suppression services [5,10,11,17]. To determine an objective definition of wildland–urban interface based on where fires actually have occurred, I applied several classifiers to examine fire occurrences during two intervals of 2010 and 2000 to match decennial census data for the conterminous United States and additionally, by regions and the interface and intermix designations. I then generalized classifications into class thresholds, determined area of each class, and compared to standard (SILVIS) WUI classifications. The method of using fire occurrences to classify WUI is rare and has never been applied to such a large extent; for example, one small Australian study was located in the review by Johnston [17]. This method also may be most appropriate for fire applications, that is, identification and prioritization of communities at greatest risk of fire to target areas for fire management. Complicating analysis are locations where a fire could have occurred but did not, or occurred in the past when housing density, population density, and vegetation (i.e., components of WUI) were different or the many other factors of extreme weather, climate, ignitions, and fuel build-up that influence fire occurrence. Therefore, although these classifications are founded on quantitative evidence to help inform communities and managers, WUI definitions will remain flexible.
2. Methods
In the Fire Program Analysis fire occurrence database ([19]; https://0-doi-org.brum.beds.ac.uk/10.2737/RDS-2013-0009.4), fire occurrences from 2010 and 2000 correspond with census collection dates that provide housing and population density for the 2010 and 2000 SILVIS WUI layer ([12], http://silvis.forest.wisc.edu/data/wui-change/). To increase sample size and account for variance by year, I also selected fires during 2009–2011, 2008–2012, 1999–2001, and 1998–2002. Fires were excluded that occurred in census blocks of very low housing and population densities with values ≤1 per km2 and blocks with vegetation with values ≤1. Fire occurrences were removed that were less than 0.4 ha in size, to emphasize more flammable conditions. Number of fire occurrences remained relatively stable over time. After these exclusions, samples size were about 19,000 fires during 2010, 58,000 fires during 2009–2011, 93,000 fires during 2008–2012, 25,000 fires during 2000, 56,000 fires during 1999–2001, and 107,000 fires during 1998–2002. During 2008–2012, about 36,000 fires were intermix and 7000 fires were interface. During 1998–2002, about 41,000 fires were intermix and 7500 fires were interface.
The SILVIS WUI layer ([12], http://silvis.forest.wisc.edu/data/wui-change/) is the standard for the United States, based on census blocks. Area of census block is variable within and among census years that occur every 10 years. About 11 million blocks were delineated for the 2010 census, covering the U.S. and its territories, with half the blocks smaller than 2.6 ha. Census blocks were removed of very low housing and population densities with values ≤1 per km2 and blocks of vegetation with values ≤1 during 2010 and 2000. This reduced the number of census blocks to about 2.5 million. Pseudoabsences, or places where fire may be less likely to occur, were represented by census blocks without fires during 2010, 2009–2011, and 2008–2012 for 2010 and census blocks without fires during 2000, 1999–2001, and 1998–2002 for 2000.
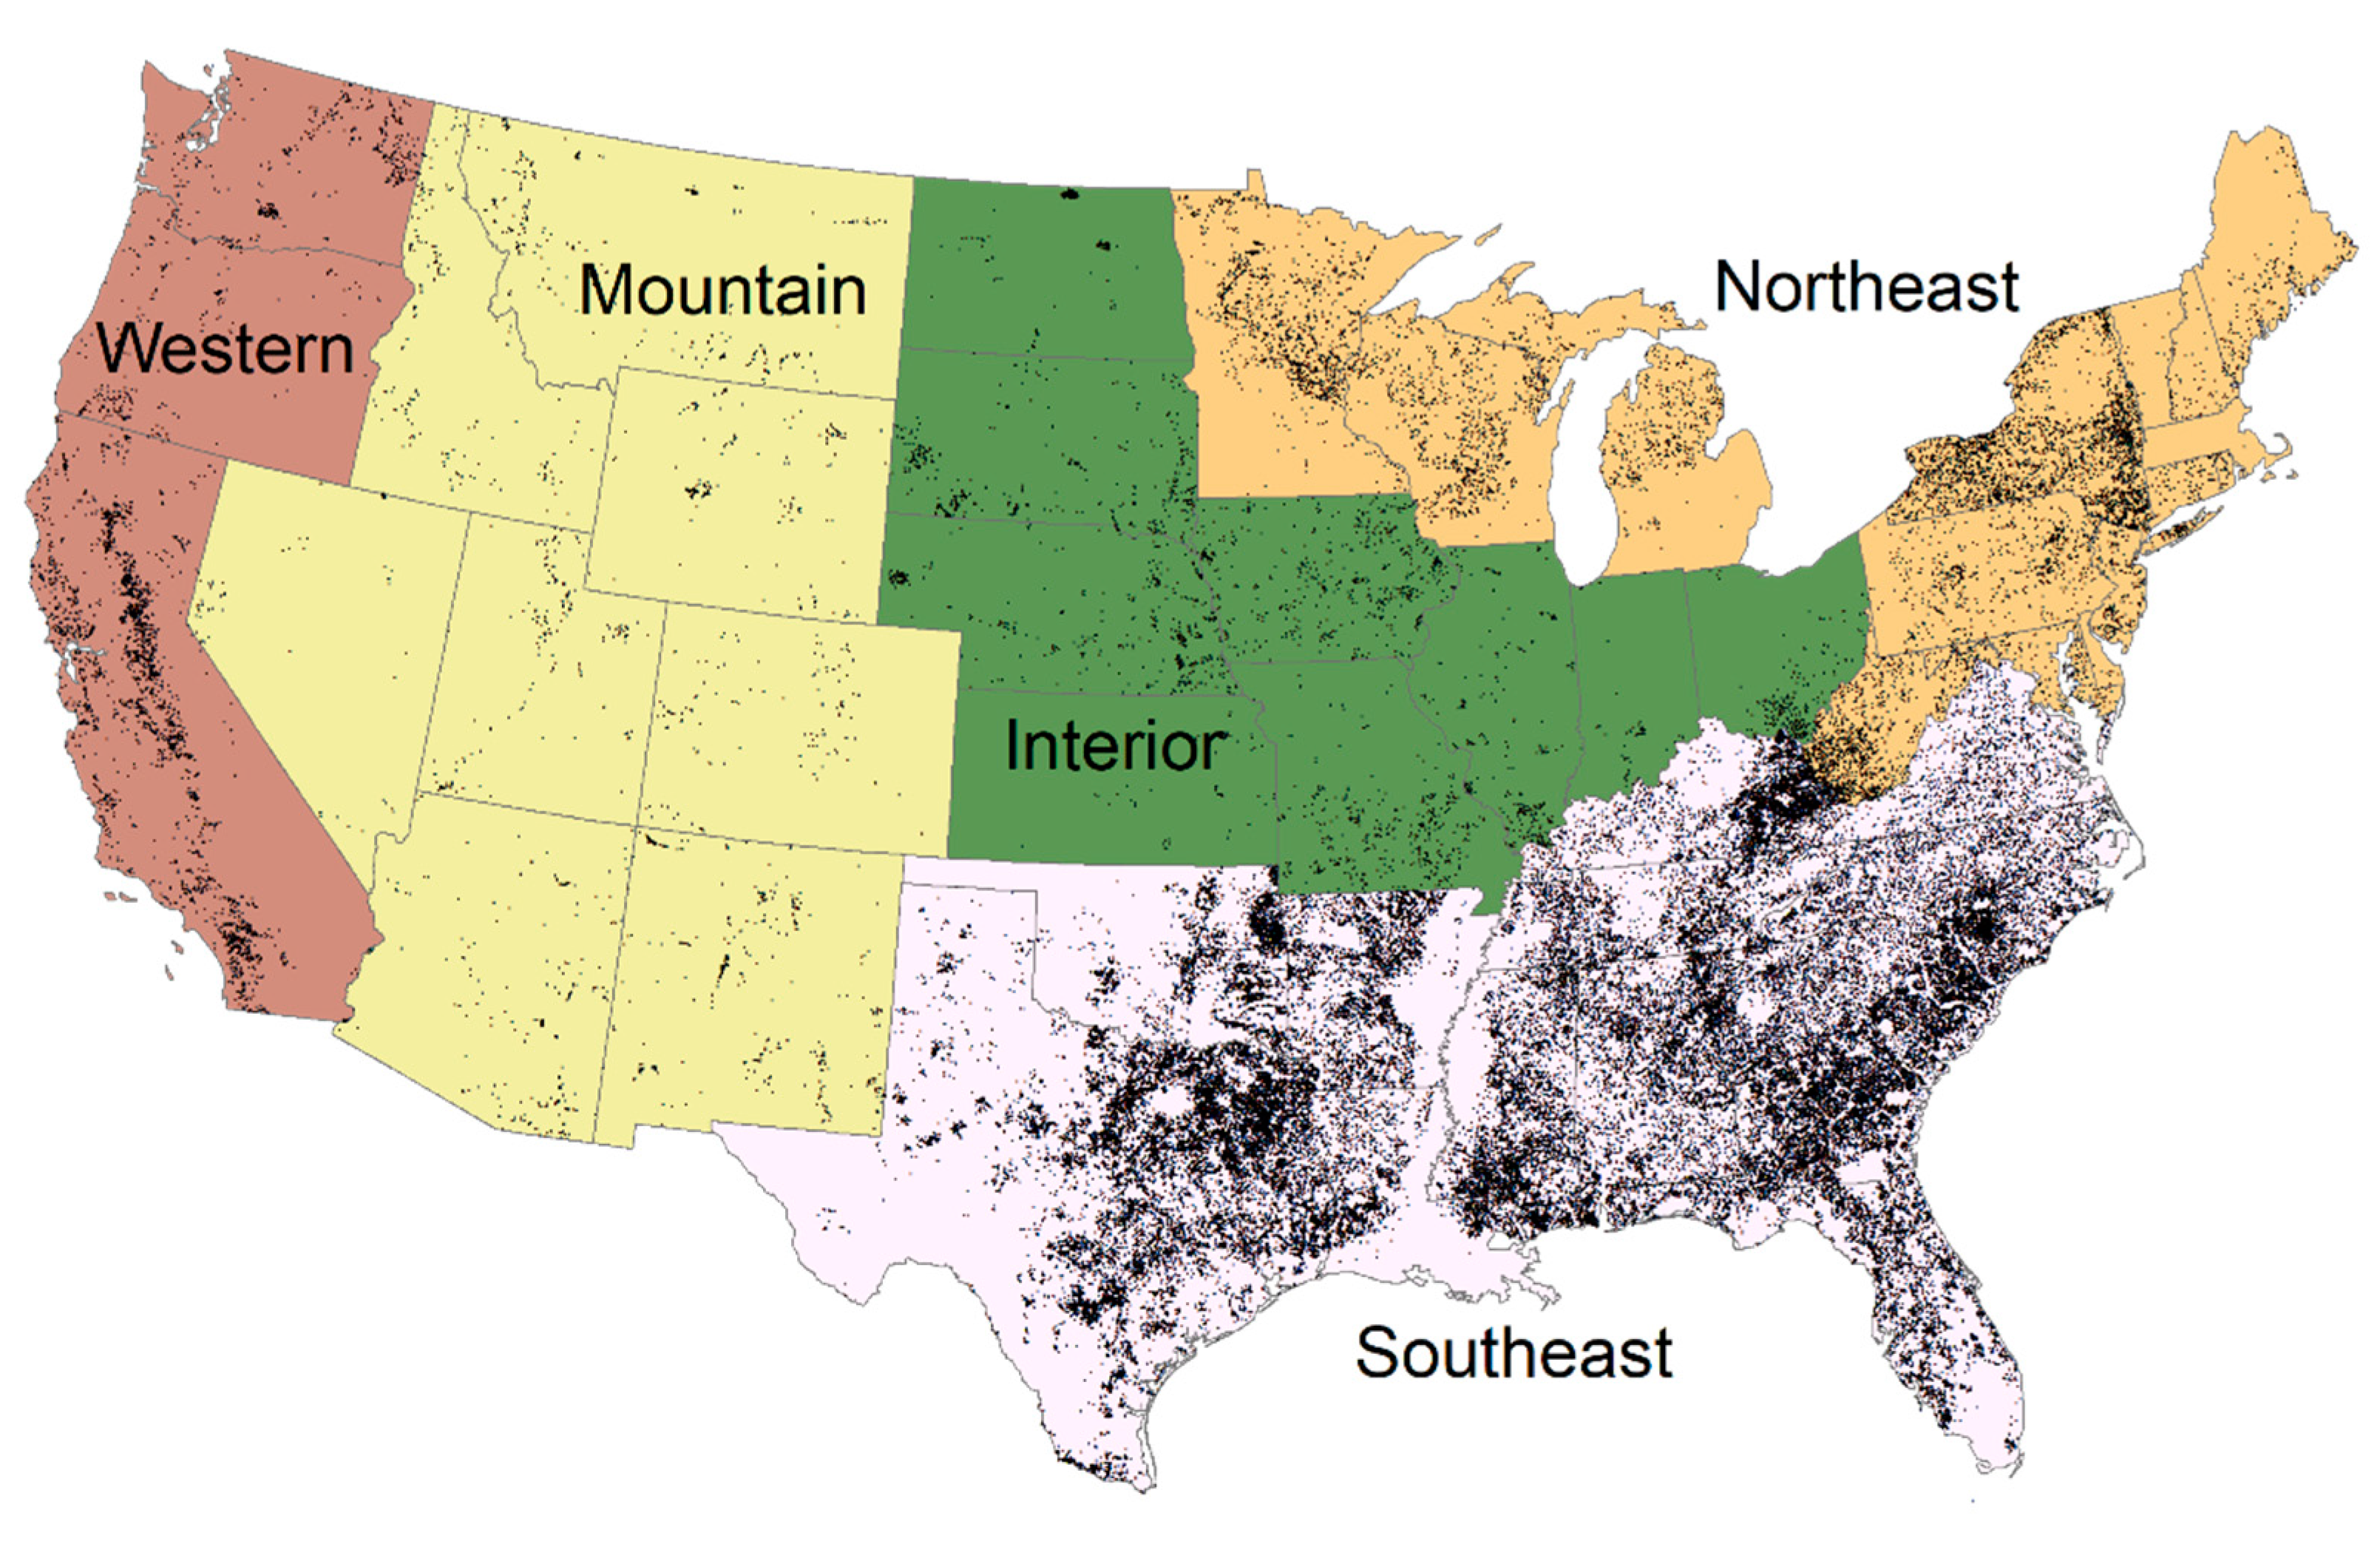
In addition to temporal differences, I examined coarse spatial differences to check for regional effects. The conterminous US was divided into five regions, in part based on fire occurrences (Figure 1). The Southeast and Northeast regions primarily are forested, whereas the Interior region currently is croplands and grasslands. The Mountain and Western regions are mixtures of forests, shrublands, and grasslands. In order to have enough samples per region, fires during 2008–2012 and 1998–2002 were applied. Similarly, WUI census blocks defined as either interface and intermix were assessed [12] during 2010 and 2000 for fires during 2008–2012 and 1998–2002. During 2008–2012, about 75,000 fires >0.4 ha occurred in the Southeast, 9000 fires in the Northeast, 3500 fires in the Pacific, 3000 fires in the Interior, and 2000 in the Mountain regions. Outside of the southeastern states, New York and California were the only states with >2000 fire occurrences at about 3000 each. During 1998–2002, about 88,000 fires >0.4 ha occurred in the Southeast, 9000 fires in the Northeast, 4000 fires in the Pacific, 3500 fires in the Interior, and 2000 in the Mountain regions. Outside of the southeastern states, California was the only state with >3000 fire occurrences; West Virginia and Minnesota had >2000 fire occurrences.
Although there are many possible variables that influence fire occurrences, the WUI is an outcome of housing density and/or population density and percent vegetation cover, and thus these were the only predictors for the classifiers. Several classifiers including random forests, parallel random forests, extreme gradient boosting with a tree booster, and the C5.0 decision trees or rules model had similar sensitivity (i.e., true positive rate or correct classification of fires), which was greater than other classifiers. These are known as data mining or machine learning classifiers due to use of rules or decision trees [21]. Prevalence, or ratio of present cases to pseudoabsent cases, was modeled at 1:1 (0.50) and 2:1 (0.67). That is, for random samples of census blocks where fires did occur, I chose both equal and half the number of samples with census blocks where fires did not occur (or pseudoabsences; sample sizes listed above). Although prevalence may not affect models, prevalence is a researcher choice that should be presented and evaluated [23]. The caret package [24,25] was used to partition the datasets into training (75% of data) and testing sets (remaining data), train the model with 10-fold cross-validation, and then predict for the testing sets.
Generalizing classifications, I developed guidelines for WUI class definitions. I then applied these thresholds to determine WUI area during 1990 and 2010. I compared the area for these classifications to the area according to the definitions in the SILVIS WUI layer.
3. Results
The classifiers all performed well in correctly identifying fire occurrence (>0.86 sensitivity or true positive rate) when prevalence was 0.67, or training data with proportionately more true fire records than unknown pseudoabsences (Table 1). Extreme gradient boosting with a tree booster was slightly more accurate (0.89 at 0.67 prevalence) for fire occurrences during 2010, 2009–2011, and 2008–2012 in WUI during 2010. The C5.0 was more accurate for fire occurrences during 2000, 1999–2001, and 1998–2002 in WUI during 2000 (0.89 to 0.92 at 0.67 prevalence).
Given that the C5.0 decision trees or rules model had equivalent sensitivity and the majority decision from an ensemble of trees is not clear, the feature of the C5.0 classifier to supply an explicit ruleset was most useful for the purpose of definitions. The first decision tree or ruleset constructed is identical to that produced without boosting [26], and error rates were within 0.3% of combinations. Generally, if there were multiple trees or rules, the last tree or ruleset also has similar overall error rate (see Supplementary Materials Figure S1 for example). Note that model results were identical if re-run as well, demonstrating stability. Therefore, I concentrated on definitions from this classifier (see Supplementary Materials, Figures S1–S3). Nevertheless, definitions were not always clear or explanatory.
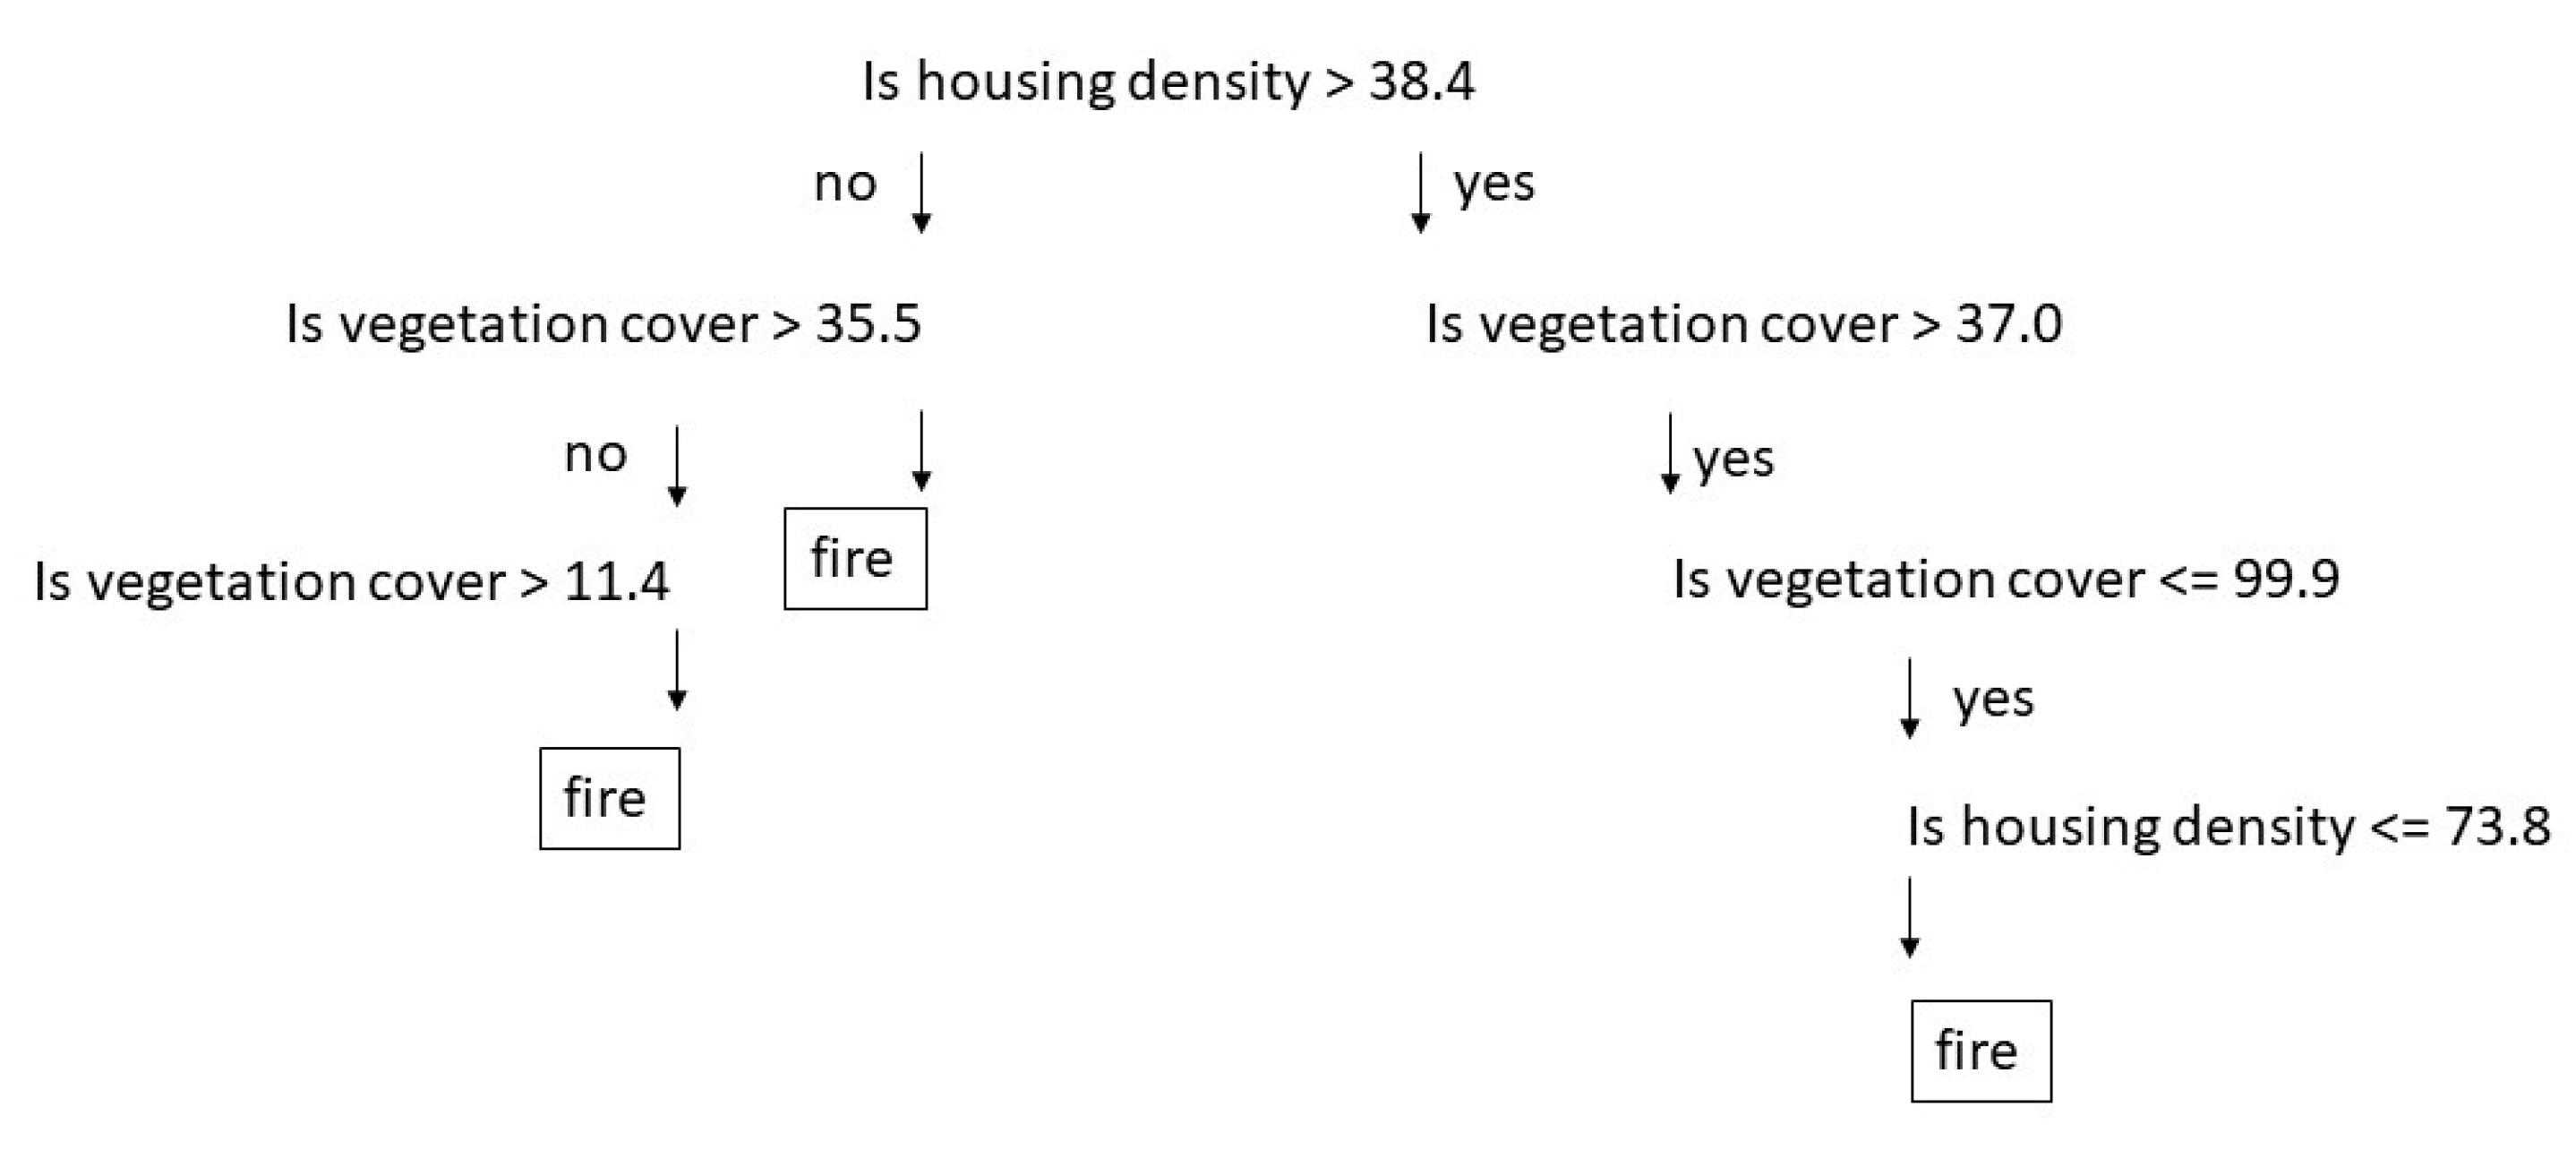
The upper limit of the wildland–urban interface for the conterminous United States during 2010 occurred at densities of about 75 houses per km2 (fires occurring during 2010; Figure 2) to 90 (2009–2011 fires) houses per km2, although fires could occur at housing densities >75 if vegetation cover was >50% (2008–2012 fires; see Supplementary Materials, Figure S1). During 2000, fires occurred at densities of about 55 houses per km2 (2000 fires) if vegetation cover was >48%, although fires could occur at housing densities >80 to 104 if vegetation cover was >50% to 60% (1999–2001 fires and 1998–2002 fires). Addition of fire occurrence years increased complexity of trees or rules that invoked population density.
Regional differences generally appeared minimal, despite complexity of rulesets, perhaps due to limited number of fire occurrences or lack of regionally specific ecological differences in the predictor variables. Due to this stability, I did not balance samples by region. For the Interior region, fires occurred at housing densities of >37 if vegetation cover was >65% for 2008–2012 fires (see Supplementary Materials, Figure S2; Table 2). The classification tree for 1998–2002 was more complicated and spread among 3500 fires. For the Mountain region, fires occurred at housing densities of <51 to 64, although fires could occur at housing densities of <214 if vegetation cover was >72% (2008–2012 fires). For the Northeastern region, fires occurred at housing densities of <67 if vegetation cover was >40% for 2008–2012 fires, although fires could occur at housing densities of >67 if vegetation cover was >75%. Fires occurred at housing densities of <28 if vegetation cover was >39% or <124 if vegetation cover was >51% for 1998–2002 fires. For the Pacific region, fires occurred at housing densities of <37 if vegetation cover was >90% or >37 if vegetation cover was >54% for 2008–2012 fires. Fires occurred at housing densities of <115 if vegetation cover was >73% or <40 if vegetation cover was >20% for 1998–2002 fires. For the Southeastern region, fires occurred at housing densities of both greater than or less than 43 based on vegetation cover and population densities for 2008–2012 fires. Fires occurred at housing densities of <109 if vegetation cover was >40%.
In census blocks classified as interface during 2010 [12], fires occurred at housing densities <109, although fires could occur at housing densities of <287 if vegetation cover was >25% (2008–2012 fires; see Supplementary Materials, Figure S3; Table 2). In blocks classified as interface during 2000, fires occurred at housing densities <64, although fires could occur at housing densities of <280 if vegetation cover was >20% (1998–2002 fires). In blocks classified as intermix during 2010 [12], fires occurred at housing densities <62 (2008–2012 fires) and areas classified as intermix during 2000 had a complex decision tree.
According to these classifications, generalized guidelines were developed (Table 3). Low-density WUI was 6.17 to 50 houses/km2 and medium-density WUI was 50 to 100 houses/km2; these densities may encompass the area of greatest concern with maximum fire occurrences. High-density WUI was 100–200 houses/km2. Wildland–urban interface, or suburban, communities would be 200 to 400 houses/km2.
These guidelines were applied with vegetation cover >10%, given that fire was predicted to occur at that threshold, to determine area during 1990 and 2010 and then compared to the standard SILVIS WUI definitions, which had a 50% threshold of vegetation cover for intermix densities. Total WUI area was greater by about a factor of 1.2 for the reclassified classes than the standard SILVIS WUI area. The area of low-density intermix was about 1.5 times greater even though housing density thresholds were the same because of the differing vegetation cover thresholds. Medium-density intermix had similar area even though the maximum housing density varied (i.e., the SILVIS WUI housing density extended to 741 houses/ha). Area of high-density intermix was much greater and area of interface was much less; both of these housing density ranges also differed from the standard SILVIS WUI definitions. Area in the reclassified WUI increased by 220,000 km2 compared to 190,000 km2 during the decade, although the percent growth was the same (i.e., 33%).
4. Discussion
Human infrastructure had a stronger relationship than human density with fire occurrences, which aligns with the concept of WUI and protection concerns for housing from fire in the wildland–urban interface. This is important to establish because it is the humans and not the houses that increase number of ignitions. Houses may be influential on fire occurrences indirectly by both reducing vegetation cover and housing humans, which are the sources of additional ignitions. Stewart et al. [10] correspondingly determined that the definition of WUI was most sensitive to housing density.
Fires overall were classified to occur at lower housing densities below 100/km2, as long as percent vegetation cover was at least 10%, albeit with a wide range of values for percent vegetation cover varying with housing densities in each spatiotemporal model (Figure 2). The 10% vegetation cover was a much lower vegetation cover threshold than the standard of 50% for intermix types. The upper limit of the wildland–urban interface for the conterminous United States during 2010 occurred at densities of about 75 to 90 houses per km2. The 2000 wildland–urban interface had a greater upper range from 55 to 104/km2 that was more moderated by vegetation cover than the 2010 wildland–urban interface. By region, fire occurrences generally followed similar rulesets to the conterminous US. Rulesets for interface communities expanded the upper limit of housing densities to 280 or 290 houses/km2; however, these greater densities were not as likely to have fire occurrence according to conterminous and regional classifications.
Generalized reclassifications of WUI are very simple, without the wide range of housing densities of the standard WUI classes or vegetation modifiers (Table 3). The new classifications contain two low-density classes that match standard definitions by housing density. According to these rulesets, a generalized guideline is continuation of the wildlands definition of <6.17 houses per km2. Low-density WUI would be 6.17 to 50 houses/km2, also a continuation of the existing standard definition, although depending on the vegetation cover and distance modifiers, the area identified varies greatly (see Table 3). The other classes differed by housing density, including medium-density WUI of 50–100 houses/km2, a density that typically included the maximum end of predicted fire occurrences, and high-density WUI of 100–200 houses/km2. Wildland–urban interface, or suburban, communities would be 200 to 400 houses/km2, similar to suburban land use definitions [27]. The classifications showed that the standard definition of 741 structures/km2 is too high, as Theobald and Romme [18] stated. These straightforward guidelines support the use of functional, real-world applications and may translate well internationally. The major findings of importance, of housing density as a predictor variable and, secondly, fire exposure primarily at housing density classes <100/km2, were stable by region and decade. Thus, it is likely that these findings will continue to be applicable when 2020 census information has been collected and processed.
The new classifications included vegetation cover but at a lower percent and did not account for distance to vegetation. Therefore, even though the density ranges remained the same in the low-density class, the areal extent was much greater with different vegetation modifiers, of 10% vegetation cover rather than 50%. At least 10% and perhaps >35% vegetation cover is necessary for fire spread, depending on housing density and (unknown) characteristics of vegetation, such as flammability and spatial arrangement. Accounting for minimum cover and configuration of vegetation remains uncertain and may need to be conducted at the community scale with building location data. Vegetation classification also has changed over time. Indeed, a newly revised version of the National Land Cover Database was published to update all previously released versions of landcover, which is not directly comparable to previous products [28]. This methodology can be applied again with newly updated vegetation cover, 2020 housing and population densities, and fire occurrences bracketing the year 2020. Regarding distance between housing and vegetation, such variability exists within and between vegetation types that one distance is not likely to be particularly useful in classification.
These classifiers performed well (sensitivity of 0.87 to 0.91) despite access to only three predictor variables, potentially imprecise fire locations, and incorrect values of the non-fire class. Not all areas that are susceptible to burning, at the intersection of vegetation and housing, will burn every year. Certainly, other variables are risk factors for fire occurrence and spread, not to mention severity, including time since last fire, quantity and flammability of vegetation, severe weather, climate, number of ignitions, topography, land use, fire breaks, and “firespreads” or “firesheds”.
The number of fires >0.4 ha was notable by region, with about 10 times more wildfires in the Southeast. In this region, both lightning and prescribed burns are common, and at least the historical vegetation carried frequent fire, which may be among the reasons for more wildfires. The Northeast had about 9000 fires, due primarily to the number of fires in New York. It is unclear why fires are common in New York, as causes of wildfire were primarily identified (67%) as “miscellaneous”. The other regions had 2000 to 4000 fires.
Implications of WUI reclassification include more communities identified with exposure to fire. Total WUI area in the United States increased by 33% between from 1990 to 2010 and 50% between 1970 and 2000 [12,18]. According to the new classifications, percent growth between 1990 and 2010 remained the same, but the total area in WUI was greater in the reclassification, at 926,000 km2 compared to 770,000 km2. However, the critical area of low and medium-density WUI was for housing densities below 100 houses/km2; this areal extent was greater at 855,000 km2 in the reclassification compared to 607,000 km2. The new area is with a minimum 10% vegetation cover in the census block and although a greater threshold in vegetation cover would reduce the area, it may remove communities that are at risk. The low-density class, which is at greatest risk of fire, covered the greatest area in both definitions and has diffuse housing that is difficult to protect, especially in the new classifications that increased the areal extent. Fortunately, the medium-density class that may be of greatest concern, in terms of maximum concentration of housing densities where fire occurrence was predicted, had similar areal extent as the standard definition, although the spatial locations may differ.
A greater area of WUI, or more communities of concern for fire exposure, may prompt protection and actions to mitigate risk through fuel treatments. National mitigation activities may be focused on the low and medium housing density classes (housing densities < 100/km2), identified as at greatest risk. Houses located in the wildland–urban interface will be exposed to wildfire, given sufficient vegetation to carry fire, resulting in a tension between periodic fire that occurs in ecosystems and the need to minimize negative impacts to people and their homes from wildfire. At most national levels, funding primarily is allocated for reactive fire suppression rather than proactive fuel treatments [29]. Fire suppression in wildlands may result in increased fire suppression as fuels accumulate, greater consequent severity of wildfires due to postponement, and escalation of fire suppression costs [4]. Risk of wildfires in wildlands can be reduced by lessening stand density through preventative thinning or prescribed burning [4]. Although fuel treatments change fire behavior, they do not suppress fires [4]. Recent reintroduction of fire for forest and fuel management is limited by social constraints and pressures, which may be most acute in the wildland–urban interface, particularly as most of the WUI is privately owned. Likewise, application of fuel treatments in WUI lands also may require access or proximity to private lands, hindering the ability of public agencies to manage fuels in WUI lands without extensive resources spent on agreements with private landowners. In any event, only about 11% of fuel treatments by United States federal agencies were within 2.5 km of WUI lands during 2004–2008 [11].
Communities and landowners also can minimize vulnerability. A variety of different strategies have been developed internationally to increase awareness about the problem of fire risk in the WUI through outreach and to reduce fire risk through mitigation and planning [6]. The most effective fire prevention occurs on the exterior structure and immediate surroundings [4]. Private landowners can lessen risk by creating defensible space around houses by limiting flammable vegetation and removing entry holes or flammable wood surfaces on or around houses to prevent burning by wind-borne embers, which may cause more residential losses than direct flames or radiant heat [30]. However, many wildland–urban interface residents underinvest in mitigation actions and do not realize the risk of fire without outreach notifications [31]. While individual homeowner actions are essential to reduce the potential for wildfire damage to property, entire communities ideally would be adapted to fire such that fire could spread through a community without causing extensive damage. Fire-adapted communities are “knowledgeable, engaged communities where actions of residents and agencies in relation to infrastructure, buildings, landscaping and the surrounding ecosystem lessen the need for extensive protection actions and enable the communities to safely accept fire as part of the surrounding landscape” [32]. Thus, fire-adapted communities do not rely solely on suppression, and associated fire protection services, but are able to tolerate fires. Zoning and planning authority for WUI development typically rests with county and municipal governments [33]. Planning guidelines that reduce WUI dispersion will result in easier wildfire defense and evacuation of people from WUI communities. The safest strategy is to avoid building in the most vulnerable environments. Disclosure of wildfire risk, similarly to flood risk, may reduce willingness of people to move into particularly fire-prone areas, affecting spread of future housing development [34].
Classifications of WUI areas that intermix with fire additionally are meaningful for understanding relationships between human communities and the natural environment. Fire is part of the Earth system, influential on biota, soil, carbon cycling, and water, and fire also interacts with humans through social and economic spheres [35]. Coexistence of human societies with fire may be a relevant objective to integrate into Sustainable Development Goals (SDGs) of the United Nations to increase adaptation to fire in communities with high fire exposure [35,36,37]. Sustainable development involves recognizing and planning for effects of natural disturbances on ecosystem services while limiting housing sprawl, which relates to WUI definitions and management of fire and housing densities [33,36]. Presence of housing in wildlands also creates a cascade of ecological impacts, including changes in density and richness of native species and spread of non-native species, which may promote different fire regimes [12].
5. Conclusions
Classification of the wildland–urban interface based on fire occurrences provides a reliable foundation for detecting residential densities at risk of fire, which primarily were housing densities of <100/km2. Although the WUI is well-conceptualized in terms of the interaction between human structures and vegetation/fuels, this method specifically accounts for wildland fire risk of occurrence, unlike the majority of definitions. The WUI area, calculated explicitly from fire occurrence, is with a minimum 10% vegetation cover in the census blocks. A greater threshold would reduce the area of WUI; however, fires were predicted to occur at as low as 10% vegetation cover for some housing densities and models. This may be due to where vegetation occurs within the census block relative to housing, potential misclassification of land cover, and characteristics of the vegetation as related to fuels for fire. The classification does not include fire severity, which may be altered by surrounding vegetation, date of last fire or treatment for fuel loads, and mitigation around home ignition zones. Numerous factors influence fire including weather and timing, which varies from year to year. Most historical fire regimes did not occur every year, and perhaps not every five to ten years. Nevertheless, the wildland-interface is susceptible to fire due to the juxtaposition of vegetation and human-caused ignitions [7] and the classification rules generally were stable in space by region and time by decade.
Reclassifying the wildland–urban interface thresholds, with a lower vegetation cover modifier, has numerous implications, including directing mitigation activities to the low and medium-density classes, redefining interface as suburban communities and perhaps concurrently renaming WUI as wildland–urban intermix, new characterization of communities at greatest risk, and changing summaries and maps of WUI over time. Defining the critical WUI area of concern provides information necessary for decisionmakers to allocate resources for fire mitigation and protection services and disclosure of risk to alert homeowners and communities for planning and actions to coexist with fire. Additionally, the simplified guidelines are compatible with classifications of urban, suburban, and rural areas. To have consistent and stable densities in WUI classifications may be useful internationally and for research and management of non-fire issues in the WUI.
Supplementary Materials
The following are available online at https://0-www-mdpi-com.brum.beds.ac.uk/2073-445X/9/7/225/s1, Figure S1: Classification trees or rules for the conterminous United States, Figure S2: Classification trees or rules by region, and Figure S3: Classification trees or rules for interface and intermix.
Funding
This research received no external funding.
Acknowledgments
I thank three anonymous reviewers for their helpful comments.
Conflicts of Interest
The author declares no conflict of interest.
References
- Pausas, J.G.; Keeley, J.E. A Burning Story: The Role of Fire in the History of Life. Bioscience 2009, 59, 593–601. [Google Scholar] [CrossRef] [Green Version]
- Doerr, S.H.; Santin, C. Global trends in wildfire and its impacts: Perceptions versus realities in a changing world. Philos. Trans. R. Soc. B. Boil. Sci. 2016, 371, 20150345. [Google Scholar] [CrossRef] [PubMed]
- Roos, C.I.; Bowman, D.M.J.S.; Balch, J.K.; Artaxo, P.; Bond, W.J.; Cochrane, M.; D’Antonio, C.M.; DeFries, R.; Mack, M.; Johnston, F.H.; et al. Pyrogeography, historical ecology, and the human dimensions of fire regimes. J. Biogeogr. 2014, 41, 833–836. [Google Scholar] [CrossRef]
- Calkin, D.E.; Cohen, J.D.; Finney, M.A.; Thompson, M.P. How risk management can prevent future wildfire disasters in the wildland-urban interface. Proc. Natl. Acad. Sci. USA 2013, 111, 746–751. [Google Scholar] [CrossRef] [PubMed] [Green Version]
- Caton, S.E.; Hakes, R.S.P.; Gorham, D.J.; Zhou, A.; Gollner, M. Review of Pathways for Building Fire Spread in the Wildland Urban Interface Part I: Exposure Conditions. Fire Technol. 2016, 53, 429–473. [Google Scholar] [CrossRef]
- Bento-Gonçalves, A.; Vieira, A. Wildfires in the wildland-urban interface: Key concepts and evaluation methodologies. Sci. Total. Environ. 2020, 707, 135592. [Google Scholar] [CrossRef]
- Balch, J.K.; Bradley, B.A.; Abatzoglou, J.T.; Nagy, R.C.; Fusco, E.J.; Mahood, A.L. Human-Started Wildfires Expand the Fire Niche across the United States. Proc. Natl. Acad. Sci. USA 2017, 114, 2946–2951. [Google Scholar] [CrossRef] [Green Version]
- Zambon, I.; Cerdà, A.; Cudlin, P.; Serra, P.; Pili, S.; Salvati, L. Road network and the spatial distribution of wildfires in the Valencian community (1993–2015). Agriculture 2019, 9, 100. [Google Scholar] [CrossRef] [Green Version]
- United States Department of Agriculture and Department of the Interior. Urban Wildland Interface Communities Within the Vicinity of Federal Lands that Are at High Risk from Wildfire. Fed. Reg. 2001, 66, 751–777. [Google Scholar]
- Stewart, S.I.; Radeloff, V.C.; Hammer, R.B.; Hawbaker, T.J. Defining the wildland–urban interface. J. For. 2007, 105, 201–207. [Google Scholar]
- Schoennagel, T.; Nelson, C.R.; Theobald, D.M.; Carnwath, G.C.; Chapman, T.B. Implementation of National Fire Plan treatments near the wildland–urban interface in the western United States. Proc. Natl. Acad. Sci. USA 2009, 106, 10706–10711. [Google Scholar] [CrossRef] [PubMed] [Green Version]
- Radeloff, V.C.; Helmers, D.P.; Kramer, H.A.; Mockrin, M.H.; Alexandre, P.M.; Bar-Massada, A.; Butsic, V.; Hawbaker, T.J.; Martinuzzi, S.; Syphard, A.; et al. Rapid growth of the US wildland-urban interface raises wildfire risk. Proc. Natl. Acad. Sci. USA 2018, 115, 3314–3319. [Google Scholar] [CrossRef] [PubMed] [Green Version]
- Homer, C.; Dewitz, J.; Yang, L.; Jin, S.; Danielson, P.; Xian, G.; Coulston, J.; Herold, N.; Wickham, J.; Megown, K. Completion of the 2011 National Land Cover Database for the conterminous United States–representing a decade of land cover change information. Photogramm. Eng. Remote Sens. 2015, 81, 345–354. [Google Scholar]
- Mell, W.; Manzello, S.L.; Maranghides, A.; Butry, D.; Rehm, R.G. The wildland - urban interface fire problem—Current approaches and research needs. Int. J. Wildland Fire 2010, 19, 238–251. [Google Scholar] [CrossRef]
- Platt, R.V. The wildland–urban interface: Evaluating the definition effect. J. For. 2010, 108, 9–15. [Google Scholar]
- Haight, R.G.; Cleland, D.T.; Hammer, R.B.; Radeloff, V.C.; Rupp, T.S. Assessing fire risk in the wildland-urban interface. J. For. 2004, 102, 41–48. [Google Scholar]
- Johnston, L. Mapping Canadian Wildland Fire Interface Areas. Master’s Thesis, University of Alberta, Alberta, AB, Canada, 2016. [Google Scholar]
- Theobald, D.M.; Romme, W.H. Expansion of the US wildland–urban interface. Landsc. Urban Plan. 2007, 83, 340–354. [Google Scholar] [CrossRef]
- Short, K.C. Spatial Wildfire Occurrence Data for the United States, 1992–2015 [FPA_FOD_20170508], 4th ed.; Forest Service Research Data Archive: Fort Collins, CO, USA, 2017. [Google Scholar]
- Hanberry, B.B.; He, H.S.; Palik, B.J. Pseudoabsence Generation Strategies for Species Distribution Models. PLoS ONE 2012, 7. [Google Scholar] [CrossRef] [Green Version]
- Fernández-Delgado, M.; Cernadas, E.; Barro, S.; Amorim, D. Do we need hundreds of classifiers to solve real world classification problems? J. Mach. Learn. Res. 2014, 15, 3133–3181. [Google Scholar]
- Chen, T.; Guestrin, C. XGBoost: A Scalable Tree Boosting System. In Proceedings of the 22nd ACM SIGKDD International Conference on Knowledge Discovery and Data Mining—KDD ’16, San Francisco, CA, USA, 13–17 August 2016; ACM Press: New York, NY, USA, 2016; pp. 785–794. [Google Scholar] [CrossRef] [Green Version]
- Hanberry, B.B.; He, H.S. Prevalence, statistical thresholds, and accuracy assessment for species distribution models. Web Ecol. 2013, 13–19. [Google Scholar] [CrossRef]
- Kuhn, M. Building Predictive Models in R Using the caret Package. J. Stat. Softw. 2008, 28, 1–26. [Google Scholar] [CrossRef] [Green Version]
- R Core Team R: A Language and Environment for Statistical Computing; R Foundation for Statistical Computing: Vienna, Austria, 2020.
- C5.0: An Informal Tutorial, 2019. Rulequest Research. Available online: https://www.rulequest.com/see5-unix.html (accessed on 28 May 2020).
- United States Environmental Protection Agency (EPA). Updates to the Demographic and Spatial Allocation Models to Produce Integrated Climate and Land Use Scenarios (ICLUS) Version 2; EPA/600/R-16/366F; National Center for Environmental Assessment: Washington, DC, USA, 2017. Available online: https://edg.epa.gov/metadata/catalog/main/home.page (accessed on 25 February 2020).
- Homer, C.; Dewitz, J.; Jin, S.; Xian, G.; Costello, C.; Danielson, P.; Gass, L.; Funk, M.; Wickham, J.; Stehman, S.; et al. Conterminous United States land cover change patterns 2001–2016 from the 2016 National Land Cover Database. ISPRS J. Photogramm. Remote Sens. 2020, 162, 184–199. [Google Scholar] [CrossRef]
- Moreira, F.; Ascoli, D.; Safford, H.; Adams, M.; Moreno, J.M.; Pereira, J.C.; Catry, F.X.; Armesto, J.; Bond, W.J.; E González, M.; et al. Wildfire management in Mediterranean-type regions: paradigm change needed. Environ. Res. Lett. 2020, 15, 011001. [Google Scholar] [CrossRef]
- Cohen, J.D. Preventing disaster: Home ignitability in the wildland-urban interface. J. For. 2000, 98, 15–21. [Google Scholar]
- Ayres, A.; DeGolia, A.; Fienup, M.; Kim, Y.; Sainz, J.; Urbisci, L.; Viana, D.F.; Wesolowski, G.; Plantinga, A.J.; Tague, C.L. Social Science/Natural Science Perspectives on Wildfire and Climate Change. Geogr. Compass 2016, 10, 67–86. [Google Scholar] [CrossRef]
- What Is a Fire-Adapted Community? 2020. Fire Adapted Communities Learning Network. Available online: https://fireadapted.org (accessed on 23 June 2020).
- Zambon, I.; Cerdà, A.; Gambella, F.; Egidi, G.; Salvati, L. Industrial Sprawl and Residential Housing: Exploring the Interplay between Local Development and Land-Use Change in the Valencian Community, Spain. Land 2019, 8, 143. [Google Scholar] [CrossRef] [Green Version]
- Donovan, G.H.; Champ, P.A.; Butry, D.T. Wildfire Risk and Housing Prices: A Case Study from Colorado Springs. Land Econ. 2007, 83, 217–233. [Google Scholar] [CrossRef]
- Cerdà, A. The Role of Fire in Achieving the Sustainable Development Goals of the United Nations. Proceedings 2020, 30, 65. [Google Scholar] [CrossRef]
- United Nations Transforming Our World: The 2030 Agenda for Sustainable Development. 2015. Available online: https://sustainabledevelopment.un.org/post2015/transformingourworld/publication (accessed on 23 June 2020).
- Martin, D.A. Linking fire and the United Nations Sustainable Development Goals. Sci. Total. Environ. 2019, 662, 547–558. [Google Scholar] [CrossRef]
Figure 1.
Regions with occurrences of fire >0.4 ha during 2008–2012.

Figure 2.
Classification for 2010 fires in the conterminous United States, where fire occurrence is predicted from housing density and percent vegetation cover. Raw output modified to be clearer.
Figure 2.
Classification for 2010 fires in the conterminous United States, where fire occurrence is predicted from housing density and percent vegetation cover. Raw output modified to be clearer.


Table 1.
Sensitivity (true positive rate) of predictions by four different classifiers (C5.0; rf = random forests, prf = parallel random forests, xgbTree = extreme gradient boosting with trees) and two prevalence ratios (0.5 and 0.67) for test set (25% of observations) based on modeled training data of fire occurrences during 2010, 2009–2011, and 2008–2012 in WUI during 2010, and fire occurrences during 2000, 1999–2001, and 1998–2002 in wildland–urban interface (WUI) during 2000.
| WUI 2010 | Fire 2010 | Fire 2009–2011 | Fire 2008–2012 |
|---|---|---|---|
| C5.0 | |||
| 0.5 | 0.787 | 0.757 | 0.768 |
| 0.67 | 0.886 | 0.865 | 0.877 |
| rf | |||
| 0.5 | 0.760 | 0.765 | 0.786 |
| 0.67 | 0.876 | 0.874 | 0.878 |
| prf | |||
| 0.5 | 0.761 | 0.766 | 0.785 |
| 0.67 | 0.877 | 0.874 | 0.878 |
| xgbTree | |||
| 0.5 | 0.790 | 0.769 | 0.786 |
| 0.67 | 0.890 | 0.885 | 0.887 |
| WUI 2000 | Fire 2000 | Fire 1999–2001 | Fire 1998–2002 |
| C5.0 | |||
| 0.5 | 0.744 | 0.761 | 0.795 |
| 0.67 | 0.908 | 0.914 | 0.890 |
| rf | |||
| 0.5 | 0.785 | 0.764 | 0.829 |
| 0.67 | 0.873 | 0.875 | 0.898 |
| prf | |||
| 0.5 | 0.785 | 0.765 | 0.830 |
| 0.67 | 0.872 | 0.876 | 0.898 |
| xgbTree | |||
| 0.5 | 0.802 | 0.780 | 0.808 |
| 0.67 | 0.892 | 0.888 | 0.895 |
Table 2.
Sensitivity (true positive rate) of predictions for the C5.0 classifier at 0.67 prevalence from modeled training data of fire occurrences during 2008–2012 in WUI during 2010 and fire occurrences during 1998–2002 in WUI during 2000 by region and WUI type.
Table 2.
Sensitivity (true positive rate) of predictions for the C5.0 classifier at 0.67 prevalence from modeled training data of fire occurrences during 2008–2012 in WUI during 2010 and fire occurrences during 1998–2002 in WUI during 2000 by region and WUI type.
| WUI 2010 | Fire 2008–2012 | WUI 2000 | Fire 1998–2002 |
|---|---|---|---|
| Interior | 0.87 | Interior | 0.90 |
| Mountain | 0.90 | Mountain | 0.94 |
| Northeast | 0.87 | Northeast | 0.86 |
| Pacific | 0.91 | Pacific | 0.93 |
| Southeast | 0.91 | Southeast | 0.90 |
| intermix | 0.89 | intermix | 0.91 |
| interface | 0.90 | interface | 0.89 |
Table 3.
Area, and mean and range of housing densities (km2), for different classes of WUI from reclassified (>10% vegetation cover) and standard (SILVIS) WUI definitions (intermix WUI has >50% vegetation cover and interface WUI has <50% vegetation and is within 2.4 km of at least 75% wildland vegetation that is at least 5 km2 in area).
| 1990 | 2010 | |||||
|---|---|---|---|---|---|---|
| Reclassified (>10% Vegetation) | Area | Mean | Range | Area | Mean | Range |
| Low-density intermix | 603,971 | 21 | 6.17 to 50 | 779,782 | 21 | 6.17 to 50 |
| Medium-density intermix | 52,728 | 72 | 50 to 100 | 75,014 | 72 | 50 to 100 |
| High-density intermix | 31,121 | 144 | 100 to 200 | 44,933 | 144 | 100 to 200 |
| Interface | 17,306 | 285 | 200 to 400 | 26,273 | 285 | 200 to 400 |
| Total | 705,126 | 926,002 | ||||
| Standard (SILVIS) | ||||||
| Low-density intermix | 404,214 | 20 | 6.17 to 50 | 532,823 | 21 | 6.17 to 50 |
| Medium-density intermix | 50,557 | 181 | 50 to 741 | 74,547 | 173 | 50 to 741 |
| High-density intermix | 344 | 1807 | 741 to 954,230 | 285 | 1654 | 741 to 336,027 |
| Interface | 125,717 | 622 | 6.17 to 755,310 | 162,646 | 654 | 6.17 to 2,088,788 |
| Total | 580,831 | 770,301 | ||||
© 2020 by the author. Licensee MDPI, Basel, Switzerland. This article is an open access article distributed under the terms and conditions of the Creative Commons Attribution (CC BY) license (http://creativecommons.org/licenses/by/4.0/).
Share and Cite
MDPI and ACS Style
Hanberry, B.B. Reclassifying the Wildland–Urban Interface Using Fire Occurrences for the United States. Land 2020, 9, 225. https://0-doi-org.brum.beds.ac.uk/10.3390/land9070225
AMA Style
Hanberry BB. Reclassifying the Wildland–Urban Interface Using Fire Occurrences for the United States. Land. 2020; 9(7):225. https://0-doi-org.brum.beds.ac.uk/10.3390/land9070225
Chicago/Turabian StyleHanberry, Brice B. 2020. "Reclassifying the Wildland–Urban Interface Using Fire Occurrences for the United States" Land 9, no. 7: 225. https://0-doi-org.brum.beds.ac.uk/10.3390/land9070225
Note that from the first issue of 2016, this journal uses article numbers instead of page numbers. See further details here.