1. Introduction
The shifts in land use and territorial occupation are a topic of great relevance at global, national and regional levels, due to the impacts that these changes can have on the ecological, environmental and socio-economic systems [
1,
2]. Those changes in land use and territorial occupation are a direct manifestation of human activity upon the natural environment [
1,
2].
In this regard, the evaluation of land-use changes (LUC) has become essential in several areas such as spatial and urban planning, environmental monitoring, in policy-making, economic and social levels, among many other fields.
The pattern of land use and occupation raised several issues related to efficiency and sustainability. In fact, nowadays, those issues constitute one of the significant challenges for urban policies [
3]. Thus, it is essential to have more profound knowledge and learn to better manage the existing territorial resources, in a more efficient and integrated way; also, it is crucial to make territory more resilient, promoting its adaptation to the growing exposure of the dynamics of globalization and external impacts, whether economic or climatic; furthermore, it is crucial to pursue a more sustainable model of territorial development, centered on the rehabilitation and regeneration of existing territories, in the containment of urban perimeters and also, in the promotion of a polycentric territorial structure; finally, it is also relevant to create the conditions for island territories to gain scale and competitiveness in the strengthening, growth, and internationalization of their economy.
Thus, the need to gain more information about the Earth’s surface and its territorial occupation has led to many initiatives to study the use and land cover and their associated dynamics and models [
4,
5]. Many global or continental data sets relating to land cover (mostly from Earth observation via satellite) have been developed, designed, and generated. Nowadays, there is an extensive typology of different mapping models [
5].
From a large amount of existing Geographical Information Systems (GIS), we should highlight the Global Land Cover (GLC2000) designed for the year 2000 or the Pan-European Land Cover Monitoring project (PELCOM) (based on satellite images from 1996). In this regard, for the regional and local scales, there is the CORINE (Coordination of Information on the Environment) cartography [
4].
Since 2006, countries as Germany, Austria, United Kingdom, Sweden, Switzerland, among several others, have started to use GIS tools to obtain maps with more detail than traditional cartography [
5]. These new methods used by the GIS instruments provide more stability to the maps regarding the land uses and land covers, which have fostered the debate over this issue [
5]. However, the CORINE cartography contemplates all these techniques and methods [
4].
In this regard, a monitoring process of the LUC and territorial occupation in Europe was conducted in a unified manner. Contextually, the CORINE land cover inventory (CLC) was designed from standardized images obtained by satellite. This joint database exploited by a considerable amount of organizations in Europe and co-financed by the European Commission, and the member states has been managed by the European Environment Agency (EEA). This processing considers many land-use coverages, the guidelines of the System of Economic and Environmental Accounts (SEEA) for ‘land and ecosystem’. The CORINE project portrays the land-use cover of the European Union (EU); it is seen as an essential complement to the understanding of its main LUC [
6,
7].
The diversity of land-use and occupation maps results from the application of several methodologies and models underlying their achievement: many layouts, syntactic issues, schematic heterogeneity, and semantic aspects [
8]. Nevertheless, if we use various mapping methods, it is hard to differentiate between changes in land uses and territorial occupation. This may result from the fact that these shifts are the result of several approaches taken to create that map [
9].
Land-cover and Land-use maps can play a pivotal role in balancing the socio-economic, political, cultural, and environmental factors of a specific territory [
10]. They permit the analysis of substantial changes in the landscape, as well as the study of periods and tendencies. Many research projects have been carried out in European territories regarding LUC, their dynamics, and models. Nevertheless, regarding the peripheral and insular regions and territories, as is the case of the Canary Islands (Spain), these types of study lacks development, which maximizes the relevance of the present study, permitting is to gain further knowledge regarding the dynamics, barriers, and opportunities ongoing on those territories.
Contextually, the insular and peripheral territories are highly affected by their geographic location, leading to a high degree of isolation. Moreover, if we bear in mind their usually small dimensions (spatial restrictions), these territories can be seen as challenges with specific fragilities and resistance to changes [
11].
Many authors have conducted territorial studies based on GIS Tools and CORINE data. As an example there is the study of Vizzari et al. [
12] where CORINE data were used and applied to study metropolitan areas in France; the work of Varga et al. [
13] have studied the effects of category aggregation on land change simulation based on CORINE data; the investigations of Santana-Cordero et al. [
14,
15] or Pérez-Hernández et al. [
16] where GIS tools were used to analyze the land use on coastal dune systems on insular territories.
Therefore, territorial planning strategy is, in itself, a fundamental instrument for attributing pre-conditions of wealth to the inhabitants, thereby fostering prosperity for future generations living on that territory, fostering the reduction of social unbalances and spatial inequalities, as well as being a stimulus instrument for sustainable development [
11,
17,
18,
19,
20,
21,
22].
Bearing in mind the Brundtland report [
22], sustainability becomes a worldwide concern once all of us are involved as an integrated part in this process. Many questions arise from it, such as what the concept “really” means? How can we measure sustainability? Which are the strategies that should be implemented? Which are the future steps? [
23,
24]. Even if a strong interrelationship exists between the economic, social, and environmental pillars, they are considered separately, which could lead us to unsustainable tendencies [
23]. For example, the insular regions characterized by limited land and hydric resources management issues attest to the complexity of uniformity of the different pillars of sustainability. Considering that land is an even more scarce resource in insular territories, it is vital to regulate its uses. The use of GIS tools in these territories is essential to add additional help for the decision making and planning processes in these specific regions [
23,
25].
The overall goal of the present research is to analyze and assess the LUC in peripheral or “ultra-peripheral” areas, through a practical approach to a case study: the Canary Archipelago (Spain). Besides the main goal, it is also expected that the study could provide some directions for the main actors of the territorial planning process i.e., disclosing some barriers and opportunities for a sustainable growth and development process in the archipelago.
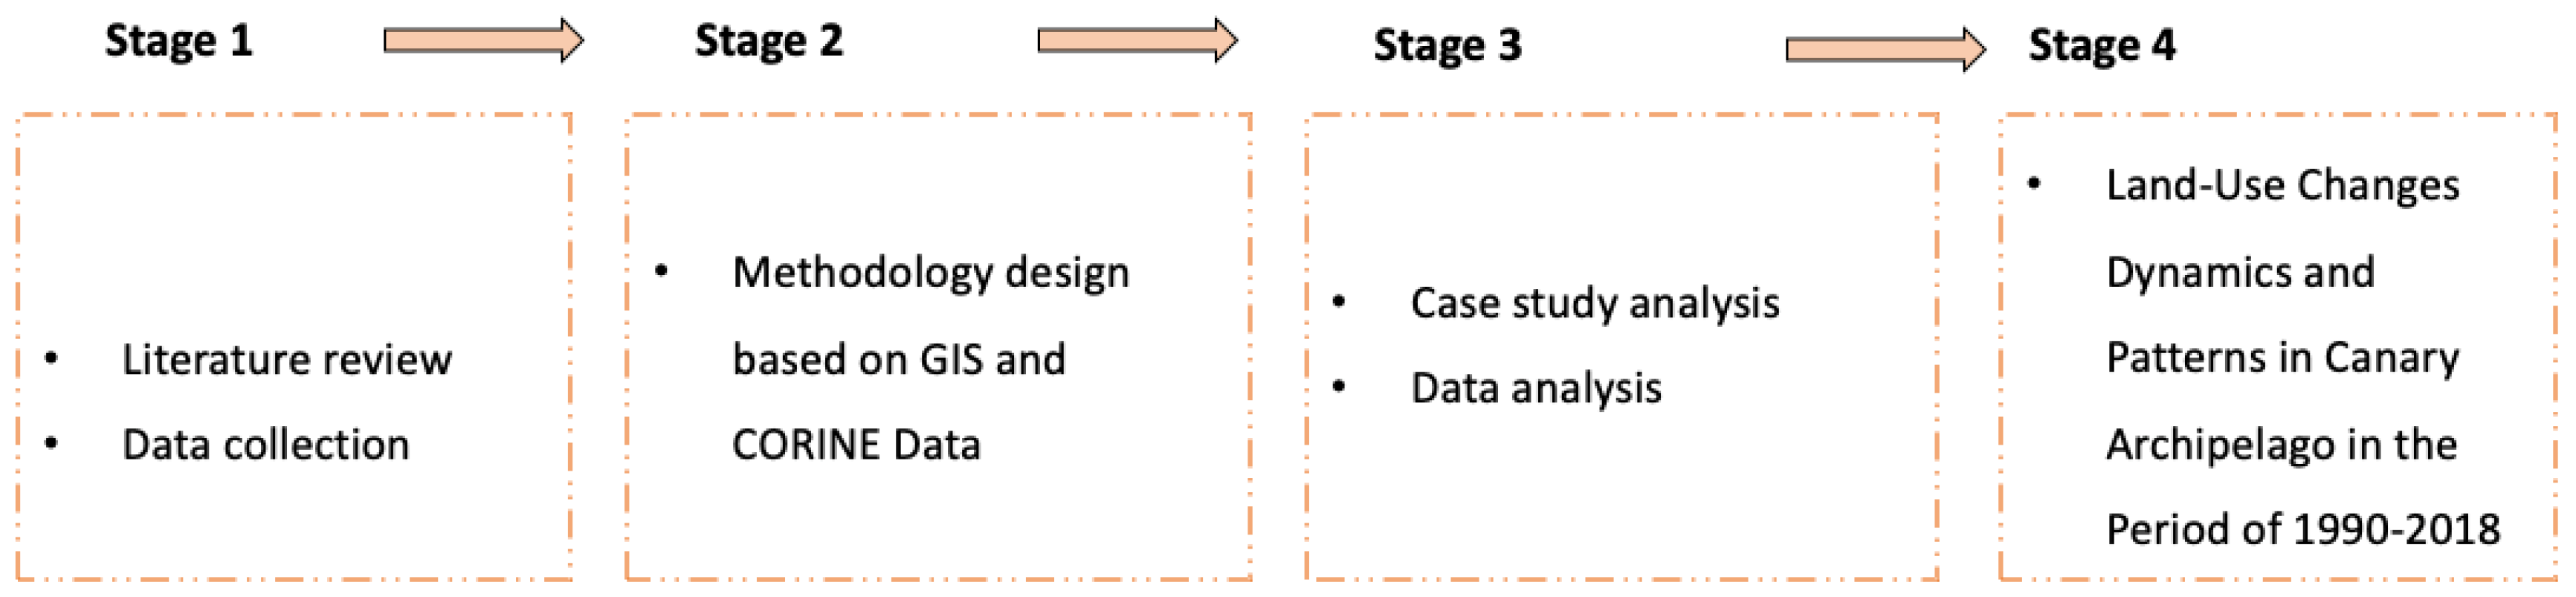
2. Methodology
The analysis area is located on the islands of the Canary Islands in Spain. The tool used was the Arcgis 10.5 Geographic Information Systems Management Software and Microsoft Office Professional Plus 2016. The analyzed data were provided by CORINE land cover (CLC).
In this regard, the working scale was 1:100,000, and the minimum cartographic unit was 25 ha. Likewise, the geometric precision was always greater than 100 m. The representation of the land uses was undertaken employing polygonal graphical entities. Polygons were associated with a land-use code to which they refer. For this reason, a specific coding was developed in three levels of detail. Thus, there were 44 classes at level 3, with the highest degree of detail (
Table 1).
Firstly, the geodatabases were adequately made for every year of study (1990, 2000, 2006, 2012, and 2018). After that, the alphanumeric information supplied by CLC in 1990, as well as the information regarding the variation between 2000 and 1990, was added to the geodatabase in 1990. Consequently, new graphical entities were created. Then, the same procedure was made to get the new geodatabases for the rest of the years.
After that, the administrative limits of the Canary Islands were downloaded, using the geoportal belonging to the Center of Geographical Information Institute in Spain.
In order to obtain the representative polygons of LUC for each year, we confronted them with the administrative limits, through a geo-process.
Finally, the proportion of extension for each land use is calculated using percentage, which is determined by using structured query language (SQL). The procedure was repeated for each year analyzed.
Also, a chart of the used methodology in the study is shown in the following (
Figure 1).
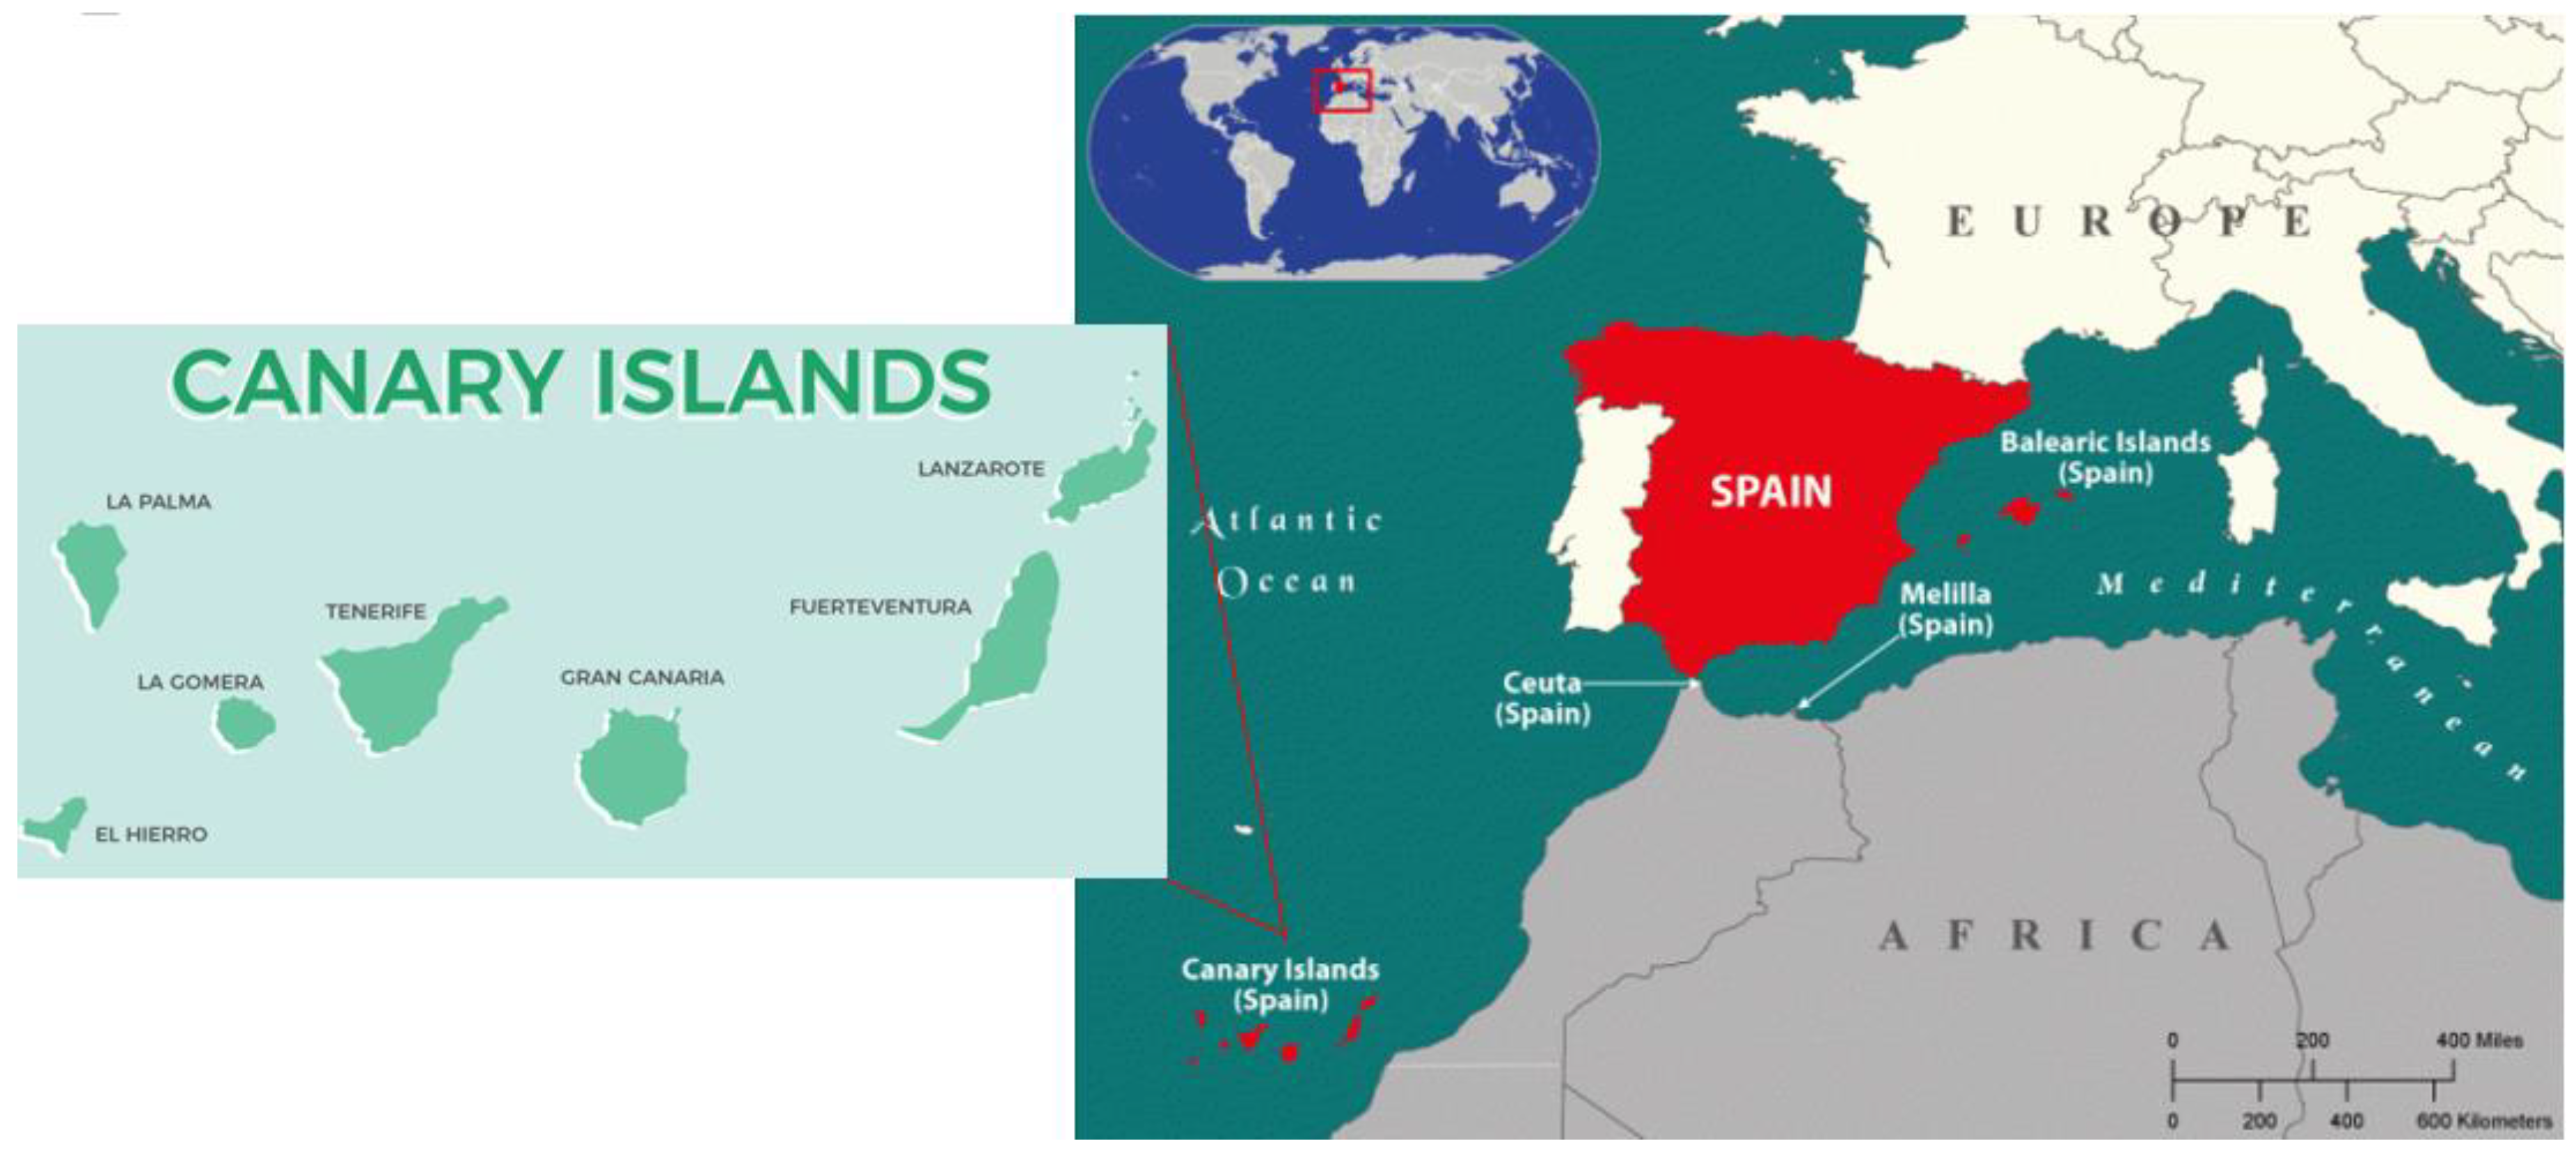
Case Study Area: A Brief Description
The Canary archipelago is composed of seven principal volcanic islands with a few small islets and islets [
26]. The archipelago is located in the eastern Atlantic Ocean, between 27°37′ and 29°25′ North, and 13°20′ and 18°10′ West, in front of the Saharan coast of Africa [
26]. Along a length of 400 km from East to West, the islands are Lanzarote, Fuerteventura, Gran Canaria, Tenerife, La Gomera, La Palma, and El Hierro (
Figure 2). Also, the main geographical features are shown in
Table 2.
The low rainfall and the topography of these islands create some points of water. However, there is an absence of rivers. The islands most exposed to the influence of the ocean and rain are La Palma, La Gomera, and El Hierro. The average annual temperature of 20 °C (with slight fluctuations), except in mountainous areas (is lower).
The traditional activities of the Canaries are the production of bananas, tomatoes, potatoes, livestock, fishing, fish farming, the production of plants and flowers, wine-growing, the agri-food industry, as well as energy and desalination of seawater. Also, the region is investing in activities as research and development in the field of biomedicine, astronomy, and tourism.
In 2017, economic activity was, respectively 85.7% in services (dominated by tourism), 7.6% in industry and energy, and 5.4% in construction, and 3.7% in the manufacturing industry and 1.3% in agriculture, animal breeding and fishing. However, there are large variations from island to island [
29].
In the Canary Islands, tourism acquires a significant relevance in several contexts due to its economic potential; however, this phenomenon’s social focus needs to be disseminated and valued [
30]. In the archipelago, tourism is a social phenomenon in which people move voluntarily for a certain period for various reasons, such as recreation, rest, culture, or health [
30]. Therefore, as Santana [
31] recalls, tourism is a complex and dynamic activity in close relationship with society and its nuances—behaviour, motivations, values, history, traditions, and beliefs.
The Canary Islands are a tourist destination in the reorientation phase [
32]. In this regard, the Government of the Canary Islands is committed to “the renewal, innovation and regeneration” of the tourist space, always having as north tourism of higher quality [
32,
33].
Contextually, tourism planning necessarily involves planning both in terms of the tourism system and in terms of spatial planning [
34]. Thus, it is increasingly common to have land-use policies, namely legislation on the division of the territory into areas ranging from categories of environmental protection to supposedly controlled tourism development spaces [
34]. However, spatial planning is often a concern that arises posteriori when many destinations are already frankly overloaded or threatened [
35].
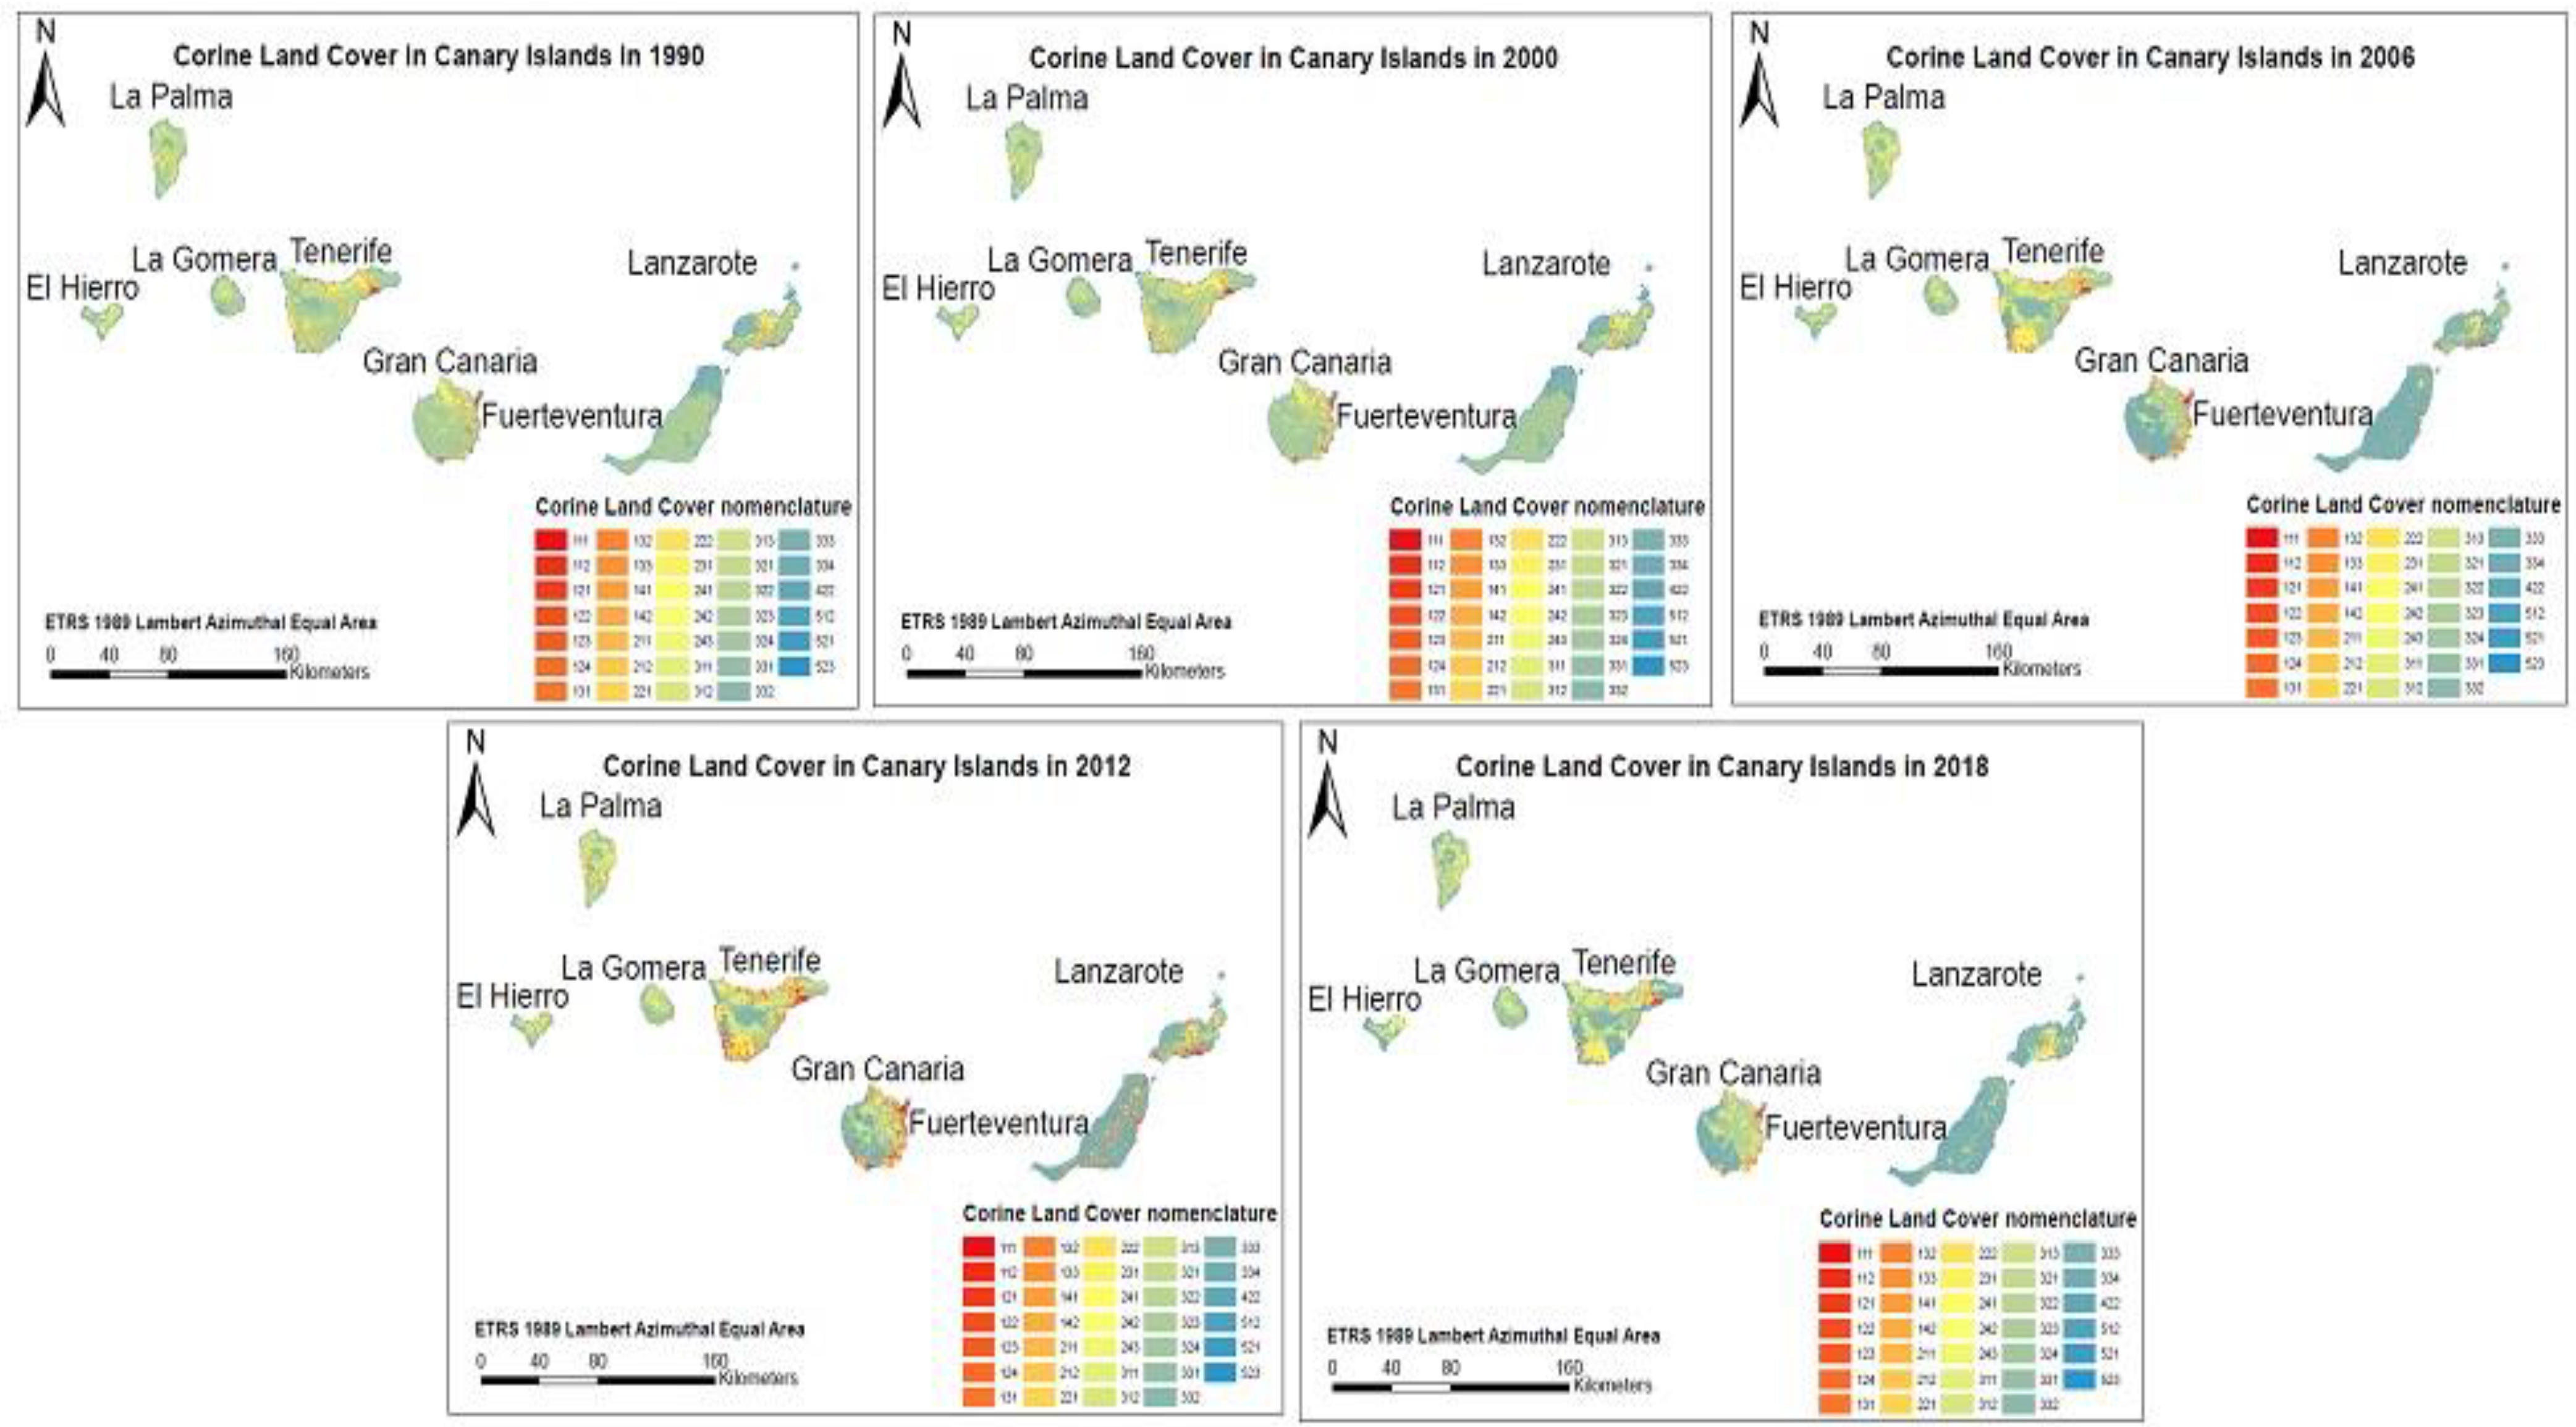
3. Outcomes and Discussions
This section analyzes the evolution of land uses determined by the CLC for the Canary Islands in the years 1990, 2000, 2006, 2012, and 2018 (
Figure 3). Also, the analysis of the LUC variation in the percentage of occupation is shown in
Table 3,
Table 4,
Table 5,
Table 6,
Table 7 and
Table 8. Population density map by municipalities of the Canary Islands is shown in the
Figure 4.
According to the maps of
Figure 3, it is possible to verify that in the bigger islands (Tenerife, Gran Canarias, Fuerteventura y Lanzarote), there is more variation in the land uses. Also, a higher variation is founded in peripheral areas. In those Island areas (Tenerife and Gran Canarias), there is more population, and tourism activities are more intensive instead in the other islands of the archipelago (
Figure 4). Therefore, this higher anthropic pressure could explain such variations. On the other hand, the inner areas are being less exploited for human use, and they are more preserved (
Figure 3). This fact is noteworthy to prevent climate change and preserve the ecosystems in the archipelago. Besides, it is noticeable that the predominance of forests and semi-natural areas is the most prevalent in the Canary Islands for the period analyzed, followed by agricultural areas. Percentages of land use in Canary Islands according to CORINE are shown in the
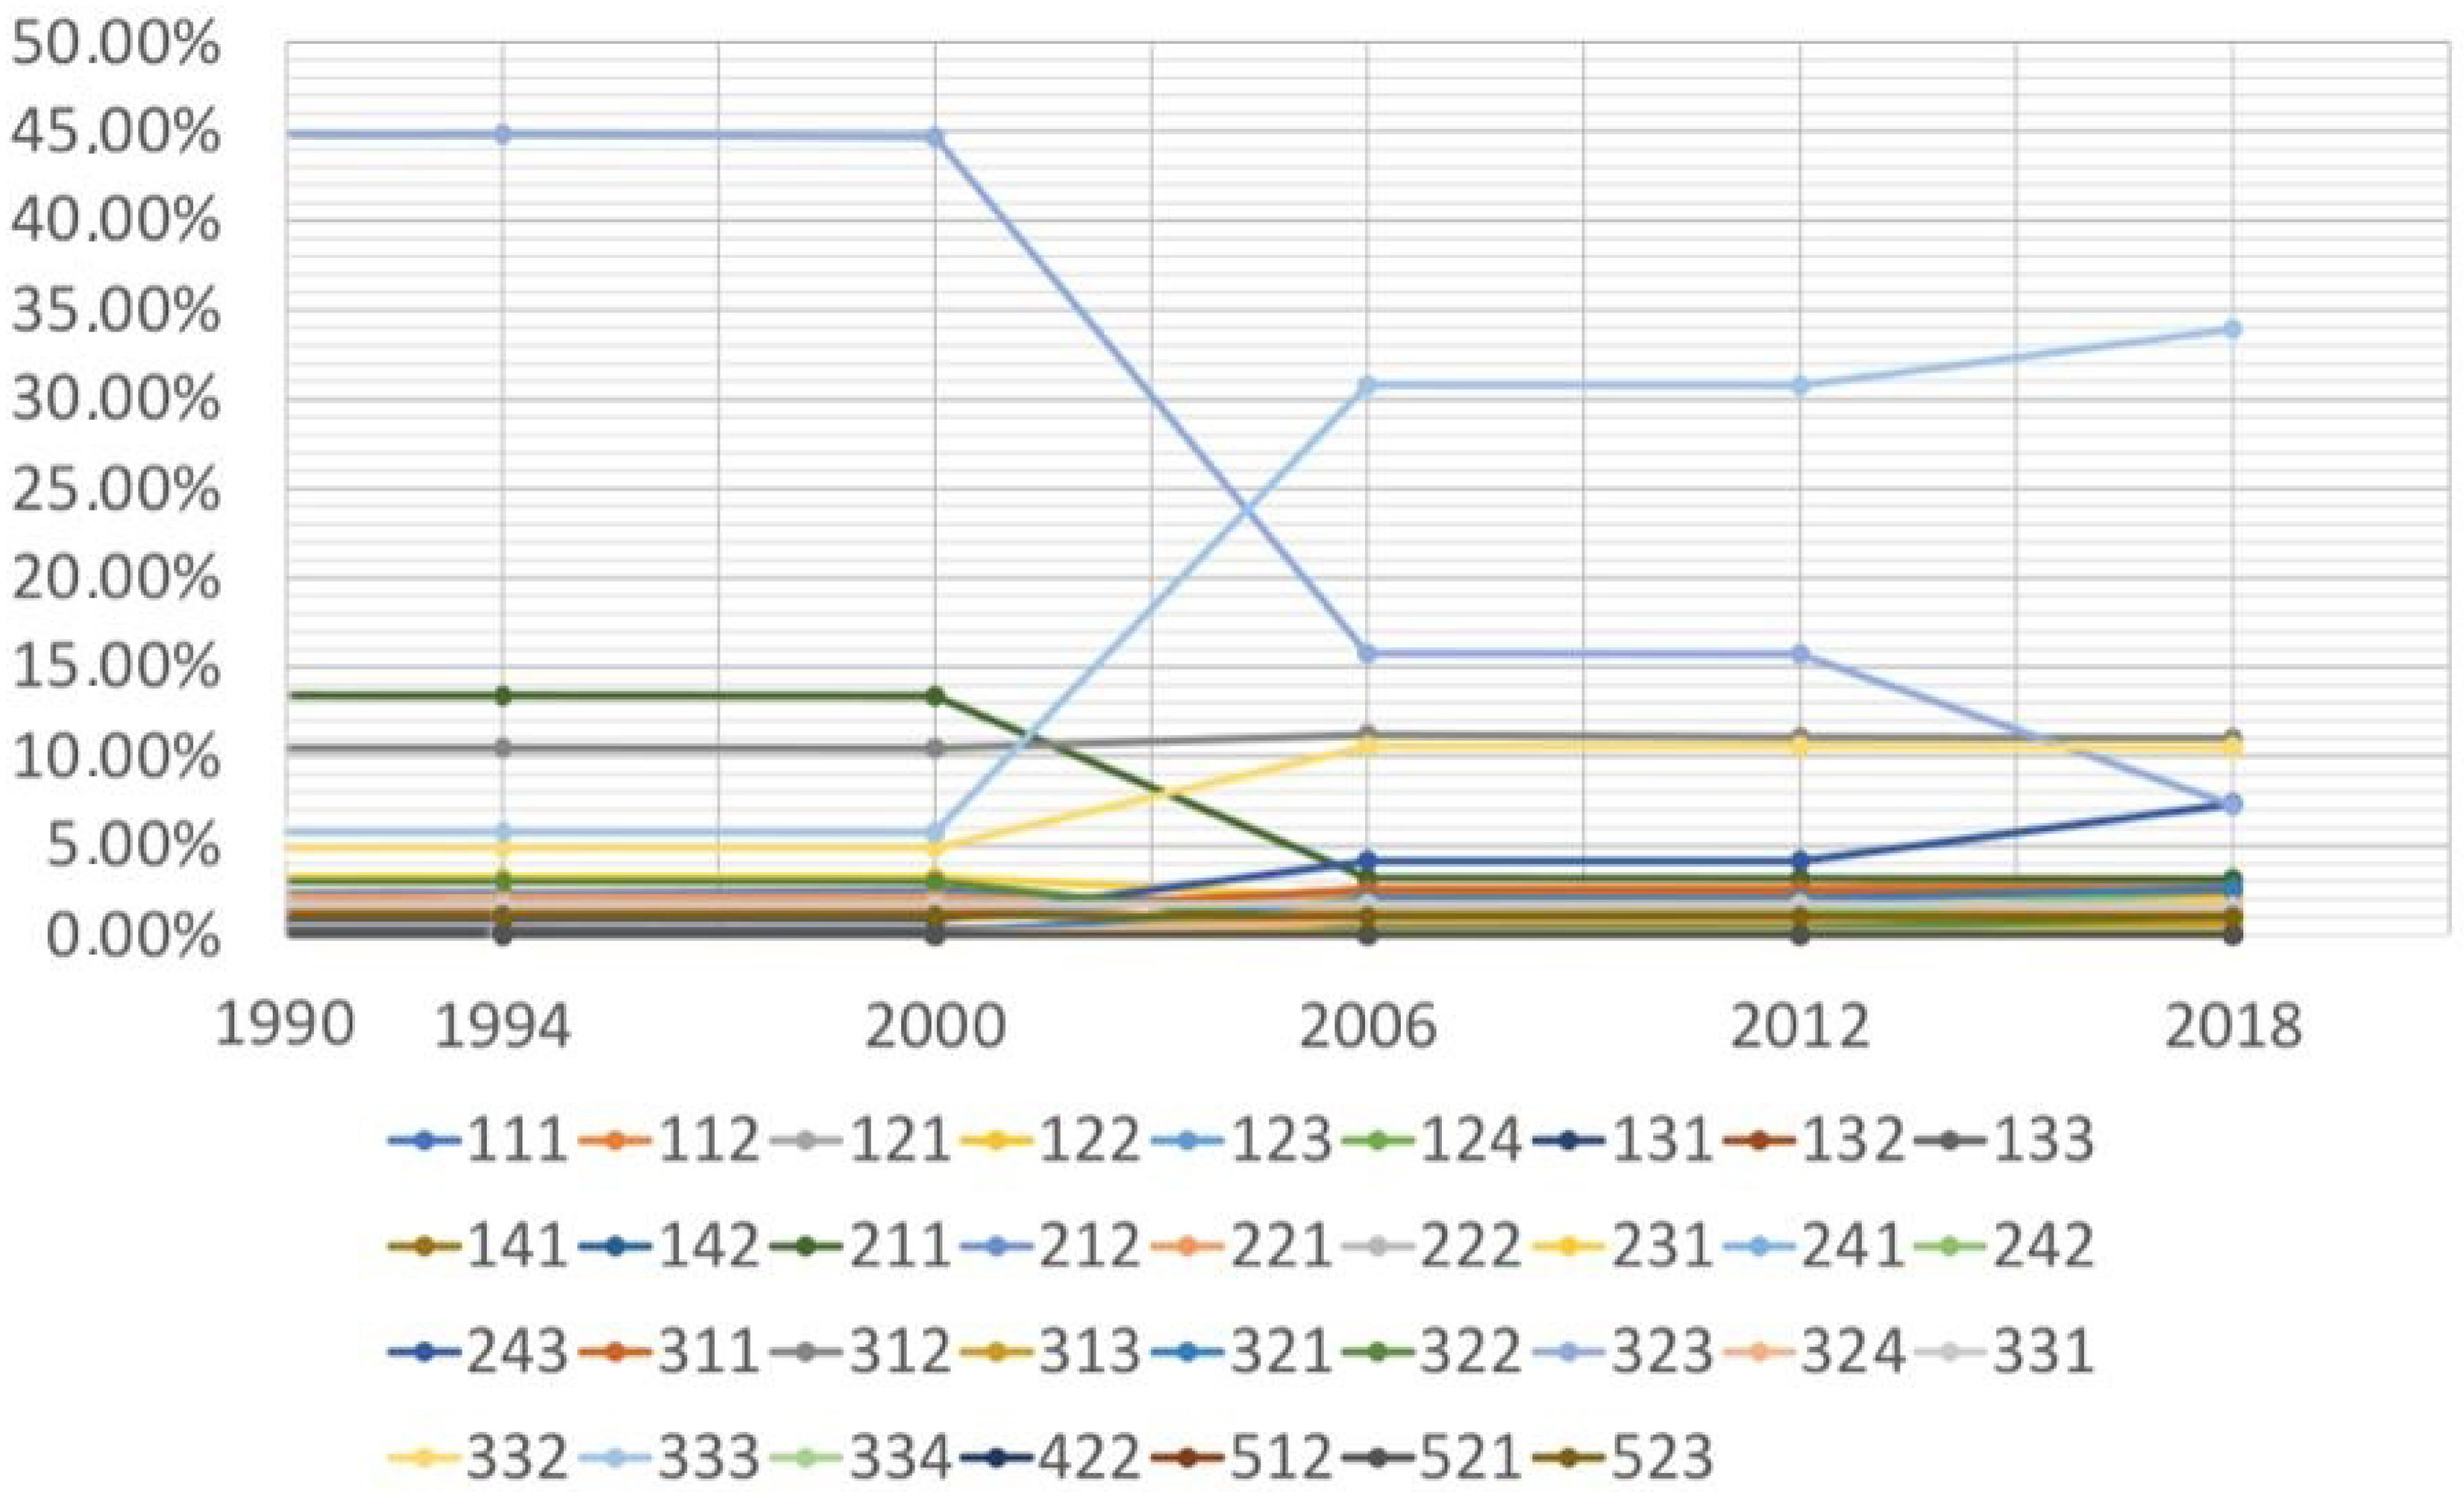
Figure 5.
The line graphs of
Figure 5 show that there is a significant drop for the land use (323) corresponding to sclerophyllous vegetation from 1998 to 2018: about 45% to 7%. Indeed, it was the maximum value in 1990 but not in 2018. As for this year, the maximum value corresponds to the land use of 333 (sparsely vegetated) areas. Although, these values are classified into level 3, as forest and semi-natural areas. Precisely, it is evident that there is an evolution in the use of forest and semi-natural areas. Contextually, as for the lowest values (values below 5%), these correspond to a variety of land uses, and their values are very similar. Consequently, it is noteworthy that the great variety of land uses in the archipelago. Moreover, if we analyze the maps every year and the variability of land-use percentages for the period between 1990 and 2000, land uses are practically stable, but as of 2006, a decrease can be seen in agricultural areas, mainly in the land use 211 (arable land without irrigation). From 2006 to 2018, there has been an increase in semi-natural areas, urban agglomerations, and, therefore, the development of new nuclei.
However, the areas corresponding to wetlands and bodies of water have remained stable from 1990 to 2018. Nonetheless, considering the small values for these land-uses, their preservation should be a must.
In the analysis of the behaviour of artificial surfaces, the continuous urban fabric (111) and the discontinuous urban fabric (112) are the most typical values. However, it should be noted that both uses show inverse trends, the continuous urban fabric (111) follows a decreasing trend compared to the discontinuous urban fabric that represents an increasing trend (112) (
Table 3).
In the analysis of the use of agricultural land, it is extracted that the non-irrigated arable land (211) is the most representative. However, it shows a decreasing trend for the period analyzed (
Table 7). The second highest value is for land use occupied mainly by agriculture (243), but unlike using 211, it shows an increasing trend since 2006 (
Table 4).
Considering the LUC behaviour and the uses related to forests and semi-natural areas in the Canary Islands in the analyzed years (
Table 5), it is possible to verify that the sclerophyllous vegetation (323) is the most representative. Nevertheless, it shows a decreasing trend, as can be seen in
Table 4. Spaces with sparse vegetation (333) are the second with the highest values and with an increasing trend during the period analyzed, followed by land uses 312 and 332 (coniferous forest and Roquedo forest, respectively), both with an increasing trend (
Table 5).
Concerning wetlands (
Table 6), only the 422 land-use values (saline areas), have remained stable over the years.
Moreover, the use of land concerning bodies of water has practically remained stable throughout the decades, with a slight increase in sheets of water (512) and a slight decrease in seas and oceans (523) (
Table 7).
From the analysis of the evolution of land uses in the Canary Islands for the established period (
Figure 2 and
Table 3,
Table 4,
Table 5,
Table 6,
Table 7 and
Table 8), we can affirm that, in most uses, they have remained stable over the years. However, it should be noted, on the one hand, that agricultural areas (211) show a decreasing trend, on the other hand, spaces with sparse vegetation (333) and discontinuous urban fabric, show an increasing trend over the years.
Through the analysis of
Table 8, it is extracted that the highest values of the uses of the CLC for the Canary Islands are the forests and semi-natural areas, followed by the use of agricultural land. However, both show a decreasing trend throughout the period studied (1990, 2000, 2006, 2012 and 2018).
4. Conclusions
Across this research, it was possible to comprehend the LUC and their dynamism on this particular insular territory in the last few decades. Moreover, through the analyses of the LUC models, together with the practical information of the territory, instructions, and guidelines for sustainable development, are possible to describe as follows.
The changes that occurred in the land use are a direct indicator of the evidence of human activity upon natural environments [
1,
2]. In this regard, natural factors and features as is the case of physiography, inclination, relief, soil, and vegetation, amid several others, are seen as crucial for a proper planning, spatial distribution and management of the territory as well as of their subsequent land uses [
1]. Moreover, the scarce information associated with the lack of planning drives us to the annihilation of the natural resources, promoting significant adverse impacts upon native communities [
23,
24,
37]. In fact, in these specific insular territories, a correct definition and identification of risk areas (always bearing in mind the field of planning and territorial management) are critical requirements to prevent and mitigate the damage resulting from the natural events as well as dangerous activities [
12,
25,
38]. Moreover, this issue is even more relevant in territories with uncontrolled growth [
39,
40,
41]. Many times, this uncontrolled growth has been associated with the absence of a proper planning process [
39]. Besides, constructed areas help to raise the soil vulnerability, fostering the chance of natural disasters [
26,
27] i.e., the case of erosion or landslides, if we bear in mind the local, territorial features.
In the Canary Islands, increasing urban growth (more evident in the periods 2006–2018), on many occasions, is closer to a more inclined and geologic volatile ground [
42] similar to what occurs in the neighbouring archipelago of Madeira [
12,
43,
44,
45,
46,
47,
48,
49]. Thereby, this can generate significant problems, affecting the population, the environment, and consequently, the regional economy i.e., it can drive a decrease in tourism. Some of these results were announced in previous studies e.g., Escudero Gómez et al. [
50]; Hübscher [
51]; Rodríguez-Díaz et al. [
52]; among many others.
Furthermore, an EU report lists nine Outermost Regions (ORs) [
53], including the Canary Archipelago, and defined the following major geographical limitations: (i) remoteness; (ii) insularity; (iii) double insularity; (iv) small territory; (v) complex territorial morphology; (vi) specific climatic conditions; and (vii) high natural risk.
Thus, bearing in mind the geologic risks, the inclination assumes a primary role, once it interacts and promotes erosion, creating critical slopes for mudflows—also in the vegetal ground cover, eradicating natural resources of the island [
54]. According to Zêzere [
25]: “
The definition of land use is consistent with the risk degree that characterizes it and the prohibition or limitation to the urban expansion in the unstable areas” this is some of the possibilities that can be considered to avoid such risks. Furthermore, according to Castanho et al. [
12], it also should be highlighted “(…)
the crossing of the constraints to urban growth and development with risk areas leads to the determination of land suitability for each category of use and respective infrastructure implementation”. Also, the land-use capacity assessment, mostly in urban territories and areas of expansion and redevelopment, should be carefully monitored [
42,
54].
Thereby, it is pivotal to determine classes, stages, and levels for certain land uses, considering spatial and urban planning principles [
42], articulating it with the urban growth limitations (a recurrent scenario in insular territories) to predict the chance of natural risks and disasters happening in particular areas [
38,
39,
40,
41,
54].
On the other hand, this specific geomorphology could affect the urban expansion and development [
55], pushing the urban agglomerations to expand in a more spread and scattered (evidently chaotic) manner, creating the so-called urban voids [
38]. Thus, these Canary territorial specific features (present in most of the Islands) can be seen as a topographical obstacle which represents a natural barrier to the expected urban growth and also as a wall of protection for the fragmentation of the natural habitats. In fact, previous research using similar methods has studied this territory; Santana-Cordero et al. [
14,
15], Pérez-Hernández et al. [
16], Acosta Yepes et al. [
42], Pérez Martínez et al. [
56], or Cruz [
57], are just some examples. These specificities and particularities are in line with what occurs in Madeira Archipelago or in the more urbanized islands of Azores i.e., more pertinent in cities located in mountainous areas where the variation of altitude is considerable, and there are steep slopes [
43,
44,
45,
46,
47,
48,
49]. The geomorphology of the territory affects its development and growth and consequently defines, on many occasions, the typology of land use of the region.
Nonetheless, although all the constraints related to the territorial features, the terrain barriers at Canary Archipelago will value the environmental dimension. Such specificities shall be considered as crucial from a socio-economic perspective, enabling the full usage of the values and endogenous natural resources to be promoted and also fostering the growth of tourism activities [
26,
58]. Thus, the interactions between the economic activities, nature conservation, biodiversity, and tourism activities are affected by the exceptional fauna, flora, and specific features of these islands as well as by their ecosystems, natural and anthropogenic landscapes [
27,
59,
60,
61]; therefore, those particular elements may be considered as opportunities to foster the sustainable development.
Furthermore, we also should highlight tourism activities, perhaps the major economic driver of the archipelago. Due to the factors mentioned above, it is believed that the tourist success in the archipelagic spaces depends on the implementation of sustainable practices and how monitoring and planning processes are required by the government [
62,
63]. In fact, in these territories, often through the land uses it is required to limit tourism growth to achieve sustainability. According to Ferreira [
63]: “
In small islands and archipelagos, natural capital quickly reaches a limit, and built-up capital cannot grow indefinitely to compensate for this shortage. Archipelagos are fragile and appealing territories where the available land is a natural limit to growth”.
Moreover, the decrease in agricultural land in the archipelago in the last few years is also concerning. The valorisation of the agricultural heritage should be preserved and protected sustainably. In fact, in the Canary Islands, there are several typical crops with a high richness (economic and social) i.e., banana, tomatoes, avocado, mango, papaya, pineapple, grapes, to name a few.
If more robust sustainable development policies were to be considered and well implemented, the involved actors, as well as the Canary Islands inhabitants, could benefit from the territorial valorisation. If so, the so-called barriers that exist in this “ultra-peripheral” territories can be overturned in catalysts for growth, instead of obstacles.
In this regard, the obstacles and constraints of these insular territories are apparent, not only by the particular spatial dimensions presented but also by the complexity of carrying out reconversion of uses [
18].
Final Remarks
Based on the aforementioned, the study of the LUC patterns is understood as critical to perceive the tendencies and dynamics of these ultra-peripheral territories. Furthermore, this research enables us to provide some guidance for the main actors in order to define the directions where the actions directorate the sustainable development and growth shall be placed.
Bearing in mind the specificity of these territories, the decision-makers, and main-actors as well as their policies and actions over the territories are even more critical and need to be re-thought, re-designed, and conducted more wisely.
Nevertheless, for these typologies of studies to have a positive impact over the territorial planning and management in a long-term, a close monitoring process of the land-uses changes as well as of the impact of the public policies over the territories is pivotal to achieve the desired sustainable development.

 ,
, 


