Visualization of High-Dimensional Data by Pairwise Fusion Matrices Using t-SNE

 ,
,  , , and
Abstract
:1. Introduction
2. Stochastic Neighbor Embedding (SNE)
3. t-Distributed Stochastic Neighbor Embedding (t-SNE)
| Algorithm 1: t-Distributed Stochastic Neighbor Embedding [17] |
| Data: data set X = , , , …, |
| cost function parameters: perplexity Perp |
| optimization parameters: number of iterations T, learning rate h, momentum a(t). |
| Result: low-dimensional data representation = , , , …, |
| begin |
| compute pairwise affinities with perplexity Perp (using Equation (1)) |
| set sample initial solution = , , …, from |
| for to N |
| compute low-dimensional affinities (using Equation (5)) |
| compute gradient (using Equation (6)) |
| set |
| end |
| end |
4. Motivation
- First, there is dearth of research visualizing the high-dimensional data of Urdu handwritten text at character level.
- Second, there is ambivalence as to whether to use the heterogeneous data fusion from multiple data sources while visualizing high-dimensional data.
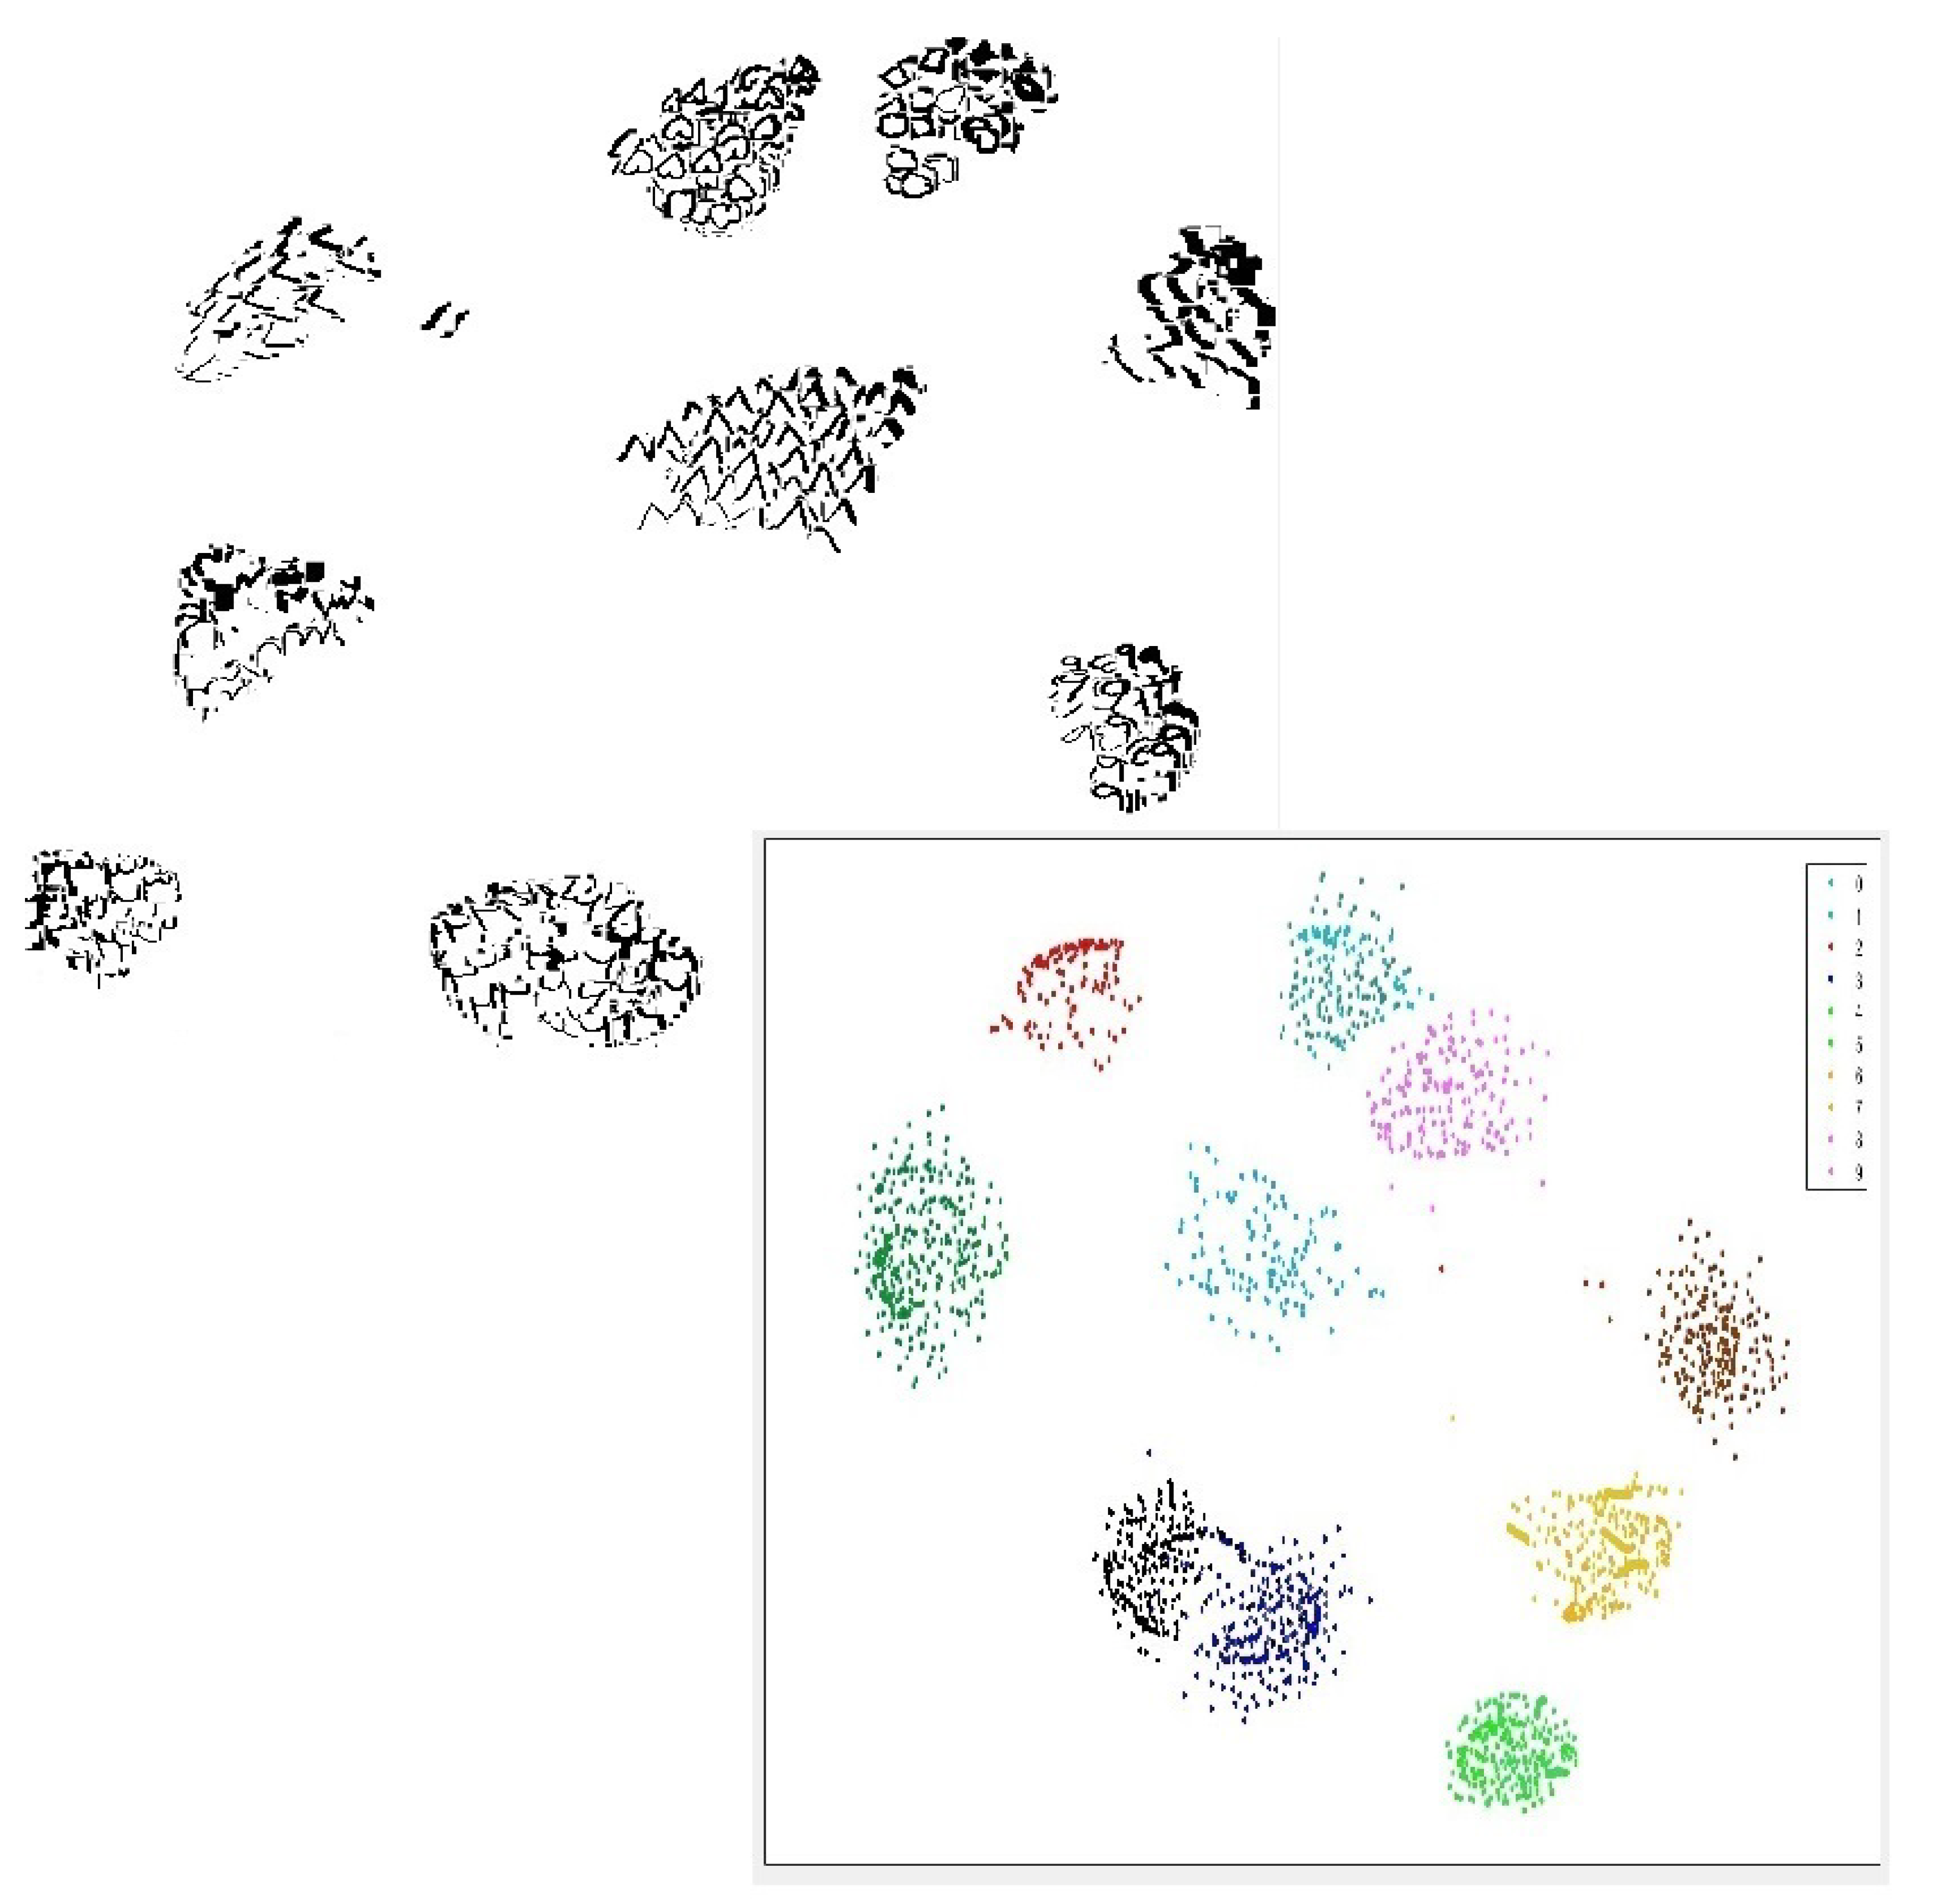
- Third, there is need to enhance the visualization of Urdu handwritten digit data by increasing the inter-cluster separation.
5. Our Approach
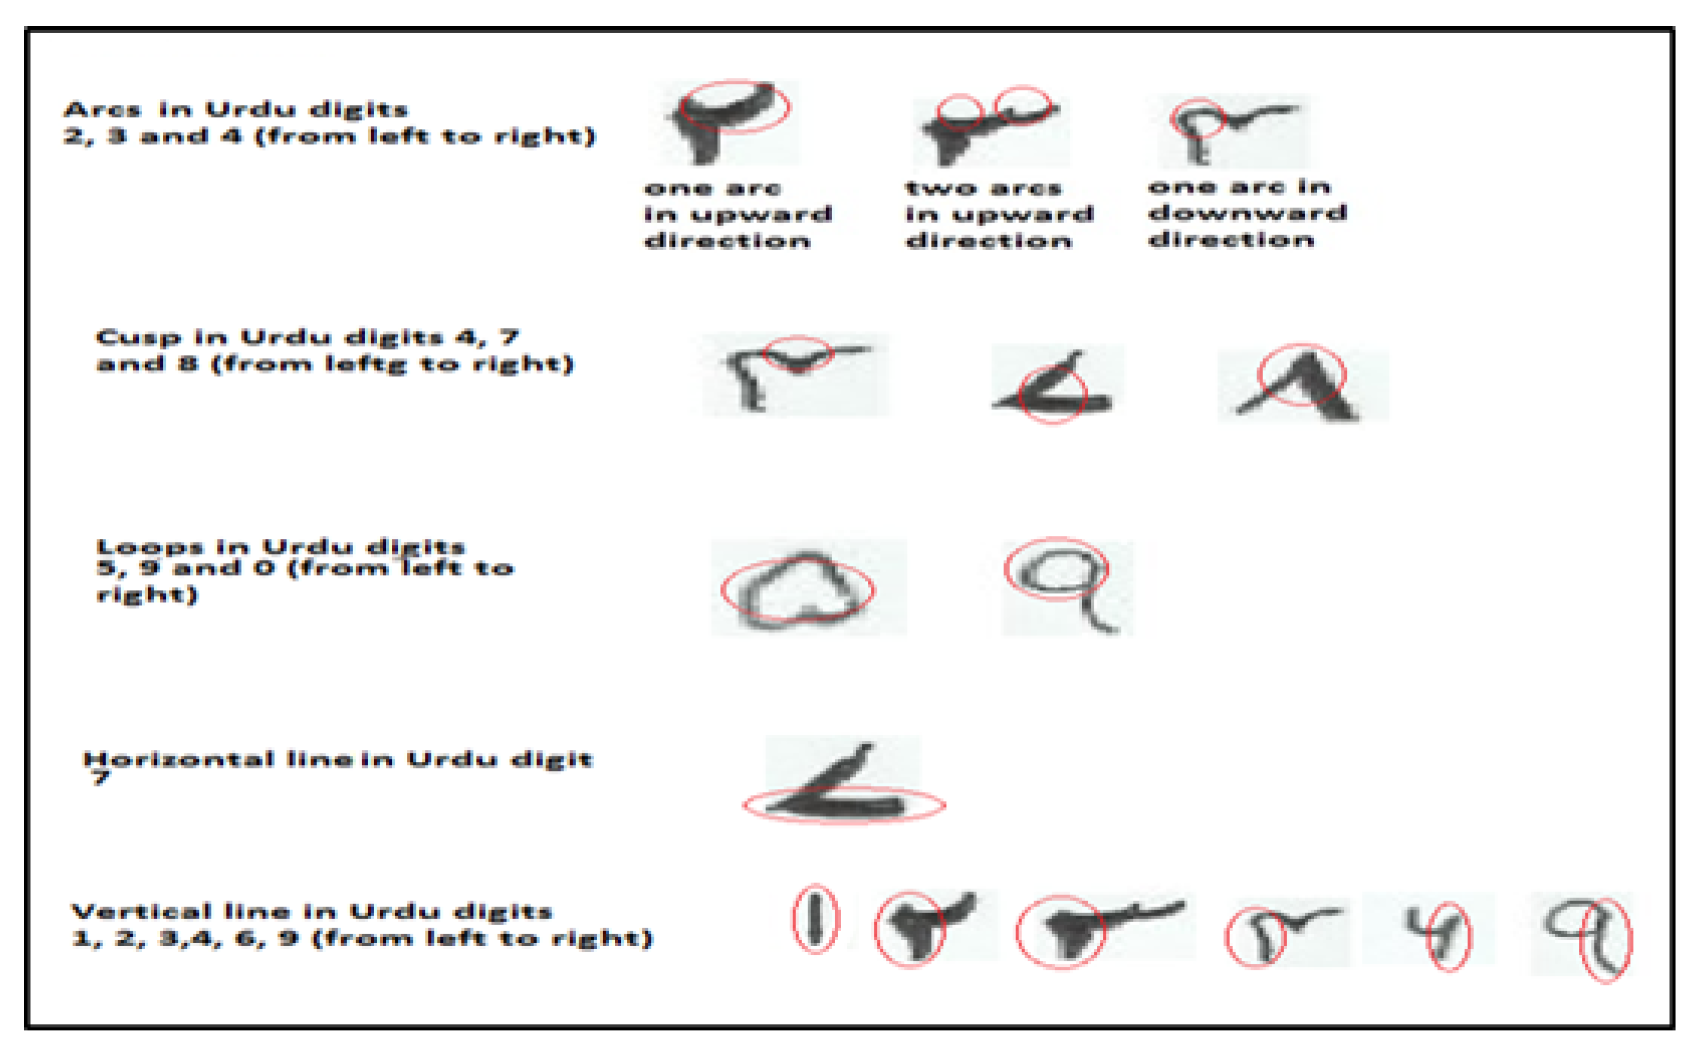
5.1. Dataset
5.2. Experimental Setup and Results
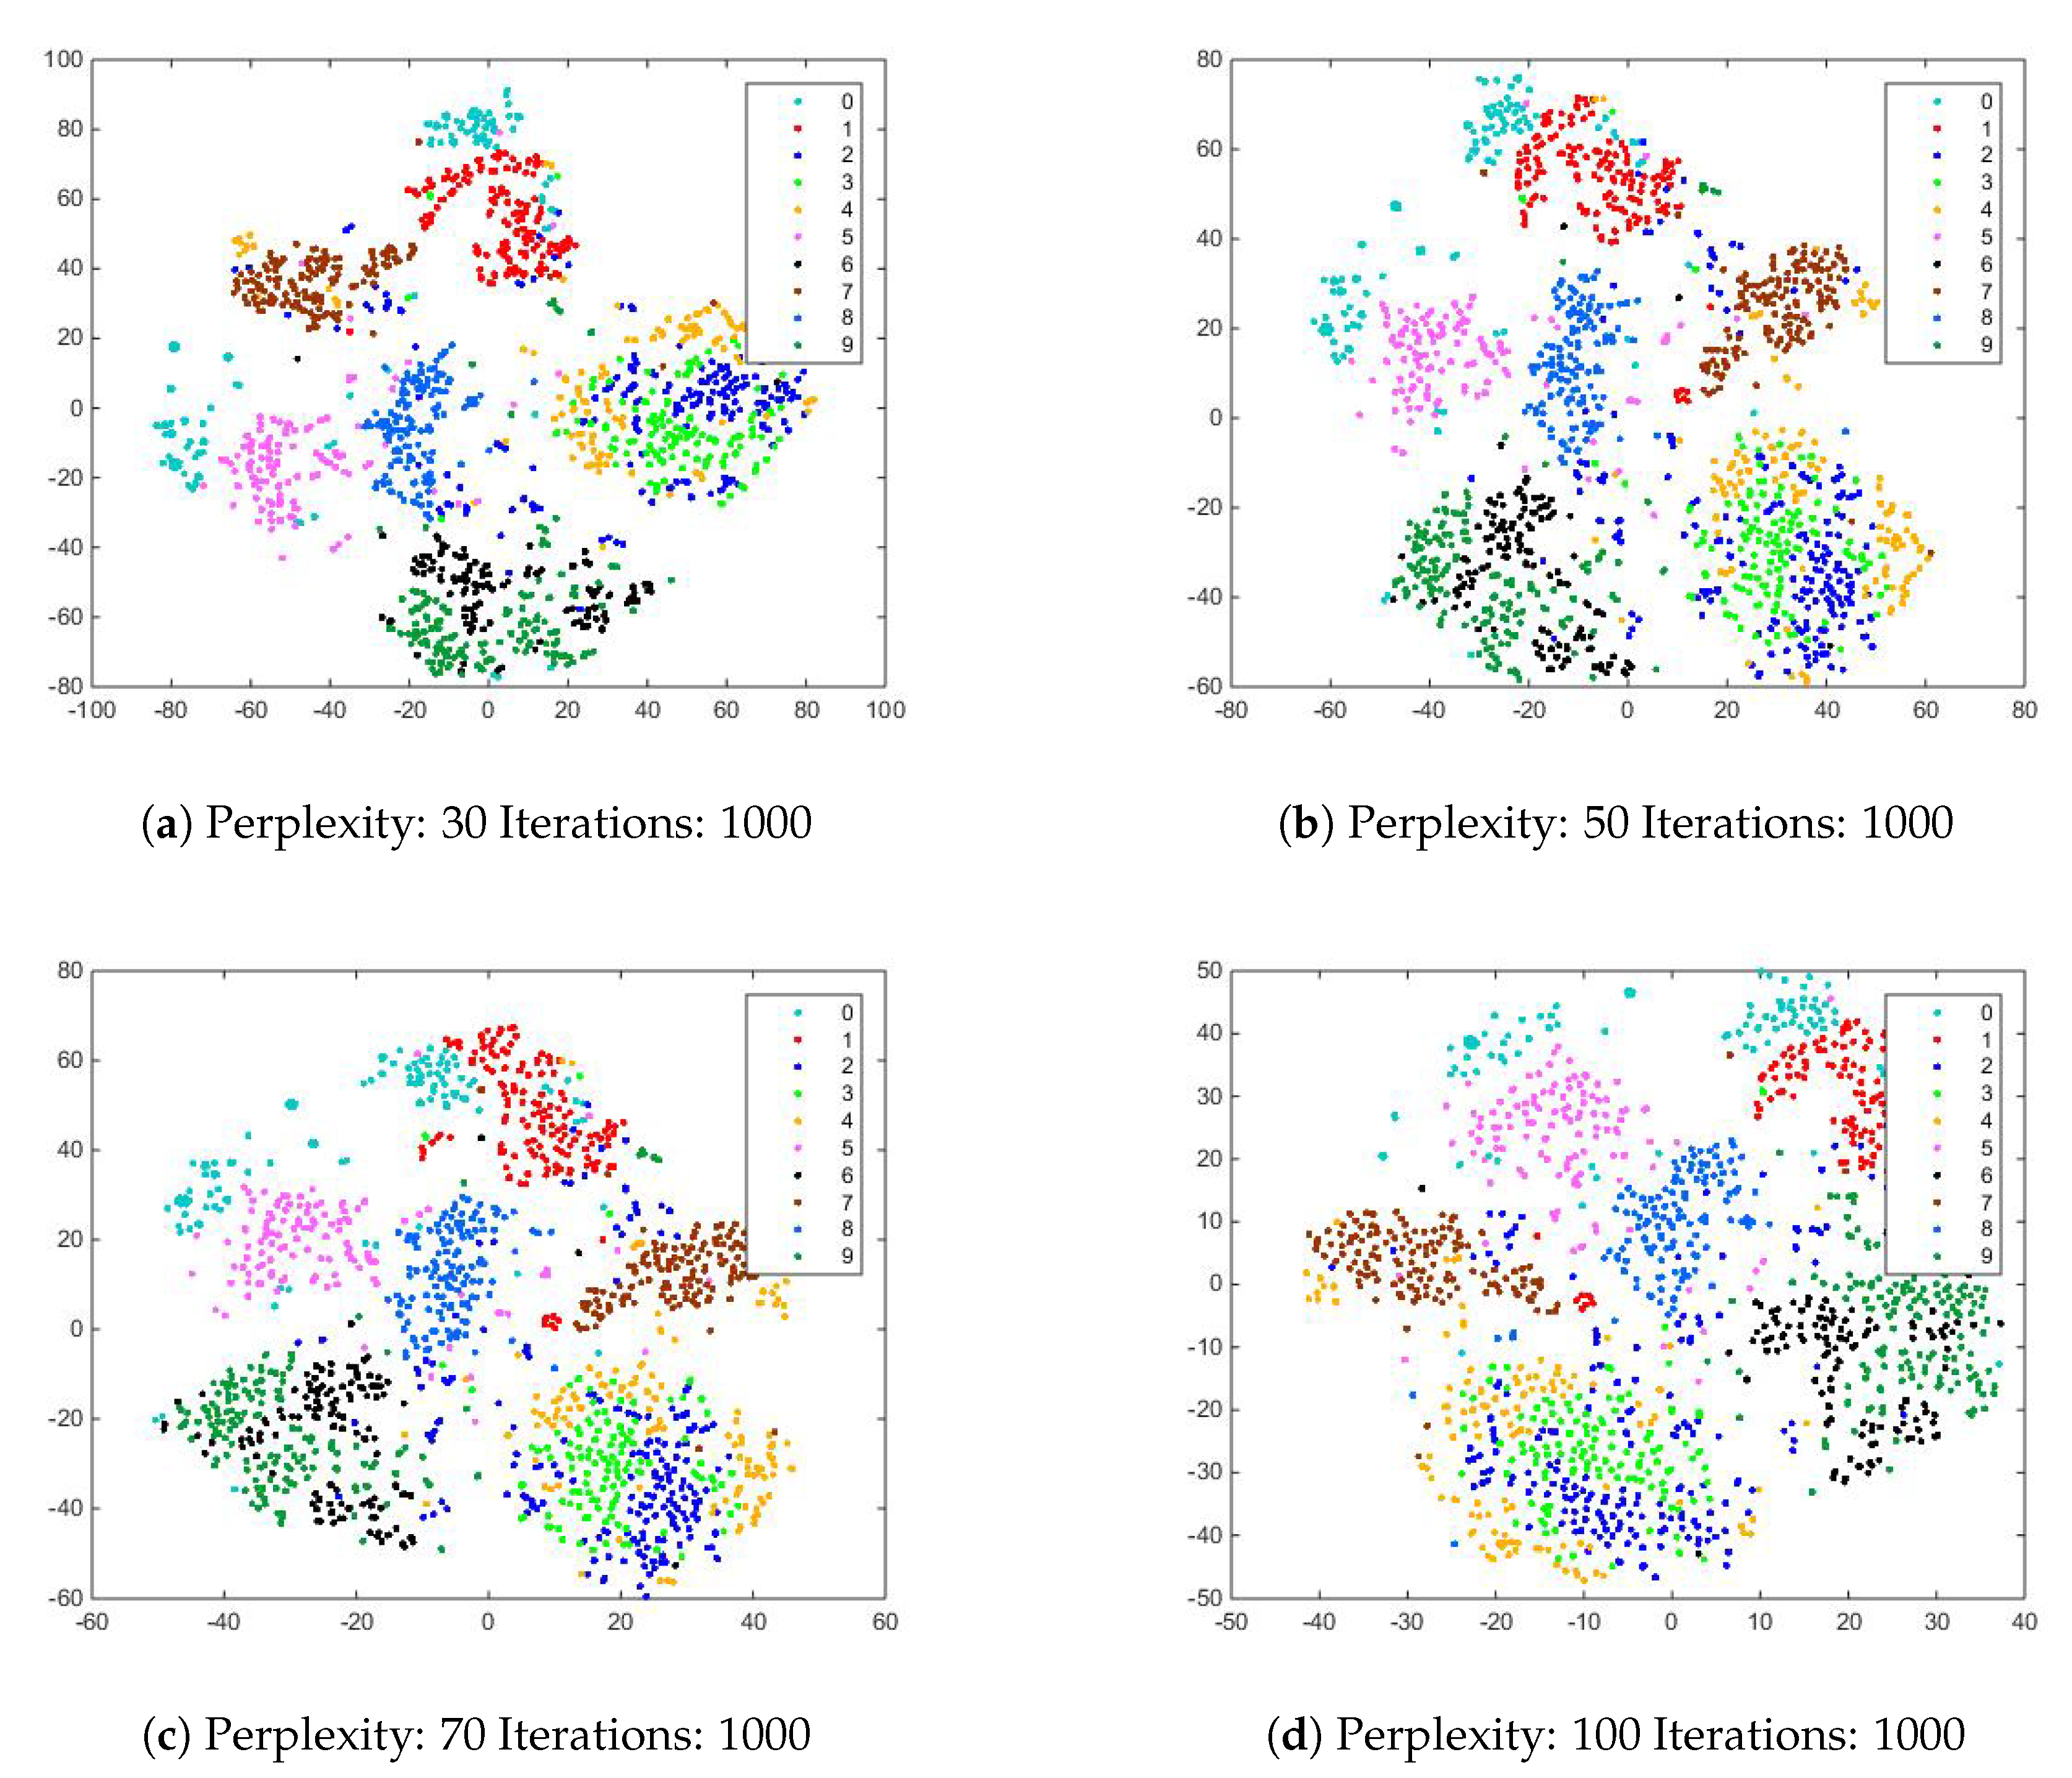
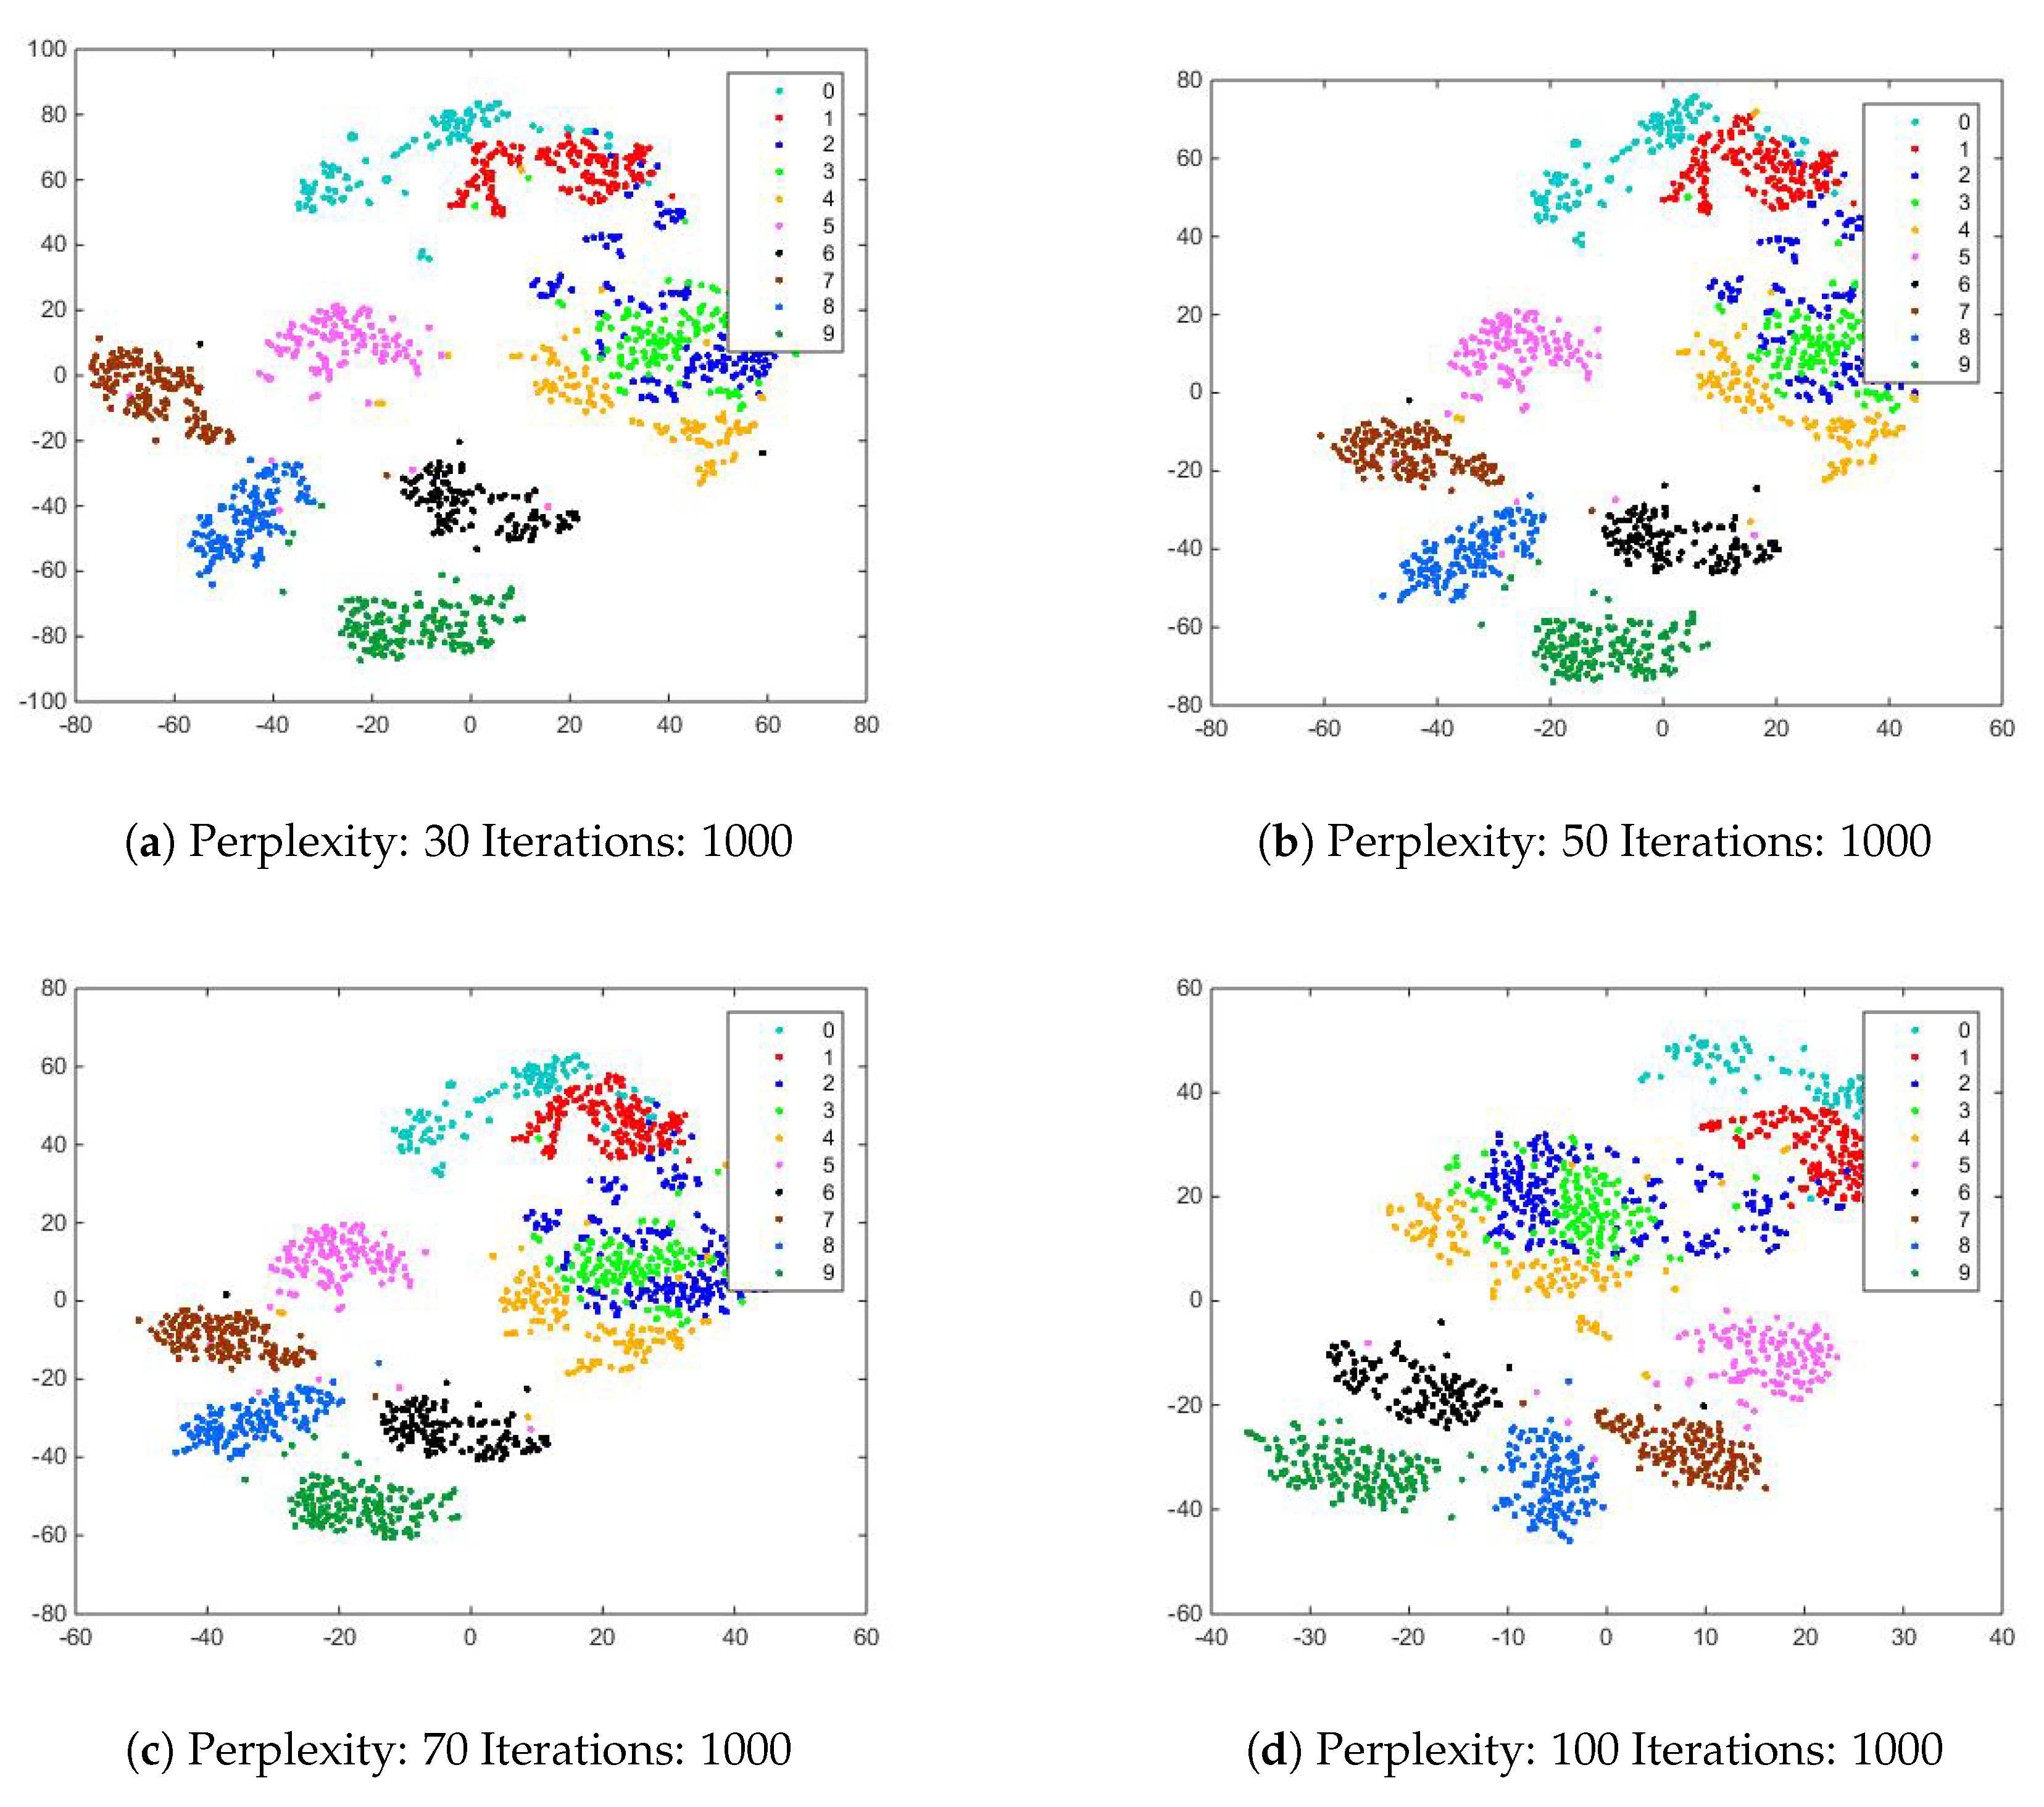
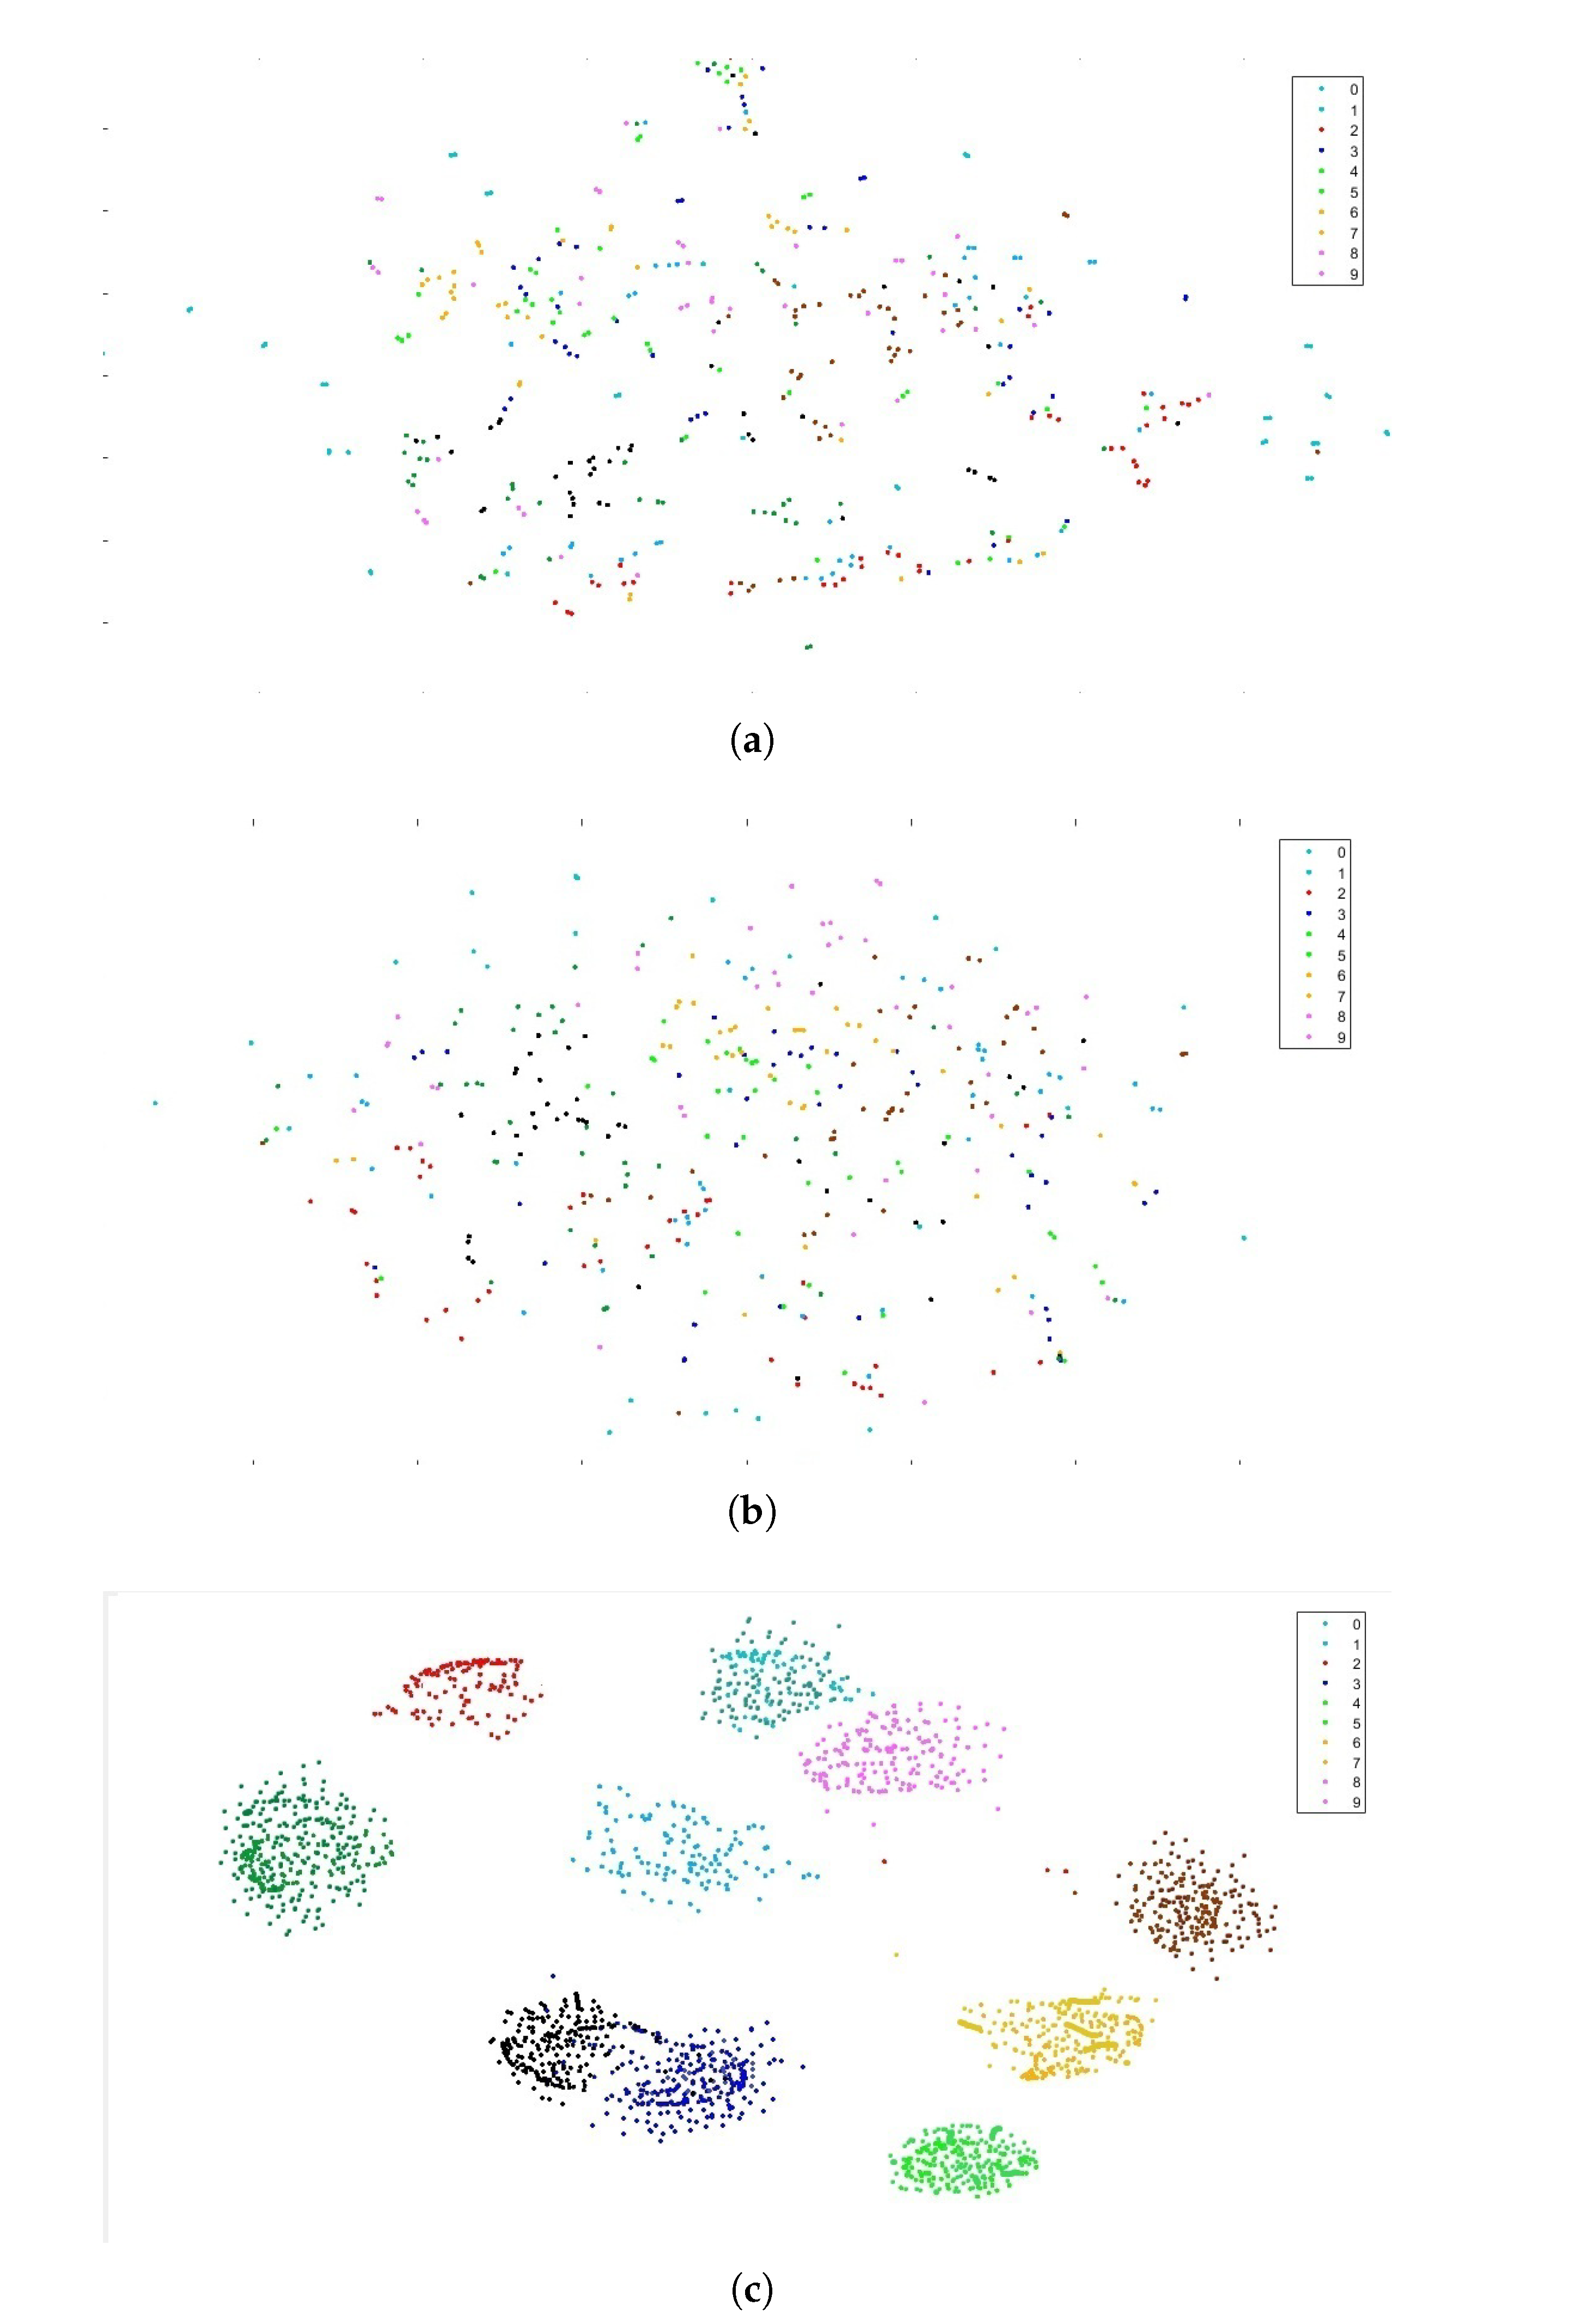
5.3. Applying Standard t-SNE
5.4. Fusion Matrix
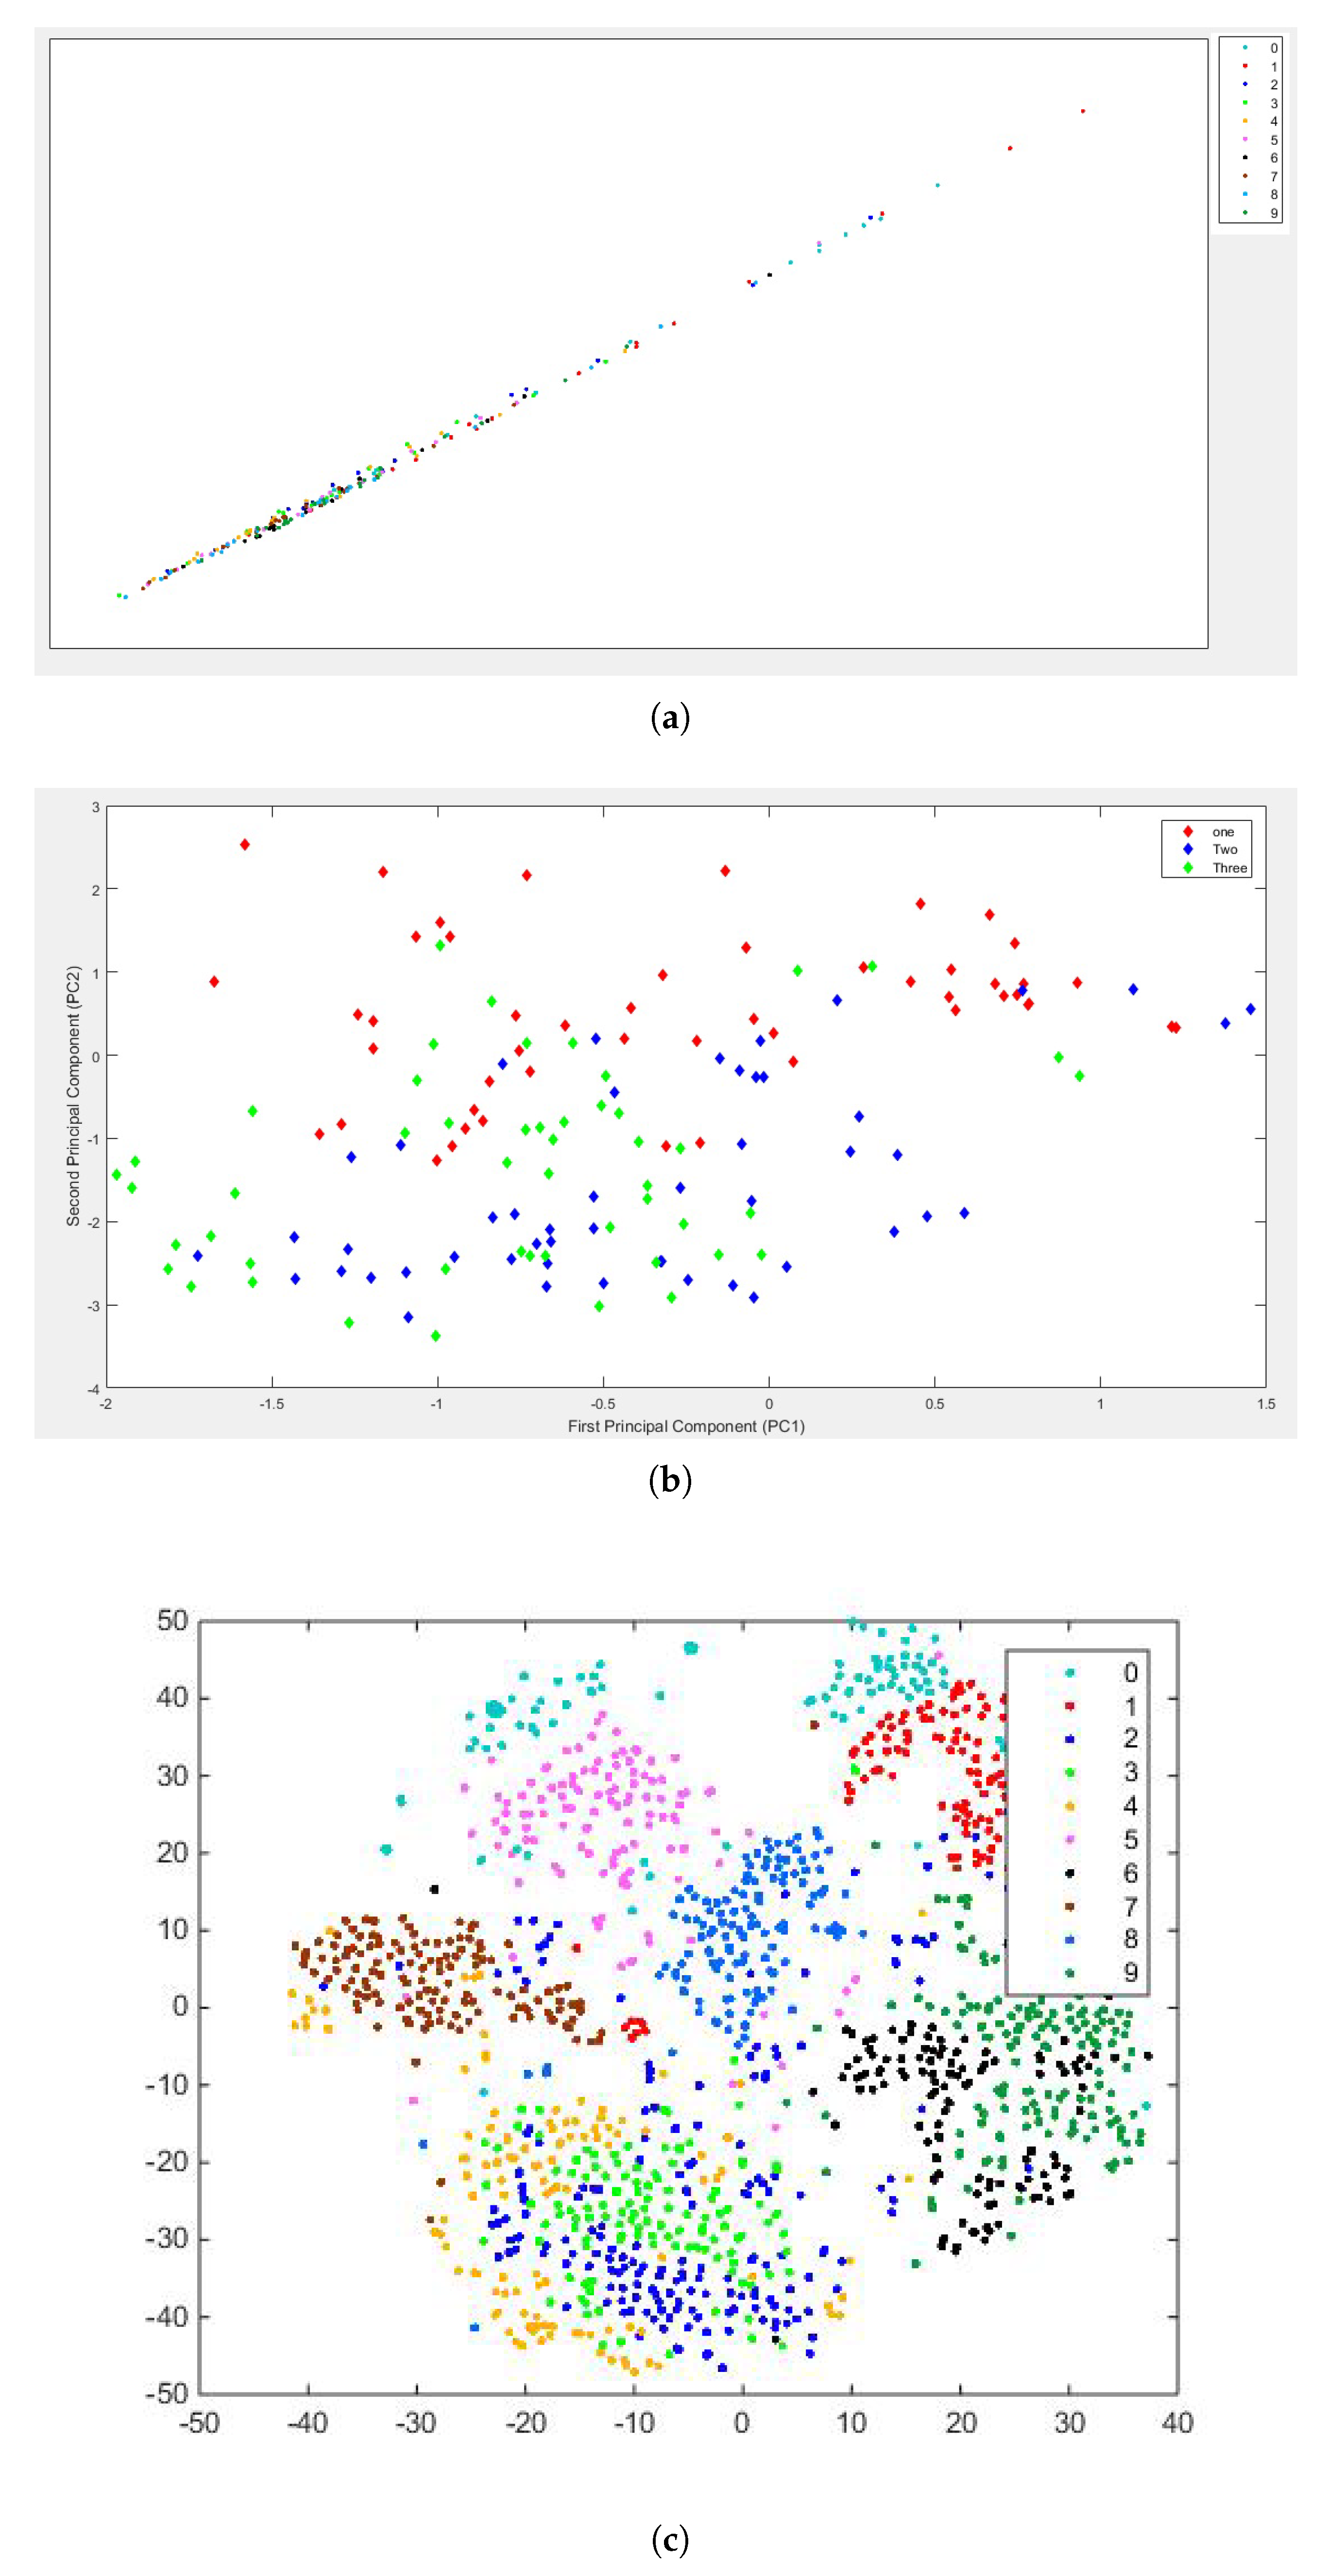
5.5. Experimental Results of PCA, AE and Modified t-SNE
6. Discussion
7. Conclusions
Author Contributions
Funding
Acknowledgments
Conflicts of Interest
References
- Bahlmann, C. Directional features in online handwriting recognition. Pattern Recognit. 2006, 39, 115–125. [Google Scholar] [CrossRef] [Green Version]
- Razzak, M.I.; Anwar, F.; Husain, S.A.; Belaid, A.; Sher, M. HMM and fuzzy logic: A hybrid approach for online Urdu script-based languages character recognition. Knowl.-Based Syst. 2010, 23, 914–923. [Google Scholar] [CrossRef]
- Herrera-Luna, E.C.; Felipe-Riveron, E.M.; Godoy-Calderon, S. A supervised algorithm with a new differentiated-weighting scheme for identifying the author of a handwritten text. Pattern Recognit. Lett. 2011, 32, 1139–1144. [Google Scholar] [CrossRef]
- Carbonell, M.; Villegas, M.; Fornés, A.; Lladós, J. Joint recognition of handwritten text and named entities with a neural end-to-end model. arXiv, 2018; arXiv:1803.06252. [Google Scholar]
- Shinde, A.; Shinde, A. Overlapping character recognition for handwritten text using discriminant hidden Semi-Markov model. In Intelligent Computing and Information and Communication; Springer: Singapore, 2018; pp. 163–172. [Google Scholar]
- Mori, S.; Nishida, H.; Yamada, H. Optical Character Recognition; John Wiley & Sons, Inc.: New York, NY, USA, 1999. [Google Scholar]
- Schantz, H.F. The History of OCR, Optical Character Recognition; Recognition Technologies Users Association: Manchester, VT, USA, 1982. [Google Scholar]
- Khan, N.H.; Adnan, A.; Basar, S. An analysis of off-line and on-line approaches in urdu character recognition. In Proceedings of the 15th International Conference on Artificial Intelligence, Knowledge Engineering and Data Bases (AIKED ’16), Venice, Italy, 29–31 January 2016. [Google Scholar]
- Akram, Q.U.A.; Hussain, S. Ligature-based font size independent OCR for Noori Nastalique writing style. In Proceedings of the 2017 1st International Workshop on Arabic Script Analysis and Recognition (ASAR), Nancy, France, 3–5 April 2017; pp. 129–133. [Google Scholar]
- Melville, P.; Mooney, R.J. Diverse ensembles for active learning. In Proceedings of the Twenty-First International Conference on Machine Learning, Banff, AB, Canada, 4–8 July 2004; p. 74. [Google Scholar]
- Weinstein, J.N.; Collisson, E.A.; Mills, G.B.; Shaw, K.R.M.; Ozenberger, B.A.; Ellrott, K.; Shmulevich, I.; Sander, C.; Stuart, J.M.; Network, C.G.A.R.; et al. The cancer genome atlas pan-cancer analysis project. Nat. Genet. 2013, 45, 1113. [Google Scholar] [CrossRef] [PubMed]
- Ravi, L.; Yan, Q.; Dascalu, S.M.; Harris, F.C., Jr. A survey of visualization techniques and tools for environmental data. In Proceedings of the 2013 Intl. Conference on Computers and Their Applications (CATA 2013), Honolulu, HI, USA, 4–6 March 2013. [Google Scholar]
- De Oliveira, M.F.; Levkowitz, H. From visual data exploration to visual data mining: A survey. IEEE Trans. Vis. Comput. Graph. 2003, 9, 378–394. [Google Scholar] [CrossRef]
- Keim, D.A.; Ankerst, M.; Kriegel, H.-P. Recursive pattern: A technique for visualizing very large amounts of data. In Proceedings of the 6th Conference on Visualization’95; IEEE Computer Society, Atlanta, GA, USA, 29 October–9 November 1995; p. 279. [Google Scholar]
- Rekimoto, J.; Green, M. The information cube: Using transparency in 3rd information visualization. In Proceedings of the Third Annual Workshop on Information Technologies & Systems (WITS93), Orlando, FL, USA, 5 December 1993; pp. 125–132. [Google Scholar]
- Pickett, R.M.; Grinstein, G.G. Iconographic displays for visualizing multidimensional data. In Proceedings of the 1988 IEEE Conference on Systems, Man, and Cybernetics, Beijing, China, 18–12 August 1988; Volume 514, p. 519. [Google Scholar]
- Van der Maaten, L.; Hinton, G. Visualizing data using t-SNE. J. Mach. Lear. Res. 2008, 9, 2579–2605. [Google Scholar]
- Maaten, L. Learning a parametric embedding by preserving local structure. In Proceedings of the 12th International Conference on Artificial Intelligence and Statistics, Clearwater Beach, FL, USA, 8–12 June 2009; pp. 384–391. [Google Scholar]
- Hotelling, H. Analysis of a complex of statistical variables into principal components. J. Educ. Psychol. 1933, 24, 417. [Google Scholar] [CrossRef]
- Torgerson, W.S. Multidimensional scaling: I. Theory and method. Psychometrika 1952, 17, 401–419. [Google Scholar] [CrossRef]
- Lee, J.A.; Verleysen, M. Nonlinear Dimensionality Reduction; Springer Science & Business Media: New York, NY, USA, 2007. [Google Scholar]
- Roweis, S.T.; Saul, L.K. Nonlinear dimensionality reduction by locally linear embedding. Science 2000, 290, 2323–2326. [Google Scholar] [CrossRef]
- Belkin, M.; Niyogi, P. Laplacian eigenmaps and spectral techniques for embedding and clustering. In Proceedings of the Advances in Neural Information Processing Systems, Vancouver, BC, Canada, 3–8 December 2002; pp. 585–591. [Google Scholar]
- Weinberger, K.Q.; Sha, F.; Saul, L.K. Learning a kernel matrix for nonlinear dimensionality reduction. In Proceedings of the Twenty-First International Conference on Machine Learning, Banff, AB, Canada, 4–8 July 2004; p. 106. [Google Scholar]
- Hinton, G.E.; Roweis, S.T. Stochastic neighbor embedding. In Proceedings of the Advances in Neural Information Processing Systems, Vancouver, BC, Canada, 8–13 December 2003; pp. 857–864. [Google Scholar]
- Demartines, P.; Hérault, J. Curvilinear component analysis: A self-organizing neural network for nonlinear mapping of data sets. IEEE Trans. Neural Netw. 1997, 8, 148–154. [Google Scholar] [CrossRef] [PubMed]
- Song, L.; Gretton, A.; Borgwardt, K.M.; Smola, A.J. Colored maximum variance unfolding. In Proceedings of the Advances in Neural Information Processing Systems, Vancouver, BC, Canada, 12–13 December 2008; pp. 1385–1392. [Google Scholar]
- Liou, C.-Y.; Cheng, W.-C.; Liou, J.-W.; Liou, D.-R. Autoencoder for words. Neurocomputing 2014, 139, 84–96. [Google Scholar] [CrossRef]
- Joyce, J.M. Kullback-leibler divergence. In International Encyclopedia of Statistical Science; Springer: Berlin/Heidelberg, Germany, 2011; pp. 720–722. [Google Scholar]
- Lin, J. Divergence measures based on the Shannon entropy. IEEE Trans. Inf. Theory 1991, 37, 145–151. [Google Scholar] [CrossRef] [Green Version]
- Gashi, I.; Stankovic, V.; Leita, C.; Thonnard, O. An experimental study of diversity with off-the-shelf antivirus engines. In Proceedings of the 2009 Eighth IEEE International Symposium on Network Computing and Applications (NCA 2009), Cambridge, MA, USA, 9–11 July 2009; pp. 4–11. [Google Scholar]
- Hamel, P.; Eck, D. Learning Features from Music Audio with Deep Belief Networks. In Proceedings of the 11th International Society for Music Information Retrieval Conference ISMIR, Utrecht, The Netherlands, 9–13 August 2010; Volume 10, pp. 339–344. [Google Scholar]
- Jamieson, A.R.; Giger, M.L.; Drukker, K.; Li, H.; Yuan, Y.; Bhooshan, N. Exploring nonlinear feature space dimension reduction and data representation in breast CADx with Laplacian eigenmaps and t-SNE. Med. Phys. 2010, 37, 339–351. [Google Scholar] [CrossRef] [PubMed]
- Wallach, I.; Lilien, R. The protein–small-molecule database, a non-redundant structural resource for the analysis of protein-ligand binding. Bioinformatics 2009, 25, 615–620. [Google Scholar] [CrossRef] [PubMed]
- Najafabadi, M.M.; Villanustre, F.; Khoshgoftaar, T.M.; Seliya, N.; Wald, R.; Muharemagic, E. Deep learning applications and challenges in big data analytics. J. Big Data 2015, 2, 1. [Google Scholar] [CrossRef]
- Kiselev, V.Y.; Kirschner, K.; Schaub, M.T.; Andrews, T.; Yiu, A.; Chandra, T.; Natarajan, K.N.; Reik, W.; Barahona, M.; Green, A.R.; et al. SC3: Consensus clustering of single-cell RNA-seq data. Nat. Methods 2017, 14, 483. [Google Scholar] [CrossRef]
- Pezzotti, N.; Lelieveldt, B.P.; van der Maaten, L.; Höllt, T.; Eisemann, E.; Vilanova, A. Approximated and user steerable tSNE for progressive visual analytics. IEEE Trans. Vis. Comput. Graph. 2017, 23, 1739–1752. [Google Scholar] [CrossRef]
- Wattenberg, M.; Viégas, F.; Johnson, I. How to use t-sne effectively. Distill 2016, 1, e2. [Google Scholar] [CrossRef]
- De Ridder, D.; Duin, R.P. Sammon’s mapping using neural networks: a comparison. Pattern Recognit. Lett. 1997, 18, 1307–1316. [Google Scholar] [CrossRef]
- Tenenbaum, J.B.; De Silva, V.; Langford, J.C. A global geometric framework for nonlinear dimensionality reduction. Science 2000, 290, 2319–2323. [Google Scholar] [CrossRef] [PubMed]


© 2019 by the authors. Licensee MDPI, Basel, Switzerland. This article is an open access article distributed under the terms and conditions of the Creative Commons Attribution (CC BY) license (http://creativecommons.org/licenses/by/4.0/).
Share and Cite
Husnain, M.; Missen, M.M.S.; Mumtaz, S.; Luqman, M.M.; Coustaty, M.; Ogier, J.-M. Visualization of High-Dimensional Data by Pairwise Fusion Matrices Using t-SNE. Symmetry 2019, 11, 107. https://0-doi-org.brum.beds.ac.uk/10.3390/sym11010107
Husnain M, Missen MMS, Mumtaz S, Luqman MM, Coustaty M, Ogier J-M. Visualization of High-Dimensional Data by Pairwise Fusion Matrices Using t-SNE. Symmetry. 2019; 11(1):107. https://0-doi-org.brum.beds.ac.uk/10.3390/sym11010107
Chicago/Turabian StyleHusnain, Mujtaba, Malik Muhammad Saad Missen, Shahzad Mumtaz, Muhammad Muzzamil Luqman, Mickaël Coustaty, and Jean-Marc Ogier. 2019. "Visualization of High-Dimensional Data by Pairwise Fusion Matrices Using t-SNE" Symmetry 11, no. 1: 107. https://0-doi-org.brum.beds.ac.uk/10.3390/sym11010107