A Decision Support System Using Text Mining Based Grey Relational Method for the Evaluation of Written Exams


1
Department of Computer Engineering, Mehmet Akif Ersoy University, Burdur 15030, Turkey
2
Department of Industrial Engineering, Mehmet Akif Ersoy University, Burdur 15030, Turkey
*
Author to whom correspondence should be addressed.
Symmetry 2019, 11(11), 1426; https://0-doi-org.brum.beds.ac.uk/10.3390/sym11111426
Submission received: 4 October 2019
/
Revised: 7 November 2019
/
Accepted: 15 November 2019
/
Published: 19 November 2019
Abstract
:Grey relational analysis (GRA) is a part of the Grey system theory (GST). It is appropriate for solving problems with complicated interrelationships between multiple factors/parameters and variables. It solves multiple-criteria decision-making problems by combining the entire range of performance attribute values being considered for every alternative into one single value. Thus, the main problem is reduced to a single-objective decision-making problem. In this study, we developed a decision support system for the evaluation of written exams with the help of GRA using contextual text mining techniques. The answers obtained from the written exam with the participation of 50 students in a computer laboratory and the answer key prepared by the instructor constituted the data set of the study. A symmetrical perspective allows us to perform relational analysis between the students’ answers and the instructor’s answer key in order to contribute to the measurement and evaluation. Text mining methods and GRA were applied to the data set through the decision support system employing the SQL Server database management system, C#, and Java programming languages. According to the results, we demonstrated that the exam papers are successfully ranked and graded based on the word similarities in the answer key.
1. Introduction
The concept of measurement, which aims to determine and grade differences, is defined as the observation of characteristics and the expression of observation results [1]. It is accepted as a critical component of the education system and contains various techniques to define the level of education status and differences [2]. Between these techniques used to determine the levels of success, measurement tools such as tests, essay exams, written exams, and oral exams are available. Written exams are considered as essential tools when it comes to measuring the original and creative thinking power of students, written expression skills, subject evaluation, and application of knowledge and skills [2,3,4]. However, the validity and reliability of written exams are reduced due to some factors such as non-objective assessment, not to pay attention and care to the scoring criteria, making unnecessary verbiage in answers, scoring difficulties, and time-consuming situations [2,3,4,5].
In recent years, increasing attention to artificial intelligence has encouraged the progress of data mining and analytics in the field of education. Data mining is a knowledge-intensive task concerned with deriving higher-level insights from data. It is defined as ‘‘the non-trivial process of identifying valid, novel, potentially useful, and ultimately understandable patterns in data’’ [6,7] or ‘‘the analysis of large observational datasets to find unsuspected relationships and to summarize the data in novel ways that are both understandable and useful to the data owner’’ [8]. It is the process of discovering patterns (new aspects, hidden knowledge) and extracting useful information from large data sets or databases through the methods used in artificial intelligence, machine learning, statistics, and database systems to help decision-makers to make correct decisions [9,10].
Data mining specialized in the field of education is called Educational Data Mining (EDM). EDM refers to the methods and tools used to obtain information from educational records (i.e., exam results, online logs to track learning behaviors) and then analyzes the information to formulate outcomes. It is concerned with developing methods (i.e., statistics, correlation analysis, regression, online analytical processes, social network analysis, cluster analysis, and text mining) to explore the unique and increasingly large-scale data obtained from educational environments and utilizing those methods to better understand students and the environments in which they learn [11,12,13]. Since data mining techniques are usually used to evaluate training models and tools, EDM is seen as knowledge-intensive work. In the literature, classification, clustering, and estimation techniques have been applied, and various applications have been developed by using structured data. In particular, with the development of internet-based technologies, unstructured data analysis (e.g., documents, text files, media files, images, emails, social media data, and so on) is not encountered much in the field of educational technologies [14,15,16]. However, the fact that the vast majority of educational data is in textual format provides significant analysis opportunities for the research. Text mining, where unstructured data analysis can be performed, is an analysis technique based on data mining of textual data. It is carried out by Information Retrieval (IR) and Natural Language Processing (NLP) methods and claims that a document can be represented by the number of words in the texts [17,18,19].
Text mining, which analyzes emails, online reviews, documents, tweets, sentences, and survey responses, enables applications such as clustering, classification, and summarization according to similarity levels of data. The similarity analysis of documents and text data in excess amounts is particularly of interest in the literature [20,21,22]. In our study, the main goal is to evaluate written exam answers by using text mining in order to contribute to the correct decision of the instructor. We developed a two-stage decision support system that employs the SQL Server database management system, C#, and Java programming languages to rate the exam results. Since the insufficiencies of the Term Frequency-Inverse Document Frequency (TF-IDF) method in short text analysis [22,23,24], we took advantage of Grey relational analysis (GRA), which gives effective results in case of incomplete information. In this context, we constructed a decision matrix by using the Bag of Words (BoW) and Vector Space Model (VSM). Then, we applied a two-stage GRA to the decision matrix. According to the experimental results, we observed that the level of similarity between the exam answers and the answer key is determined successfully by the decision support system we developed.
The remainder of this paper is organized as follows: Section 2 presents a literature review about the evaluation of exams, data mining, text mining, and EDM; Section 3 focuses on the GRA concept; Section 4 describes the proposed method; Section 5 summarizes the findings of the analysis; and Section 6 presents discussions and suggestions.
2. Background
2.1. The Evaluation of Exams
The concept of measurement, which is defined as expressing the result of observations in terms of quality and quantity, is a research topic aimed at determining the differences [1]. The fact that individuals and objects have different characteristics makes it necessary to measure these characteristics [25]. According to [26], the concept of measurement has an approach involving the identification of differences. In other words, by measuring, differences between objects can be quantitatively determined and graded according to the properties possessed by the objects. In this way, measurement methods can be seen as a decision-making process. The concept of assessment, which is used to determine the intended learning outcomes in education levels, rather than a successful or unsuccessful evaluation form today, points to a level of learning-oriented approach [27]. According to [28], when deciding on the level of learning, the interests, motivation, preparation, participation, perseverance, and achievement of the students should be considered. Various measuring instruments or methods are used to evaluate the achievement between the mentioned elements. Commonly used measuring instruments are oral exams, multiple-choice exams (tests), and written exams [29]. Oral exams have low validity and reliability. They cannot go beyond measuring isolated information. The emotional and mental state of the student affects the test result. The appearance of the student (i.e., dressing style) also affects the evaluation result. For these reasons, oral exams are a measurement tool that results in high inconsistencies. In multiple-choice exams, the student chooses the most appropriate answer to the question. However, these exams reduce expression skills, decision-making skills, and interpretation power, and cannot measure mental skills. It is not seen as a robust measurement tool for such reasons. Contrary to oral exams and multiple-choice exams, there is a consensus in the literature that written exams offer effective results in measurement and assessment, although they are laborious in practice [1,2,3,4,5]. The advantages and disadvantages of these exam types are presented in Table 1, Table 2, and Table 3, respectively.
2.1.1. Written Exams
When it comes to putting together ideas, organizing, evaluating, and applying knowledge and skills, the most appropriate method for the measurement is written exams. Therefore, written exams, which aim to find out the student’s original and creative thinking power, are a beneficial technique for measuring writing skills and are quite a widely applied method for measurement at all levels of the education system starting from primary school [3,4,5]. Written exams, which are also called classical exams and open-ended exams, are created with answers by the students in a handwritten or an electronic environment. The answers to the written exams, which reflect the students’ knowledge and thinking skills about the subject, are usually short texts [25,26,27].
Written exams, which are suitable for measuring high-level mental skills, have some advantages over the other exam types. The most important feature of the written exams is the freedom to answer. The student is free to decide on how to approach the questions, which practical information to use, how to arrange the answer, and how much emphasis is placed on every aspect of the answer. Therefore, the written exams enable students to have the ability to produce, integrate, and express ideas and to develop skills to state their thoughts in written form. Furthermore, unlike other types of tests, these exams increase the validity of results because of the chance factor and lack of possibility of copying, providing a more accurate determination of the outcomes and performance [26,27,28,29].
Besides the advantages of written exams, there are some restrictions. According to educators, exam scoring is the most significant limitation in the evaluation of exams [1,2,3]. The scoring process can be influenced by the paper layout, imperfections, in-class behavior, and students’ family characteristics (i.e., interests and attitudes). Therefore, different scores can be shown on the same answer sheet. Consequently, there may be some situations in which results distort the measuring success and reduce reliability [3,4,5,25]. In [4], the authors emphasized that evaluators should pay attention to the learning outcomes and evaluate answers carefully. In this context, the evaluation process was described as “three blind men and an elephant”. On the other hand, students who do not know the exact answer can write answers consisting of unnecessary statements to show that they have knowledge. In this case, it is challenging to identify information to be scored, and the educator loses the objectivity; thus, reducing the validity and the reliability of the exam. Finally, the excessive course load on the students can extend the period in which the educator evaluates the learning success, and reduce the efficiency of exams through these results [2,3,4,28,29,30].
Because of the positive effects of results obtained from written exams on the measurement and evaluation, we focused on the analysis of these exams. From this point of view, we developed a decision support system as a solution to the problems experienced in scoring the written exams.
2.2. Data Mining
With the increasing growth of data used in many application areas (e.g., bioinformatics, business intelligence, finance, retail, health, telecommunication, Web search engines, social media, and digital libraries), data mining meets the needs for flexible, scalable, and efficient data analysis in today’s information age. Data mining (also known as knowledge discovery from data) can be considered as a natural evolution of information technology and a confluence of several disciplines (i.e., machine learning, statistics, information retrieval, pattern recognition, and bioinformatics) and application fields. It is the process of discovering interesting patterns (that represent knowledge and are novel, potentially useful, and easily understandable by humans) from large amounts of data [31,32]. Data mining, as a knowledge discovery process, usually includes an iterative sequence of the following steps: data cleaning, data integration, data selection, data transformation, pattern discovery, pattern evaluation, and knowledge presentation. It can be performed by any kind of data (e.g., transactional data, data warehouse data, database data, advanced data types that have versatile forms, structures and rather different semantic meanings, such as Web data, engineering design data, data streams, hypertext and multi-media data, graph and networked data, spatial and spatiotemporal data, time-related or sequence data) as long as the data are meaningful for the target application [33,34].
There are several techniques to specify the kinds of patterns to be discovered in data mining tasks. In general, such data mining tasks are classified into two major groups: descriptive and predictive. Descriptive tasks characterize the properties of data in a target dataset. Predictive tasks carry out induction on the available data to make predictions [17]. The main techniques used in data mining tasks are classification and regression; characterization and discrimination; cluster analysis; the mining of frequent patterns, associations, and correlations; association rules; outlier detection; sequence analysis; time series analysis; sentiment analysis; social network analysis; prediction; and text mining [31,32]. As a highly application-driven discipline, data mining incorporates many techniques from the other research areas such as artificial intelligence, machine learning, database systems, data warehouses, information retrieval, high-performance computing, statistics, pattern recognition, and visualization [33,34]. Consequently, the interdisciplinary nature of data mining development significantly contributes to the success of data mining and its extensive application domains.
2.3. Text Mining
The analysis of structural data is possible with data mining approaches. However, the vast majority of data we encounter in our daily lives, such as documents, texts, and pictures, are composed of unstructured data. In the analysis of these data, the insufficiency of data mining approaches requires the use of analyses involving textual operations and language constructs. In this context, text mining can be defined as the process to obtain confidential information from textual data [35]. The first study on the analysis of textual data was done by [36]. The authors, aiming to extract keywords based on NLP from project descriptions recorded in the database in text form, have performed a cluster analysis of the documents by using those keywords. The process of converting textual data into a structured form was first described by [37]. In this study, the textual data in documents were converted into a structured form using IR, and then meaningful concepts were determined by using the text categorization approach of [36]. In recent years, the use of text mining, which is also an interdisciplinary research area related to the IR, the NLP, and the Named Entity Recognition (NER), has increased rapidly and become the focus of interest in almost all application domains.
To be able to analyze the textual data, first of all, they must be represented numerically. For the numerical representation of a document, the Bag of Words (BoW), the Binary model, and the Vector Space Model (VSM) representations are employed [18]. In the BoW method, the number of words in the document is determined, and the document can, therefore, be represented numerically [38,39]. In the Binary model, a set of terms in the document is referenced, and the values “0” and “1” are encoded to determine whether or not a specific term is related to the document; “1” is used in the case of the term is in the text, otherwise “0” is used. The VSM is used to vectorize the word counts in the text [40]. In other words, it can be considered as a matrix based on BoW, which shows the word frequencies in the document. If more than one document is compared, each word is weighted depending on the frequency numbers in other documents. In general, the TF-IDF method is used for the weighting operation.
There are two techniques used in text mining: contextual analysis and lexical analysis [31,32]. The contextual analysis is aimed at determining words and word associations based on the frequency values of the words in the text. The BoW and VSM methods are employed in contextual analysis to represent the documents. Lexical analysis is carried out in the context of NLP for the meaningful examination of texts [39,41]. Within the meaningful analyses, applications such as opinion mining, sentiment analysis, evaluation mining, and thought mining are performed and used to extract social, political, commercial, and cultural meanings from textual data. Besides, the main methods used in text mining include clustering, classification, and summarization [19,42,43].
- Clustering: It is the method to organize similar contents from unstructured data sources such as documents, news, images, paragraphs, sentences, comments, or terms in order to enhance retrieval and support browsing. It is the process to group the contents based on fuzzy information, such as words or word phrases in a set of documents. The similarity is computed using a similarity function. Measurement methods such as Cosine distance, Manhattan distance, and Euclidean distance are used for the clustering process. Besides, there is a wide variety of different clustering algorithms, such as hierarchical algorithms, partitioning algorithms, and standard parametric modeling-based methods. These algorithms are grouped along different dimensions based either on the underlying methodology of the algorithm, leading to agglomerative or partitional approaches, or on the structure of the final solution, leading to hierarchical or non-hierarchical solutions [35,38,43].
- Classification: It is a data mining approach to the grouping of the data according to the specified characteristics. It is carried out in two stages as learning and classification. In the first stage, a part of the data set is used for training purposes to determine how data characteristics will be classified. In the second stage, all datasets are classified by these rules. Supervised machine learning algorithms are used for classification methods. These algorithms include decision trees, I Bayes, nearest neighbor, classification and regression trees, support vector machines, and genetic algorithms [31,35,43].
- Summarization: It is used for documents and aims to determine the meanings, words, and phrases that can represent a document. It is carried out based on the language-specific rules that textual data belongs to. NLP approaches, which are one of the complex processes in terms of computer systems, are used in applications such as speech recognition, language translation, automated response systems, text summarization, and sentiment analysis [31,35,43].
2.4. Educational Data Mining (EDM)
EDM is a research area in which education system issues (e.g., learning models, programs, activities, teaching methods and materials, resources, and vocational qualifications of teachers) are studied based on data mining. It aims to develop education models and techniques and analyze data related to the attitudes and behaviors of students, teachers, administrators, teaching methods and materials [13]. In the literature, we observed that data mining techniques such as clustering, classification, and prediction are typically used in EDM studies [16,17]. With EDM applications, educators, administrators, and researchers make effective decisions by using tools such as student modeling, performance assessment, educational outcome prediction, course activity analysis, management activity analysis, and learning behaviors analysis [44]. In this context, EDM analyses that employ statistical methods and machine learning techniques are decision support systems performed with educational data.
The fact that the educational data consists of multiple factors and that all data cannot be transferred to the electronic environment creates problems in educational analysis processes [45]. Therefore, many educators, managers, and policymakers have hesitated to use data mining methods. In recent years, the transfer of historical data to the electronic media and the more regular recording of data have attracted the attention of researchers to the field of data mining. Besides, the experience is essential in acquiring general and special field vocational competences in education. In this context, it is indisputable that the analysis of data based on past experiences will significantly contribute to the education process. However, the inclusion of historical data in the analysis poses more challenging processes for EDM. Traditional data mining techniques used in EDM are inadequate in complex data analysis. Thus, it is inevitable that EDM analyses make use of artificial intelligence techniques, such as machine learning, NLP, expert systems, deep learning, neural networks, and big data. The analysis of educational data (the evaluation of relations, patterns, and associations based on the historical data) through these techniques will enable more precise assessments related to education and ensure that future decisions will be made more accurately by the administrators, supervisors, and teachers.
3. Grey Relational Analysis (GRA)
The Grey system theory is used to solve problems with a small sample and missing information and produce results in the case of uncertainty and incomplete information [46]. While the exact unknown information in the Grey system theory is represented by black, precisely known information is represented by white, and the incomplete information between these two endpoints is represented by grey [47,48,49].
GRA is a relational ranking, classification, and decision-making technique developed by using the Grey system theory [47]. With this method, it is aimed to determine the degree of relations between the reference series and each factor in a grey system. The relationship level between the factors is called a Grey relational degree. GRA is used to make the most appropriate selection based on various criteria between the options. It aims at the selection of the best alternatives in a multi-criteria decision-making process. It can be regarded as an optimization method. The calculation to perform the comparison and sorting between alternatives is realized in six steps: the creation of decision matrix, comparison matrix, normalization matrix, absolute value table, grey relational coefficient matrix, and grey relational degrees [50,51].
Step 1: The first operation in GRA is to create a decision matrix consisting of alternatives a and decision criteria c. Equation (2) shows the decision matrix . represents each alternative, and represents the criteria value of each alternative. The alternative number in the decision matrix is denoted by , and the criteria number is denoted by .
Step 2: Based on the values in the decision matrix, the reference series is added to the matrix, and the comparison matrix is obtained. The value of the reference series is selected based on the maximum or minimum values of the decision criteria in the alternatives, as well as the optimal criterion value, which the ideal alternative can obtain. Comparison matrix is
Step 3: The process of reducing a datum to small intervals is called normalization. After normalization, it becomes possible to compare the series with each other. Thus, the normalization prevents the analysis from being adversely affected, depending on the discrete values [50,51,52]. In GRA, the normalization varies according to whether the criterion values in the series are maximum or minimum. If the maximum value of the series contributes positively to the decision (utility-based), Equation (4) is used. If the minimum value of the series contributes positively to the decision (cost-based), Equation (5) is used. If there is a positive contribution of a desired optimal value to the decision (optimal based), Equation (6) is used to normalize the matrix . In this case, the normalization matrix is obtained by Equation (7)
Step 4: Equation (8) indicates the absolute subtraction of the reference series and the alternatives. The absolute value table is created by taking the absolute difference of each alternative series in and the reference series and obtained by Equation (9). For example, the absolute value of the second alternative third criterion is calculated as .
Step 5: The absolute value table () in Equation (9) is used to calculate the grey relational coefficients indicating the degree of closeness of the decision matrix to the comparison matrix. The grey relational coefficients are calculated by Equation (12).
In Equation (12), denotes the distinguishing coefficient and . The purpose of is to expand or compress the range of coefficients. In cases where there is a large difference in data, is chosen close to 0 otherwise close to 1. In the literature, it is stated that does not affect the ranking and is generally taken as [53].
Step 6: Grey relational degrees determining the relationship between the reference series and alternatives can be calculated in two ways. If the decision criteria have equal significance, Equation (13) is used to calculate the degrees. In the other case, Equation (14) is used. The value denotes the weight of the decision criteria in Equation (14). The value calculated by the arithmetic mean of is close to 1 indicates that the relationship with the reference series is high.
4. Proposed Method
Text mining is a complex process consisting of four steps (Figure 1), in which textual data is converted into structured data and analyzed by data mining techniques.
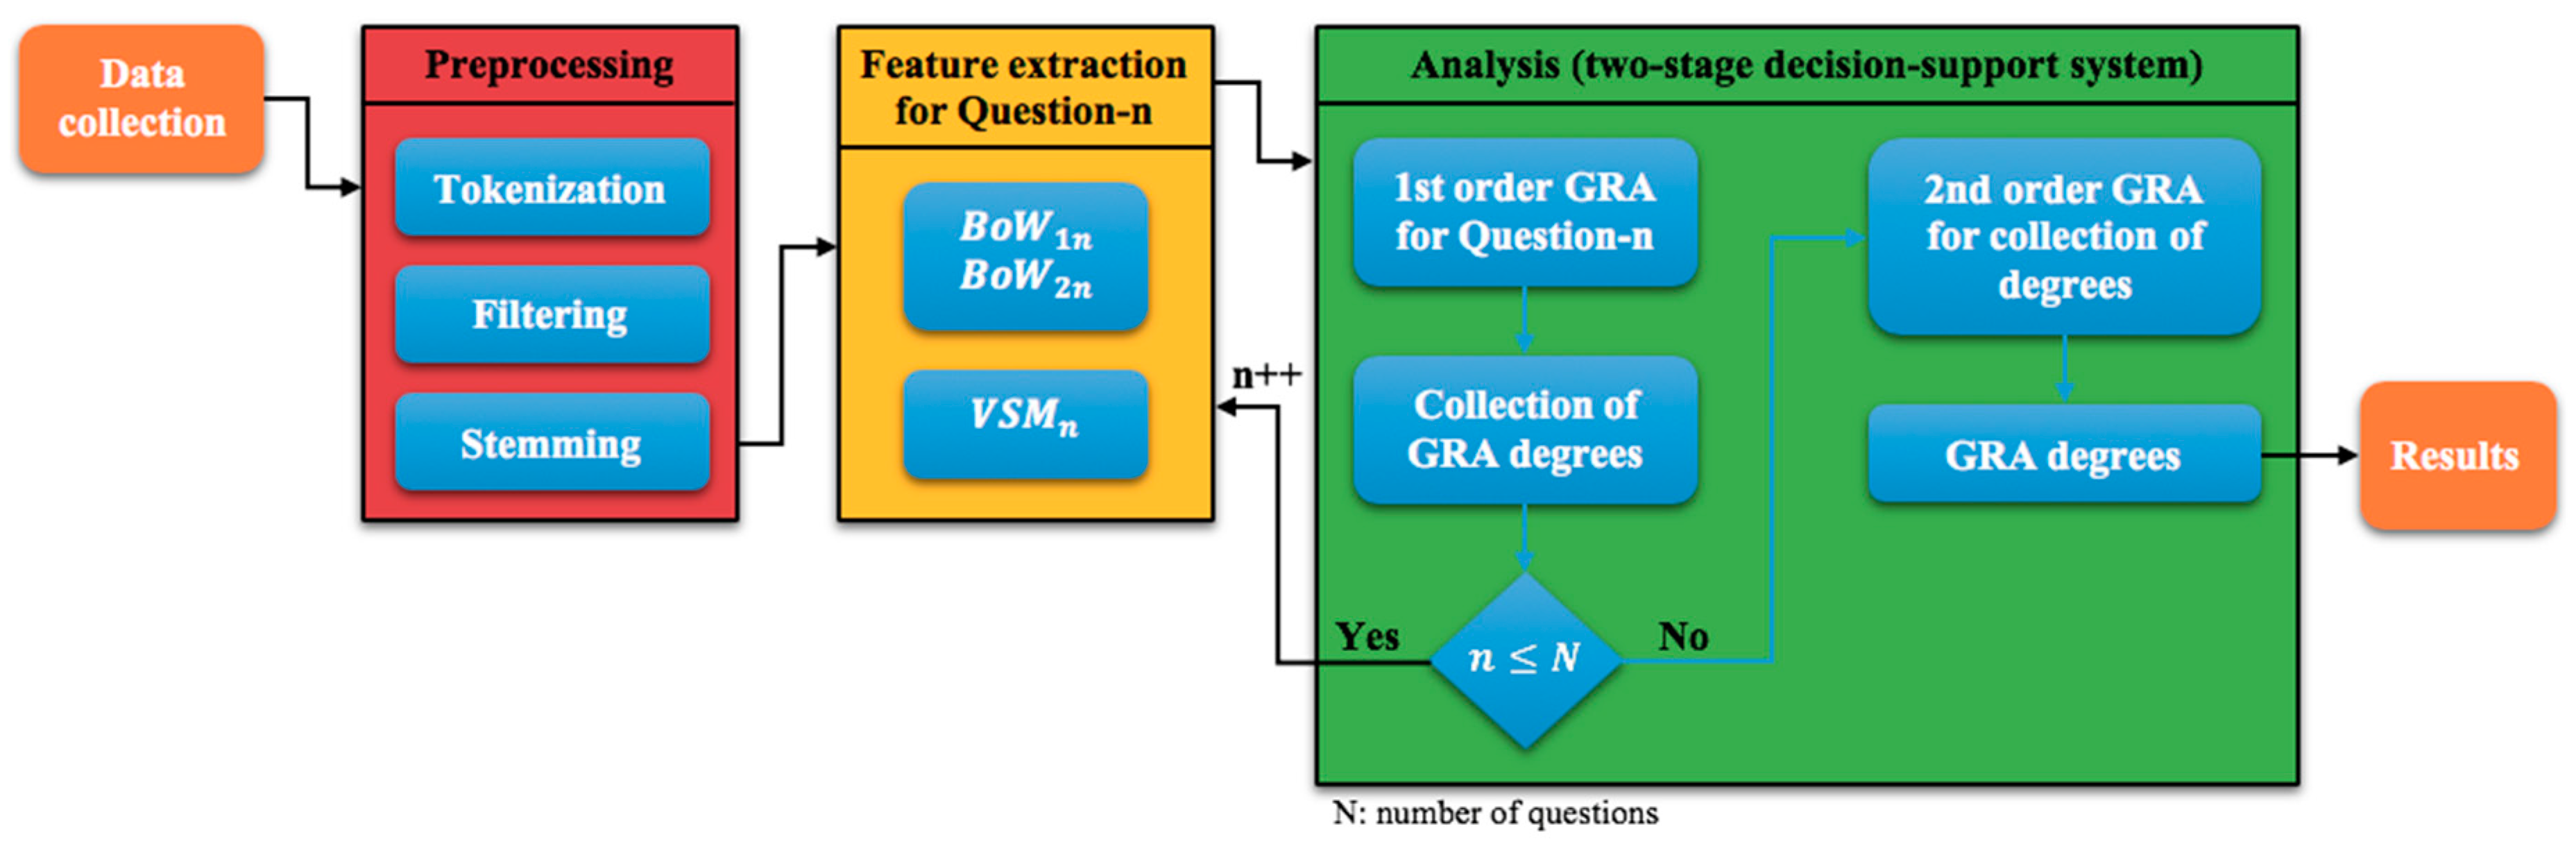
In this study, we developed a decision support system based on text mining and GRA to evaluate the written exams. Figure 2 depicts our system model. At the university level, 50 students in the same class took an examination, and the instructor evaluated the answer sheets. In this context, we analyzed the relationship level between the students’ written exams and the answer key.
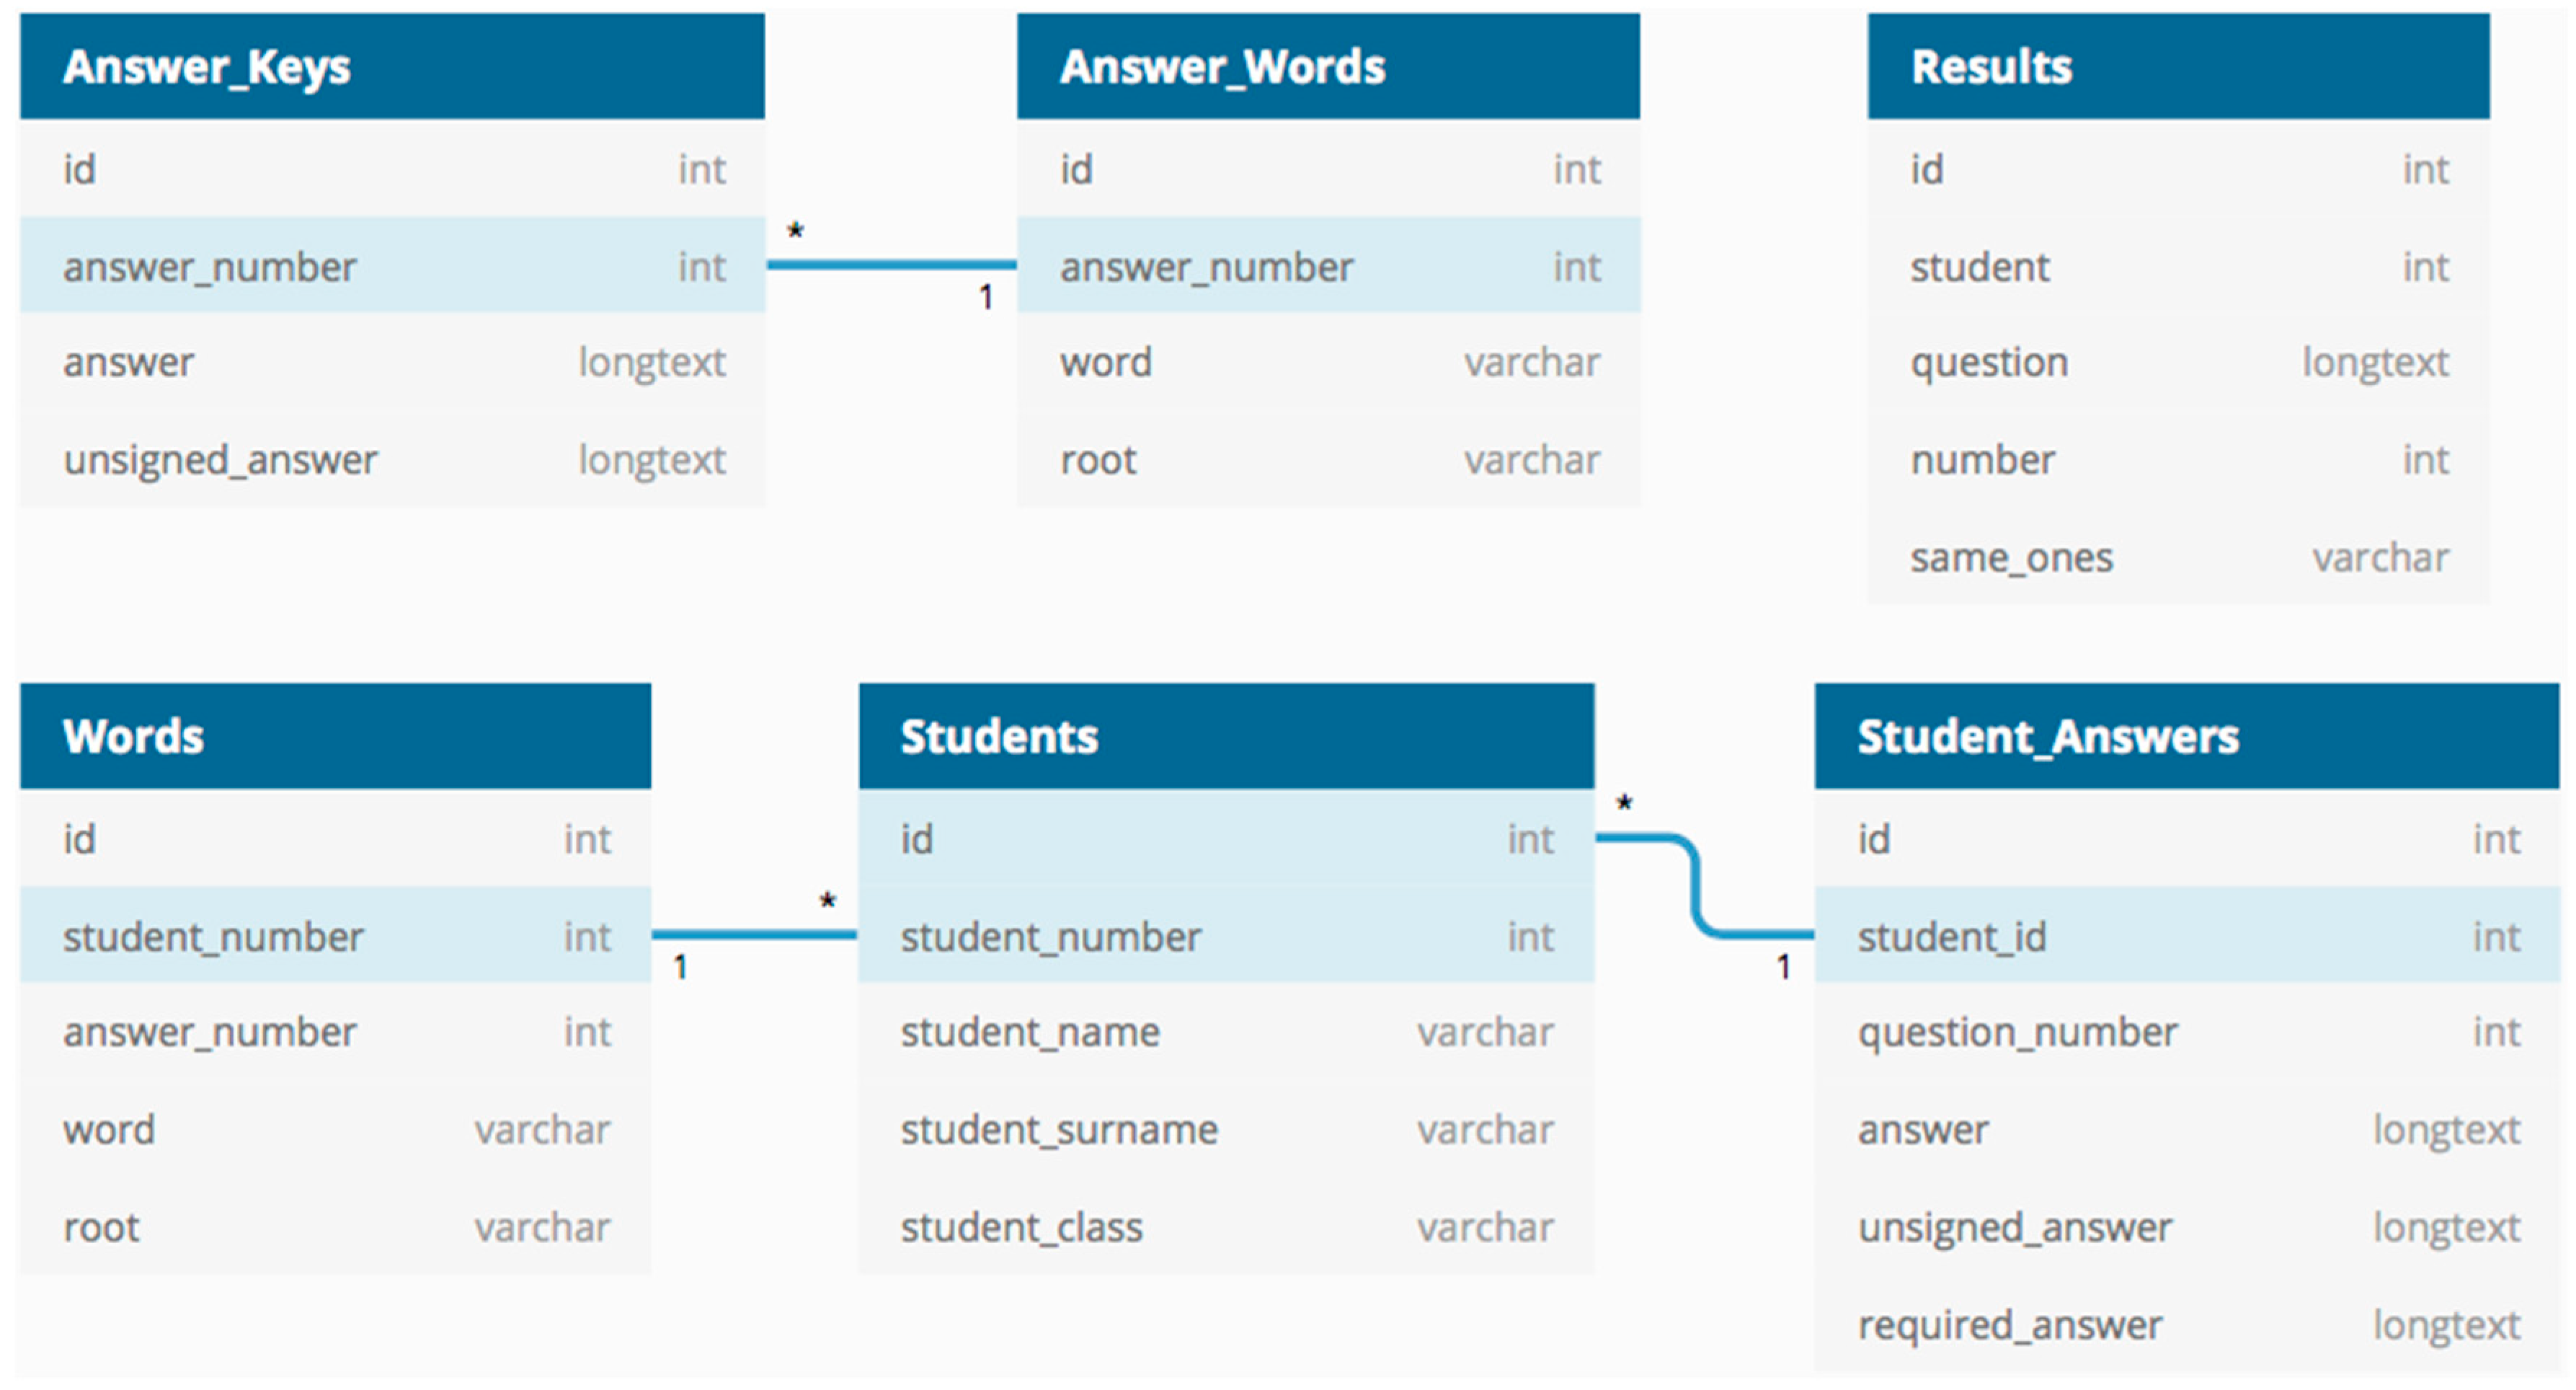
In our system, we used the C# programming language for data collection, data preparation, text processing, and GRA operations. We also found word roots using Java programming language and performed data operations through the Microsoft SQL Server database management system. The database tables used in the analysis process are shown in Figure 3.
4.1. Data Collection
Students taking the exam were announced a week before the exam date. On a volunteer basis, 50 students participated in the exam in the computer laboratory. Five questions were asked to the students, and the answer sheets were received in an electronic format (as a Word document). The answer key for the first question is shown in Appendix A (a,b). In order to be able to describe the GRA-based system model used in this research to the reader as short and understandable, we created a sample table by considering five student answers and explained the GRA calculations according to this table. The answers given by the five students are presented in Appendix A (c). The answers, the scores, and the answer key were saved into the database with the application programming interface we developed.
4.2. Data Preprocessing
The efficiency of text mining technique is directly related to data preprocessing. Data preprocessing influences the health of the analysis results. It consists of three steps, which are applied, respectively: tokenization, filtering, and stemming. In the tokenization phase, which is performed by text processing functions of the software developed, the marks such as point, comma, and exclamation are extracted from the text firstly. Then, the words in the text are broken up, and each word is stored in the database. Those steps in the tokenization phase are repeated for each answer of all students and the answer key. The second phase used in data preprocessing is filtering, which is NLP-based and includes removing prepositions and conjunction words. This process is carried out by deleting the words from the database through the programming language. Some of the deleted words in filtering process are as follows in Turkish: fakat (but), ancak (only), bile (even), ile (with), çünkü (because), eğer (if), ve (and), veya (or), etc. The final phase in data preprocessing is the stemming. As a process of finding word roots, stemming is used to extract the prefixes and the suffixes that change the meaning of the words. In this study, we employed the Zemberek 0.11.1, which is the Java-based NLP library designed for performing Turkish NLP operations, to find the root of the words. Roots of the words stored in the database were identified by the Java application we developed. After removing the prefixes and the suffixes, the roots found were recorded in the database again.
4.3. Feature Extraction
Converting data to a structured form is a transformation process to apply data mining techniques to the text data. BoW, binary, and VSM methods are typically used to extract the word counts of the text, and these values are considered as features of the document. In other words, the data conversion task is the feature extraction of the document (textual data) at the same time [54,55].
4.3.1. Bag of Words (BoW)
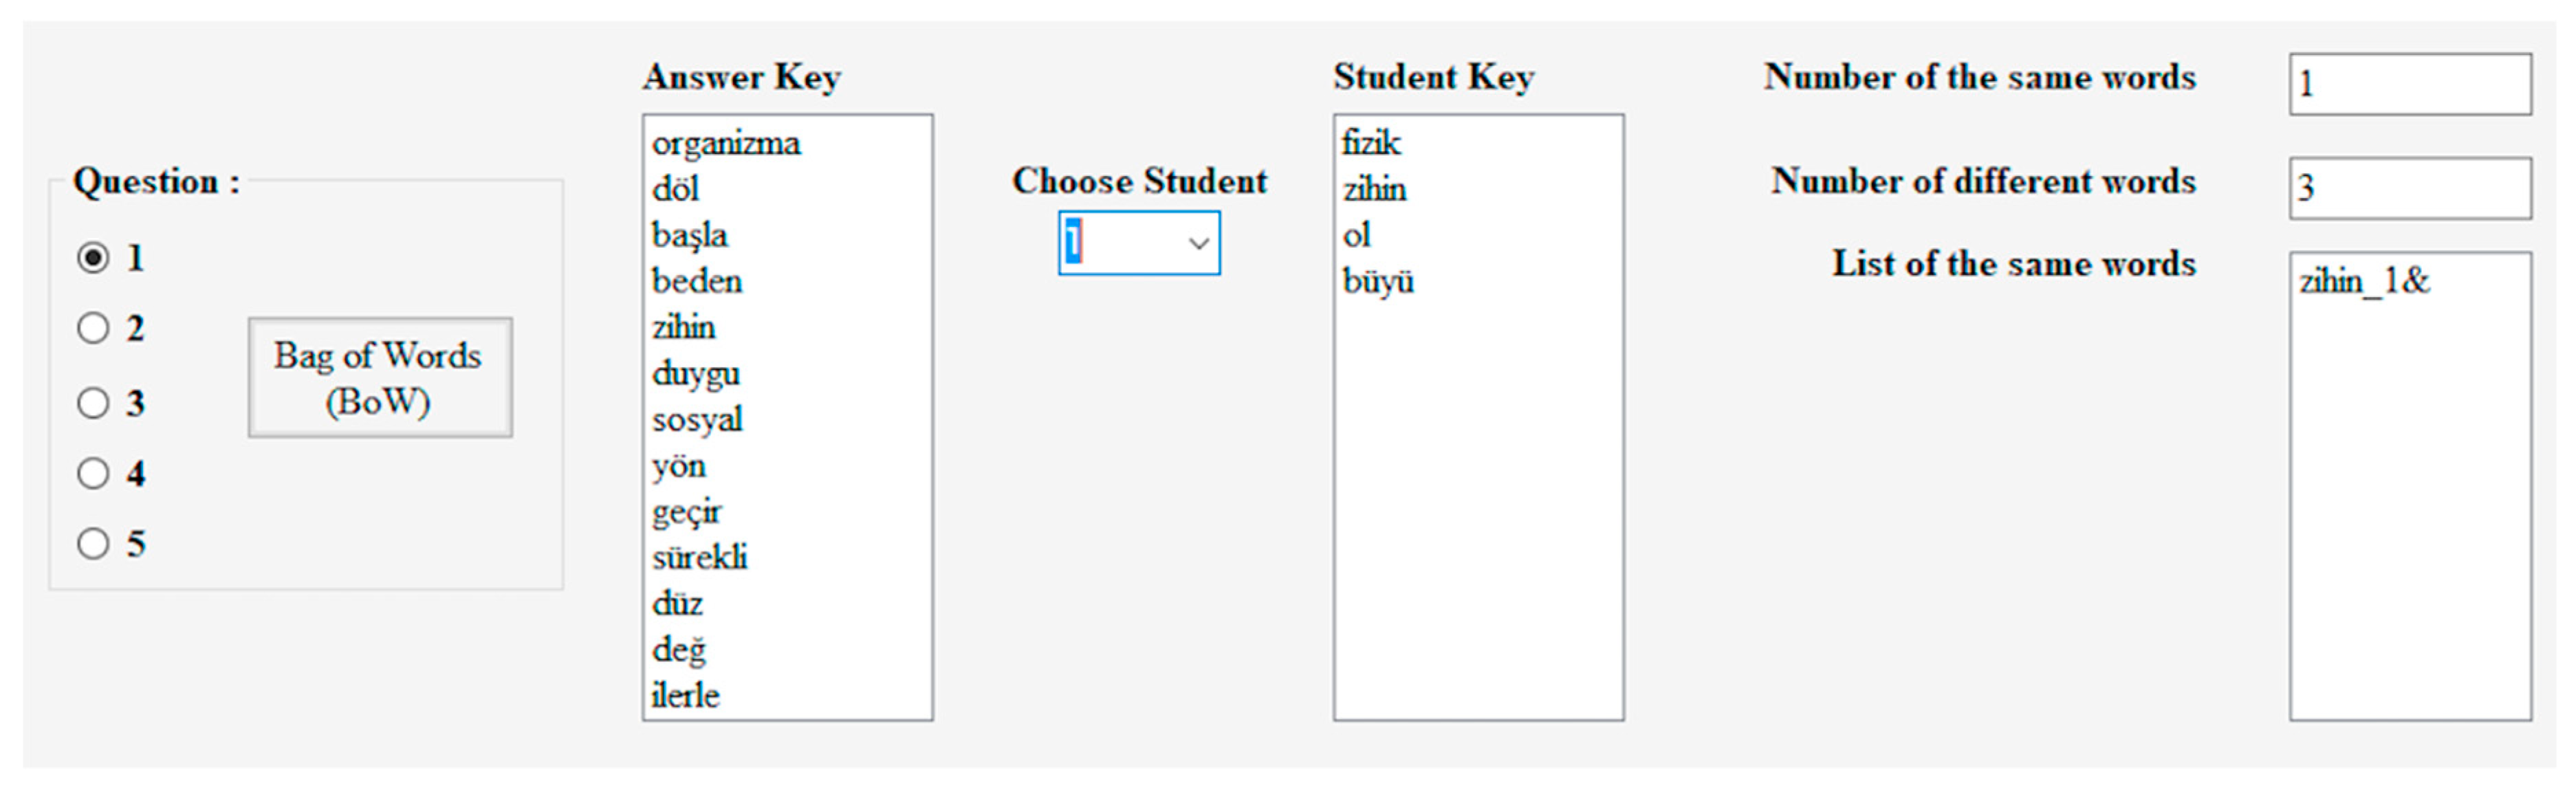
The BoW approach is used to convert the document into a structured form. In other words, it assumes that the number of words in the text document can represent the document. In our study, we generated two BoW series (BoW1: the word frequency number of answer key; BoW2: the word frequency number of student answers) for each answer. In the BoW generation process given by Algorithm 1, BoW values of both answer key and student answers were placed in the BoW array. A value of 0 for the variable “answer” in the algorithm indicated the answer key BoW.
| Algorithm 1. BoW Generation |
|
4.3.2. Vector Space Model (VSM)
VSM is the most common method to represent textual data numerically. In VSM, each document is represented by a vector created using the frequency count of the items. In document comparisons, the weight values of the words in documents to be compared can be determined relative to the Term Frequency (TF) or the Term Frequency-Inverse Document Frequency (TF-IDF). The TF denotes the number of terms in the document. The TF-IDF is a weighting method of the terms in the document collection [19]. It is possible to compare the multi-documents using the TF-IDF. For the term weight calculation, we used the TF-IDF method as follows:
In Equation (15), denotes the weight of the term . The value of is directly proportional to the number of in document , , and inversely proportional the number of in other documents . is the number of all documents, and indicates the number of documents in which the related term is located. This approach, which is used in text mining applications effectively, is not a measure of similarity; however, it indicates the importance of a term in documents. Document similarities can be determined using the similarity measures such as Cosines and Euclidean [55,56].
Besides the advantages of simple calculation and allowing a comparison of multiple documents, there are some limitations related to TF-IDF. Insufficient information, defined as the sparsity in short texts, is one of those limitations. Although the TF-IDF provides healthy results in the analysis of long text data, it may not give effective results in the analysis of short text data. On the other hand, the evaluation of a text according to the weight gradations of the terms makes the term with a higher weight degree more important than others. Therefore, the TF-IDF indicates the importance of the frequency-based term in the text [20,56]. According to [21], although this method can be used to separate terms, it is not sufficient to distinguish between documents. Because of the shortcomings of the TF-IDF, it can be problematic when we consider short texts where terms with a low weight scale and terms with higher weight have an equal prefix. Therefore, the use of TF-IDF may not be an appropriate choice when written exams consist of short texts. Furthermore, exam evaluations should be measured with the similarity to the answer key to be referenced, not to other answers. In other words, the evaluation of exam questions should be done by the similarity to the answer key of all answers, and not be weighted according to other answers. In this context, it is suitable to analyze exam answers represented by the VSM with GRA, which is used in case of insufficient information so that written exam evaluations can be carried out by text mining.
4.4. Analysis
The structural text converted into a digital vector is analyzed in detail by employing clustering, classification, and summarization. Moreover, statistical methods and machine learning techniques in data mining tasks can also be used as analysis methods.
5. Experimental Results
5.1. BoW Findings
The number of frequencies of the word roots in the answer key was determined, and the bag of words, , representing the answer key was created for each question. Thus, the bag of words for n questions in the answer key can be defined as
In the same way, , was created by representing the answers of m students for the questions and can be defined as
For example, , which is the first question answer key bag of words and , which is the first question first student bag of words are shown in Figure 4. Words are in Turkish. (For all students, see Appendix B (a)).
5.2. VSM Findings
The roots of words and numbers that match the answer key need to be specified for the analysis. The VSM table showing word distribution based on the answers of the first question responded by the five students is presented in Table 4. The VSM table, created by the answers of all students to the first question, is given in Appendix B (b).
5.3. Grey Relational Degree Findings
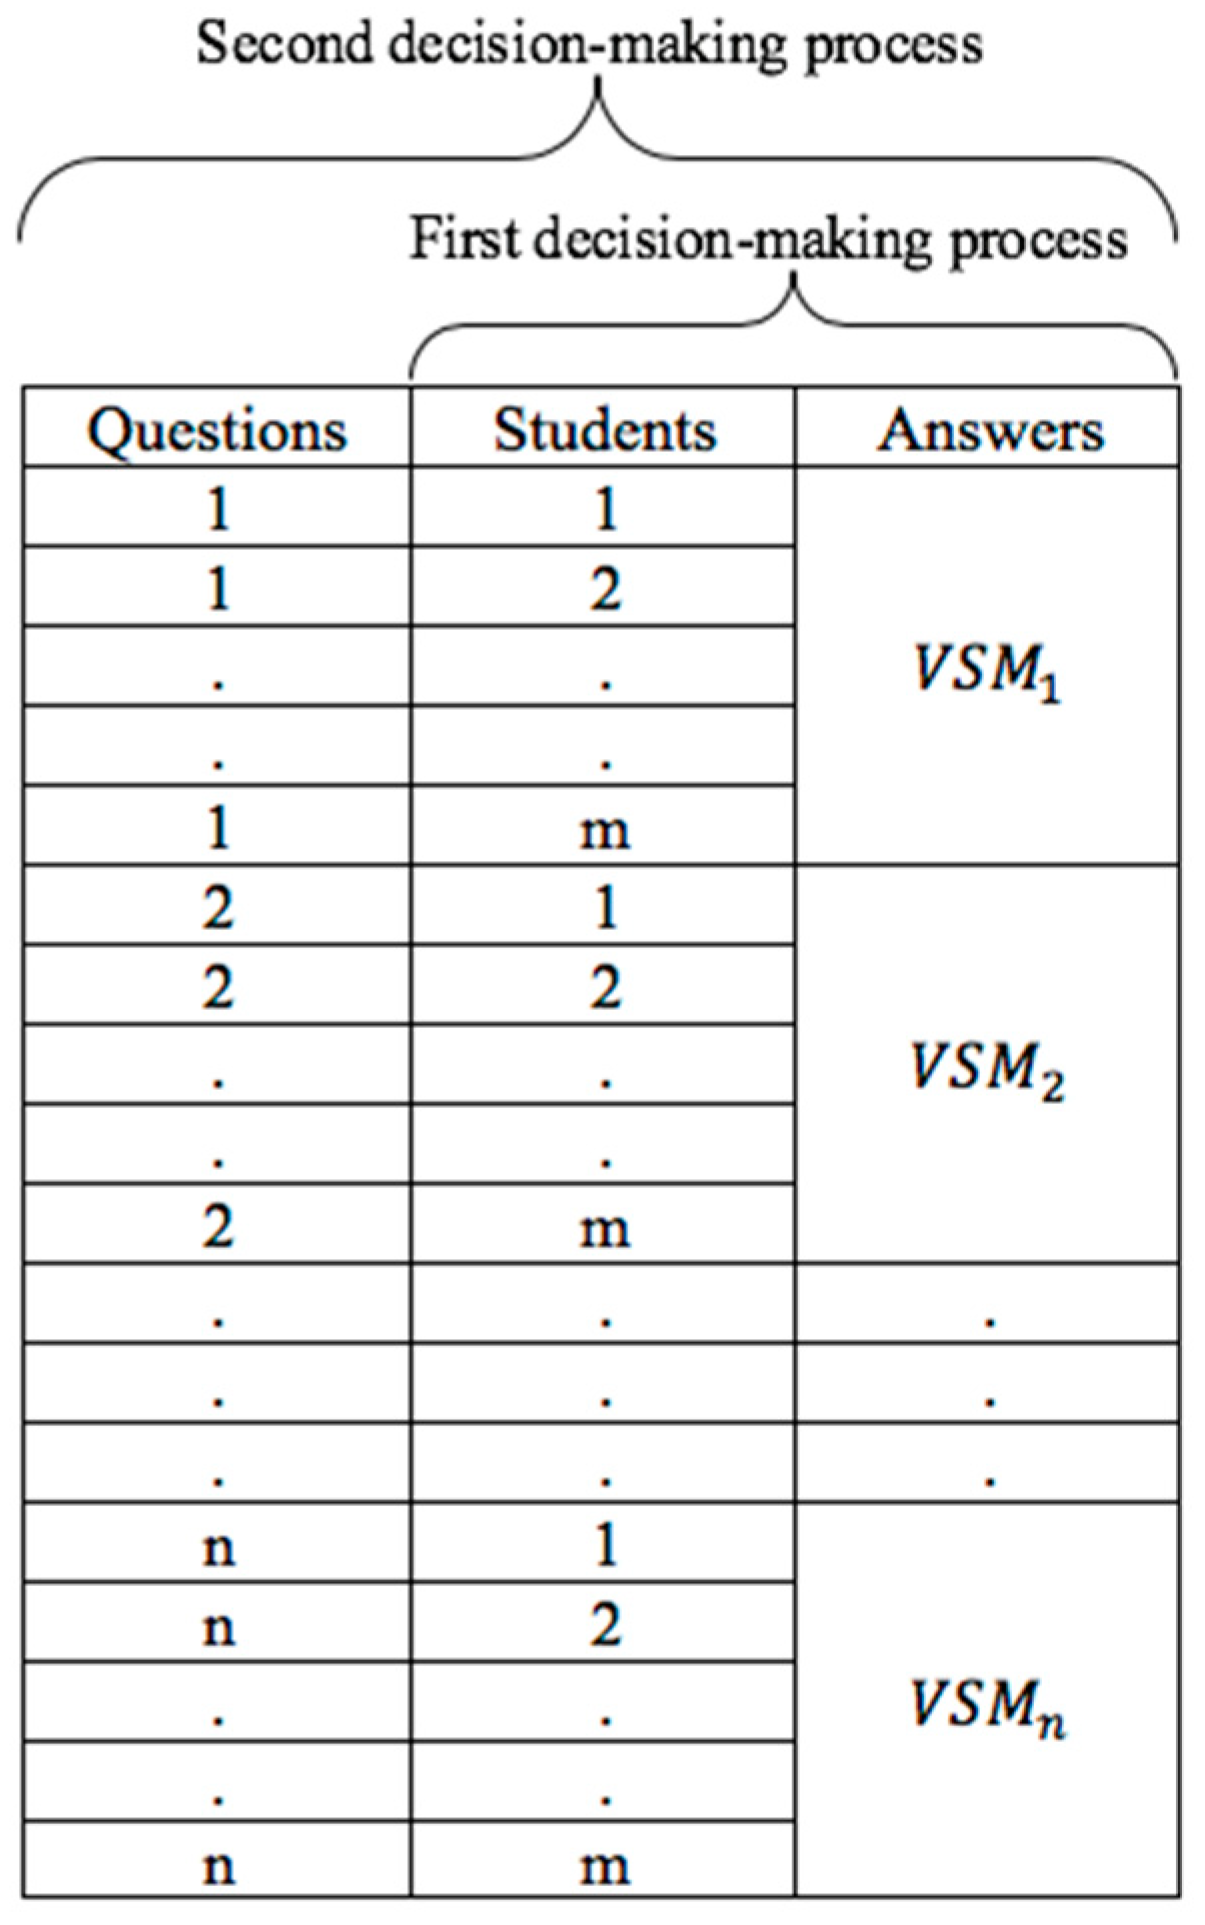
As illustrated in Figure 5, there is a two-stage decision-making process in our analysis. The first stage is to identify the level of relationship between the answers responded by the student and the words in the answer key for each question. The level of relationship between and was determined based on the result of the first step using VSM prepared for each question.
In the first stage, VSM, used as a decision matrix in the GRA, has a reference series which is added according to the utility-based values of each criterion among alternatives. Normalization was carried out by applying Equations (4) and (6). If the number of frequencies of the words in is less than , Equation (4) is used. If is greater than or equal to , Equation (6) is used for normalization. The absolute differences of the series obtained from the normalization process of the VSM with reference series were calculated, and then the Grey relational coefficients were calculated. was chosen in accordance with the literature in the calculation of the coefficients. The decision matrix formed by the first step is presented in Appendix C (a), the normalization matrix is given in Appendix C (b), the absolute differences are shown in Appendix C (c), and the Grey relational coefficients are given in Appendix C (d). Equation (13) is used for the calculation of Grey relational degrees with the assumption that the words in each question have equal importance. The Grey relational degrees showing the answer key relational level of the answers responded by the students for each question are presented in Table 5.
Table 5 shows the relationship between and for the questions answered by each student and requires a second decision-making process. It is used to rank the exam paper of each student in relation to the answer key. In this context, it was used as a decision matrix for the second stage GRA. The reference series was created by maximum values within the alternative degree values for each question. Since the higher degree of alternatives shows the maximum scoring value, based on the utility-based approach, normalization is carried out by Equation (4), and the absolute differences table is created. The Grey relational coefficients are calculated with Equation (12) by . The Grey relational coefficients of the second stage decision-making process were presented in Appendix D (a). Since each question has equal weight, the Grey relational degrees presented in Table 6 were calculated by Equation (13). Table 6 shows the relevance level of student answers to the answer key. For example, according to the table, the answer closest to the answer key for the first question belongs to student-1 and student-3. In similar, student-5 has the best answer to question 2. If all the questions are considered, the highest score should be given to the student-5.
The analysis results that contain the instructor’s scoring and the Grey relational degrees of the students’ answers are presented in Table 7. (See Appendix D (b) for all students).
6. Discussion and Suggestions
In this study, we developed a decision support system using text mining and Grey system theory. The exam evaluations, considered as multi-criteria decision-making problems, are based on the student answers and word similarities in the answer key. No study has been found on the use of Grey system theory (which is rarely studied in text mining literature) for the evaluation of the written exams. In this regard, our study is a pioneer in the field of text mining and educational data mining.
It should be noted that the study does not provide a scoring system based on the results. However, it realizes an evaluation based on the rating. In this respect, it is a decision support system that helps the decision-maker to evaluate the student exam results. When the results, presented in Table 7, are compared, it is seen that the analysis results made with the classical method are close to each other. The decision support system developed in this way contributes to the assessment of distance learning exams, both in the classical written exams and online, and facilitates the control of exam scores.
Since the study is based on the similarity of the word roots, the preprocessing part of the text mining analysis becomes an important task. At this stage, we observed that the Zemberek library has some inadequacies, such as the shortening of some vocabulary roots. However, since the stemming process was applied to both the answer key and the answer sheets by using the same way, this inadequacy was assumed not to affect the analysis results. Furthermore, since the study is based on contextual text mining, semantic changes in word roots were neglected in the stemming process.
We have observed that there are some limitations related to the root-finding processes involved in the preprocessing. We have accepted that the stemming is applied to both the answer key and student answers in the same way and that the analysis is not affected since the study is contextual. However, in lexical analysis, it cannot be assumed that the situation will not have an analytical effect. In this context, since the development of NLP tools will gain importance, more effective results can be obtained for the lexical text mining studies.
In the future study, the renovation of the research using the lexical text mining method and realizing semantic analyses using artificial intelligence will contribute positively to the literature. However, the inadequacies in NLP implementations in the used language limit the semantic approaches. Particularly phrases, sentences, expressions composed of more than one word, and the shortcomings in the idioms make the lexical text mining analysis difficult. Turkish NLP libraries, which are currently being developed to increase the efficiency and capacity of the libraries such as Zemberek, ITU Turkish NLP, and Tspell, will have a vital role for text mining. Besides, the fact that the data set used in the study is in Turkish does not mean that the proposed model cannot be applied in other languages. On the contrary, thanks to the powerful processing capabilities of English NLP libraries, our model can achieve more successful results in English data sets.
7. Conclusions
In this paper, we presented a new novel approach to written exam evaluation. We developed a decision support system employing text mining and GRA to help decision-makers to evaluate the written exams. We demonstrated that how GRA could be used in two-stage decision systems. We carried out the analysis with the assumption that the word and the problem have equal weight. It has been determined in the application process that even if the factors affecting the decision have different effect weights, it can be performed with GRA easily. Therefore, it will be an exciting research topic to analyze the decision-making process that has differently weighted criteria by using GRA.
The assessment of written exam questions should be based on a referenced answer key. The words used to answer the question should be used to determine word similarity in the answer key prepared for each question. Thus, the evaluation of the written exams is a multi-criteria decision process. Besides, BoW, TF, and TF-IDF methods used in contextual text mining studies can be insufficient. Therefore, this study reveals that a rating can be made based on the word similarities in the written exams. In this context, by employing two-stage GRA, we have demonstrated that Grey relational degrees obtained by word similarities can be used to determine the similarity between the exam papers and the answer key.
In our study, text data in the exam papers of 50 students were structured by text mining methods, and first-order GRA was applied to the decision matrix created by VSM. The ranking of the student exam papers was carried out by applying the second-order GRA so that this method was applied to cover all questions. The decision support system using the GRA similarity values determines the range in which the student assessment score should be. Instead of evaluating as successful or unsuccessful, the success level of a student is determined relationally based on the success level of the other students by taking advantage of the GRA. Consequently, we demonstrated that the exam papers were evaluated using grey relational degrees. Furthermore, we compared the ranking using GRA with the instructor’s ranking, and we observed that there were no significant differences between these two assessments.
Author Contributions
The authors contributed equally to this work.
Funding
This research received no external funding.
Acknowledgments
The authors are grateful to the Editor of the Journal and anonymous referees for their detailed and valuable comments.
Conflicts of Interest
The authors declare that they have no conflict of interest regarding the publication of this research article.
Appendix A
(a) The questions prepared by the instructor (our application software)

(b) The answer key of the first question

(c) Student answers for the first question

Appendix B
(a) for the first question * (* Student whose is null set were excluded from the table. S: Student, Q: Question.)
| S | Q | Words (in both Turkish and English) |
| 1 | 1 | zihin_1& (mental_1&) |
| 3 | 1 | sosyal_1& (social_1&) |
| 6 | 1 | organizma_1&döl_1&başla_1& (organism_1&seed_1&start_1&) |
| 7 | 1 | başla_1&duygu_1& (start_1&emotion_1&) |
| 10 | 1 | döl_1&başla_1&sosyal_1&yön_1& (seed_1&start_1&social_1&direction_1&) |
| 13 | 1 | organizma_1&döl_1&başla_1&beden_1&zihin_1&sosyal_1&yön_1&geçir_1&sürekli_1&düz_1&değ_1&(organism_1&seed_1&start_1&body_1&mental_1&social_1&direction_1&pass_1&continuous_1&straight_1&touch_1&) |
| 14 | 1 | organizma_1&döl_1&başla_1&beden_1&zihin_1&duygu_1&sosyal_1&yön_1&geçir_1&sürekli_1&düz_2&ilerle_1&(organism_1&seed_1&start_1&body_1&mental_1&emotion_1&social_1&direction_1&pass_1&continuous_1&straight_2&move_1&) |
| 15 | 1 | döl_1&başla_1&sürekli_1& (seed_1&start_1&continuous_1&) |
| 18 | 1 | zihin_1& (mental_1&) |
| 19 | 1 | sosyal_1&yön_2& (social_1&direction_2&) |
| 20 | 1 | beden_1& (body_1&) |
| 21 | 1 | sosyal_1& (social_1&) |
| 24 | 1 | başla_1&zihin_1&sosyal_1& (start_1&mental_1&social_1&) |
| 25 | 1 | döl_1&başla_1& (seed_1&start_1&) |
| 26 | 1 | sürekli_1&düz_1&ilerle_1& (continuous_1&straight_1&move_1&) |
| 27 | 1 | organizma_1&döl_1&başla_1&sosyal_1&yön_1&geçir_1&sürekli_1&düz_1&değ_1&(organism_1&seed_1&start_1&social_1&direction_1&pass_1&continuous_1&straight_1&touch_1& |
| 29 | 1 | geçir_1& (pass_1&) |
| 31 | 1 | organizma_1&döl_1&başla_1&zihin_1&sosyal_1&yön_1&(organism_1&seed_1&start_1&mental_1&sosyal_1&yön_1&) |
| 32 | 1 | beden_1&zihin_1&sosyal_1&yön_1&geçir_1&sürekli_1&düz_1&değ_1&(body_1&mental_1&social_1&direction_1&pass_1&continuous_1&straight_1&touch_1&) |
| 33 | 1 | döl_1&başla_1&düz_1&ilerle_1& (seed_1&start_1& straight_1&move_1&) |
| 34 | 1 | başla_1&duygu_1&sosyal_1& (start_1&emotion_1&social_1&) |
| 37 | 1 | başla_1& (start_1&) |
| 39 | 1 | başla_1& (start_1&) |
| 40 | 1 | sosyal_1&yön_1& (social_1&direction_1&) |
| 43 | 1 | sürekli_1& (continuous_1&) |
| 44 | 1 | başla_1& (start_1&) |
| 45 | 1 | sürekli_1& (continuous_1&) |
| 46 | 1 | başla_2&duygu_1&sosyal_1& (start_2&emotion_1&social_1&) |
| 47 | 1 | duygu_1&sosyal_1&yön_1& (emotion_1&social_1&direction_1&) |
| 48 | 1 | döl_1&başla_1&sürekli_1&değ_1& (seed_1&start_1&continuous_1&touch_1&) |
| 49 | 1 | sosyal_1&yön_2& (social_1& direction_2&) |
| 50 | 1 | başla_1&duygu_1&sosyal_1&yön_1& (start_1&emotion_1&social_1&direction_1&) |
(b) table (VSM for the first question)
| Words (in both Turkish and English) | ||||||||||||||
| Q | S | Organizma (organism) | Döl (seed) | Başla (start) | Beden (body) | Zihin (mental) | Duygu (emotion) | Sosyal (social) | Yön (direction) | Geçir (pass) | Sürekli (continuous) | Düz (straight) | Değ (touch) | Ilerle (move) |
| 1 | 0 * | 1 | 1 | 1 | 1 | 1 | 1 | 1 | 1 | 1 | 1 | 1 | 1 | 1 |
| 1 | 1 | 0 | 0 | 0 | 0 | 1 | 0 | 0 | 0 | 0 | 0 | 0 | 0 | 0 |
| 1 | 2 | 0 | 0 | 0 | 0 | 0 | 0 | 0 | 0 | 0 | 0 | 0 | 0 | 0 |
| 1 | 3 | 0 | 0 | 0 | 0 | 0 | 0 | 1 | 0 | 0 | 0 | 0 | 0 | 0 |
| 1 | 4 | 0 | 0 | 0 | 0 | 0 | 0 | 0 | 0 | 0 | 0 | 0 | 0 | 0 |
| 1 | 5 | 0 | 0 | 0 | 0 | 0 | 0 | 0 | 0 | 0 | 0 | 0 | 0 | 0 |
| 1 | 6 | 1 | 1 | 1 | 0 | 0 | 0 | 0 | 0 | 0 | 0 | 0 | 0 | 0 |
| 1 | 7 | 0 | 0 | 1 | 0 | 0 | 1 | 0 | 0 | 0 | 0 | 0 | 0 | 0 |
| 1 | 8 | 0 | 0 | 0 | 0 | 0 | 0 | 0 | 0 | 0 | 0 | 0 | 0 | 0 |
| 1 | 9 | 0 | 0 | 0 | 0 | 0 | 0 | 0 | 0 | 0 | 0 | 0 | 0 | 0 |
| 1 | 10 | 0 | 1 | 1 | 0 | 0 | 0 | 1 | 1 | 0 | 0 | 0 | 0 | 0 |
| 1 | 11 | 0 | 0 | 0 | 0 | 0 | 0 | 0 | 0 | 0 | 0 | 0 | 0 | 0 |
| 1 | 12 | 0 | 0 | 0 | 0 | 0 | 0 | 0 | 0 | 0 | 0 | 0 | 0 | 0 |
| 1 | 13 | 1 | 1 | 1 | 1 | 1 | 0 | 1 | 1 | 1 | 1 | 1 | 1 | 0 |
| 1 | 14 | 1 | 1 | 1 | 1 | 1 | 1 | 1 | 1 | 1 | 2 | 2 | 0 | 1 |
| 1 | 15 | 0 | 1 | 1 | 0 | 0 | 0 | 0 | 0 | 0 | 1 | 0 | 0 | 0 |
| 1 | 16 | 0 | 0 | 0 | 0 | 0 | 0 | 0 | 0 | 0 | 0 | 0 | 0 | 0 |
| 1 | 17 | 0 | 0 | 0 | 0 | 0 | 0 | 0 | 0 | 0 | 0 | 0 | 0 | 0 |
| 1 | 18 | 0 | 0 | 0 | 0 | 1 | 0 | 0 | 0 | 0 | 0 | 0 | 0 | 0 |
| 1 | 19 | 0 | 0 | 0 | 0 | 0 | 0 | 1 | 2 | 0 | 0 | 0 | 0 | 0 |
| 1 | 20 | 0 | 0 | 0 | 1 | 0 | 0 | 0 | 0 | 0 | 0 | 0 | 0 | 0 |
| 1 | 21 | 0 | 0 | 0 | 0 | 0 | 0 | 1 | 0 | 0 | 0 | 0 | 0 | 0 |
| 1 | 22 | 0 | 0 | 0 | 0 | 0 | 0 | 0 | 0 | 0 | 0 | 0 | 0 | 0 |
| 1 | 23 | 0 | 0 | 0 | 0 | 0 | 0 | 0 | 0 | 0 | 0 | 0 | 0 | 0 |
| 1 | 24 | 0 | 0 | 1 | 0 | 1 | 0 | 1 | 0 | 0 | 0 | 0 | 0 | 0 |
| 1 | 25 | 0 | 1 | 1 | 0 | 0 | 0 | 0 | 0 | 0 | 0 | 0 | 0 | 0 |
| 1 | 26 | 0 | 0 | 0 | 0 | 0 | 0 | 0 | 0 | 0 | 1 | 1 | 0 | 1 |
| 1 | 27 | 1 | 1 | 1 | 0 | 0 | 0 | 1 | 1 | 1 | 1 | 1 | 1 | 0 |
| 1 | 28 | 0 | 0 | 0 | 0 | 0 | 0 | 0 | 0 | 0 | 0 | 0 | 0 | 0 |
| 1 | 29 | 0 | 0 | 0 | 0 | 0 | 0 | 0 | 0 | 1 | 0 | 0 | 0 | 0 |
| 1 | 30 | 0 | 0 | 0 | 0 | 0 | 0 | 0 | 0 | 0 | 0 | 0 | 0 | 0 |
| 1 | 31 | 1 | 1 | 1 | 0 | 1 | 0 | 1 | 1 | 0 | 0 | 0 | 0 | 0 |
| 1 | 32 | 0 | 0 | 0 | 1 | 1 | 0 | 1 | 1 | 1 | 1 | 1 | 1 | 0 |
| 1 | 33 | 0 | 1 | 1 | 0 | 0 | 0 | 0 | 0 | 0 | 0 | 1 | 0 | 1 |
| 1 | 34 | 0 | 0 | 1 | 0 | 0 | 1 | 1 | 0 | 0 | 0 | 0 | 0 | 0 |
| 1 | 35 | 0 | 0 | 0 | 0 | 0 | 0 | 0 | 0 | 0 | 0 | 0 | 0 | 0 |
| 1 | 36 | 0 | 0 | 0 | 0 | 0 | 0 | 0 | 0 | 0 | 0 | 0 | 0 | 0 |
| 1 | 37 | 0 | 0 | 1 | 0 | 0 | 0 | 0 | 0 | 0 | 0 | 0 | 0 | 0 |
| 1 | 38 | 0 | 0 | 0 | 0 | 0 | 0 | 0 | 0 | 0 | 0 | 0 | 0 | 0 |
| 1 | 39 | 0 | 0 | 1 | 0 | 0 | 0 | 0 | 0 | 0 | 0 | 0 | 0 | 0 |
| 1 | 40 | 0 | 0 | 0 | 0 | 0 | 0 | 1 | 1 | 0 | 0 | 0 | 0 | 0 |
| 1 | 41 | 0 | 0 | 0 | 0 | 0 | 0 | 0 | 0 | 0 | 0 | 0 | 0 | 0 |
| 1 | 42 | 0 | 0 | 0 | 0 | 0 | 0 | 0 | 0 | 0 | 0 | 0 | 0 | 0 |
| 1 | 43 | 0 | 0 | 0 | 0 | 0 | 0 | 0 | 0 | 0 | 1 | 0 | 0 | 0 |
| 1 | 44 | 0 | 0 | 1 | 0 | 0 | 0 | 0 | 0 | 0 | 0 | 0 | 0 | 0 |
| 1 | 45 | 0 | 0 | 0 | 0 | 0 | 0 | 0 | 0 | 0 | 1 | 0 | 0 | 0 |
| 1 | 46 | 0 | 0 | 2 | 0 | 0 | 1 | 1 | 0 | 0 | 0 | 0 | 0 | 0 |
| 1 | 47 | 0 | 0 | 0 | 0 | 0 | 1 | 1 | 1 | 0 | 0 | 0 | 0 | 0 |
| 1 | 48 | 0 | 1 | 1 | 0 | 0 | 0 | 0 | 0 | 0 | 1 | 0 | 1 | 0 |
| 1 | 49 | 0 | 0 | 0 | 0 | 0 | 0 | 1 | 2 | 0 | 0 | 0 | 0 | 0 |
| 1 | 50 | 0 | 0 | 1 | 0 | 0 | 1 | 1 | 1 | 0 | 0 | 0 | 0 | 0 |
Appendix C
(a) First order GRA decision matrix (first question 5 students)
| Question | Student | Words | ||||||||||||
| 1 | Answer Key | 1 | 1 | 1 | 1 | 1 | 1 | 1 | 1 | 1 | 1 | 1 | 1 | 1 |
| 1 | Reference | 1 | 1 | 2 | 1 | 1 | 1 | 1 | 2 | 1 | 2 | 2 | 1 | 1 |
| 1 | 1 | 0 | 0 | 0 | 0 | 1 | 0 | 0 | 0 | 0 | 0 | 0 | 0 | 0 |
| 1 | 2 | 0 | 0 | 0 | 0 | 0 | 0 | 0 | 0 | 0 | 0 | 0 | 0 | 0 |
| 1 | 3 | 0 | 0 | 0 | 0 | 0 | 0 | 1 | 0 | 0 | 0 | 0 | 0 | 0 |
| 1 | 4 | 0 | 0 | 0 | 0 | 0 | 0 | 0 | 0 | 0 | 0 | 0 | 0 | 0 |
| 1 | 5 | 0 | 0 | 0 | 0 | 0 | 0 | 0 | 0 | 0 | 0 | 0 | 0 | 0 |
(b) First order GRA normalization matrix (first question 5 students)
| Question | Student | Words | ||||||||||||
| 1 | Reference | 1 | 1 | 1 | 1 | 1 | 1 | 1 | 1 | 1 | 1 | 1 | 1 | 1 |
| 1 | 1 | 0 | 0 | 1 | 0 | 1 | 0 | 0 | 1 | 0 | 1 | 1 | 0 | 0 |
| 1 | 2 | 0 | 0 | 1 | 0 | 0 | 0 | 0 | 1 | 0 | 1 | 1 | 0 | 0 |
| 1 | 3 | 0 | 0 | 1 | 0 | 0 | 0 | 1 | 1 | 0 | 1 | 1 | 0 | 0 |
| 1 | 4 | 0 | 0 | 1 | 0 | 0 | 0 | 0 | 1 | 0 | 1 | 1 | 0 | 0 |
| 1 | 5 | 0 | 0 | 1 | 0 | 0 | 0 | 0 | 1 | 0 | 1 | 1 | 0 | 0 |
(c) First order GRA absolute differences (first question 5 students)
| Question | Student | Words | ||||||||||||
| 1 | Reference | 0 | 0 | 0 | 0 | 0 | 0 | 0 | 0 | 0 | 0 | 0 | 0 | 0 |
| 1 | 1 | 0 | 0 | 1 | 0 | 1 | 0 | 0 | 1 | 0 | 1 | 1 | 0 | 0 |
| 1 | 2 | 0 | 0 | 1 | 0 | 0 | 0 | 0 | 1 | 0 | 1 | 1 | 0 | 0 |
| 1 | 3 | 0 | 0 | 1 | 0 | 0 | 0 | 1 | 1 | 0 | 1 | 1 | 0 | 0 |
| 1 | 4 | 0 | 0 | 1 | 0 | 0 | 0 | 0 | 1 | 0 | 1 | 1 | 0 | 0 |
| 1 | 5 | 0 | 0 | 1 | 0 | 0 | 0 | 0 | 1 | 0 | 1 | 1 | 0 | 0 |
(d) First order GRA coefficients
| Question | Student | Words | ||||||||||||
| 1 | Reference | 0 | 0 | 0 | 0 | 0 | 0 | 0 | 0 | 0 | 0 | 0 | 0 | 0 |
| 1 | 1 | 1 | 1 | 0.333 | 1 | 0.333 | 1 | 1 | 0.333 | 1 | 0.333 | 0.333 | 1 | 1 |
| 1 | 2 | 1 | 1 | 0.333 | 1 | 1 | 1 | 1 | 0.333 | 1 | 0.333 | 0.333 | 1 | 1 |
| 1 | 3 | 1 | 1 | 0.333 | 1 | 1 | 1 | 0.333 | 0.333 | 1 | 0.333 | 0.333 | 1 | 1 |
| 1 | 4 | 1 | 1 | 0.333 | 1 | 1 | 1 | 1 | 0.333 | 1 | 0.333 | 0.333 | 1 | 1 |
| 1 | 5 | 1 | 1 | 0.333 | 1 | 1 | 1 | 1 | 0.333 | 1 | 0.333 | 0.333 | 1 | 1 |
Appendix D
(a) Second order GRA coefficients and degrees (S: Student, Q: Question.)
| S | Q-1 | Q-2 | Q-3 | Q-4 | Q-5 | Degrees |
| 1 | 0.4117 | 0.4189 | 0.5241 | 0.3874 | 0.3422 | 0.4169 |
| 2 | 0.3684 | 0.6305 | 0.4517 | 0.367 | 0.3859 | 0.4407 |
| 3 | 0.4117 | 0.4406 | 0.5863 | 0.4118 | 0.3692 | 0.4439 |
| 4 | 0.3684 | 0.6072 | 0.3692 | 0.4367 | 0.3913 | 0.4346 |
| 5 | 0.3684 | 1 | 0.4236 | 0.4011 | 0.3523 | 0.5091 |
| 6 | 0.4117 | 0.4006 | 0.4745 | 0.3697 | 0.3778 | 0.4069 |
| 7 | 0.3684 | 0.4521 | 0.5029 | 0.3741 | 0.4045 | 0.4204 |
| 8 | 0.3684 | 0.709 | 0.4264 | 0.4037 | 0.3822 | 0.4579 |
| 9 | 0.3684 | 0.4106 | 0.6004 | 0.3964 | 0.377 | 0.4306 |
| 10 | 0.3684 | 0.7275 | 1 | 0.3923 | 0.4133 | 0.5803 |
| 11 | 0.3684 | 0.4362 | 0.4236 | 0.3695 | 0.4592 | 0.4114 |
| 12 | 0.3684 | 0.4545 | 0.6159 | 0.3846 | 0.3488 | 0.4344 |
| 13 | 0.5385 | 0.6535 | 0.3446 | 0.4022 | 0.48 | 0.4838 |
| 14 | 1 | 0.621 | 0.5699 | 1 | 1 | 0.8382 |
| 15 | 0.3333 | 0.7404 | 0.3486 | 0.3864 | 0.3913 | 0.44 |
| 16 | 0.3684 | 0.4757 | 0.6159 | 0.3641 | 0.4059 | 0.446 |
| 17 | 0.3684 | 0.4812 | 0.5029 | 0.3991 | 0.3536 | 0.421 |
| 18 | 0.4117 | 0.5224 | 0.5132 | 0.3854 | 0.3488 | 0.4363 |
| 19 | 0.4117 | 0.5224 | 0.5221 | 0.42 | 0.3505 | 0.4453 |
| 20 | 0.4117 | 0.3812 | 0.4402 | 0.3966 | 0.3818 | 0.4023 |
| 21 | 0.4117 | 0.4524 | 0.4008 | 0.4123 | 0.3333 | 0.4021 |
| 22 | 0.3684 | 0.4295 | 0.4668 | 0.3623 | 0.3711 | 0.3996 |
| 23 | 0.3684 | 0.4247 | 0.4891 | 0.3978 | 0.381 | 0.4122 |
| 24 | 0.4117 | 0.4298 | 0.4531 | 0.4123 | 0.379 | 0.4172 |
| 25 | 0.3684 | 0.6078 | 0.4813 | 0.443 | 0.4433 | 0.4688 |
| 26 | 0.3333 | 0.5224 | 0.3535 | 0.4123 | 0.3987 | 0.404 |
| 27 | 0.4117 | 0.7312 | 0.3333 | 0.4393 | 0.3523 | 0.4536 |
| 28 | 0.3684 | 0.3812 | 0.3566 | 0.3741 | 0.3863 | 0.3733 |
| 29 | 0.4117 | 0.5949 | 0.4252 | 0.4084 | 0.4045 | 0.4489 |
| 30 | 0.3684 | 0.4423 | 0.5627 | 0.4123 | 0.379 | 0.4329 |
| 31 | 0.4666 | 0.3954 | 0.3867 | 0.3333 | 0.4374 | 0.4039 |
| 32 | 0.4666 | 0.3826 | 0.3513 | 0.4051 | 0.3673 | 0.3946 |
| 33 | 0.3684 | 0.616 | 0.6004 | 0.3944 | 0.3913 | 0.4741 |
| 34 | 0.4117 | 0.6444 | 0.4531 | 0.3856 | 0.4348 | 0.4659 |
| 35 | 0.3684 | 0.4278 | 0.5728 | 0.3792 | 0.5389 | 0.4574 |
| 36 | 0.3684 | 0.4329 | 0.3805 | 0.3968 | 0.3913 | 0.394 |
| 37 | 0.3333 | 0.4683 | 0.5404 | 0.3964 | 0.3913 | 0.4259 |
| 38 | 0.3684 | 0.616 | 0.3627 | 0.3921 | 0.3913 | 0.4261 |
| 39 | 0.3333 | 0.5224 | 0.5358 | 0.4492 | 0.4068 | 0.4495 |
| 40 | 0.3684 | 0.4112 | 0.6159 | 0.4123 | 0.3913 | 0.4398 |
| 41 | 0.3684 | 0.6305 | 0.5378 | 0.4196 | 0.3818 | 0.4676 |
| 42 | 0.3684 | 0.4647 | 0.4319 | 0.4239 | 0.3913 | 0.416 |
| 43 | 0.3333 | 0.4647 | 0.4382 | 0.4227 | 0.3913 | 0.41 |
| 44 | 0.3333 | 0.4647 | 0.4833 | 0.3731 | 0.3913 | 0.4091 |
| 45 | 0.3333 | 0.4861 | 0.3928 | 0.4123 | 0.422 | 0.4093 |
| 46 | 0.4666 | 0.3974 | 0.4929 | 0.4013 | 0.3913 | 0.4299 |
| 47 | 0.4117 | 0.5291 | 0.5241 | 0.4123 | 0.355 | 0.4464 |
| 48 | 0.3684 | 0.549 | 0.4467 | 0.4123 | 0.4245 | 0.4402 |
| 49 | 0.4117 | 0.3812 | 0.3952 | 0.4256 | 0.3987 | 0.4025 |
| 50 | 0.3684 | 0.3333 | 0.4097 | 0.4013 | 0.3913 | 0.3808 |
(b) Comparison table of evaluator scores and GRA results (S: Student, Q: Question.)
| Evaluator Scores | GRA Results | |||||||||
| S | Q-1 | Q-2 | Q-3 | Q-4 | Q-5 | Total | Rank | Degrees | Rank | Suggestion |
| 1 | 5 | 8 | 5 | 0 | 2 | 20 | 33 | 0.4169 | 33 | do not change |
| 2 | 0 | 10 | 10 | 15 | 0 | 35 | 25 | 0.4407 | 18 | increase the score |
| 3 | 15 | 12 | 10 | 0 | 0 | 37 | 24 | 0.4439 | 17 | increase the score |
| 4 | 5 | 0 | 15 | 15 | 0 | 35 | 26 | 0.4346 | 23 | increase the score |
| 5 | 0 | 20 | 12 | 13 | 20 | 65 | 8 | 0.5091 | 3 | increase the score |
| 6 | 10 | 8 | 10 | 15 | 10 | 53 | 13 | 0.4069 | 40 | decrease the score |
| 7 | 15 | 15 | 20 | 15 | 2 | 67 | 7 | 0.4204 | 31 | decrease the score |
| 8 | 0 | 0 | 10 | 15 | 10 | 35 | 27 | 0.4579 | 9 | increase the score |
| 9 | 10 | 20 | 0 | 0 | 2 | 32 | 29 | 0.4306 | 26 | increase the score |
| 10 | 20 | 20 | 20 | 20 | 20 | 100 | 1 | 0.5803 | 2 | decrease the score |
| 11 | 0 | 15 | 20 | 15 | 20 | 70 | 6 | 0.4114 | 36 | decrease the score |
| 12 | 0 | 15 | 0 | 10 | 15 | 50 | 14 | 0.4344 | 24 | decrease the score |
| 13 | 15 | 20 | 20 | 15 | 15 | 85 | 3 | 0.4838 | 4 | decrease the score |
| 14 | 20 | 20 | 12 | 15 | 20 | 87 | 2 | 0.8382 | 1 | increase the score |
| 15 | 10 | 10 | 5 | 5 | 10 | 40 | 16 | 0.44 | 20 | decrease the score |
| 16 | 0 | 15 | 20 | 0 | 5 | 40 | 17 | 0.446 | 15 | increase the score |
| 17 | 0 | 5 | 0 | 0 | 0 | 5 | 48 | 0.421 | 30 | increase the score |
| 18 | 0 | 0 | 5 | 15 | 5 | 25 | 32 | 0.4363 | 22 | increase the score |
| 19 | 10 | 0 | 0 | 0 | 0 | 10 | 45 | 0.4453 | 16 | increase the score |
| 20 | 5 | 8 | 0 | 5 | 0 | 18 | 37 | 0.4023 | 44 | decrease the score |
| 21 | 15 | 2 | 20 | 0 | 2 | 39 | 21 | 0.4021 | 45 | decrease the score |
| 22 | 0 | 15 | 5 | 10 | 10 | 40 | 18 | 0.3996 | 46 | decrease the score |
| 23 | 0 | 8 | 0 | 0 | 0 | 8 | 46 | 0.4122 | 35 | increase the score |
| 24 | 0 | 8 | 5 | 0 | 0 | 13 | 42 | 0.4172 | 32 | increase the score |
| 25 | 10 | 10 | 15 | 15 | 15 | 65 | 9 | 0.4688 | 6 | increase the score |
| 26 | 10 | 0 | 10 | 0 | 10 | 30 | 31 | 0.404 | 41 | decrease the score |
| 27 | 20 | 20 | 20 | 15 | 10 | 85 | 4 | 0.4536 | 11 | decrease the score |
| 28 | 10 | 8 | 5 | 10 | 0 | 33 | 28 | 0.3733 | 50 | decrease the score |
| 29 | 0 | 18 | 0 | 8 | 5 | 31 | 30 | 0.4489 | 13 | increase the score |
| 30 | 0 | 10 | 10 | 0 | 0 | 20 | 34 | 0.4329 | 25 | increase the score |
| 31 | 18 | 10 | 20 | 20 | 15 | 83 | 5 | 0.4039 | 42 | decrease the score |
| 32 | 18 | 15 | 10 | 5 | 2 | 50 | 15 | 0.3946 | 47 | decrease the score |
| 33 | 10 | 15 | 10 | 20 | 0 | 55 | 11 | 0.4741 | 5 | increase the score |
| 34 | 10 | 4 | 10 | 20 | 10 | 54 | 12 | 0.4659 | 8 | increase the score |
| 35 | 10 | 0 | 0 | 10 | 10 | 40 | 19 | 0.4574 | 10 | increase the score |
| 36 | 0 | 5 | 10 | 0 | 0 | 15 | 40 | 0.394 | 48 | decrease the score |
| 37 | 10 | 2 | 0 | 0 | 0 | 12 | 43 | 0.4259 | 29 | increase the score |
| 38 | 0 | 18 | 0 | 0 | 0 | 18 | 38 | 0.4261 | 28 | increase the score |
| 39 | 0 | 0 | 10 | 5 | 5 | 20 | 35 | 0.4495 | 12 | increase the score |
| 40 | 0 | 5 | 0 | 0 | 0 | 5 | 49 | 0.4398 | 21 | increase the score |
| 41 | 0 | 12 | 0 | 0 | 0 | 12 | 44 | 0.4676 | 7 | increase the score |
| 42 | 0 | 6 | 0 | 0 | 0 | 6 | 47 | 0.416 | 34 | increase the score |
| 43 | 0 | 6 | 14 | 0 | 0 | 20 | 36 | 0.41 | 37 | decrease the score |
| 44 | 0 | 5 | 0 | 0 | 0 | 5 | 50 | 0.4091 | 39 | increase the score |
| 45 | 0 | 10 | 20 | 0 | 10 | 40 | 20 | 0.4093 | 38 | decrease the score |
| 46 | 10 | 18 | 5 | 5 | 0 | 38 | 22 | 0.4299 | 27 | decrease the score |
| 47 | 0 | 8 | 5 | 0 | 2 | 15 | 41 | 0.4464 | 14 | increase the score |
| 48 | 20 | 15 | 15 | 0 | 10 | 60 | 10 | 0.4402 | 19 | decrease the score |
| 49 | 0 | 8 | 10 | 0 | 0 | 18 | 39 | 0.4025 | 43 | decrease the score |
| 50 | 10 | 8 | 15 | 5 | 0 | 38 | 23 | 0.3808 | 49 | decrease the score |
References
- Turgut, M.F.; Baykul, Y. Eğitimde Ölçme ve Değerlendirme; Pegem Akademi: Ankara, Turkey, 2012. [Google Scholar]
- Dikli, S. Assessment at a distance: Traditional vs. alternative assessments. Turk. Online J. Educ. Technol. 2003, 2, 13–19. [Google Scholar]
- Yılmaz, A. Ölçme ve Değerlendirme; Pegem Akademi: Ankara, Turkey, 2009. [Google Scholar]
- Miller, M.D.; Linn, R.L.; Gronlund, N.E. Measurement and Assessment in Teaching; Pearson: Boston, MA, USA, 2013. [Google Scholar]
- Fraenkel, J.R.; Wallen, N.E. How to Design and Evaluate Research in Education; McGraw-Hill: New York, NY, USA, 2005. [Google Scholar]
- Kurgan, L.A.; Musilek, P. A survey of knowledge discovery and data mining process models. Knowl. Eng. Rev. 2006, 21, 1–24. [Google Scholar] [CrossRef]
- Kahraman, C.; Onar, S.C. Intelligent Techniques in Engineering Management, Theory and Applications; Springer: Cham, Switzerland, 2015. [Google Scholar]
- Nenonen, N. Analysing factors related to slipping, stumbling, and falling accidents at work: Application of data mining methods to Finnish occupational accidents and diseases statistics database. Appl. Ergon. 2013, 44, 215–224. [Google Scholar] [CrossRef] [PubMed]
- Gurbuz, F.; Ozbakir, L.; Yapici, H. Classification rule discovery for the aviation incidents resulted in fatality. Knowl. Based Syst. 2009, 22, 622–632. [Google Scholar] [CrossRef]
- Yuksel, M.E. Agent-based evacuation modeling with multiple exits using NeuroEvolution of Augmenting Topologies. Adv. Eng. Inform. 2018, 35, 30–55. [Google Scholar] [CrossRef]
- Ji, H.; Park, K.; Jo, J.; Lim, H. Mining students activities from a computer supported collaborative learning system based on peer to peer network. Peer Peer Netw. Appl. 2016, 9, 465–476. [Google Scholar] [CrossRef]
- Sailesh, S.B.; Lu, K.J.; Aali, M.A. Profiling Students on Their Course-Taking Patterns in Higher Educational Institutions (HEIs). In Proceedings of the International Conference on Information Science, Kochi, India, 12–13 August 2016. [Google Scholar]
- Scheuer, O.; McLaren, B.M. Educational Data Mining, In the Encyclopedia of the Sciences of Learning; Springer: Boston, MC, USA, 2011. [Google Scholar]
- Tsai, C.Y.; Tsai, M.H. A Dynamic Web Service Based Data Mining Process System. In Proceedings of the 5th International Conference on Computer and Information Technology, Shanghai, China, 21–23 September 2005. [Google Scholar]
- Rygielski, C.; Wang, J.C.; Yen, D.C. Data mining techniques for customer relationship management. Technol. Soc. 2002, 24, 483–502. [Google Scholar] [CrossRef]
- Ramakrishnan, R.; Gehrke, J. Database Management Systems; McGraw-Hill Education: New York, NY, USA, 2003. [Google Scholar]
- Dunham, M.H. Data Mining: Introductory and Advanced Topics; Prentice-Hall: New Jersey River, NJ, USA, 2003. [Google Scholar]
- Harish, B.S.; Guru, D.S.; Manjunath, S. Representation and classification of text documents: A brief review. Int. J. Comput. Appl. Spec. Issue Recent Trends Image Process. Pattern Recognit. 2010, 2, 110–119. [Google Scholar]
- Allahyari, M.; Pouriyeh, S.; Assefi, M.; Safaei, S.; Trippe, E.D.; Gutierrez, J.B.; Kochut, K. A brief survey of text mining: Classification, clustering and extraction techniques. arXiv 2017, arXiv:1707.02919. [Google Scholar]
- Pan, W.; Zhong, E.; Yang, Q. Transfer learning for text mining. In Mining Text Data; Aggarwal, C., Zhai, C., Eds.; Springer: Boston, MA, USA, 2012; pp. 223–257. [Google Scholar]
- Korde, V.; Mahender, C.N. Text classification and classifiers: A survey. Int. J. Artif. Intell. Appl. 2012, 3, 85–99. [Google Scholar]
- Xia, T.; Chai, Y. An improvement to TF-IDF: Term distribution based term weight algorithm. J. Softw. 2011, 6, 413–420. [Google Scholar] [CrossRef]
- Tasci, S.; Gungor, T. Comparison of text feature selection policies and using an adaptive framework. Expert Syst. Appl. 2013, 40, 4871–4886. [Google Scholar] [CrossRef]
- Chen, K.; Zhang, Z.; Long, J.; Zhang, H. Turning from TF-IDF to TF-IGM for term weighting in text classification. Expert Syst. Appl. 2016, 66, 245–260. [Google Scholar] [CrossRef]
- Cakan, M. Eğitimde Ölçme ve Değerlendirme; Pegem Akademi: Ankara, Turkey, 2008. [Google Scholar]
- Atilgan, H.; Kan, A.; Dogan, N. Eğitimde Ölçme ve Değerlendirme; Ani Yayincilik: Ankara, Turkey, 2009. [Google Scholar]
- Stiggins, R. Assessment Manifesto: A Call for the Development of Balanced Assessment Systems; ETS Assessment Training Institute: Portland, OR, USA, 2008. [Google Scholar]
- Gecit, Y. Eğitimde Ölçme ve Değerlendirme; Nobel Yayincilik: Ankara, Turkey, 2012. [Google Scholar]
- Tekindal, S. Okullarda Ölçme ve Değerlendirme Yöntemleri; Nobel Yayincilik: Ankara, Turkey, 2014. [Google Scholar]
- Ozcelik, D.A. Okullarda Ölçme ve Değerlendirme Öğretmen El Kitabı; Pegem Akademi: Ankara, Turkey, 2010. [Google Scholar]
- Han, J.; Kamber, M.; Pei, J. Data Mining Concepts and Techniques; Morgan Kaufmann: Waltham, MC, USA, 2012. [Google Scholar]
- Witten, I.H.; Frank, E.; Hall, M.A.; Pal, C.J. Data Mining: Practical Machine Learning Tools and Techniques; Morgan Kaufmann: Waltham, MC, USA, 2017. [Google Scholar]
- Ozkan, Y. Veri Madenciliği Yöntemleri; Papatya Bilim: Istanbul, Turkey, 2016. [Google Scholar]
- Zheng, Y. Trajectory data mining: An overview. ACM Trans. Intell. Syst. Technol. 2015, 6, 29. [Google Scholar] [CrossRef]
- Berry, M.W. Survey of Text Mining: Clustering, Classification, and Retrieval; Springer: New York, NY, USA, 2004. [Google Scholar]
- Hebrail, G.; Marsais, J. Experiments of textual data analysis at Electricite de France. In New Approaches in Classification and Data Analysis. Studies in Classification, Data Analysis, and Knowledge Organization; Diday, E., Lechevallier, Y., Schader, M., Bertrand, P., Burtschy, B., Eds.; Springer: Heidelberg, Germany, 1994; pp. 569–576. [Google Scholar]
- Feldman, R.; Dagan, I. Knowledge Discovery in Textual Databases. In Proceedings of the First International Conference on Knowledge Discovery and Data Mining, Montreal, QC, Canada, 20–21 August 1995. [Google Scholar]
- Weiss, S.M.; Indurkhya, N.; Zhang, T. Fundamentals of Predictive Text Mining; Springer: London, UK, 2015. [Google Scholar]
- Beliga, S.; Mestrovic, A.; Ipsic, M.S. An overview of graph based keyword extraction methods and approaches. J. Inf. Organ. Sci. 2015, 39, 1–20. [Google Scholar]
- Zhang, W.; Yoshida, T.; Tang, X. Text classification based on multi-word with support vector machine. Knowl. Based Syst. 2008, 21, 879–886. [Google Scholar] [CrossRef]
- Ravi, K.; Ravi, R. A survey on opinion mining and sentiment analysis: Tasks, approaches and applications. Knowl. Based Syst. 2015, 89, 14–46. [Google Scholar] [CrossRef]
- Montoyo, A.; Barco, P.M.; Balahur, A. Subjectivity and sentiment analysis: An overview of the current state of the area and envisaged developments. Decis. Support Syst. 2012, 53, 675–679. [Google Scholar] [CrossRef]
- Aggarwal, C.C.; Zhai, C.X. Mining Test Data; Springer: New York, NY, USA, 2012. [Google Scholar]
- Romero, C.; Ventura, S.; Pechenizkiy, M.; Baker, R.S. Handbook of Educational Data Mining; CRC Press, Taylor & Francis Group: Boca Raton, FL, USA, 2010. [Google Scholar]
- Baker, R.S. Educational data mining: An advance for intelligent systems in education. IEEE Intell. Syst. 2014, 29, 78–82. [Google Scholar] [CrossRef]
- Liu, S.; Lin, Y. Grey Information Theory and Practical Applications; Springer: New York, NY, USA, 2006. [Google Scholar]
- Deng, J.L. Control problems of grey systems. Syst. Control Lett. 1982, 1, 288–294. [Google Scholar]
- Liu, S.; Forrest, J.; Yang, Y. A brief introduction to grey systems theory. Grey Syst. Theory Appl. 2012, 2, 89–104. [Google Scholar] [CrossRef]
- Yildirim, B.F. Gri ilişkisel analiz. In Çok Kriterli Karar Verme Yöntemleri; Yildirim, B.F., Onder, E., Eds.; Dora Yayincilik: Bursa, Turkey, 2015; pp. 229–236. [Google Scholar]
- Fidan, H. Association rules-based grey relational approach for e-commerce recommender system. In Machine Learning Techniques for Improved Business Analytics; Kumar, G.D., Ed.; IGI Global: Hershey, PA, USA, 2019; pp. 64–93. [Google Scholar]
- Fidan, H. Grey relational classification of consumers’ textual evaluations in e-commerce. J. Theor. Appl. Electron. Commer. Res. 2020, 15, 48–65. [Google Scholar] [CrossRef]
- Fidan, H. Grey relational clustering analysis of e-commerce customers loyalty. Online Acad. J. Inf. Technol. 2018, 9, 163–182. [Google Scholar]
- Ertugrul, I.; Oztas, T.; Ozcil, A.; Oztas, G.Z. Grey relational analysis approach in academic performance comparison of university: A case study of Turkish universities. Eur. Sci. J. 2016, 128–139. [Google Scholar]
- Tsai, C.H.; Chang, C.L.; Chen, L. Applying grey relational analysis to the vendor evaluation model. Int. J. Comput. Internet Manag. 2003, 11, 45–53. [Google Scholar]
- Turney, P.D.; Pantel, P. From frequency to meaning: Vector space models of semantics. J. Artif. Intell. Res. 2010, 37, 141–188. [Google Scholar] [CrossRef]
- Ropero, J.; Gomez, A.; Carrasco, A.; Leon, C.; Luque, J. Term weighting for information retrieval using fuzzy logic. In Fuzzy Logic-Algorithms, Techniques and Implementations; Elmer, P.D., Ed.; Intech: London, UK, 2012; pp. 173–192. [Google Scholar]
Figure 1.
Text mining process.

Figure 2.
System model. GRA, Grey Relational Analysis; BoW, Bag of Words; VSM, Vector Space Model.

Figure 3.
Database tables.

Figure 4.
BoW1 and BoW2 for first question first student.

Figure 5.
Two-stage decision-making process.


Table 1.
The advantages and disadvantages of oral exams.
| Advantages | Disadvantages |
|---|---|
|
|
Table 2.
The advantages and disadvantages of multiple-choice exams.
| Advantages | Disadvantages |
|---|---|
|
|
Table 3.
The advantages and disadvantages of written exams.
| Advantages | Disadvantages |
|---|---|
|
|
Table 4.
VSM table for the first question.
| Question | Student | Words (in Both Turkish and English) | |||
|---|---|---|---|---|---|
| Zihin (Mental) | Sosyal (Social) | Duygu (Emotion) | |||
| Answer key | 1 | 0 | 1 | 1 | 1 |
| 1 | 1 | 1 | 0 | 0 | |
| 1 | 2 | 0 | 0 | 0 | |
| 1 | 3 | 0 | 1 | 0 | |
| 1 | 4 | 0 | 0 | 0 | |
| 1 | 5 | 0 | 0 | 0 | |
Table 5.
First order GRA degrees for the five students.
| Student | Question-1 | Question-2 | Question-3 | Question-4 | Question-5 |
|---|---|---|---|---|---|
| 1 | 0.7436 | 0.8921 | 0.7357 | 0.8317 | 0.9022 |
| 2 | 0.7949 | 0.789 | 0.7532 | 0.8423 | 0.8903 |
| 3 | 0.7436 | 0.8769 | 0.7241 | 0.8204 | 0.8945 |
| 4 | 0.7949 | 0.7968 | 0.7815 | 0.8102 | 0.889 |
| 5 | 0.7949 | 0.7136 | 0.7616 | 0.8252 | 0.8992 |
Table 6.
Second order GRA degrees for the five students.
| Student | Question-1 | Question-2 | Question-3 | Question-4 | Question-5 | Degrees |
|---|---|---|---|---|---|---|
| 1 | 0.4117 | 0.4189 | 0.5241 | 0.3874 | 0.3422 | 0.4169 |
| 2 | 0.3684 | 0.6305 | 0.4517 | 0.367 | 0.3859 | 0.4407 |
| 3 | 0.4117 | 0.4406 | 0.5863 | 0.4118 | 0.3692 | 0.4439 |
| 4 | 0.3684 | 0.6072 | 0.3692 | 0.4367 | 0.3913 | 0.4346 |
| 5 | 0.3684 | 1 | 0.4236 | 0.4011 | 0.3523 | 0.5091 |
Table 7.
Comparison of evaluator scores and GRA degrees for the five students.
| Evaluator Scores | Analysis Results | ||||||
|---|---|---|---|---|---|---|---|
| Student | Question-1 | Question-2 | Question-3 | Question-4 | Question-5 | Total | GRA Degrees |
| 1 | 5 | 8 | 5 | 0 | 2 | 20 | 0.4169 |
| 2 | 0 | 10 | 10 | 15 | 0 | 35 | 0.4407 |
| 3 | 15 | 12 | 10 | 0 | 0 | 37 | 0.4439 |
| 4 | 5 | 0 | 15 | 15 | 0 | 35 | 0.4346 |
| 5 | 0 | 20 | 12 | 13 | 20 | 65 | 0.5091 |
© 2019 by the authors. Licensee MDPI, Basel, Switzerland. This article is an open access article distributed under the terms and conditions of the Creative Commons Attribution (CC BY) license (http://creativecommons.org/licenses/by/4.0/).
Share and Cite
MDPI and ACS Style
Yuksel, M.E.; Fidan, H. A Decision Support System Using Text Mining Based Grey Relational Method for the Evaluation of Written Exams. Symmetry 2019, 11, 1426. https://0-doi-org.brum.beds.ac.uk/10.3390/sym11111426
AMA Style
Yuksel ME, Fidan H. A Decision Support System Using Text Mining Based Grey Relational Method for the Evaluation of Written Exams. Symmetry. 2019; 11(11):1426. https://0-doi-org.brum.beds.ac.uk/10.3390/sym11111426
Chicago/Turabian StyleYuksel, Mehmet Erkan, and Huseyin Fidan. 2019. "A Decision Support System Using Text Mining Based Grey Relational Method for the Evaluation of Written Exams" Symmetry 11, no. 11: 1426. https://0-doi-org.brum.beds.ac.uk/10.3390/sym11111426
Note that from the first issue of 2016, this journal uses article numbers instead of page numbers. See further details here.