1. Introduction
Urban population is steadily growing worldwide, while the number of inhabitants in Eastern European countries is decreasing and reallocation between different cities is taking place [
1]. In Eastern European countries, due to decline in local production emigration occurs, population decreases, and separate villages disappear in some parts of the territory of the country. Meanwhile, bigger cities are forced to expand their administrative boundaries, thus seeking to manage the unrestrained urban development along the horizontal axis, which has become the largest urban threat of the 21st century. The problem originates from accelerating construction in the suburban area, because a large part of the urban population prefers this location as a place of residence. As a result, the density of urban population decreases, the compactness of cities is diminished, the infrastructure of transport becomes more and more expensive, cars start playing the predominant role, inner urban development is paid less attention, and outer urban development is stimulated.
To avoid the above-mentioned consequences and to find a possibility of balancing (symmetry) needs and their satisfaction, the promotion of inner urban development is necessary, and therefore, the analysis and identification of development trends characteristics of urban areas and based on historical urban plans, maps, general planning, and the main factors that can be considered as the most important expected areas of inner urban development seem to be very important issues. Thus, three Lithuanian different size territories were selected as a research object: Kaunas city, with a population of approximately 300,000 people, Taurage town, with a population of around 20,000 people, and Silale town, with a population of approximately 5000 people.
The main objective of the article is to analyse the variations in three different sized urban territories to define trends in urban development and to identify the main criteria when considering which are the most important areas of inner urban development can be predefined. Thus, an overview of urban growth evolution has been presented. The comparative analysis of the studied urban areas and changes in the population has been carried out. The criteria and groups of criteria having an effect on urban development have been determined. Upon considering the major criteria in inner urban development and applying the expert evaluation method in assessing the significance of multiple criteria, the weights of the criteria have been calculated. Following the identification of the most relevant criteria, recommendations that allow for assessing the possibilities of the growing intensity of urban development have been provided. Additionally, the recommendations allow for weighing the long-term objective of inner urban development, thus increasing the development density up to 100%.
2. Overview of Guidelines and Models for Urban Development
Across Europe, there is a complex mosaic of urban population development [
2]. For instance, a decline in the size of urban population and an increase in rural population across Europe have been observed. Central and East Europe are not an exception [
3,
4,
5]. The ongoing migration of inhabitants to peripheral zones have driven such variations, and therefore suburban areas have grown, their activity has become integrated with the city, and rural areas have been afforded the opportunity to be connected with cities. The development of the urbanized environment and intensive construction processes include former agricultural areas that are located near the city. Good infrastructure, a well-developed transportation system, and lower land prices are important factors having an effect on the rapid spatial distribution of suburbs [
6]. An increasing number of construction sites in suburban areas indicate the accelerated growth of low-rise residential buildings in natural, rural, and suburban landscapes, which results in forming the groups of new buildings, frequently urban brownfields, and landfill sites of construction waste [
7].
Geoffrey K. F. Tso and Jin Li [
8] make a remark that balanced national or regional development has recently gained more and more attention, and a number of countries or regions have implemented strategies to safeguard the sustainable environment. It is assumed that balanced development covers three important areas: finance (economic), social responsibility (social), and ecology (ecologic). These areas are interrelated and affect each other.
Tom Kauko [
9] states that sustainable cities exist much longer than discourse on sustainability.
Researchers from the University of Granada [
10] assessed sustainable urban planning analysis, thus mainly focusing on urban transport, an increase in energy consumption, green area planning, and waste management planning. The carried out research showed that decision-making institutions, consumers, and residents affected sustainable urban development. According to the scientists from Technical University of Madrid, urban development is indicated by large-scale renovation work [
11].
Decision-makers in a field of urban and regional planning in Germany faced new challenges in terms of sustainability, with an emphasis to climate change [
12]. High rates of urban sprawl need to be reduced by increased inner-urban development and contribute to the reduction of greenhouse gas emissions at the same time. Hoymann and Goetzke [
12] state that strengthening the inner-urban development is particularly effective in terms of reducing built-up and transport area development, which matches the sustainability objective of the German Federal Government for the year 2020.
Plans from private investors often need to be redirected to meet the objectives and constraints of Governmental as well as Municipal authorities, which should also look after the overall sustainability of inner urban development and environmental sustainability above all [
13]. According to Gussoni et al. [
13], the delayed involvement of a competent department can negatively affect the overall planning procedure and can lead to unsatisfactory outcomes: either the project by the private investors fail or the investor’s plans are realized, regardless of “urban sustainability”, hampering the development of the whole surrounding area.
Other researchers in articles [
14,
15,
16] unanimously point out that the current worldwide predominating type of urban development is called urban development, which is accepted as the gradual transformation of the rural environment into the urbanized one, where the outer development of the city and its suburbs absorbs more and more rural and natural areas on the outskirts. Most often, such urban development is described as partly spontaneous, dispersed, of low intensity, and creating the chaotic and fragmented suburbanized landscape. The problems of planning at a higher level, for example, lack of the systemic approach to planning an urban structure at the regional level, and can be highlighted as the main reason for these processes.
The rapid process of urbanization has a negative impact on cities due to the uncontrolled urban expansion. Thus, to successfully manage the problem, urban growth boundaries that are given different names are used. Since the beginning of the 20th century, setting urban boundaries has been used as a tool for urban planning in a number of countries across the world [
17]. Urban growth boundaries, or ‘green bands’, have been accepted as an urban development method that regulates urban growth by defining the area. In the 1950s [
18] and 1960s, most urban areas in Japan faced a rapid urban rise, which resulted in the employment of ‘green bands’. For instance, the ‘yellow line’ system [
19] in Albania was used for defining ‘population centres’, highlighting the urban-rural zones. Urban growth boundaries were proposed as one of the first management measures (instruments) for rapid and unrestrained urban growth in the countries such as Saudi Arabia [
20], with an annual 6% increase in the urban areas, which resulted in the expansion of urban infrastructure in the most important cities [
21]. Urban growth boundaries are also widespread in Canada and the United States of America (USA) as a tool for regional planning [
22,
23]. For example, the metropolitan zones of Vancouver, Toronto, Ottawa, Waterloo, and Ontario have set urban growth boundaries in order to limit urban growth in the areas of utmost importance and to protect green areas [
24]. However, in case of Portland, urban growth boundary was not completely successful [
25]. Building new cities in many countries has been intended to have the growth of the urbanized area under control, thus applying the British model based on the garden city idea. However, the effective solution has been adopted developing new cities in Israel, France, and Egypt [
26].
R. Giffinger and co-authors [
27] analysed intelligent urban models and put emphasis on six axes (aspects) of a smart city: governance, economy, mobility, environment, people, and living conditions. The identified six characteristics were considered to be the relevant group describing the smart city.
A review of scientific literature proposes that the researchers focusing on inner urban development do not analyse the historical development of urban areas. Similarly, scientists use a variety of methods for assessing inner urban development. However, multi-criteria methods, including different components of sustainable development, are insufficiently considered. Thus, it can be concluded that researchers have a narrow focus on the needs of society and, most of all, use their own insights to create the patterns of inner urban development (economic, social, or ecological) in one or several directions, which later becomes meaningless. On these grounds, a challenging task of carrying out historical studies on the growth of urban areas has been approached, which greatly assists in creating a multi-criteria model meeting all the aspects of sustainable development.
3. Research Methodology
Historical cartographic material and the maps of the selected city and towns were used for conducting research on the historical development of urban areas. ArcGIS software displayed the received results. The maps and plans of Kaunas, Taurage and Silale towns were taken from municipal archives and websites.
ArcGis software was applied to analyse the outcomes of variations in urban areas. The carried out analysis covered five stages. At the first stage, cartographic material was prepared—old paper plans and maps were scanned. At the second stage, the attachment of the scanned plans or maps to the coordinate system of Lithuania (LKS94) in ArcGis software was performed. At the third stage, the maximum attachment error was determined and used for making the geometric correction of the attached map. At the fourth stage, the city/town plans attached to the coordinate system of Lithuania (LKS94) were vectorized. At the fifth stage, the comparative analysis of variations in urban areas was carried out.
Table 1 presents a more detailed methodology for the survey.
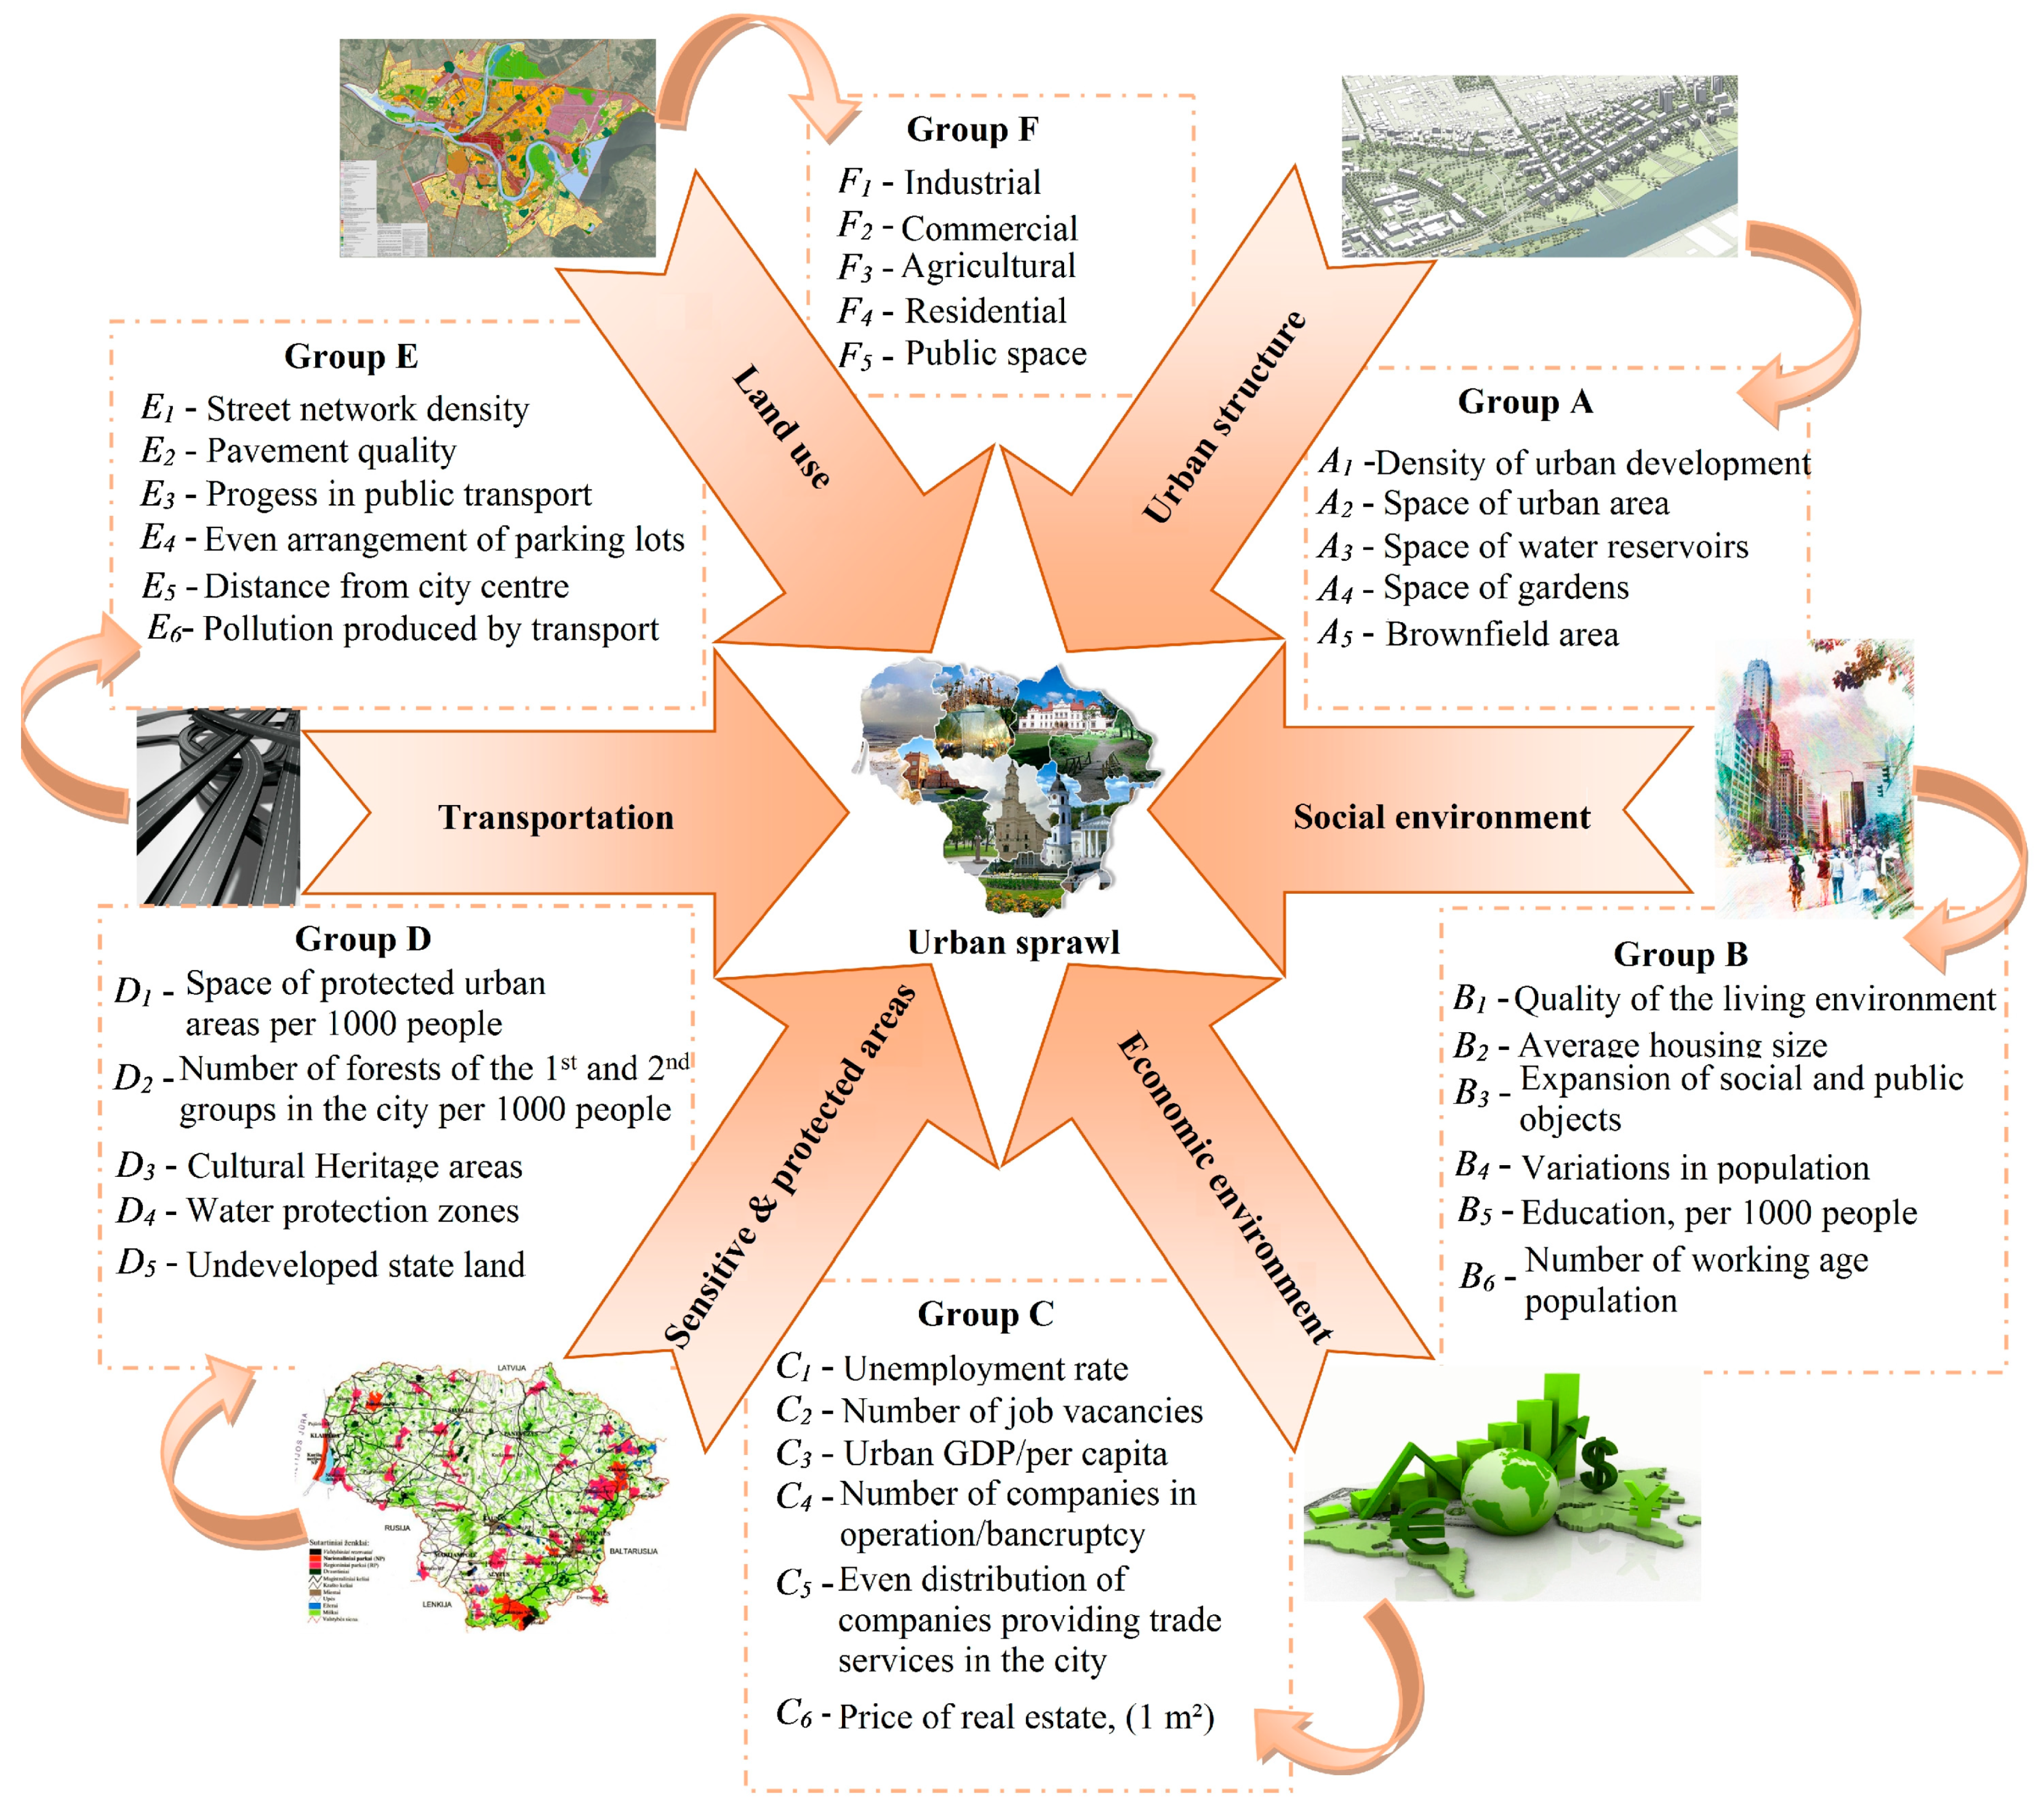
Following the comparative analysis of variations in urban areas, the databases of the analyzed cities were compiled taking into account four groups of indicators:
Group A—Urban Structure (five criteria),
Group B—Social Environment (six criteria),
Group C—Economic Environment (six criteria),
Group D—Sensitive and Protected Areas (five criteria),
Group E—Transportation (six criteria), and
Group F—Land Use (five criteria).
All the above data were used for formulating and selecting the most important criteria and groups of criteria in inner urban development thus identifying similarities and differences in the areas. Schemes were proposed to visually present the collected data (
Figure 1,
Figure 2 and
Figure 3). To determine and accumulate indicators, the grid system that was suggested by the Lithuanian Department of Statistics according to the data on the general population census of 2011 was employed. According to the findings of the conducted analysis, the main criteria of six groups in inner urban development were proposed and they could be considered for defining the expected most important inner areas of urban development.
The next essential and critical procedure is the weighting of criteria, i.e., determining their relative significance to the analysed problem. Both the objective and subjective methods can be used for evaluating the importance of criteria in solving multi-criteria problems [
28,
29,
30]. The subjective weight approaches reflect judgments of experts, resulting in the acquisition of less rigorous values [
31]. The objective weights are achieved by entirely mathematical methods [
32]. From a variety of methods, the most useful and practical tools, according to [
33], can be considered as a analytical hierarchy process (AHP) [
34,
35,
36], analytical network process (ANP) [
37], superiority and inferiority ranking (SIR) method [
38], stepwise weight assessment ratio analysis (SWARA) [
39,
40], factor relationship (FARE) [
41], KEmeny Median Indicator RanksAccordanc (KEMIRA) [
42], and the best–worst method (BWM) [
43]. A new approach of step-wise weight assessment with symmetric interval type-2 fuzzy sets for determining the subjective weights of criteria has been suggested recently [
44]. The recalculation of weights of criteria using the Bayes approach was presented [
45].
If a decision is made on the basis of expert evaluation, a degree of the consistency of expert opinions must be assessed. The correlation coefficient can quantify whether the opinions of two experts are consistent; however, if the number of experts exceeds two, then the level of agreement among the ratings of these experts is expressed by the coefficient of concordance [
46,
47,
48,
49,
50].
Following expert evaluation, the obtained sets
tik are statistically processed. The mean value of evaluating criterion
is determined by the formula:
where
tik—the evaluation of criterion
i provided by expert
k;
r—the number of experts; and,
n—the number of criteria.
The relative significance of every indicator
qi is calculated according to the formula:
The credibility of expert evaluation can be expressed by the concordance coefficient of expert opinions describing the degree of agreement among individual opinions:
where
S is the sum of the squares of deviation from the evaluation results of each indicator;
Tk—
k the indicator of related ranks;
Hl—the number of the groups of equal ranks in
k ranking;
hl—the number of equal ranks in the group of related ranks
l under the evaluation of expert
k;
tik—the rank attributed to indicator
i by expert
k;
r—the number of experts; and,
n—the number of evaluated criteria.
The significance of the coefficient of concordance is defined according to the formula:
The overall weights
qi″ can be calculated using Equation (7), which combines the criteria weights in a group
qi and criteria group weights
qj′:
where
n—the number of criteria in a group; and,
m—the number of criteria groups.
If the value of calculated according to formula (6) is higher than , which depends on the degrees of freedom and the accepted level of significance; the hypothesis regarding the agreement between expert ranks is accepted.
If < , the positions of experts are considered to be inconsistent.
4. Research Findings
4.1. The Analysed Results of Kaunas City
Kaunas is a city in south-central Lithuania, existing at the confluence of the Neris and Nemunas rivers. It is the second-largest city in Lithuania and the historical centre of Lithuanian economic, academic, and cultural life. In the Russian Empire, it was the capital of the Kaunas Governorate from 1843 to 1915. During the interwar period, it served as the temporary capital of Lithuania, when the current capital Vilnius was part of Poland between 1920 and 1939.
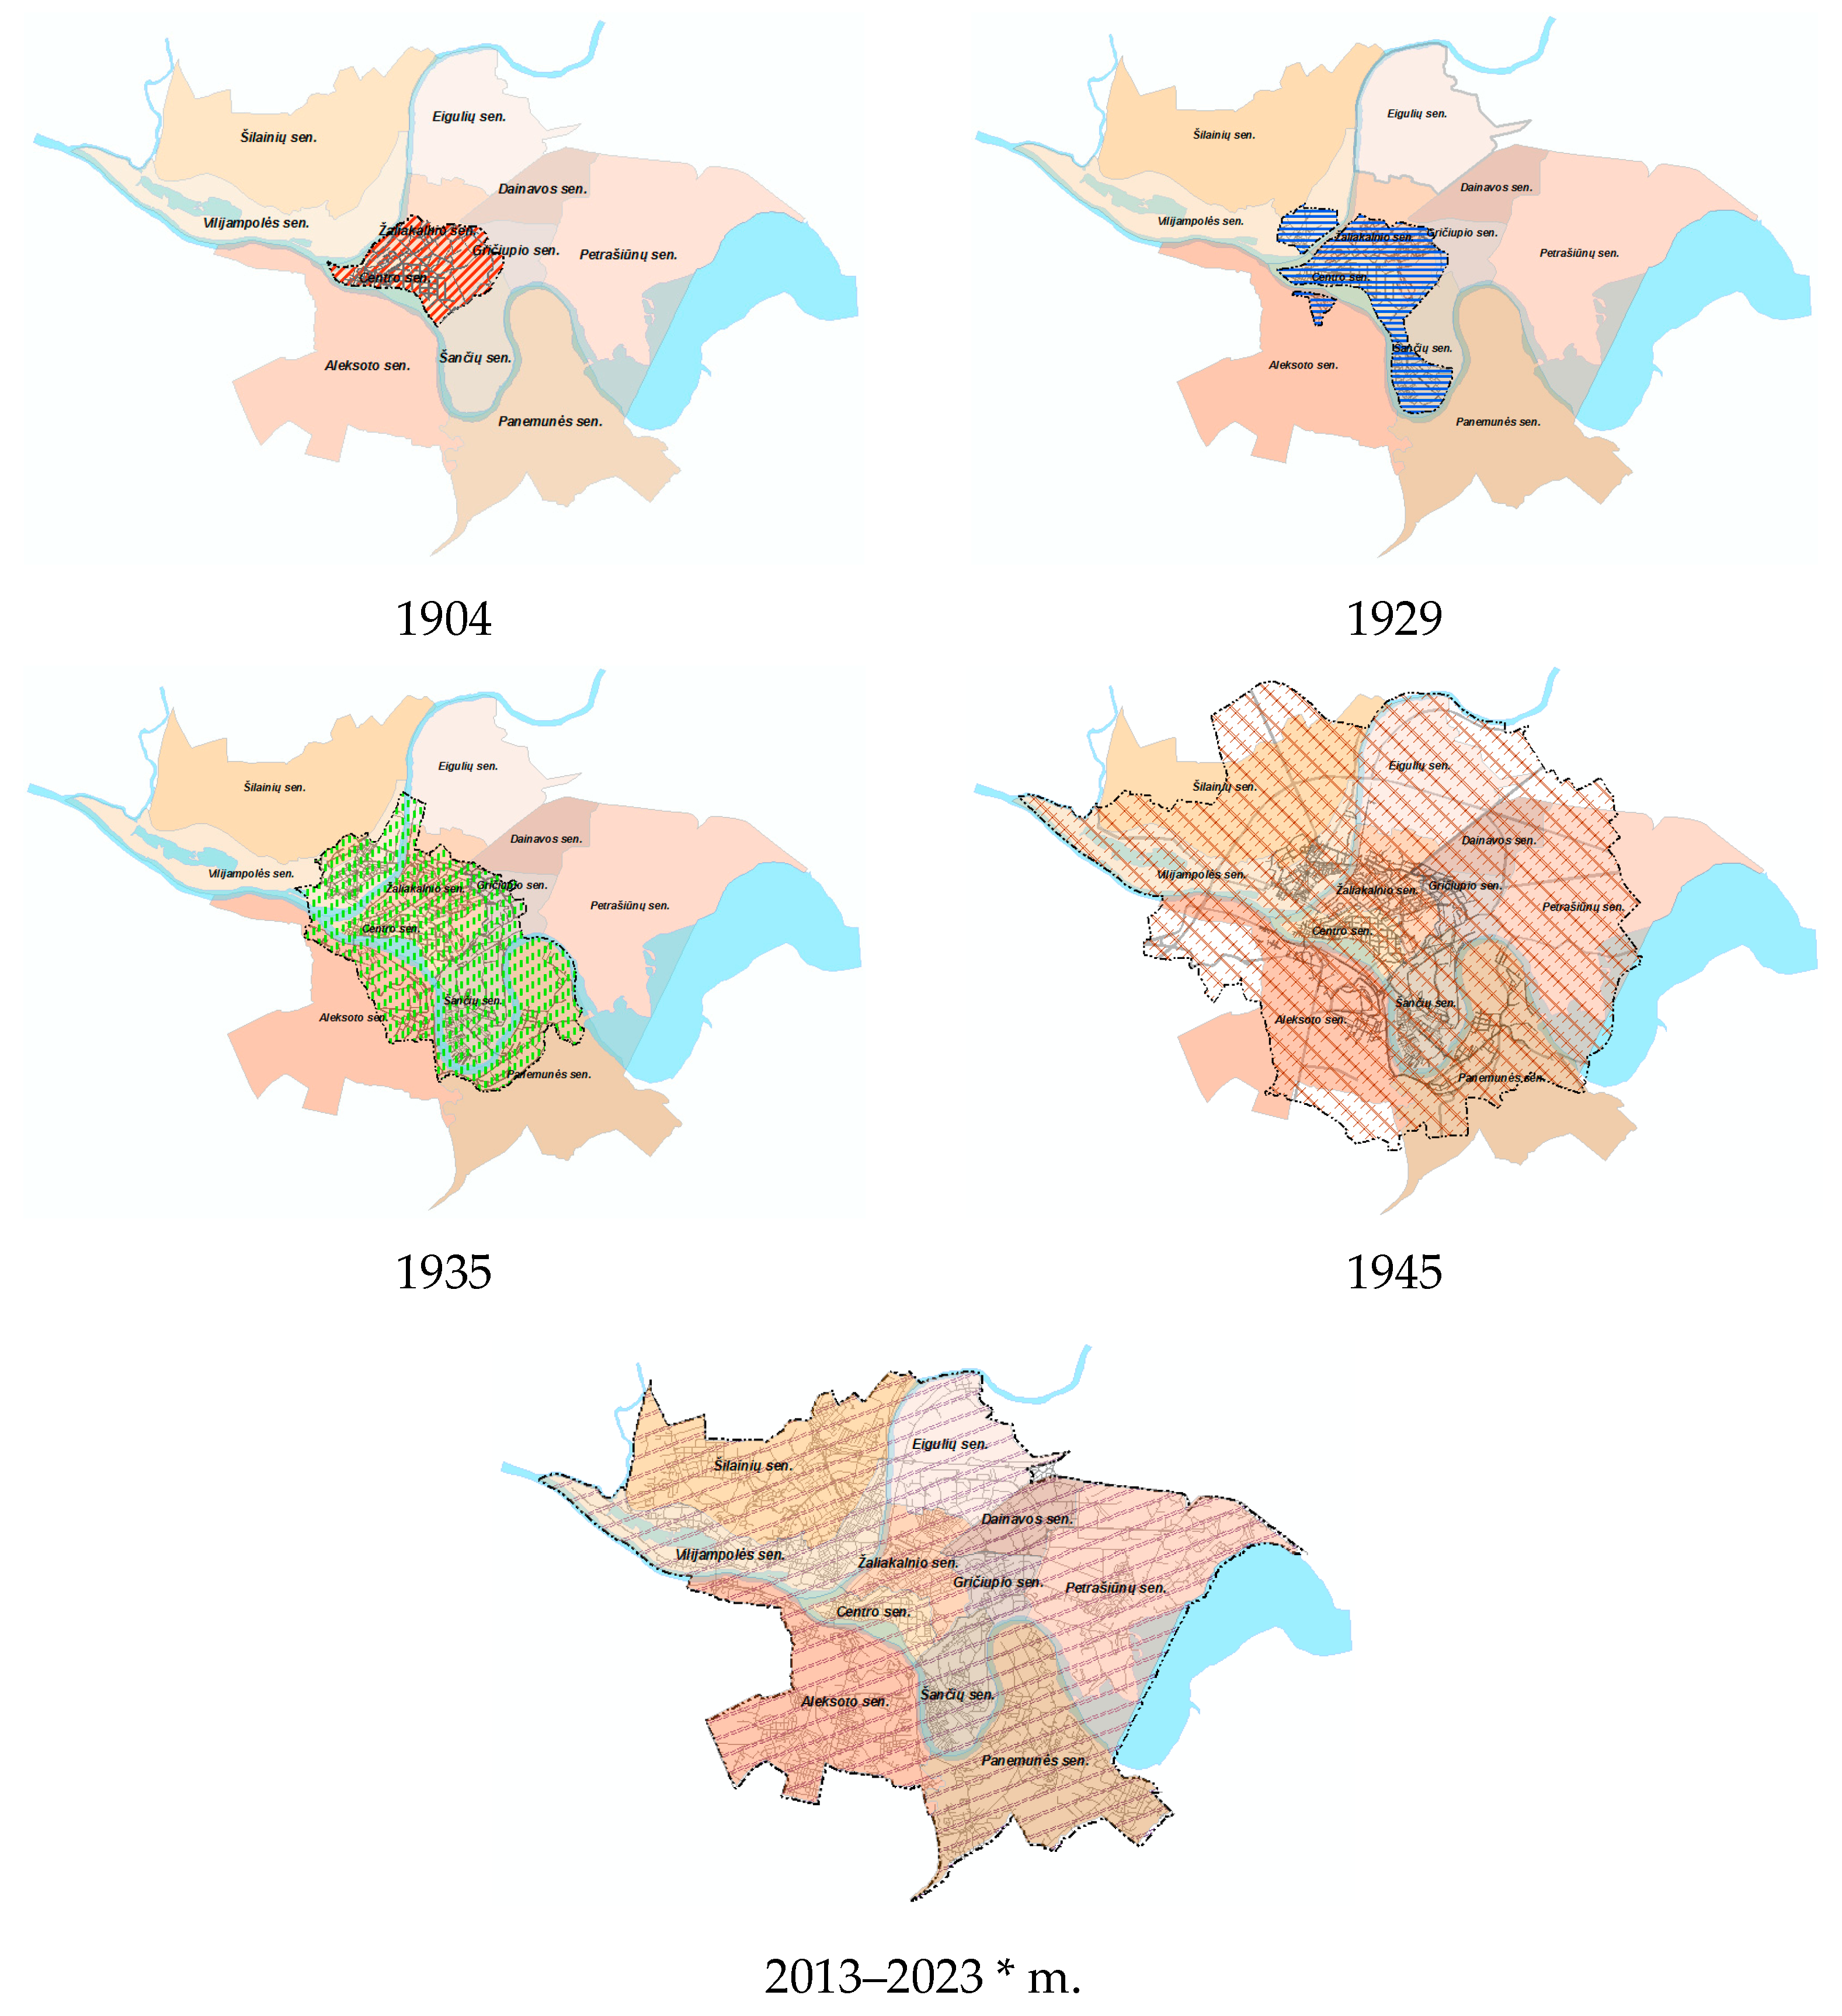
In the period considered, between 1904 and 2023 (solutions to the current general plan are valid up to 2023), both the spatial area of Kaunas city and the number of inhabitants have increased. The population of Kaunas city was steadily growing until 1970, regardless of a sudden drop during war years; however, since 1970, the population has been slightly decreasing (
Table 2). The opposite trend is evident while looking at variations in the area. From 1857 to 2013, the area of Kaunas was scattering over, thus occupying new territories closer to the city (
Figure 1). Within the analyzed period, the city remained homogeneous and compact, including neighbouring residential areas. Thus, it can be argued that the spatial area of the city is evenly subject to population growth.
Kaunas, Taurage, and Silale cities maps were used in five different periods to evaluate the development of the area of these cities. The maps were randomly selected while considering the precision of historical data found in archives. Our goal was to determine the extent of the urban area varying most of time. The development of Kaunas city took the longest period of time, as changes in the area has covered 120 years. The analysis of the area of Taurage town has been carried out over a period of 74 years, and that of Silale embraced a period of 52 years. The research was aimed at demonstrating the proposed approach to the analysis of old maps, starting from scanning to vectorization on a racist map and a comparison of changes in the analyzed area. The authors suggest that six indicators (the area of the site (km2), population, population density (people per km2), street length (km), street density (km/km2), and length of streets 1000 inhabitants/km.) can perfectly reflect the urban changes in the development of Kaunas city and Taurage and Silale towns.
Figure 1 shows that the urban area covered the entire present Centre neighbourhood and a part of Zaliakalnis and Griciupis neighbourhoods in 1904. A part of the current neighbourhoods of Sanciai, Vilijampole, and Aleksotas joined the area in 1929, a part of Griciupis and Panemune neighbourhoods—in 1935. In 1945, the area of Kaunas was partially formed by all present neighbourhoods of the city.
The analysis of variations in the population of Kaunas city, the existing transportation infrastructure and the expansion of street network infrastructure for the period from 1904 to 2013 (
Table 2) shows that the area, population, the general length of streets, and the length of streets per 1000 people were gradually increasing, except for 1945, when the population suddenly dropped to 80,000 and it had an effect on other results, the calculation of which was affected by the population; for example, from 1904 to 1935, the length of streets per 1000 people gradually increased up to 1.60 km, in 1945, the length of streets per 1000 people suddenly increased to 4.65 km, and in 2016, decreased to 3.42 km. The area of Kaunas city has increased by 17.9 times, while the population has grown by 4.2 times. During the analyzed period, Kaunas has become the agglomeration core, together with the settlements that are located along the administrative boundaries of the city and belonging to Kaunas region. Research has shown that Kaunas city has high compactness, reaching 5.92, because of the dense centre in the confluence of Nemunas and Neris rivers and due to apartment blocks build in the northern part of the city forming a large part of the urban area. Kaunas has made an indirect impact on the surrounding areas and encouraged them to develop and enlarge together with the city by expanding its territory. Such variations have significantly reduced the population density in Kaunas city (amounts to 1896.83 people per km
2), which mainly has changed the way of life and vehicles that are used for transportation, because a passenger car has acquired the predominant role.
4.2. The Analysed Results of Taurage Town
Tauragė is an industrial city in Lithuania. It is situated on the Jūra River, close to the border with the Kaliningrad Oblast, and not far from the Baltic Sea coast. Although first mentioned in 1507, Tauragė only received its city charter in 1924. Lithuanian, Swedish, and Danish factories operate in the city. Nowadays, Tauragė is famous for its car markets and adventure park.
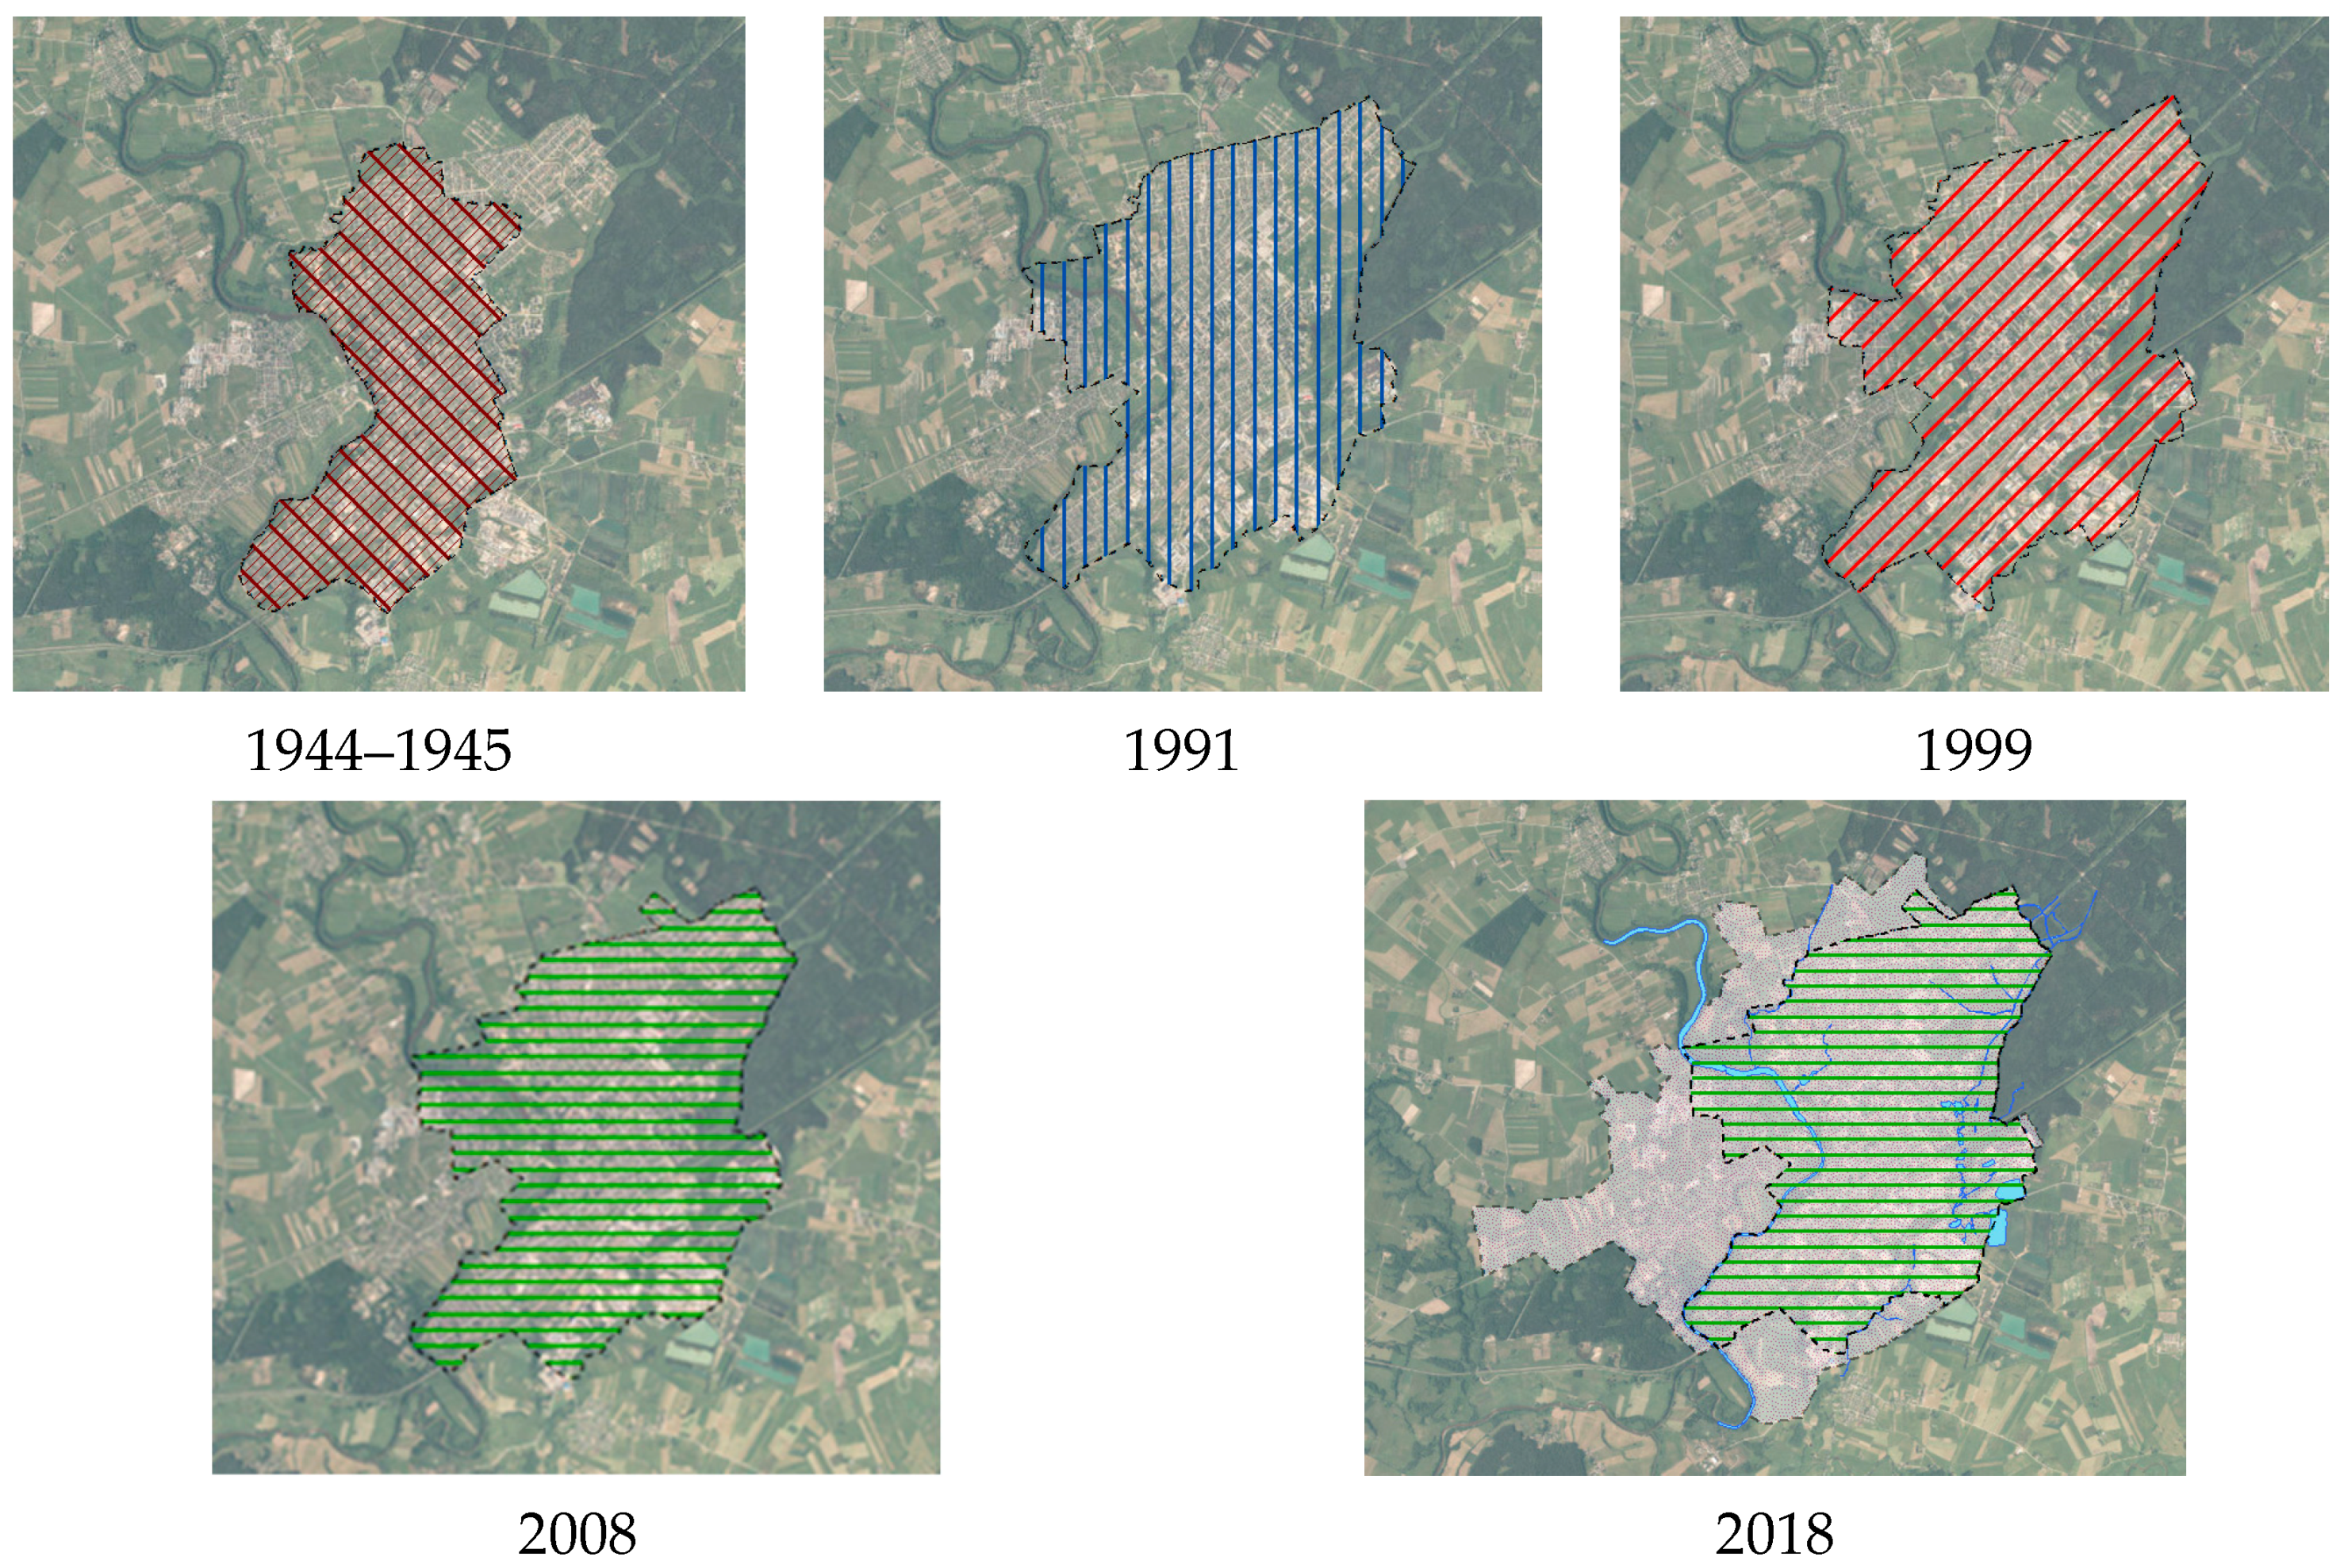
The findings of the investigated period from 1944 to 2018 have demonstrated that Taurage town has been expanding steadily by enlarging its area and maintaining a similar shape and the direction of development subject to population changes (
Table 3). The population of Taurage town tended to rise until 1989, and it then started decreasing due to a negative natural increase in the population and the negative migration balance. In 2016, a growth in the quantity of people was observed, because the number of town residents was added to that of the citizens of nearby settlements that were planned to be included in the town. The opposite trend is evident when looking at variations in the space of the urban area. From 1653 to 2018, the area of Taurage has gradually expanded. Starting from 2008, according to the general plan of the area of Taurage municipality until 2018, the long-term urban area should increase to 22.33 km
2 (
Figure 2) after a decision regarding connecting the surrounding villages to the city. The examined period faced the constantly growing population, which analogically changed the administrative boundary of the town. By 2008, the town was strongly developed in the northeast and southeast directions, and since 2008 southwest and northwest directions have been planned to be developed. The carried out analysis of variations in the area of Taurage town leads to a conclusion that, since 1944, the former elongated city structures situated around railway branches and present Silale Street have not been sufficiently compact, and therefore will become a homogeneous, compact town centre integrated into surrounding areas until 2018 (
Figure 2).
The analysis of variations in the population of Taurage town and the expansion of street network infrastructure from 1944 until 2018, provided in
Table 3, shows that the space of the area, the population before 1991, the length of streets, and that of streets per 1000 people are gradually increasing. The area of the town has expanded by 1.6 times and therefore a growth in the population of Taurage has an effect on the results of the analysis that was conducted in 2018. Since 1991, the population has decreased, and hence population density and people/km
2 have proportionally varied.
The period from 1944 to 2018 ranged from 1371.56 people/km2 to 2157.99 people/km2, and it should decrease to 1298.84 people/km2 in 2018, although the recommended minimum population density in the abovementioned spatial planning norms makes 3000 people/km2. A decrease in population density results in a reduction in the incomes of the city budget and in the growing costs of maintaining urban infrastructure and public services. Continually decreasing population density indicates that Taurage town needs well-thought-out inner development strategy to the developed territory of town within boundaries.
4.3. The Analysed Results of Silale Town
Silale is a town in Western Lithuania. It is located 30 km north of Taurage. The river Lokysta flows through the town. The town is part of the Samogitian ethnographic region of Lithuania and it was first mentioned in the 16th century. Before the War, a large part of inhabitants were Jewish people. In 1941, the Nazis massacred around 1300 Jews in Silale.
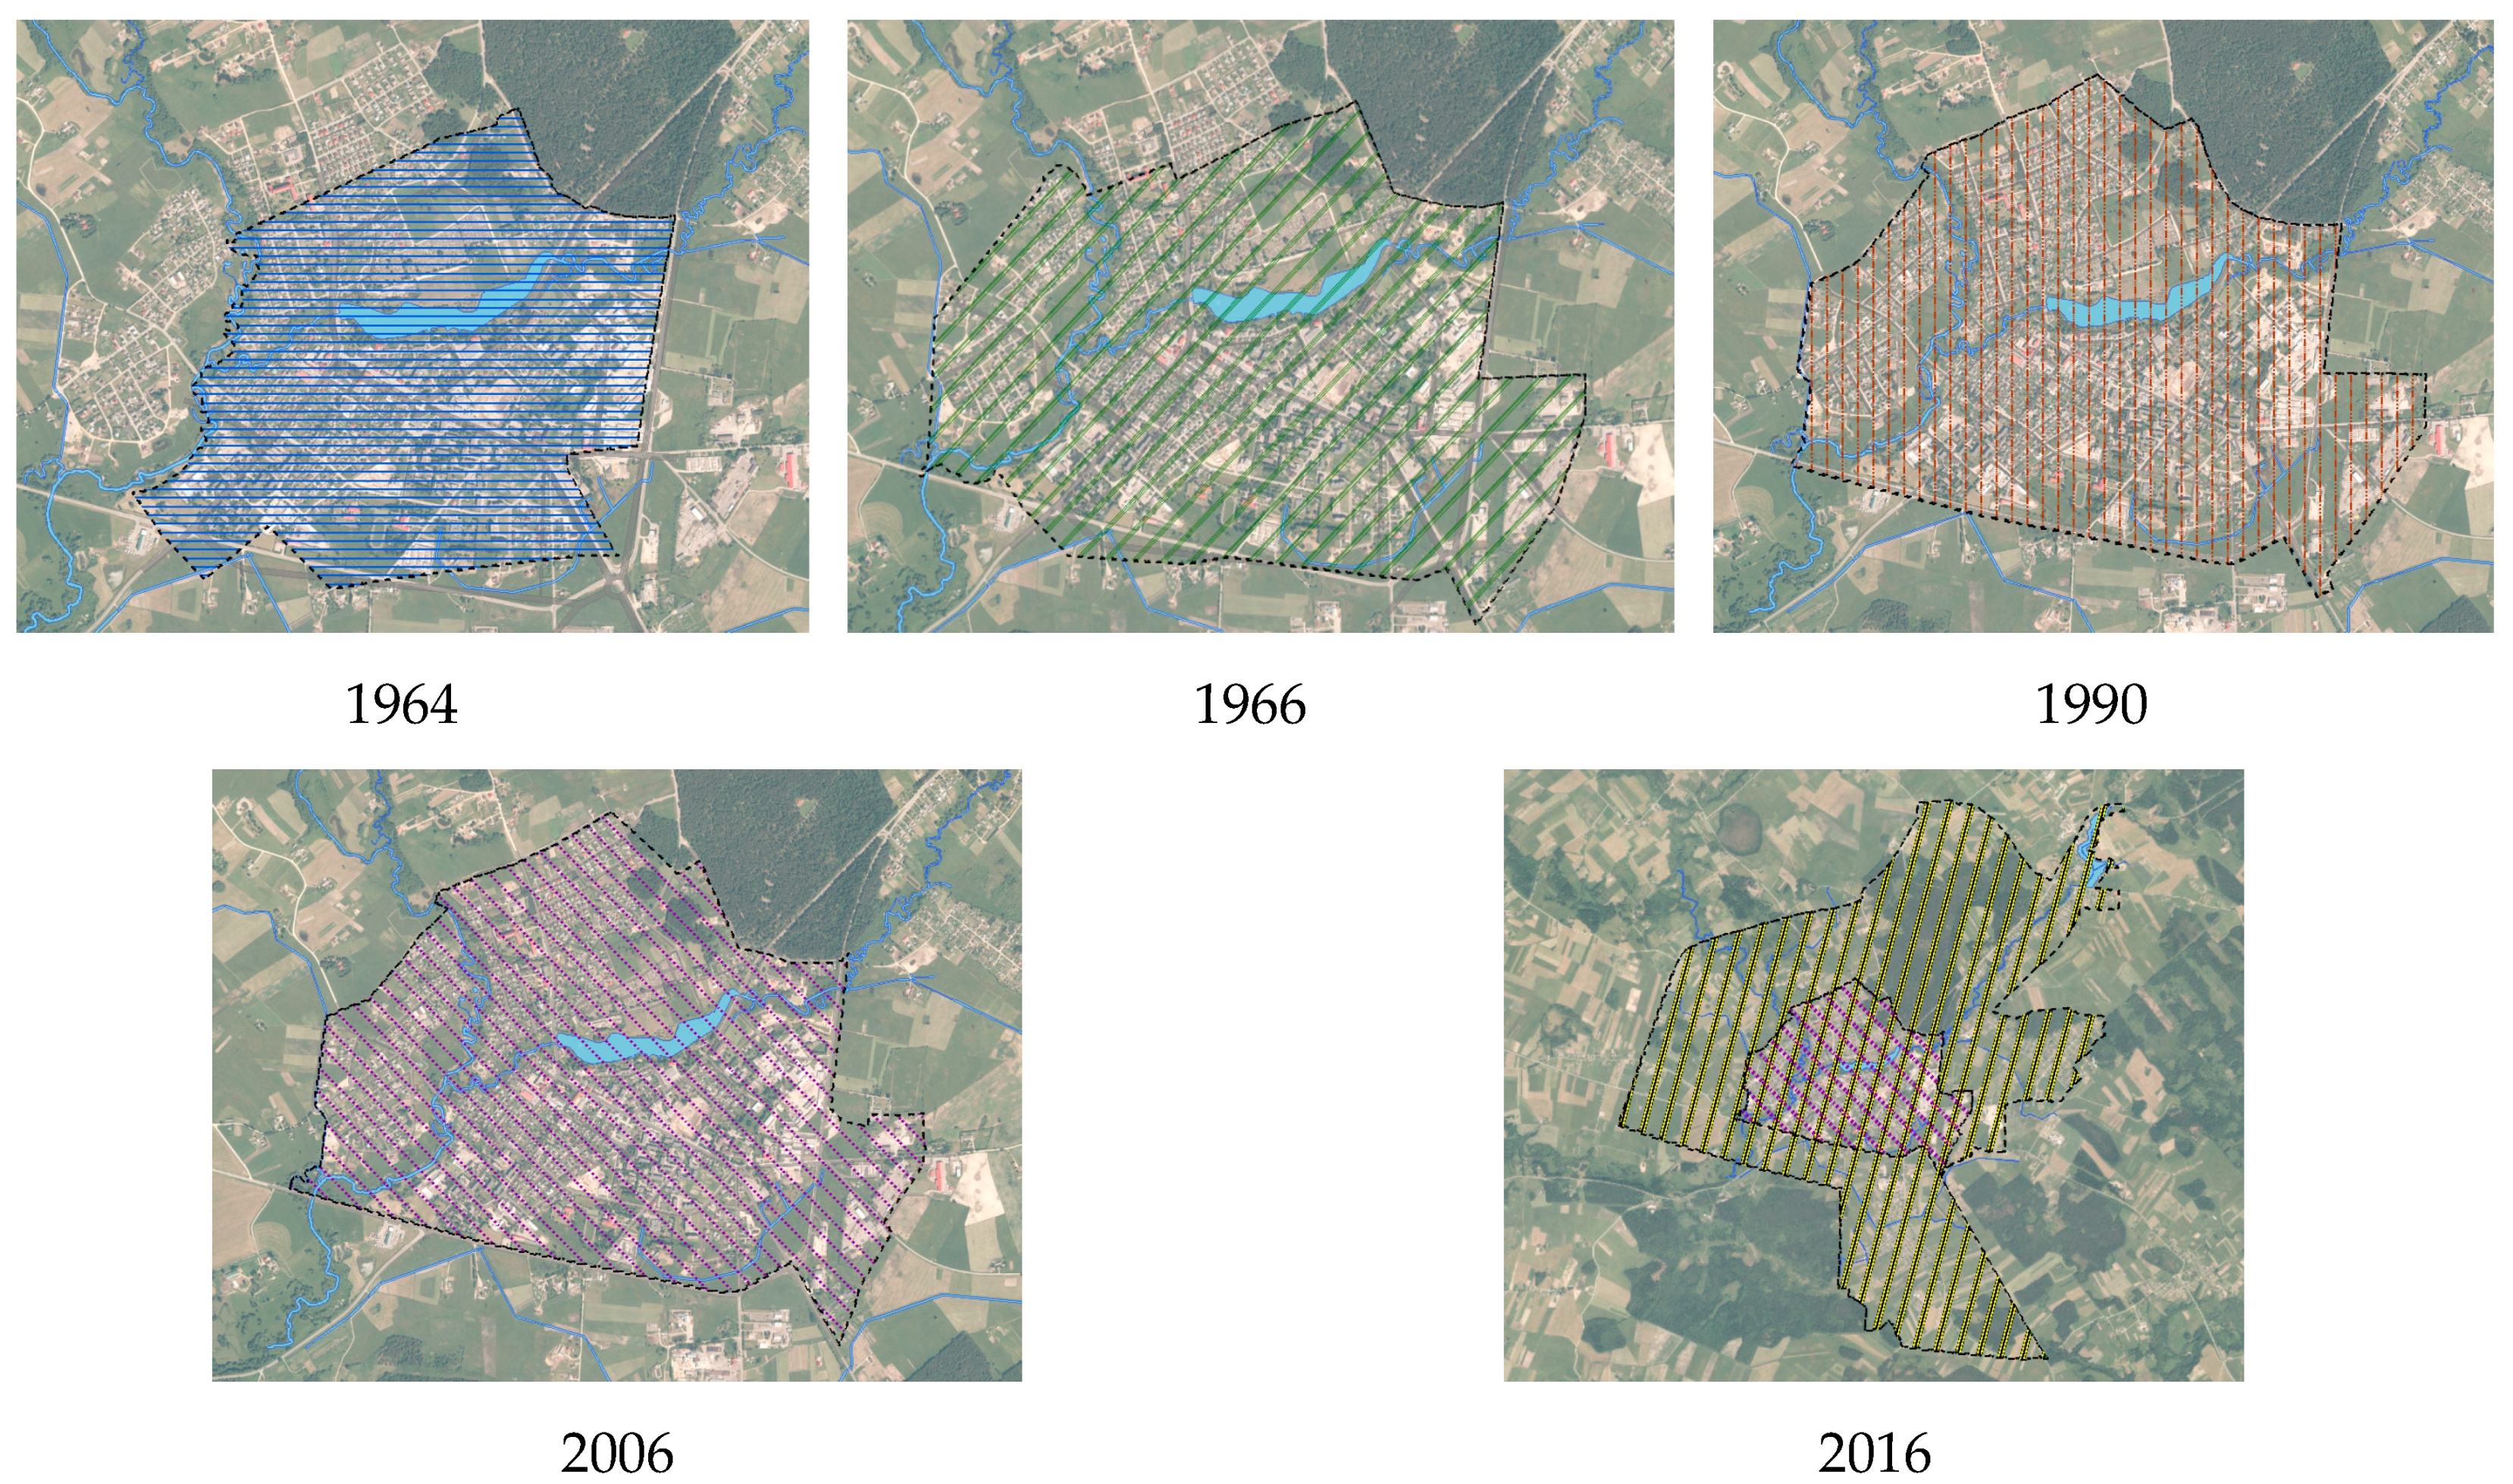
Within the examined period from 1964 to 2016, Silale town developed evenly in all directions, along with variations in the number of the population that fluctuated and faced both an increase and a decrease. For the period from 1989 to 2016, a drop in the population was noticed, which might be affected by tendencies in the aging population, a low birth rate, and the structure of economy, i.e., a reduction in the structural part of agricultural production, migration to metropolitan areas, and foreign countries. The opposite trend is evident when looking at variations in the space of the urban area. From 1964 to 2006, the area of Silale town gradually increased. From 2006, according to the general plan of the town until 2016, the long-term urban area increased to 17.95 km
2 following a decision regarding the connection of surrounding villages to the city (
Figure 3). During the period considered, the town formed and became compact, including the surrounding residential areas. Thus, it can be proposed that the urban area was evenly subject to population growth prior to 2006.
The analysis of variations in the population of Silale town and the expansion of the street network infrastructure from 1964 to 2016 are presented in
Table 4, showing that the space of the area, the population prior to 1990, the length of streets, and that of streets per 1000 people were gradually increasing. Since 1990, along a drop in the number of people, population density, and the number of people/km
2 have also declined. The findings of the carried out analysis are distorted by the long-term boundary of the area of Silale town presented in the general plan of Silale until 2016 and covering the unified urban structure of Silale, Silai, Balsiai, Vingininkai, and other neighbouring villages. This urban structure is analyzed in the general plan and it is expected to be further developed to give the status of the town, which should strengthen the rank of Silale town in the common system nationwide. The general plan of the area of Silale town until 2016 provides a decreasing number of the population in Silale. Therefore, the situation is intended to be compensated by incorporating surrounding villages into the urban area, thus extending administrative boundaries (approximately 5.2 times) and increasing urban population. Such a decision should obviously increase the space of the urbanized area, however this is a dubious need from a demographic viewpoint of Silalė town and the whole of Lithuania. Prior to 2006, Silale maintained a homogeneous and compact structure with neighbouring surrounding villages having very strong links with the city center. With reference to geospatial data on the results of the population and housing census in the Republic of Lithuania (2011), grids were used for calculating the population of the surrounding settlements that were planned to be incorporated into the city. According to the data collected in 2011, the population of Silale town increased by 3480 inhabitants; nevertheless, it should be taken into account that, from 2011 to the beginning of 2016, the population in Silale decreased by 1.59%—from 5486 to 5400 inhabitants, and therefore the population of the incorporated territories was reduced by 1.59% to 3387 people. The analysis of urban development that was scheduled in the general plan of the city by 2016 points out the opposite trend: the city expanded its area, the population increased by 3387 people, but the population density considerably decreased (from 2006 to 2016, even 71.30%) and the urban structure changed and became less compact than before.
5. Expert Evaluation of Criteria in Inner Urban Development
Cities are constantly expanding externally, regardless of the ever-decreasing population. The analysis of territorial variations in Kaunas city, as well as in Taurage and Silale towns, has showed that, according to the latest general plans of Silale and Taurage, the outer development of these cities is scheduled, although the areas still have room to expand inside. There is a risk, because this option allows for the expansion of urban areas and carrying out construction works in the large area, thus providing perfect conditions for settling small groups of urban areas that are situated around the densely developed towns of Taurage and Silale. These examples show that, in order to manage urban and outer development, the main criteria in inner development must be analyzed, so that the towns could seize all the inside opportunities for expansion.
Figure 4 presents a scheme for the formulated and selected key groups of criteria in urban development. The criteria affecting inner urban development have been formulated and divided into six groups: Group A—Urban Structure (five criteria), Group B—Social Environment (six criteria), Group C—Economic Environment (six criteria), Group D—Sensitive and Protected Areas (five criteria), Group E—Transportation (six criteria), and Group F—Land Use (five criteria).
This study applies for expert evaluation in turn to assess the relative importance of criteria in inner urban development. The experts are selected professionals in spatial planning and transportation systems and those employed in state institutions and all having a Master’s or PhD degree or work experience exceeding 10 years.
The core of the expert evaluation method is determining the relative importance of the criteria under consideration in planning sustainable urban development employing the quantitative assessment of expert opinions and processing the evaluation results. Ten experts, with reference to their knowledge and experience, were asked to rank (i.e., to assign scores based on the scoring scale) inner urban development criteria that are presented in the questionnaire and provided in
Figure 4. According to the above-presented technique (Equations (1)–(7)), the summarized expert opinion was accepted as the result of the solution to the problem.
Table 5 and
Table 6 provide the criteria evaluated and ranked (arranged in order of importance) by the experts in separate groups and the importance of the groups of criteria.
The most important group of criteria according to experts’ opinion is Group A—Urban Structure. It is an obvious leader, with relative significance qi = 0.28. The next follow Group E—Transportation, Group B—Social Environment, and then Group C—Economic Environment.
The overall weights of criteria are calculated using Equation (7), which combines criteria weights in a group and criteria group weights.
Table 7 presents the results.
The most important criterion according to experts with
qi″ = 0.09 is density of urban development, the next follow space of urban area and brownfield area, with
qi″ = 0.06 each (
Table 7).
6. Discussion
Expert evaluation has shown that the criteria having the most powerful impact on urban development can be found in each of the groups.
To ensure the sustainable development of the area, the urban structure and the density of the urban development,
qi = 0.31 each (
Table 6) must be primarily evaluated. These are the most important criteria in determining how the city should be further developed to make it more convenient to live selecting an appropriate layout of residential areas to ensure the quality of the living environment. The latter criterion, in particular, determines the price of real estate, which is a complex one, reflecting the level of the quality of life. This criterion includes all income, embracing that of shadow economy in order to obtain highest quality private housing that meets the needs of the family.
The space of protected areas (
qi = 0.27) remains important for urban life (
Table 6), which shows that inhabitants seek to have a sustainable city with a sufficient number of green areas that should assure the proximity of recreational areas to residential buildings.
Another group of criteria describing the urban transportation system is very important to the urban population. The equal importance of criteria (
qi = 0.22) illustrates that the distance from the city centre, the density of the street network, and progress in public transport are equally important for the population (
Table 6). All of these criteria describe the balance of urban population, because the closer you can get to the city centre, the more comfortable and faster you can reach attraction objects of the city. Street density and progress in public transport determine daily travel time of the population.
The results of the survey indicate that inner city development is proposed to be given priority when considering the development of the urban area. This shows that the group of indicators for the urban transport system accepts the distance from the city centre and the level of progress in public transport as extremely relevant and, in all cases, the latter will be higher in the places of dense street networks and urban development, because public transport works efficiently only in the areas with a population density of more than 92 people/ha.
The greatest weights of criteria are obtained in all different domains and they show that urban development is a multifaceted process that is determined by composite criteria, which lead to consistency or symmetry in urban development.
As a result of the density decrease of urban population, the compactness of cities is diminished, the infrastructure of transport becomes more and more expensive, cars start playing the predominant role, it is payed less attention to inner urban development, and outer urban development is stimulated.
While planning without taking into account the most important urban indicators (density and intensity of build-up territory) and increasing the number of additional areas increases the cost of maintaining urban infrastructure and it is typical of all the cities analysed, especially in the most recent (2006–2008) Master plans.
As for further studies, it is possible to elaborate on the extent of external development, depending on the size of the urban area, the type of a building, and the means to manage urban development, thus ensuring the quality of life in the compactly developed city, i.e., possibility of balancing (symmetry) of needs and their satisfaction.
7. Conclusions
According to foreign experience, urban development as the biggest issue of the 21st century can be managed by determining the urban growth limits beyond which construction is prohibited or restricted. Another way is using the resources of inner urban development and increasing the density of urban development, thus simultaneously promoting the compactness of applying brownfields and undeveloped territories inside the city borders.
While taking into account the evolution of urban development in Lithuania and abroad, and due to the permanently decreasing population, the cities and towns of Lithuania should focus on inner urban development, although the historical cartographic material of Kaunas city (1904–2023) and Taurage (1944–2018) and Silale (1964–2016) towns, as well as the analysis of variations in urban boundaries, have demonstrated that the design of the initial general plans for cities for the period 2006–2008 overestimated the privatization of land ownership and unduly expanded urban administrative boundaries, despite the fact that the territories had been developed sufficiently evenly. Nevertheless, if we compare the development of cities area, we can see that only the last Master Plan proposed large territorial development, which is due to restoration of private property.
The multi-criteria development model that is proposed by the authors allows for using it in any country or city where the suggested methodology may assist in interviewing urbanists, real estate developers, and planning experts to identify the most important criteria that, when considering the opinion of experts, have a profound effect on urban development.
In the case of Lithuanian cities and towns, the key criteria embrace urban structure, the density of urban development (0.31), which is the aspect defining it, space for residential areas (0.31), and the space of protected areas within the city per 1000 people (0.27). For assessing the effect of infrastructure, transportation plays a crucial role and it can be characterized by the density of the street network, the level of progress in public transport, and the distance from the city centre to developing areas (all above mentioned criteria take weight equal to 0.22). As a result, the price of real estate and the quality of the living environment (weight 0.26) are mentioned.
The results of the study could be incorporated in further steps of the research—ranking areas of urban development that are based on identified criteria and applying multi-criteria decision-making (MCDM) methods.


