SCFH: A Student Analysis Model to Identify Students’ Programming Levels in Online Judge Systems

College of Computer Science and Engineering, Northeastern University, Shenyang 110819, China
*
Author to whom correspondence should be addressed.
†
These authors contributed equally to this work.
Symmetry 2020, 12(4), 601; https://0-doi-org.brum.beds.ac.uk/10.3390/sym12040601
Submission received: 7 March 2020
/
Revised: 23 March 2020
/
Accepted: 25 March 2020
/
Published: 10 April 2020
Abstract
:Computer basic teaching is an essential basic learning content in higher education teaching. In order to encourage students and enable them to practice and improve their programming ability, the online judge system has been introduced into the programming course for compiling, executing and evaluating the algorithm source code submitted by students. The asymmetry of students’ programming level is an important issue when teachers guide the programming of online judge system. We used the exploratory factor analysis method to identify the potential variable structure from the log data submitted by the students of the online judge system, and evaluate the programming level of the students to predict the “at risk” learners. We proposed a student participation model, SCFH, based on this variable structure. Using the log data of the students in the C language course and their final exam results, we trained a deep neural network based on SCFH to divide the students into three different grades, namely “risky”, “intermediate” and “advanced”. To verify the validity of the model, we used the prediction model to classify students in another C++ language programming course. The results show that the submission log data model SCFH can be used to predict the programming ability of students, and the validity of these results can be tested by examination results.
1. Introduction
With the rapid development of Internet technology, information technologies such as big data and artificial intelligence have developed rapidly. Modern education is also transforming from informatization to intelligence. Computer-aided education has become an important part of modern education. The online judge system is an educational website which refers to a network service and was originally designed for programming competitions such as the ICPC(International Collegiate Programming Contest) of ACM. The online judge system has a large number of programming problems, which can be solved online and offline. As an open and shared testing platform, online judge system provides more and more new resources for students to learn independently, and also provides new tools and platforms for the teaching of programming courses [1].
Programming is an interdisciplinary subject. In addition, competitive programming may be relatively difficult and daunting for entry-level students due to the difficulty, variety and competitiveness of the problem. From our research on the log data submitted by the anonymous online judge system, we can see that quite a number of students are trying to find the right solutions and appropriate problems to solve. In order to help them overcome difficulties, it is very important to correctly identify these students with certain risks at an early stage. However, online judge system is designed for self-directed learning. It only provides real-time automatic evaluation of the source program of the solution submitted by the user and has no interaction with the teacher. Therefore, it is difficult for teachers to evaluate students’ learning, track and correct students’ learning behavior. Some studies have shown that classifying students’ participation in learning in daily teaching helps to improve the educational effect of students in different classes [2]. Many researches [3,4] focus on the development of theoretical models of student participation, but these models are usually limited to formal educational environment and pay less attention to online judge system.
The strength of students depends on the characteristics of online judge system submission log. Each of these features is interrelated. Therefore, clustering and statistical analysis of these multidimensional data can help us understand these students’ thinking patterns. In this research, we used exploratory factor analysis to identify the potential variable structure from the submission log data of students in online judge system. Aiming at the submission log data of students in online judge system, we proposed a participation model “SCFH” described by the key features of the submission log. In addition, we trained the deep neural network based on the SCFH model by using the students’ log data and final exam scores in C language course, and divided the students into three different grades. In order to verify the validity of the model, we used the prediction model to classify students in another C+ + programming course.
2. Related Works
2.1. Application of Online Judge System in Programming Education
Online judge system has a long history of application in education. It was introduced by Stanford University at least in 1961 to support the evaluation of student procedures coded with ALGOL [5]. Since then, online judge system has quickly replaced traditional manual judgment. Many scholars have conducted a large number of researches related to online judge system. Andy Kurnia et al. [6] analyzed the advantages of online judge system for student project evaluation and labor. They first systematically introduced the design of the online test system, and then compared the efficiency and fairness issues. M. Choy et al. [7] analyzed the experience of applying online judge system to programming education and emphasized that timeliness and development motivated students to be passionate about programming.
The application of online judge system has several advantages. First, the teacher can accurately verify the correctness of the source code submitted by the student by preparing a complete test case that covers all the results. Second, the time for judging is greatly reduced, so students can do a lot of preparation and practice. Finally, students are able to get immediate feedback and know if their answers are correct.
It is worth noting that online judge system requires a high degree of motivation and self-discipline, so online judge system can only serve as a teaching aid to enhance professional skills [8]. However, due to the limitations of online judge system, teachers are not able to obtain feedback on the ability of students to gain experience in online judge system. There is currently no effective tool for analyzing and evaluating students’ interactions in online judge system and providing valuable feedback to teachers. Therefore, it is necessary to find a set of observation indicators to measure the students’ learning in online judge system, and to classify students by model. In this way, teachers can get feedback on students’ learning situations and correct students’ learning behavior.
2.2. Programming Level Assessment
In online systems and non-online learning environments, a great deal of research has been done to identify “risky” entry-level students. The key features that have been considered in these studies [9,10,11,12] are given in Table 1.
In order to classify students’ programming level, many researches have realized and trained statistical learning models and neural networks. Recent research [9] has proposed a back propagation neural network, which can estimate students’ performance according to their prior knowledge. The study also construct a student attribute matrix (SAM), indicators and predictors, which reflect how much influence a particular factor will have on students’ performance. D Capobia’s [12] research focuses on learning behaviors and programmers’ personality traits to determine their abilities and motivations. This study compares programmers who learn through conceptualization with programmers with relevant experience, and proposes a measurement index based on a small number of questionnaires, called DiCS-Index. Research [13] classifies programmers’ abilities according to the timeliness of homework submission, that is, the timeliness of students, as well as their average scores and progress in the past few years.
It is obvious from the existing research that there are a lot of contents related to “risk” student prediction in online and offline learning environments. Data mining and knowledge discovery are still rarely used in online judge programming systems. However, research and contributions in this field are increasing rapidly recently. In recent years, different support systems and recommendation systems have been proposed for online judge programming environment [14,15]. The support system includes problem difficulty assessment [16,17], problem suggestion [18,19] and other services. Most of the proposed support systems are based on collaborative filtering [14,16,17] and are limited to classroom data. As far as we know, there is no clear research on classification in online judge system based on submitting log data, scoring and other key features.
2.3. Exploratory Factor Analysis
In the field of scientific research, some variables are not easy to be directly observed, and these variables can only be indirectly reflected by the observable variables related to them [20]. We call the observable variable the original variable, and the variable that is not easy to be observed that has a correlation effect on the original variable is called the factor.
The exploratory factor analysis is a multivariate statistical analysis method that finds out the main factors that affect the original variables and estimates the influence of the factors on the original variables by exploring the characteristics, properties and internal relations of the original variables. It can reduce many disordered original variables into fewer core factors and make them have subsequent interpretation ability, thus realizing the extraction and reconstruction of measurement information.
3. Method
3.1. Research Questions
- Find the potential variable structure in the log data submitted by online judge system, and find the key features that are more sufficient to evaluate students’ programming ability.
- Verify whether the key feature model we found can be related to the course scores and whether it can be applied to different courses in online judge system.
3.2. Data
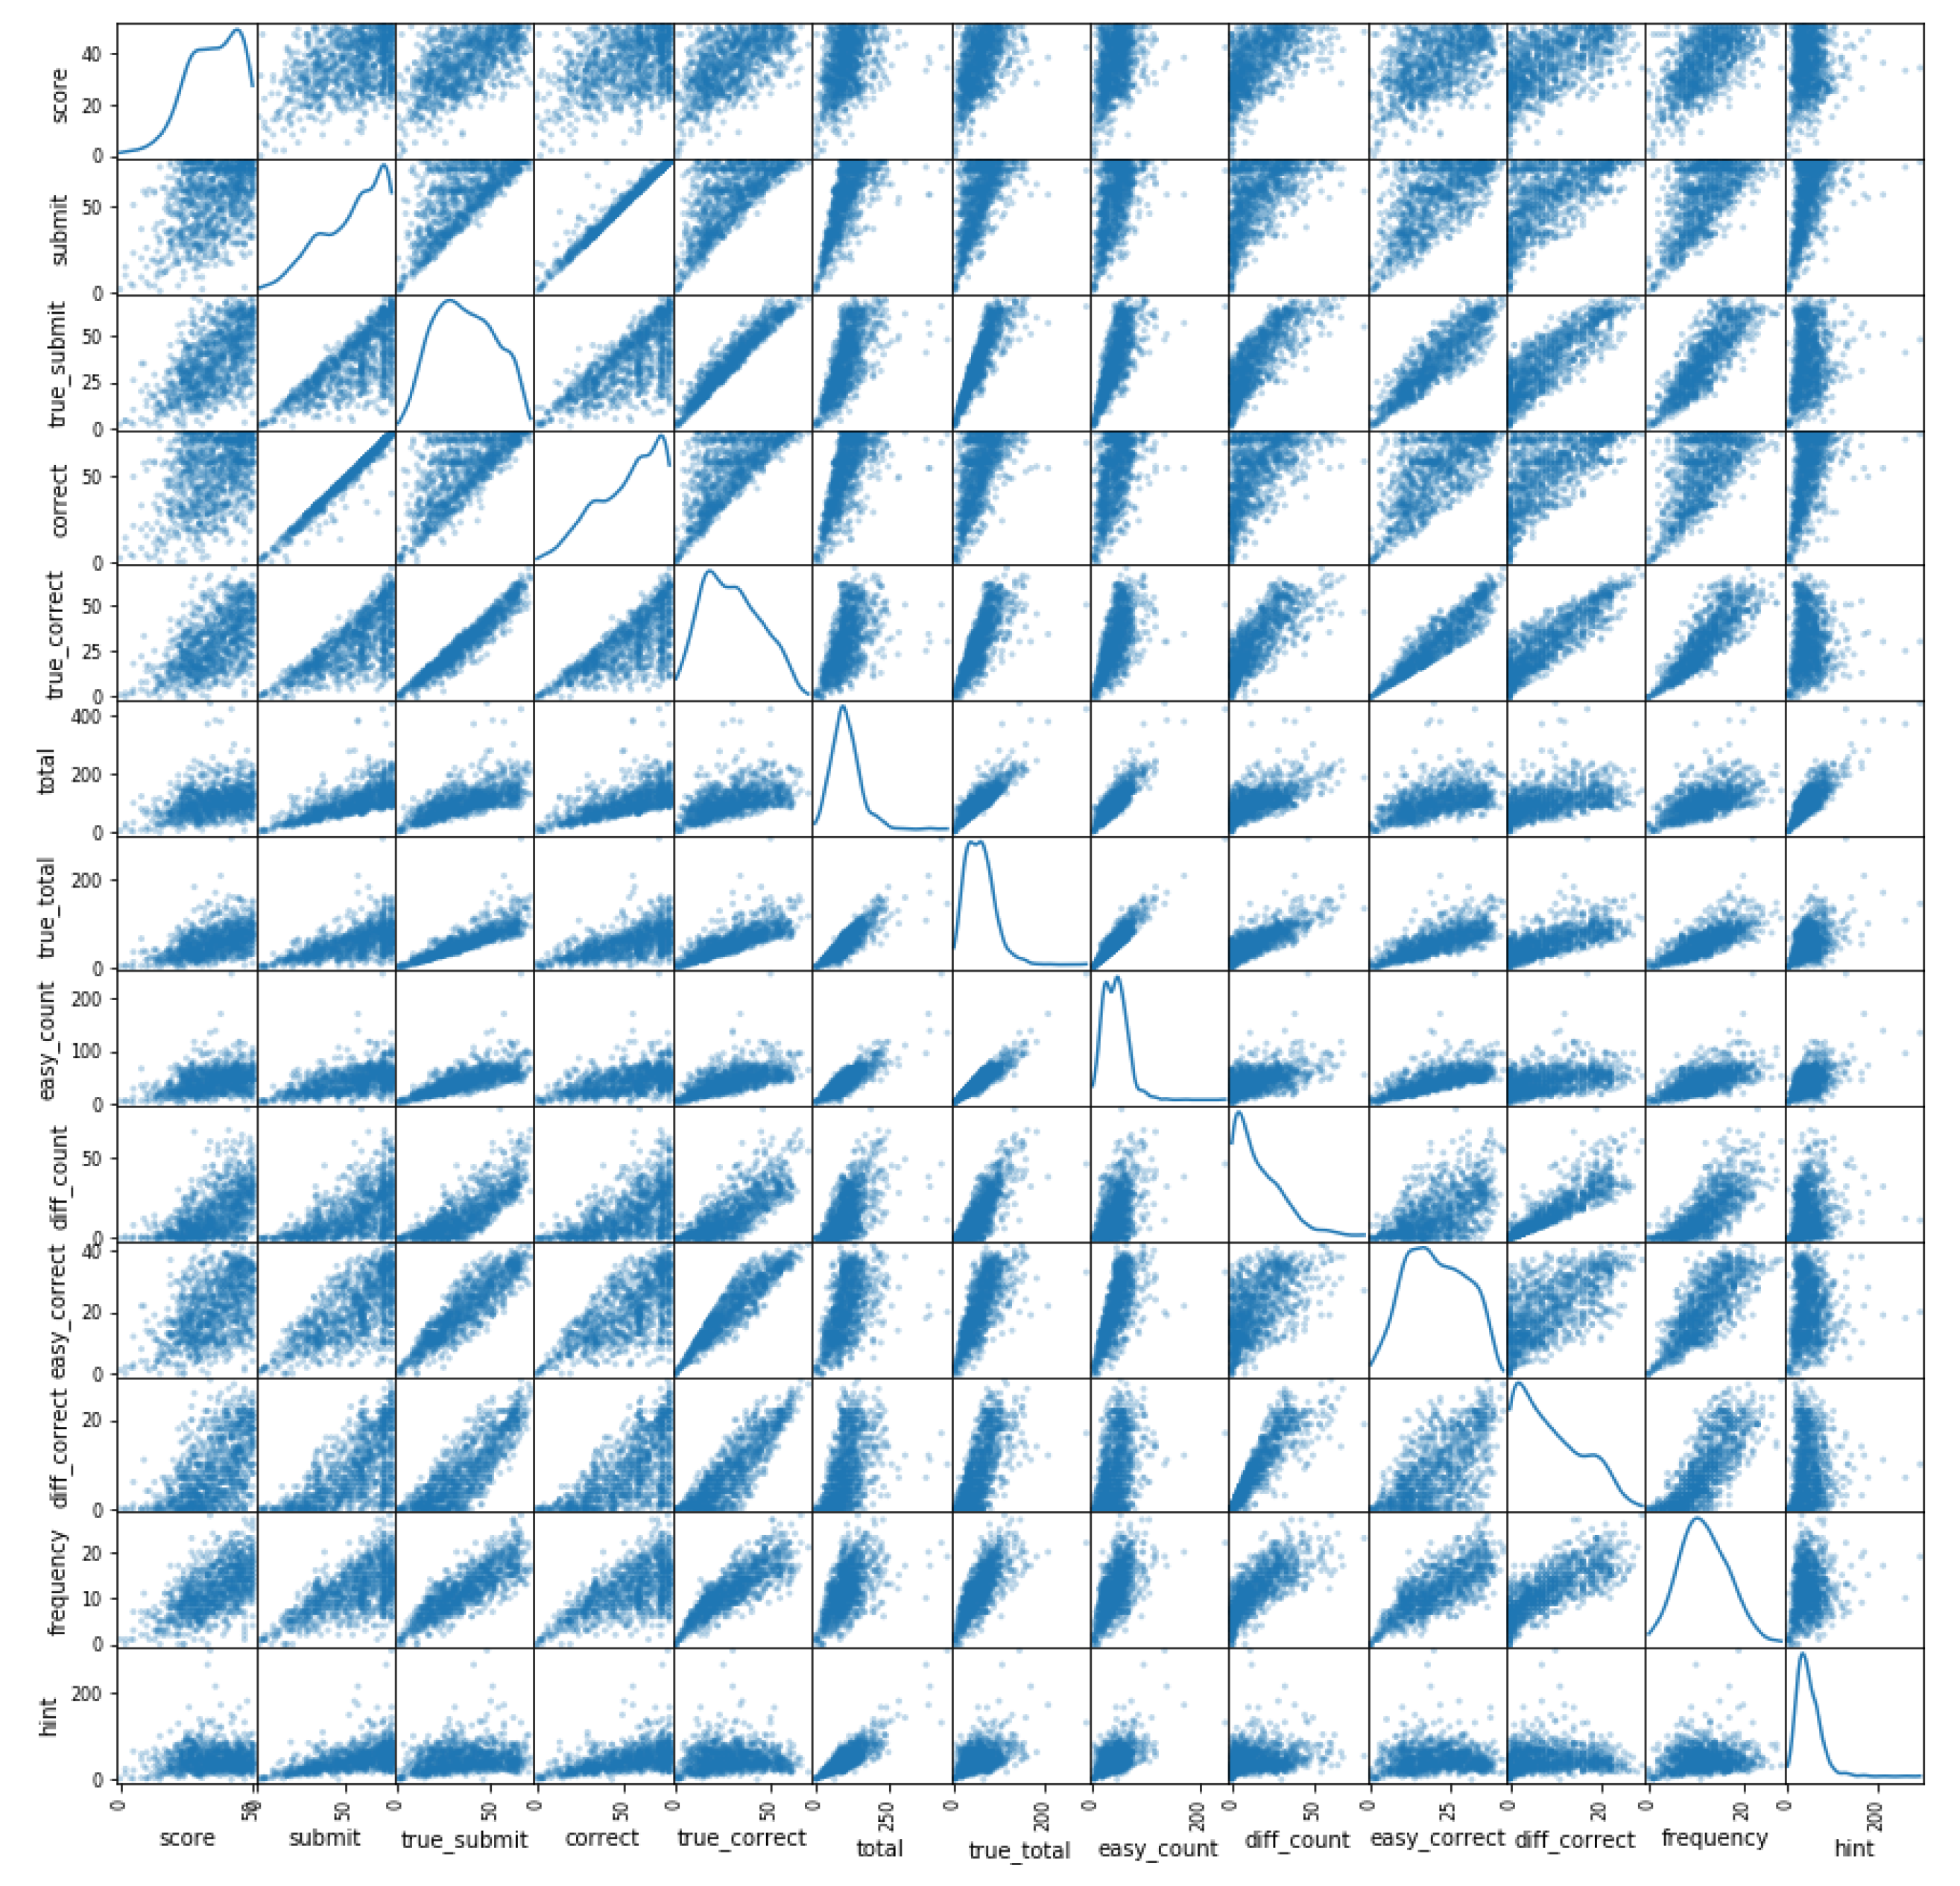
The data for this study are from the log data of first-year C programming course students using online judge system. Table 2 shows the detailed statistical data. The explanation of these data is given in Table 3. The definition of hint is that when a student is unable to solve the problem by himself, he or she chooses to ask for help from others. We detect whether help is requested by comparing the code similarity of the two students. All these data come from 1043 students enrolled in the course. Figure 1 shows the dispersion matrix of the data. The graph depicts the correlation between each pair of features.It can be seen from the figure that these features are highly correlated.
3.3. Factor Analysis
In order to solve our first research problem, that is, to identify the potential variable structure, we used exploratory factor analysis on the data and established an exploratory factor analysis model based on the characteristics in Table 3. The model is as follows:
where is an -dimensional random vector composed of n original variables, is a common factor matrix composed of m factors, is an -dimensional factor load matrix, and is an -dimensional special factor matrix or residual matrix. Therefore, the model can be written as:
We have the following assumptions about the model:
- The special factors are independent of each other.
- The expectation of the special factor is 0, and the variance is , that is, .
- The special factor is independent of the common factor .
- The common factors are independent of each other.
- The expectation of the common factor is 0, the variance is 1, that is, .
Based on model (2) and model assumptions, we can obtain the covariance matrix ∑ of , as follows:
where is the factor load matrix, . The eigenvalue of ∑ and the corresponding eigenvector can be solved by Formula (2). Therefore, the covariance matrix ∑ can also be expressed as:
Thus, the estimated value of the -th factor load can be obtained. Where, represents the i-th characteristic value, represents the j-th component of the i-th characteristic vector corresponding to , and represents the degree of influence of the j-th factor on the i-th original variable.
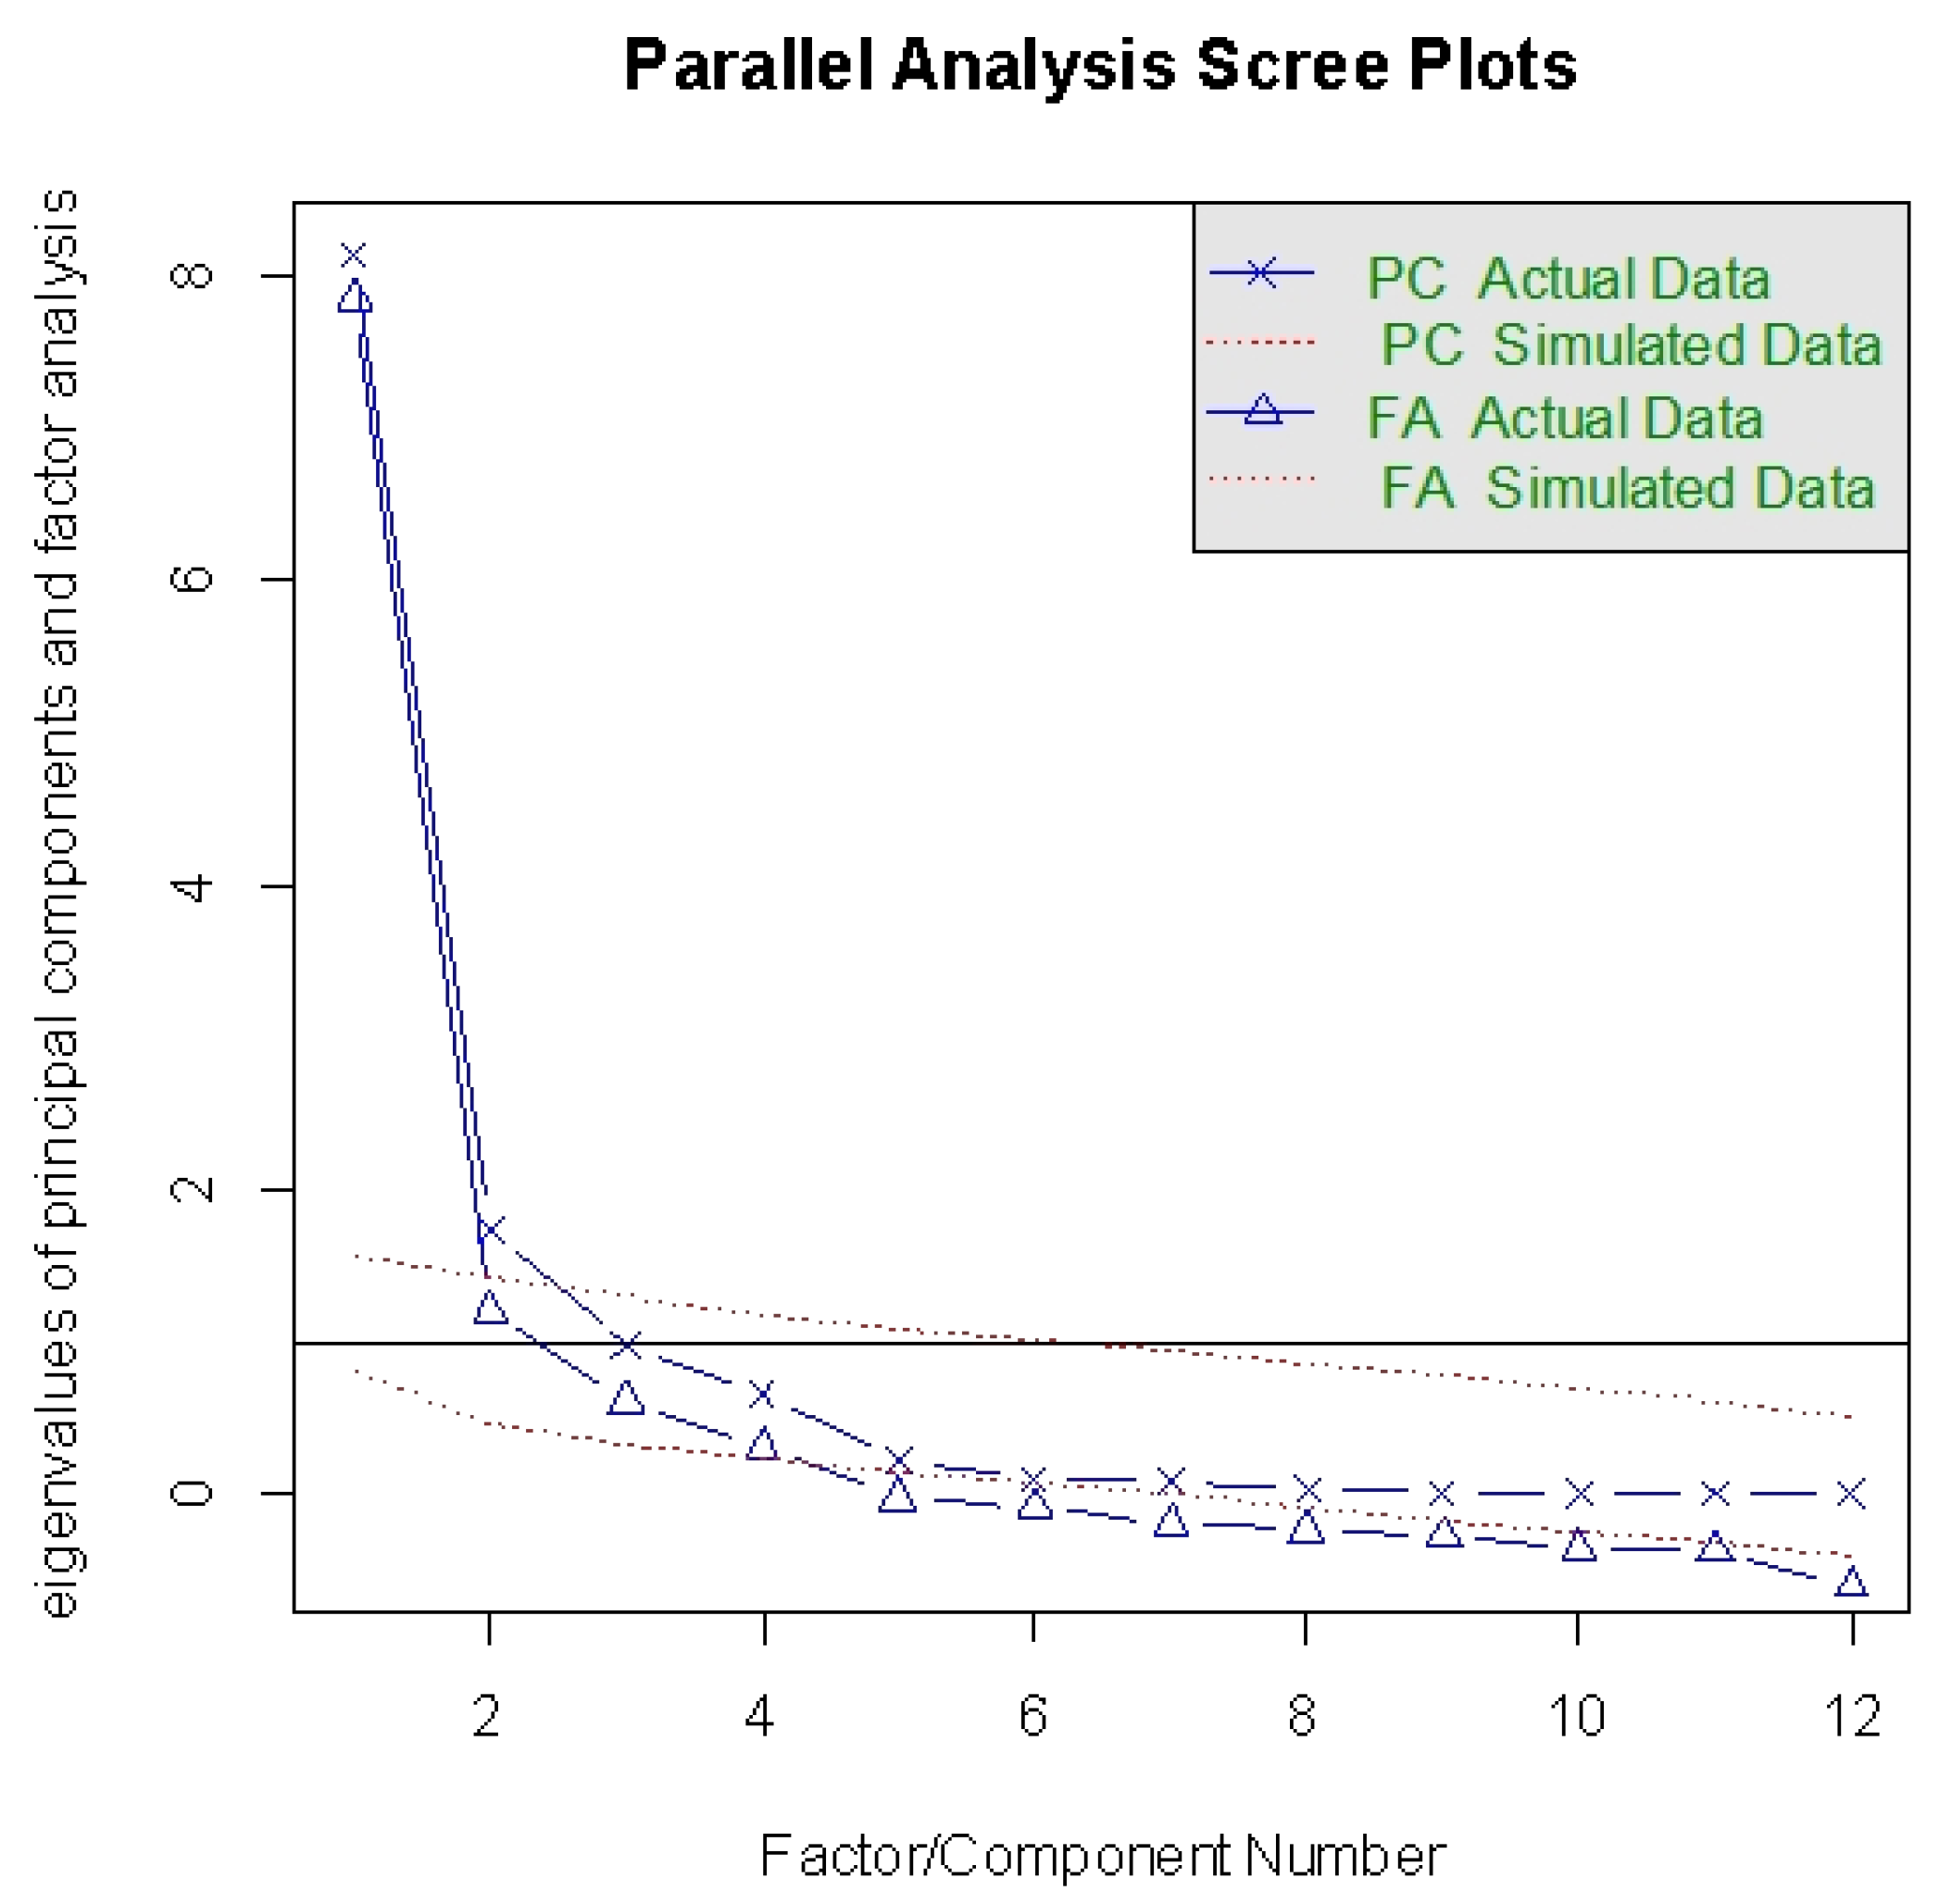
After the model is established, the key problem is to extract common factors. In order to preserve the variance caused by common factors and the variance caused by special factors, we used the principal axis factor method to extract common factors. In the process of extracting common factors, it is very important to decide how many factors to keep. We used scree plot test to determine the number of reserved factors. In order to study the potential factors that affect the original variables and make these factors have clearer explanatory significance, it is also necessary to rotate the model by factors. Considering the correlation between various factors, we used oblique rotations in determining the factor model. At this time, by calculating the model, we got a factor pattern load matrix that identifies the potential variable structures in all features, and these common factors can explain almost all the differences of the original features. All of the above methods are analyzed by using R’s Psych package [21,22].
3.4. Verify the Effect of the Model
In factor analysis, we found a variable model to analyze the level of students’ participation in online judge system programming. In order to verify the effectiveness of the model in relevant courses, we have established a student classification model using the deep neural network. The criteria for classification come from the scores students get in the final examination. The teacher divided the students into three categories according to their examination scores. The first category is students with risks, i.e., students with weak programming ability, whose scores are far lower than those of other students. The second category is students who master basic programming knowledge and can solve simple problems. They can solve moderately difficult problems in exams. The third category is students who are familiar with programming knowledge and can solve most problems.
The input layer of the deep neural network we established consists of four neurons, and the four features obtained through factor analysis are used as input vectors. The hidden layer has two layers with 5 and 6 neurons respectively. Then there is the output layer, which consists of 3 neurons, corresponding to the number of categories of target variables. Finally, create a softmax function output layer to solve the multi-classification problem. The structure of the network is shown in Figure 2. We divided the data set of C language course into training set and test set according to the ratio of 7:3 for cross-validation. In order to solve the convergence speed of the algorithm, a cross entropy loss function is used in the network.
First of all, we used the feature model obtained from the previous factor analysis to train and verify the deep neural network on the C language programming course data set, and used the area under the curve (AUC) and accuracy to evaluate the classification effect of the model. The greater the AUC value, the stronger the robustness of the model to classification. The greater the accuracy value, the more accurate the classification result. Then, we transferred the trained model to another C++ language programming course for verification to verify the invariance of the model, that is, to verify the effectiveness of the model in different courses. We used the model-based transfer learning method to share the trained model parameters with the new target domain. Use all data set records of the C++ course as test sets. The classification results of the final examination scores of the C++ language programming course are used as labels to verify the classification results of the neural network. The two courses we had chosen are those that use the same online judge system for programming exercises, so the characteristics of the two courses remain unchanged. AUC and accuracy are still used for evaluation.
Considering that our teaching method is a combination of online judge system and offline teaching, we have designed comparative experiments of different classes to verify whether different teaching methods will affect the identification of models. We used SCFH model to classify students of three different majors in C language course, including mechanical major, material major and biology major. The three majors are all non-computer majors and adopt the learning method of combining online judge system with offline courses, using the same learning materials. Different majors have different teachers, and each teacher has different teaching methods and strategies. In order to eliminate the influence of these external factors, we respectively extracted subsets of the three major students from the big data set, and observed the classification effect of SCFH model on the three data sets through experiments.
4. Results
4.1. Results of Factor Analysis
In the first research question, we used scree plot test to determine the number of retained factors. The results of this analysis are shown in Figure 3. The curve in the figure shows that this is a four-element structure. Then a factor pattern load matrix is obtained through calculation of the model, and variables with factor loads greater than 1 are deleted. Table 4 shows the load matrix of the final model factors and generates a model with 9 variables and 4 factors.
According to Equation (2), we can define the variance of the original variable as follows:
If , then:
where, is constituted by the sum of squares of the factor loads of the original variable , which represents the ratio of the variance of the common factor to the original variable . We call the common degree of the original variable , which reflects the influence of the common factor on the total difference of the original variable . can be called the special degree or residual variance of the original variable , which reflects the difference part of the original variable not considered by the common factor . As the common degree approaches 1, this means that the common factor can account for almost all the differences in the original variable .
Therefore, it can be seen from Table 4 that the four variables: easy_correct, frequency, difficult_correct, hint are the common factors of each group of factors, and these four features can explain the original twelve features. So we got a participation model extracted from the submission log data of online judge system. We described it as SCFH, and the model consists of four factors: the number of simple items that students correctly solve (Simple), the number of complex items that students correctly solve (Complex), the frequency of students accessing online judge system (Frequency) and the number of times that students ask for help (Hint). The model can be used as a tool to measure students’ programming level in online judge system.
4.2. Verify the Effect of the Model
In order to verify the validity and invariance of the model, we used the deep neural network to model. We used the four factors of SCFH model as the input features of deep neural network to classify students. The results of the classification are compared with the results given by the final examination results classification to study and verify the relationship between our variable structure and academic performance. We have also extracted a subset of student data from the big data set for mechanical, materials and biology majors, and verified the factor of lecture method on the student data sets of three different majors to determine whether our model will be affected by the lecture method. The final results are shown in Table 5. These data are obtained by classifying students in C language programming courses and C++ language programming courses using SCFH model.
The data in the table show that the AUC of SCFH model is higher than 90% in C language programming course, which indicates that our model classification effect is very stable. When SCFH model is used in C++ programming courses, the accuracy rate can still reach 84% and AUC exceeds 75%. This indicates that the classification ability of SCFH is still good and stable after transfer. By comparing the results obtained on the subset of students majoring in mechanics, materials and biology, it is found that the SCFH model effect is very close on the student data sets of three different majors, which indicates that different lecture methods will not have significant influence on the students’ programming ability. In the mode of combination of online judge system and offline teaching, students’ programming level depends more on their actual programming experience. These results mean that SCFH model can be used as a general model to classify and evaluate students’ programming level in online judge system.
5. Conclusions and Future Work
Through factor analysis, we have found a potential variable structure, which can be used as a classification evaluation model of students’ programming level in online judge system. The model includes 4 factors and 9 features. According to the factor load, a model SCFH is extracted to judge the students’ programming level. The model consists of four factors: the number of simple items that students correctly solve (Simple), the number of complex items that students correctly solve (Complex), the frequency (Frequency) that students visit online judge system and the number of times that students ask for help (Hint).
Then the SCFH model is modeled by a deep neural network to classify the students in the existing courses. The experimental results show that the student evaluation results classified by the model are basically consistent with the results classified according to the final examination results. Through the verification in another course, the results show that our model can be transformed between different courses and can be used as a general model for students’ classification in online judge system.
Although our model can express the relationship between the submitted log data and academic performance in online judge system, and classify the students’ programming level. However, we hope to explore more information that features in online judge system can represent. Therefore, our future work will study how to make this potential variable result represent more information and explore the relationship among more information.
When evaluating the validity and invariance of the model, we transferred the model, but only the structure of the model was transferred to share the parameters of the model. Nowadays, transfer learning has become an important branch of in-depth learning, and there are many methods of transfer model. Our future work will also focus on how to use transfer learning to improve the effectiveness of our model in different courses.
Author Contributions
The presented work is a result of the intellectual contribution of the whole team. The author’s contributions are as follows: Data curation, S.Y., X.J. and S.F.; Formal analysis, S.Y.; Investigation, S.Y.; Methodology, S.Y.; Project administration, B.X.; Validation, S.Y.; Writing—original draft, S.Y.; writing—review and editing, B.X., X.J. and S.F. All authors have read and agreed to the published version of the manuscript.
Funding
This research was funded by the National Natural Science Foundation of China under grant number U1811261.
Conflicts of Interest
The authors declare no conflict of interest.
References
- Revilla, M.A.; Manzoor, S.; Liu, R. Competitive learning in informatics: The uva online judge experience. Olymp. Inform. 2008, 2, 131–148. [Google Scholar]
- Yoshihashi, R.; Shimada, D.; Iyatomi, H. Feasibility study on evaluation of audience’s concentration in the classroom with deep convolutional neural networks. In 2014 IEEE International Conference on Teaching, Assessment and Learning for Engineering (TALE); IEEE: Piscataway, NJ, USA, 2014; pp. 288–292. [Google Scholar]
- Baradwaj, B.K.; Pal, S. Mining educational data to analyze students’ performance. arXiv 2012, arXiv:1201.3417. [Google Scholar]
- Pal, A.K.; Pal, S. Analysis and mining of educational data for predicting the performance of students. Int. J. Electron. Comput. Eng. 2013, 4, 1560–1565. [Google Scholar]
- Hext, J.B.; Winings, J. An automatic grading scheme for simple programming exercises. Commun. ACM 1969, 12, 272–275. [Google Scholar] [CrossRef]
- Kurnia, A.; Lim, A.; Cheang, B. Online judge. Comput. Educ. 2001, 36, 299–315. [Google Scholar] [CrossRef]
- Choy, M.; Nazir, U.; Poon, C.K.; Yu, Y.-T. Experiences in using an automated system for improving students’ learning of computer programming. In International Conference on Web-Based Learning; Springer: London, UK, 2005; pp. 267–272. [Google Scholar]
- Kaplan, A.M.; Haenlein, M. Higher education and the digital revolution: About moocs, spocs, social media, and the cookie monster. Bus. Horiz. 2016, 59, 441–450. [Google Scholar] [CrossRef]
- Yang, F.; Li, F.W. Study on student performance estimation, student progress analysis, and student potential prediction based on data mining. Comput. Educ. 2018, 123, 97–108. [Google Scholar] [CrossRef] [Green Version]
- Tabanao, E.S.; Rodrigo, M.M.T.; Jadud, M.C. Predicting at-risk novice java programmers through the analysis of online protocols. In Proceedings of the Seventh International Workshop on Computing Education Research, Providence, RI, USA, 8–9 August 2011; pp. 85–92. [Google Scholar]
- Bergin, S.; Reilly, R. Programming: factors that influence success. In Proceedings of the 36th SIGCSE Technical Symposium on Computer Science Education, St. Louis, MI, USA, 23–27 February 2005; pp. 411–415. [Google Scholar]
- Capovilla, D.; Hubwieser, P.; Shah, P. Dics-index: Predicting student performance in computer science by analyzing learning behaviors. In Proceedings of the 2016 International Conference on Learning and Teaching in Computing and Engineering (LaTICE), Mumbai, India, 31 March–3 April 2016; pp. 136–140. [Google Scholar]
- Falkner, N.J.; Falkner, K.E. A fast measure for identifying at-risk students in computer science. In Proceedings of the Ninth Annual International Conference on International Computing Education Research, New York, NY, USA, 9–11 September 2012; pp. 55–62. [Google Scholar]
- Yu, X.; Chen, W. Research on three-layer collaborative filtering recommendation for online judge. In Proceedings of the 2016 Seventh International Green and Sustainable Computing Conference (IGSC), Hangzhou, China, 7–9 November 2016; pp. 1–4. [Google Scholar]
- Francisco, R.E.; Ambrosio, A.P. Mining an online judge system to support introductory computer programming teaching. In EDM (Workshops); EDM Academy: Amsterdam, The Netherlands, 2015. [Google Scholar]
- Verdú, E.; Verdú, M.J.; Regueras, L.M.; de Castro, J.P.; García, R. A genetic fuzzy expert system for automatic question classification in a competitive learning environment. Expert Syst. Appl. 2012, 39, 7471–7478. [Google Scholar] [CrossRef]
- Zhao, W.X.; Zhang, W.; He, Y.; Xie, X.; Wen, J.-R. Automatically learning topics and difficulty levels of problems in online judge systems. ACM Trans. Inf. Syst. (TOIS) 2018, 36, 1–33. [Google Scholar] [CrossRef]
- Toledo, R.Y.; Mota, Y.C. An e-learning collaborative filtering approach to suggest problems to solve in programming online judges. Int. J. Distance Educ. Technol. (IJDET) 2014, 12, 51–65. [Google Scholar] [CrossRef]
- Yera, R.; Martínez, L. A recommendation approach for programming online judges supported by data preprocessing techniques. Appl. Intell. 2017, 47, 277–290. [Google Scholar] [CrossRef]
- Norris, M.; Lecavalier, L. Evaluating the use of exploratory factor analysis in developmental disability psychological research. J. Autism Dev. Disord. 2010, 40, 8–20. [Google Scholar] [CrossRef] [PubMed]
- Field, A.; Miles, J.; Field, Z. Discovering Statistics Using R; Sage Publications: Thousand Oaks, CA, USA, 2012. [Google Scholar]
- Revelle, W.R. Psych: Procedures for Personality and Psychological Research; Northwestern University: Evanston, IL, USA, 2017. [Google Scholar]
Figure 1.
A decentralized matrix describing the correlation between features in online programming judge systems. This figure describes the correlation between each pair of features.
Figure 1.
A decentralized matrix describing the correlation between features in online programming judge systems. This figure describes the correlation between each pair of features.

Figure 2.
The student classification model.

Figure 3.
Scree Plots of Parallel Analysis.


Table 1.
Key features considered in the study.
| Features | Description |
|---|---|
| The progress of the introductory programming course | Whether the students have studied the introductory course of programming and the progress of learning. |
| Previous programming experience | Do students have programming experience before class. |
| Gender | The gender of the student. |
| Negative attitude in programming | Whether the students have a negative attitude of giving up and depression in the programming course. |
| Mathematical background | Students’ mathematics foundation. |
| Formal training in programming | Training progress of student courses. |
| Students’ understanding of learning material difficulties | Students’ ability to understand difficult problems. |
| Students’ ability to find solutions to problems | Whether students can find the right solution. |
Table 2.
Statistical of C language course data.
| Score | Submit | True_Submit | Correct | True_Correct | Total | True_Total | Easy_Count | Difficult_Count | Easy_Correct | Difficult_Correct | Frequency | Hint | |
|---|---|---|---|---|---|---|---|---|---|---|---|---|---|
| count | 1043 | 1043 | 1043 | 1043 | 1043 | 1043 | 1043 | 1043 | 1043 | 1043 | 1043 | 1043 | 1043 |
| mean | 35.17 | 53.86 | 36.40 | 52.16 | 29.52 | 104.50 | 57.78 | 42.35 | 15.44 | 20.76 | 8.76 | 11.68 | 46.72 |
| std | 9.95 | 18.17 | 16.42 | 19.00 | 15.19 | 49.86 | 31.43 | 22.21 | 13.73 | 9.66 | 7.10 | 5.04 | 27.55 |
| min | 0.00 | 1.00 | 1.00 | 0.00 | 0.00 | 1.00 | 1.00 | 1.00 | 0.00 | 0.00 | 0.00 | 0.00 | 0.00 |
| 0.25 | 28 | 40 | 24 | 38 | 17 | 72 | 34 | 25 | 4.5 | 13 | 3 | 8 | 28 |
| 0.50 | 36 | 58 | 36 | 57 | 28 | 98 | 56 | 42 | 12 | 20 | 7 | 11 | 42 |
| 0.75 | 44 | 71 | 49 | 70 | 41 | 129 | 76 | 55 | 24 | 29 | 14 | 15 | 61 |
| max | 50 | 76 | 71 | 76 | 70 | 443 | 292 | 246 | 80 | 42 | 29 | 28 | 298 |
Table 3.
Candidate Characteristics of Factor Analysis.
| Metric | Description |
|---|---|
| Submit | Number of problems submitted by students |
| true_submit | The number of problems submitted by students without asking for a prompt |
| Correct | Number of students solving problems |
| true_correct | The number of students actually solving the problem |
| Total | Total number of submissions by students |
| true_total | The Total number of problems submitted by students without asking for a prompt |
| easy_count | Number of attempts by students to solve simple problems |
| difficult_count | Number of attempts by students to solve difficult problems |
| easy_correct | The correct number of times students solve simple problems |
| difficult_correct | The correct number of times students solve complex problems |
| Frequency | Number of times students log in to online judge system |
| Hint | Number of requests for help from students. |
Table 4.
Factor pattern load matrix obtained from exploratory factor analysis.
| PA1 | PA4 | PA2 | PA3 | |
|---|---|---|---|---|
| true_submit | 0.59 | - | - | - |
| true_correct | 0.61 | - | - | - |
| true_total | 0.57 | - | - | - |
| easy_correct | 0.9 | - | - | - |
| submit | - | - | - | 0.83 |
| correct | - | - | - | 0.75 |
| total | - | - | - | 0.81 |
| frequency | - | - | - | 0.85 |
| difficult_correct | - | 1 | - | - |
| hint | - | - | 0.96 | - |
Table 5.
Results obtained by SCFH classification.
| AUC | Accuracy | |
|---|---|---|
| SCFH(C) | 0.904 | 0.942 |
| SCFH(C++) | 0.763 | 0.837 |
| SCFH(Mechanics) | 0.886 | 0.948 |
| SCFH(Materials ) | 0.901 | 0.912 |
| SCFH(Biology) | 0.888 | 0.918 |
© 2020 by the authors. Licensee MDPI, Basel, Switzerland. This article is an open access article distributed under the terms and conditions of the Creative Commons Attribution (CC BY) license (http://creativecommons.org/licenses/by/4.0/).
Share and Cite
MDPI and ACS Style
Xu, B.; Yan, S.; Jiang, X.; Feng, S. SCFH: A Student Analysis Model to Identify Students’ Programming Levels in Online Judge Systems. Symmetry 2020, 12, 601. https://0-doi-org.brum.beds.ac.uk/10.3390/sym12040601
AMA Style
Xu B, Yan S, Jiang X, Feng S. SCFH: A Student Analysis Model to Identify Students’ Programming Levels in Online Judge Systems. Symmetry. 2020; 12(4):601. https://0-doi-org.brum.beds.ac.uk/10.3390/sym12040601
Chicago/Turabian StyleXu, Bin, Sheng Yan, Xin Jiang, and Shaoge Feng. 2020. "SCFH: A Student Analysis Model to Identify Students’ Programming Levels in Online Judge Systems" Symmetry 12, no. 4: 601. https://0-doi-org.brum.beds.ac.uk/10.3390/sym12040601
Note that from the first issue of 2016, this journal uses article numbers instead of page numbers. See further details here.