
Optimal Designs of Phononic Crystal Microstructures Considering Point and Line Defects


1
State Key Laboratory of Structural Analysis for Industrial Equipment, Dalian University of Technology, Dalian 116024, China
2
Shenyang Railway Signal Co., Ltd., Shenyang 110025, China
*
Author to whom correspondence should be addressed.
Symmetry 2021, 13(11), 1993; https://0-doi-org.brum.beds.ac.uk/10.3390/sym13111993
Submission received: 17 September 2021
/
Revised: 18 October 2021
/
Accepted: 20 October 2021
/
Published: 21 October 2021
(This article belongs to the Special Issue Topology Optimization of Aerospace Materials and Structures)
Abstract
:In this paper, a two-stage optimization strategy for designing defective unit cells of phononic crystal (PnC) to explore the localization and waveguide states for target frequencies is proposed. In the optimization model, the PnC microstructures are parametrically described by a series of hyperelliptic curves, and the optimal designs can be obtained by systematically changing the designable parameters of hyperellipse. The optimization contains two individual processes. We obtain the configurations of a perfect unit cell for different orders of band gap maximization. Subsequently, by taking advantage of the supercell technique, the defective unit cells are designed based on the unit cell configuration for different orders of band gap maximization. The finite element models show the localization and waveguide phenomenon for target frequencies and validate the effectiveness of the optimal designs numerically.
1. Introduction
Due to the band gap property of a periodic microstructure, phononic crystals (PnCs) reveal the substantial potential of regulating the propagation of sound and elastodynamic waves in some specific frequency ranges [1,2,3]. The applications of PnCs have received much attention over the past two decades, such as vibration and noise reduction [4,5], acoustic filters [6], and waveguide [7]. The compositions of PnC microstructures, including the material properties, the shapes of the scatterers, and the filling ratio, significantly affect the band gap characteristics of PnCs. It is meaningful to optimize the PnC microstructures systematically to broaden the application prospects of PnCs [8,9,10,11,12].
Optimization methods, especially topology optimization, are considered as powerful and automatic tools to develop and innovate material microstructure design [13,14,15] in various physics fields [16,17,18,19,20]. There have been a number of studies with the aim of optimizing the PnC band gap width with various types of optimization methods [21,22,23]. For instance, Sigmund and Jensen [24] optimized one-dimensional and two-dimensional band gap structures based on solid isotropic material interpolation with the topology optimization method. Hussein et al. [25] and Dong et al. [26,27] designed the unit cell of a PnC with maximum band gap with a genetic algorithm-based optimization method. Li et al. [28,29] designed a PnC band gap structure with a specified bulk or shear modulus by employing the bidirectional evolutionary structural optimization (BESO) method. Li et al. [30] designed broad phononic band gaps for in-plane modes by employing different amounts of solid and hollow scatterers based on Lloyd’s algorithm. Zhang et al. [31] carried out the robust topology optimization of PnCs with random field uncertainty. He and Kang [32] proposed a study on the topology optimization of novel material microstructural configurations to achieve directional elastic wave propagation through the maximization of partial band gaps.
The above works considered the design of single PnC unit cells, which meant that the unit cells shared the same configuration for a certain design. However, when some defects (point, line, or face defects) are introduced to a periodic microstructure, the propagation of elastodynamic wave can be altered significantly [33,34,35]. These defects can restrict the propagation of elastodynamic waves, which has aroused significant interest among researchers in the design of resonant cavities [36,37,38], energy harvesters [39,40,41], acoustic switches [42,43,44], and so on. Sigalas [45] studied the propagation of elastic waves through two-dimensional periodic composites with defect states. Kafesaki et al. [46] examined the line defect of PnCs and found that elastodynamic waves could only propagate along with the line defects. Torres et al. [47] explored the surface states and localization phenomena in linear and point defects experimentally. Romero-Garcia et al. [48] used complex band structures and multiple scattering theory to analyze the overlapping of evanescent waves localized in point defects in sonic crystals. Rostami-Dogolsara et al. [43] designed a switchable phononic crystal-based acoustic demultiplexer. Pennec et al. [49] designed a waveguide consisting of a row of hollow cylinders with different inner radii that could transport waves at two different frequencies. Dong et al. [50] designed narrow band filters for the given operating frequencies of a waveguide cavity structure in PnCs. It has a strong necessity to utilize the systematic optimization methods to design the PnC microstructures with point or line defects to regulate the propagation of elastodynamic waves [51,52,53,54].
In this study, we propose a two-stage optimization strategy for designing defective unit cells of PnC to explore the localization and waveguide states for target frequencies. The optimization process provides the particular configurations of the PnC unit cell and supercell systematically. Based on the optimized PnC microstructures, the point and line defect configurations are designed with the intention of exploring the localization and waveguide phenomenon. Firstly, the band gap optimization for a PnC microstructure is implemented based on the hyperelliptic curves. Several microstructures of different orders for band gap optimization are presented to establish the foundation for defect design. Then, based on the 3 × 3 PnC supercells, the configurations of the point defect for different frequencies are optimized and validated with numerical examples. Then, the waveguide structure can be determined by introducing the line defect to a perfect PnC. Different propagation states of elastodynamic waves can be observed in the numerical experiments. These studies show a valid and effective means to optimize and utilize the defect states in PnC microstructures.
The rest of the paper is organized as follows. Section 2 presents the dispersion analysis of PnC microstructures. Section 3 proposes several optimal designs for different orders of PnC band gap maximization. In Section 4, the point defect configurations of PnC at different target frequencies are designed and the transmission curves are calculated to explore the localization state. Section 5 shows the pass band state, the waveguide state and the forbidden band state of the elastodynamic waves within a PnC structure with a line defect. Conclusions are presented in Section 6.
2. Dispersion Analysis of PnC Microstructures
The band gap characteristics of PnCs are mainly examined by calculating the dispersion curves [24]. The dispersion curves are strongly affected by the elastic properties, shape and arrangements of the scatterers [9,10]. The PnC band gap characteristics and dispersion curves can then be tailored with appropriate choices of materials, crystal lattice, and topology of inclusions. To analyze the dispersion curves of a periodic system as PnCs, various methods, such as plane wave expansion [45], lumped mass method [21], and finite element analysis [12,31], can be introduced according to the adopted material and physics field. In this study, we employed the finite element analysis to calculate the dispersion curves due to their universality and effectiveness.
In the absence of body force, the elastodynamic wave equation in an isotropic homogenous medium is governed by:
where is the material density, is the frequency of elastodynamic wave, u is the displacement vector, and are the Lame coefficients, and is differential operator. When assuming the elastodynamic wave propagating in the x-y plane, the governing equation in Equation (1) is free from the z direction coordinates as:
where and are displacement components. The above equation can be written in discrete form by the finite element method as:
where K and M are the stiffness and mass matrix, respectively. The Bloch theorem is utilized to handle the elastodynamic wave propagation in the infinite periodic medium, and the Bloch periodic boundary condition can be written as:
where r is the space position vector, R is the translation vector, and k is the wave vector. The displacement vector is given in the complex form as:
where Re and Im represent the real and imagined part, respectively. Then, the boundary condition in Equation (5) can be rewritten as:
The dispersion curves can be obtained with the eigenvalue analysis of Equation (4) along the boundary condition in Equation (7). The wave vector k is swept along with the boundary of the first irreducible Brillouin zone.
3. Optimal Designs of PnC Microstructures for Band Gap Maximization
The optimal PnC microstructure designs for different orders of PnC band gap characteristics were demonstrated in the research of Li with the BESO method [30]. They found that the scatterers were concentrated regularly. This inspired us to employ the hyperelliptic curves to represent the shape of the scatterers. The hyperelliptic curves, also known as the Lame curves, can be expressed as:
where a and b are the semi-axis lengths, and η is the order of the hyperelliptic curves. The above expression is centered on the origin of the coordinates in the two-dimensional x-y plane. Various hyperelliptic curve clusters can be obtained when changing a, b, and η, which are shown in Figure 1. These hyperelliptic curve clusters are closed and symmetric about the x and y axes, covering a range of shapes including rhombuses, ellipses, and rectangles. Moreover, when equaling the two semi-axis lengths, circles can be formed, which are employed in the optimization process.
In this study, the orders of hyperelliptic curves η were set to range from 1 to 6. The center coordinate of the hyperelliptic curves was (x0, y0), and the parametric form of Equation (8) is expressed as:
For highly symmetric microarchitectures (such as the one-eighth symmetry), the extreme points of the dispersion curves occur on the boundary of the irreducible Brillouin zone [27]. Here, the PnC microstructure showed the one-eighth symmetry property. To maintain the symmetry structure, it is suggested to equal the semi-axis lengths of a hyperellipse, i.e., a = b. It only needs two design variables for the formation of each hyperellipse. To optimize the band gap width of the PnCs, the objective is defined as the absolute width of the mth order, which can be written as:
where k is the wave vector, and ω is the eigenfrequency of the PnCs.
The optimization formula can be expressed as:
where xi (the design variable) is the parameter of the hyperellipse, N is the number of total parameters, and and are the lower and upper bounds of the design variables, respectively.
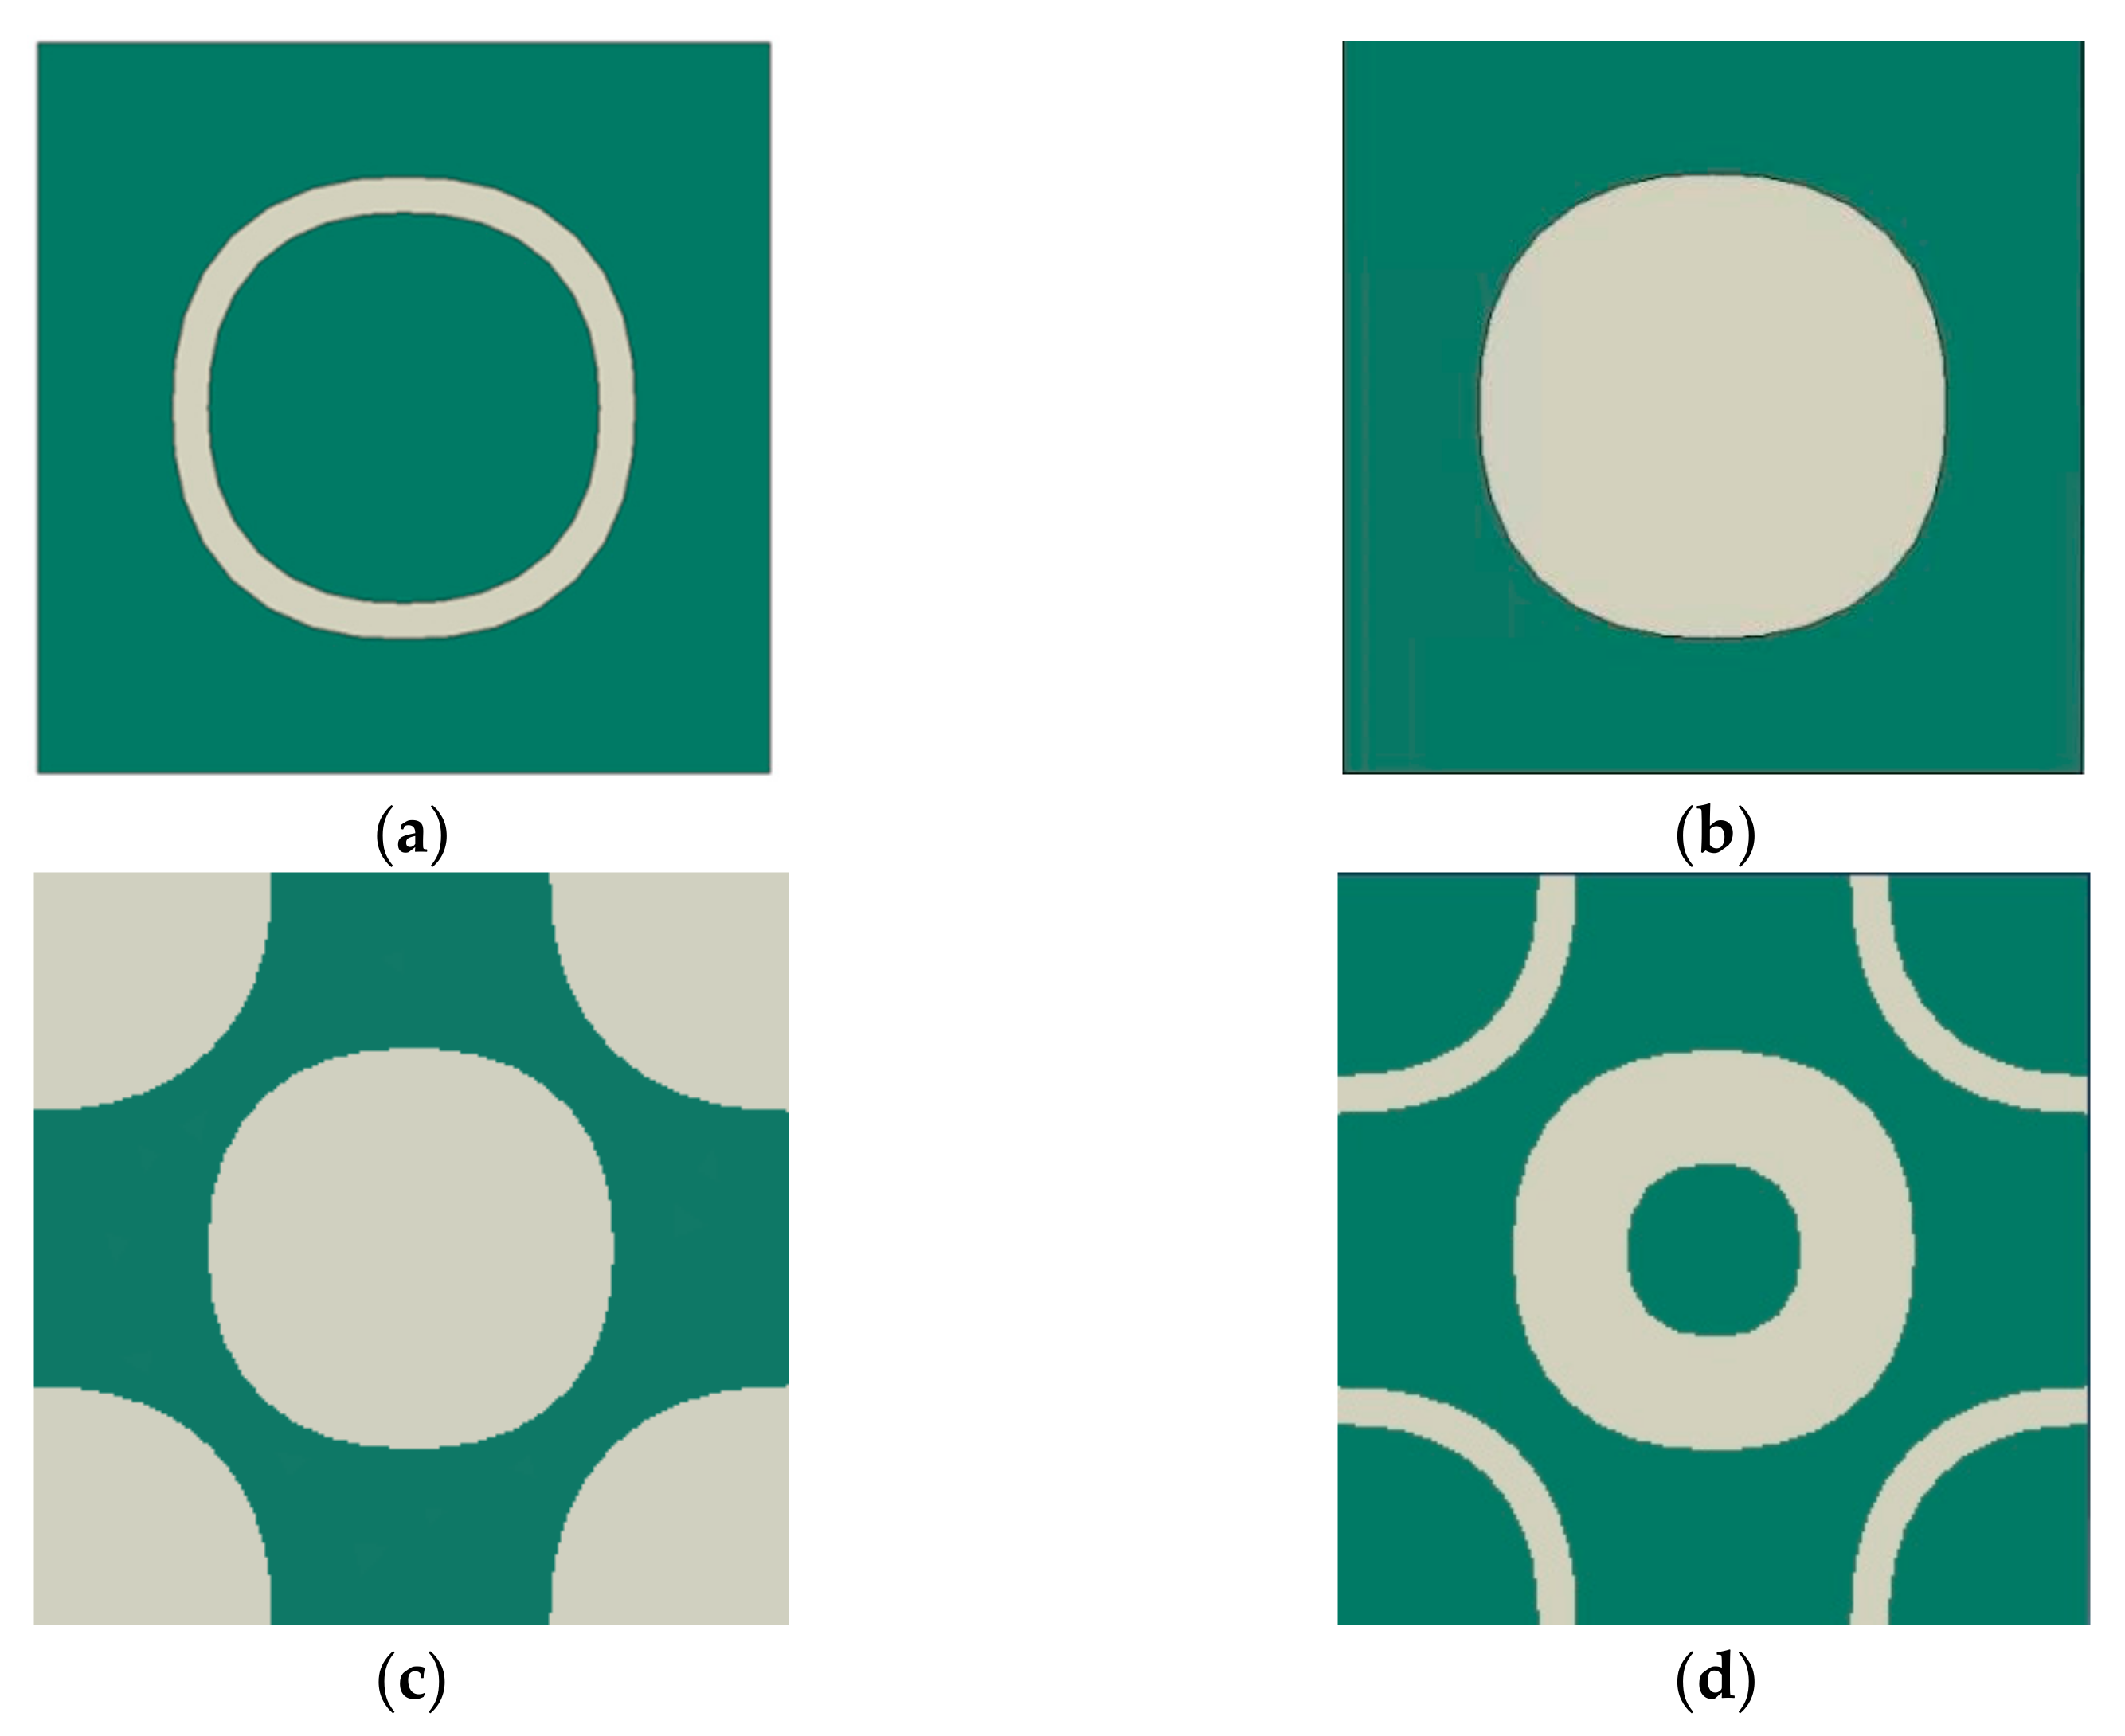
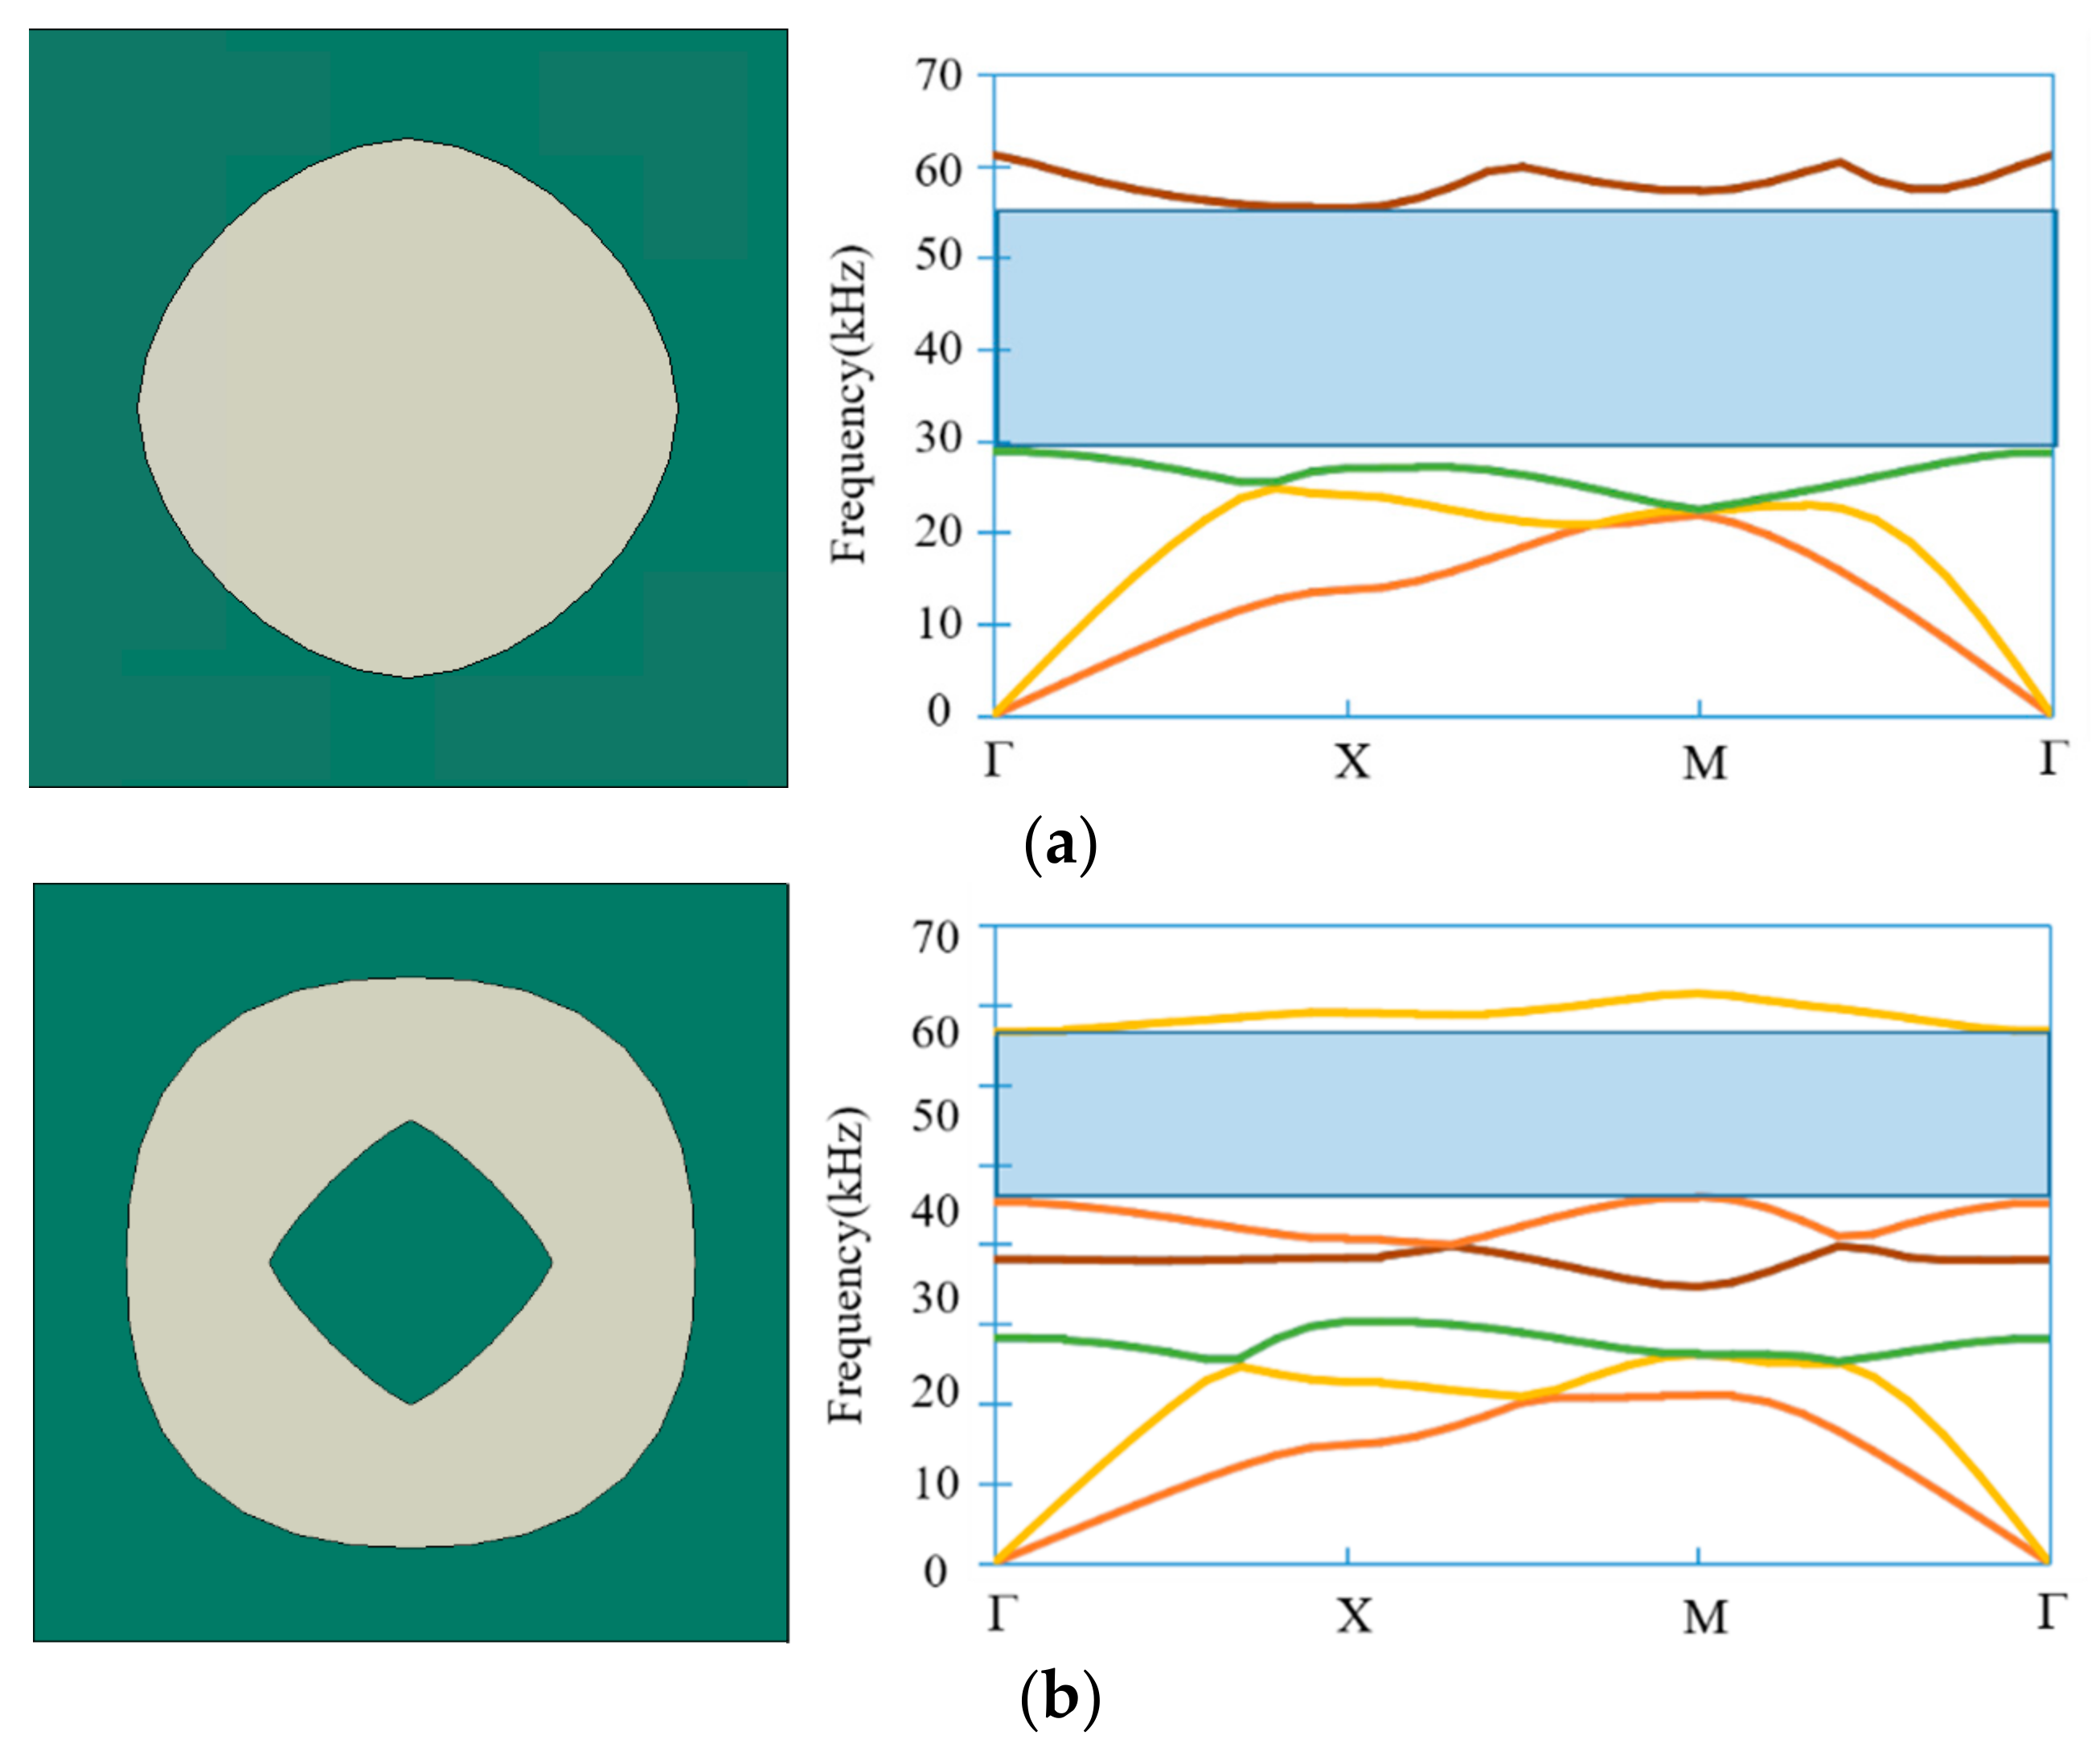
In this study, the dispersion curves of PnCs were calculated on the ABAQUS platform. To optimize the band gap of the third, fifth, sixth, and tenth orders, different initial microstructure configurations to alleviate the local optima [32] were used, as shown in Figure 2. The green part is regarded as the matrix (epoxy in this study), while the khaki part is the scatterer (plumbum in this study). The size of the unit cell is 20 mm, whenever referenced in this paper. In these initial configurations, every single hyperellipse has 40 control points for the spline curves parametrically.
The Isight software was utilized to optimize the parameters of the established hyperelliptic curve in various configurations. To reduce the convergence difficulty and the variability of the optimization problem, an evolutionary optimization strategy was adopted as the solver of the optimization problem. Based on our numerical experience, the minimal step length was set to 2% of the microstructure size, and the number of evaluations was set to 100. The optimal designs of different orders of PnCs along with their dispersion curves are shown in Figure 3.
The lower and upper band gap bounds along with the band gap widths of different orders of PnCs are compared in Table 1.
Therefore, the optimal configurations of different orders of PnC dispersion curves are obtained.
4. Optimal Designs of PnC Microstructures Considering Point Defects
It has been found that when introducing a point defect in a perfect PnC microstructure, a flat band line appears in the dispersion analysis [39,47,48]. The flat line indicates the same vibration eigenfrequency for different wavevectors, which implies that the elastodynamic wave presents the localization state. The slope of the flat line is zero, which indicates that the elastodynamic wave with a certain frequency is localized in the point defects. This phenomenon can be utilized to design energy harvesters and resonant cavities [37,39,55,56].
Based on the optimal configurations of different orders of the PnC dispersion curves obtained in Section 3, we introduce the point defect for the supercell of a PnC microstructure and optimize the geometric parameters of the point defect to alter the localized frequency so that it is close to the target frequency.
To explore the influence of the point defect, it is essential to unite multiple unit cells as one supercell. This section describes how the 3 × 3 supercell was constructed and the central cell was considered to be defective, while the other cells kept the original optimized configuration. Different frequencies were selected as the target. Table 1 shows that the frequency band gap of fifth order optimal design was [45,824 66,584] Hz, while the frequency band gap of sixth order optimal design was [39,716 77,278] Hz; therefore, an overlap frequency range [45,824 66,584] Hz was obtained. It was found that there are some overlaps in the band gap frequency ranges for the fifth and sixth order optimal designs shown in Figure 3; thus, we chose the optimal designs of the third, fifth, and tenth order obtained as described in Section 3 to proceed with the point defect design. It is noted that due to the introduction of the 3 × 3 supercell, all band orders were expanded by nine times.
In order to localize the elastic wave, a flat band line is prospective as the optimization goal because its group velocity is nearly zero. The group velocity is defined by the equation , where is the wave’s angular frequency, and is the wavevector. Therefore, the objective is proposed as:
where the function ‘abs( )’ represents the absolute value operation, arr_mean ( ) represents the mean value operation, arr_std ( ) represents the standard deviation operation that is used to describe the smoothness of a specified flat band, is the 9mth order band, ωt is the target frequency, and α is the weight coefficient. In this study, we set α = 0.01 to balance the mean value and standard deviation value in the objective function. The optimization formula can be expressed as:
where xi (the design variable) is the parameter of the point defect, N is the number of design variables, and and are the lower and upper bounds of the design variables, respectively.
For the third order optimal design of perfect PnCs, four target frequencies 36 kHz, 38 kHz, 40 kHz, and 42 kHz were selected. The optimal designs of different point defects are depicted in Figure 4.
The specific values of different designs are listed in Table 2.
We found that a flat band line appeared in the dispersion curves in the vicinity of the target frequency, which indicates that the optimization results meet the expectation. Moreover, the standard deviations (the smoothness) of the target band were relatively small, which means that the slopes of the target bands were nearly zero.
The modes of different designs are shown in Figure 5. The mode is localized in the central area where the point defect is located.
To explore the propagation feature, a finite element model with the 4-node bilinear plane strain quadrilateral element was established based on the optimal point defect design shown in Figure 6, whose total number of elements is 38,128. The design of the 40 kHz target frequency was selected as the example. The upper and lower boundaries of the model were applied by the continuous periodic boundary condition. At the left inlet of the model, a displacement excitation was applied, while the displacement response was calculated at the right outlet. In order to prevent the boundary influence, a non-reflective boundary condition was applied in the right boundary. The non-reflection boundary conditions were perfectly transparent for the propagating elastodynamic waves. The range of the excitation frequency was set to [25,70] kHz. The total CPU time was 2983.1 s. The transmission is defined as:
where T is the transmission and win and wout are the energies of the inlet and outlet, respectively. It is defined that and , where u is the displacement of the outlet, and is the displacement of the inlet.
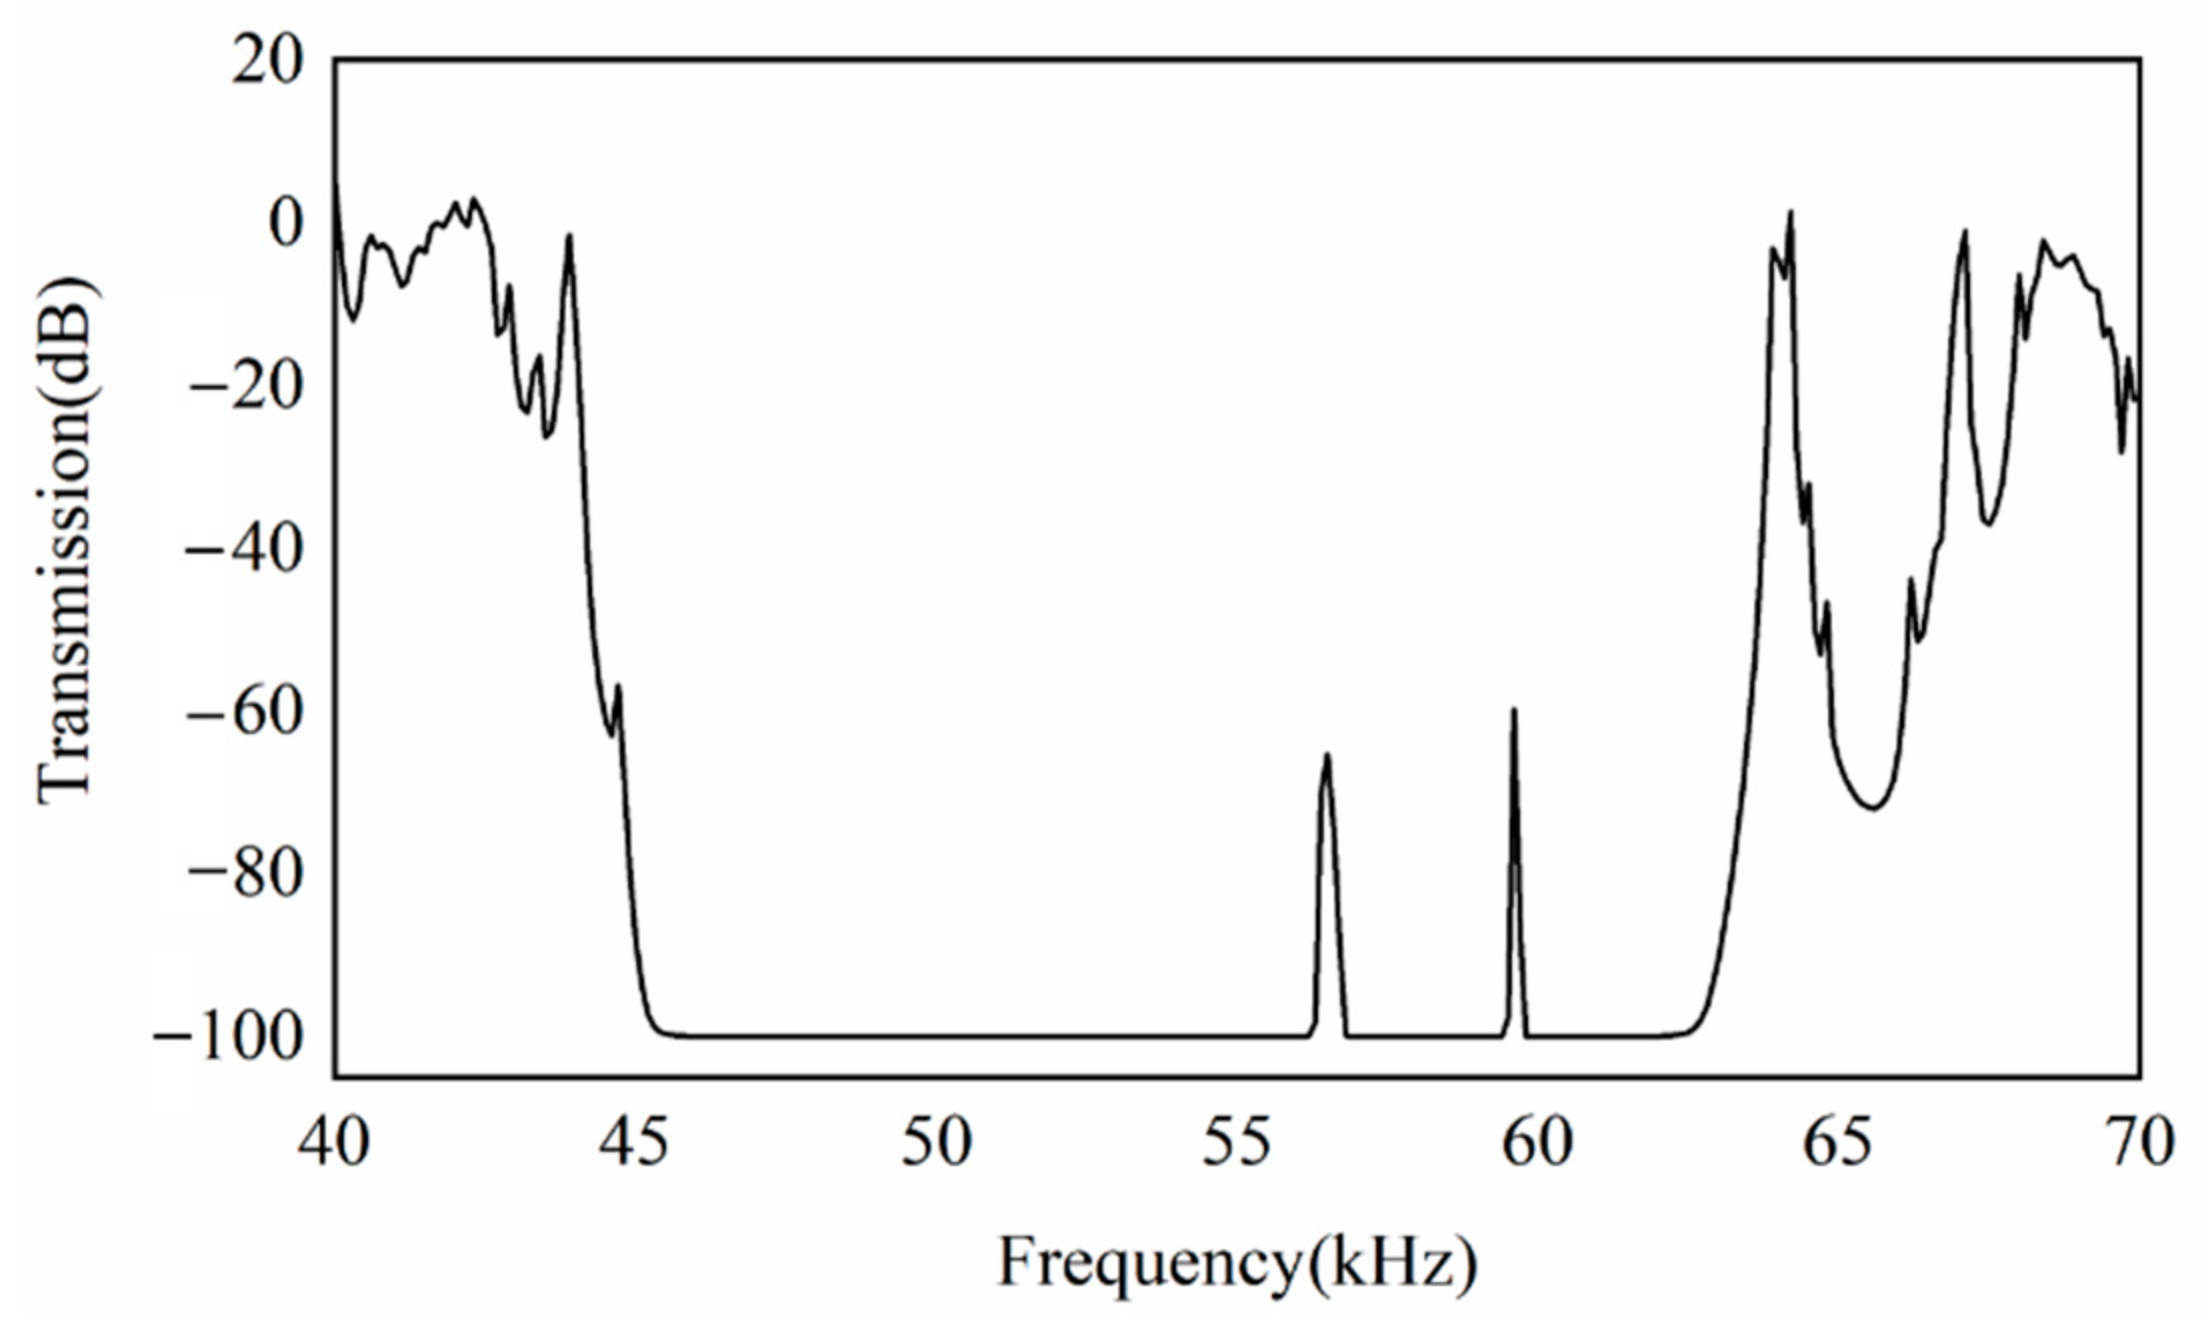
The transmission curve and the displacement field for 40 kHz are depicted in Figure 7 and Figure 8, respectively. We found that the elastodynamic wave was localized in the point defect at the target frequency of 40 kHz and could not propagate through the unit cell.
For the fifth order optimal design, 60 kHz was chosen as the target frequency. The optimal point defect and its dispersion curves are shown in Figure 9. A flat band was observed at around 60 kHz in the dispersion curve. The slope of the flat line was zero, which indicates that the elastodynamic wave was localized in the point defects.
The objective function values are listed in Table 3. The vibration mode of the supercell is displayed in Figure 10. The mode indicates that the vibration and the energy were localized in the point defect of the supercell.
The design in Figure 9 was utilized to establish the finite element model, and the excitation and boundary conditions were as the same as those in the model shown in Figure 6. The transmission curve for the design is depicted in Figure 11. The displacement field for 60 kHz is displayed in Figure 12. We found that the elastodynamic wave was localized in the point defect of the supercell. In this example, only the localization state of 60 kHz was of concern, and we did not apply constraints to other frequencies. Thus, the optimized design may contain some other localization state of different frequencies (such as the 55 kHz flat band in Figure 11).
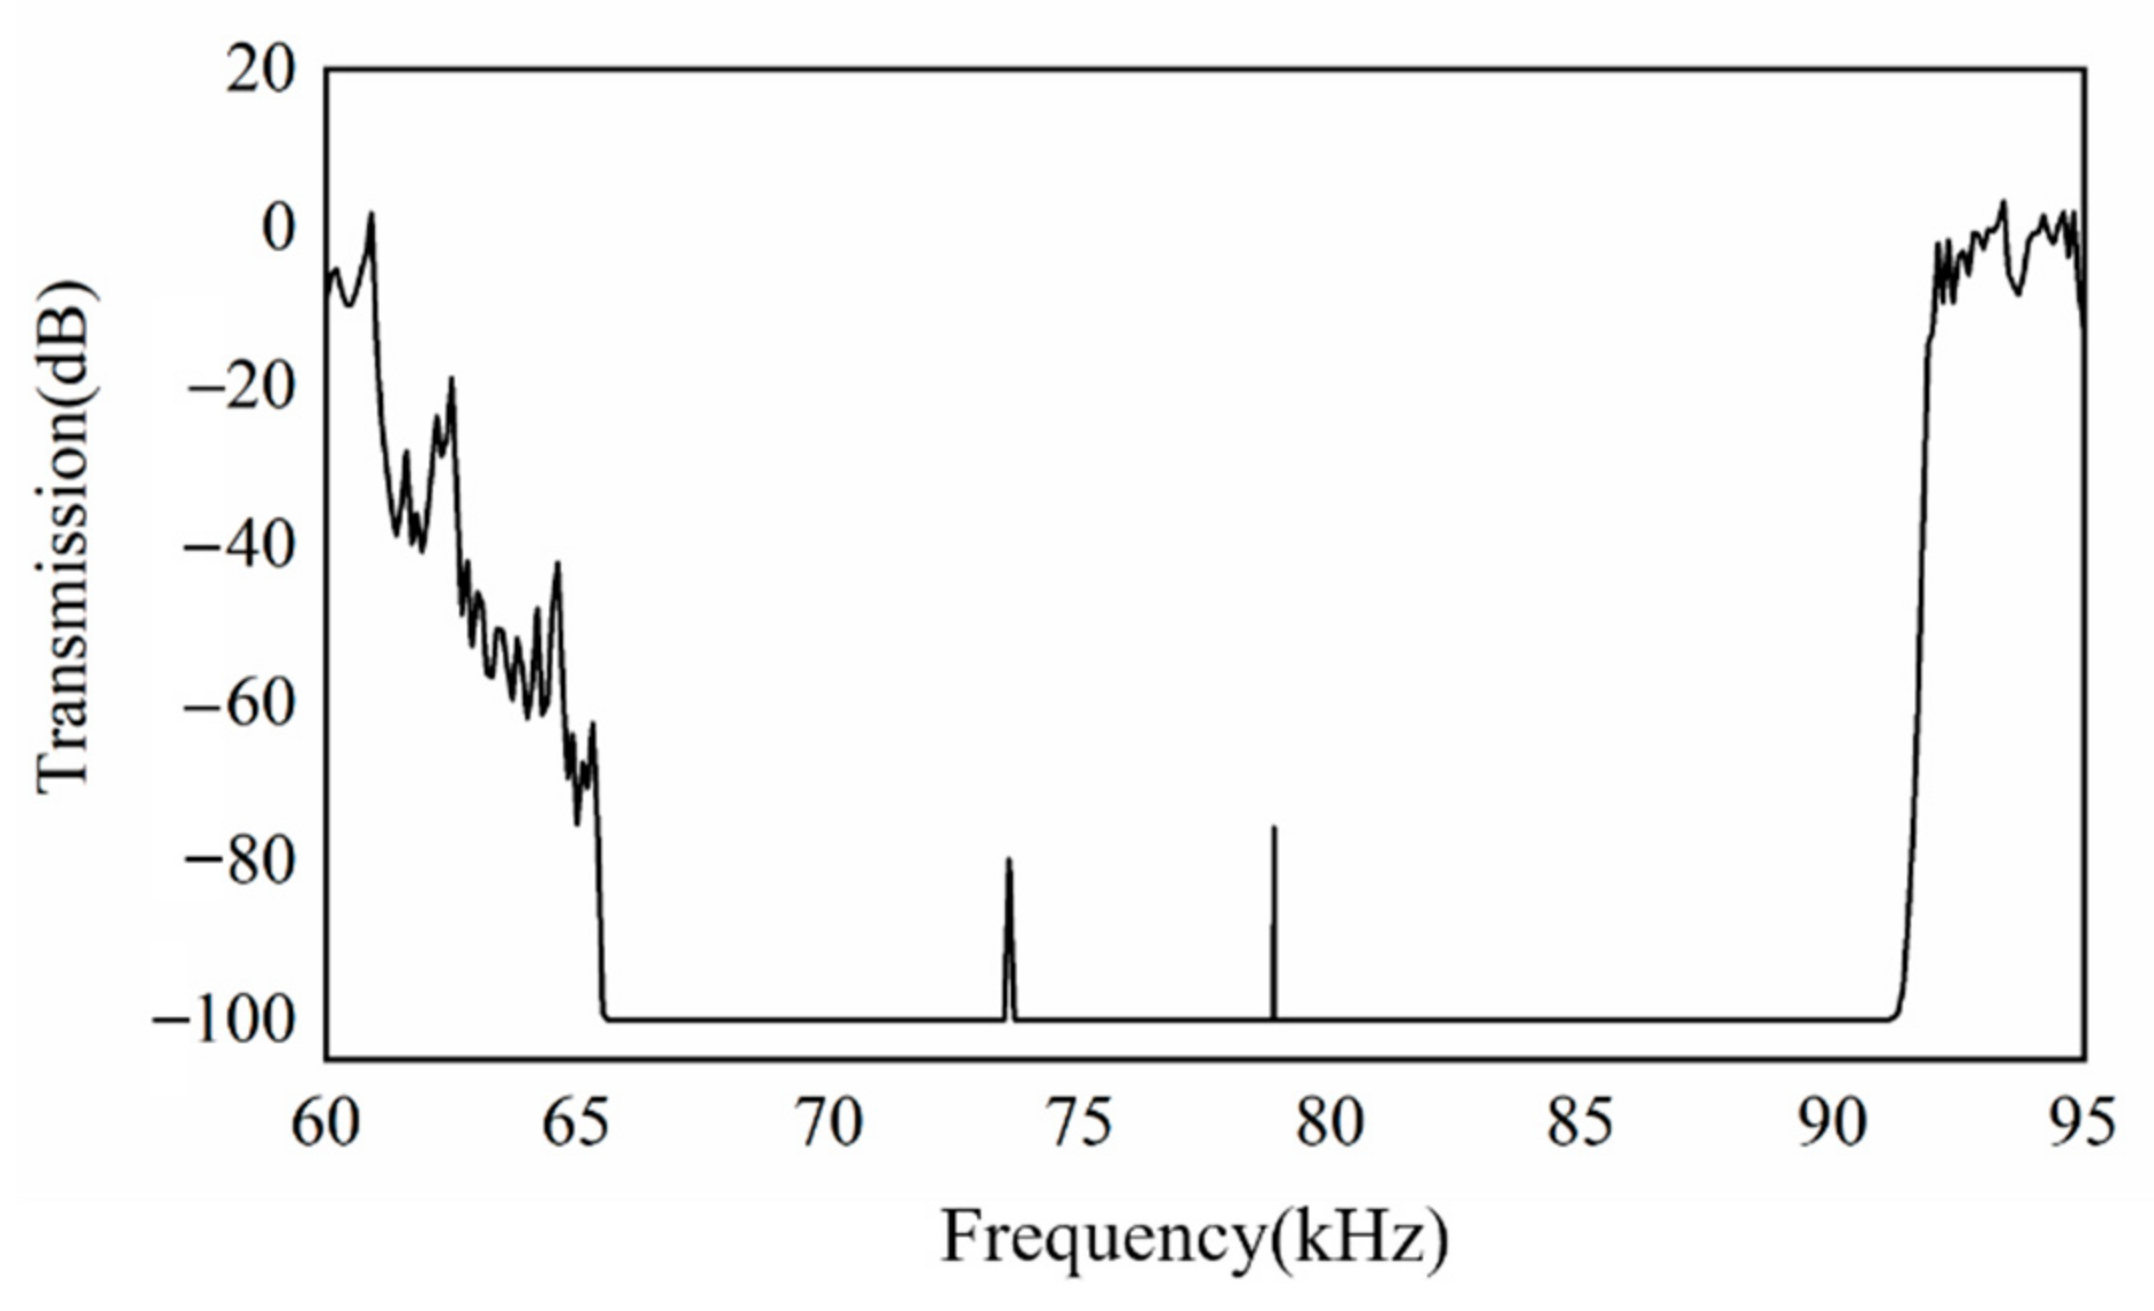
Similarly, when choosing the tenth order optimal design, shown in Figure 3, the defective supercell was designed as shown in Figure 13 with the target frequency of 80 kHz. A flat band can be observed around 80 kHz in the dispersion curve in Figure 13.
The objective function values are listed in Table 4. The vibration mode of the supercell is displayed in Figure 14. The mode indicates that the vibration and the energy were localized in the point defect of the supercell.
We built the finite element model based on the design in Figure 13 and applied the excitation and boundary conditions to the model. Then, the transmission curve for the design was obtained, as shown in Figure 15. The elastodynamic waves were also localized in the point defect of the supercell for the target frequency of 80 kHz, which can be summarized as shown in Figure 16. Similar to the example of 60 kHz, the optimal design may contain another localization state near 75 kHz.
Consequently, the localization state can be determined for different target frequencies and band orders by optimizing the point defects of a supercell.
5. Waveguide State of PnC Microstructures with Line Defects
The PnCs with line defects are mainly used to construct the waveguide structure. By changing a row of microstructures within periodic PnC cells, the PnC waveguide that are straight-type, L-type, or another type can be formed [7,49,57]. In this study, the straight-type waveguide structure was of concern.
As mentioned in Section 3, when optimizing the band gap of PnC microstructures, a closer observation of the band structure for the fifth order band gap design reveals that the band structure also contains the third order band gap. This specialty can be regarded as there being two pass bands between 30 kHz and 65 kHz. This inspired us to utilize this microstructure to design the waveguide. Based on the design shown in Figure 3, we put forward a concentric hyperellipse microstructure with inner and outer radii of 3.5 mm and 7 mm, respectively. The band structure of the microstructure in the Γ-X direction is displayed in Figure 17.
The band structure reveals that there exist two pass bands between 30,729 Hz and 63,890 Hz, whose frequencies are located in the ranges of [38,027 38,551] Hz and [41,912 46,111] Hz, respectively. By combining the designs shown in Figure 3a and Figure 17, one 5 × 1 supercell can be established. The band structure in the Γ-X direction is shown in Figure 18.
The band structure reveals that the supercell structure also contains two pass bands between 29,236 Hz and 55,465 Hz, whose frequencies are located in the ranges of [37,332 39,618] Hz and [40,061 43,253] Hz, respectively. Then, we determined the waveguide structure based on the supercell and compute the transmission along the Γ-X direction, which is shown in Figure 19.
The dispersion curves show different states for the elastodynamic wave propagation. Then, we examined three typical states of the waveguide structure, namely the pass band state, the waveguide state, and the forbidden band state. The frequencies of the three states were 25 kHz for the pass band state, 40 kHz for the waveguide state, and 50 kHz for the forbidden band state. The displacement fields can be found in Figure 20.
6. Conclusions
In this study, we investigated the design methods of PnC microstructures by utilizing a series of hyperellipses to describe the unit cell configuration. The computation of the dispersion curves and the optimization process were implemented with the combination of ABAQUS and Isight software. Several optimal designs for different orders of wide band gap PnCs were provided. Then, the configurations of the central point defect unit cell in the 3 × 3 supercell were designed to achieve the localization state for an elastodynamic wave. Subsequently, the 5 × 1 supercell structure was constructed, and the waveguide phenomenon was examined at the target frequencies. Numerical examples are presented in the paper to illustrate the effectiveness of the proposed framework. The propagation of the elastodynamic wave shows the localization and waveguide characteristics when utilizing the proposed point and line defect designs. In future work, other objectives for diverse applications may be formulated to utilize optimization methods to design different configurations for PnCs.
In this study, we assumed that the material and geometry are deterministic during the analysis and optimization process. The uncertainties of the material or geometry were not of concern. Some studies on the robust design of PnCs have been conducted [31], showing that the reliability-based and uncertainty analyses also play an important role in designing the unit cell of PnCs. This is also one of our possible future research directions.
Author Contributions
Conceptualization, J.H. and X.Z.; methodology, J.S., J.F. and X.Z.; software, J.S., J.F. and Z.J.; validation, J.S. and Z.J.; writing—original draft preparation, J.H. and X.Z.; project administration, J.F. and X.Z.; funding acquisition, J.H. and X.Z. All authors have read and agreed to the published version of the manuscript.
Funding
The support provided by the Natural Science Foundation of China (Grant 12102079) is greatly acknowledged.
Institutional Review Board Statement
Not applicable.
Informed Consent Statement
Not applicable.
Data Availability Statement
Please contact the corresponding author.
Conflicts of Interest
The authors declare no conflict of interest.
References
- Kushwaha, M.S.; Halevi, P.; Dobrzynski, L.; Djafari-Rouhani, B. Acoustic band structure of periodic elastic composites. Phys. Rev. Lett. 1993, 71, 2022. [Google Scholar] [CrossRef] [PubMed]
- Martínez-Sala, R.; Sancho, J.; Sánchez, J.V.; Gómez, V.; Llinares, J.; Meseguer, F. Sound attenuation by sculpture. Nature 1995, 378, 241. [Google Scholar] [CrossRef]
- Liu, Z.; Zhang, X.; Mao, Y.; Zhu, Y.; Yang, Z.; Chan, C.T.; Sheng, P. Locally resonant sonic materials. Science 2000, 289, 1734–1736. [Google Scholar] [CrossRef] [PubMed]
- Richards, D.; Pines, D.J. Passive reduction of gear mesh vibration using a periodic drive shaft. J. Sound Vib. 2003, 264, 317–342. [Google Scholar] [CrossRef]
- Lee, J.W.; Kim, Y.Y. Topology optimization of muffler internal partitions for improving acoustical attenuation performance. Int. J. Numer. Methods Eng. 2009, 80, 455–477. [Google Scholar] [CrossRef]
- Hirsekorn, M.; Delsanto, P.; Batra, N.; Matic, P. Modelling and simulation of acoustic wave propagation in locally resonant sonic materials. Ultrasonics 2004, 42, 231–235. [Google Scholar] [CrossRef]
- Khelif, A.; Choujaa, A.; Benchabane, S.; Djafari-Rouhani, B.; Laude, V. Guiding and bending of acoustic waves in highly confined phononic crystal waveguides. Appl. Phys. Lett. 2004, 84, 4400–4402. [Google Scholar] [CrossRef]
- Vasseur, J.O.; Deymier, P.A.; Chenni, B.; Djafari-Rouhani, B.; Dobrzynski, L.; Prevost, D. Experimental and theoretical evidence for the existence of absolute acoustic band gaps in two-dimensional solid phononic crystals. Phys. Rev. Lett. 2001, 86, 3012. [Google Scholar] [CrossRef] [Green Version]
- Jensen, J.S. Phononic band gaps and vibrations in one-and two-dimensional mass–spring structures. J. Sound Vib. 2003, 266, 1053–1078. [Google Scholar] [CrossRef]
- Kuang, W.; Hou, Z.; Liu, Y. The effects of shapes and symmetries of scatterers on the phononic band gap in 2D phononic crystals. Phys. Lett. A 2004, 332, 481–490. [Google Scholar] [CrossRef]
- Zhang, X.; Luo, Y.; Yan, Y.; Liu, P.; Kang, Z. Photonic Band Gap Material Topological Design at Specified Target Frequency. Adv. Theory Simul. 2021, 2100125. [Google Scholar] [CrossRef]
- Zhang, X.; Xing, J.; Liu, P.; Luo, Y.; Kang, Z. Realization of full and directional band gap design by non-gradient topology optimization in acoustic metamaterials. Extrem. Mech. Lett. 2021, 42, 101126. [Google Scholar] [CrossRef]
- Da, D.; Chen, J.; Cui, X.; Li, G. Design of materials using hybrid cellular automata. Struct. Multidiscip. Optim. 2017, 56, 131–137. [Google Scholar] [CrossRef]
- Da, D.; Xia, L.; Li, G.; Huang, X. Evolutionary topology optimization of continuum structures with smooth boundary representation. Struct. Multidiscip. Optim. 2018, 57, 2143–2159. [Google Scholar] [CrossRef]
- Da, D.; Qian, X. Fracture resistance design through biomimicry and topology optimization. Extrem. Mech. Lett. 2020, 40, 100890. [Google Scholar] [CrossRef]
- Luo, Y.; Bao, J. A material-field series-expansion method for topology optimization of continuum structures. Comput. Struct. 2019, 225, 106122. [Google Scholar] [CrossRef]
- Asheghi, R.; Hosseini, S.A.; Saneie, M.; Shahri, A.A. Updating the neural network sediment load models using different sensitivity analysis methods: A regional application. J. Hydroinform. 2020, 22, 562–577. [Google Scholar] [CrossRef] [Green Version]
- Jia, J.; Da, D.; Loh, C.-L.; Zhao, H.; Yin, S.; Xu, J. Multiscale topology optimization for non-uniform microstructures with hybrid cellular automata. Struct. Multidiscip. Optim. 2020, 62, 757–770. [Google Scholar] [CrossRef]
- Luo, Y.; Xing, J.; Kang, Z. Topology optimization using material-field series expansion and Kriging-based algorithm: An effective non-gradient method. Comput. Methods Appl. Mech. Eng. 2020, 364, 112966. [Google Scholar] [CrossRef]
- Da, D.; Xia, L. Design of heterogeneous mesostructures for nonseparated scales and analysis of size effects. Int. J. Numer. Methods Eng. 2021, 122, 1333–1351. [Google Scholar] [CrossRef]
- Rupp, C.J.; Evgrafov, A.; Maute, K.; Dunn, M.L. Design of phononic materials/structures for surface wave devices using topology optimization. Struct. Multidiscip. Optim. 2007, 34, 111–121. [Google Scholar] [CrossRef]
- Yi, G.; Youn, B.D. A comprehensive survey on topology optimization of phononic crystals. Struct. Multidiscip. Optim. 2016, 54, 1315–1344. [Google Scholar] [CrossRef]
- Hedayatrasa, S.; Kersemans, M.; Abhary, K.; Uddin, M.; Guest, J.K.; Van Paepegem, W. Maximizing bandgap width and in-plane stiffness of porous phononic plates for tailoring flexural guided waves: Topology optimization and experimental validation. Mech. Mater. 2017, 105, 188–203. [Google Scholar] [CrossRef] [Green Version]
- Sigmund, O.; Søndergaard Jensen, J. Systematic design of phononic band–gap materials and structures by topology optimization. Philos. Trans. R. Soc. Lond. Ser. A Math. Phys. Eng. Sci. 2003, 361, 1001–1019. [Google Scholar] [CrossRef]
- Hussein, M.I.; Hamza, K.; Hulbert, G.M.; Scott, R.A.; Saitou, K. Multiobjective evolutionary optimization of periodic layered materials for desired wave dispersion characteristics. Struct. Multidiscip. Optim. 2006, 31, 60–75. [Google Scholar] [CrossRef] [Green Version]
- Dong, H.-W.; Su, X.-X.; Wang, Y.-S. Multi-objective optimization of two-dimensional porous phononic crystals. J. Phys. D Appl. Phys. 2014, 47, 155301. [Google Scholar] [CrossRef]
- Dong, H.-W.; Su, X.-X.; Wang, Y.-S.; Zhang, C. Topological optimization of two-dimensional phononic crystals based on the finite element method and genetic algorithm. Struct. Multidiscip. Optim. 2014, 50, 593–604. [Google Scholar] [CrossRef]
- Li, Y.F.; Huang, X.; Meng, F.; Zhou, S. Evolutionary topological design for phononic band gap crystals. Struct. Multidiscip. Optim. 2016, 54, 595–617. [Google Scholar] [CrossRef]
- Li, Y.F.; Huang, X.; Zhou, S. Topological design of cellular phononic band gap crystals. Materials 2016, 9, 186. [Google Scholar] [CrossRef] [Green Version]
- Li, Y.F.; Meng, F.; Li, S.; Jia, B.; Zhou, S.; Huang, X. Designing broad phononic band gaps for in-plane modes. Phys. Lett. A 2018, 382, 679–684. [Google Scholar] [CrossRef]
- Zhang, X.; He, J.; Takezawa, A.; Kang, Z. Robust topology optimization of phononic crystals with random field uncertainty. Int. J. Numer. Methods Eng. 2018, 115, 1154–1173. [Google Scholar] [CrossRef]
- He, J.; Kang, Z. Achieving directional propagation of elastic waves via topology optimization. Ultrasonics 2018, 82, 1–10. [Google Scholar] [CrossRef]
- Christensen, J.; Fernandez-Dominguez, A.; de Leon-Perez, F.; Martin-Moreno, L.; Garcia-Vidal, F. Collimation of sound assisted by acoustic surface waves. Nat. Phys. 2007, 3, 851–852. [Google Scholar] [CrossRef]
- Thomas, E.L. Bubbly but quiet. Nature 2009, 462, 990–991. [Google Scholar] [CrossRef]
- Zigoneanu, L.; Popa, B.-I.; Cummer, S.A. Three-dimensional broadband omnidirectional acoustic ground cloak. Nat. Mater. 2014, 13, 352–355. [Google Scholar] [CrossRef] [Green Version]
- Wu, L.-Y.; Chen, L.-W.; Liu, C.-M. Acoustic energy harvesting using resonant cavity of a sonic crystal. Appl. Phys. Lett. 2009, 95, 013506. [Google Scholar] [CrossRef]
- Lucklum, R.; Ke, M.; Zubtsov, M. Two-dimensional phononic crystal sensor based on a cavity mode. Sens. Actuators B Chem. 2012, 171, 271–277. [Google Scholar] [CrossRef]
- Xie, C.; Chen, C.P.; Anada, T. 2D microwave metallic photonic crystal point-defect-cavity resonator. Microw. Opt. Technol. Lett. 2017, 59, 2547–2551. [Google Scholar] [CrossRef]
- Lv, H.; Tian, X.; Wang, M.Y.; Li, D. Vibration energy harvesting using a phononic crystal with point defect states. Appl. Phys. Lett. 2013, 102, 034103. [Google Scholar] [CrossRef] [Green Version]
- Park, C.-S.; Shin, Y.C.; Jo, S.-H.; Yoon, H.; Choi, W.; Youn, B.D.; Kim, M. Two-dimensional octagonal phononic crystals for highly dense piezoelectric energy harvesting. Nano Energy 2019, 57, 327–337. [Google Scholar] [CrossRef]
- Jo, S.-H.; Yoon, H.; Shin, Y.C.; Choi, W.; Park, C.-S.; Kim, M.; Youn, B.D. Designing a phononic crystal with a defect for energy localization and harvesting: Supercell size and defect location. Int. J. Mech. Sci. 2020, 179, 105670. [Google Scholar] [CrossRef]
- Serajmohammadi, S.; Alipour-Banaei, H.; Mehdizadeh, F. All optical decoder switch based on photonic crystal ring resonators. Opt. Quantum Electron. 2015, 47, 1109–1115. [Google Scholar] [CrossRef]
- Rostami-Dogolsara, B.; Moravvej-Farshi, M.K.; Nazari, F. Designing switchable phononic crystal-based acoustic demultiplexer. IEEE Trans. Ultrason. Ferroelectr. Freq. Control. 2016, 63, 1468–1473. [Google Scholar] [CrossRef]
- Alinejad, M.; Bahrami, A. Two-channel ultrasonic switch based on two-dimensional fluid/fluid phononic crystals with composite lattices. Phys. Scr. 2020, 96, 015702. [Google Scholar] [CrossRef]
- Sigalas, M. Elastic wave band gaps and defect states in two-dimensional composites. J. Acoust. Soc. Am. 1997, 101, 1256–1261. [Google Scholar] [CrossRef]
- Kafesaki, M.; Sigalas, M.; Garcia, N. Frequency modulation in the transmittivity of wave guides in elastic-wave band-gap materials. Phys. Rev. Lett. 2000, 85, 4044. [Google Scholar] [CrossRef] [Green Version]
- Torres, M.; De Espinosa, F.M.; Garcia-Pablos, D.; Garcia, N. Sonic band gaps in finite elastic media: Surface states and localization phenomena in linear and point defects. Phys. Rev. Lett. 1999, 82, 3054. [Google Scholar] [CrossRef]
- Romero-García, V.; Sánchez-Pérez, J.V.; Garcia-Raffi, L. Propagating and evanescent properties of double-point defects in sonic crystals. New J. Phys. 2010, 12, 083024. [Google Scholar] [CrossRef]
- Pennec, Y.; Djafari-Rouhani, B.; Vasseur, J.; Khelif, A.; Deymier, P.A. Tunable filtering and demultiplexing in phononic crystals with hollow cylinders. Phys. Rev. E 2004, 69, 046608. [Google Scholar] [CrossRef] [Green Version]
- Dong, H.-W.; Wang, Y.-S.; Zhang, C. Inverse design of high-Q wave filters in two-dimensional phononic crystals by topology optimization. Ultrasonics 2017, 76, 109–124. [Google Scholar] [CrossRef] [Green Version]
- Liu, Z.-F.; Wu, B.; He, C.-F. Systematic topology optimization of solid–solid phononic crystals for multiple separate band-gaps with different polarizations. Ultrasonics 2016, 65, 249–257. [Google Scholar] [CrossRef] [PubMed]
- Zhang, S.; Yin, J.; Zhang, H.; Chen, B. Multi-objective optimization of two-dimensional phoxonic crystals with multi-level substructure scheme. Int. J. Mod. Phys. B 2016, 30, 1650046. [Google Scholar] [CrossRef]
- Asadpoure, A.; Tootkaboni, M.; Valdevit, L. Topology optimization of multiphase architected materials for energy dissipation. Comput. Methods Appl. Mech. Eng. 2017, 325, 314–329. [Google Scholar] [CrossRef]
- De, M.; Gangwar, R.K.; Singh, V.K. Designing of highly birefringence, dispersion shifted decagonal photonic crystal fiber with low confinement loss. Photonics Nanostruct.-Fundam. Appl. 2017, 26, 15–23. [Google Scholar] [CrossRef]
- Wu, L.-Y.; Chen, L.-W.; Liu, C.-M. Experimental investigation of the acoustic pressure in cavity of a two-dimensional sonic crystal. Phys. B Condens. Matter 2009, 404, 1766–1770. [Google Scholar] [CrossRef]
- Chen, Z.; Guo, B.; Yang, Y.; Cheng, C. Metamaterials-based enhanced energy harvesting: A review. Phys. B Condens. Matter 2014, 438, 1–8. [Google Scholar] [CrossRef]
- Khelif, A.; Deymier, P.; Djafari-Rouhani, B.; Vasseur, J.; Dobrzynski, L. Two-dimensional phononic crystal with tunable narrow pass band: Application to a waveguide with selective frequency. J. Appl. Phys. 2003, 94, 1308–1311. [Google Scholar] [CrossRef] [Green Version]
Figure 1.
Hyperelliptic curve clusters with different values of η.

Figure 2.
Initial microstructure configurations for band gap optimization of different orders. (a) Third order; (b) fifth order; (c) sixth order; (d) tenth order.
Figure 2.
Initial microstructure configurations for band gap optimization of different orders. (a) Third order; (b) fifth order; (c) sixth order; (d) tenth order.

Figure 3.
Optimal designs of maximum band gap and corresponding dispersion curves. The band gap parts are marked as the shaded area. (a) Third order; (b) fifth order; (c) sixth order; (d) tenth order.
Figure 3.
Optimal designs of maximum band gap and corresponding dispersion curves. The band gap parts are marked as the shaded area. (a) Third order; (b) fifth order; (c) sixth order; (d) tenth order.


Figure 4.
Optimal designs of defective supercells and their dispersion curves: (a) 36 kHz; (b) 38 kHz; (c) 40 kHz; (d) 42 kHz.
Figure 4.
Optimal designs of defective supercells and their dispersion curves: (a) 36 kHz; (b) 38 kHz; (c) 40 kHz; (d) 42 kHz.


Figure 5.
Modes of supercell with point defect for different frequencies: (a) 36 kHz; (b) 38 kHz; (c) 40 kHz; (d) 42 kHz.
Figure 5.
Modes of supercell with point defect for different frequencies: (a) 36 kHz; (b) 38 kHz; (c) 40 kHz; (d) 42 kHz.


Figure 6.
Finite element model of elastodynamic wave propagation.

Figure 7.
Transmission curve.

Figure 8.
Displacement field for 40 kHz.

Figure 9.
Optimal design of a defective supercell and its dispersion curve for 60 kHz.

Figure 10.
Mode of a supercell with point defect for 60 kHz.

Figure 11.
Transmission curve for the designed device composed of optimized 60 kHz supercells.

Figure 12.
Displacement field for the designed device composed of optimized 60 kHz supercells.

Figure 13.
Optimal design of a defective supercell and its dispersion curve for 80 kHz.

Figure 14.
The supercell mode with point defect for 80 kHz.

Figure 15.
Transmission curve for the designed device composed of optimized 80 kHz supercells.

Figure 16.
Displacement field for the designed device composed of optimized 80 kHz supercells.

Figure 17.
Unit cell and its dispersion curves along Γ-X direction. There are two pass bands between 30 kHz and 65 kHz.
Figure 17.
Unit cell and its dispersion curves along Γ-X direction. There are two pass bands between 30 kHz and 65 kHz.

Figure 18.
Design of a defective supercell and its dispersion curves along the Γ-X direction.

Figure 19.
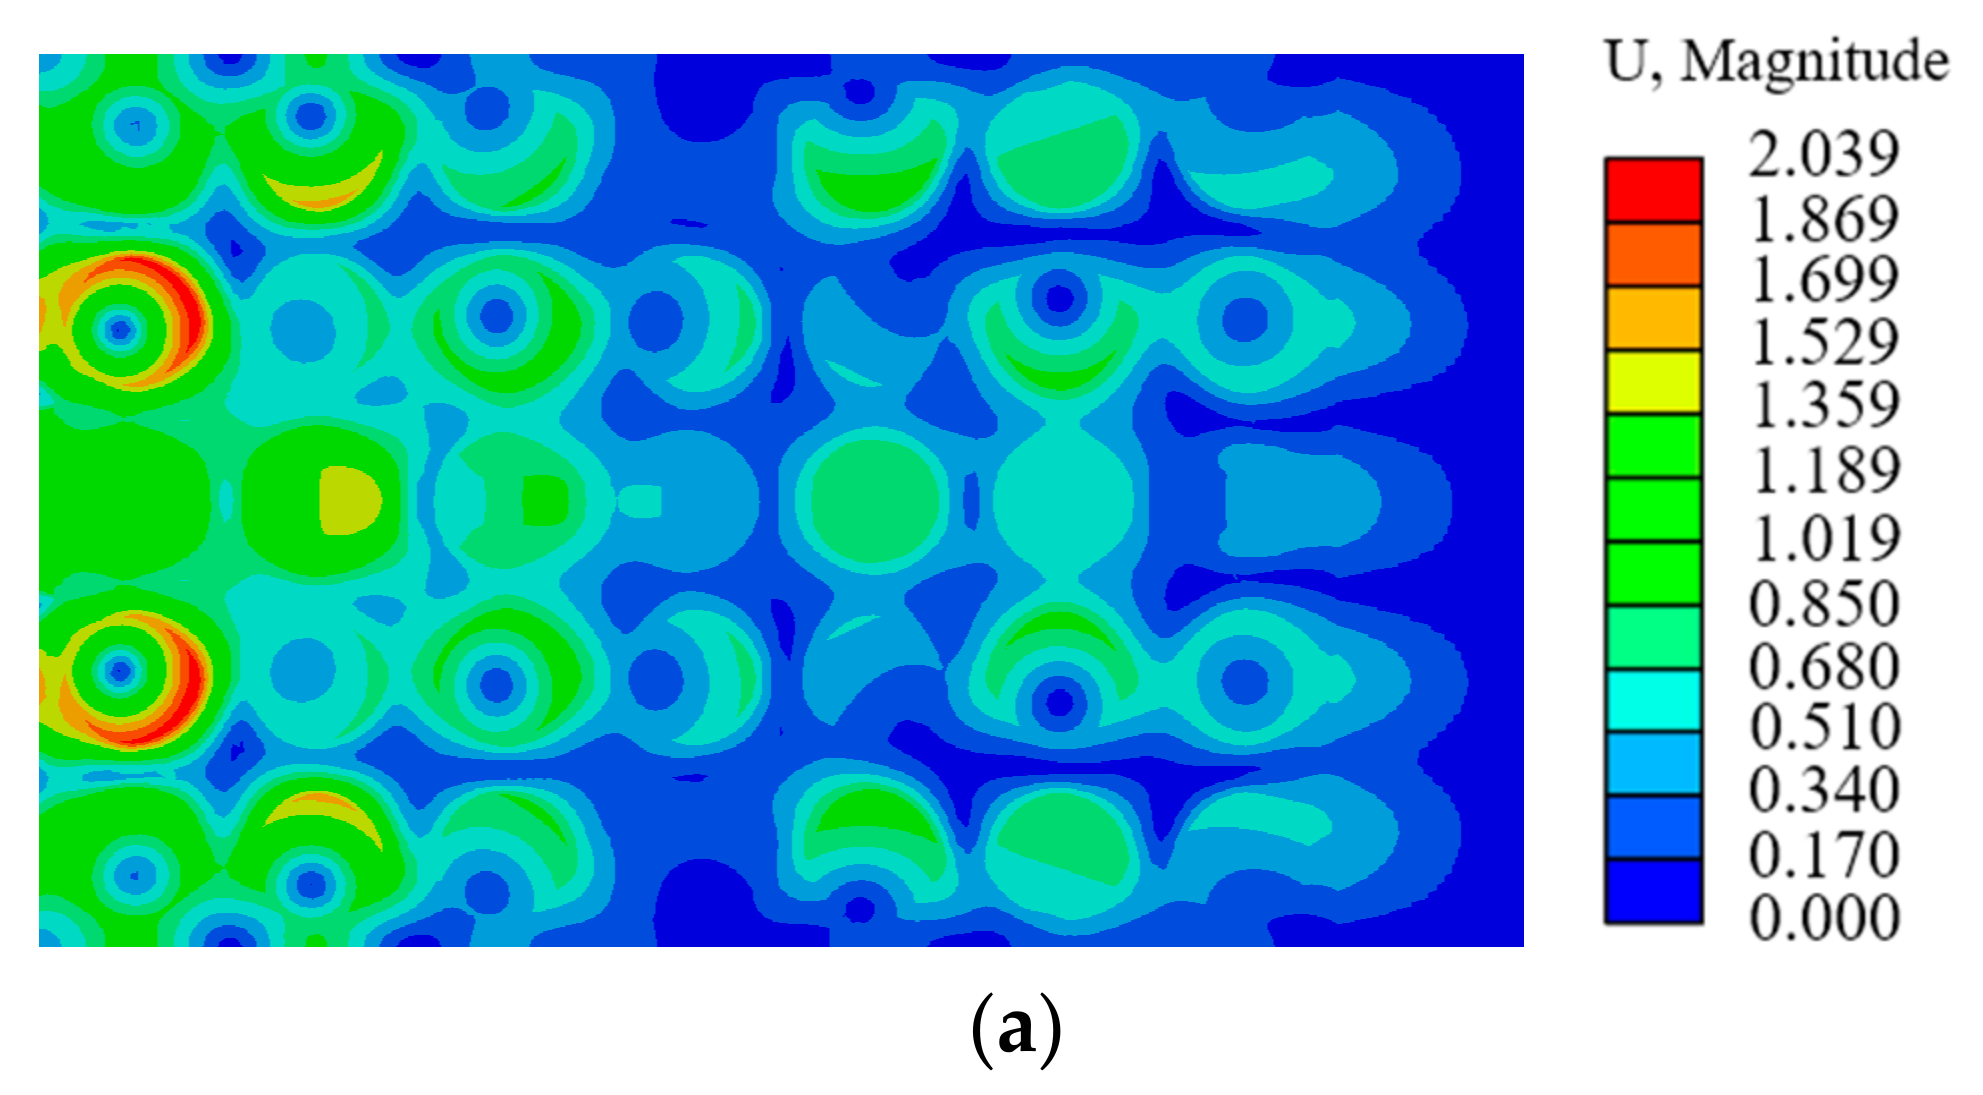
(a) Finite element model of elastodynamic wave propagation; (b) transmission curve.

Figure 20.
Three typical states of waveguide structure. (a) Pass band state for 25 kHz; (b) waveguide state for 40 kHz; (c) forbidden band state for 50 kHz.
Figure 20.
Three typical states of waveguide structure. (a) Pass band state for 25 kHz; (b) waveguide state for 40 kHz; (c) forbidden band state for 50 kHz.


Table 1.
Comparison of optimal designs of different orders. Units: Hz.
| 3rd Order | 5th Order | 6th Order | 10th Order | |
|---|---|---|---|---|
| max((k)) | 28,844 | 45,824 | 39,716 | 67,121 |
| min( (k)) | 55,343 | 66,584 | 77,278 | 93,137 |
| band gap width | 26,499 | 20,760 | 37,562 | 26,016 |
Table 2.
Comparison of optimal designs at different target frequencies. Units: Hz.
| Target Frequency | 36,000 | 38,000 | 40,000 | 42,000 |
|---|---|---|---|---|
| arr_mean () | 35,999.5 | 37,929.8 | 39,843.7 | 42,012.8 |
| arr_std () | 46.741 | 55.328 | 66.559 | 86.938 |
| fd | 0.9674 | 70.7533 | 156.9656 | 13.6694 |
Table 3.
Objective values of the optimal design. Units: Hz.
| fd | ||
|---|---|---|
| 60,039.0 | 20.146 | 39.2015 |
Table 4.
Objective values of the optimal design. Units: Hz.
| fd | ||
|---|---|---|
| 79,921.0 | 2.0626 | 79.0206 |
Publisher’s Note: MDPI stays neutral with regard to jurisdictional claims in published maps and institutional affiliations. |
© 2021 by the authors. Licensee MDPI, Basel, Switzerland. This article is an open access article distributed under the terms and conditions of the Creative Commons Attribution (CC BY) license (https://creativecommons.org/licenses/by/4.0/).
Share and Cite
MDPI and ACS Style
He, J.; Sun, J.; Fan, J.; Jia, Z.; Zhang, X. Optimal Designs of Phononic Crystal Microstructures Considering Point and Line Defects. Symmetry 2021, 13, 1993. https://0-doi-org.brum.beds.ac.uk/10.3390/sym13111993
AMA Style
He J, Sun J, Fan J, Jia Z, Zhang X. Optimal Designs of Phononic Crystal Microstructures Considering Point and Line Defects. Symmetry. 2021; 13(11):1993. https://0-doi-org.brum.beds.ac.uk/10.3390/sym13111993
Chicago/Turabian StyleHe, Jingjie, Jiamei Sun, Juncheng Fan, Zhiyuan Jia, and Xiaopeng Zhang. 2021. "Optimal Designs of Phononic Crystal Microstructures Considering Point and Line Defects" Symmetry 13, no. 11: 1993. https://0-doi-org.brum.beds.ac.uk/10.3390/sym13111993
Note that from the first issue of 2016, this journal uses article numbers instead of page numbers. See further details here.