
Feasibility Study of Using X-ray Tube and GMDH for Measuring Volume Fractions of Annular and Stratified Regimes in Three-Phase Flows

 ,
,  , , , , , and
Abstract
:1. Introduction
2. Materials and Methods
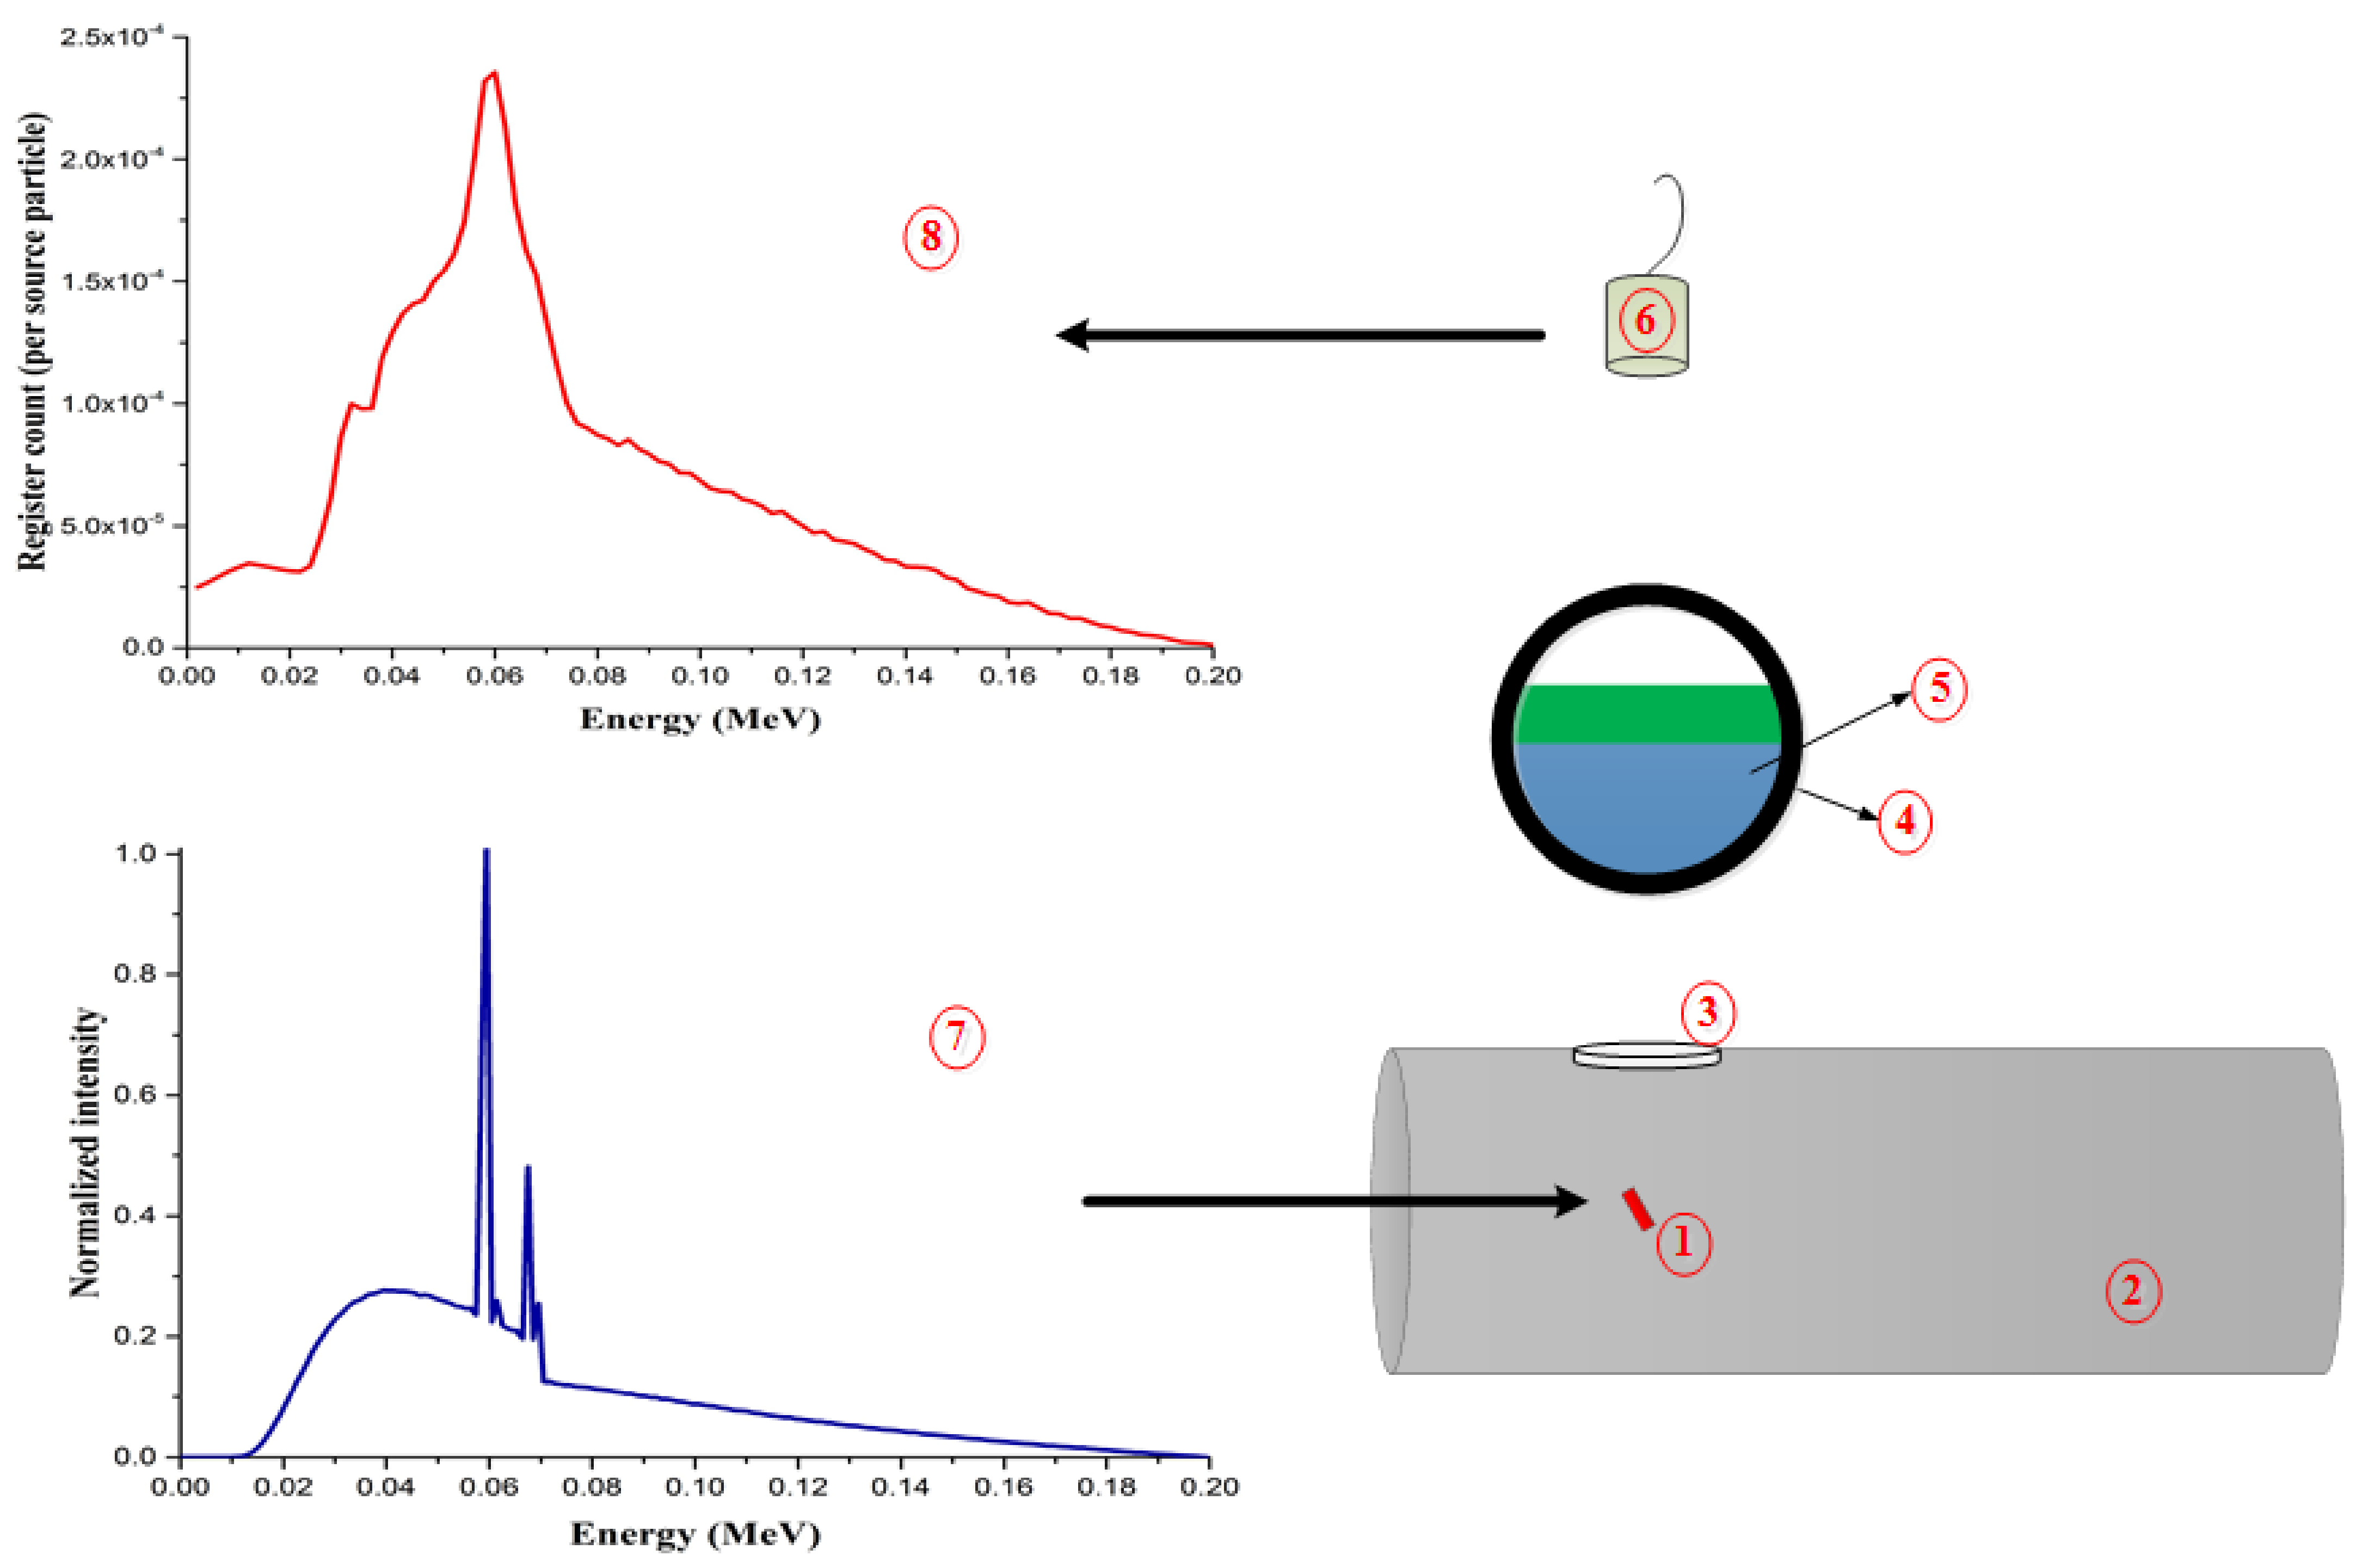
2.1. Simulation Procedure
2.1.1. Photon Source Modeling
2.1.2. Detector Modeling
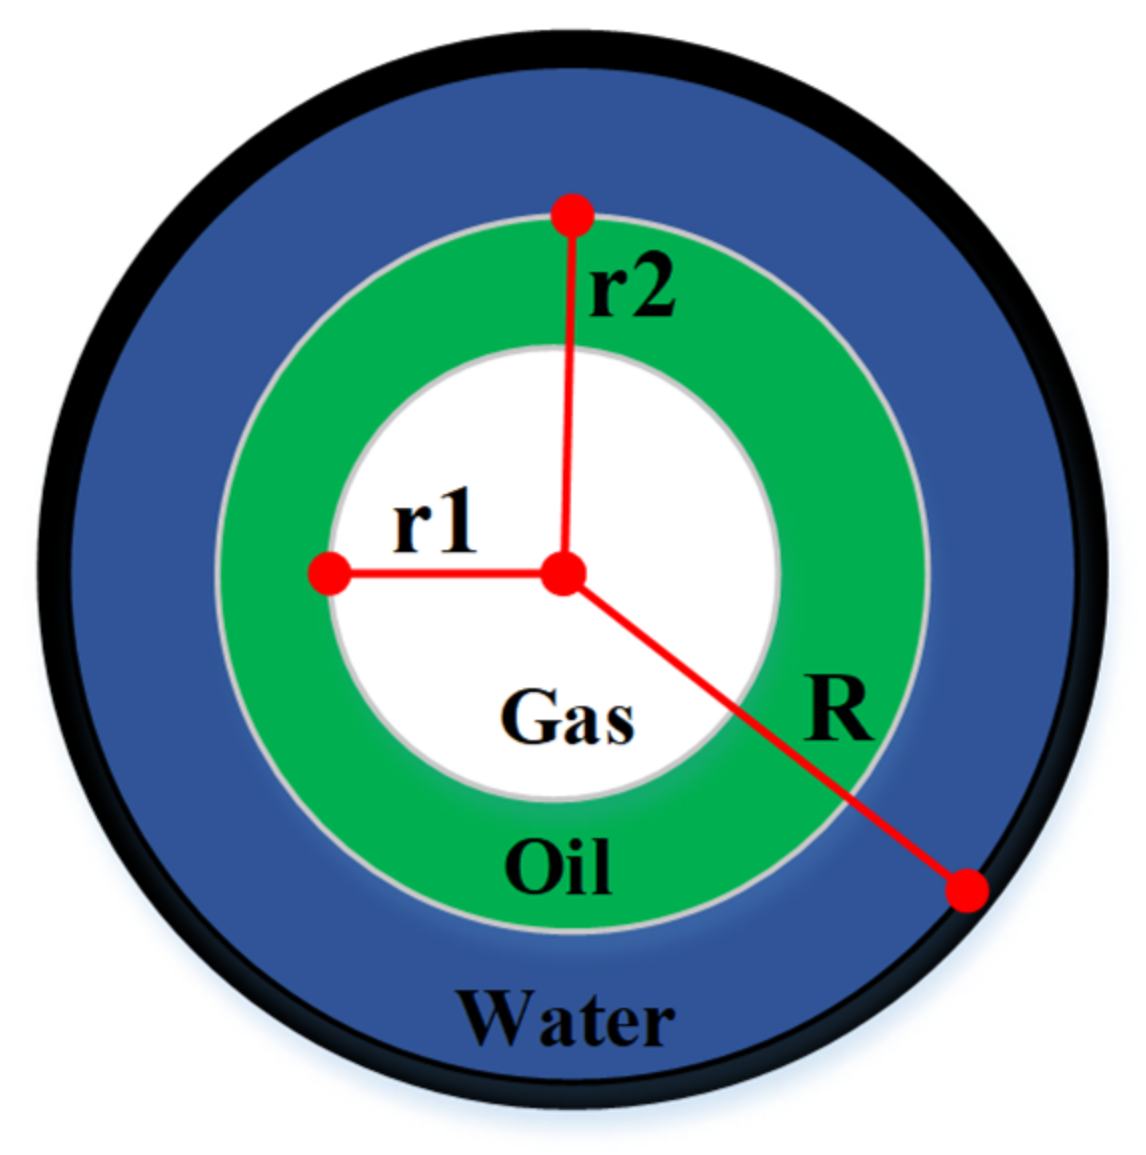
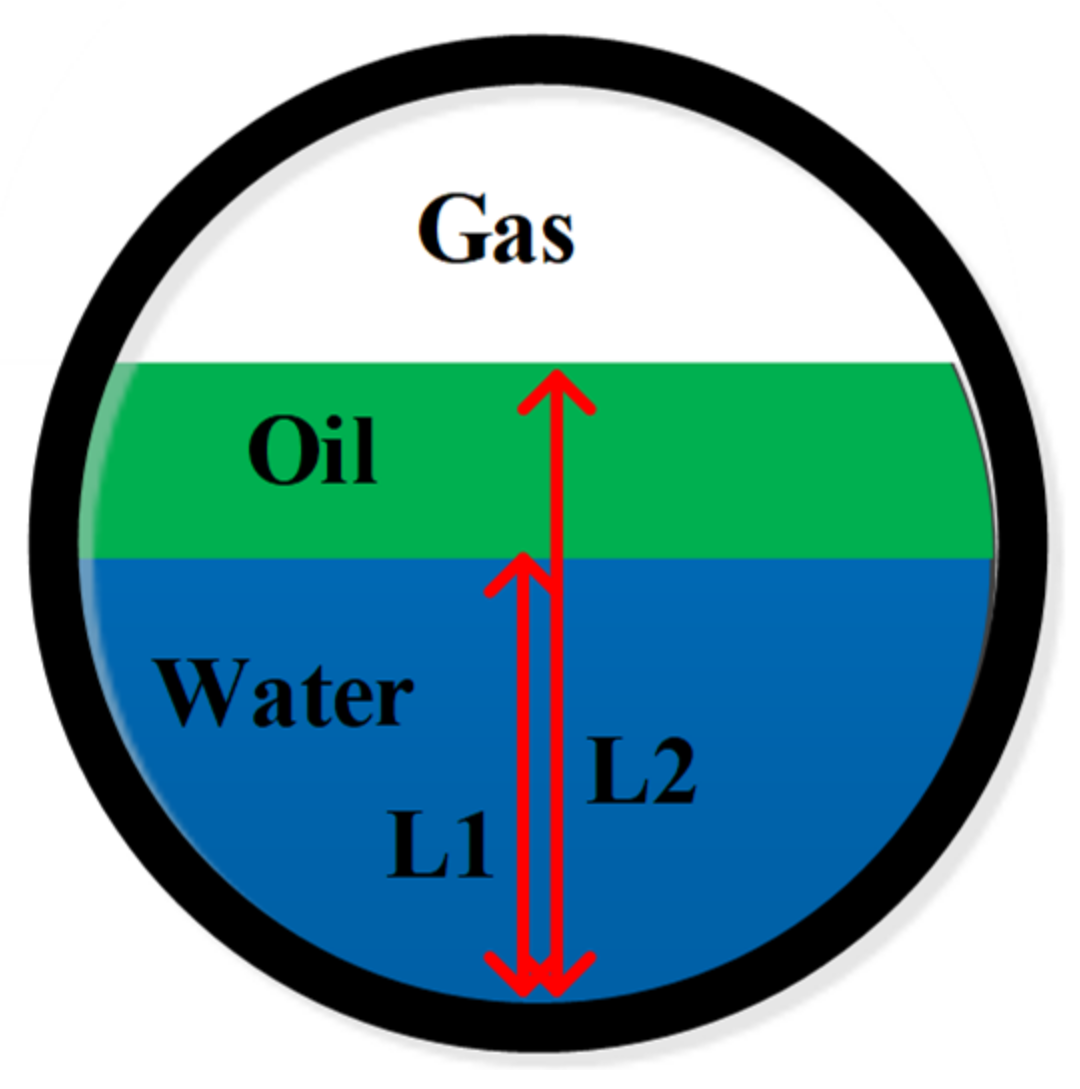
2.1.3. Flow Regime and Volume Fraction Modeling
Annular Regime
Stratified Regime
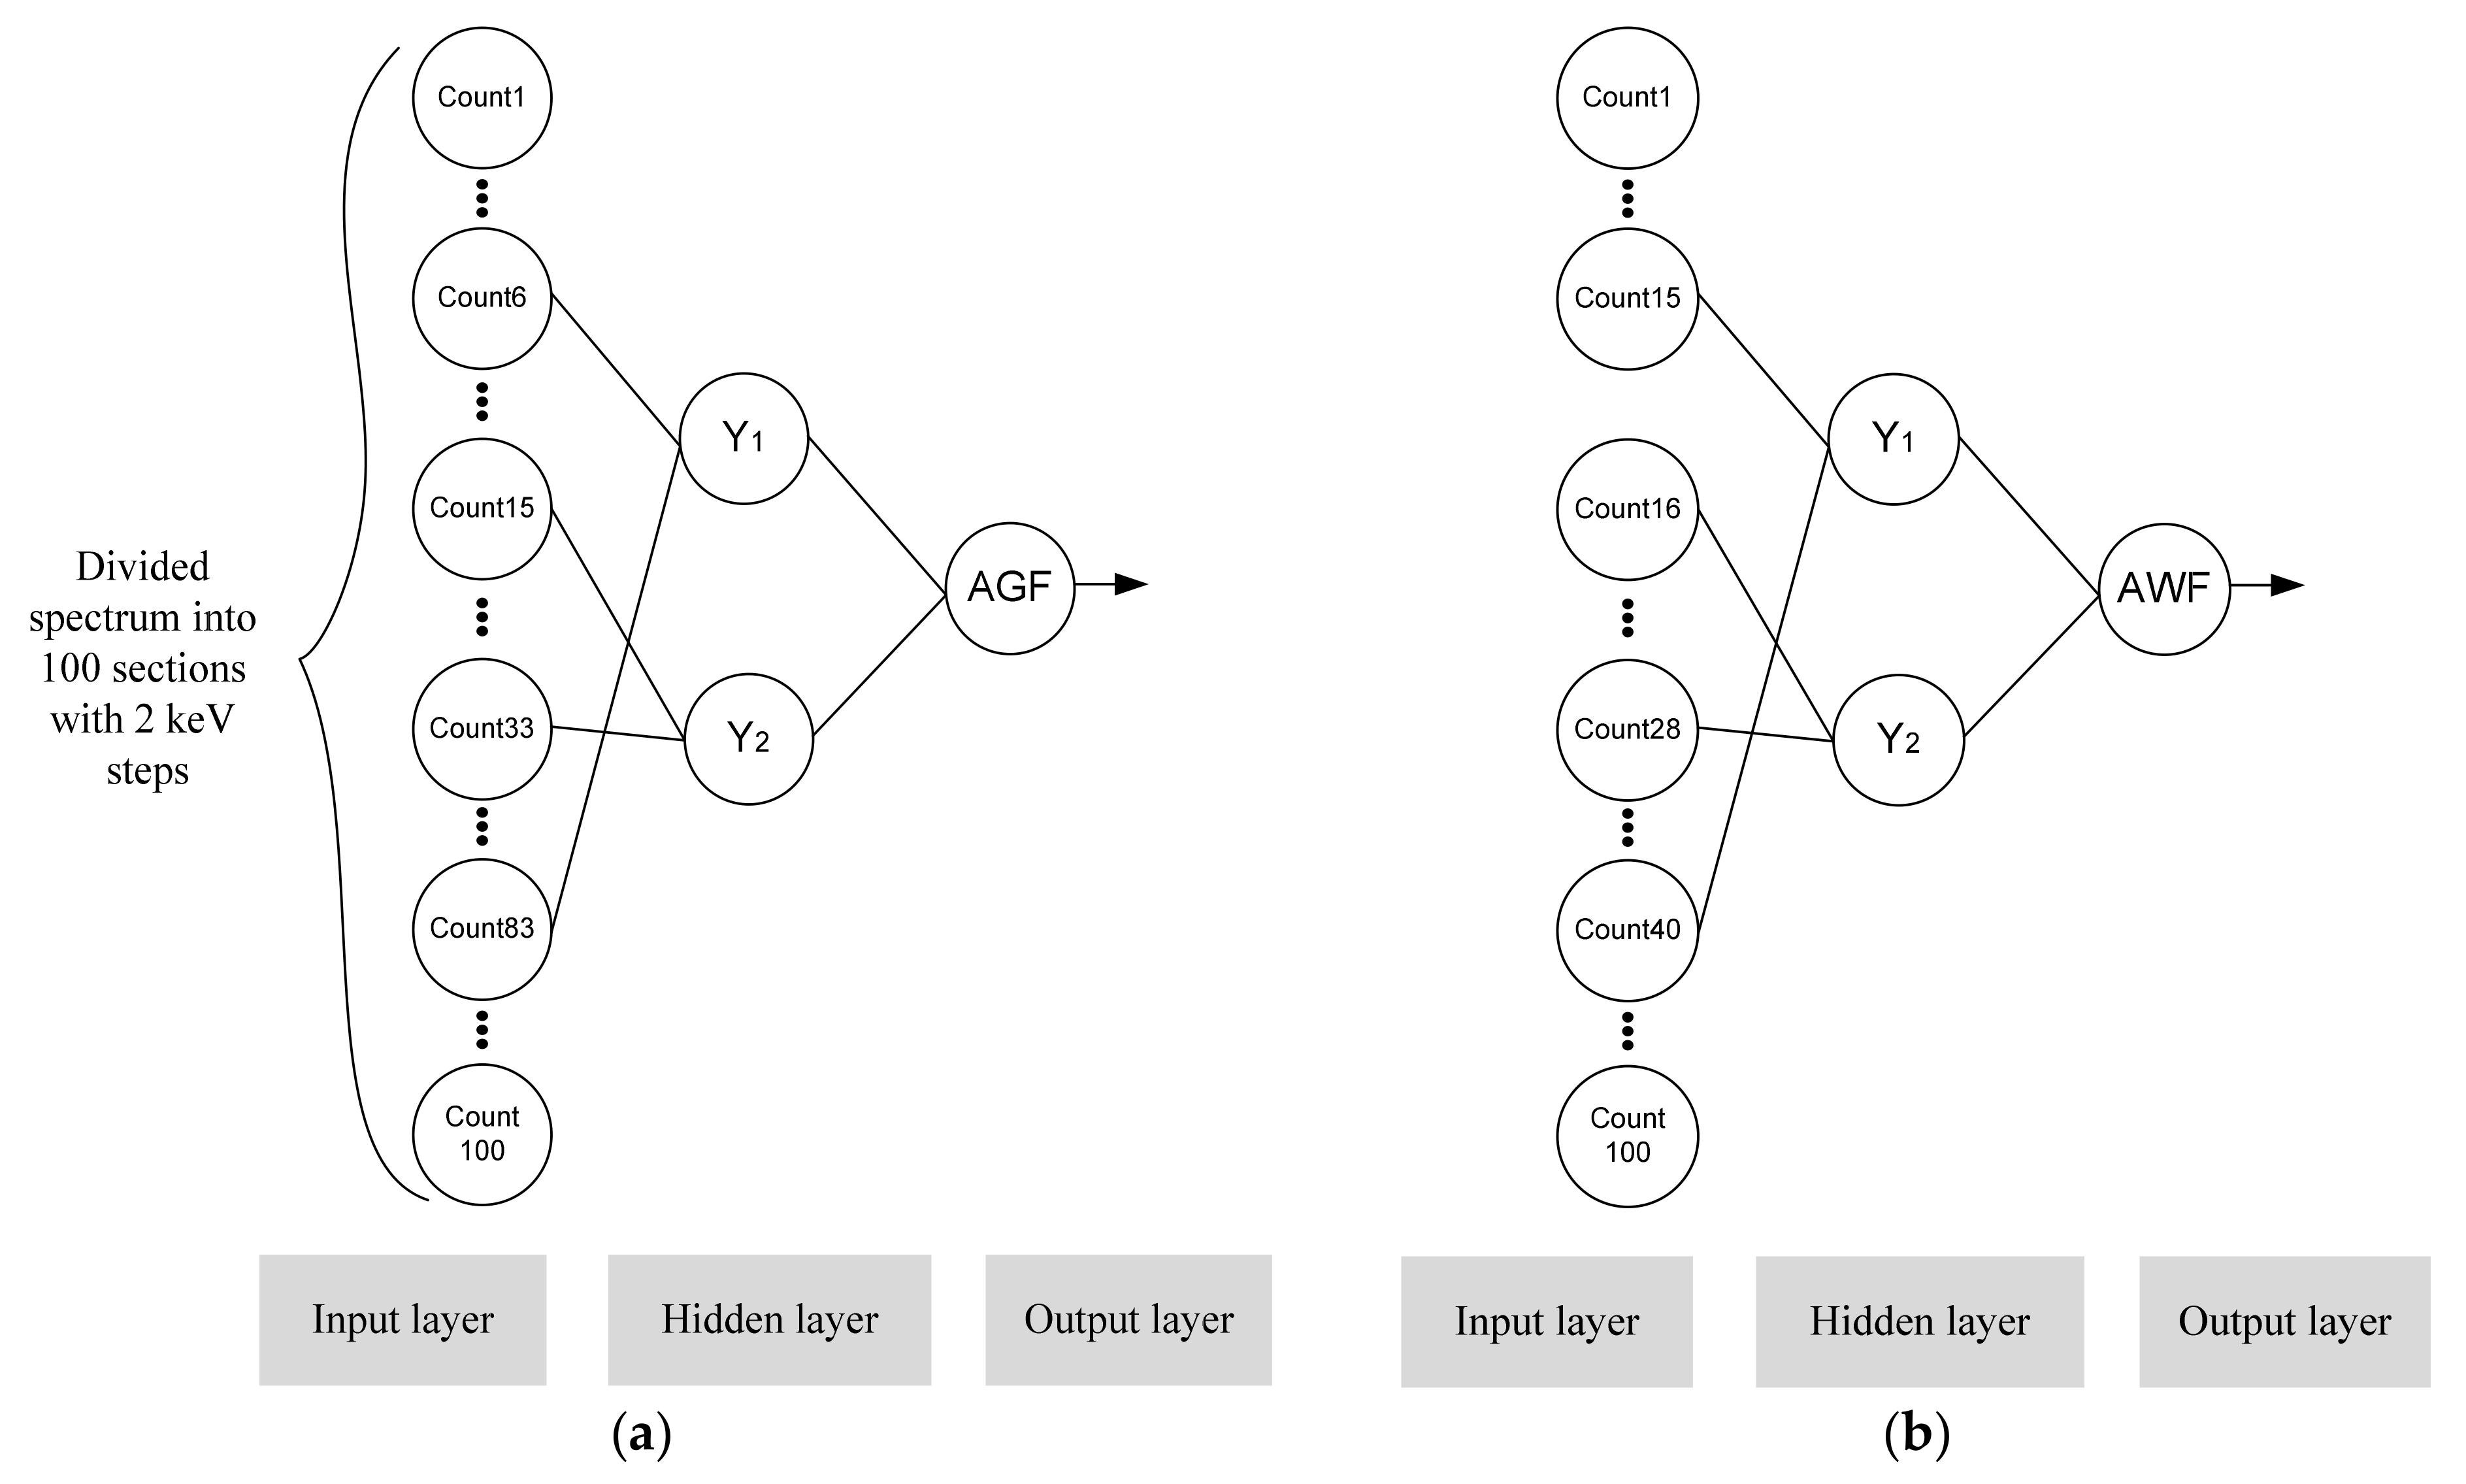
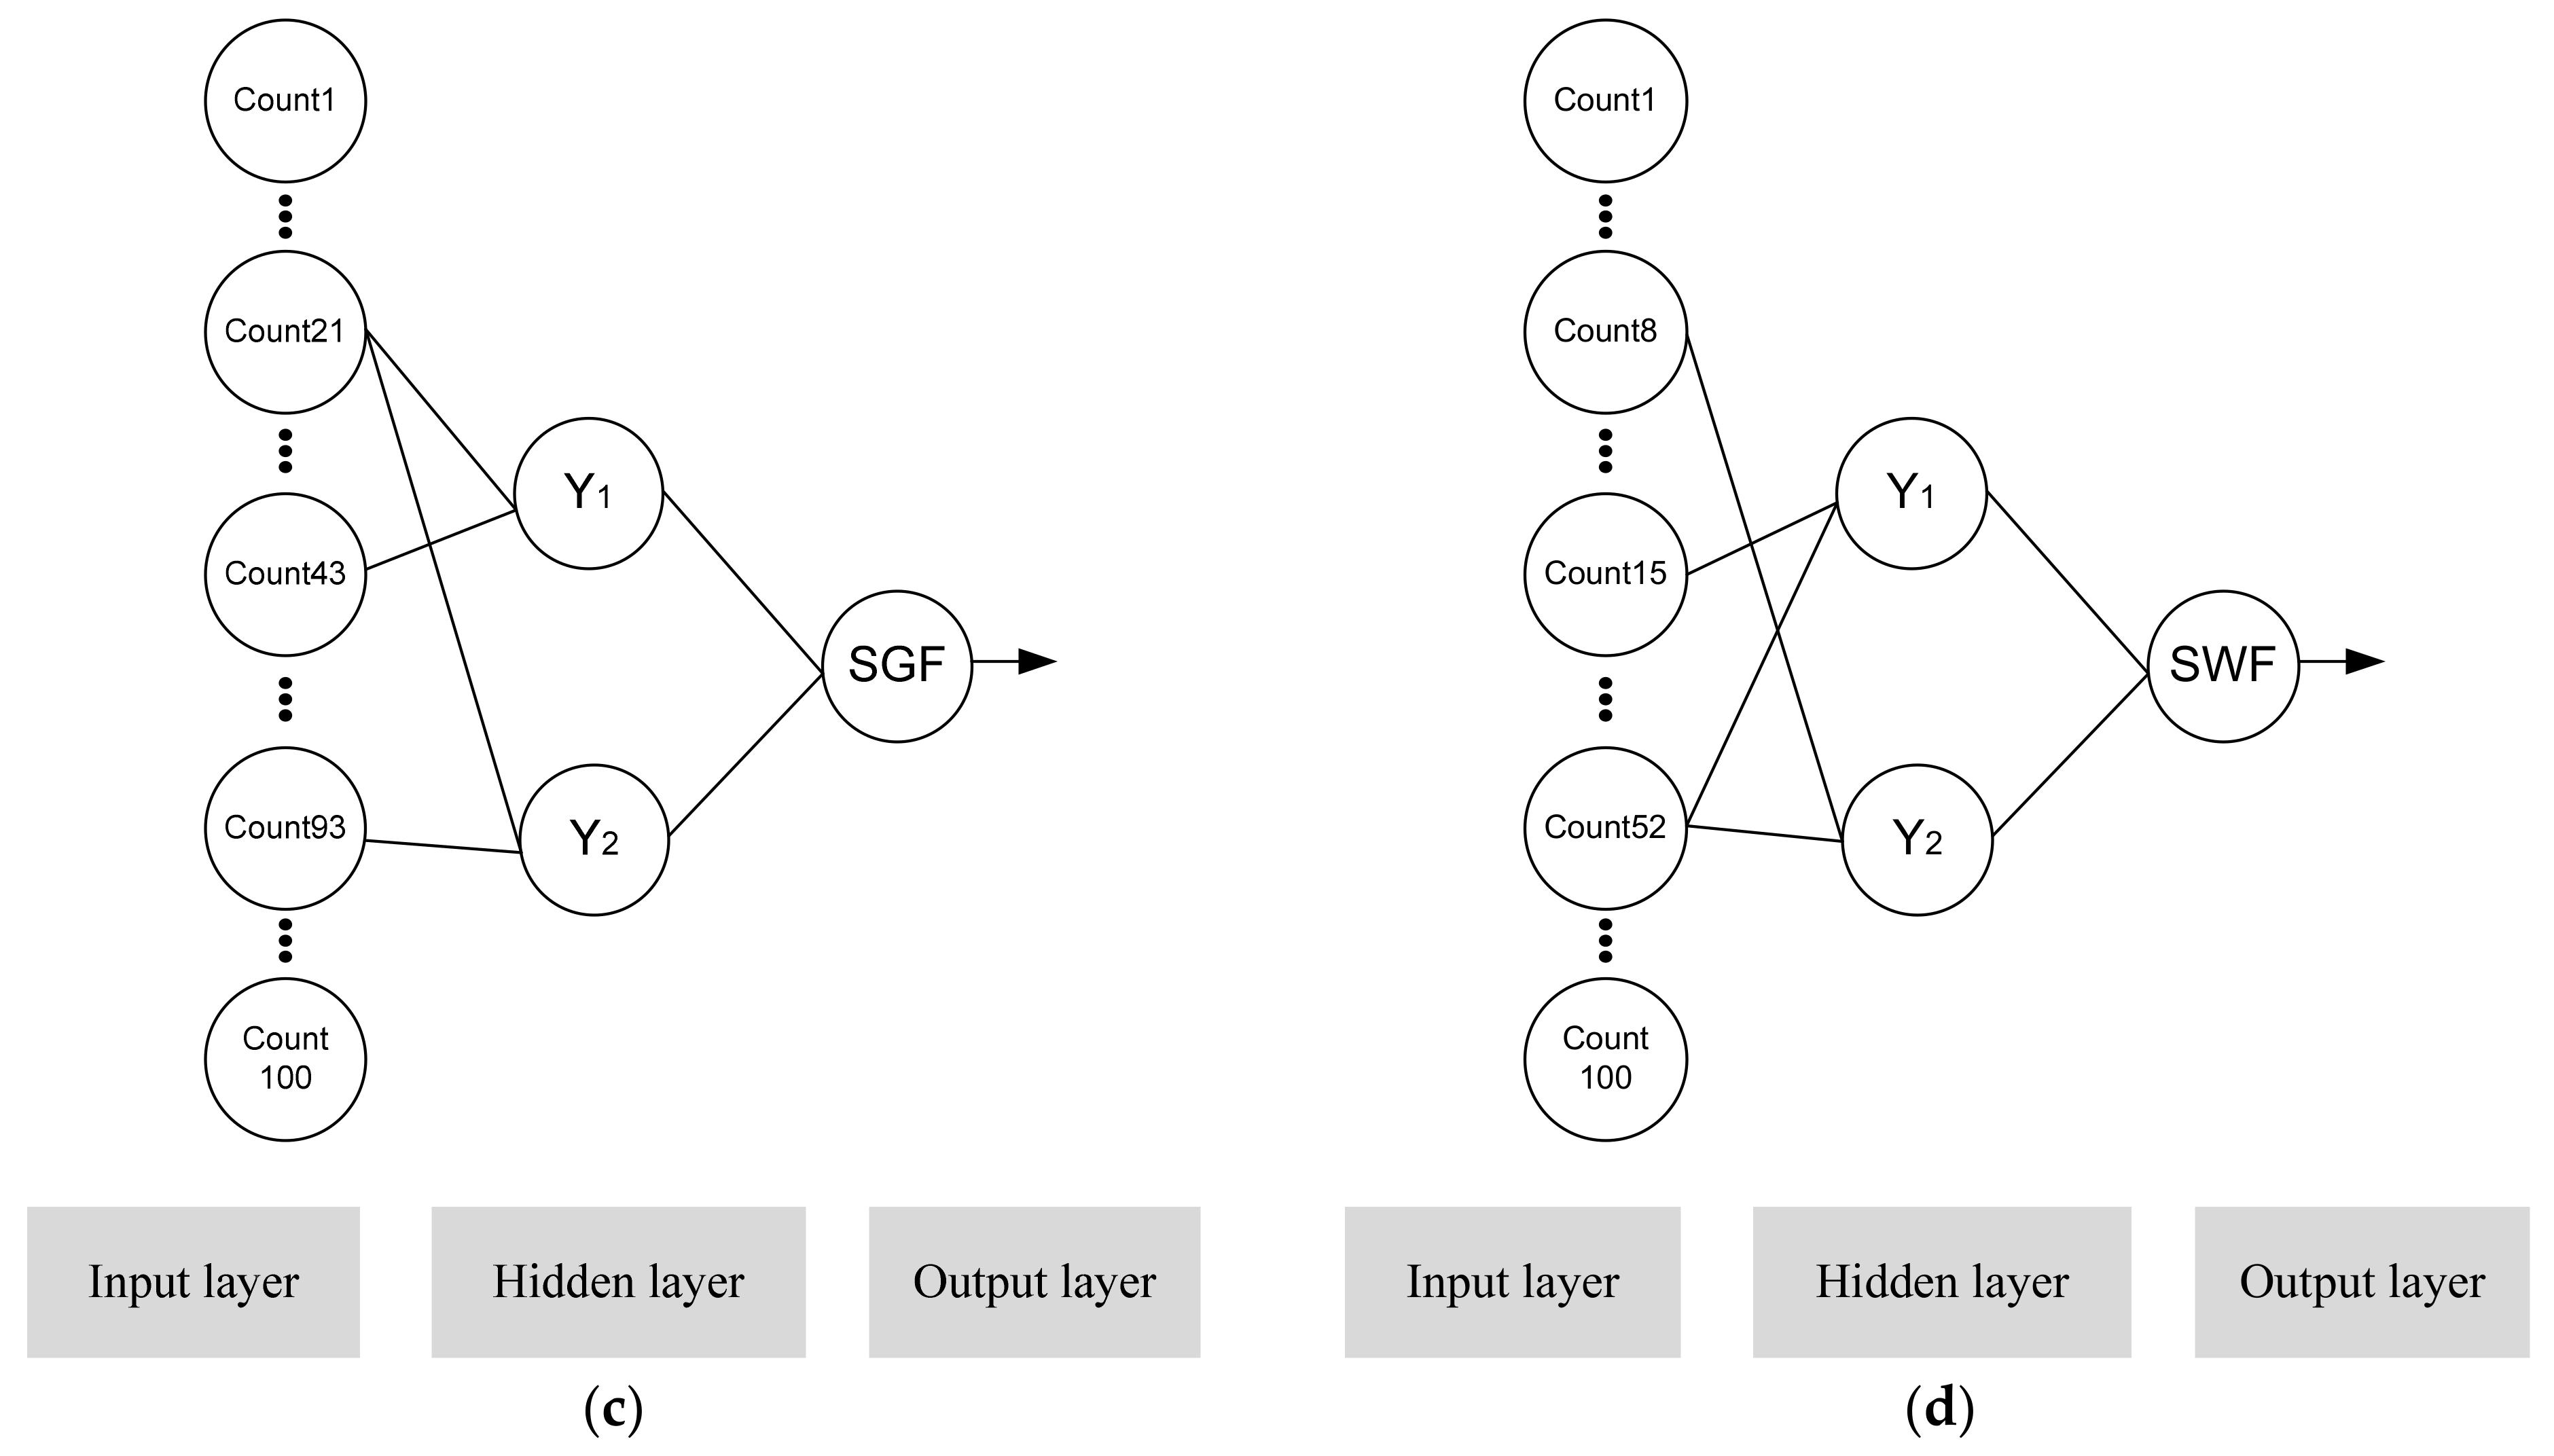
2.2. Group Method of Data Handling (GMDH)
3. Results and Discussion
4. Conclusions
Author Contributions
Funding
Institutional Review Board Statement
Informed Consent Statement
Data Availability Statement
Conflicts of Interest
References
- Wolfgang, R.; Eckart, M.; Ludwig, R.H.; GEA Group AG. Process and Apparatus for Separating Liquids. U.S. Patent 3,412,861, 26 November 1968. [Google Scholar]
- Rajan, V.S.V.; Ridley, R.K.; Rafa, K.G. Multiphase Flow Measurement Techniques—A Review. J. Energy Resour. Technol. 1993, 115, 151–161. [Google Scholar] [CrossRef]
- Salgado, C.M.; Pereira, C.M.; Schirru, R.; Brandão, L.E. Flow regime identification and volume fraction prediction in multiphase flows by means of gamma-ray attenuation and artificial neural networks. Prog. Nucl. Energy 2010, 52, 555–562. [Google Scholar] [CrossRef]
- Roshani, G.; Karami, A.; Salehizadeh, A.; Nazemi, E. The capability of radial basis function to forecast the volume fractions of the annular three-phase flow of gas-oil-water. Appl. Radiat. Isot. 2017, 129, 156–162. [Google Scholar] [CrossRef]
- Peyvandi, R.G.; Rad, S.Z.I. Application of artificial neural networks for the prediction of volume fraction using spectra of gamma rays backscattered by three-phase flows. Eur. Phys. J. Plus 2017, 132, 511. [Google Scholar] [CrossRef]
- Karami, A.; Roshani, G.H.; Khazaei, A.; Nazemi, E.; Fallahi, M. Investigation of different sources in order to optimize the nuclear metering system of gas–oil–water annular flows. Neural Comput. Appl. 2018, 32, 3619–3631. [Google Scholar] [CrossRef]
- Meric, I.; Johansen, G.A.; Mattingly, J.; Gardner, R. On the ill-conditioning of the multiphase flow measurement by prompt gamma-ray neutron activation analysis. Radiat. Phys. Chem. 2014, 95, 401–404. [Google Scholar] [CrossRef]
- Roshani, G.H.; Roshani, S.; Nazemi, E.; Roshani, S. Online measuring density of oil products in annular regime of gas-liquid two phase flows. Measurement 2018, 129, 296–301. [Google Scholar] [CrossRef]
- Matousek, V. Pressure drops and flow patterns in sand-mixture pipes. Exp. Therm. Fluid Sci. 2002, 26, 693–702. [Google Scholar] [CrossRef]
- Moradi, M.J.; Hariri-Ardebili, M.A. Developing a Library of Shear Walls Database and the Neural Network Based Predictive Meta-Model. Appl. Sci. 2019, 9, 2562. [Google Scholar] [CrossRef] [Green Version]
- Roshani, G.; Nazemi, E.; Roshani, M. Intelligent recognition of gas-oil-water three-phase flow regime and determination of volume fraction using radial basis function. Flow Meas. Instrum. 2017, 54, 39–45. [Google Scholar] [CrossRef]
- Roshani, M.; Phan, G.T.; Ali, P.J.M.; Roshani, G.H.; Hanus, R.; Duong, T.; Corniani, E.; Nazemi, E.; Kalmoun, E.M. Evaluation of flow pattern recognition and void fraction measurement in two phase flow independent of oil pipeline’s scale layer thickness. Alex. Eng. J. 2021, 60, 1955–1966. [Google Scholar] [CrossRef]
- Vlasák, P.; Chára, Z.; Matoušek, V.; Konfršt, J.; Kesely, M. Experimental investigation of fine-grained settling slurry flow behaviour in inclined pipe sections. J. Hydrol. Hydromech. 2019, 67, 113–120. [Google Scholar] [CrossRef] [Green Version]
- Nazemi, E.; Feghhi, S.; Roshani, G.; Peyvandi, R.G.; Setayeshi, S. Precise Void Fraction Measurement in Two-phase Flows Independent of the Flow Regime Using Gamma-ray Attenuation. Nucl. Eng. Technol. 2016, 48, 64–71. [Google Scholar] [CrossRef] [Green Version]
- Roshani, G.H.; Nazemi, E.; Roshani, M.M. Flow regime independent volume fraction estimation in three-phase flows using dual-energy broad beam technique and artificial neural network. Neural Comput. Appl. 2016, 28, 1265–1274. [Google Scholar] [CrossRef]
- El Abd, A. Intercomparison of gamma ray scattering and transmission techniques for gas volume fraction measurements in two phase pipe flow. Nucl. Instrum. Methods Phys. Res. Sect. A 2014, 735, 260–266. [Google Scholar] [CrossRef]
- Roshani, M.; Phan, G.; Roshani, G.H.; Hanus, R.; Nazemi, B.; Corniani, E.; Nazemi, E. Combination of X-ray tube and GMDH neural network as a nondestructive and potential technique for measuring characteristics of gas-oil–water three phase flows. Measurement 2021, 168, 108427. [Google Scholar] [CrossRef]
- Roshani, G.; Nazemi, E.; Roshani, M. Identification of flow regime and estimation of volume fraction independent of liquid phase density in gas-liquid two-phase flow. Prog. Nucl. Energy 2017, 98, 29–37. [Google Scholar] [CrossRef]
- Vlasák, P.; Matoušek, V.; Chára, Z.; Krupička, J.; Konfršt, J.; Kesely, M. Concentration distribution and deposition limit of medium-coarse sand-water slurry in inclined pipe. J. Hydrol. Hydromech. 2020, 68, 83–91. [Google Scholar] [CrossRef] [Green Version]
- Abro, E.; Johansen, G.A. Improved Void Fraction Determination by Means of Multibeam Gamma-Ray Attenuation Measurements. Flow Meas. Instrum. 1999, 10, 99–108. [Google Scholar] [CrossRef]
- Roshani, M.; Sattari, M.A.; Ali, P.J.M.; Roshani, G.H.; Nazemi, B.; Corniani, E.; Nazemi, E. Application of GMDH neural network technique to improve measuring precision of a simplified photon attenuation based two-phase flowmeter. Flow Meas. Instrum. 2020, 75, 101804. [Google Scholar] [CrossRef]
- Roshani, M.; Phan, G.; Faraj, R.H.; Phan, N.-H.; Roshani, G.H.; Nazemi, B.; Corniani, E.; Nazemi, E. Proposing a gamma radiation based intelligent system for simultaneous analyzing and detecting type and amount of petroleum by-products. Nucl. Eng. Technol. 2020. [Google Scholar] [CrossRef]
- Roshani, G.; Nazemi, E.; Feghhi, S. Investigation of using 60 Co source and one detector for determining the flow regime and void fraction in gas–liquid two-phase flows. Flow Meas. Instrum. 2016, 50, 73–79. [Google Scholar] [CrossRef]
- Heindel, T.J.; Gray, J.N.; Jensen, T.C. An X-ray system for visualizing fluid flows. Flow Meas. Instrum. 2008, 19, 67–78. [Google Scholar] [CrossRef]
- Heindel, T.J. A Review of X-Ray Flow Visualization with Applications to Multiphase Flows. J. Fluids Eng. 2011, 133, 074001. [Google Scholar] [CrossRef] [Green Version]
- Song, K.; Liu, Y. A compact x-ray system for two-phase flow measurement. Meas. Sci. Technol. 2017, 29, 025305. [Google Scholar] [CrossRef]
- Hussein, E.M.A. Chapter one—Mechanisms. In Radiation Mechanics; Hussein, E.M.A., Ed.; Elsevier Science Ltd: Oxford, UK, 2007; pp. 1–65. ISBN 9780080450537. [Google Scholar] [CrossRef]
- Pelowitz, D.B. MCNP-X TM User’s Manual, Version 2.5.0. LA-CP-05e0369; Los Alamos National Laboratory: New Mexico, NM, USA, 2005. [Google Scholar]
- Hernandez, A.M.; Boone, J.M. Tungsten anode spectral model using interpolating cubic splines: Unfiltered x-ray spectra from 20 kV to 640 kV. Med. Phys. 2014, 41, 042101. [Google Scholar] [CrossRef] [Green Version]
- Zadeh, E.E.; Feghhi, S.A.H.; Bayat, E.; Roshani, G.H. Gaussian Energy Broadening Function of an HPGe Detector in the Range of 40 keV to 1.46 MeV. J. Exp. Phys. 2014, 2014, 623683. [Google Scholar] [CrossRef] [Green Version]
- Nazemi, E.; Roshani, G.H.; Feghhi, S.A.H.; Setayeshi, S.; Zadeh, E.E.; Fatehi, A. Optimization of a method for identifying the flow regime and measuring void fraction in a broad beam gamma-ray attenuation technique. Int. J. Hydrogen Energy 2016, 41, 7438–7444. [Google Scholar] [CrossRef]
- Roshani, G.; Nazemi, E. Intelligent densitometry of petroleum products in stratified regime of two phase flows using gamma ray and neural network. Flow Meas. Instrum. 2017, 58, 6–11. [Google Scholar] [CrossRef]
- Roshani, G.; Nazemi, E.; Feghhi, S.; Setayeshi, S. Flow regime identification and void fraction prediction in two-phase flows based on gamma ray attenuation. Measurement 2015, 62, 25–32. [Google Scholar] [CrossRef]
- Moradi, M.J.; Roshani, M.M.; Shabani, A.; Kioumarsi, M. Prediction of the Load-Bearing Behavior of SPSW with Rectangular Opening by RBF Network. Appl. Sci. 2020, 10, 1185. [Google Scholar] [CrossRef] [Green Version]
- Salgado, C.M.; Brandão, L.E.; Pereira, C.M.; Salgado, W.L. Salinity independent volume fraction prediction in annular and stratified (water–gas–oil) multiphase flows using artificial neural networks. Prog. Nucl. Energy 2014, 76, 17–23. [Google Scholar] [CrossRef]
- Karami, A.; Roshani, G.H.; Nazemi, E.; Roshani, S. Enhancing the performance of a dual-energy gamma ray based three-phase flow meter with the help of grey wolf optimization algorithm. Flow Meas. Instrum. 2018, 64, 164–172. [Google Scholar] [CrossRef]
- Roshani, G.; Hanus, R.; Khazaei, A.; Zych, M.; Nazemi, E.; Mosorov, V. Density and velocity determination for single-phase flow based on radiotracer technique and neural networks. Flow Meas. Instrum. 2018, 61, 9–14. [Google Scholar] [CrossRef]
- Sattari, M.A.; Roshani, G.H.; Hanus, R.; Nazemi, E. Applicability of time-domain feature extraction methods and artificial intelligence in two-phase flow meters based on gamma-ray absorption technique. Measurement 2021, 168, 108474. [Google Scholar] [CrossRef]
- Roshani, G.; Nazemi, E.; Roshani, M. Usage of two transmitted detectors with optimized orientation in order to three phase flow metering. Measurement 2017, 100, 122–130. [Google Scholar] [CrossRef]
- Ivakhnenko, A.G. Polynomial theory of complex systems. IEEE Trans. Syst. Man Cybern. 1971, 4, 364–378. [Google Scholar] [CrossRef] [Green Version]


| Gas Fraction (%) | Water Fraction (%) | Oil Fraction (%) | Gas Fraction (%) | Water Fraction (%) | Oil Fraction (%) | Gas Fraction (%) | Water Fraction (%) | Oil Fraction (%) |
|---|---|---|---|---|---|---|---|---|
| 10 | 10 | 80 | 20 | 50 | 30 | 40 | 40 | 20 |
| 10 | 20 | 70 | 20 | 60 | 20 | 40 | 50 | 10 |
| 10 | 30 | 60 | 20 | 70 | 10 | 50 | 10 | 40 |
| 10 | 40 | 50 | 30 | 10 | 60 | 50 | 20 | 30 |
| 10 | 50 | 40 | 30 | 20 | 50 | 50 | 30 | 20 |
| 10 | 60 | 30 | 30 | 30 | 40 | 50 | 40 | 10 |
| 10 | 70 | 20 | 30 | 40 | 30 | 60 | 10 | 30 |
| 10 | 80 | 10 | 30 | 50 | 20 | 60 | 20 | 20 |
| 20 | 10 | 70 | 30 | 60 | 10 | 60 | 30 | 10 |
| 20 | 20 | 60 | 40 | 10 | 50 | 70 | 10 | 20 |
| 20 | 30 | 50 | 40 | 20 | 40 | 70 | 20 | 10 |
| 20 | 40 | 40 | 40 | 30 | 30 | 80 | 10 | 10 |
| Regime | Output | Obtained Formula |
|---|---|---|
| Annular | Gas Fraction | AGF (Annular Gas Fraction) = 0.1065 + 0.6299Y1 + 0.3578Y2 + 0.0131 (Y1)2 + 0.0016 (Y2)2 − 0.0147Y1 × Y2 Y1 = −23.2373 − 2588729.9560 Count6 + 6108121.5088 Count83 − 98604621043.5337 (Count6)2 − 646317594778.770 (Count83)2 + 559590375769.721 Count6 × Count83 Y2 = 18.9831 + 534567.5620 Count15 − 728265.4137 Count33 + 5563023189.1905 (Count15)2 + 6197122569.6787(Count33)2 − 10335907306.5612Count15 × Count33 |
| Annular | Water Fraction | AWF (Annular Water Fraction) = 0.0634 + 0.1968Y1 + 0.7851Y2 + 0.0224 (Y1)2 + 0.0151 (Y2)2 − 0.0372Y1 × Y2 Y1 = −64.0274 − 5332130.0639 Count15 + 7831232.8529 Count40 − 19323662787.6527 (Count15)2 − 70655643553.4150 (Count40)2 + 77895388968.2904Count15 × Count40 Y2 = 38.5623 − 3810210.0071Count16 + 1969802.2064 Count28 − 3184557757.5583 (Count16)2 − 4133655084.9143 (Count28)2 + 10196267194.7447Count16 × Count28 |
| Stratified | Gas Fraction | SGF (Stratified Gas Fraction) = −0.3260 + 0.7927Y1 + 0.2175Y2 + 0.0098(Y1)2 + 0.0064 (Y2)2 − 0.0163Y1 × Y2 Y1= −132.4847 − 320032.5870Count21 + 2881002.1315Count43 − 3776733668.2311 (Count21)2 − 13830795453.3680 (Count43)2 + 11265920274.4972Count21 × Count43 Y2 = −75.4546 + 870792.6629 Count21 + 2107893.1360 Count93 − 31974289450.5452 (Count21)2 − 13623525745533.6 (Count93)2 + 1305755788438.76Count21 × Count93 |
| Stratified | Water Fraction | SWF (Stratified Water Fraction) = 0.2794 + 1.7624Y1 − 0.7492Y2 − 0.0053(Y1)2 + 0.0123(Y2)2 − 0.0074Y1 × Y2 Y1 = −35.5540 − 4719676.8017Count15 + 8667666.3274Count52 + 18379435343.0679 (Count15)2 − 36941702608.4495 (Count52)2 − 10438629829.3565Count15 × Count52 Y2 = 417.8013 − 41319029.8558Count8 + 12151320.0537Count52 + 815488926491.5330 (Count8)2 + 27263210414.1598 (Count52)2 − 373712731581.2180Count8 × Count52 |
| GMDH Model | Test Sample Number | Actual Volume Fraction (%) | Predicted Volume Fraction (%) | Absolute Error between Actual and Predicted Volume Fraction (%) | Relative Error × 100 (%) |
|---|---|---|---|---|---|
| Annular Regime and Gas Fraction Output (AGF) | 1 | 20 | 20.947 | 0.947 | 4.736 |
| 2 | 50 | 49.592 | 0.407 | 0.814 | |
| 3 | 20 | 20.266 | 0.266 | 1.334 | |
| 4 | 50 | 47.349 | 2.650 | 5.300 | |
| 5 | 70 | 72.423 | 2.423 | 3.462 | |
| 6 | 20 | 20.051 | 0.051 | 0.258 | |
| 7 | 10 | 10.279 | 0.279 | 2.791 | |
| 8 | 10 | 10.132 | 0.132 | 1.326 | |
| 9 | 10 | 9.695 | 0.304 | 3.041 | |
| 10 | 20 | 19.972 | 0.027 | 0.135 | |
| 11 | 40 | 40.465 | 0.465 | 1.164 | |
| Annular Regime and Water Fraction Output (AWF) | 1 | 50 | 49.734 | 0.265 | 0.531 |
| 2 | 10 | 10.543 | 0.543 | 5.439 | |
| 3 | 50 | 53.255 | 3.255 | 6.511 | |
| 4 | 30 | 29.661 | 0.338 | 1.129 | |
| 5 | 20 | 19.448 | 0.551 | 2.757 | |
| 6 | 40 | 40.054 | 0.054 | 0.135 | |
| 7 | 30 | 27.781 | 2.218 | 7.395 | |
| 8 | 20 | 20.787 | 0.787 | 3.937 | |
| 9 | 20 | 19.004 | 0.995 | 4.976 | |
| 10 | 40 | 39.235 | 0.764 | 1.910 | |
| 11 | 60 | 61.515 | 1.515 | 2.526 | |
| Stratified Regime and Gas Fraction Output (SGF) | 1 | 10 | 9.992 | 0.007 | 0.078 |
| 2 | 20 | 18.759 | 1.240 | 6.200 | |
| 3 | 50 | 45.014 | 4.985 | 9.971 | |
| 4 | 50 | 44.496 | 5.503 | 11.006 | |
| 5 | 80 | 82.316 | 2.316 | 2.895 | |
| 6 | 10 | 10.125 | 0.125 | 1.250 | |
| 7 | 50 | 47.028 | 2.971 | 5.943 | |
| 8 | 70 | 71.105 | 1.105 | 1.579 | |
| 9 | 60 | 58.554 | 1.445 | 2.409 | |
| 10 | 30 | 29.491 | 0.508 | 1.695 | |
| 11 | 20 | 19.553 | 0.446 | 2.233 | |
| Stratified Regime and Water Fraction Output (SWF) | 1 | 10 | 10.125 | 0.125 | 1.255 |
| 2 | 20 | 21.283 | 1.283 | 6.419 | |
| 3 | 70 | 70.934 | 0.934 | 1.335 | |
| 4 | 20 | 18.181 | 1.818 | 9.093 | |
| 5 | 40 | 40.303 | 0.303 | 0.759 | |
| 6 | 20 | 20.545 | 0.545 | 2.729 | |
| 7 | 10 | 11.988 | 1.988 | 19.880 | |
| 8 | 50 | 57.911 | 7.911 | 15.823 | |
| 9 | 20 | 21.098 | 1.098 | 5.493 | |
| 10 | 30 | 32.159 | 2.159 | 7.198 | |
| 11 | 70 | 67.466 | 2.533 | 3.619 |
| Regime | Output | RMSE Train | RMSE Test | MRE Train (%) | MRE Test (%) |
|---|---|---|---|---|---|
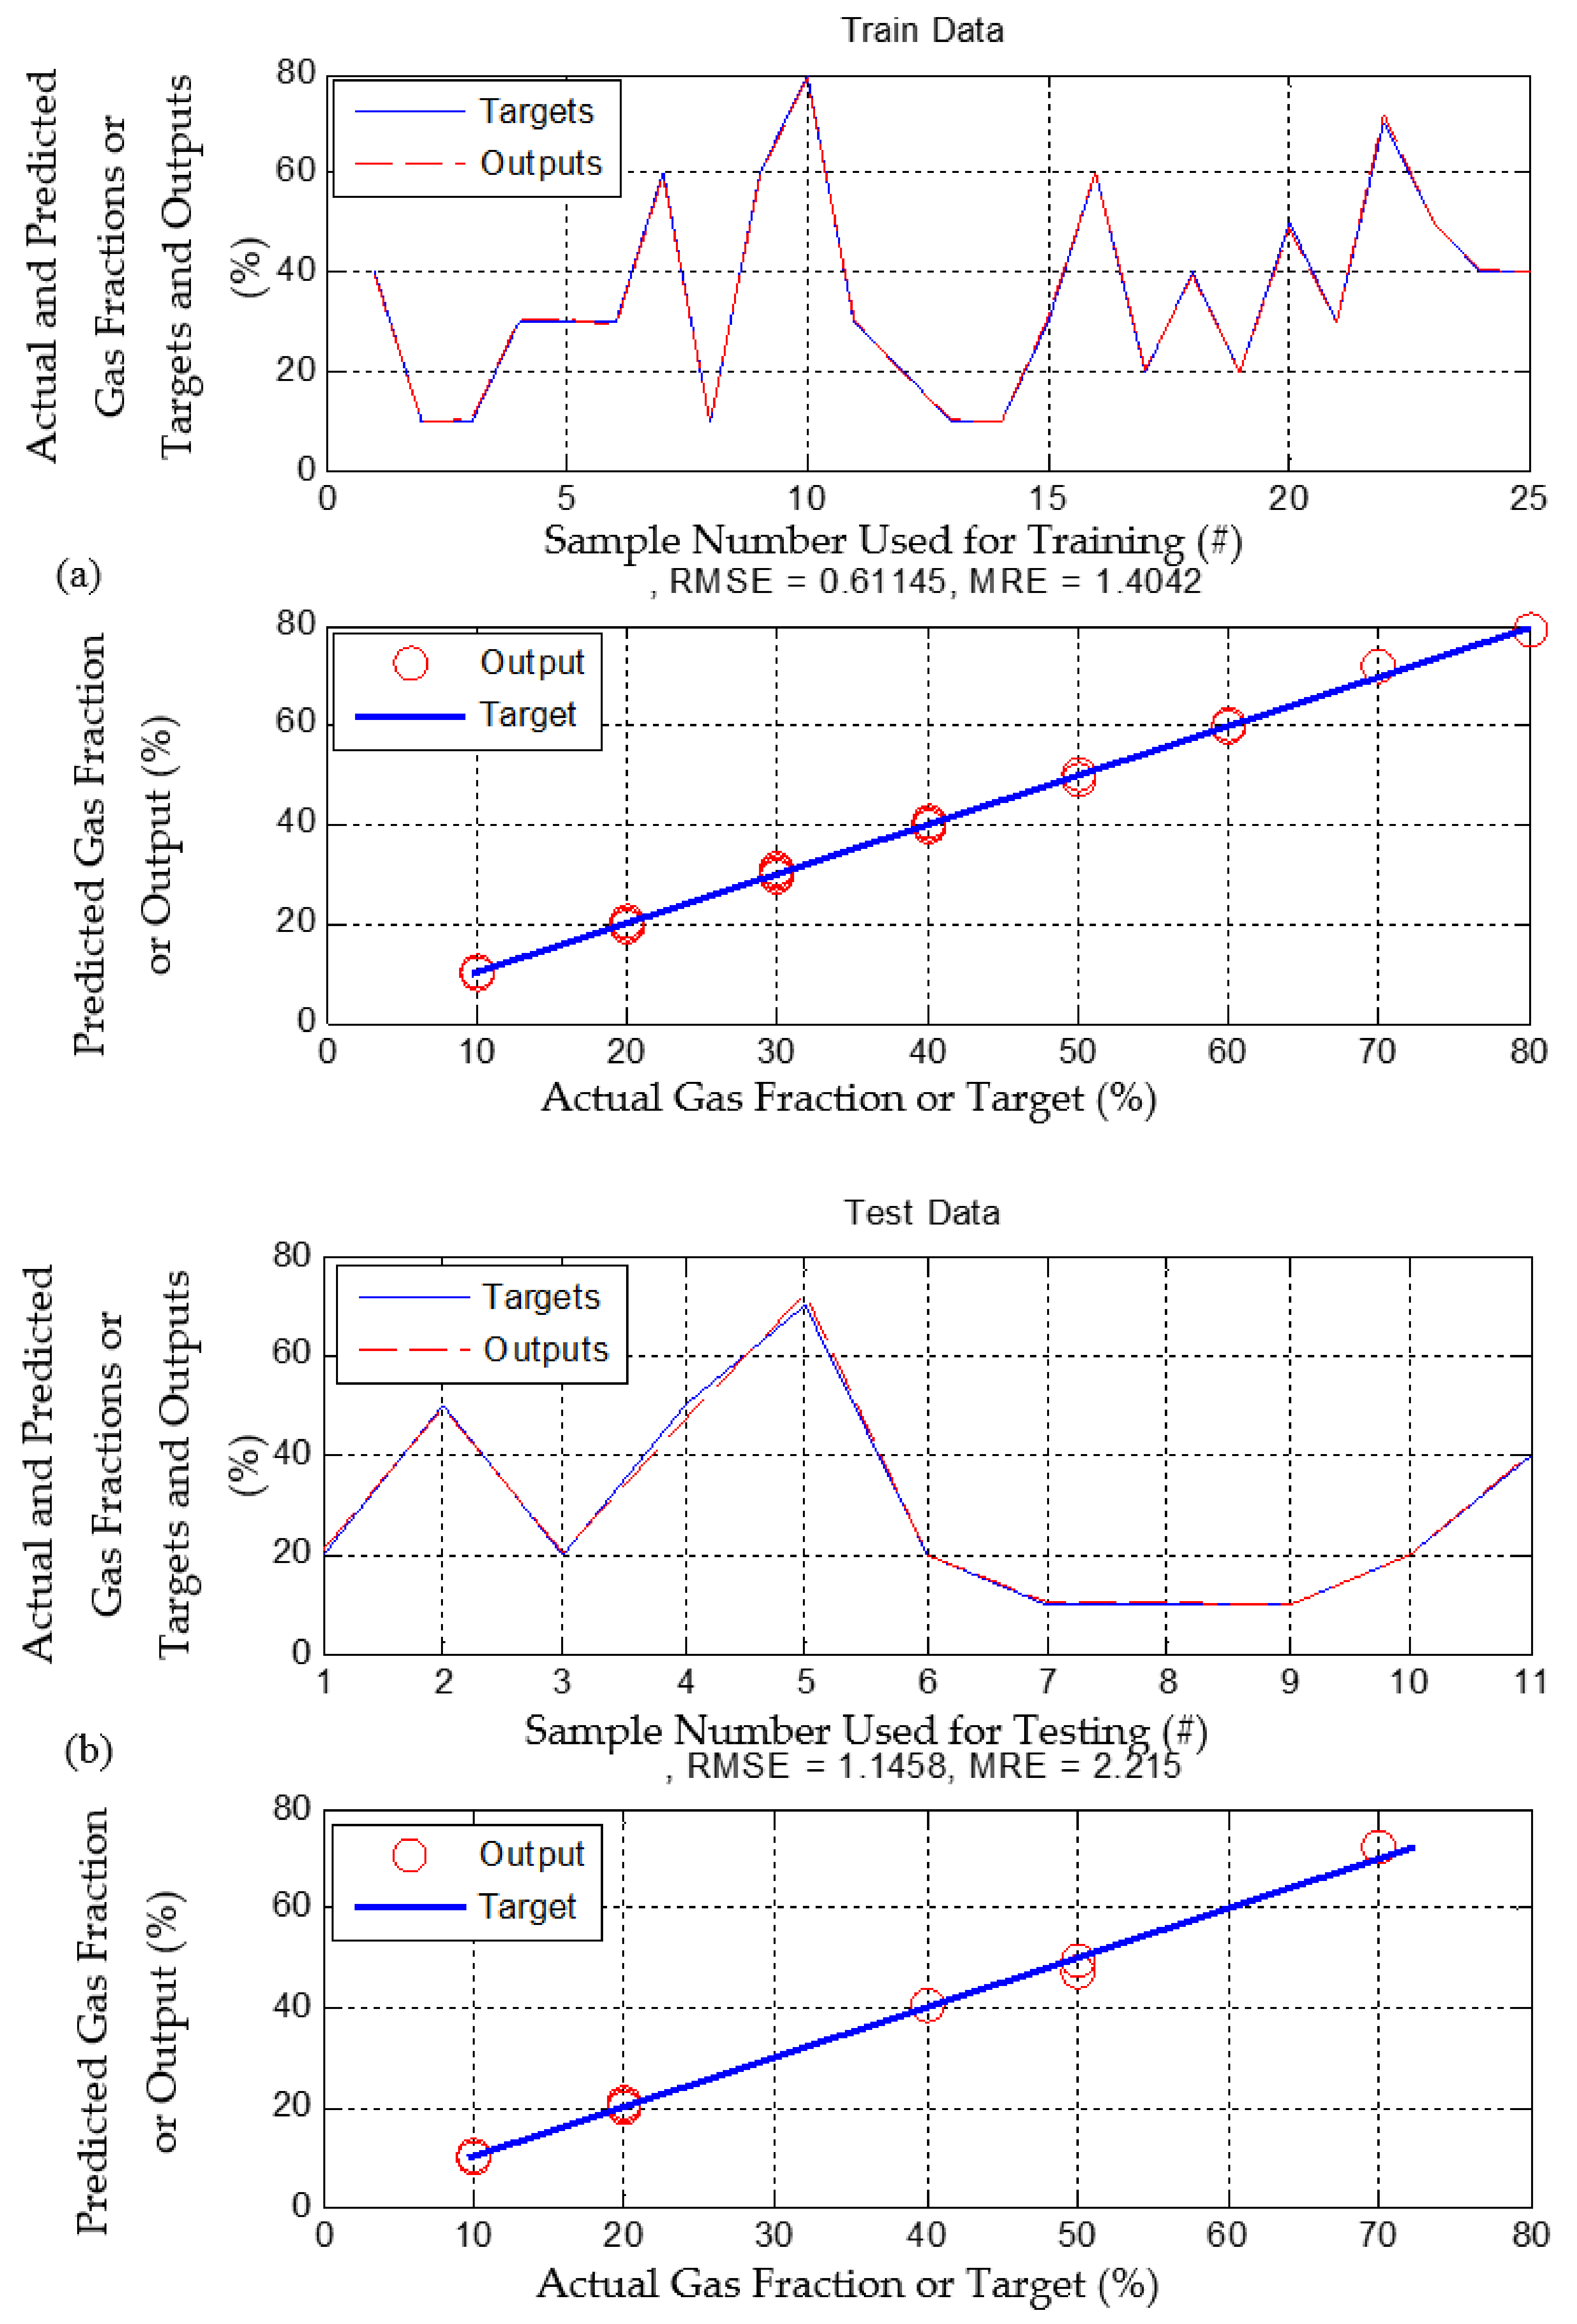
| Annular | Gas Fraction | 0.61 | 1.14 | 1.40 | 2.21 |
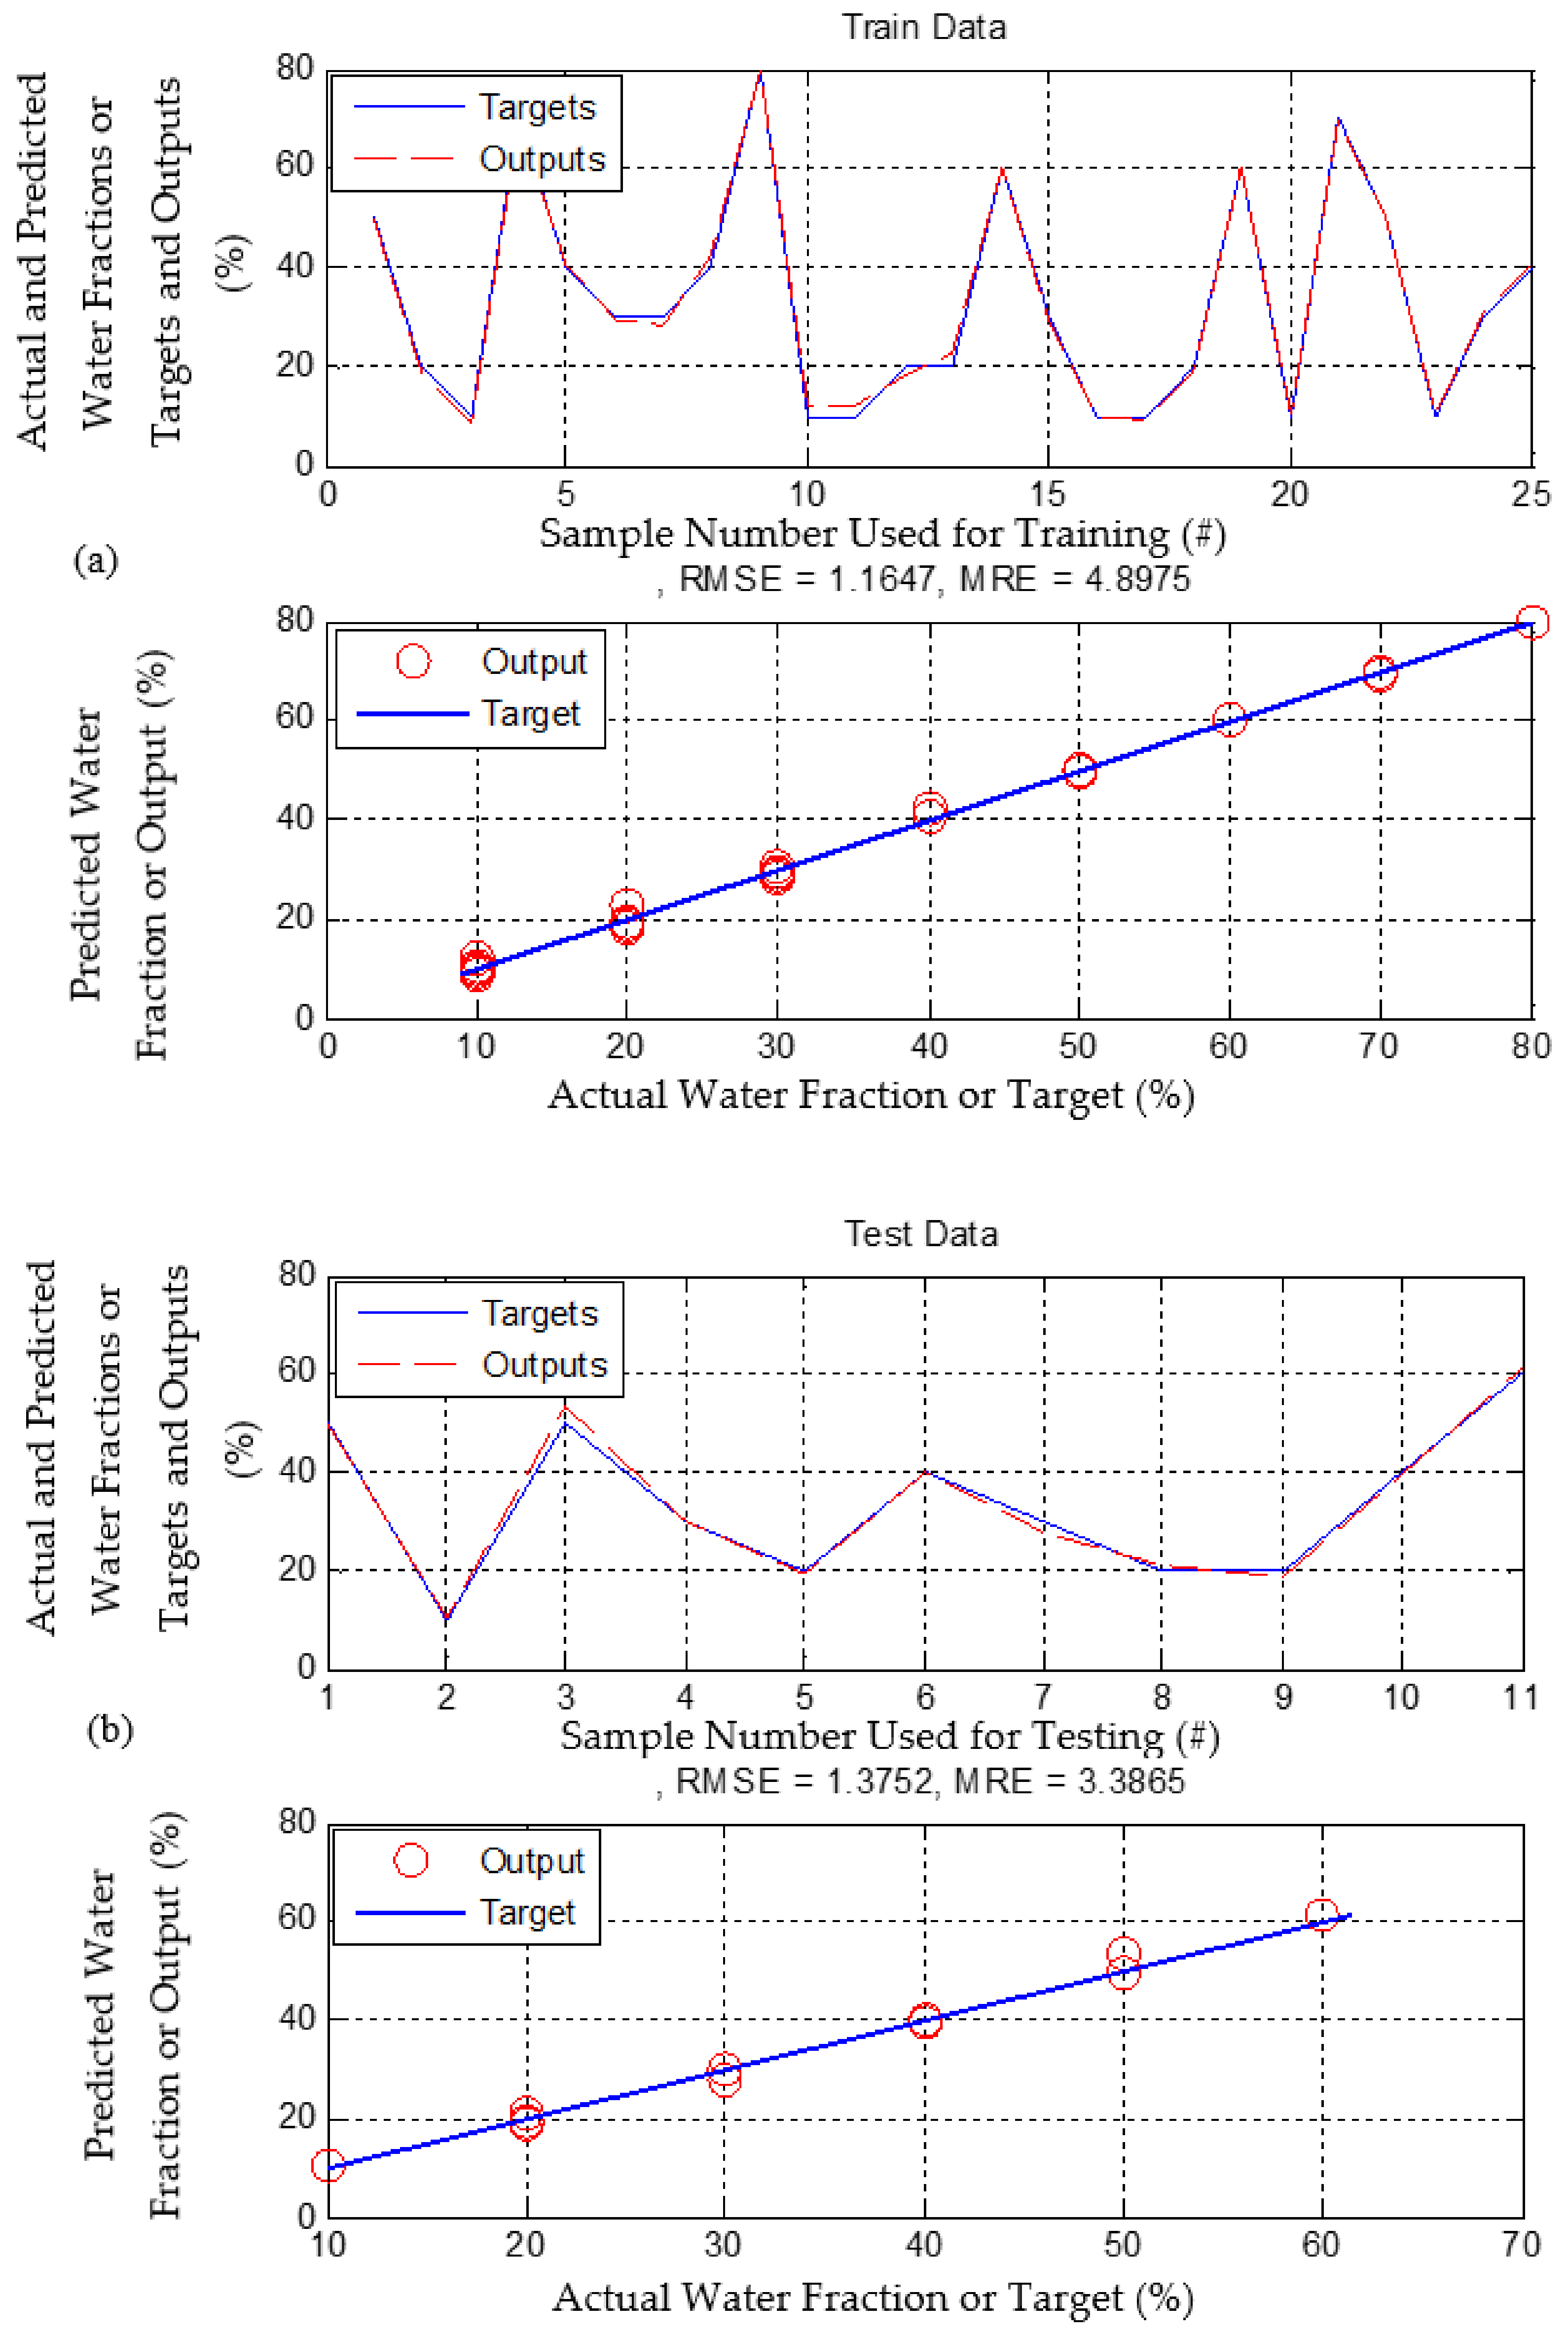
| Annular | Water Fraction | 1.16 | 1.37 | 4.89 | 3.38 |
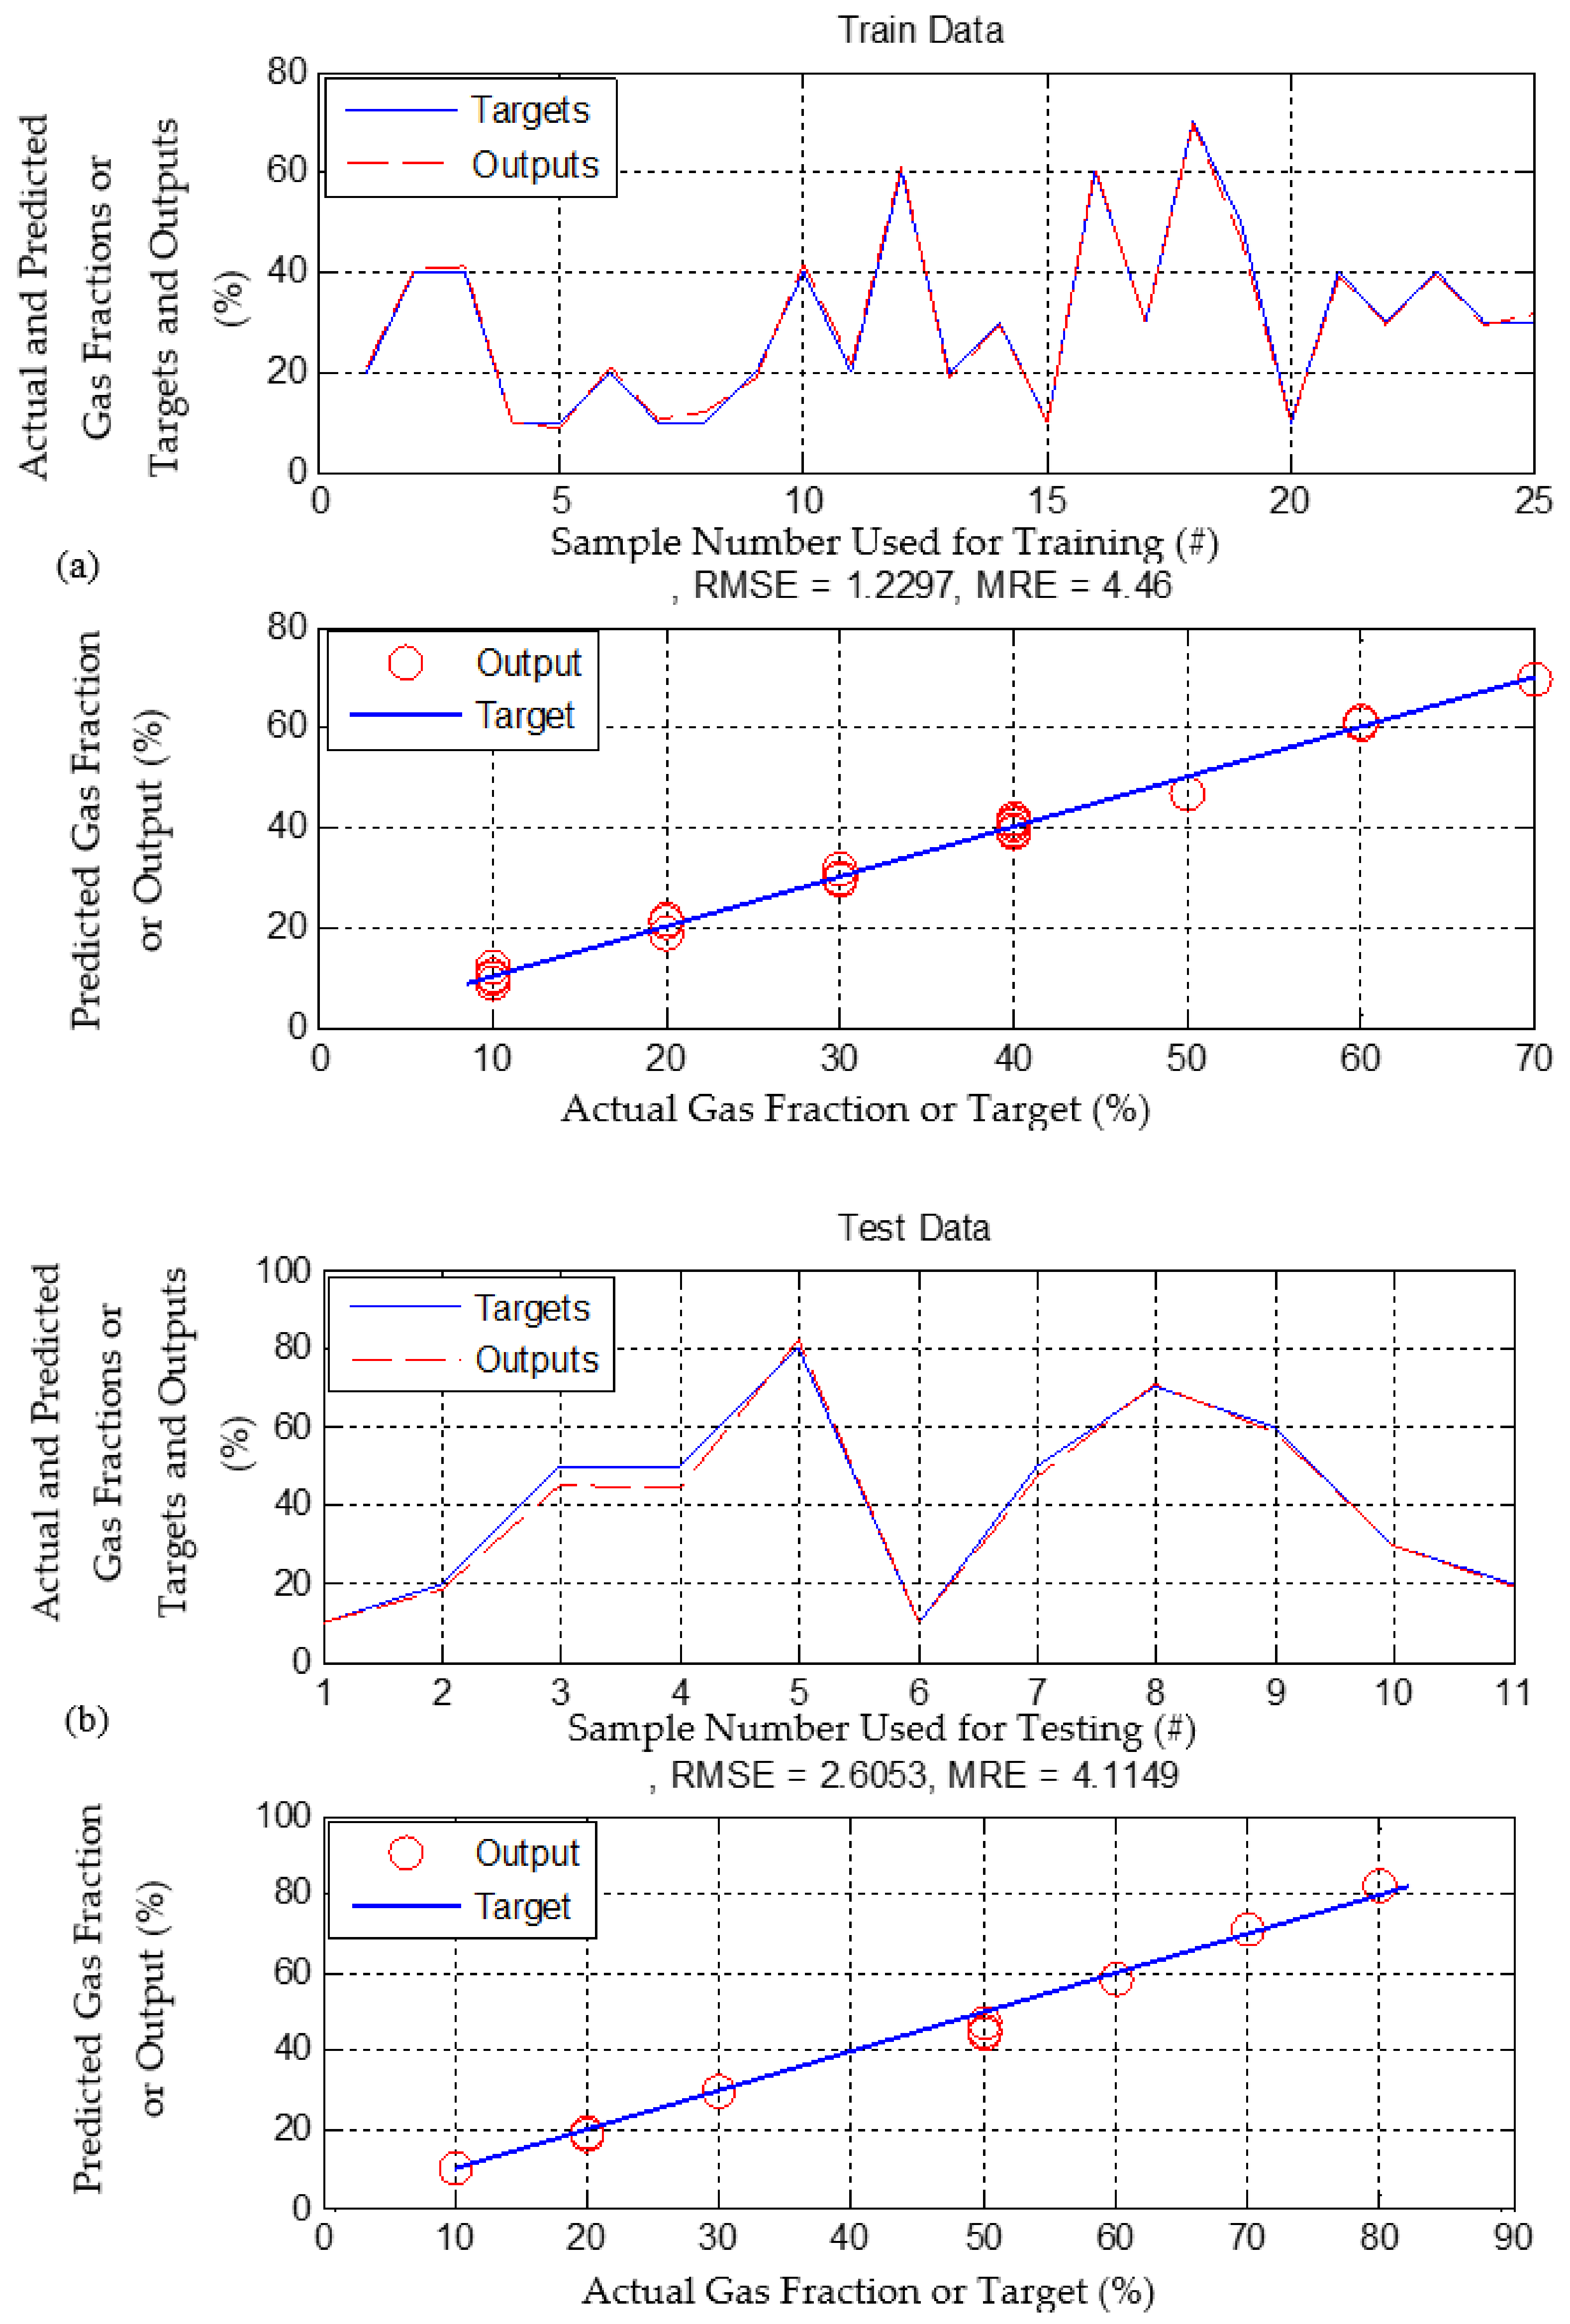
| Stratified | Gas Fraction | 1.22 | 2.60 | 4.46 | 4.11 |
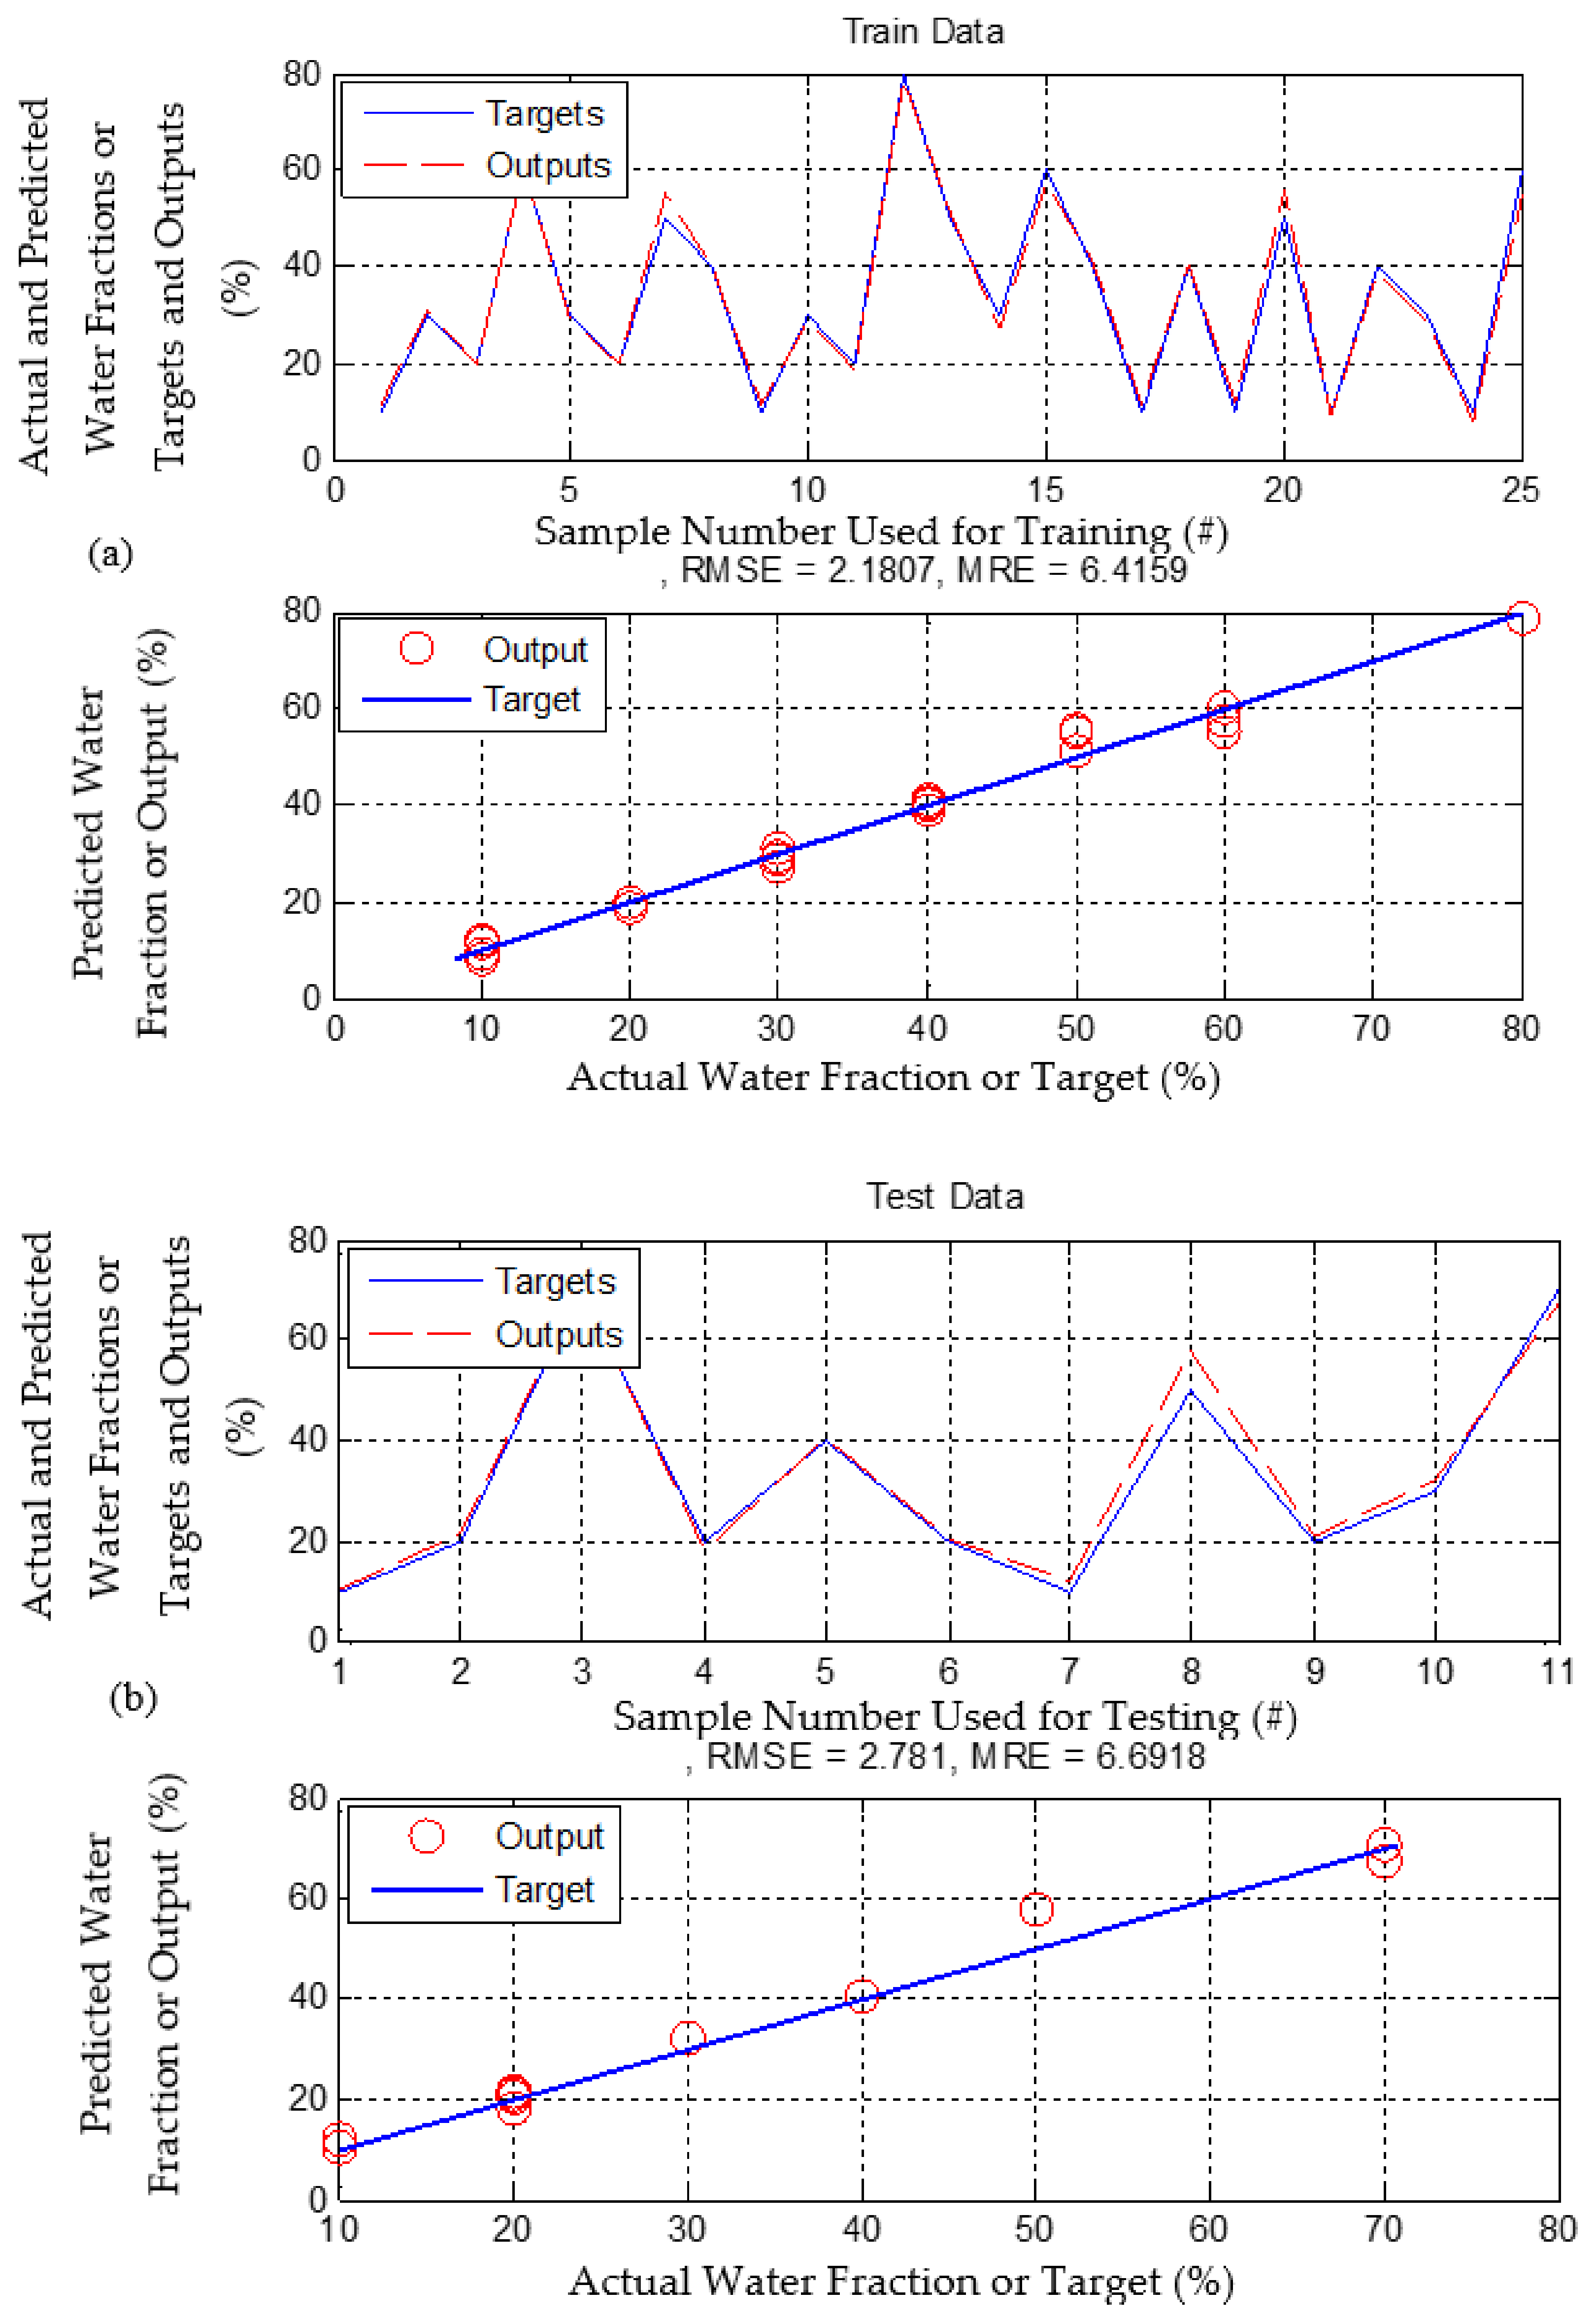
| Stratified | Water Fraction | 2.18 | 2.78 | 6.41 | 6.69 |
Publisher’s Note: MDPI stays neutral with regard to jurisdictional claims in published maps and institutional affiliations. |
© 2021 by the authors. Licensee MDPI, Basel, Switzerland. This article is an open access article distributed under the terms and conditions of the Creative Commons Attribution (CC BY) license (https://creativecommons.org/licenses/by/4.0/).
Share and Cite
Roshani, G.H.; Muhammad Ali, P.J.; Mohammed, S.; Hanus, R.; Abdulkareem, L.; Alanezi, A.A.; Nazemi, E.; Eftekhari-Zadeh, E.; Kalmoun, E.M. Feasibility Study of Using X-ray Tube and GMDH for Measuring Volume Fractions of Annular and Stratified Regimes in Three-Phase Flows. Symmetry 2021, 13, 613. https://0-doi-org.brum.beds.ac.uk/10.3390/sym13040613
Roshani GH, Muhammad Ali PJ, Mohammed S, Hanus R, Abdulkareem L, Alanezi AA, Nazemi E, Eftekhari-Zadeh E, Kalmoun EM. Feasibility Study of Using X-ray Tube and GMDH for Measuring Volume Fractions of Annular and Stratified Regimes in Three-Phase Flows. Symmetry. 2021; 13(4):613. https://0-doi-org.brum.beds.ac.uk/10.3390/sym13040613
Chicago/Turabian StyleRoshani, Gholam Hossein, Peshawa Jammal Muhammad Ali, Shivan Mohammed, Robert Hanus, Lokman Abdulkareem, Adnan Alhathal Alanezi, Ehsan Nazemi, Ehsan Eftekhari-Zadeh, and El Mostafa Kalmoun. 2021. "Feasibility Study of Using X-ray Tube and GMDH for Measuring Volume Fractions of Annular and Stratified Regimes in Three-Phase Flows" Symmetry 13, no. 4: 613. https://0-doi-org.brum.beds.ac.uk/10.3390/sym13040613