
An Infrared and Visible Fusion Framework Based on a Novel Decomposition Method

1
School of Physics and Electronic Information, Yunnan Normal University, Kunming 650500, China
2
Yunnan Key Laboratory of Optic-Electronic Information Technology, Yunnan Normal University, Kunming 650092, China
*
Authors to whom correspondence should be addressed.
Symmetry 2022, 14(4), 786; https://0-doi-org.brum.beds.ac.uk/10.3390/sym14040786
Submission received: 12 March 2022
/
Revised: 29 March 2022
/
Accepted: 6 April 2022
/
Published: 9 April 2022
(This article belongs to the Special Issue Symmetry in Image Processing and Visualization)
Abstract
:Image fusion is one of the most rapidly evolving fields in image processing today, and its applications are widely expanded in various fields. In the field of image fusion, the method based on multi-scale decomposition plays an important role. However, it faces many difficult puzzles, such as the risk of over-smoothing during decomposition, blurring of fusion results, and loss of details. Aiming at these problems, this paper proposes a novel decomposition-based image fusion framework, which overcomes the problems of noise, blurring, and loss of details. Both the symmetry and asymmetry between infrared and visible images are important research hotspots in this paper. The experiments confirmed that the fusion framework outperforms other methods in both subjective observation and objective evaluation.
1. Introduction
Image fusion integrates the information of different spectral bands in the same scene. The sensors of infrared (IR) imaging can capture the thermal radiation emitted by objects and are extremely sensitive to thermal targets. However, IR images miss background texture details. The visible (VI) image sensors can obtain rich scene information, and they will be interfered with by illumination conditions, fog, occlusion, and so on. The fusion of infrared and visible images has received more and more attention to retain the target and enhance the detail and other useful information for extending the ability of visual perception [1,2,3].
There is a number of image fusion methods proposed for IR and VI images. Existing fusion methods can be classified into four categories: multi-scale transform (MST) [4,5,6,7,8,9,10,11,12,13,14,15], deep learning (DL) [16,17,18,19], sparse representation (SR) [20,21,22], and other methods [23,24,25]. In recent years, deep learning has proved superior and successful in many applications. However, there are some key issues unsolved. One is the complexity of the algorithm. DL needs strong hardware support and is difficult to deploy on embedded platforms. In particular, the training of DL needs a large number of registered image pairs, and the data set is difficult to obtain. Considering the inherent sparse representation of the human visual system, sparse representation methods have also been widely developed [20]. Other methods include total variation [15], principal components analysis (PCA) and robust PCA (RPCA) [24,25], intensity-hue-saturation (IHS) transform [26], etc. As a popular image fusion method, the multi-scale fusion theory (MST) has been successfully used in various application scenarios. The large-scale structure of an image usually contains background information and large size targets, while the small-scale structure usually represents details and texture information. A large number of algorithms have been widely proposed, such as the Laplacian pyramid (LAP) [4], discrete wavelet decomposition (DWT) [6,7], dual-tree complex wavelet transform (DTCWT) [8,9], non-subsampled contourlet transform (NSCT) [10], curvelet transform (CVT) [11], multi-resolution singular value decomposition (MSVD) [12], etc. However, these decomposition-based fusion methods have problems such as detail blurring due to excessive smoothing.
To tackle the above challenge, guided filtering (GF) was proposed by Li et al. for their image fusion framework [13]. Especially in recent years, various edge-preserving filtering methods have shown promising applications in image fusion [14,27,28,29,30,31]. For example, Ma et al. [28] used rolling guided filters to construct multi-scale images, which can separate scale information better in scale space and make the fused image have a good visual effect. Although these methods can improve the fusion results, they cannot reach the right scale separation for image features and often lose some salient information of the source image. In addition, they are still seriously troubled by low contrast and blurred details.
In the traditional filtering process, the filtering window always slides on the image. If the edge in an image is just in the center of a filter window, the filtering outputs a weighted average value of the filter window. However, the edge of the filtering operation on the image may be blurred. To avoid the problem, Yin et al. [29] proposed the method called side window filtering (SWF). Yan and Li [30] first used SWF to improve the two linear filters and applied it to the decomposition stage in image fusion, which proved the great potential of SWF. Subsequently, Yin et al. [31] applied the SWF technology to improve the guided filter called side window guided filter (SWGF), which has better edge protection performance than the improved linear filter. In this paper, the good edge-preserving property of SWF technology has been used to guide the process of image fusion.
In general, the filter based on the MST image fusion method consists of three steps. (1) The scale space is constructed to obtain the detail components with high-frequency information and the base components with low-frequency information; (2) According to the characteristics of the corresponding scale components, the fusion strategy is formulated; (3) The fusion image is reconstructed. After multi-scale decomposition, the base components mainly describe the energy distribution of the source image, without details and noise. Detail components mainly describe texture information, including detail distribution and noise. However, IR images are characterized by high contrast, strong edges, and a lack of detailed information. A VI image is characterized by uniform brightness and contains a lot of detailed information. Therefore, it is crucial to choose the right integration strategy. Most of the base components adopt simple “average” fusion rules. This rule is fast and effective, but it ignores the difference in brightness between the two bands of images.
This paper proposes a novel fusion scheme based on the SWGF, which can selectively retain the details of interest parts and effectively suppress noise. The common issue between infrared and visible images is the symmetry of visual quality for implementing practical applications. Furthermore, the asymmetry between infrared and visible images can produce complementarity to improve visual quality and system performance. Both the symmetry and asymmetry between infrared and visible images are important research hotspots in this paper. The main contributions of our work are as follows: (1) We propose a novel decomposition method using the SWF-Gaussian filter. The saliency information can be retained to the maximum extent during the image fusion process, and the halo artifact near the firm edges can be reduced. (2) We develop a brand-new framework for IR and VI image fusion. Moreover, regularization technology is employed to balance the degree of fusion.
2. Materials and Methods
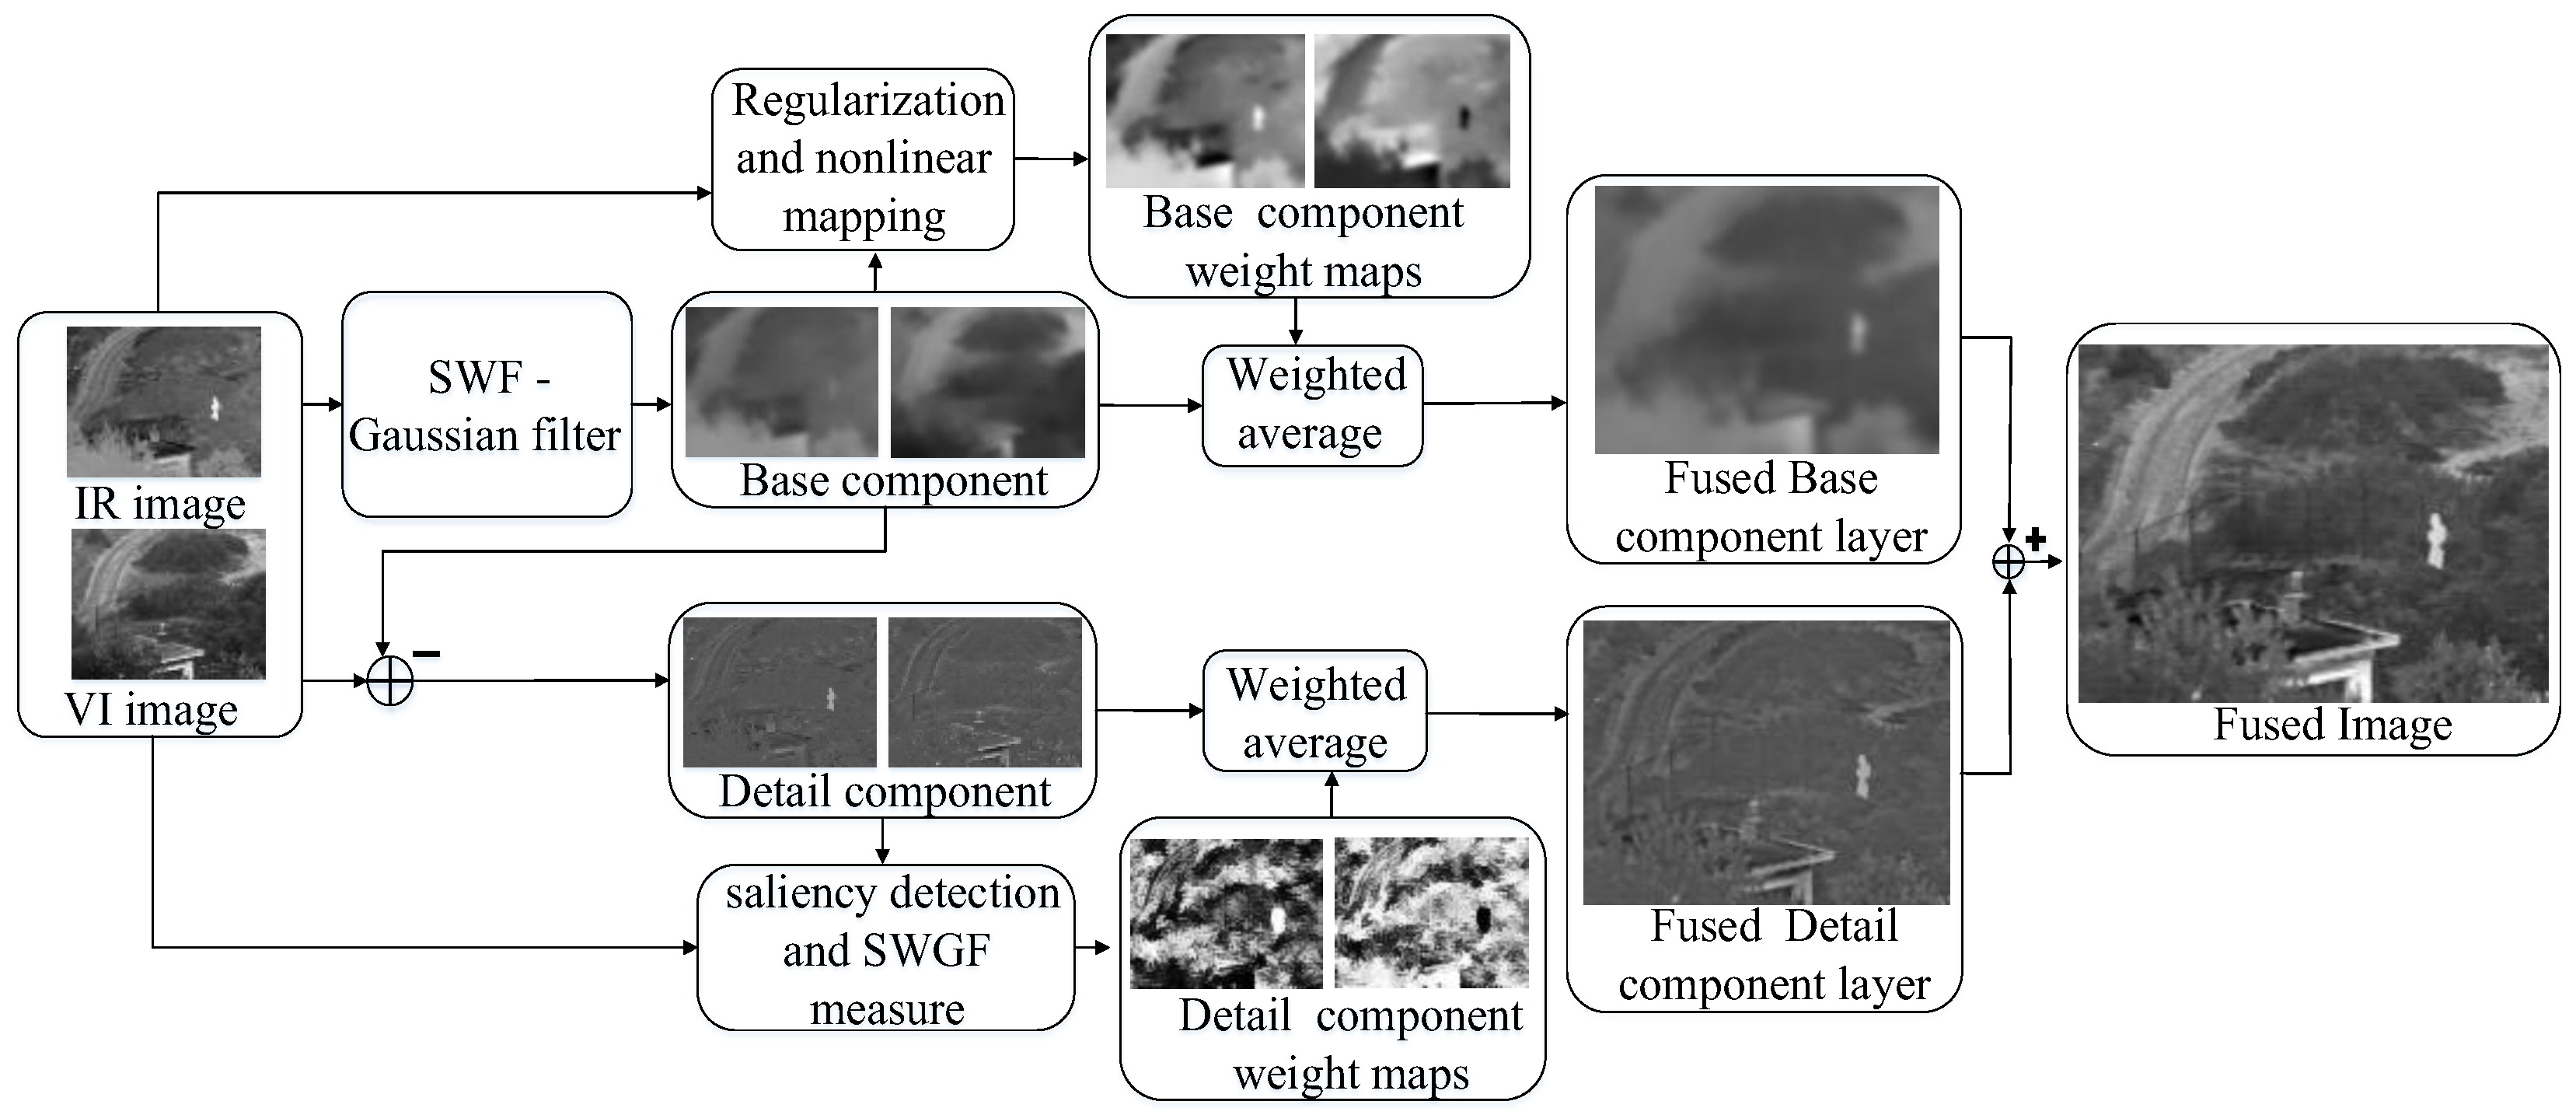
In this paper, we propose a new decomposition method to obtain the scale feature information of infrared and visible light images by scale decomposition, and then a new fusion framework is proposed to well reconstruct this scale feature information in the fused image. Figure 1 shows the flowchart of the proposed new fusion framework.
It is proposed to decompose the information contained in the source image into basic components and detail components, which correspond to the high-frequency and low-frequency information of the source image, respectively, as shown in Figure 2, Figure 3, Figure 4 and Figure 5. It is also demonstrated that the benefits of having fewer artifacts and halos in detail components. The guiding strategy of multi-strategy fusion is to preserve and balance the basic components of infrared and visible light images as much as possible, and to highlight the detail components in both. The purpose of regularization and nonlinearity is to remap the gray levels of infrared and visible light images, balance the gray level difference between the two, and retain large-scale information as much as possible. The control fusion ratio of IR and VI images is to provide the user with an optional parameter to adjust the background tendency of the fused image.
2.1. Multi-Scale Decomposition Based on SWF-Gaussian Filtering
Gaussian filter is a kind of simple linear filter, which is easy to use and has little calculation. However, Gaussian filter blurs all edges, which may cause halos and artifacts near the edges [28]. As an edge-preserving technology, the SWF technology was first proposed by Yin et al. The main idea of this technique is to keep the kernel function of the filter unchanged and construct several side windows around the image edge pixels in the filtering process. The output of the optimal side window is selected as the filtering result to avoid the blur caused by the filter window crossing the edge. Gaussian filtering and SWF-Gaussian filtering are respectively expressed as:
J represents the input image. The parameters and are the filtering radius and standard deviation, respectively. Their iterative updating formulas can be expressed by Equations (3) and (4), respectively.
here , , , are the same as those in Equations (1) and (2), and represent iteration t-time filtered images obtained by Gaussian filtering and SWF-Gaussian filtering, respectively. The initial input images are and .
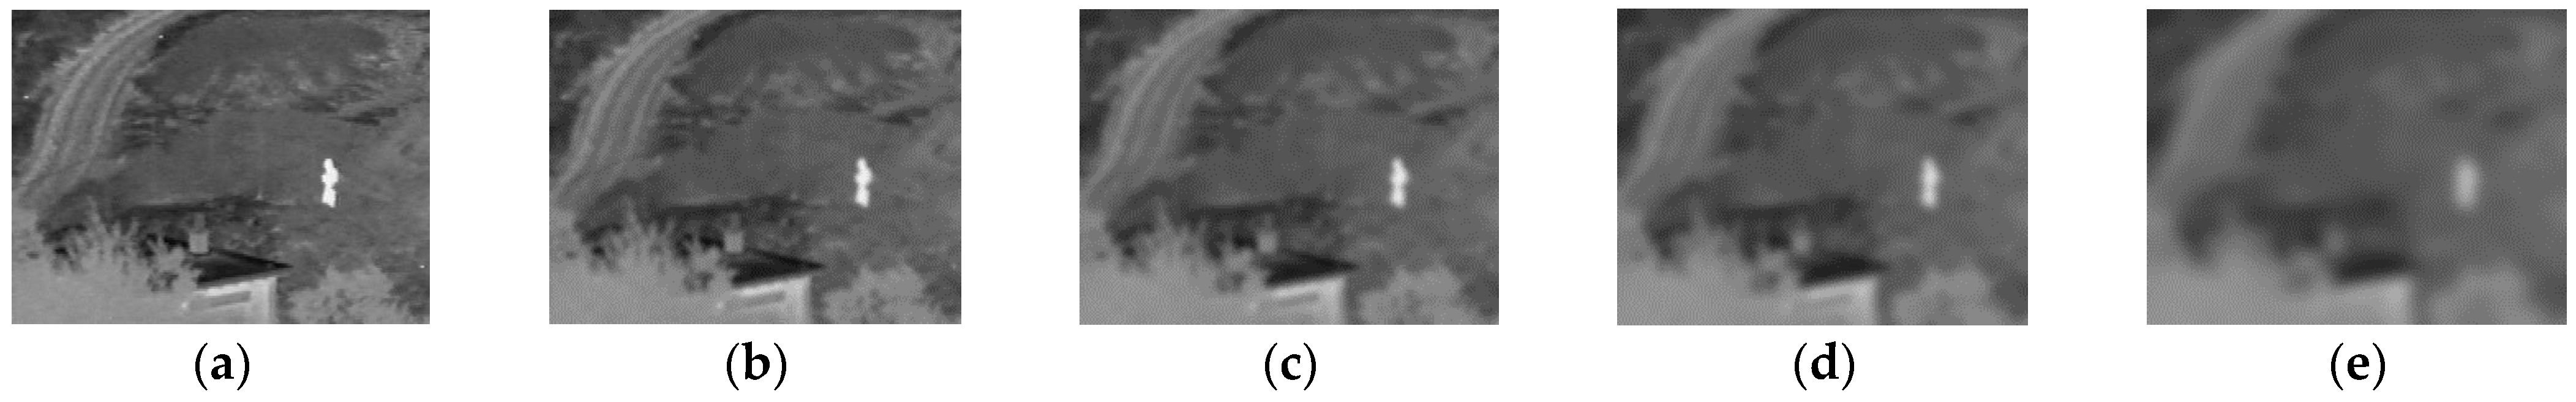
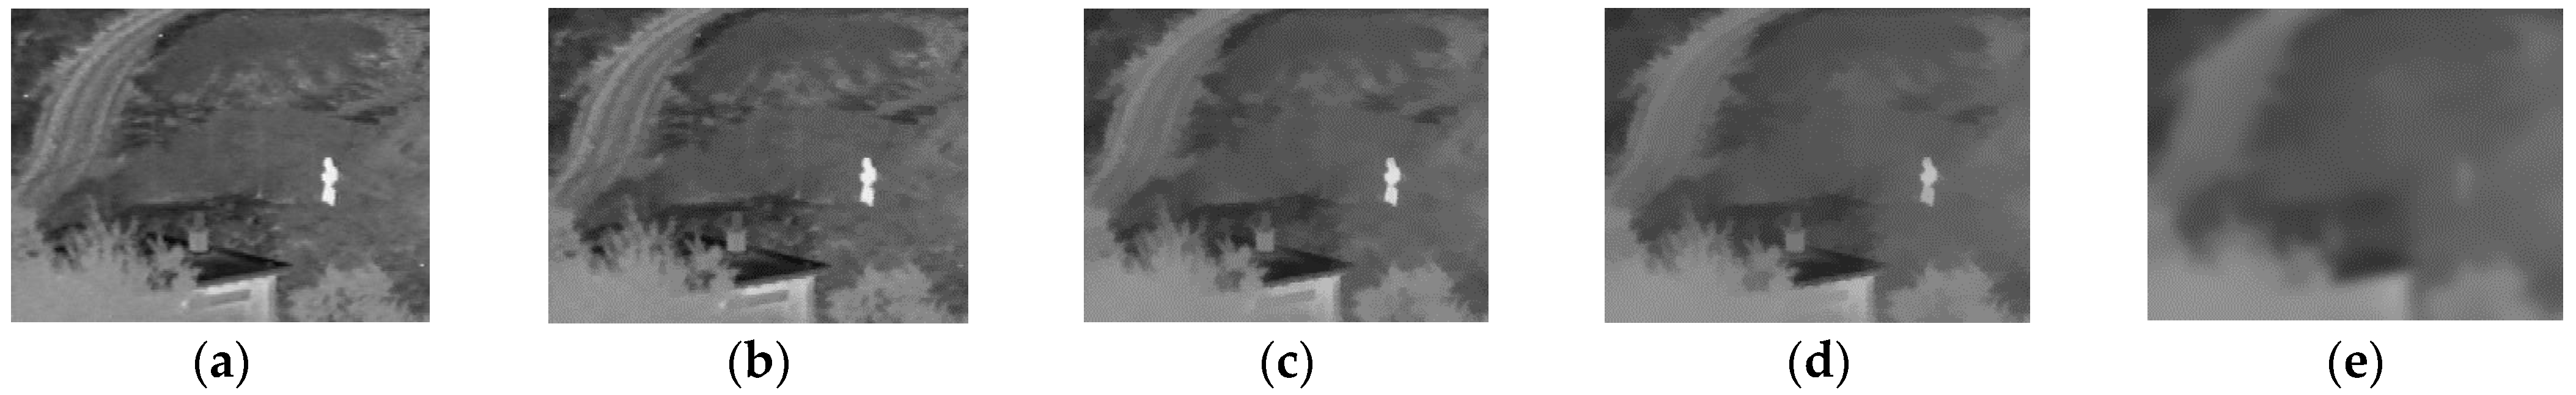
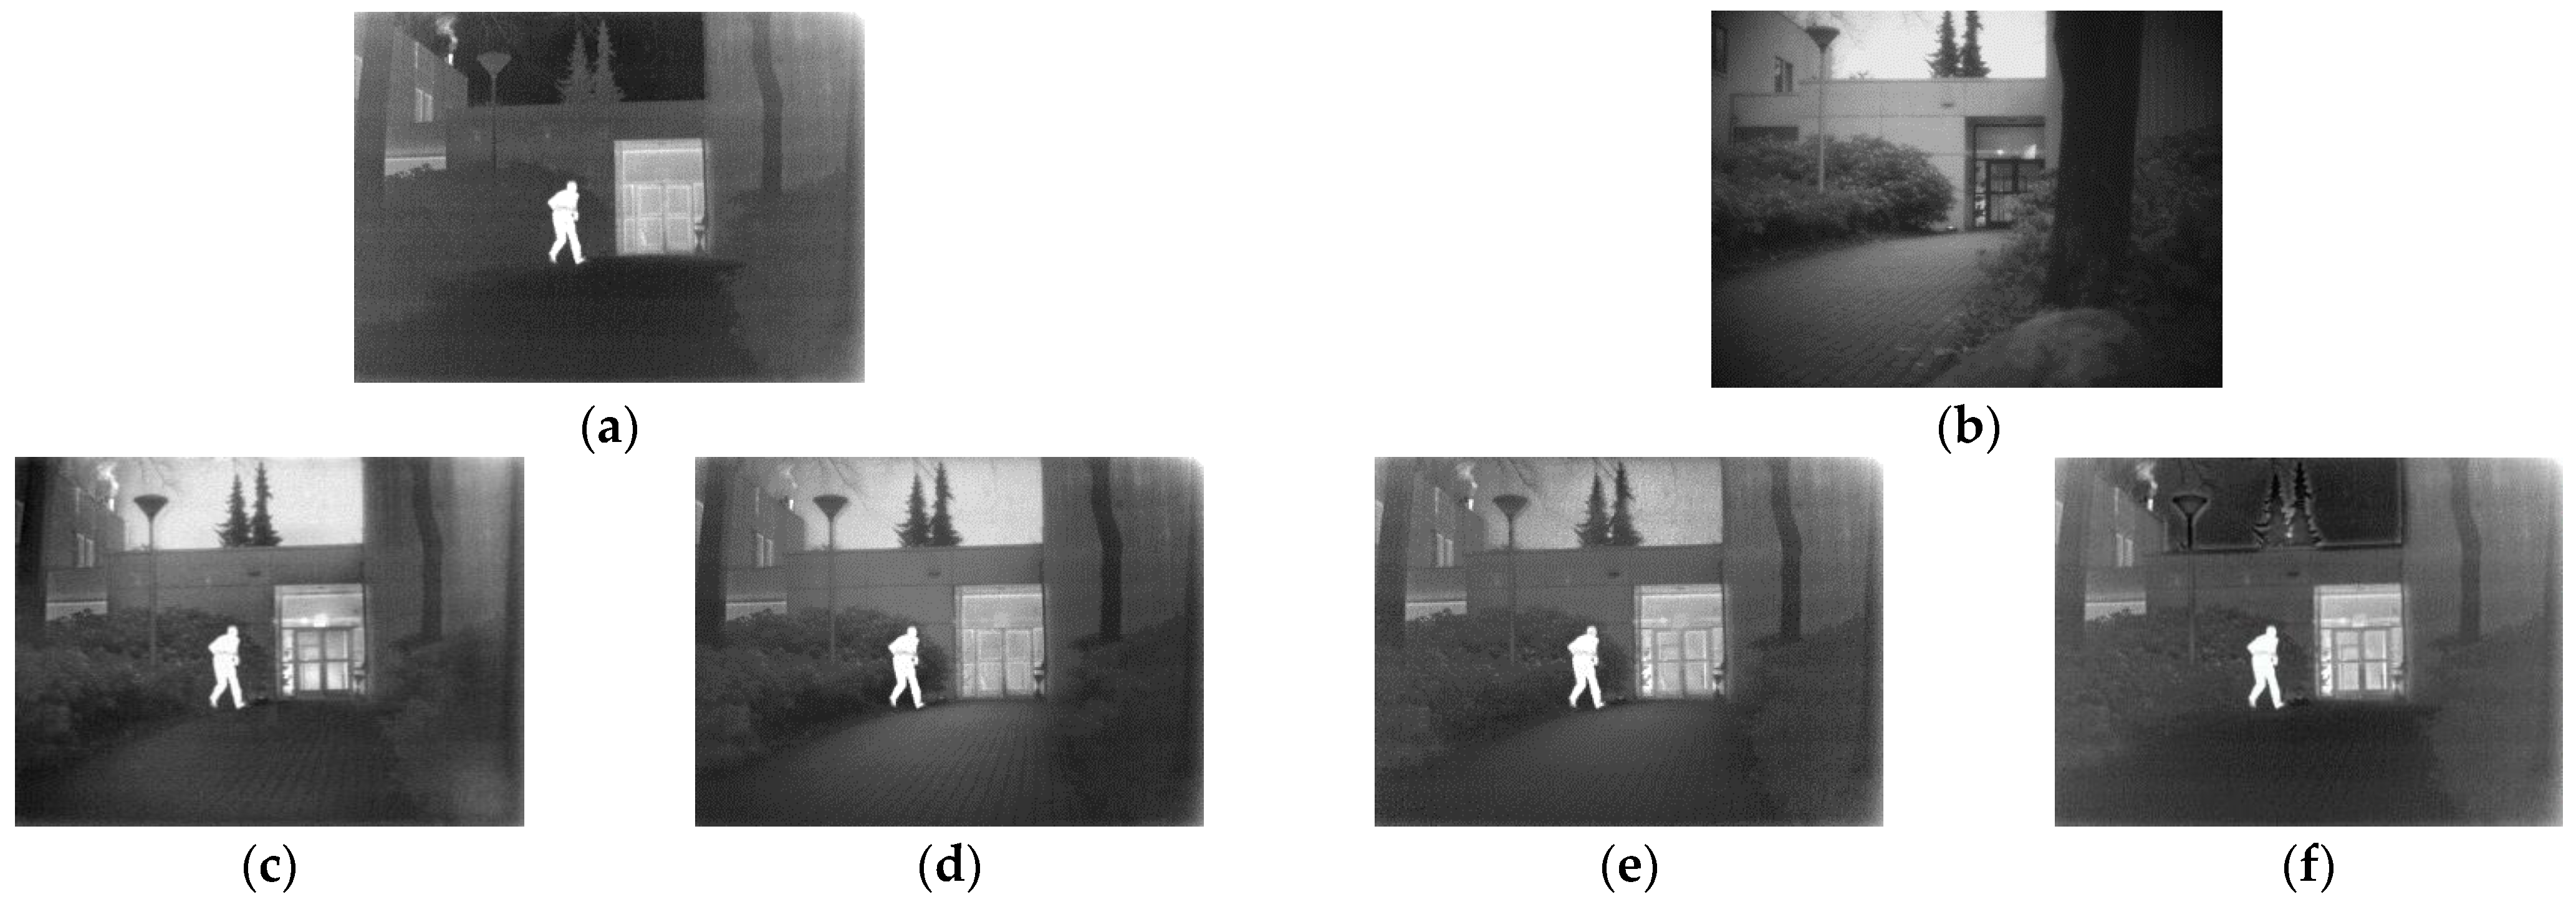
Figure 2a and Figure 3a are input images. Figure 2b–e shows the results of iterating the input images using a Gaussian filter and repeating the smoothing four times. It can be seen that the edge features become more and more blurred. It will cause bad results when extracting the detail components, which will be explained in the following section. Figure 3b–d show three iterations of smoothing using the SWF-Gaussian filter. They can not only blur the image but also preserve the edges of the large-scale structure. Figure 3e is the blurring image of Figure 3d with the Gaussian filter, which will be used as the base components for obtaining the detail components.
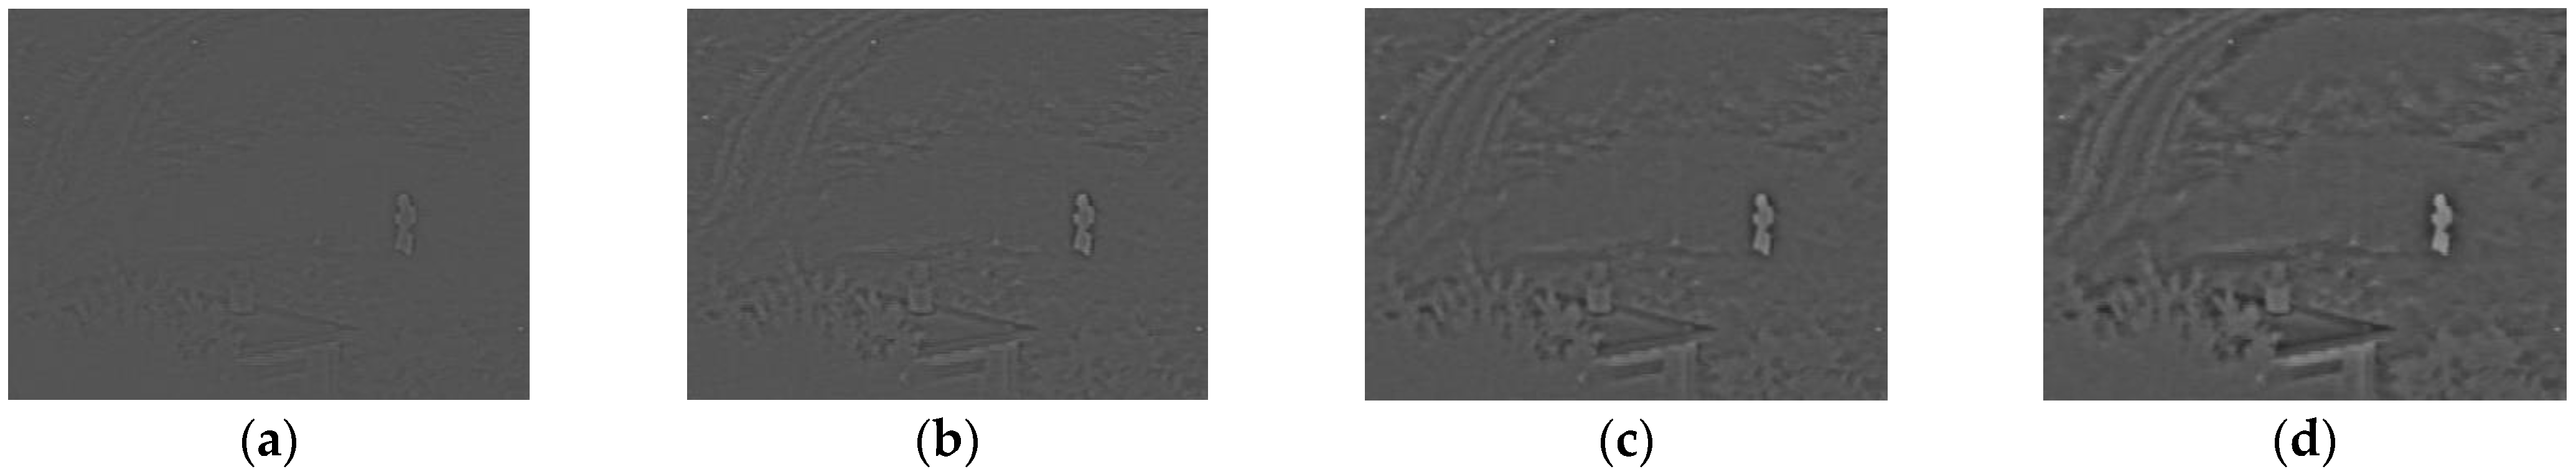
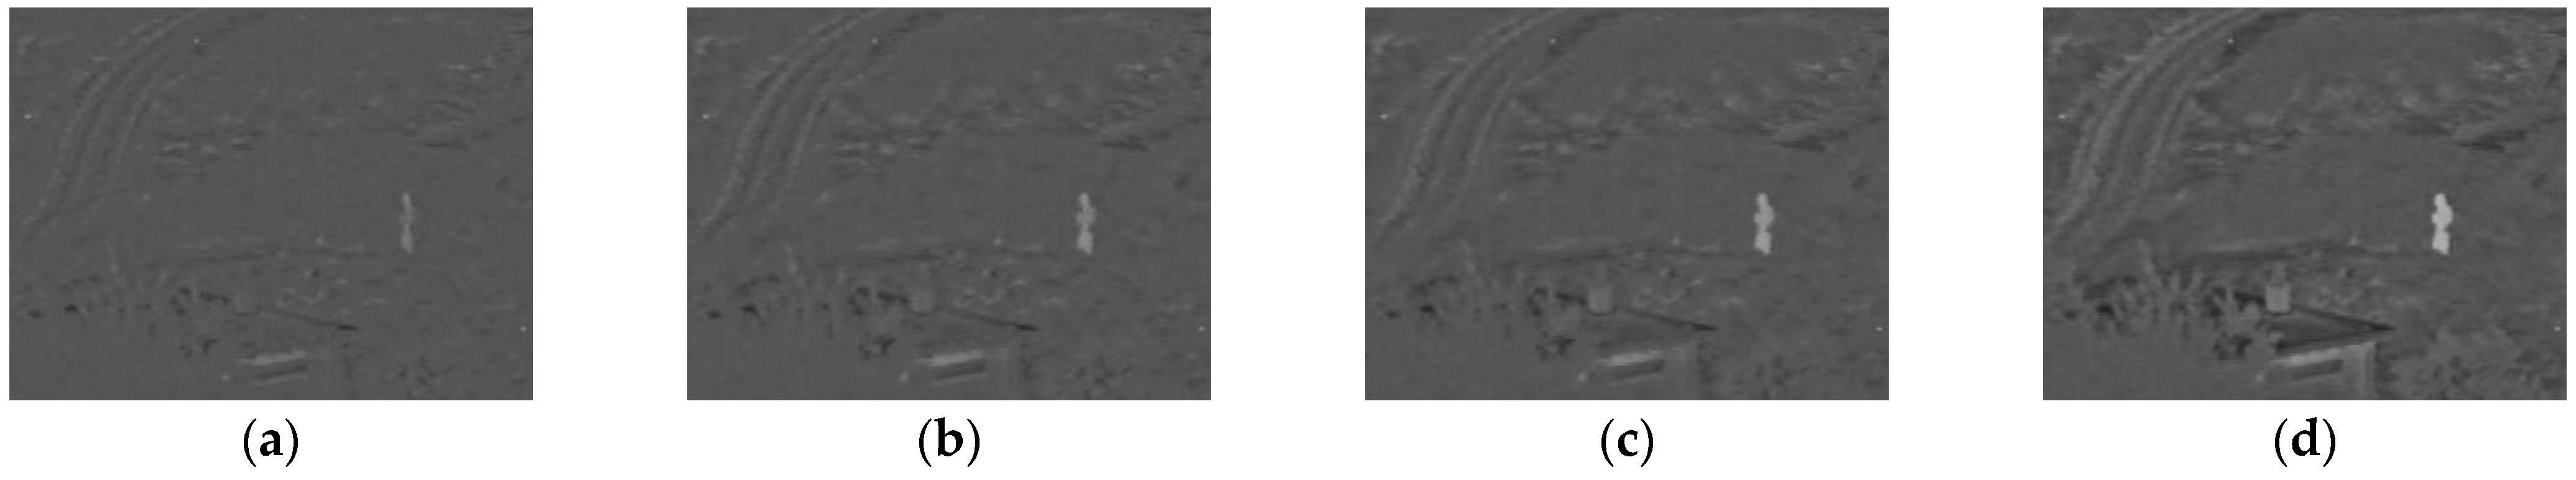
The detail components are obtained by the difference between the blurring images and the source image. In Figure 4, we can see that the Gaussian filter can output better detail components, but it has inevitable halo artifacts phenomena. For example, there is a circle of halo artifacts around the “person” in the image. The target person is not well-extracted. In contrast, Figure 5 is almost free of halos. Especially, Figure 5d shows that not only the detailed information is effectively extracted, but also the edge of the target is preserved. This effectively overcomes the halo artifacts.
Based on the above analysis, we propose a novel scheme to address halo artifacts. The scheme can obtain the base components with a combination of SWF-Gaussian filter and Gaussian filter. First, the SWF-Gaussian filter is iteratively used to produce blurred images with good edges, and then Gaussian blurring is used to produce the base components for obtaining detail components that are rich in detail but free of halos and artifacts, as follows:
where and represent IR and VI source images, respectively, and superscript represents the SWF-Gaussian filter iteratively from time t to t + 1. In our method, the IR base components and the VI base components are obtained by SWF-Gaussian filtering iteratively followed by Gaussian blurring. After that, the IR detail components and VI detail components are obtained by Equations (9) and (10).
The base components are not necessary to be iteratively produced through the SWF-Gaussian filtering. It is a fast and effective method to select a larger standard deviation to obtain the base components.
2.2. Base Components Fusion Base on Regularization and Nonlinearity
The decomposition components of different scale-spaces were obtained from the source image. The base components contain the general appearance structure of the source image and determine the overall brightness distribution. To keep the robustness of the base components, the imaging differences of two different bands need to be considered. The purpose of base components is to keep the large-scale structure and salient target of the two band images unchanged. The target in the infrared image is bright, while the background appears black in the IR image. Moreover, the dynamic range is extensive, so normalization was performed for better fusion.
where represents the brightness of the IR base components with normalized brightness and is the mean. To further enlarge the distance of the effective value, is further processed.
where max() and min() are the maximum and minimum functions. reflects the characteristic distribution of IR base components. The base fusion components of IR and VI directly determine the background style of the fusion image. This paper proposes to use a nonlinear mapping function to adjust the propensity of fused image background style in IR and VI source images. Here, a nonlinear transform is introduced to further control the fusion ratio of IR and VI images:
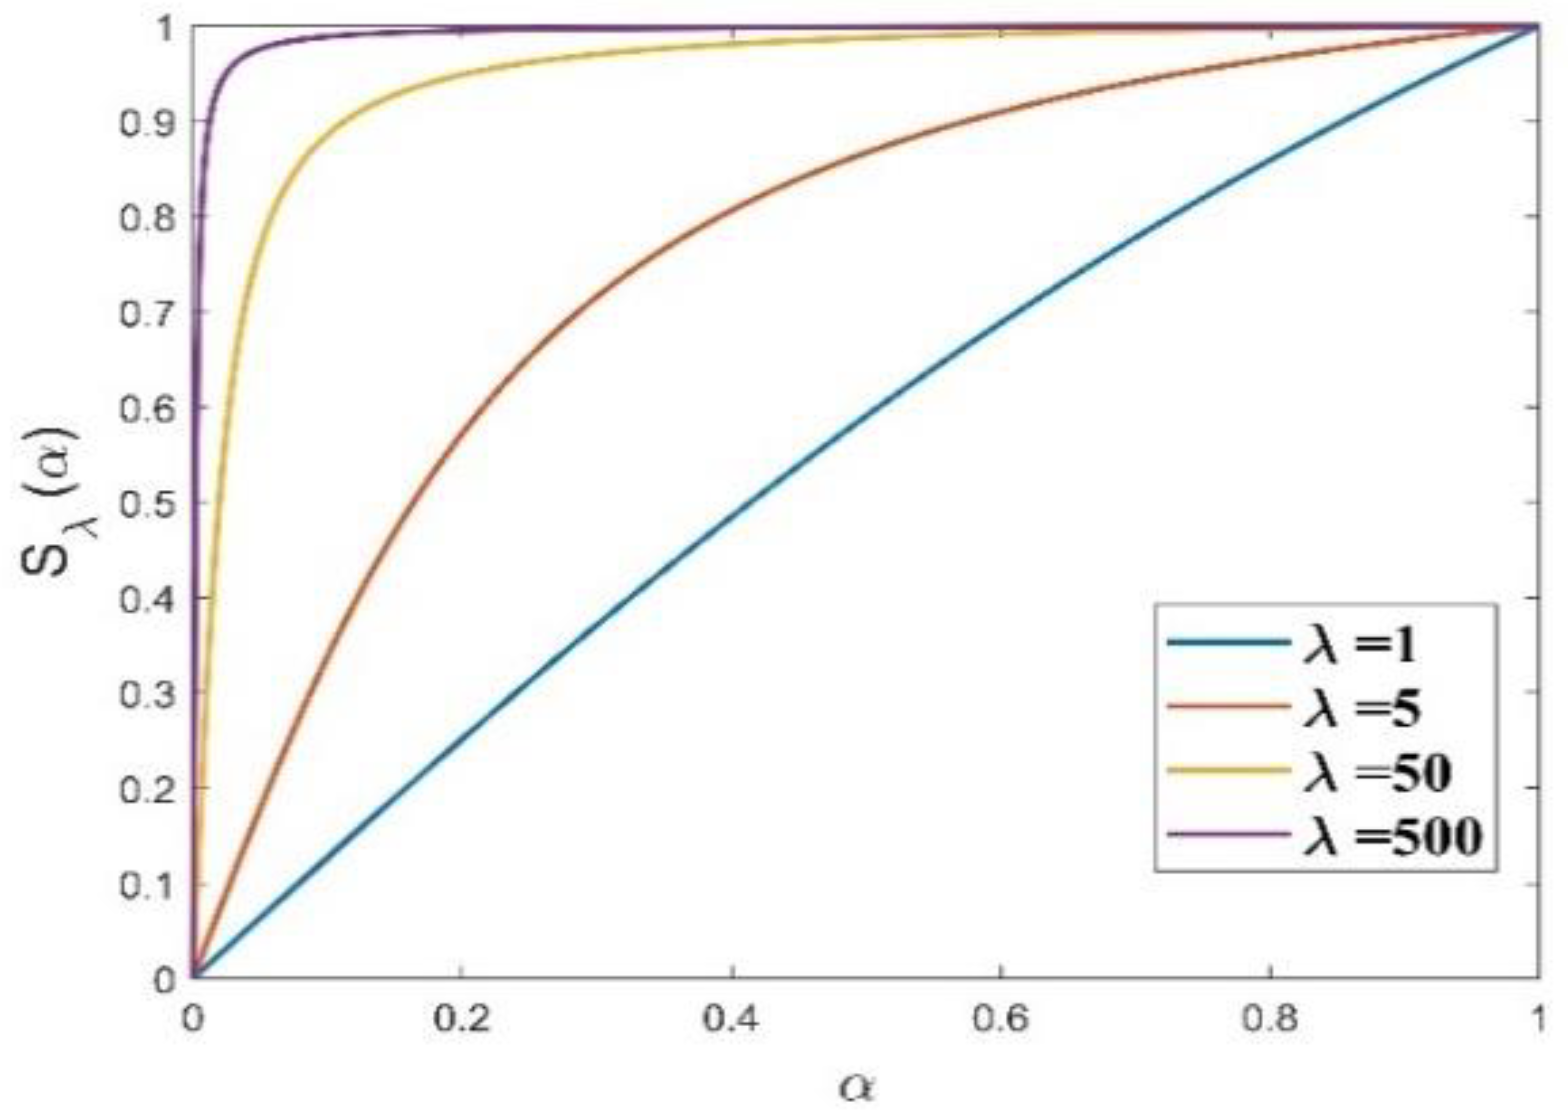
where the range of is (0,1), represents a regularization parameter greater than 0 entered by the user. From Figure 6, we can see that when , the value is close to , and the fusion rule tends to “average” fusion rule. When , the value is close to 1, and the fusion process tends to the “maximum absolute value” fusion. Therefore, the IR image fusion ratio can be controlled by adjusting the value of the parameter . Finally, the fusion weights and of the base components are obtained.
The base components fusion can be expressed by
2.3. Detail Components Fusion Base on SWGF
In general, the detail components contain the texture information. However, the detail components of the two band images are very inconsistent and have complementary properties. The target of the detail components obtained by our decomposition method is prominent and the edge is good, but it also inevitably contains significant noise. Our objective is to transmit valid information and not noise. In this paper, we apply a simple and practical technique to inject bright and significant features from IR images directly into VI images, as follows:
where represents the salient feature of the IR detail components. is calculated with the same method. At the same time, the transmission of noise should be reduced. In this work, a practical optimization method based on the SWF technique improved side window guidance filter (SWGF) is proposed. SWGF can effectively reduce the interference of noise in the process of information transmission and better preserve the edges of the target. Filtering operation is denoted as follows:
where represents the side window guided filtering function operation, and and represent the weights of the detail components of the two waveform images, respectively. and represent the window radius and standard deviation parameters of SWGF, respectively.
Then, the detail components fusion is obtained from the linear weighting of the weight map. It is worth noting that the weight map of the detail components should be normalized to [0, 1].
2.4. Reconstruction
Generally, image reconstruction is the inverse operation of image decomposition. In the multi-scale image decomposition process proposed in this paper, the detail layer component is obtained by subtracting the base layer component from the original image. Based on this idea, the fusion image reconstruction is performed by adding the base layer fusion component and the detail layer fusion component.
Eventually, the fused image is reconstructed by simple linear addition.
The flow of the proposed Algorithm 1 in this paper is shown as follows:
| Algorithm 1: New algorithms for fusing IR and VI images |
| Input: IR image , VI image , iteration times , parameter . |
| 1: Decompose the input images into base components and detail components through Gaussian filtering and SWF-Gaussian filtering. |
| 2: Calculate the fusion weight of base components part according to Equations (11), (12), (14) and (15). |
| 3: According to Equation (16), the fusion result of the base components part is obtained. |
| 4: Calculate the fusion weight of detail components part according to Equations (17)–(19). |
| 5: According to Equation (20), the fusion result of the detail components part is obtained. |
| 6: The final fusion image is reconstructed by Equation (21). |
| Output: Fused image . |
Figure 7 shows the fusion results, where Figure 7a,b show the IR and VI source images. Figure 7c–f show the fusion results when the base components fusion coefficient is set to , respectively, and the rest of the parameters are set the same. By observing Figure 7c–f, we can learn that when , the background of the fusion image “sky” is relatively bright, and then as the value of becomes larger and larger, the background of “sky” becomes darker and darker. The reason for this phenomenon is that is the parameter to control the fusion ratio of the IR base components. When the value is small, the VI base components occupy a larger fusion ratio, and the background tends to the VI image style as a whole. When the value is large, the IR base components image occupies a large proportion of fusion, and the background as a whole tends to the IR image style. Users can adjust the proportion of fusion by setting to obtain fusion images with different background styles.
3. Results
In this section, several state-of-the-art methods were employed to evaluate the performance of the proposed fusion framework. Both subjective evaluation and objective evaluation were adopted. The comparison algorithms used are as follows: LAP [4], DWT [6], NSCT [10], CVT [11], GFF [14], GTF [15], IFE [32], LPSR [20], and MSVD [12]. The TNO Image Fusion Dataset [31] was chosen for the data required for the fusion experiments.
3.1. Subjective Performance Evaluation
We selected five pairs of well-registered images, which contain various natural and artificial scenes. The fusion results are shown in Figure 8, Figure 9, Figure 10, Figure 11 and Figure 12.
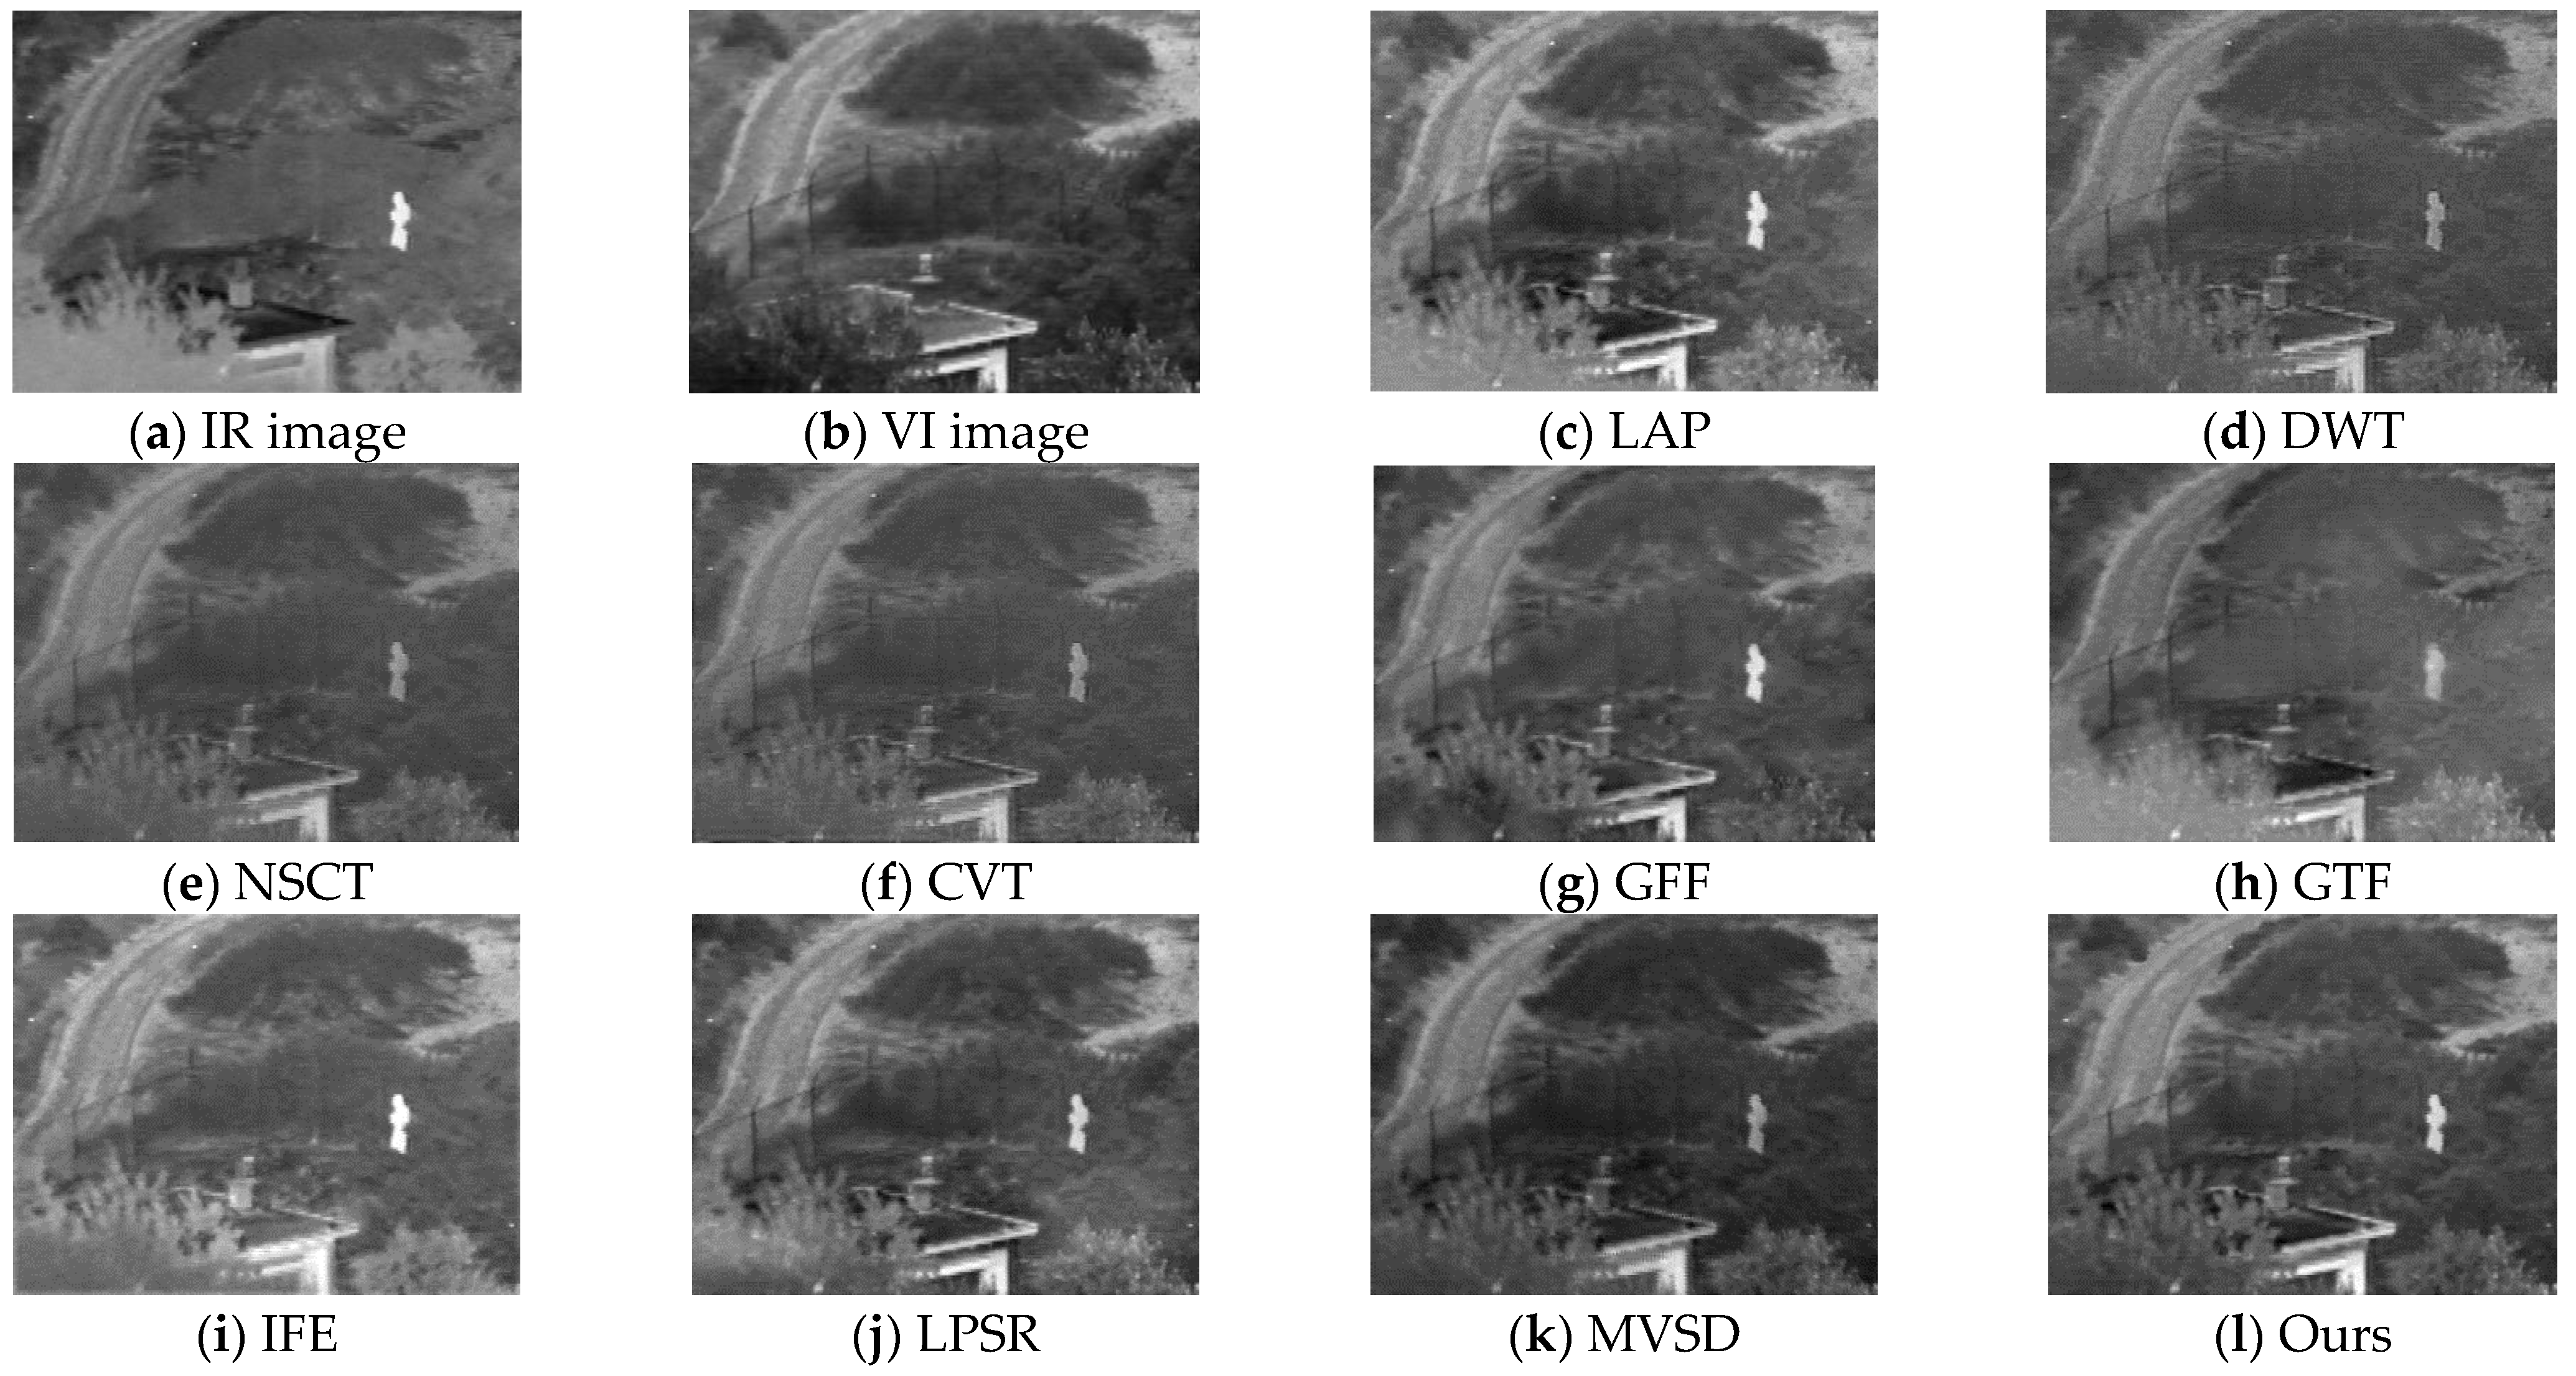
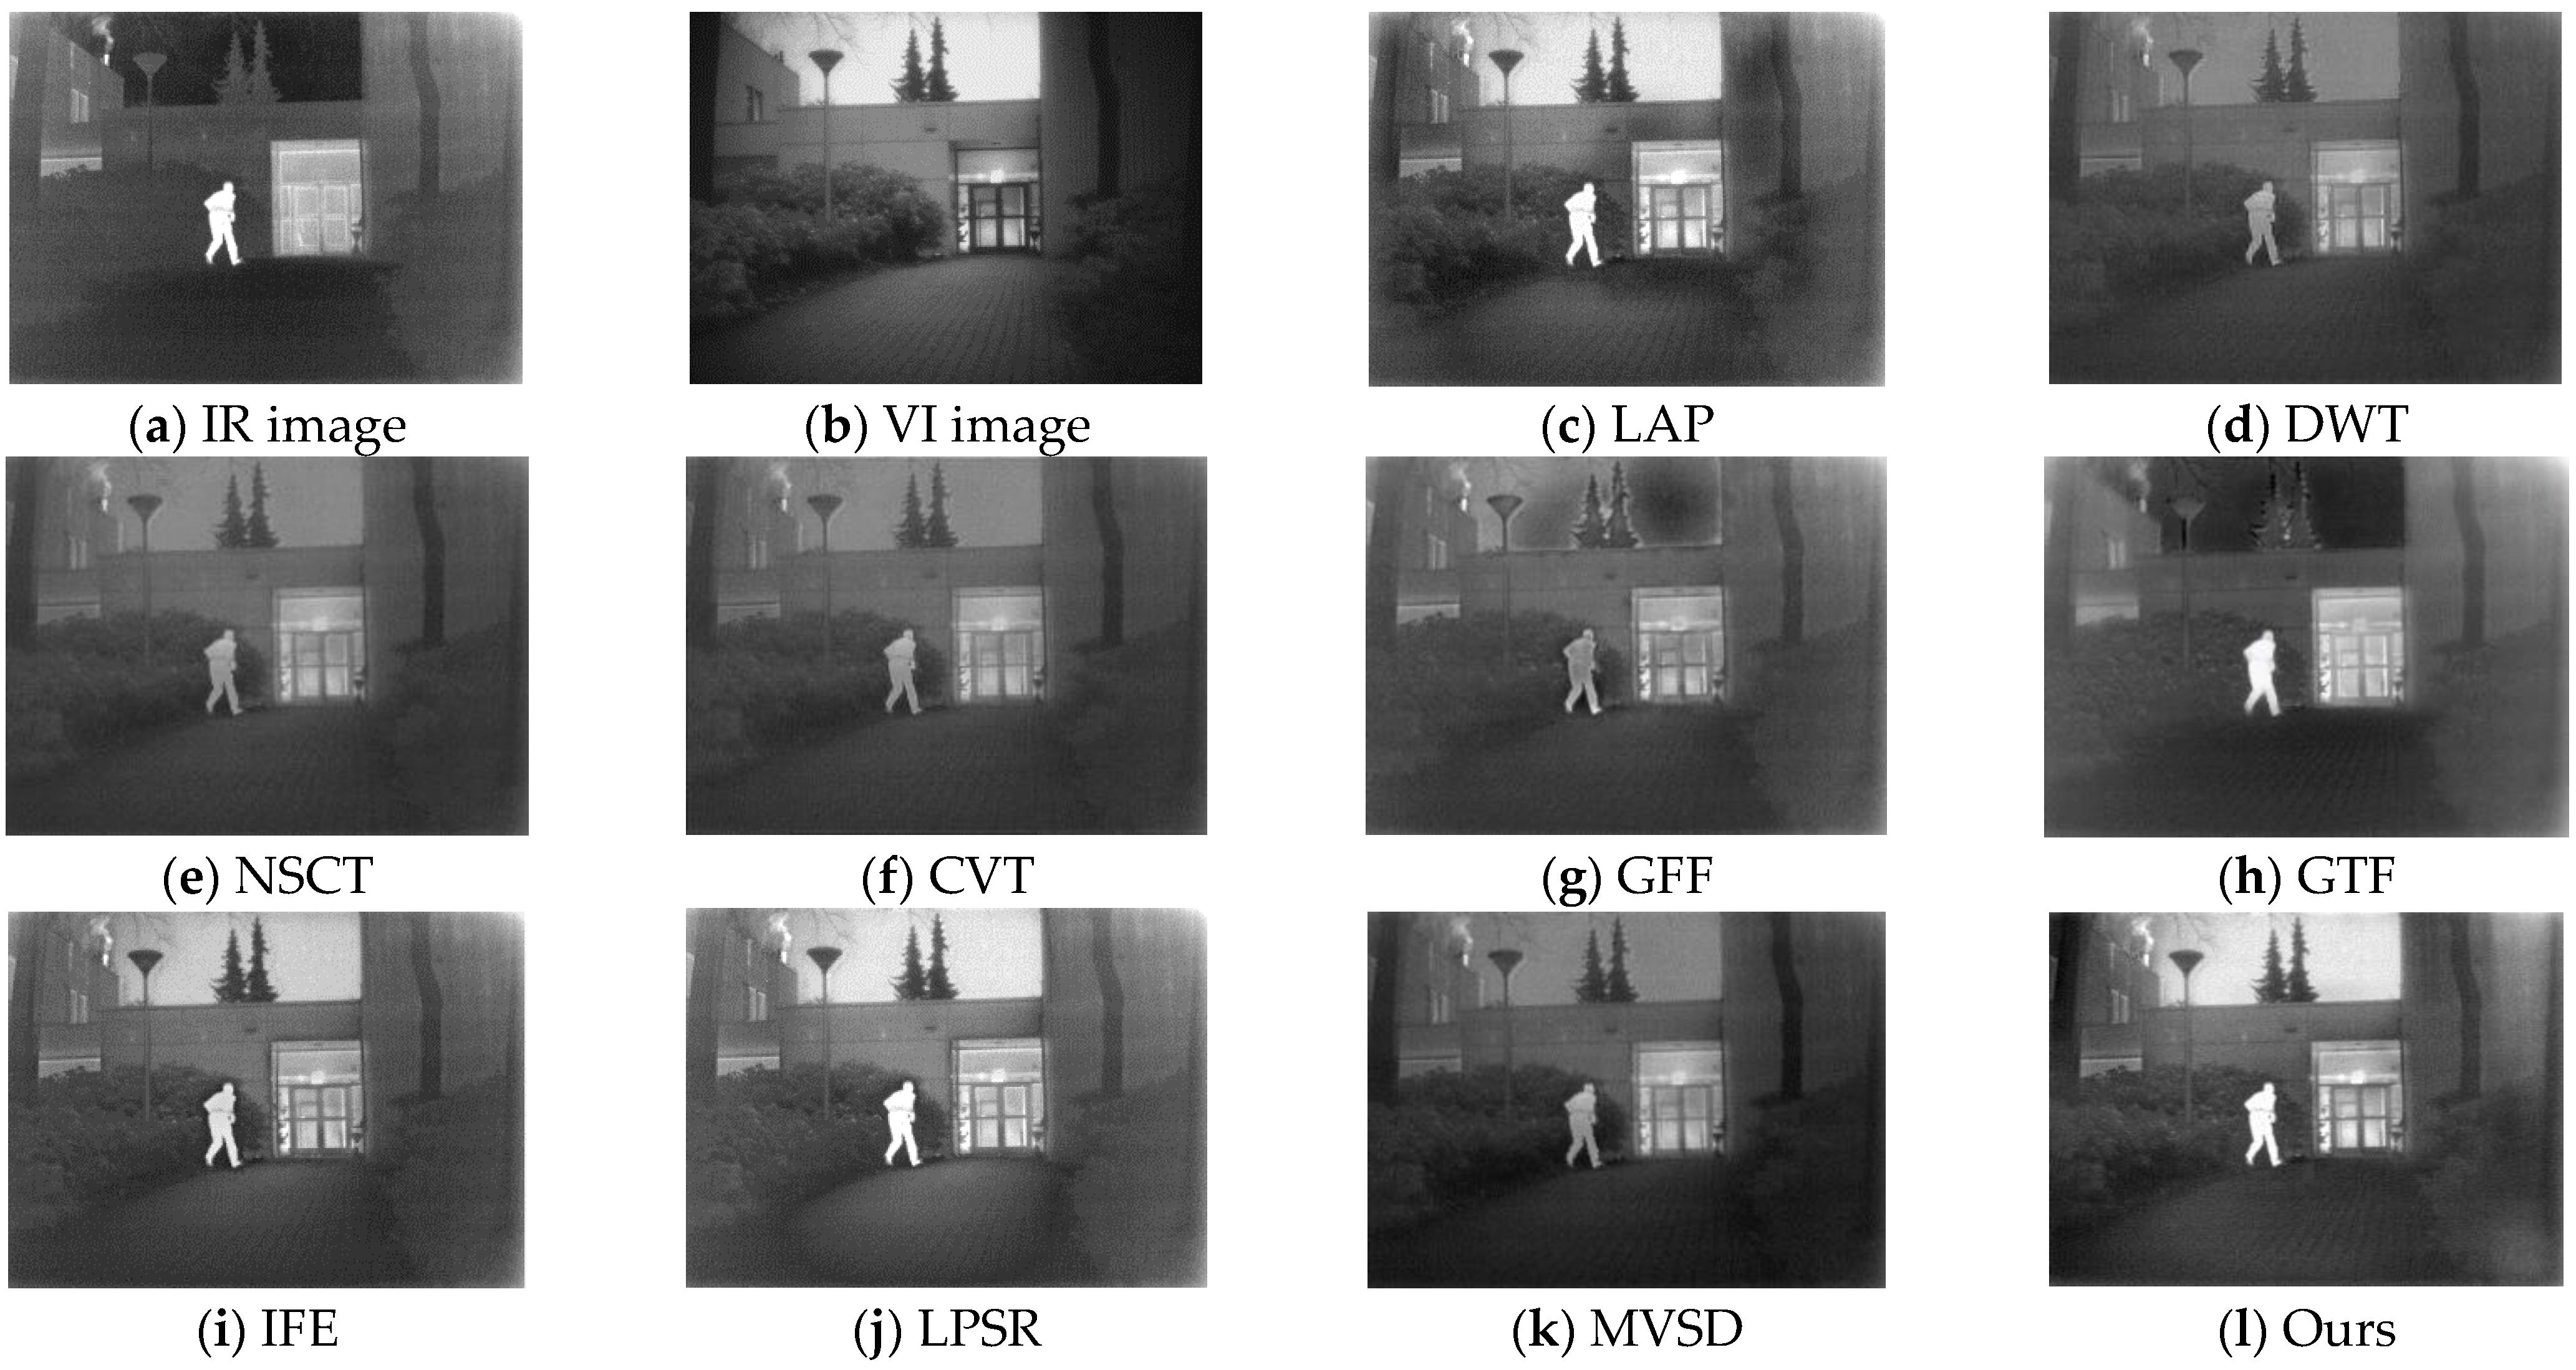
Figure 8 shows the fusion comparison results. Figure 8d–f have low contrast, which results in less prominent targets. Although Figure 8c,g,i,j have normal contrast, the background information loses a lot and the fusion effect is not uniform enough. Figure 8h becomes very blurred and a lot of the source image information is lost. Figure 8k retains much detailed information, but there are artifacts, such as people in the image. As shown in Figure 8l, our new method can achieve not only good contrast but also an obvious target and enough details.
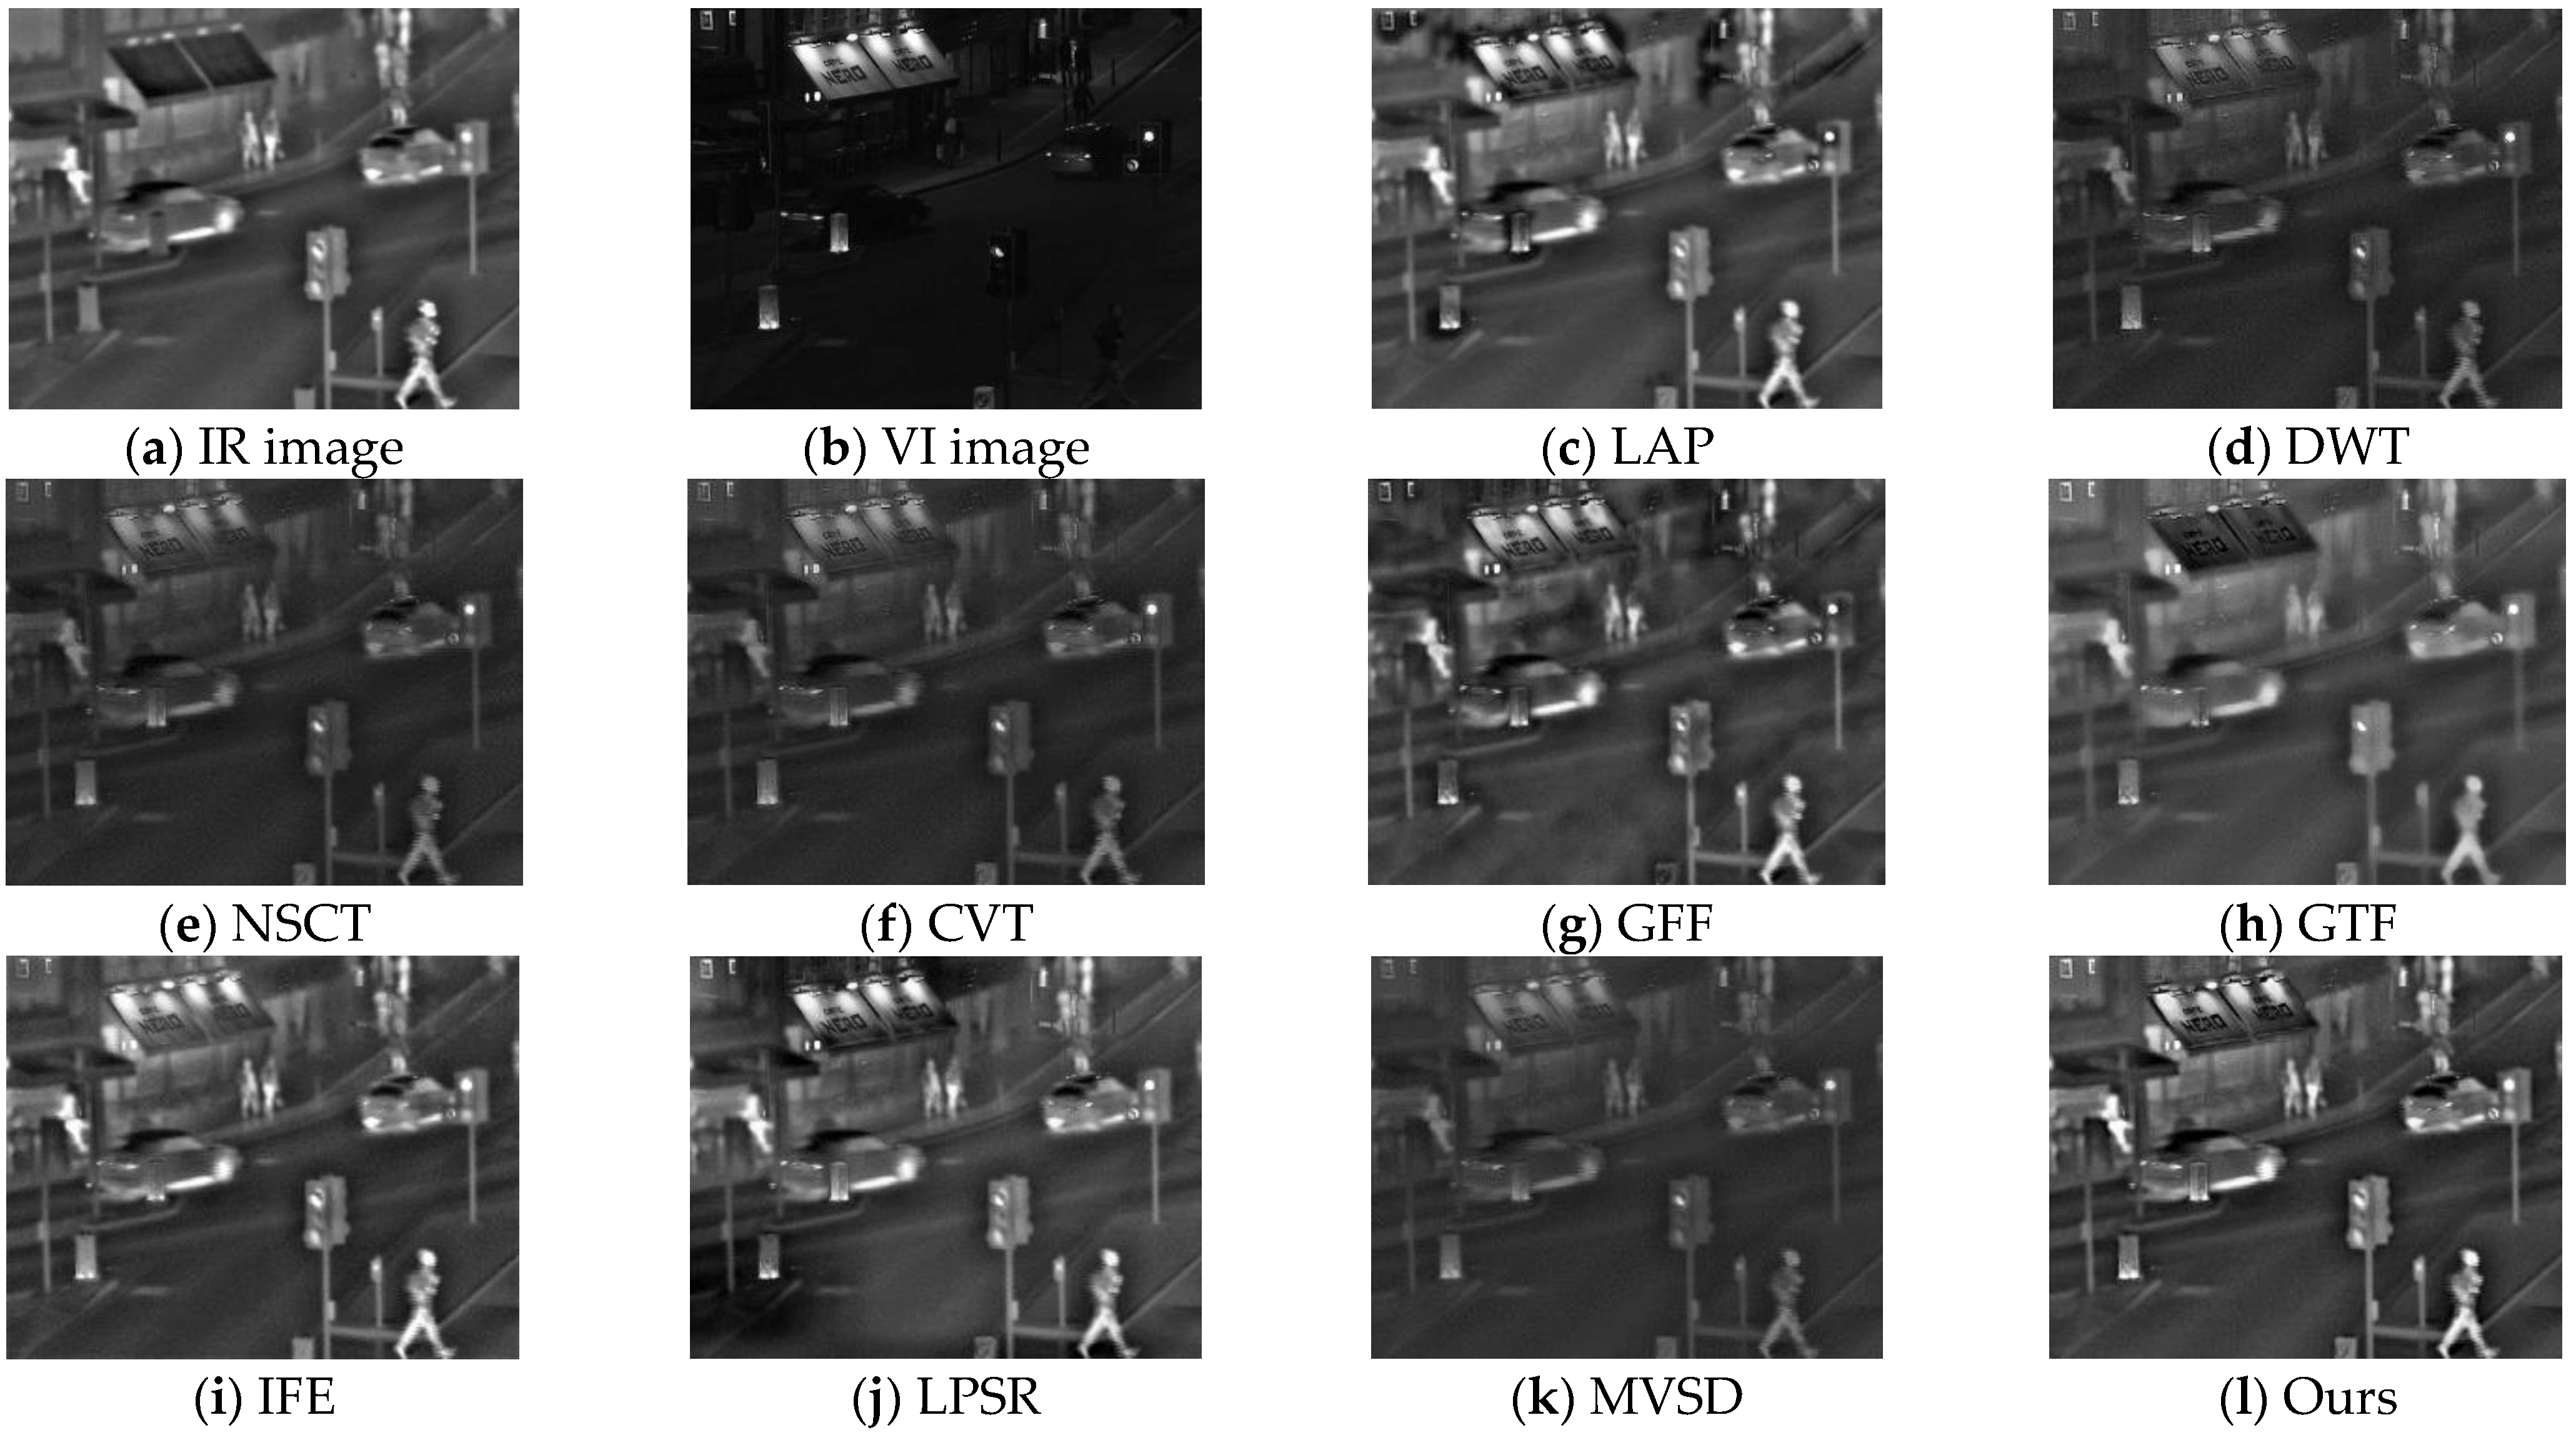
The fusion images in Figure 9d–f,k have low contrast. In addition, the critical target information in the VI source image is dim, such as billboards and people. Figure 9c,g,h have artifacts and halos. The visual effect is not right. Figure 9h looks very blurry. The contrast and overall details of Figure 9i,l are well-preserved. However, the effect of Figure 9l is better than others. For example, the character edges of billboards in the fused images of the new method are much better.
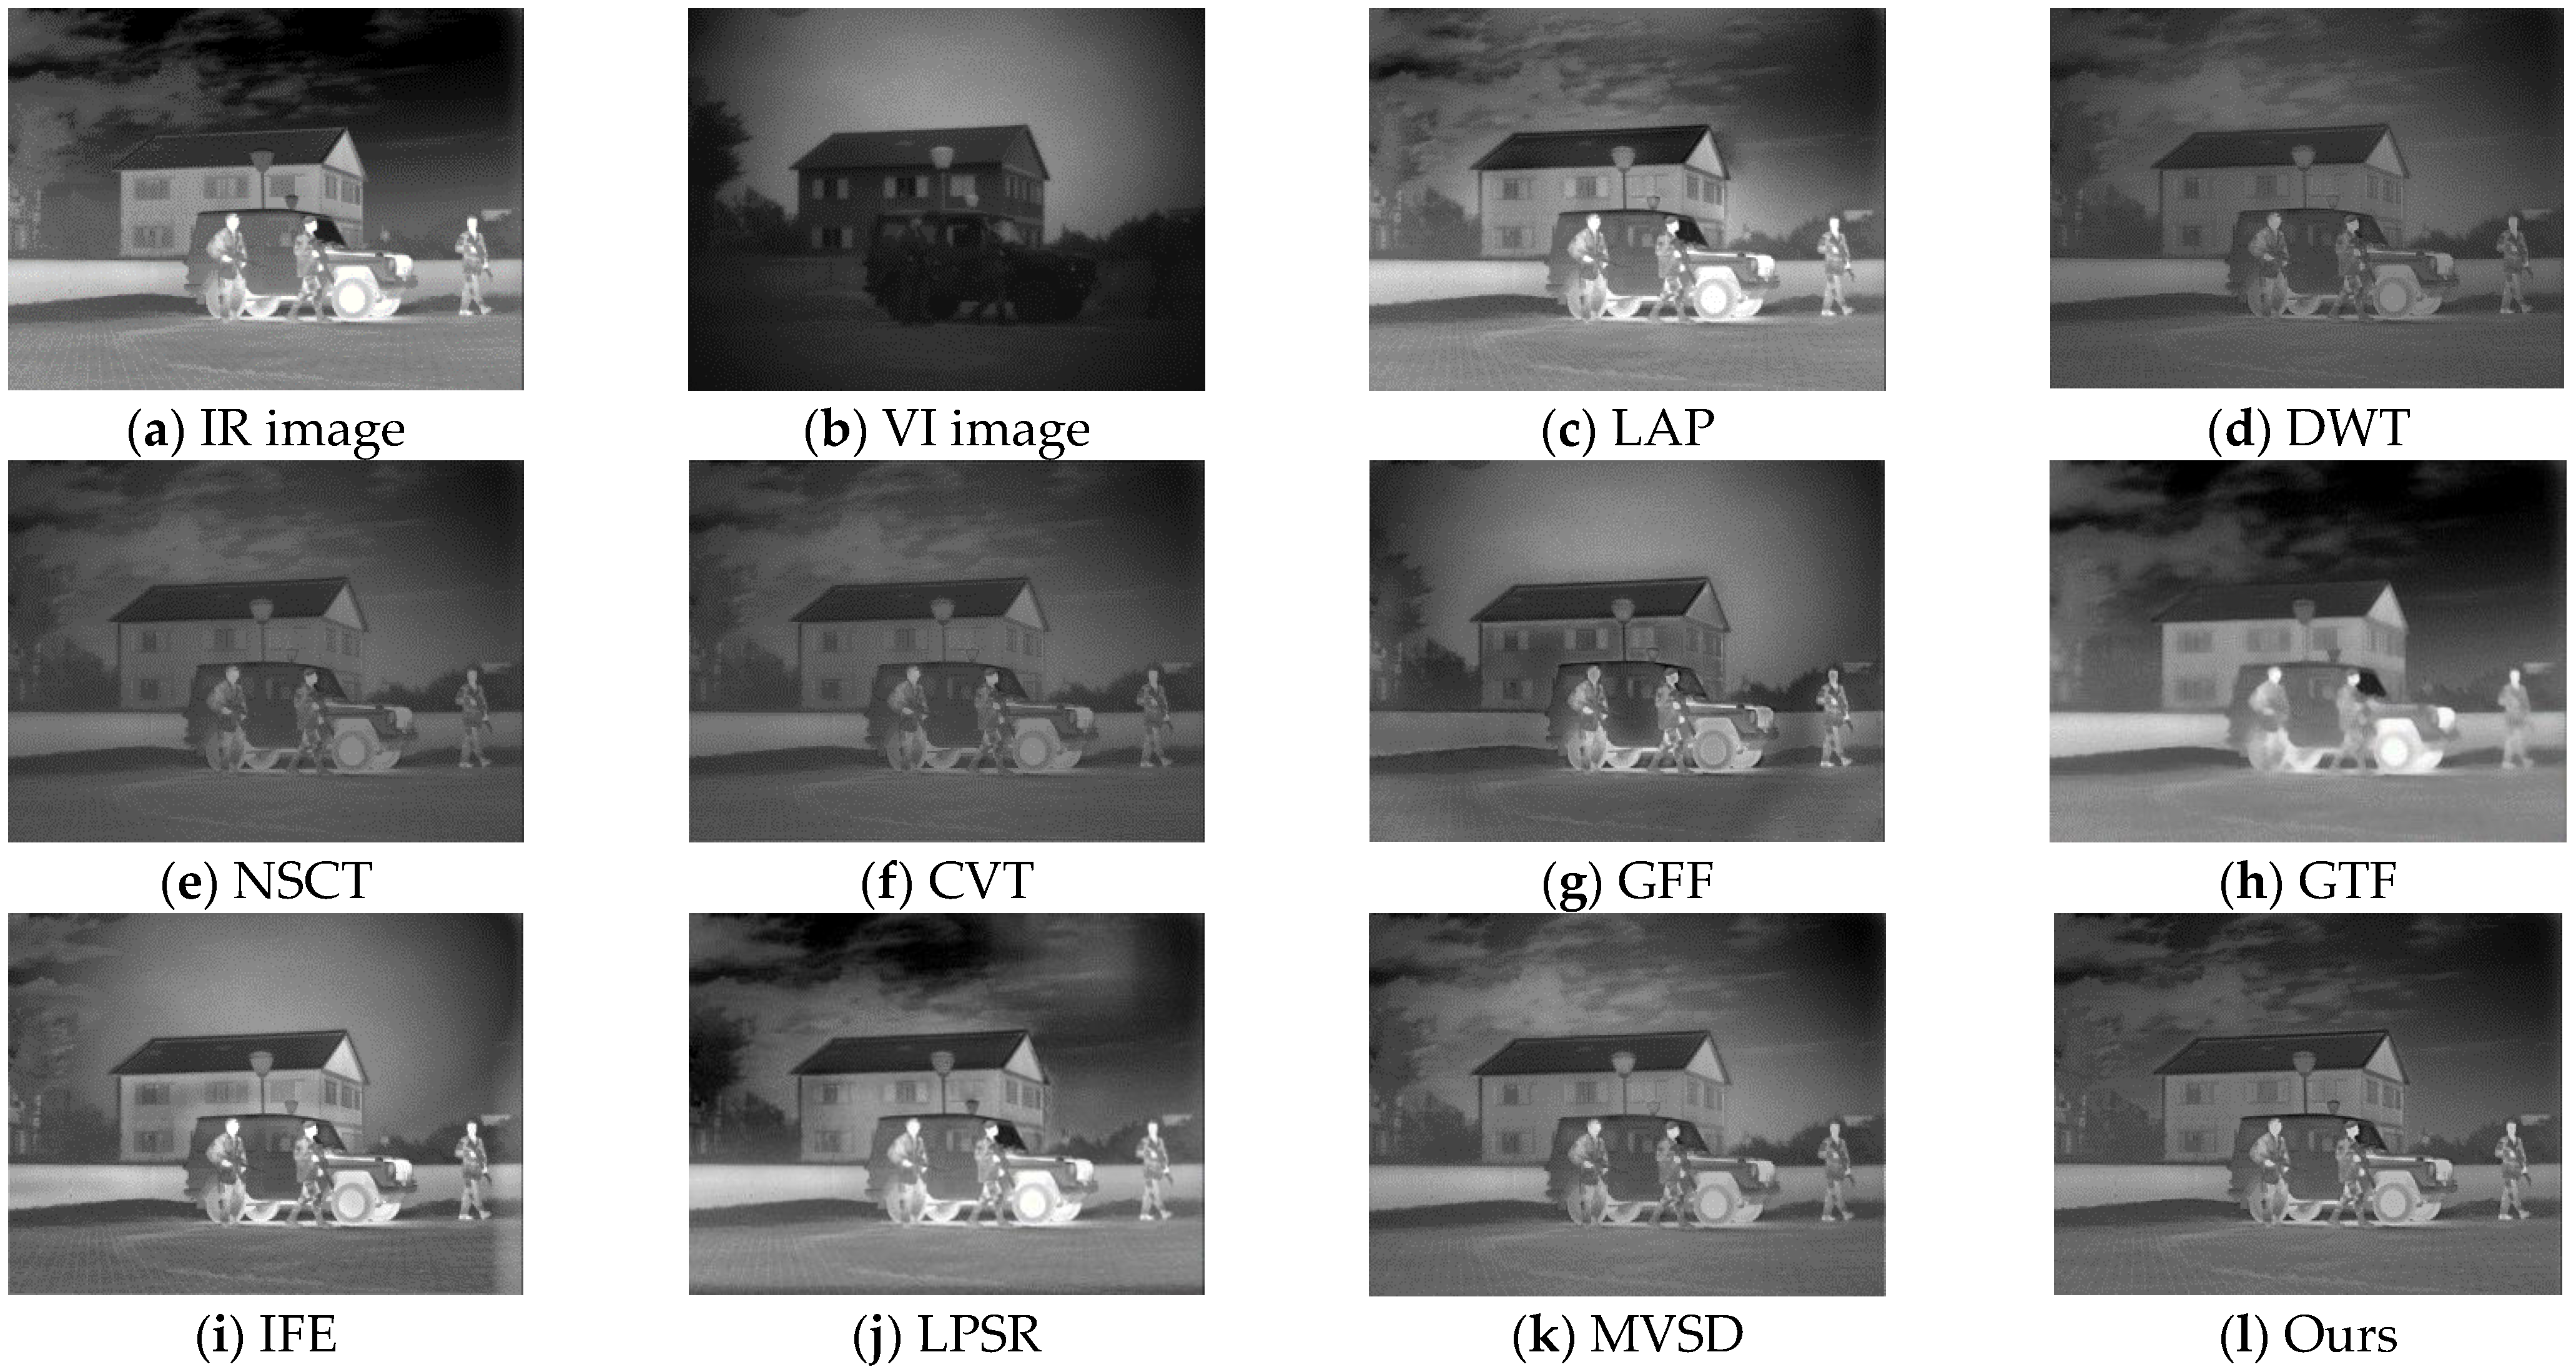
The fusion images shown in Figure 10 have a large range of brightness, which can be used to verify the robustness of the fusion method. The fusion effect of Figure 10g,i,j is very poor for the “sky”, and the background of “cloud” in the IR image is unseen, especially the obvious halo phenomenon in Figure 10j. The IR fusion of Figure 10c,h is too high, and the VI information is seriously lost. From the images of “roof”, “floor tile”, and “car windshield”, it can be seen that Figure 10d–f,k are less ideal than Figure 10l in retaining details and edges.
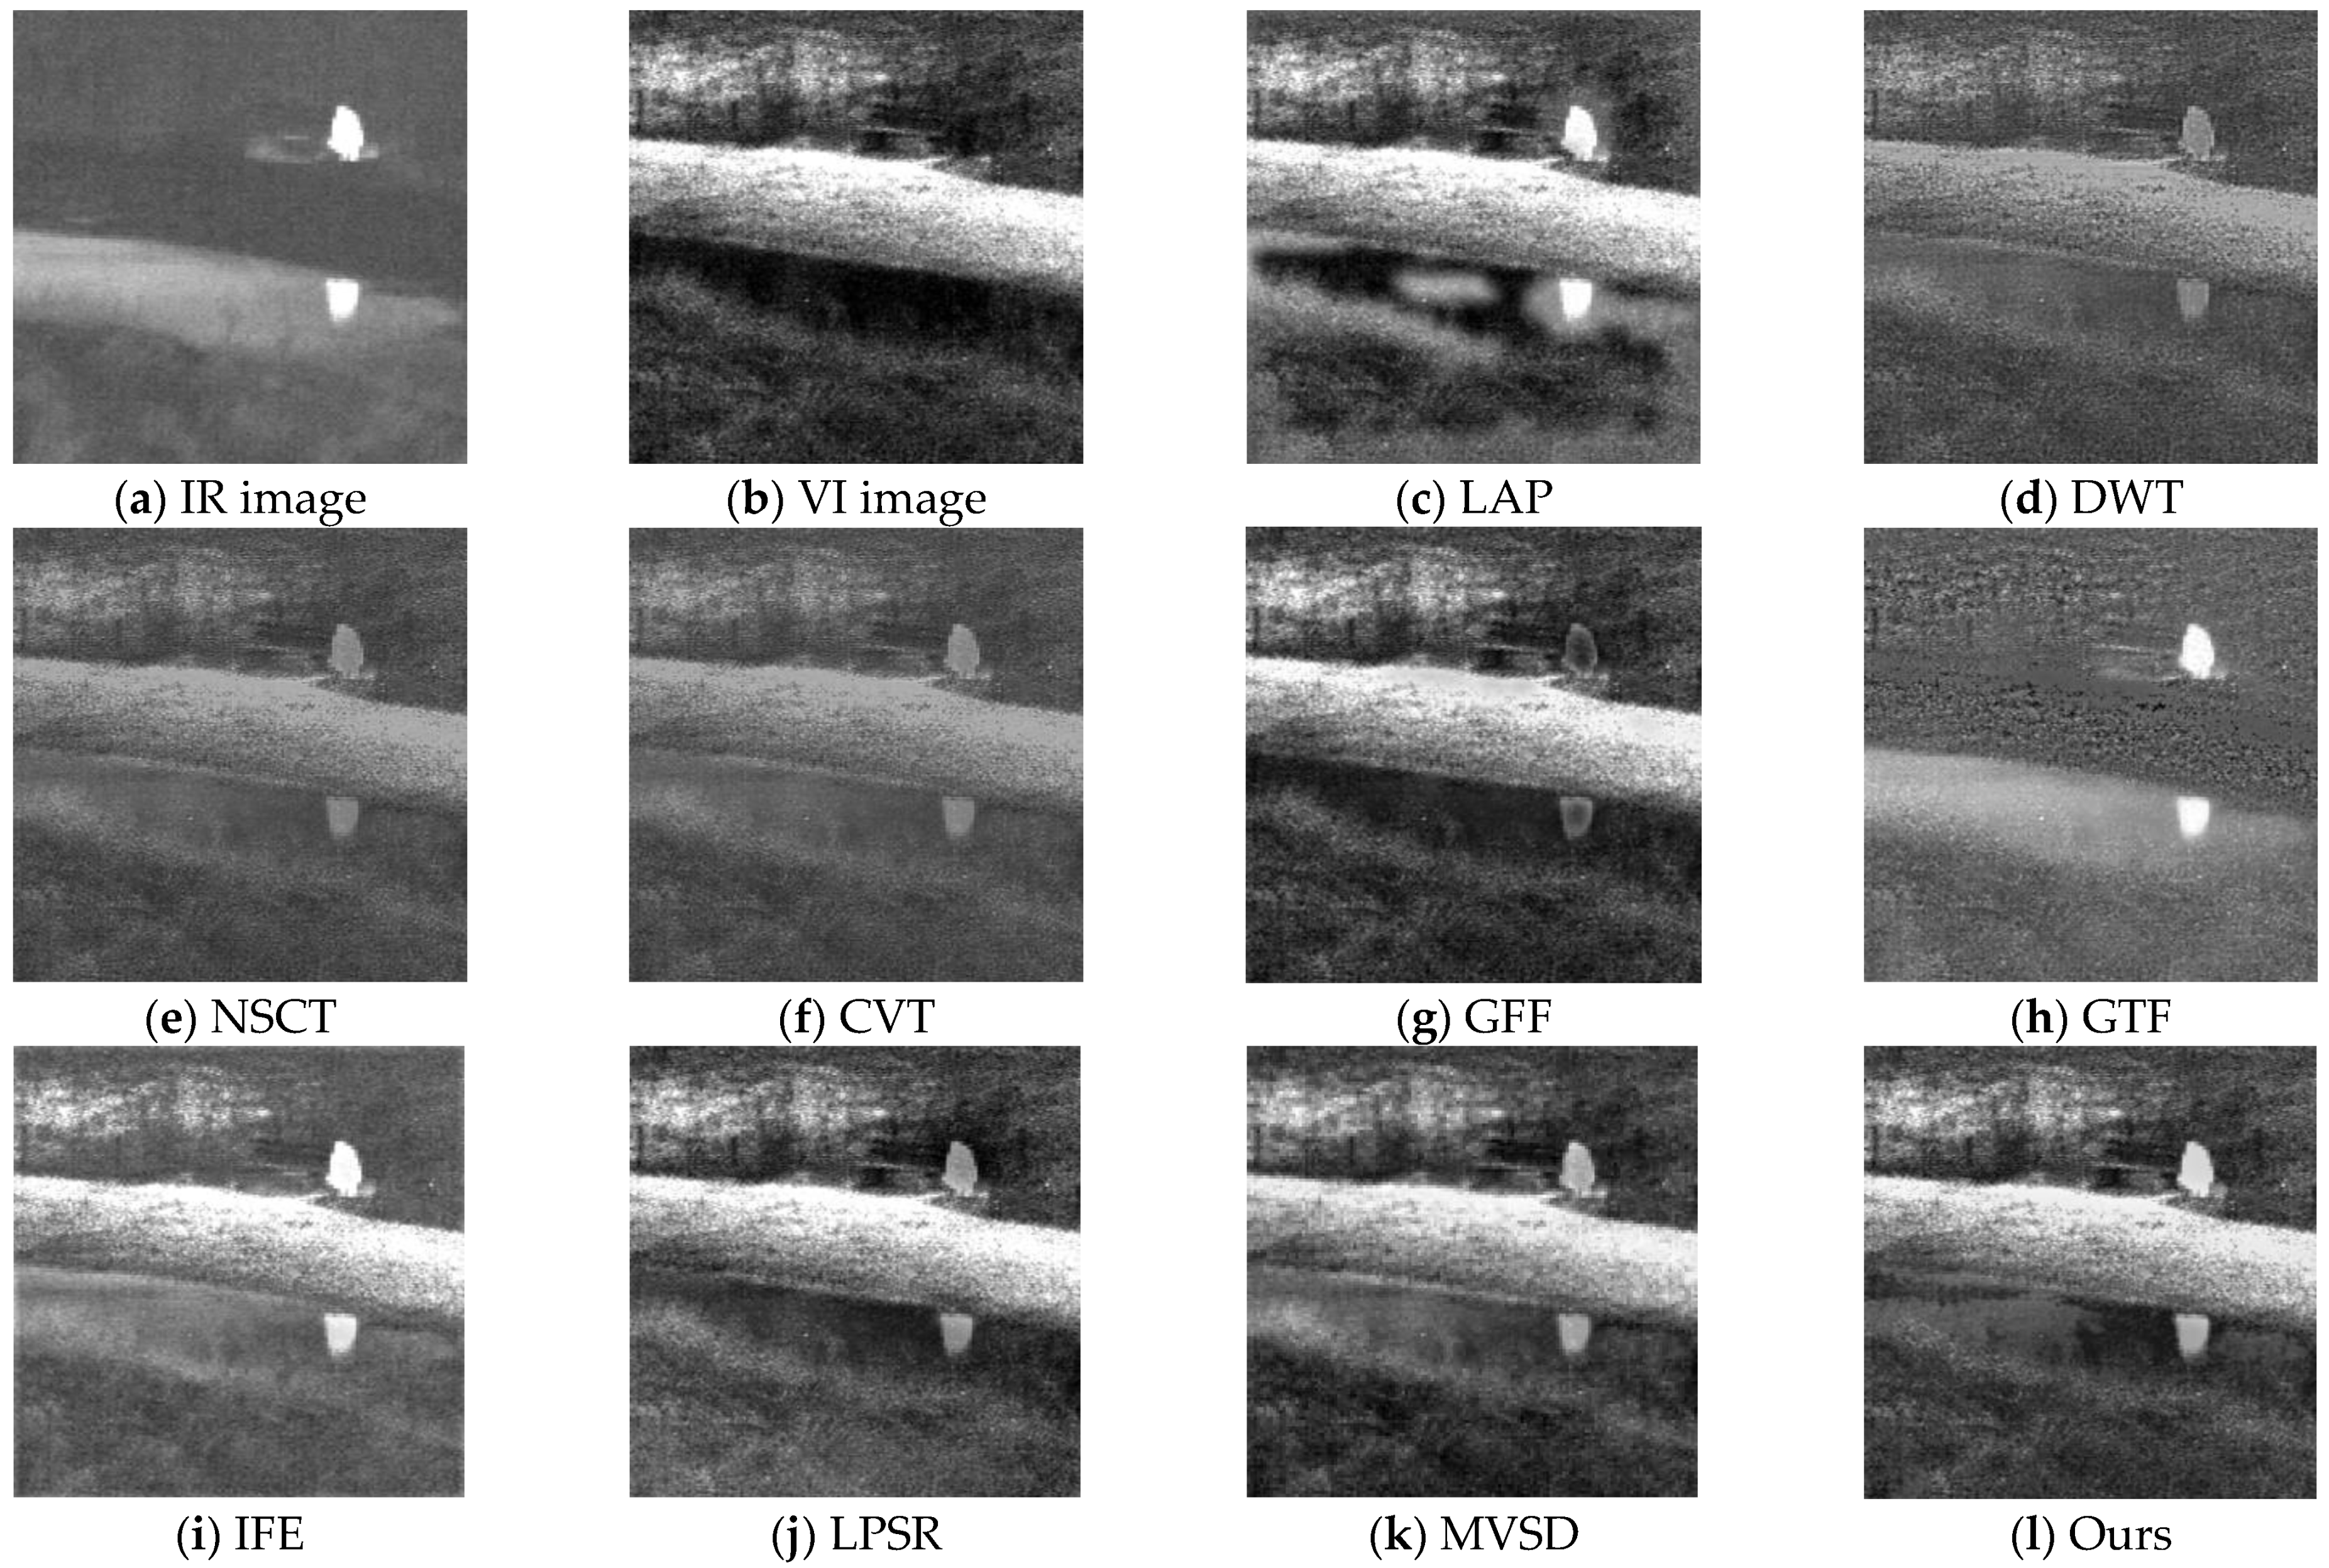
Figure 11l is the result of our method, in which the edges of pedestrian and water surface reflection are transparent. There are no artifacts and halos in our method. Besides, the fused images have high contrast and less noise.
The sky area in Figure 12g,h is polluted. Figure 12d–f,k have low contrast and dark areas of the sky. Moreover, there is a halo around the pedestrian, and the target is polluted. Figure 12c,i,j highlight the details, but there are apparent artifacts on the edge of the right tree. Figure 12l shows that our method has the capability of complementing IR and VI source images and overcoming edge artifacts and halos.
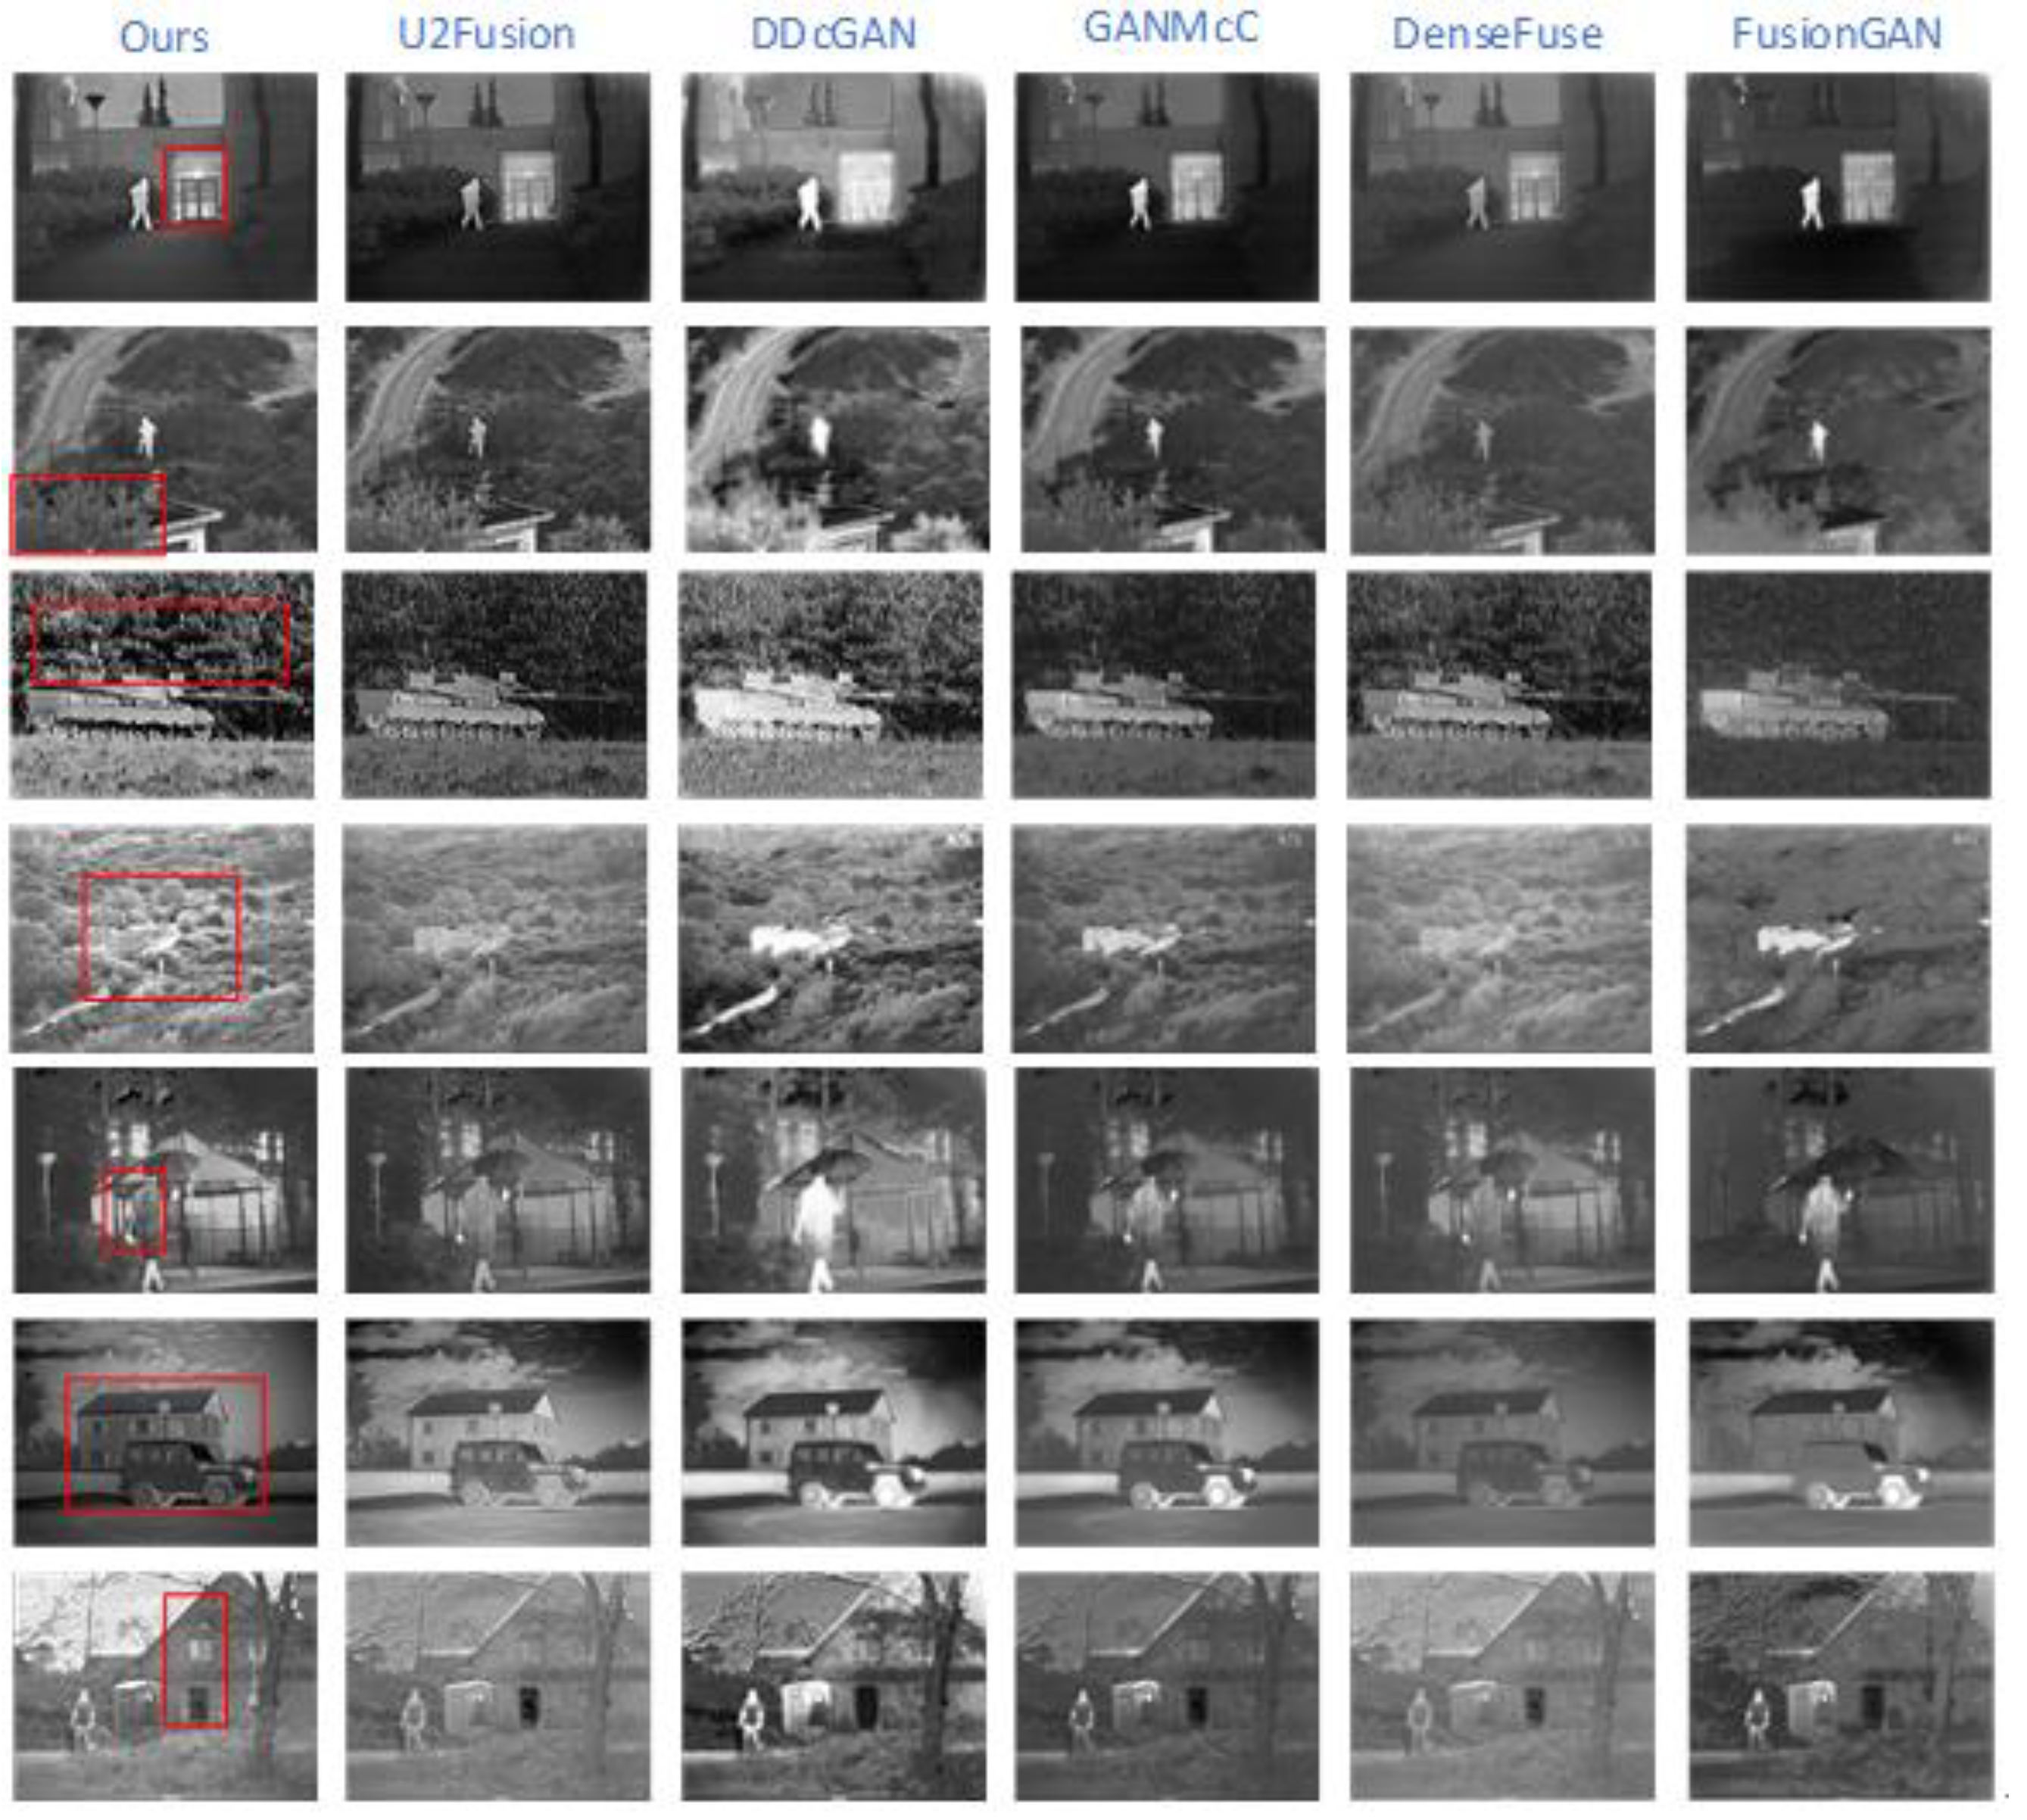
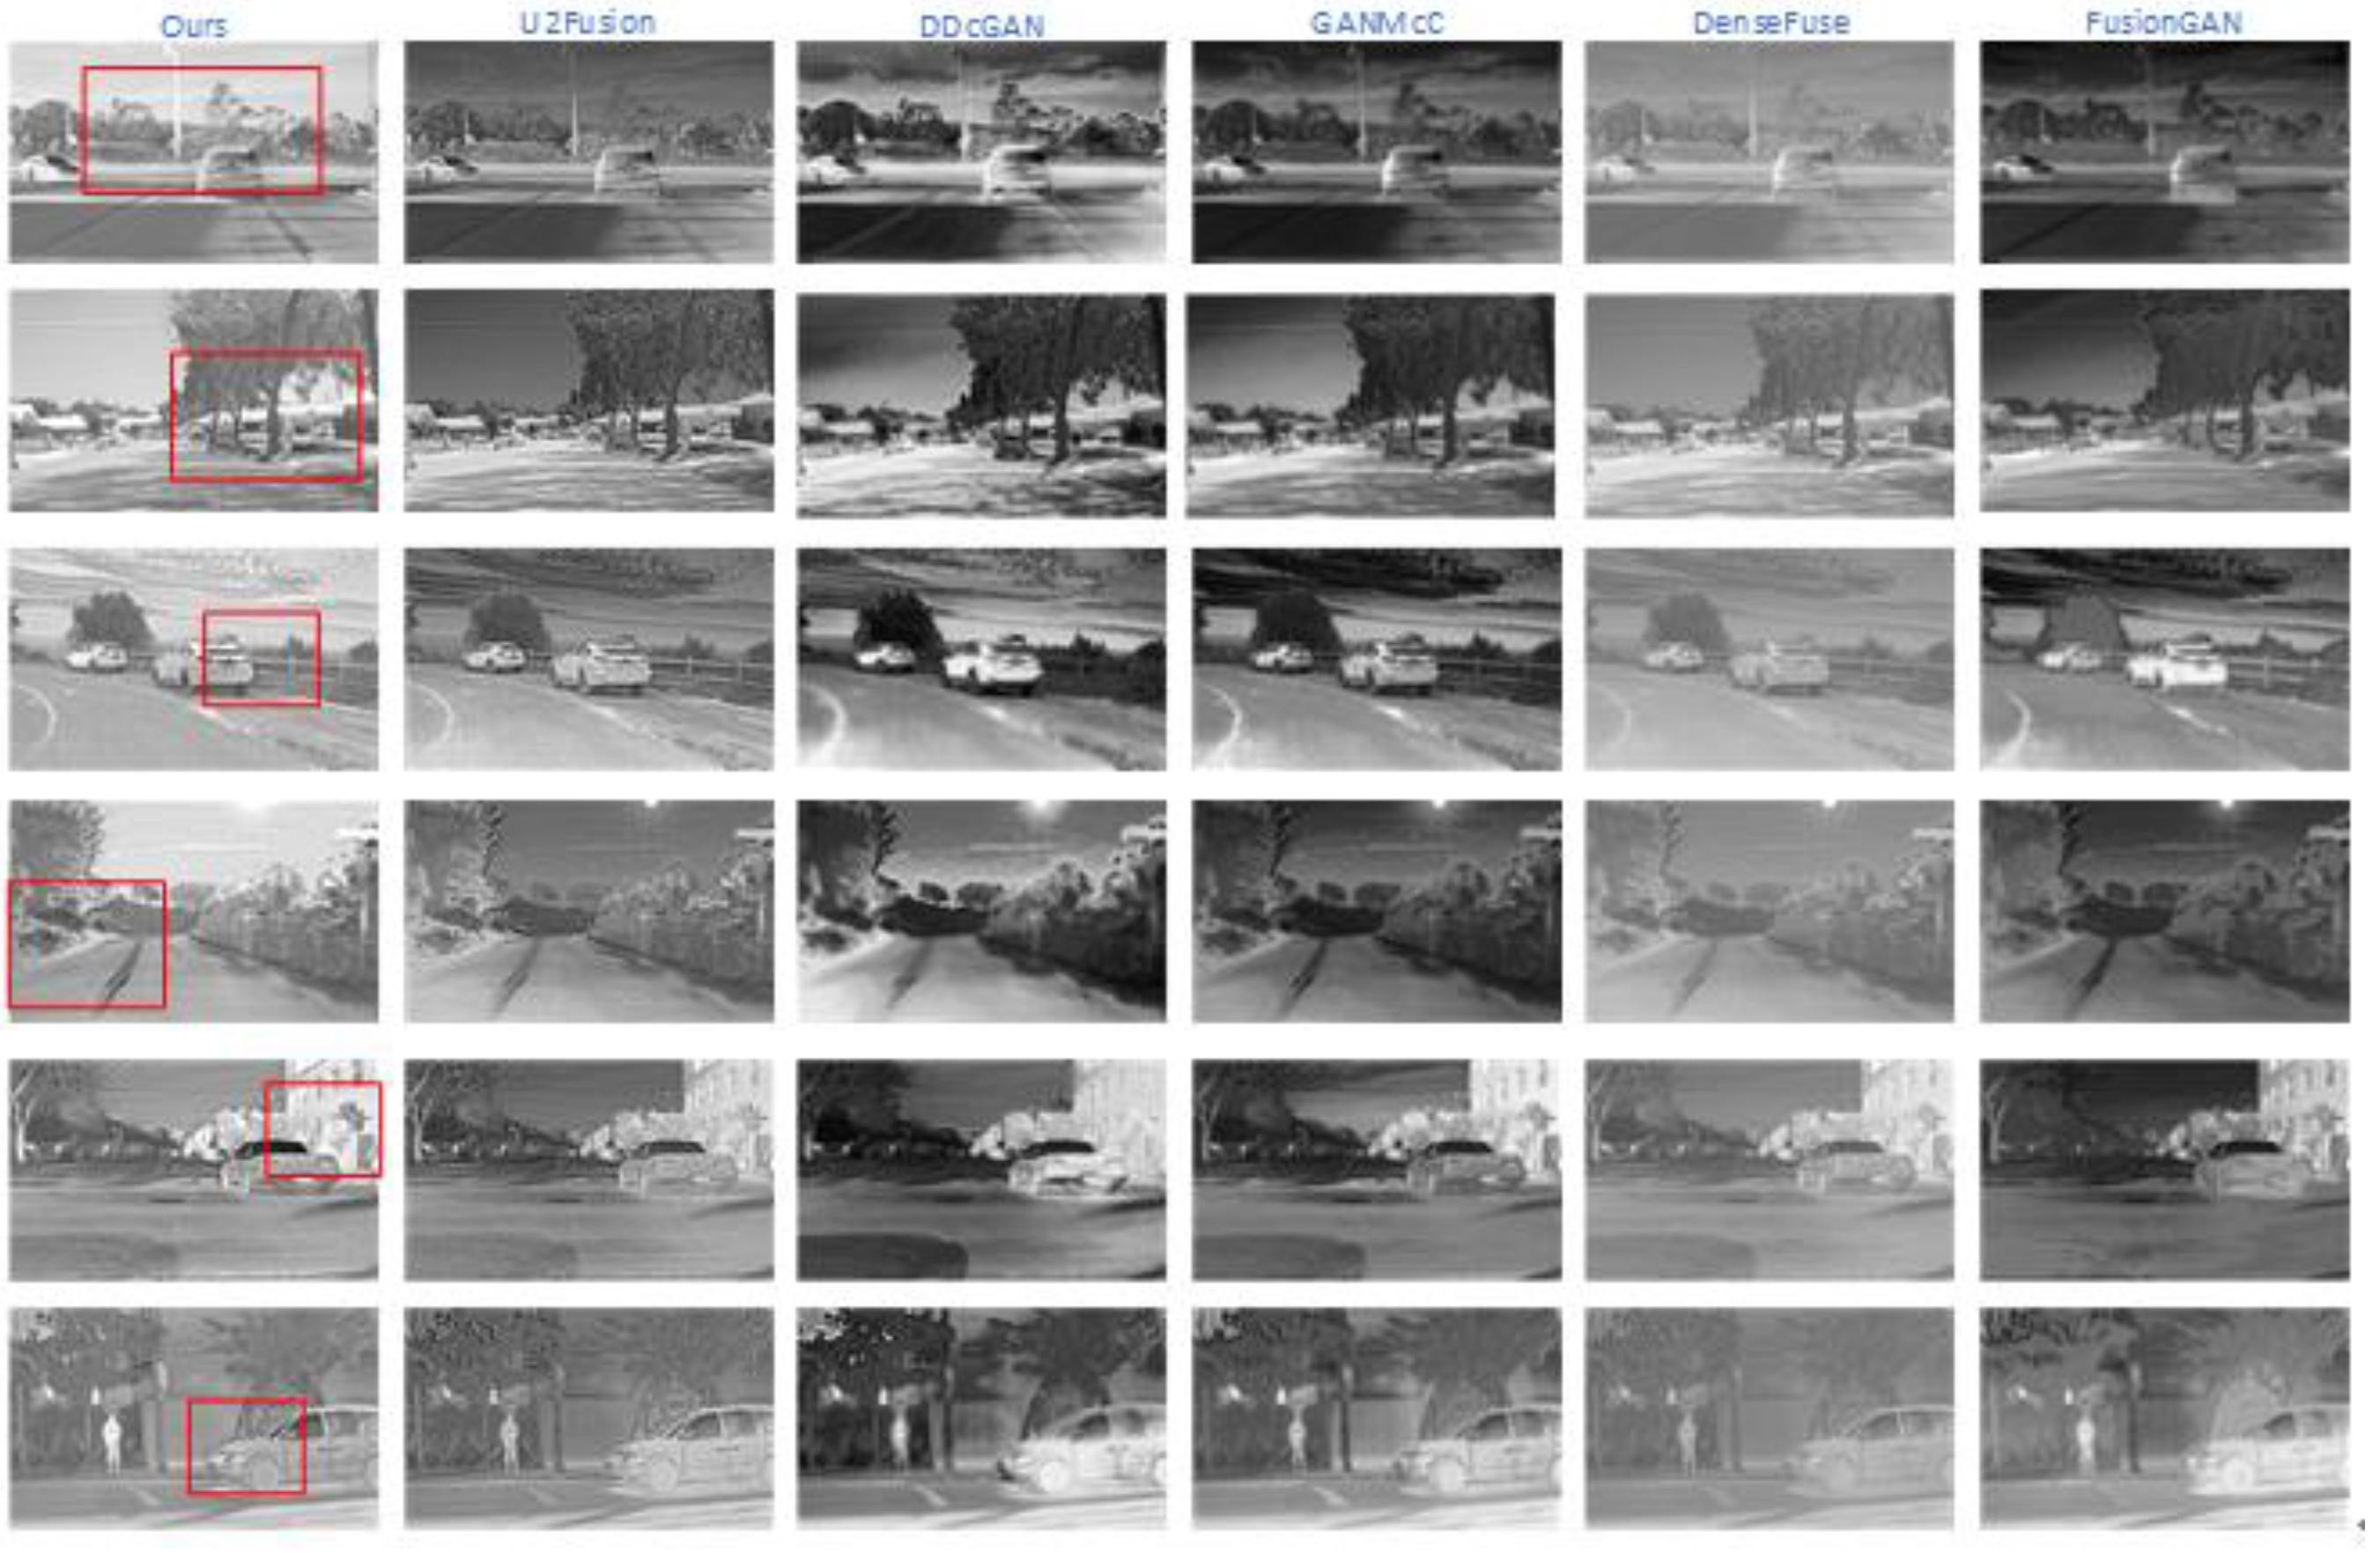
In addition to the above state-of-the-art classical methods, some latest deep learning-based fusion methods were employed to compare with the proposed method in subjective performance analysis, such as DenseFuse [33], FusionGAN [16], U2Fusion [34], GANMcC [35], and DDcGAN [36]. Qualitative comparisons were performed on image pairs in the TNO dataset [37] and the RoadScene dataset [35], respectively. The qualitative results on the TNO datasets and RoadScene datasets are shown respectively in Figure 13 and Figure 14. Overall, the proposed method exhibits a better appearance than its competitors. As shown in regions rich in texture information, the competitors lost some details, e.g., the texture of the clothes, the details of the door, and the texture of the leaves, as shown in Figure 13. Furthermore, the proposed method was also applied to fuse VIS and IR images in the RoadScene. As shown in Figure 14, the details in the fusion results appear for better scene representation because the detail layer process was performed. The promising results show that the proposed method achieves a better appearance representation and less distortion, noise, or artifacts.
3.2. Objective Performance Evaluation
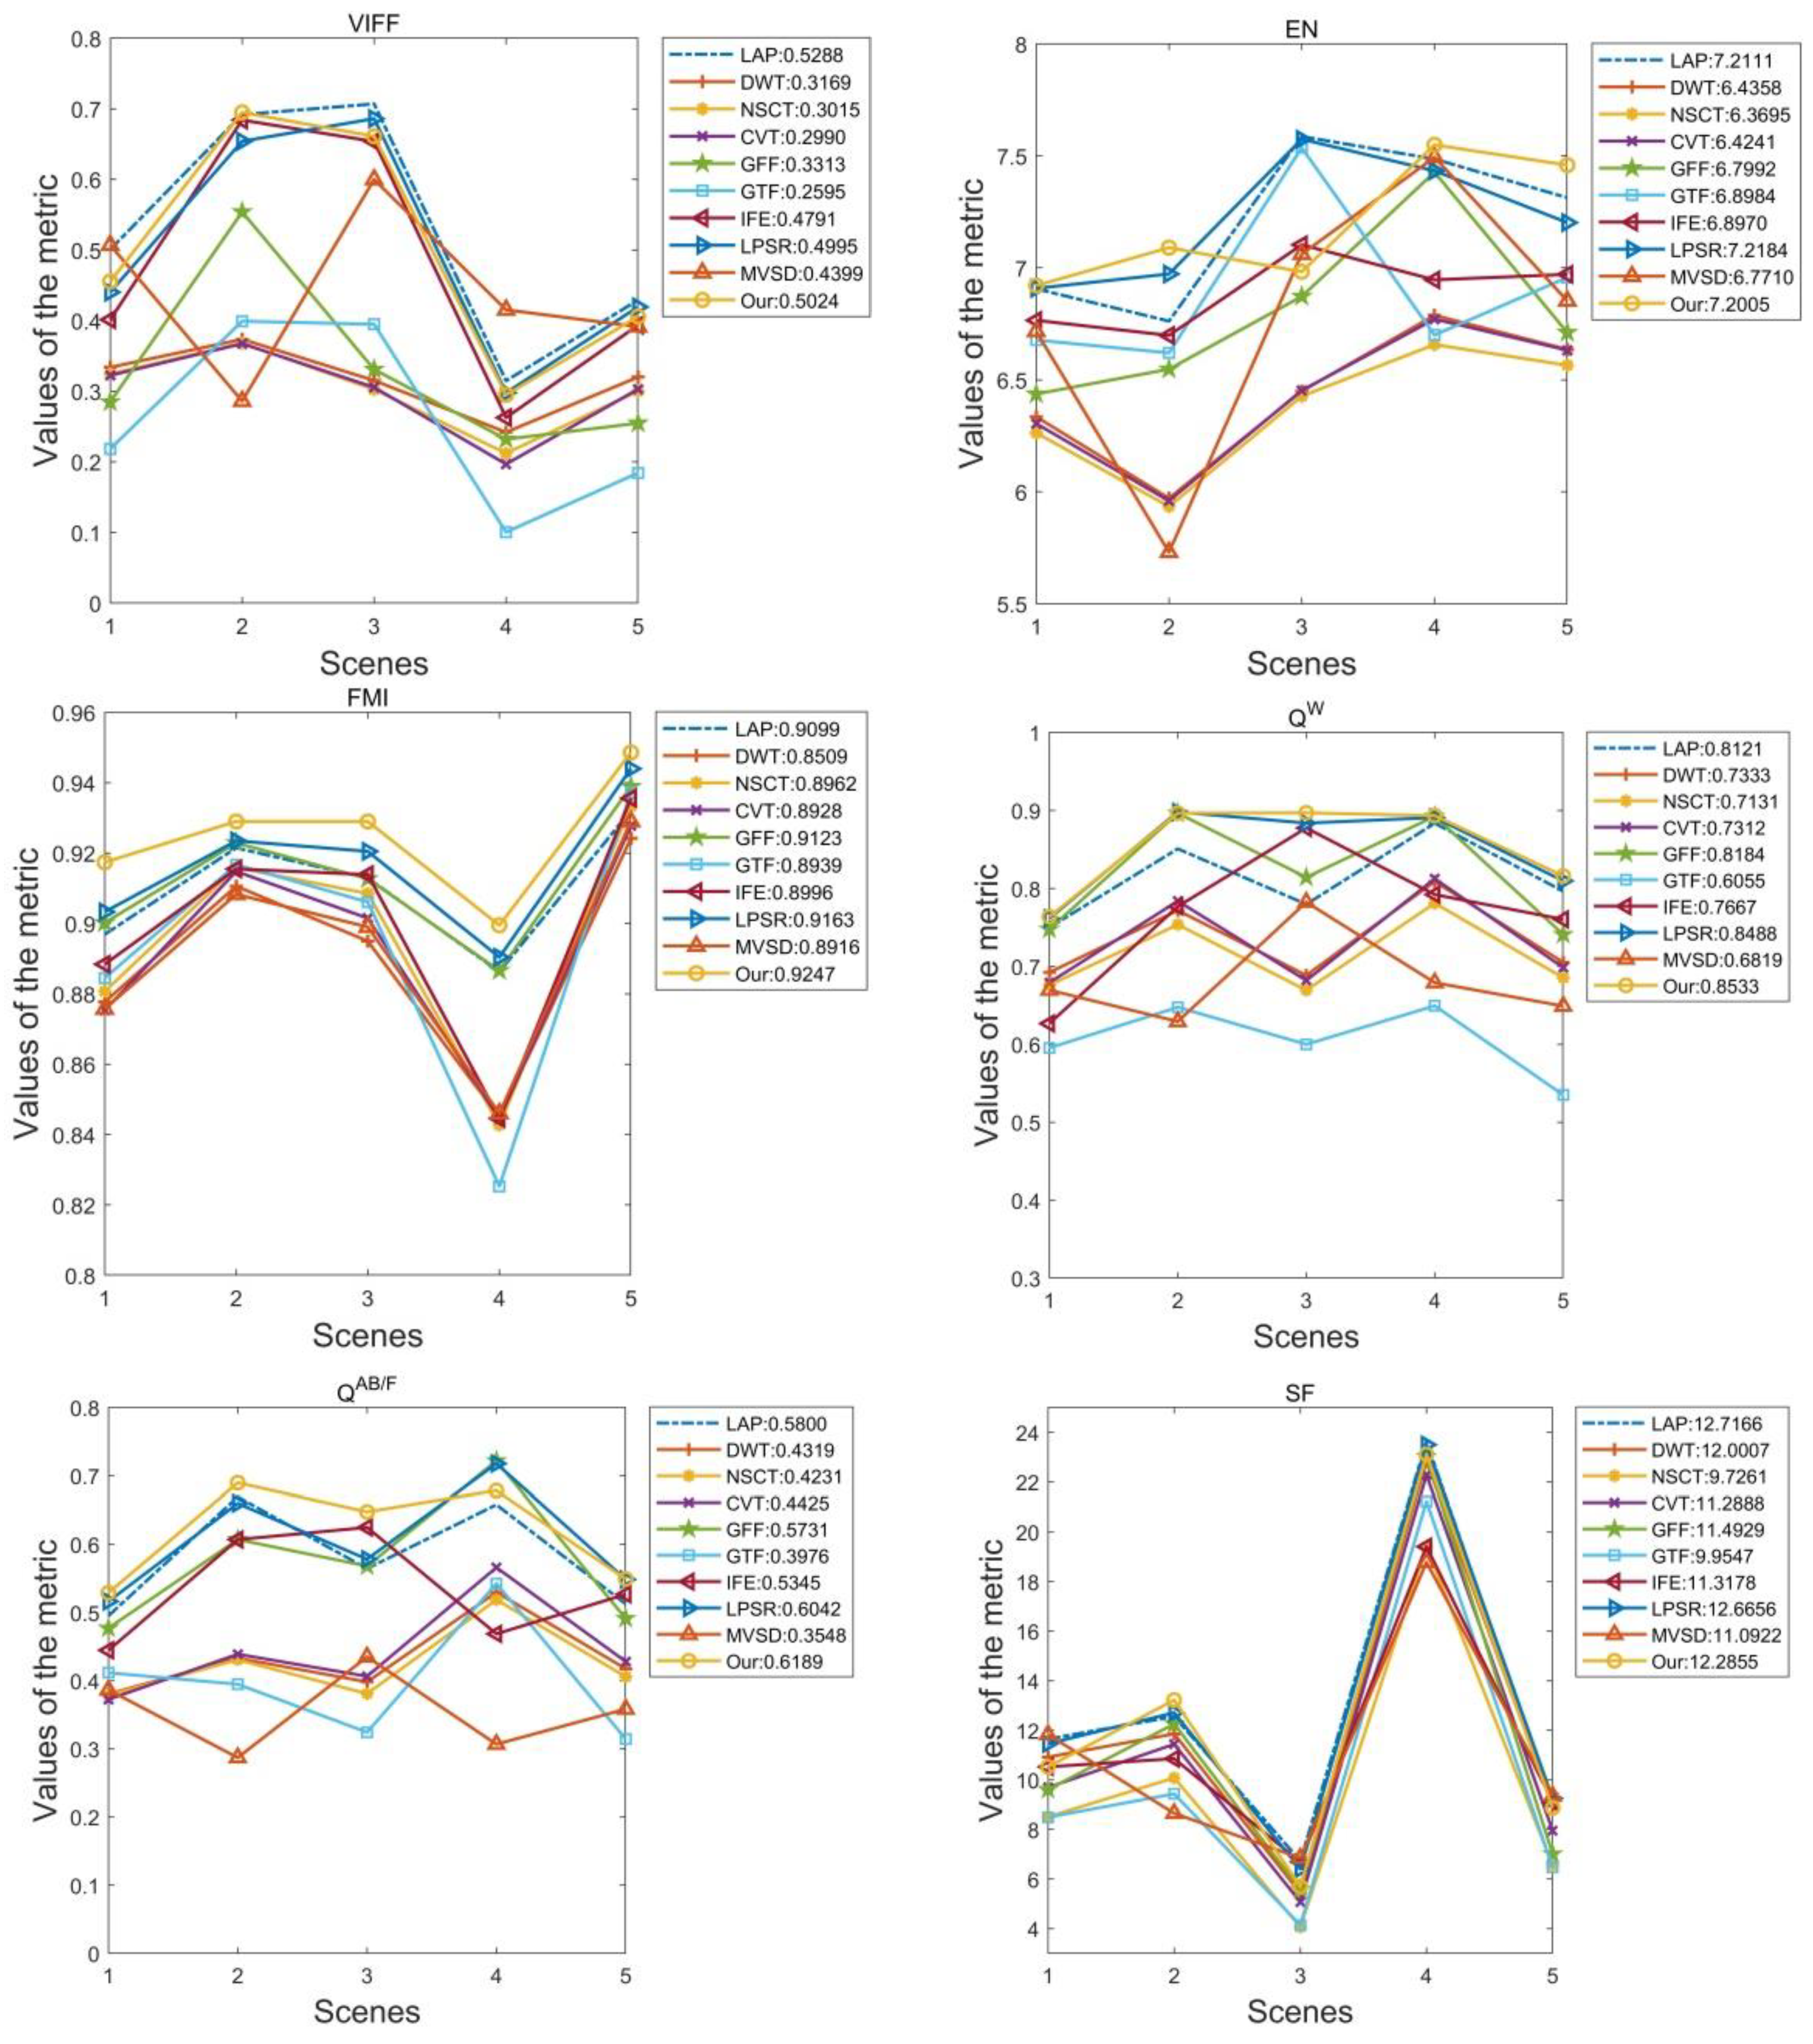
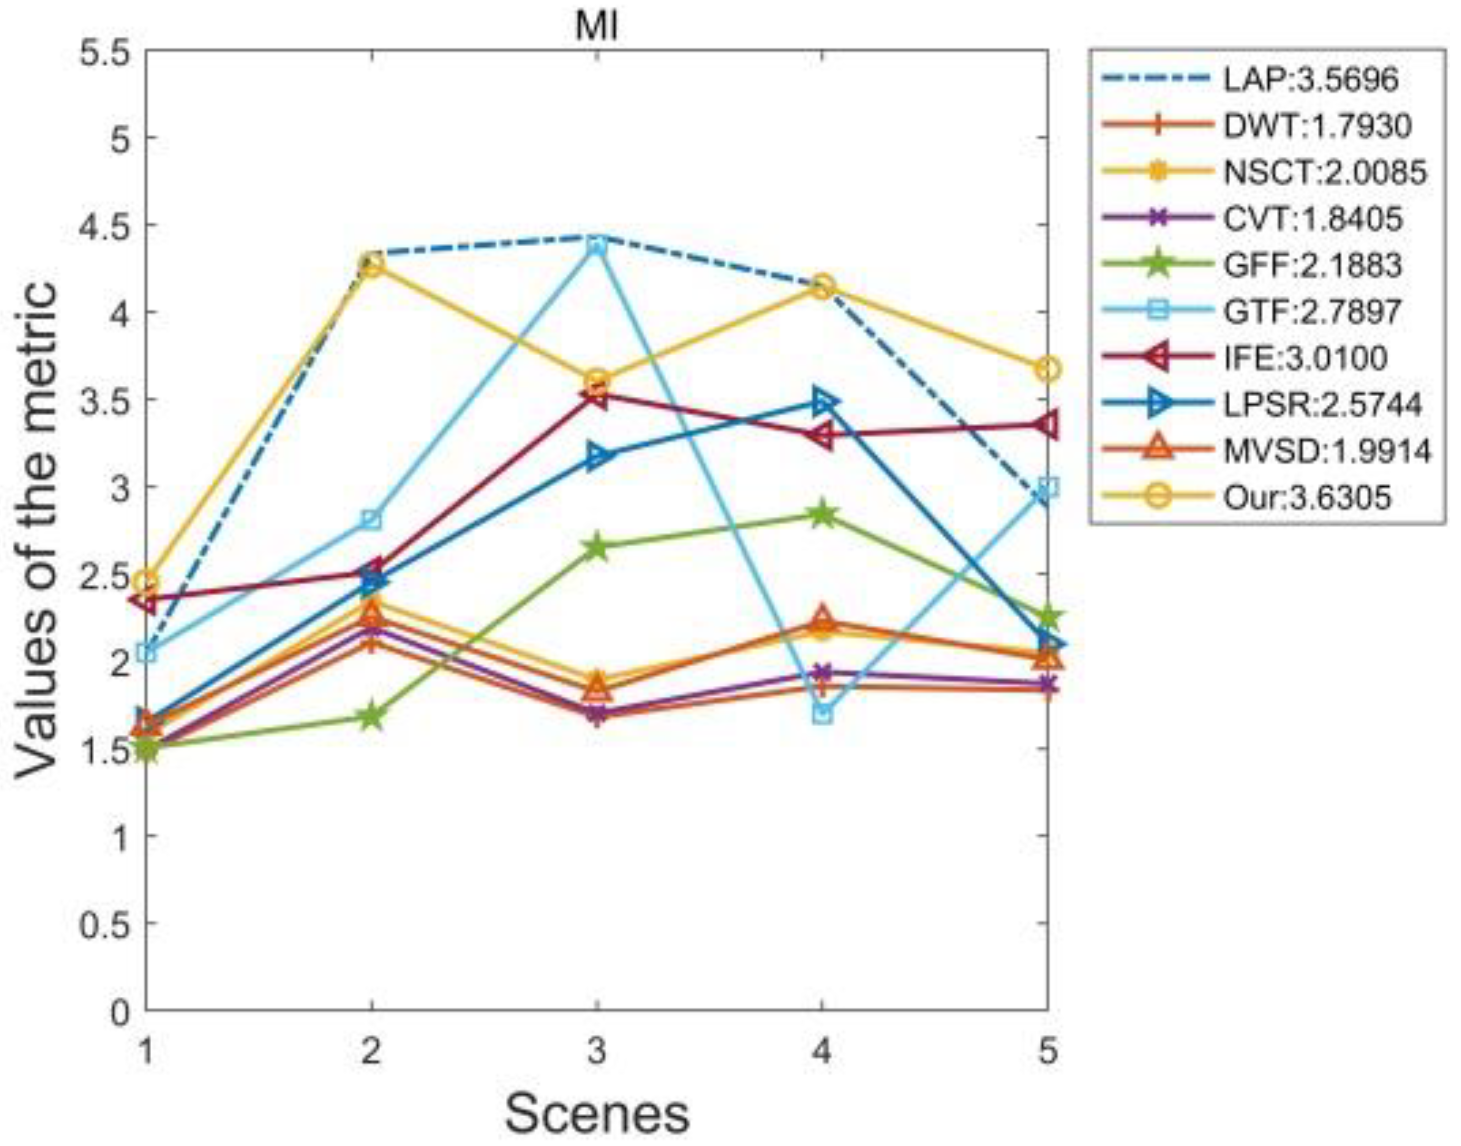
In addition to subjective observation, there are seven popular objective metrics for performance evaluation: information entropy (EN) [38], mutual information (MI) [38], [38], [39], visual information fidelity fusion metrics (VIFF) [40], spatial frequency (SF) [38], and feature mutual information (FMI) [41]. EN is used to evaluate the amount of information on fusion results. MI reflects the quantity of effective information transfer in the process of fusion. and represent the similarity between the strong edges of the target before and after the fusion process. VIFF is used to evaluate the fidelity of visual information before and after fusion. SF can represent the clarity and spatial variation of fusion results. FMI measures the feature mutual information for fusion results, and the gradient map is usually used as the evaluation feature. We used these methods to examine the fusion results of the five image pairs. Figure 15 shows the quantitative evaluation results applied to the images shown in Figure 8, Figure 9, Figure 10, Figure 11 and Figure 12. A separate evaluation cannot comprehensively measure the image quality. Different methods perform differently in different metrics, so we could not analyze the performance of each index in isolation. Therefore, we needed to combine a variety of evaluation indicators. As shown in Figure 15, although our method was not optimal in all the indicators, the average evaluation was the best overall. Our method was optimal in both EI and metrics. This fully illustrates the advantage of our method in conveying edge structure and texture information. The overall edge structure and visual effect also have good performance. Although our method was not the best one in SF, MI, , and FMI, it could work very well on most of the image pairs. However, our method could overcome halo and artifact issues better than other methods.
In recent years, deep learning-based fusion methods have improved fusion performance. Some of the Representative DL-based methods were compared with the proposed method, such as DenseFuse, FusionGAN, U2Fusion, GANMcC, and DDcGAN. Quantitative comparisons were performed on image pairs in the TNO dataset, as shown in Figure 13. FMI, MI, , , and SF metrics were used for evaluation. The comparison results are shown in Table 1. On the TNO dataset, the proposed method achieves the best performance on FMI, MI, , and . The results on SF follow behind U2Fusion and DDcGAN by 2.82 and 2.26, respectively. These results show that in the proposed model, the similarity and correlation between the fusion image and source images are higher and have less distortion and larger gradient amplitude. A bold number indicates the performance of the best method among all methods in terms of a particular metric.
4. Conclusions
This paper presents a novel decomposition-based image fusion framework, which overcomes the problems of noise, blurring, and loss of details. Firstly, the decomposition method of basic components and detail components based on SWF-Gaussian was proposed. More importantly, we developed a base components fusion strategy through normalization and nonlinear processing, which could control the fusion ratio by adjusting the regularization parameters. Furthermore, SWGF was applied to optimize the fusion process of detail components, suppressing the noise transfer effect, and obtaining better visual perception. The quantitative results show that the method has the advantages of simplicity, effectiveness, and robustness.
Author Contributions
Conceptualization, J.S. and R.X.; methodology, J.S. and R.X.; software, F.C.; validation, R.X., F.C. and Y.W.; formal analysis, R.X. and F.C.; investigation, J.S. and R.X.; resources, R.X.; data curation, R.X., F.C. and C.L.; writing—original draft preparation, J.S. and R.X.; writing—review and editing, R.X. and F.C.; visualization, R.X. and F.C.; supervision, R.X. and F.C.; project administration, J.S.; funding acquisition, J.S. All authors have read and agreed to the published version of the manuscript.
Funding
This work is funded by grants from the National Science Foundation of China (grant number 61650401, 61875171, 62165019) and the Yunnan Education Commission of China (grant number ZD2014004).
Institutional Review Board Statement
The study did not require ethical approval.
Informed Consent Statement
The study did not involve humans.
Data Availability Statement
The study did not report any data.
Conflicts of Interest
It should be understood that none of the authors have any financial or scientific conflict of interest with regard to the research described in this manuscript.
References
- Ma, J.Y.; Ma, Y.; Li, C. Infrared and visible image fusion methods and applications: A survey. Inf. Fusion 2018, 45, 153–178. [Google Scholar] [CrossRef]
- Jin, X.; Jiang, Q.; Yao, S.; Zhou, D.; Nie, R.; Hai, J.; He, K. A survey of infrared and visual image fusion methods. Infrared Phys. Technol. 2017, 85, 478–501. [Google Scholar] [CrossRef]
- He, Z.; Song, Y.; Zhong, C.; Li, L. Curvature and Entropy Statistics-Based Blind Multi-Exposure Fusion Image Quality Assessment. Symmetry 2021, 13, 1446. [Google Scholar] [CrossRef]
- Burt, P.; Adelson, E. The Laplacian Pyramid as a Compact Image Code. IEEE Trans. Commun. 1983, 31, 671–679. [Google Scholar] [CrossRef]
- Jin, H.; Wang, Y. A fusion method for visible and infrared images based on contrast pyramid with teaching learning based optimization. Infrared Phys. Technol. 2014, 64, 134–142. [Google Scholar] [CrossRef]
- Da Cunha, A.L.; Zhou, J.; Do, M.N. The Nonsubsampled Contourlet Transform: Theory, Design, and Applications. IEEE Trans. Image Process. 2006, 15, 3089–3101. [Google Scholar] [CrossRef] [Green Version]
- Elkhamy, S.E.; Hadhoud, M.M.; Dessouky, M.I.; Salam, B.M.; EIsamie, F.E.A. Blind multichannel reconstruction of high-resolution images using wavelet fusion. Appl. Opt. 2005, 44, 7349–7356. [Google Scholar] [CrossRef]
- Selesnick, I.W.; Baraniuk, R.G.; Kingsbury, N.G. The dual-tree complex wavelet transform. IEEE Signal Process. Mag. 2005, 22, 123–151. [Google Scholar] [CrossRef] [Green Version]
- Lewis, J.J.; Ocallaghan, R.J.; Nikolov, S.G.; Bull, D.R.; Canagarajah, N. Pixel- and region-based image fusion with complex wavelets. Inf. Fusion 2007, 8, 119–130. [Google Scholar] [CrossRef]
- Zhao, C.; Guo, Y.; Wang, Y. A fast fusion scheme for infrared and visible light images in NSCT domain. Infrared Phys. Technol. 2015, 72, 266–275. [Google Scholar] [CrossRef]
- Shao, Z.; Liu, J.; Chen, Q. Fusion of infrared and visible images based on focus measure operators in the curvelet domain. Appl. Opt. 2012, 51, 1910–1921. [Google Scholar] [CrossRef]
- Naidu, V.P.S. Image Fusion Technique using Multi-resolution Singular Value Decomposition. Def. Sci. J. 2011, 61, 479–484. [Google Scholar] [CrossRef] [Green Version]
- Li, S.; Kang, X.; Hu, J. Image Fusion With Guided Filtering. IEEE Trans. Image Process. 2013, 22, 2864–2875. [Google Scholar] [CrossRef] [PubMed]
- Zhang, P.; Yuan, Y.; Fei, C.; Pu, T.; Wang, S. Infrared and visible image fusion using co-occurrence filter. Infrared Phys. Technol. 2018, 93, 223–231. [Google Scholar] [CrossRef]
- Ma, J.; Chen, C.; Li, C.; Huang, J. Infrared and visible image fusion via gradient transfer and total variation minimization. Inf. Fusion 2016, 31, 100–109. [Google Scholar] [CrossRef]
- Ma, J.; Yu, W.; Liang, P.; Li, C.; Jiang, J. FusionGAN: A generative adversarial network for infrared and visible image fusion. Inf. Fusion 2019, 48, 11–26. [Google Scholar] [CrossRef]
- Li, H.; Wu, X.; Kittler, J. Infrared and Visible Image Fusion using a Deep Learning Framework. In Proceedings of the 24th International Conference on Pattern Recognition (ICPR), Beijing, China, 20–24 August 2018; pp. 2705–2710. [Google Scholar] [CrossRef] [Green Version]
- Ren, X.; Meng, F.; Hu, T.; Liu, Z.; Wang, C. Infrared-visible image fusion based on convolutional neural networks (CNN). In Proceedings of the International Conference on Intelligent Science and Big Data Engineering, Lanzhou, China, 18–19 August 2018; pp. 301–307. [Google Scholar] [CrossRef]
- Fang, M.; Liang, X.; Fu, F.; Song, Y.; Shao, Z. Attention mechanism based semi-supervised multi-gain image fusion. Symmetry 2020, 12, 451. [Google Scholar] [CrossRef] [Green Version]
- Li, H.; Wu, X.; Kittler, J. MDLatLRR: A novel decomposition method for infrared and visible image fusion. IEEE Trans. Image Process. 2020, 29, 4733–4746. [Google Scholar] [CrossRef] [Green Version]
- Liu, Y.; Liu, S.; Wang, Z. A general framework for image fusion based on multi-scale transform and sparse representation. Inf. Fusion 2015, 24, 147–164. [Google Scholar] [CrossRef]
- Anwar, S.; Zhao, Q.; Manzoor, M.F.; Khan, S.I. Saliency detection using sparse and nonlinear feature representation. Sci. World J. 2014, 2014, 137349. [Google Scholar] [CrossRef]
- Liu, Y.; Chen, X.; Ward, R.K.; Wang, Z.J. Image fusion with convolutional sparse representation. IEEE Signal Process. Lett. 2016, 23, 1882–1886. [Google Scholar] [CrossRef]
- Shahdoosti, H.R.; Ghassemian, H. Combining the spectral PCA and spatial PCA fusion methods by an optimal filter. Inf. Fusion 2016, 27, 150–160. [Google Scholar] [CrossRef]
- Fu, Z.; Wang, X.; Xu, J.; Zhou, N.; Zhao, Y. Infrared and visible images fusion based on RPCA and NSCT. Infrared Phys. Technol. 2016, 77, 114–123. [Google Scholar] [CrossRef]
- Tu, T.; Huang, P.S.; Hung, C.; Chang, C. A fast intensity-hue-saturation fusion technique with spectral adjustment for IKONOS imagery. IEEE Geosci. Remote Sens. Lett. 2004, 1, 309–312. [Google Scholar] [CrossRef]
- Sharma, V.; Hardeberg, J.Y.; George, S. RGB-NIR image enhancement by fusing bilateral and weighted least squares filters. In Proceedings of the Color Imaging Conference, Lillehammer, Norway, 11–15 September 2017; Volume 2017, pp. 330–338. [Google Scholar] [CrossRef]
- Ma, J.; Zhou, Z.; Wang, B.; Zong, H. Infrared and visible image fusion based on visual saliency map and weighted least square optimization. Infrared Phys. Technol. 2017, 82, 8–17. [Google Scholar] [CrossRef]
- Yin, H.; Gong, Y.; Qiu, G. Side Window Filtering. In Proceedings of the IEEE/CVF Conference on Computer Vision and Pattern Recognition (CVPR), Long Beach, CA, USA,, 16–20 June 2019; pp. 8758–8766. [Google Scholar]
- Yan, H.; Li, Z. A General Perceptual Infrared and Visible Image Fusion Framework Based on Linear Filter and Side Window Filtering Technology. IEEE Access 2020, 8, 3029–3041. [Google Scholar] [CrossRef]
- Yin, H.; Gong, Y.; Qiu, G. Side window guided filtering. Signal Process. 2019, 165, 315–330. [Google Scholar] [CrossRef]
- Zhang, Y.; Zhang, L.; Bai, X.; Zhang, L. Infrared and visual image fusion through infrared feature extraction and visual information preservation. Infrared Phys. Technol. 2017, 83, 227–237. [Google Scholar] [CrossRef]
- Li, H.; Wu, X.J. DenseFuse: A Fusion Approach to Infrared and Visible Images. IEEE Trans. Image Process. 2019, 5, 2614–2623. [Google Scholar] [CrossRef] [Green Version]
- Xu, H.; Ma, J.; Jiang, J.; Guo, X.; Ling, H. U2Fusion: A Unified Unsupervised Image Fusion Network. IEEE Trans. Pattern Anal. Mach. Intell. 2020, 44, 502–518. [Google Scholar] [CrossRef]
- Ma, J.; Zhang, H.; Shao, Z.; Liang, P.; Xu, H. Ganmcc: A generative adversarial network with multiclassification constraints for infrared and visible image fusion. IEEE Trans. Instrum. Meas. 2020, 70, 5005014. [Google Scholar] [CrossRef]
- Ma, J.; Xu, H.; Jiang, J.; Mei, X.; Zhang, X.P. Ddcgan: A dual-discriminator conditional generative adversarial network for multi-resolution image fusion. IEEE Trans. Image Process. 2020, 29, 4980–4995. [Google Scholar] [CrossRef] [PubMed]
- Toet, A. TNO Image Fusion Dataset. 2014. Available online: https://figshare.com/articles/dataset/TNO_Image_Fusion_Dataset/1008029 (accessed on 26 April 2014). [CrossRef]
- Zhang, K.; Huang, Y.; Yuan, X.; Ma, H.; Zhao, C. Infrared and Visible Image Fusion Based on Intuitionistic Fuzzy Sets. Infrared Phys. Technol. 2019, 105, 103124. [Google Scholar] [CrossRef]
- Wang, Q.; Shen, Y.; Jin, J. Performance evaluation of image fusion techniques. Image Fusion Algorithms Appl. 2008, 19, 469–492. [Google Scholar]
- Han, Y.; Cai, Y.; Cao, Y.; Xu, X. A new image fusion performance metric based on visual information fidelity. Inf. Fusion 2013, 14, 127–135. [Google Scholar] [CrossRef]
- Haghighat, M.; Aghagolzadeh, A.; Seyedarabi, H. A non-reference image fusion metric based on mutual information of image features. Comput. Electr. Eng. 2011, 37, 744–756. [Google Scholar] [CrossRef]
Figure 1.
The algorithm flowchart of our fusion framework.

Figure 2.
The results of Gaussian filtering: (a) IR source image; (b–e) iteration 4 times.

Figure 3.
The results of SWF-Gaussian filtering: (a) IR source image; (b–d) iteration 3 times; (e) The result of Gaussian filtering of (d).
Figure 3.
The results of SWF-Gaussian filtering: (a) IR source image; (b–d) iteration 3 times; (e) The result of Gaussian filtering of (d).

Figure 4.
Detail components obtained from the difference between the blurring images in Figure 2b–e and the source image Figure 2a.

Figure 5.
Detail components: from left to right is the difference between the blurring images in Figure 3b–e and the source image Figure 3a.

Figure 6.
The plot of with different .

Figure 7.
Fusion results for various -value parameters: (a) IR image; (b) VI image; (c–f) fused images (, , , ).
Figure 7.
Fusion results for various -value parameters: (a) IR image; (b) VI image; (c–f) fused images (, , , ).

Figure 8.
Fusion results of the “UNcamp” image pair using different methods.

Figure 9.
Fusion results of the “traffic” image pair using different fusion methods.

Figure 10.
Fusion results of the “Marne_04” image pair using different methods.

Figure 11.
Fusion results of the “bench” image pair using different methods.

Figure 12.
Fusion results of the “kaptein” source images using different methods.

Figure 13.
Qualitative comparison of the proposed method with five state-of-the-art methods on the TNO dataset.
Figure 13.
Qualitative comparison of the proposed method with five state-of-the-art methods on the TNO dataset.

Figure 14.
Qualitative comparison of the proposed method with five state-of-the-art methods on the RoadScene dataset.
Figure 14.
Qualitative comparison of the proposed method with five state-of-the-art methods on the RoadScene dataset.

Figure 15.
Quantitative comparisons of seven image fusion metrics, i.e., EI, MI, , , VIFF, SF, and FMI in the above five scenes. The nine advanced algorithms, i.e., LAP, DWT, NSCT, CVT, GFF, GTF, IFE, LPSR, and MVDS, are compared with our method.
Figure 15.
Quantitative comparisons of seven image fusion metrics, i.e., EI, MI, , , VIFF, SF, and FMI in the above five scenes. The nine advanced algorithms, i.e., LAP, DWT, NSCT, CVT, GFF, GTF, IFE, LPSR, and MVDS, are compared with our method.


Table 1.
Some of the Representative DL-based methods are compared.
| Metric | Method | Img1 | Img2 | Img3 | Img4 | Img5 | Img6 | Img7 | Rank |
|---|---|---|---|---|---|---|---|---|---|
| FMI | U2Fusion | 0.89 | 0.92 | 0.83 | 0.79 | 0.92 | 0.87 | 0.89 | 1 |
| DDcGAN | 0.88 | 0.9 | 0.82 | 0.81 | 0.9 | 0.86 | 0.88 | ||
| GANMcC | 0.9 | 0.93 | 0.85 | 0.81 | 0.91 | 0.88 | 0.9 | ||
| DenseFuse | 0.9 | 0.93 | 0.84 | 0.81 | 0.92 | 0.89 | 0.91 | ||
| FusionGAN | 0.89 | 0.92 | 0.86 | 0.79 | 0.9 | 0.88 | 0.88 | ||
| Ours | 0.92 | 0.94 | 0.86 | 0.83 | 0.92 | 0.9 | 0.91 | ||
| MI | U2Fusion | 1.38 | 1.86 | 2.07 | 2.16 | 2.41 | 1.95 | 1.83 | 1 |
| DDcGAN | 1.48 | 1.81 | 1.85 | 2.16 | 1.93 | 1.61 | 1.9 | ||
| GANMcC | 1.86 | 2.45 | 2.44 | 2.58 | 2.62 | 2.13 | 2.45 | ||
| DenseFuse | 2.11 | 2.23 | 2.23 | 3.56 | 2.62 | 2.15 | 1.88 | ||
| FusionGAN | 1.93 | 2.87 | 1.72 | 1.36 | 2.37 | 1.95 | 2.58 | ||
| Ours | 2.76 | 2.12 | 2.45 | 2.8 | 2.42 | 2.55 | 2.16 | ||
| U2Fusion | 0.43 | 0.4 | 0.41 | 0.28 | 0.47 | 0.42 | 0.41 | 1 | |
| DDcGAN | 0.4 | 0.27 | 0.28 | 0.44 | 0.35 | 0.36 | 0.28 | ||
| GANMcC | 0.17 | 0.27 | 0.3 | 0.07 | 0.44 | 0.22 | 0.36 | ||
| DenseFuse | 0.33 | 0.32 | 0.38 | 0.19 | 0.39 | 0.32 | 0.31 | ||
| FusionGAN | 0.23 | 0.16 | 0.17 | 0.05 | 0.23 | 0.14 | 0.27 | ||
| Ours | 0.56 | 0.51 | 0.53 | 0.55 | 0.58 | 0.57 | 0.52 | ||
| U2Fusion | 0.71 | 0.71 | 0.73 | 0.52 | 0.81 | 0.77 | 0.75 | 1 | |
| DDcGAN | 0.67 | 0.44 | 0.26 | 0.44 | 0.56 | 0.59 | 0.49 | ||
| GANMcC | 0.49 | 0.58 | 0.59 | 0.32 | 0.73 | 0.55 | 0.68 | ||
| DenseFuse | 0.71 | 0.66 | 0.66 | 0.49 | 0.68 | 0.68 | 0.6 | ||
| FusionGAN | 0.47 | 0.45 | 0.27 | 0.21 | 0.37 | 0.41 | 0.49 | ||
| Ours | 0.88 | 0.77 | 0.71 | 0.62 | 0.8 | 0.81 | 0.6 | ||
| SF | U2Fusion | 9.88 | 9.6 | 9.37 | 23.46 | 7.45 | 10.17 | 9.22 | 3 |
| DDcGAN | 12.24 | 7.72 | 11.29 | 26.02 | 7.52 | 11.46 | 8.66 | ||
| GANMcC | 4.73 | 5.61 | 5.05 | 10.98 | 5.62 | 5.15 | 5.46 | ||
| DenseFuse | 6.58 | 5.25 | 5.19 | 16.45 | 3.35 | 6.33 | 4.08 | ||
| FusionGAN | 6.32 | 4.39 | 4.19 | 10 | 3.29 | 4.66 | 5.45 | ||
| Ours | 11.85 | 8.1 | 7.28 | 28.24 | 5.8 | 10.68 | 6.4 |
Table 2.
Running time (seconds) is compared.
| LAP | DWT | NSCT | CVT | GFF | GTF | IFE | LPSR | MVSD | Proposed |
|---|---|---|---|---|---|---|---|---|---|
| 0.2294 | 0.6356 | 0.8087 | 0.3890 | 0.2207 | 0.8208 | 0.4776 | 0.1210 | 0.3265 | 0.2021 |
Publisher’s Note: MDPI stays neutral with regard to jurisdictional claims in published maps and institutional affiliations. |
© 2022 by the authors. Licensee MDPI, Basel, Switzerland. This article is an open access article distributed under the terms and conditions of the Creative Commons Attribution (CC BY) license (https://creativecommons.org/licenses/by/4.0/).
Share and Cite
MDPI and ACS Style
Xiao, R.; Cheng, F.; Shi, J.; Wang, Y.; Li, C. An Infrared and Visible Fusion Framework Based on a Novel Decomposition Method. Symmetry 2022, 14, 786. https://0-doi-org.brum.beds.ac.uk/10.3390/sym14040786
AMA Style
Xiao R, Cheng F, Shi J, Wang Y, Li C. An Infrared and Visible Fusion Framework Based on a Novel Decomposition Method. Symmetry. 2022; 14(4):786. https://0-doi-org.brum.beds.ac.uk/10.3390/sym14040786
Chicago/Turabian StyleXiao, Rui, Feiyan Cheng, Junsheng Shi, Yuanfangzhou Wang, and Chengli Li. 2022. "An Infrared and Visible Fusion Framework Based on a Novel Decomposition Method" Symmetry 14, no. 4: 786. https://0-doi-org.brum.beds.ac.uk/10.3390/sym14040786
Note that from the first issue of 2016, this journal uses article numbers instead of page numbers. See further details here.