
Optimal Test Plan of Step-Stress Model of Alpha Power Weibull Lifetimes under Progressively Type-II Censored Samples


Abstract
:1. Introduction
2. Model Description and Assumptions of Test
- For stress levels , the failure time is given by
- The association between the life feature and the stress loading can take one of two forms:
- The Arrhenius model is as follows: , where is the absolute temperature.
- The inverse power model is defined as , where is the voltage.
- Exponential model: , where , and is a weathering variable.
- 3.
- The cumulative exposure model is still valid, as demonstrated in [23].
3. Maximum Likelihood Estimation
4. Fisher Information Matrix
5. Confidence Intervals
5.1. Approximate Confidence Intervals
5.2. Bootstrap Confidence Intervals
| Algorithm 1. Bootstrap Algorithm |
| 1: Step 0, basic setup: |
| 2: Set b = 1 |
| 3: Determine the MLE values of as indicated by . |
| 4: Step 1, sampling: |
| 5: Obtain the bootstrap resample from , where is the MLE from Step 0. |
| 6: Step 2, bootstrap estimates: |
| 7: Determine the bootstrap estimations. |
| 8: |
| 9: Use the resample acquired in Step 1. |
| 10: Step 3, repetition: |
| 11: Set |
| 12: and then repeat Steps 1–3 until b = B. |
| 13: Step 4, begin in ascending order: |
| 14: Arrange the estimates in ascending order so that we have |
| 15: |
6. Bayesian Estimation
7. Optimization Criterion
8. Simulation
- Scheme I. and
- Scheme II. and
- Give the numbers n, m, and . N = 50 and 100; m = 40 and 45 when n = 50, and m = 80 and 90 when n = 100.
- Give the parameters and their values.
- From the random variable t provided by (1), create a sample of the randomness of size n and sort it. The APW distribution random variable is simple to produce. For instance, if the uniform random variable U comes from the range [0, 1], then
- To generate progressively censored data for given n and m, use the model provided by Equation (6). The set of data can be thought of as:
- To obtain the MLEs of the parameters, the nonlinear system is solved using the Newton–Raphson method.
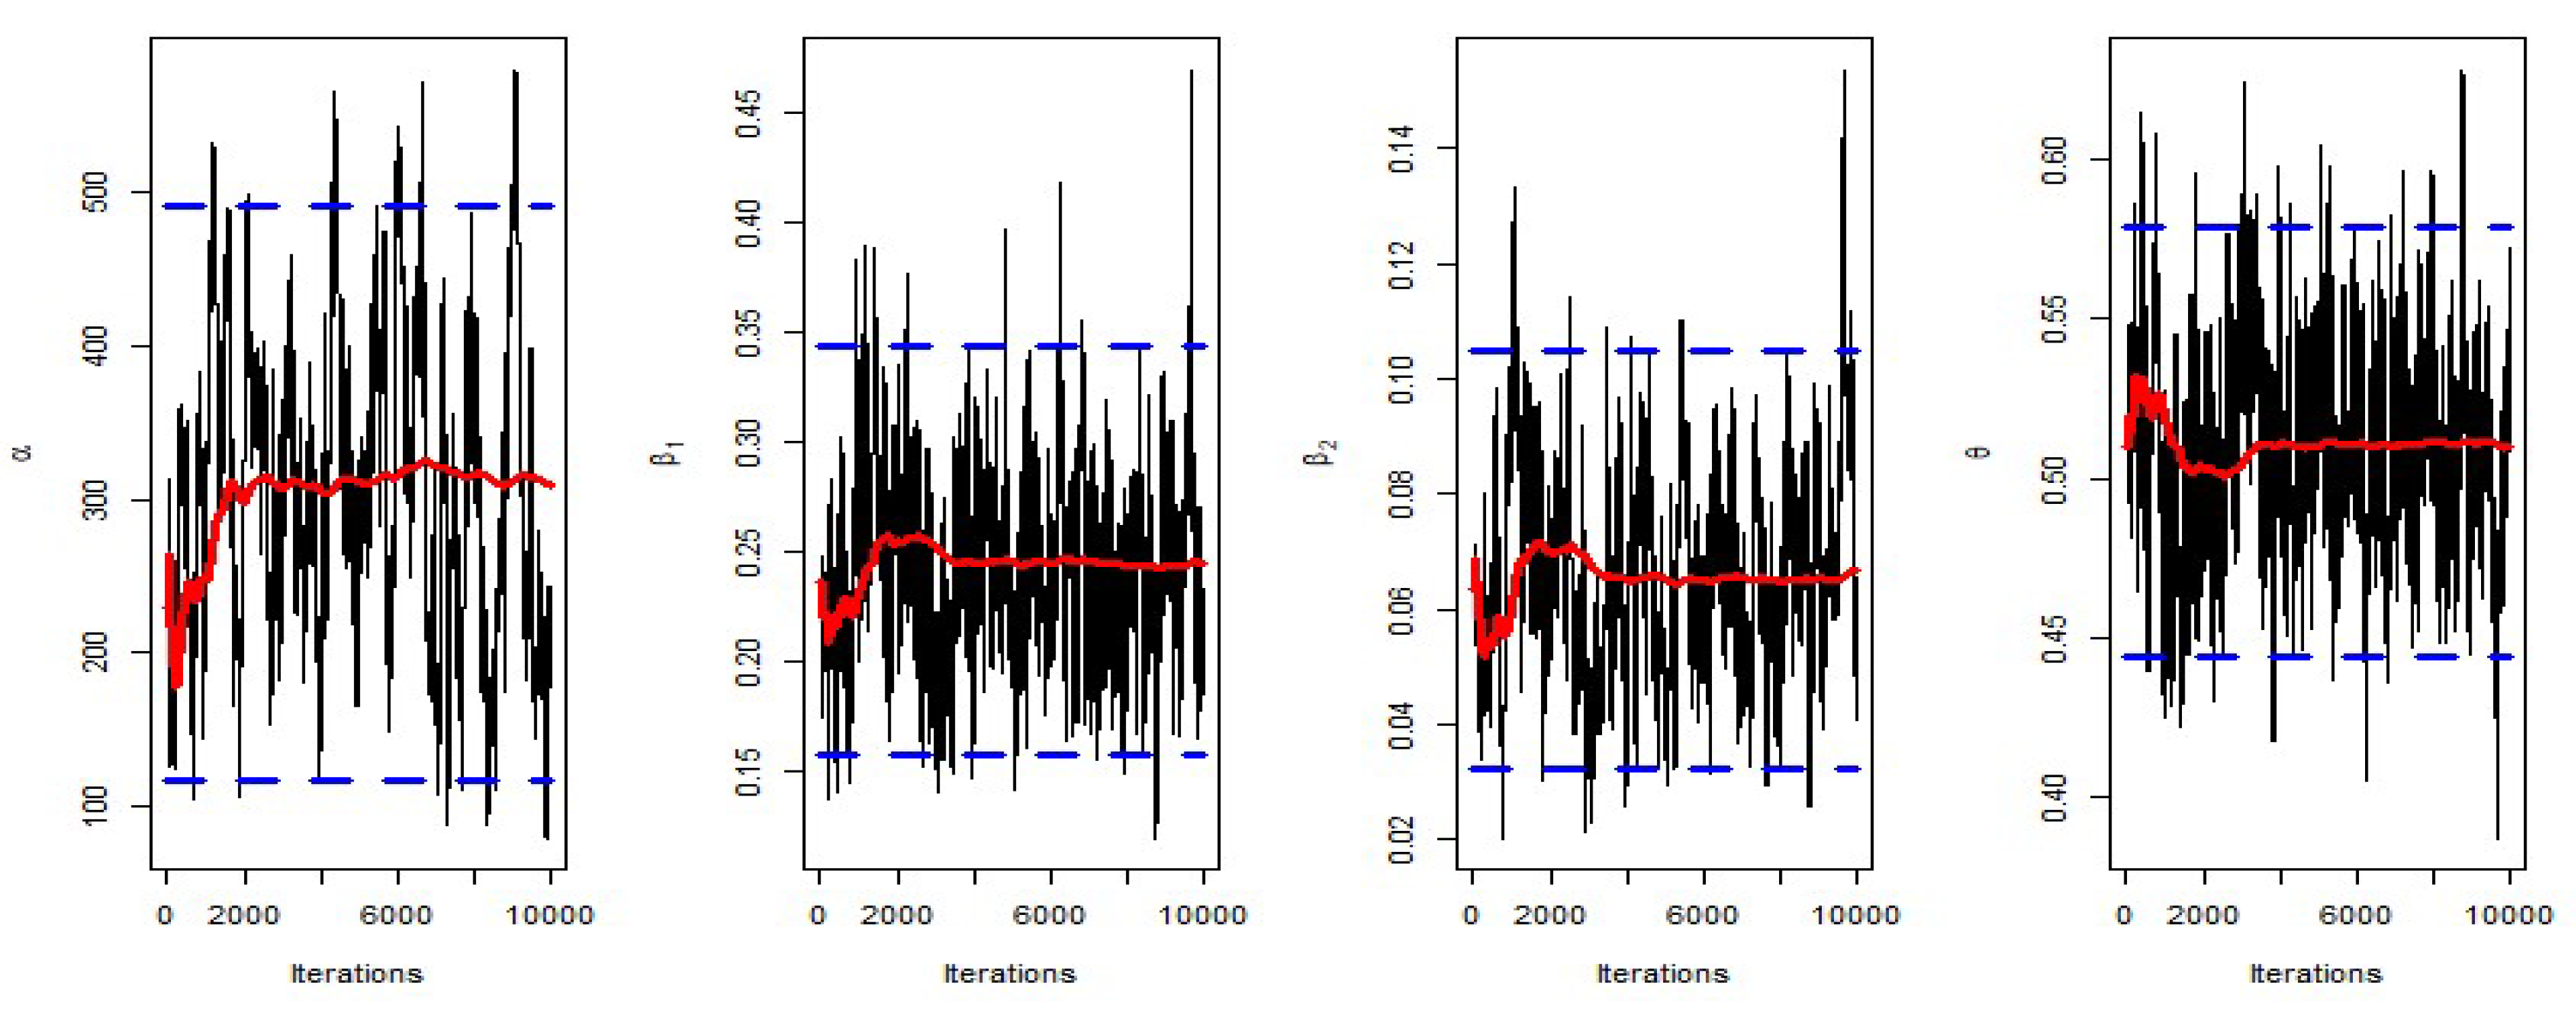
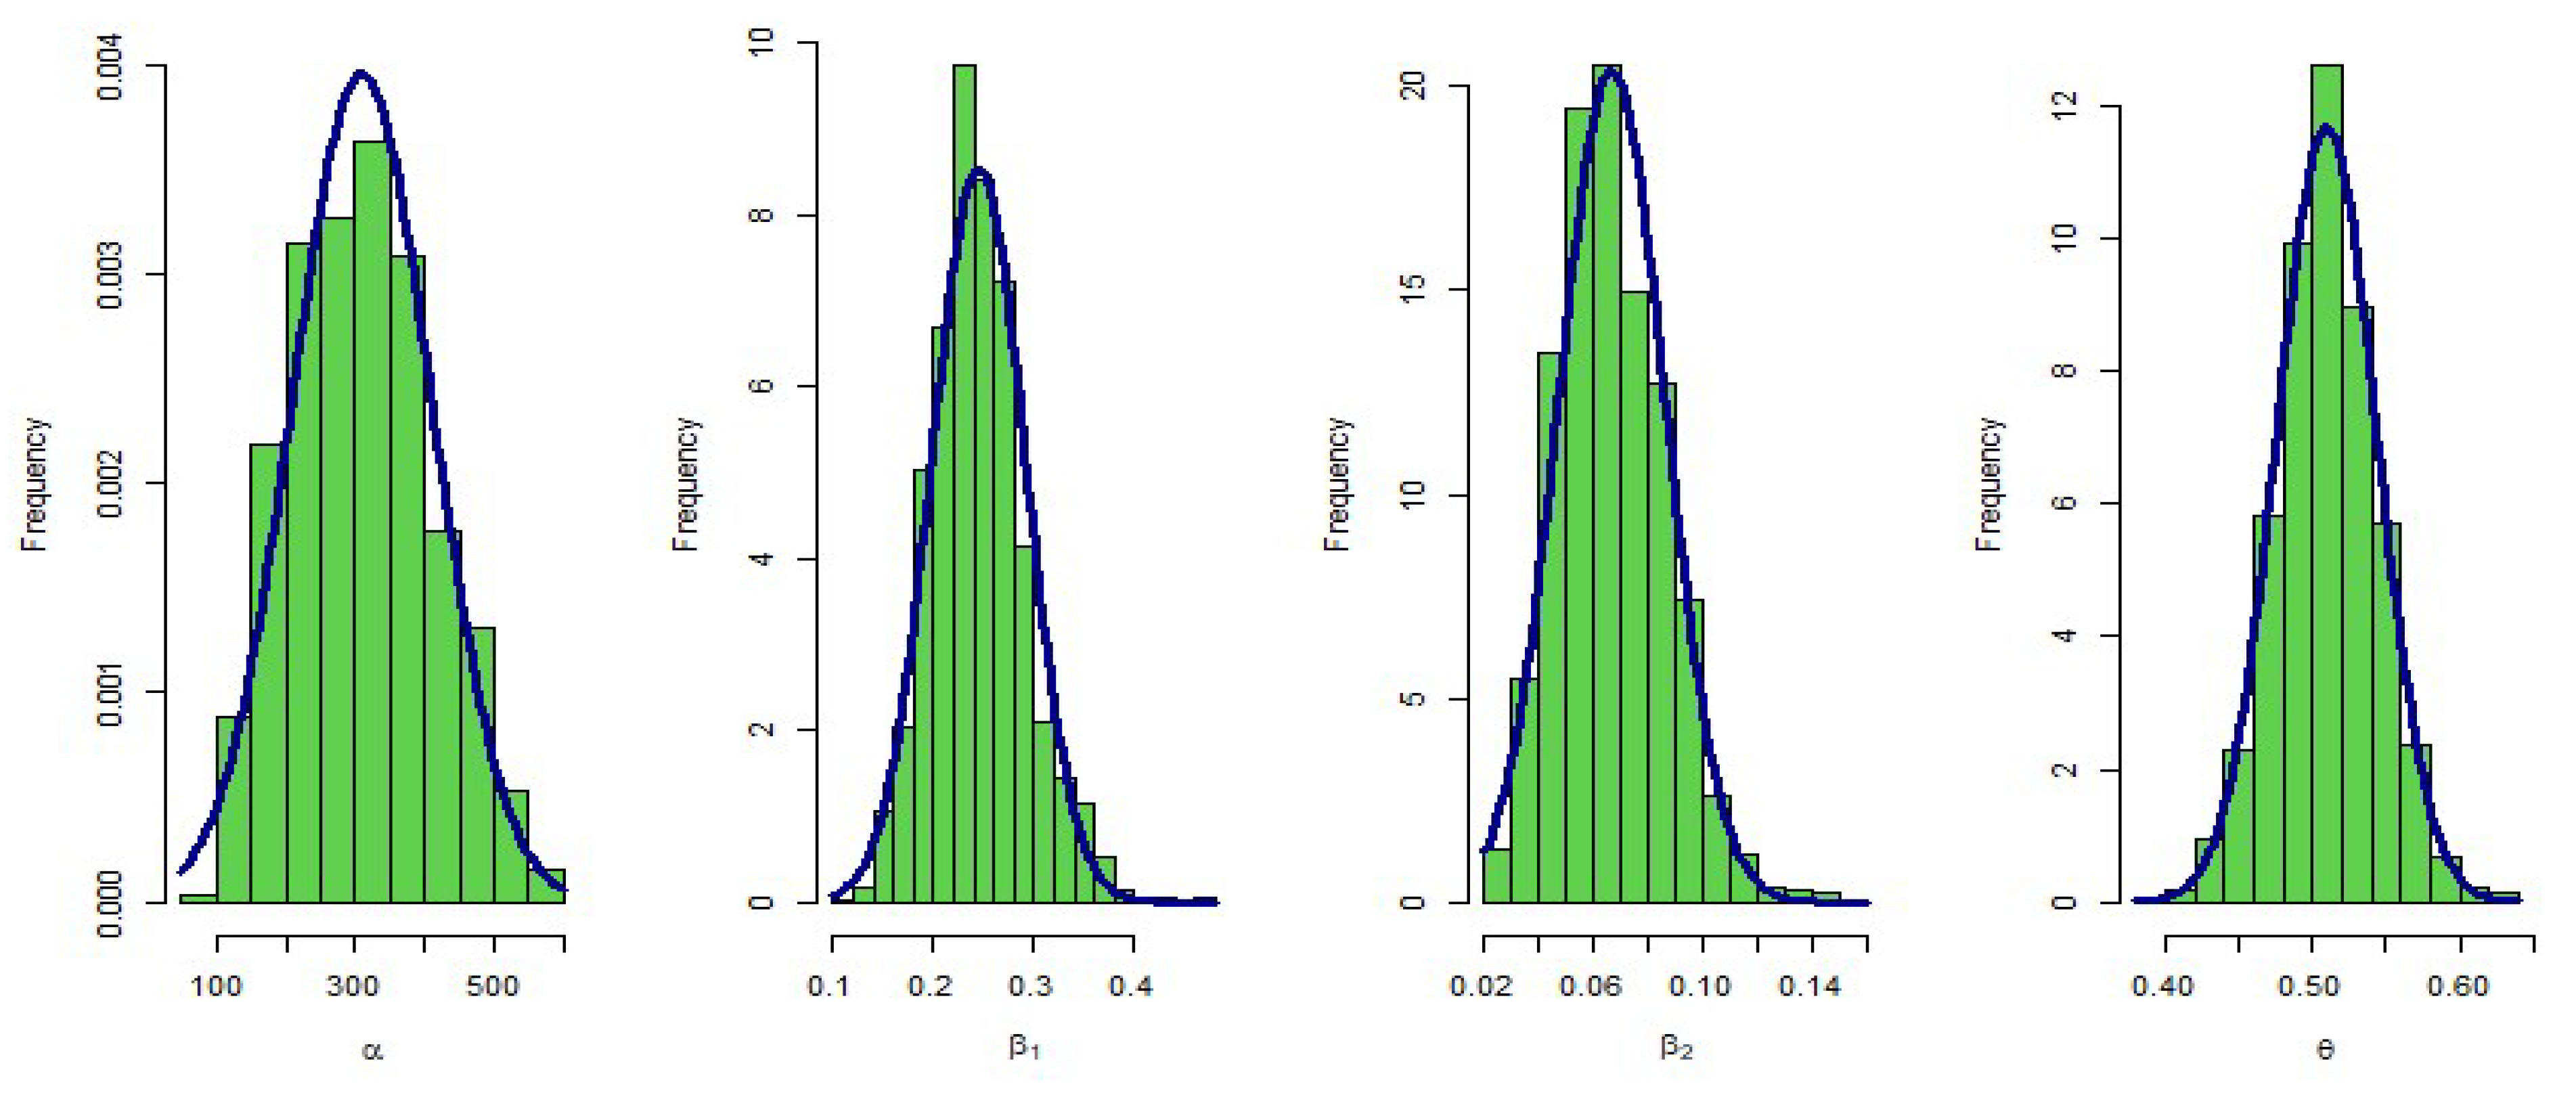
- To obtain the Bayesian estimations of the parameters, the posterior distribution is solved using the MCMC method by Metropolis–Hastings algorithm.
- Repeat steps 3 through 6 for 1000 iterations.
- Calculate the MILEs and Bayesian parameter-related average values of VB and VMSE.
- Calculate the various model parameter estimators’ confidence intervals.
- Calculate the various optimization criteria.
- The VB, VMSE, and LCI of the estimates for the two alternative censoring schemes decrease for fixed values of the sample size by increasing the censored sample size .
- By increasing the sample size n for fixed values of m, the VB, VMSE, and LCI for various censoring schemes drop.
- Under the cases taken into consideration, the symmetric and asymmetric Bayesian estimations are superior to the MLE in terms of VB and VMSE reduction.
- The LCI dramatically decreases, and the HPD’s symmetric and asymmetric Bayesian estimations outperform the MLE’s ACI.
- We note that the bootstrap CIs have the smallest CI lengths.
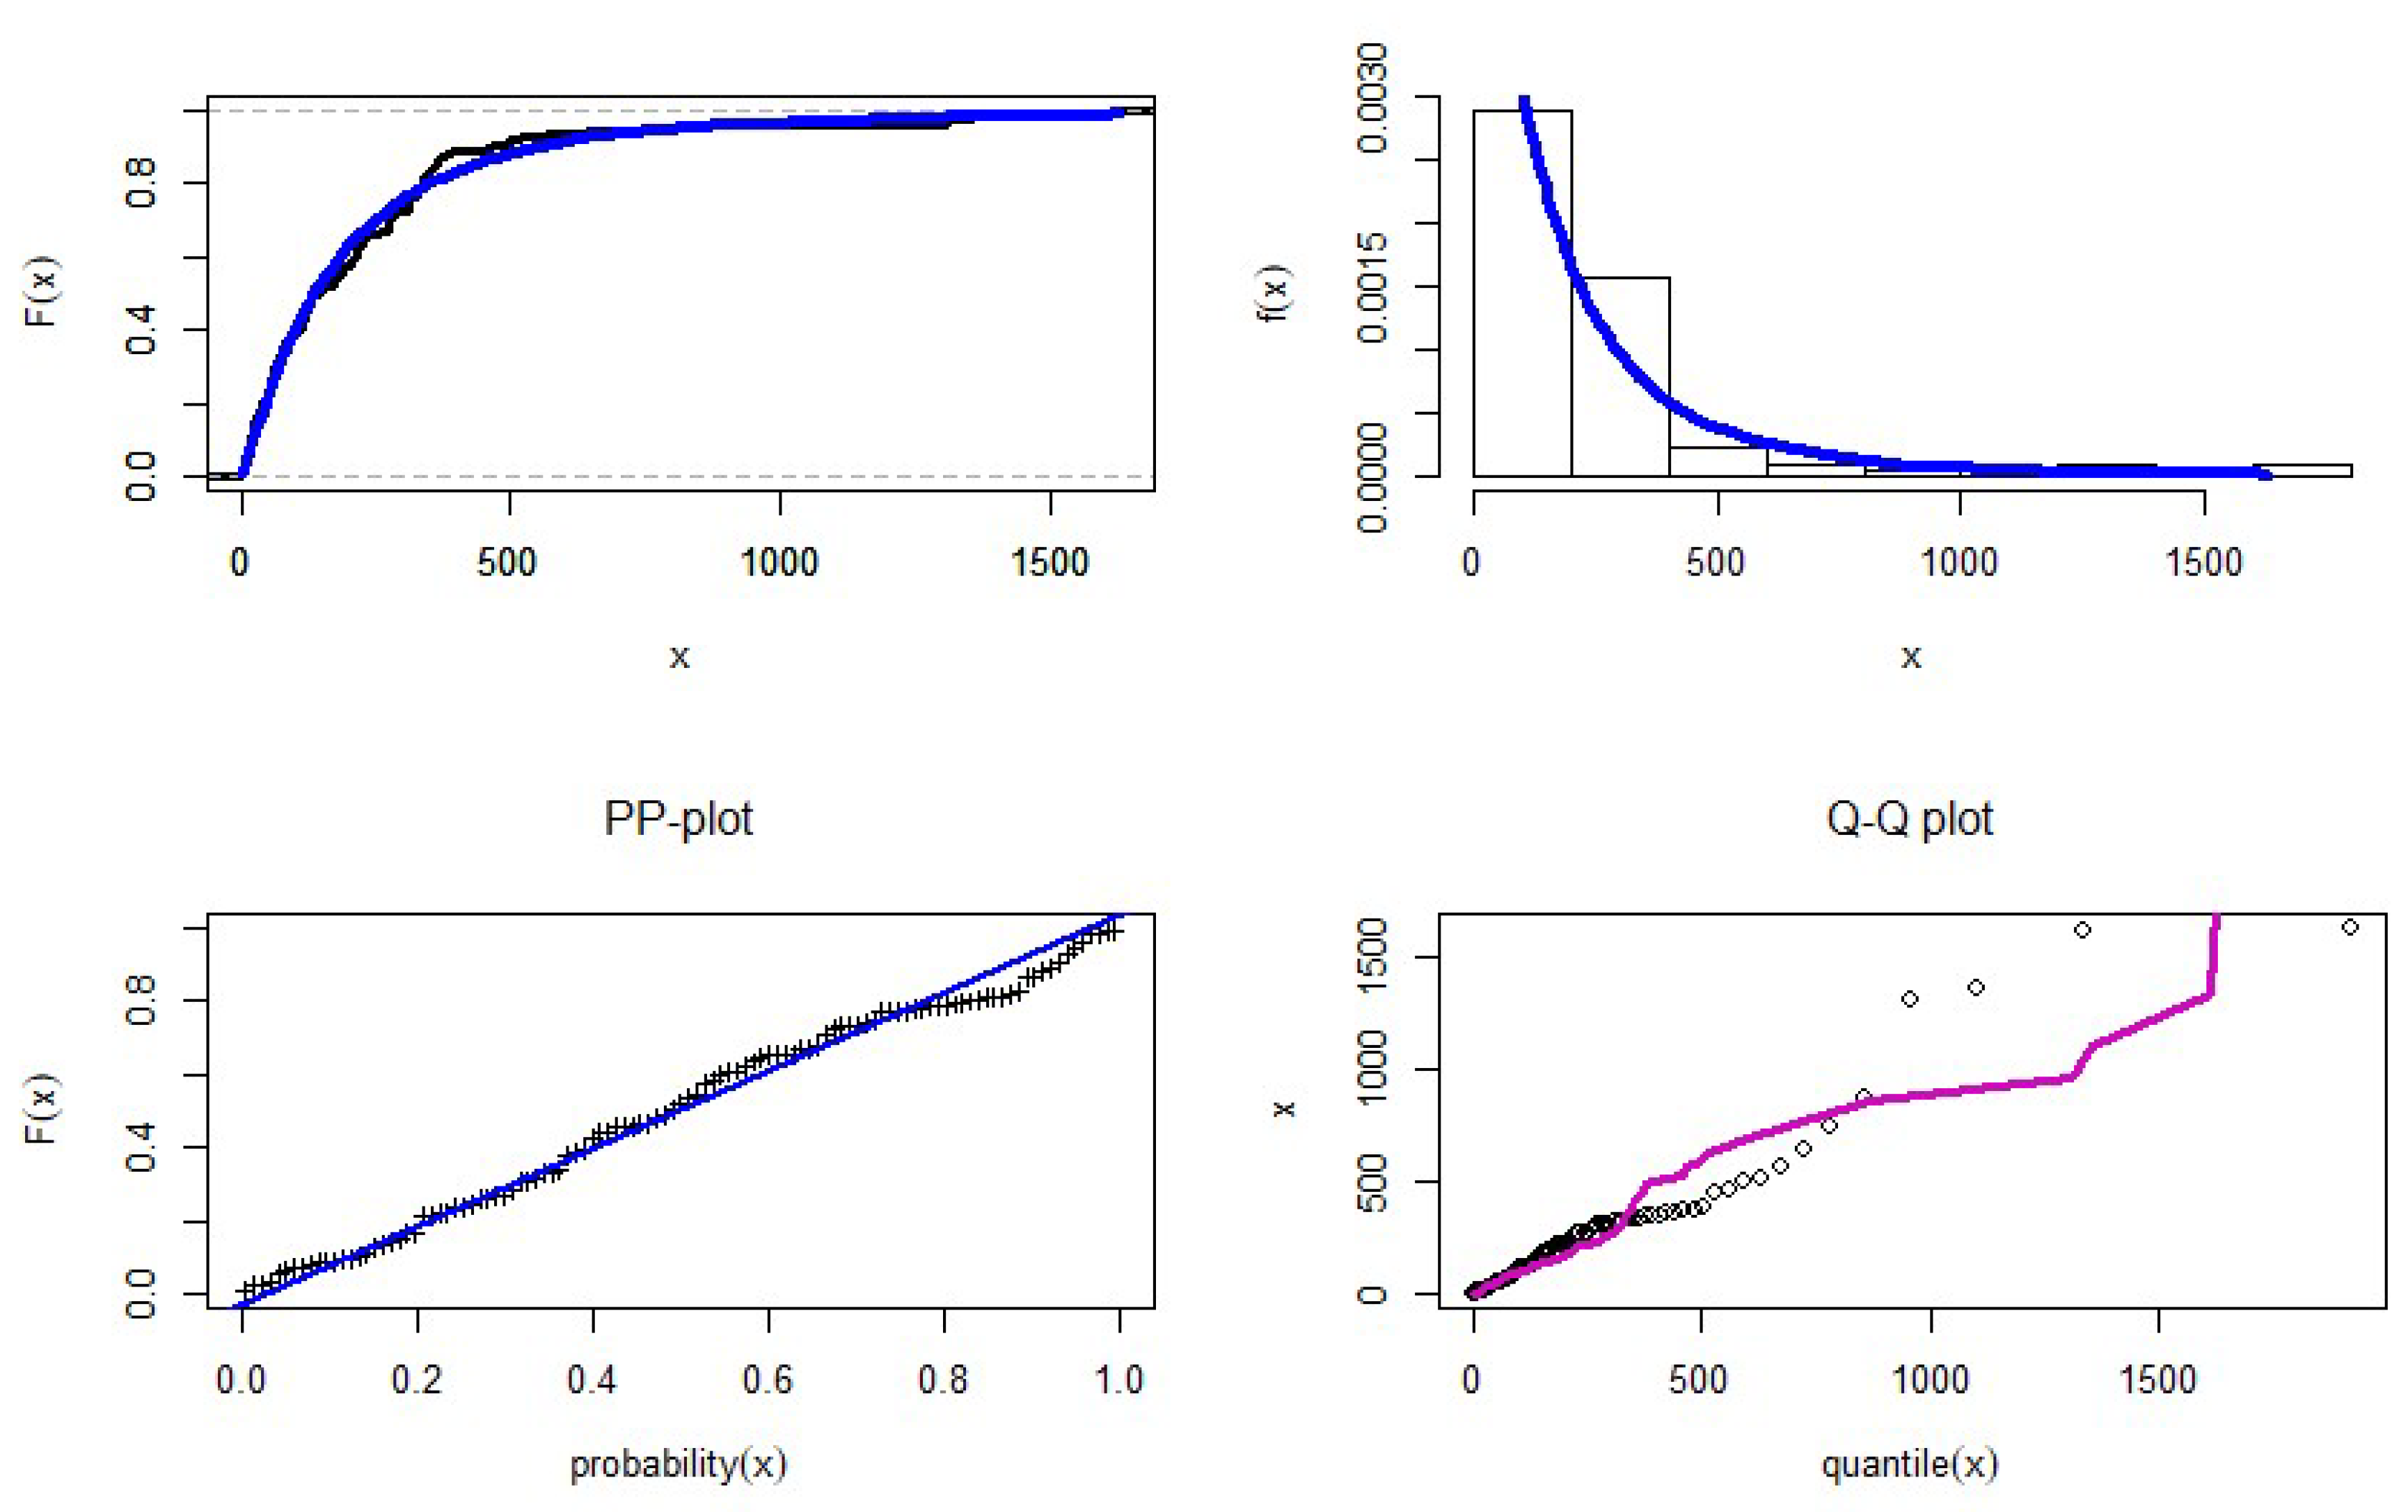
9. Application of Real Data
10. Conclusions
Author Contributions
Funding
Institutional Review Board Statement
Informed Consent Statement
Data Availability Statement
Acknowledgments
Conflicts of Interest
References
- Liu, X.; Qiu, W.S. Modeling and planning of step-stress accelerated life tests with independent competing risks. IEEE Trans. Reliab. 2011, 60, 712–720. [Google Scholar] [CrossRef]
- Xu, A.; Basu, S.; Tang, Y. A full Bayesian approach for masked data in step-stress accelerated life testing. IEEE Trans. Reliab. 2014, 63, 798–806. [Google Scholar] [CrossRef]
- Sedyakin, N.M. On one physical principle in reliability theory. Tech. Cybernatics 1966, 3, 80–87. (In Russian) [Google Scholar]
- Nelson, W. Accelerated life testing: Step-stress models and data analysis. IEEE Trans. Reliab. 1980, 29, 103–108. [Google Scholar] [CrossRef]
- Bagdonavicius, V.; Nikulin, M. Accelerated Life Models: Modelling and Statistical Analysis; Chapman and Hall/CRC Press: Boca Raton, FL, USA, 2002. [Google Scholar]
- Ganguly, A.; Kundu, D.; Mitra, S. Bayesian analysis of a simple step-stress model under Weibull lifetimes. IEEE Trans. Reliab. 2015, 64, 473–485. [Google Scholar] [CrossRef]
- Xiong, C. Inference on a simple step-stress model with Type-II censored exponential data. IEEE Trans. Reliab. 1998, 47, 142–146. [Google Scholar] [CrossRef]
- Balakrishnan, N.; Kundu, D.; NG, H.; Kannan, N. Point and interval estimation for a simple step-stress model with Type-II censoring. J. Qual. Technol. 2007, 39, 35–47. [Google Scholar] [CrossRef]
- Balakrishnan, N.; Xie, Q. Exact inference for a simple step stress model with Type-I hybrid censored data from the exponential distribution. J. Stat. Plan. Inference 2007, 137, 3268–3290. [Google Scholar] [CrossRef]
- Balakrishnan, N.; Zhang, L.; Xie, Q. Inference for a simple step stress model with Type-I censoring and lognormally distributed lifetimes. Commun. Stat.—Theory Methods 2009, 38, 1690–1709. [Google Scholar] [CrossRef]
- Bai, D.; Kim, M.; Lee, S. Optimum simple step-stress accelerated life test with censoring. IEEE Trans. Reliab. 1989, 38, 528–532. [Google Scholar] [CrossRef]
- Xie, Q.; Balakrishnan, N.; Han, D. Exact Inference and Optimal Censoring Scheme for a Simple Step-Stress Model under Progressive Type-II Censoring. In Advances in Mathematical and Statistical Modeling; Arnold, B.C., Balakrishnan, N., Sarabia, J.M., Minguez, R., Eds.; Birkhauser: Berlin, Germany, 2009; pp. 107–137. [Google Scholar]
- Ng, H.; Chan, P.; Balakrishnan, B. Optimal progressive censoring plan for the Weibull distribution. Technometrics 2004, 46, 470–481. [Google Scholar] [CrossRef]
- Khamis, I.; Higgins, J. A new model for step-stress testing. IEEE Trans. Reliab. 1998, 47, 131–134. [Google Scholar] [CrossRef]
- Kateri, M.; Balakrishnan, N. Inference for a simple step-stress model with Type-II censoring, and Weibull distributed lifetimes. IEEE Trans. Reliab. 2008, 57, 616–626. [Google Scholar] [CrossRef]
- Miller, R.; Nelson, W.B. Optimum simple step-stress plans for accelerated life testing. IEEE Trans. Reliab. 1983, 32, 59–65. [Google Scholar] [CrossRef]
- Lin, C.; Chou, C. Statistical inference for a lognormal step-stress model with Type-I censoring. IEEE Trans. Reliab. 2012, 61, 361–377. [Google Scholar] [CrossRef]
- Gouno, E.; Balakrishnan, N. Step-stress accelerated life test. In Handbook of Statistics; Balakrishnan, N., Rao, C., Eds.; Advances in Reliability, Series; North-Holland: Amsterdam, The Netherlands, 2001; Volume 20, pp. 623–639. [Google Scholar]
- Nelson, W. A bibliography of accelerated test plans, Part I—Overview. IEEE Trans. Reliab. 2005, 54, 194–197. [Google Scholar] [CrossRef]
- Balakrishnan, N. A synthesis of exact inferential results for exponential step-stress models and associated optimal accelerated life-tests. Metriika 2009, 69, 351–396. [Google Scholar] [CrossRef]
- Balakrishnan, N. Progressive censoring methodology: An appraisal. TEST Off. J. Span. Soc. Stat. Oper. Res. 2007, 16, 211–259. [Google Scholar] [CrossRef]
- Efron, B.; Tibshirani, R. An Introduction to the Bootstrap; Chapman and Hall: New York, NY, USA, 1993. [Google Scholar]
- Nassar, M.; Alzaatreh, A.; Mead, M.; Abo-Kasem, O. Alpha power Weibull distribution: Properties and applications. Commun. Stat.—Theory Methods 2017, 46, 10236–10252. [Google Scholar] [CrossRef]
- Neyman, J. Outline of a theory of statistical estimation based on the classical theory of probability. Philos. Trans. R. Soc. Lond. Ser. A Math. Phys. Sci. 1937, 236, 333–380. [Google Scholar]
- Alotaibi, R.; Mutairi, A.A.; Almetwally, E.M.; Park, C.; Rezk, H. Optimal Design for a Bivariate Step-Stress Accelerated Life Test with Alpha Power Exponential Distribution Based on Type-I Progressive Censored Samples. Symmetry 2022, 14, 830. [Google Scholar] [CrossRef]
- Gelman, A.; Carlin, J.B.; Stern, H.S.; Rubin, D.B. Bayesian Data Analysis, 2nd ed.; Chapman and Hall/CRC: Boca Raton, FL, USA, 2004. [Google Scholar]
- Lynch, S.M. Introduction to Applied Bayesian Statistics and Estimation for Social Scientists; Springer: New York, NY, USA, 2007. [Google Scholar]
- Dey, S. Bayesian estimation of the shape parameter of the generalized exponential distribution under different loss functions. Pak. J. Stat. Oper. Res. 2010, 6, 163–174. [Google Scholar] [CrossRef] [Green Version]
- Balasooriya, U.; Balakrishnan, N. Reliability sampling plans for log-normal distribution, based on progressively-censored samples. IEEE Trans. Reliab. 2000, 49, 199–203. [Google Scholar] [CrossRef]
- Balasooriya, U.; Saw, S.L.C.; Gadag, V. Progressively censored reliability sampling plans for the Weibull distribution. Technometrics 2000, 42, 160–167. [Google Scholar] [CrossRef]
- Burkschat, M.; Cramer, E.; Kamps, U. On optimal schemes in progressive censoring. Stat. Probab. Lett. 2006, 76, 1032–1036. [Google Scholar] [CrossRef]
- Burkschat, M.; Cramer, E.; Kamps, U. Optimality criteria and optimal schemes in progressive censoring. Commun. Stat.—Theory Methods 2007, 36, 1419–1431. [Google Scholar] [CrossRef]
- Burkschat, M. On optimality of extremal schemes in progressive type II censoring. J. Stat. Plan. Inference 2008, 138, 1647–1659. [Google Scholar] [CrossRef]
- Pradhan, B.; Kundu, D. On progressively censored generalized exponential distribution. Test 2009, 18, 497–515. [Google Scholar] [CrossRef]
- Elshahhat, A.; Rastogi, M.K. Estimation of parameters of life for an inverted Nadarajah–Haghighi distribution from type-II progressively censored samples. J. Indian Soc. Probab. Stat. 2021, 22, 113–154. [Google Scholar] [CrossRef]


| Criterion | Method |
|---|---|
| MLE | SELF | ELF c = −1.25 | ELF c = 1.25 | ||||||||||||||
|---|---|---|---|---|---|---|---|---|---|---|---|---|---|---|---|---|---|
| n | m | Bias | MSE | LACI | LBPCI | LBTCI | Bias | MSE | LCCI | Bias | MSE | LCCI | Bias | MSE | LCCI | ||
| 0.25 | 50 | 40 | −0.1538 | 2.0779 | 5.6213 | 0.1785 | 0.1775 | 0.0221 | 0.0290 | 0.6351 | 0.0236 | 0.0290 | 0.6334 | 0.0077 | 0.0292 | 0.6548 | |
| −0.7315 | 0.7799 | 1.9407 | 0.0641 | 0.0638 | −0.0822 | 0.0319 | 0.6075 | −0.0808 | 0.0315 | 0.6010 | −0.0946 | 0.0361 | 0.6338 | ||||
| −0.0841 | 0.1824 | 1.6421 | 0.0508 | 0.0502 | 0.1483 | 0.0448 | 0.5792 | 0.1499 | 0.0455 | 0.5823 | 0.1334 | 0.0388 | 0.5583 | ||||
| −0.0171 | 0.0467 | 0.8453 | 0.0263 | 0.0263 | −0.1120 | 0.0378 | 0.6158 | −0.1104 | 0.0372 | 0.6115 | −0.1264 | 0.0436 | 0.6466 | ||||
| 45 | −0.1188 | 1.4752 | 4.7407 | 0.1555 | 0.1581 | 0.0193 | 0.0188 | 0.5270 | 0.0203 | 0.0188 | 0.5260 | 0.0102 | 0.0187 | 0.5279 | |||
| −0.6927 | 0.6740 | 1.7284 | 0.0548 | 0.0539 | −0.0607 | 0.0203 | 0.4822 | −0.0599 | 0.0201 | 0.4809 | −0.0683 | 0.0220 | 0.4905 | ||||
| −0.0338 | 0.1480 | 1.5030 | 0.0479 | 0.0473 | 0.0973 | 0.0259 | 0.4811 | 0.0982 | 0.0262 | 0.4832 | 0.0884 | 0.0233 | 0.4682 | ||||
| −0.0148 | 0.0390 | 0.7726 | 0.0248 | 0.0248 | −0.0790 | 0.0223 | 0.4829 | −0.0780 | 0.0220 | 0.4806 | −0.0878 | 0.0249 | 0.5031 | ||||
| 100 | 80 | −0.3864 | 1.6118 | 4.7481 | 0.2603 | 0.2511 | 0.0388 | 0.0275 | 0.6051 | 0.0404 | 0.0276 | 0.6049 | 0.0248 | 0.0267 | 0.5888 | ||
| −0.8076 | 0.8049 | 1.5345 | 0.0907 | 0.0886 | −0.1397 | 0.0375 | 0.5152 | −0.1383 | 0.0369 | 0.5117 | −0.1524 | 0.0427 | 0.5385 | ||||
| −0.1827 | 0.1417 | 1.2920 | 0.0708 | 0.0703 | 0.2524 | 0.0831 | 0.4882 | 0.2546 | 0.0845 | 0.4910 | 0.2322 | 0.0707 | 0.4525 | ||||
| −0.0276 | 0.0275 | 0.6422 | 0.0363 | 0.0358 | −0.1763 | 0.0471 | 0.4742 | −0.1744 | 0.0461 | 0.4688 | −0.1951 | 0.0612 | 0.5209 | ||||
| 90 | −0.3586 | 1.0389 | 3.7420 | 0.1220 | 0.1221 | 0.0432 | 0.0259 | 0.6013 | 0.0447 | 0.0261 | 0.6021 | 0.0299 | 0.0248 | 0.5990 | |||
| −0.7703 | 0.7199 | 1.3950 | 0.0435 | 0.0437 | −0.1360 | 0.0369 | 0.5011 | −0.1345 | 0.0364 | 0.4992 | −0.1487 | 0.0420 | 0.5242 | ||||
| −0.1065 | 0.1187 | 1.2853 | 0.0399 | 0.0402 | 0.2359 | 0.0728 | 0.4964 | 0.2379 | 0.0740 | 0.4974 | 0.2178 | 0.0626 | 0.4729 | ||||
| −0.0214 | 0.0218 | 0.5732 | 0.0187 | 0.0189 | −0.1735 | 0.0470 | 0.5183 | −0.1717 | 0.0462 | 0.5152 | −0.1901 | 0.0554 | 0.5508 | ||||
| 0.7 | 50 | 40 | −0.9983 | 2.3028 | 4.8642 | 0.6904 | 0.4265 | 0.0125 | 0.0117 | 0.4110 | 0.0133 | 0.0117 | 0.4114 | −0.0059 | 0.0121 | 0.4106 | |
| −0.8436 | 0.9488 | 1.5382 | 0.1544 | 0.1431 | −0.0834 | 0.0243 | 0.5315 | −0.0821 | 0.0239 | 0.5284 | −0.0953 | 0.0280 | 0.5635 | ||||
| 1.1066 | 2.3695 | 4.2305 | 0.5592 | 0.5554 | −0.0222 | 0.0321 | 0.7313 | −0.0209 | 0.0319 | 0.7277 | −0.0344 | 0.0342 | 0.7598 | ||||
| 0.6335 | 0.6156 | 1.8301 | 0.2394 | 0.2323 | −0.0925 | 0.0321 | 0.7313 | −0.0914 | 0.0222 | 0.5276 | −0.1028 | 0.0248 | 0.4666 | ||||
| 45 | −0.8776 | 2.0948 | 4.1432 | 0.3510 | 0.3346 | 0.0031 | 0.0075 | 0.3691 | 0.0041 | 0.0075 | 0.3692 | 0.0055 | 0.0073 | 0.3771 | |||
| −0.8919 | 0.7867 | 1.0832 | 0.1020 | 0.1043 | −0.0766 | 0.0238 | 0.4806 | −0.0754 | 0.0235 | 0.4781 | −0.0874 | 0.0266 | 0.5014 | ||||
| 0.3129 | 0.8594 | 3.4288 | 0.2355 | 0.2324 | −0.0028 | 0.0279 | 0.6203 | −0.0013 | 0.0279 | 0.6182 | −0.0167 | 0.0289 | 0.6378 | ||||
| 0.3541 | 0.2783 | 1.5363 | 0.1038 | 0.1035 | −0.0559 | 0.0224 | 0.5294 | −0.0548 | 0.0217 | 0.4586 | −0.0656 | 0.0244 | 0.5351 | ||||
| 100 | 80 | −0.9330 | 2.3560 | 4.7935 | 0.4292 | 0.3807 | 0.0194 | 0.0067 | 0.3332 | 0.0201 | 0.0067 | 0.3345 | 0.0134 | 0.0064 | 0.3090 | ||
| −0.8437 | 0.8261 | 1.3300 | 0.1106 | 0.1079 | −0.1162 | 0.0294 | 0.4980 | −0.1151 | 0.0290 | 0.4976 | −0.1208 | 0.0330 | 0.5102 | ||||
| 0.8341 | 1.7017 | 3.9445 | 0.3058 | 0.3041 | 0.0267 | 0.0251 | 0.5738 | 0.0279 | 0.0252 | 0.5727 | 0.0160 | 0.0249 | 0.5709 | ||||
| 0.5448 | 0.5079 | 1.8070 | 0.1521 | 0.1521 | −0.1025 | 0.0241 | 0.4254 | −0.1013 | 0.0238 | 0.4224 | −0.1127 | 0.0272 | 0.4331 | ||||
| 90 | −1.0459 | 1.4880 | 2.4707 | 0.2820 | 0.1998 | 0.0074 | 0.0063 | 0.3027 | 0.0081 | 0.0063 | 0.3030 | 0.0010 | 0.0063 | 0.3000 | |||
| −0.9750 | 0.8200 | 0.8656 | 0.0863 | 0.0772 | −0.1101 | 0.0291 | 0.4763 | −0.1089 | 0.0287 | 0.4747 | −0.1268 | 0.0331 | 0.4947 | ||||
| 0.0922 | 0.3430 | 2.2762 | 0.2108 | 0.2058 | 0.0013 | 0.0199 | 0.5037 | 0.0025 | 0.0199 | 0.5035 | −0.0096 | 0.0204 | 0.5050 | ||||
| 0.2825 | 0.1573 | 1.0956 | 0.0973 | 0.0992 | −0.0959 | 0.0195 | 0.3699 | −0.0949 | 0.0193 | 0.3693 | −0.1043 | 0.0216 | 0.3794 | ||||
| MLE | SELF | ELF c = −1.25 | ELF c = 1.25 | ||||||||||||||
|---|---|---|---|---|---|---|---|---|---|---|---|---|---|---|---|---|---|
| n | m | Bias | MSE | LACI | LBPCI | LBTCI | Bias | MSE | LCCI | Bias | MSE | LCCI | Bias | MSE | LCCI | ||
| 0.25 | 50 | 40 | −0.0976 | 1.2539 | 4.3772 | 0.2034 | 0.2066 | 0.0180 | 0.0283 | 0.6616 | 0.0195 | 0.0284 | 0.6624 | 0.0043 | 0.0284 | 0.6579 | |
| −0.6768 | 0.6263 | 1.6095 | 0.0715 | 0.0700 | −0.0757 | 0.0311 | 0.6249 | −0.0743 | 0.0307 | 0.6207 | −0.0876 | 0.0349 | 0.6573 | ||||
| −0.0122 | 0.1362 | 1.4473 | 0.0657 | 0.0649 | 0.1158 | 0.0338 | 0.5291 | 0.1172 | 0.0342 | 0.5319 | 0.1031 | 0.0297 | 0.5218 | ||||
| −0.0069 | 0.0393 | 0.7770 | 0.0327 | 0.0327 | −0.0864 | 0.0316 | 0.5932 | −0.0849 | 0.0311 | 0.5922 | −0.0997 | 0.0360 | 0.6172 | ||||
| 45 | −0.1614 | 1.2366 | 4.3665 | 0.1423 | 0.1383 | 0.0178 | 0.0265 | 0.6402 | 0.0191 | 0.0265 | 0.6385 | 0.0041 | 0.0269 | 0.6557 | |||
| −0.6884 | 0.6163 | 1.5704 | 0.0520 | 0.0523 | −0.0748 | 0.0291 | 0.5757 | −0.0728 | 0.0287 | 0.5720 | −0.0848 | 0.0330 | 0.5975 | ||||
| −0.0254 | 0.1343 | 1.3480 | 0.0479 | 0.0477 | 0.1130 | 0.0318 | 0.5167 | 0.1132 | 0.0338 | 0.5269 | 0.1018 | 0.0233 | 0.5205 | ||||
| 0.0020 | 0.0347 | 0.7306 | 0.0232 | 0.0229 | −0.0849 | 0.0318 | 0.5776 | −0.0819 | 0.0314 | 0.5771 | −0.0911 | 0.0365 | 0.5997 | ||||
| 100 | 80 | −0.2849 | 0.8869 | 3.5257 | 0.2321 | 0.2180 | 0.0382 | 0.0313 | 0.6588 | 0.0397 | 0.0313 | 0.6590 | 0.0238 | 0.0312 | 0.6753 | ||
| −0.6954 | 0.6081 | 1.3860 | 0.0897 | 0.0906 | −0.1225 | 0.0291 | 0.4522 | −0.1212 | 0.0286 | 0.4475 | −0.1342 | 0.0336 | 0.4854 | ||||
| −0.0266 | 0.1059 | 1.2740 | 0.0834 | 0.0845 | 0.1873 | 0.0497 | 0.4562 | 0.1889 | 0.0504 | 0.4572 | 0.1731 | 0.0433 | 0.4421 | ||||
| −0.0159 | 0.0233 | 0.5962 | 0.0371 | 0.0377 | −0.1419 | 0.0232 | 0.4902 | −0.1403 | 0.0367 | 0.4865 | −0.1560 | 0.0432 | 0.5110 | ||||
| 90 | −0.2517 | 0.8791 | 3.5061 | 0.1605 | 0.1627 | 0.0303 | 0.0242 | 0.5772 | 0.0316 | 0.0243 | 0.5783 | 0.0176 | 0.0238 | 0.5817 | |||
| −0.6998 | 0.6021 | 1.3421 | 0.0661 | 0.0664 | −0.1240 | 0.0236 | 0.4485 | −0.1138 | 0.0235 | 0.4384 | −0.1252 | 0.0411 | 0.5118 | ||||
| −0.0391 | 0.1023 | 1.2455 | 0.0568 | 0.0573 | 0.1821 | 0.0460 | 0.4386 | 0.1722 | 0.0503 | 0.4397 | 0.1699 | 0.0415 | 0.4212 | ||||
| −0.0227 | 0.0222 | 0.5775 | 0.0256 | 0.0248 | −0.1406 | 0.0203 | 0.4720 | −0.1358 | 0.0341 | 0.4708 | −0.1475 | 0.0419 | 0.4399 | ||||
| 0.7 | 50 | 40 | −0.9948 | 1.8253 | 3.5850 | 0.1160 | 0.1141 | 0.0036 | 0.0108 | 0.4609 | 0.0044 | 0.0108 | 0.4615 | −0.0044 | 0.0112 | 0.4652 | |
| −0.9683 | 1.0302 | 1.1935 | 0.0381 | 0.0382 | −0.0593 | 0.0248 | 0.5776 | −0.0582 | 0.0246 | 0.5768 | −0.0691 | 0.0268 | 0.5881 | ||||
| 0.0496 | 0.3567 | 2.3343 | 0.0723 | 0.0718 | 0.0195 | 0.0235 | 0.5905 | 0.0208 | 0.0236 | 0.5905 | 0.0080 | 0.0232 | 0.5941 | ||||
| 0.2860 | 0.1713 | 1.1733 | 0.0396 | 0.0390 | −0.0512 | 0.0217 | 0.5395 | −0.0502 | 0.0216 | 0.5390 | −0.0611 | 0.0236 | 0.5549 | ||||
| 45 | −0.9899 | 1.6548 | 3.2220 | 0.1053 | 0.1040 | 0.0035 | 0.0079 | 0.3767 | 0.0070 | 0.0079 | 0.3759 | 0.0008 | 0.0078 | 0.3759 | |||
| −0.9749 | 1.0424 | 1.1893 | 0.0381 | 0.0385 | −0.0443 | 0.0171 | 0.4654 | −0.0435 | 0.0169 | 0.4644 | −0.0510 | 0.0181 | 0.4706 | ||||
| 0.0386 | 0.3486 | 2.3108 | 0.0740 | 0.0714 | 0.0067 | 0.0161 | 0.4896 | 0.0075 | 0.0162 | 0.4898 | −0.0012 | 0.0162 | 0.4928 | ||||
| 0.2735 | 0.1591 | 1.1385 | 0.0367 | 0.0364 | −0.0399 | 0.0160 | 0.4526 | −0.0391 | 0.0159 | 0.4508 | −0.0462 | 0.0170 | 0.4608 | ||||
| 100 | 80 | −1.1083 | 1.3528 | 1.3837 | 0.0583 | 0.0443 | 0.0160 | 0.0066 | 0.3336 | 0.0166 | 0.0066 | 0.3310 | 0.0101 | 0.0064 | 0.3344 | ||
| −1.0327 | 1.0892 | 0.5928 | 0.0243 | 0.0238 | −0.0956 | 0.0221 | 0.4665 | −0.0946 | 0.0219 | 0.4651 | −0.1047 | 0.0244 | 0.4786 | ||||
| −0.0784 | 0.1390 | 1.4294 | 0.0596 | 0.0595 | 0.0323 | 0.0200 | 0.5418 | 0.0333 | 0.0201 | 0.5411 | 0.0226 | 0.0192 | 0.5423 | ||||
| 0.2486 | 0.0987 | 0.7534 | 0.0391 | 0.0385 | −0.0733 | 0.0164 | 0.3997 | −0.0724 | 0.0162 | 0.3990 | −0.0813 | 0.0181 | 0.4088 | ||||
| 90 | −1.1255 | 1.2693 | 0.2016 | 0.0121 | 0.0118 | 0.0105 | 0.0057 | 0.3721 | 0.0112 | 0.0057 | 0.3271 | 0.0047 | 0.0056 | 0.3267 | |||
| −1.0583 | 0.5131 | 0.4124 | 0.0212 | 0.0202 | −0.0826 | 0.0217 | 0.4421 | −0.0816 | 0.0215 | 0.4419 | −0.0913 | 0.0239 | 0.4401 | ||||
| −0.1452 | 0.0925 | 1.0495 | 0.0502 | 0.0496 | 0.0259 | 0.0182 | 0.5014 | 0.0269 | 0.0183 | 0.5011 | 0.0166 | 0.0179 | 0.5054 | ||||
| 0.2417 | 0.0898 | 0.6956 | 0.0244 | 0.0243 | −0.0727 | 0.0163 | 0.3917 | −0.0727 | 0.0162 | 0.3900 | −0.0850 | 0.0179 | 0.4040 | ||||
| MLE | SELF | ELF c = −1.25 | ELF c = 1.25 | ||||||||||||||
|---|---|---|---|---|---|---|---|---|---|---|---|---|---|---|---|---|---|
| n | m | Bias | MSE | LACI | LBPCI | LBTCI | Bias | MSE | LCCI | Bias | MSE | LCCI | Bias | MSE | LCCI | ||
| 0.25 | 50 | 40 | 0.9414 | 2.8386 | 3.8474 | 0.3130 | 0.3126 | −0.0061 | 0.0309 | 0.6913 | −0.0055 | 0.0308 | 0.6907 | −0.0120 | 0.0315 | 0.7017 | |
| 1.1697 | 1.9148 | 2.8996 | 0.0924 | 0.0919 | −0.0655 | 0.0328 | 0.6988 | −0.0646 | 0.0326 | 0.6989 | −0.0728 | 0.0348 | 0.7070 | ||||
| −0.1820 | 0.1032 | 1.0381 | 0.0335 | 0.0334 | −0.0805 | 0.0307 | 0.6690 | −0.0796 | 0.0305 | 0.6690 | −0.0886 | 0.0331 | 0.6685 | ||||
| −0.0560 | 0.0192 | 0.4977 | 0.0159 | 0.0156 | −0.1080 | 0.0190 | 0.3310 | −0.1062 | 0.0190 | 0.3281 | −0.1245 | 0.0258 | 0.3594 | ||||
| 45 | 0.9517 | 1.3019 | 2.6460 | 0.2598 | 0.2600 | −0.0055 | 0.0224 | 0.5740 | −0.0050 | 0.0223 | 0.5705 | −0.0096 | 0.0226 | 0.5712 | |||
| 1.1301 | 1.7660 | 2.7420 | 0.0848 | 0.0850 | −0.0389 | 0.0265 | 0.5946 | −0.0378 | 0.0263 | 0.5940 | −0.0484 | 0.0286 | 0.6043 | ||||
| −0.1256 | 0.0700 | 0.9132 | 0.0297 | 0.0292 | −0.0066 | 0.0259 | 0.5285 | −0.0054 | 0.0256 | 0.5274 | −0.0166 | 0.0292 | 0.5484 | ||||
| −0.0400 | 0.0191 | 0.3878 | 0.0126 | 0.0126 | −0.0941 | 0.0166 | 0.3202 | −0.0926 | 0.0161 | 0.3130 | −0.1082 | 0.0222 | 0.3598 | ||||
| 100 | 80 | 0.9154 | 1.7481 | 2.9187 | 0.2476 | 0.2372 | −0.0130 | 0.0300 | 0.6706 | −0.0057 | 0.0300 | 0.6692 | −0.0122 | 0.0305 | 0.6714 | ||
| 1.1945 | 1.6777 | 1.9643 | 0.0636 | 0.0630 | −0.1207 | 0.0339 | 0.6496 | −0.1197 | 0.0336 | 0.6480 | −0.1292 | 0.0376 | 0.6633 | ||||
| −0.1972 | 0.0705 | 0.6977 | 0.0217 | 0.0217 | 0.0055 | 0.0328 | 0.5840 | −0.1167 | 0.0324 | 0.5850 | −0.1257 | 0.0359 | 0.5842 | ||||
| −0.0760 | 0.0114 | 0.2954 | 0.0097 | 0.0097 | −0.1283 | 0.0111 | 0.2034 | −0.1271 | 0.0187 | 0.2023 | −0.1392 | 0.0227 | 0.2110 | ||||
| 90 | 0.6449 | 0.9177 | 2.1011 | 0.2116 | 0.2117 | −0.0063 | 0.0201 | 0.5409 | −0.0051 | 0.0201 | 0.5421 | −0.0117 | 0.0204 | 0.5429 | |||
| 1.0994 | 1.4600 | 1.9663 | 0.0624 | 0.0625 | −0.0701 | 0.0336 | 0.5493 | −0.0690 | 0.0333 | 0.5476 | −0.0798 | 0.0365 | 0.5687 | ||||
| −0.1346 | 0.0417 | 0.6027 | 0.0202 | 0.0202 | −0.1176 | 0.0248 | 0.5158 | 0.0065 | 0.0246 | 0.5169 | −0.0034 | 0.0262 | 0.5288 | ||||
| −0.0508 | 0.0073 | 0.2701 | 0.0086 | 0.0086 | −0.1196 | 0.0071 | 0.1912 | −0.1184 | 0.0173 | 0.1922 | −0.1299 | 0.0214 | 0.2285 | ||||
| 0.5 | 50 | 40 | 4.6022 | 29.0365 | 10.9926 | 0.3568 | 0.3532 | 0.0017 | 0.0352 | 0.6966 | 0.0021 | 0.0348 | 0.6975 | −0.0061 | 0.0419 | 0.7010 | |
| 1.0747 | 1.4879 | 2.2629 | 0.0722 | 0.0726 | −0.0901 | 0.0362 | 0.7075 | −0.0893 | 0.0358 | 0.7048 | −0.0794 | 0.0394 | 0.7239 | ||||
| −0.5572 | 0.4593 | 1.5130 | 0.0473 | 0.0458 | −0.0855 | 0.0288 | 0.6470 | −0.0846 | 0.0288 | 0.6466 | −0.0063 | 0.0291 | 0.6544 | ||||
| −0.0970 | 0.0272 | 0.5231 | 0.0175 | 0.0172 | −0.0593 | 0.0089 | 0.2874 | −0.0581 | 0.0088 | 0.2867 | −0.0707 | 0.0111 | 0.2787 | ||||
| 45 | 3.8521 | 20.9405 | 9.6882 | 0.2892 | 0.2879 | 0.0012 | 0.0221 | 0.5780 | 0.0020 | 0.0221 | 0.5781 | −0.0024 | 0.0222 | 0.5782 | |||
| 0.9349 | 1.1954 | 2.2238 | 0.0687 | 0.0691 | −0.0693 | 0.0284 | 0.5442 | −0.0682 | 0.0282 | 0.5415 | −0.0976 | 0.0309 | 0.5603 | ||||
| −0.3477 | 0.1744 | 0.9070 | 0.0284 | 0.0284 | 0.0029 | 0.0282 | 0.5625 | 0.0039 | 0.0279 | 0.5620 | −0.0938 | 0.0310 | 0.5853 | ||||
| −0.0640 | 0.0146 | 0.4027 | 0.0128 | 0.0128 | −0.0550 | 0.0085 | 0.2665 | −0.0539 | 0.0083 | 0.2652 | −0.0645 | 0.0105 | 0.2985 | ||||
| 100 | 80 | 4.6348 | 26.0317 | 8.3661 | 0.2871 | 0.2854 | 0.0055 | 0.0288 | 0.6459 | 0.0061 | 0.0288 | 0.6462 | −0.0044 | 0.0289 | 0.6470 | ||
| 1.0837 | 1.3192 | 1.4922 | 0.0468 | 0.0468 | −0.1154 | 0.0401 | 0.6384 | −0.1383 | 0.0397 | 0.6375 | −0.1482 | 0.0444 | 0.6543 | ||||
| −0.5558 | 0.3416 | 0.7091 | 0.0234 | 0.0235 | −0.1271 | 0.0360 | 0.5828 | −0.1261 | 0.0239 | 0.5825 | −0.1365 | 0.0241 | 0.5902 | ||||
| −0.1201 | 0.0185 | 0.2514 | 0.0076 | 0.0079 | −0.0737 | 0.0077 | 0.1847 | −0.0730 | 0.0076 | 0.1848 | −0.0803 | 0.0088 | 0.1878 | ||||
| 90 | 3.9811 | 19.9447 | 7.9374 | 0.2347 | 0.2330 | −0.0008 | 0.0191 | 0.5341 | −0.0004 | 0.0191 | 0.5347 | 0.0003 | 0.0192 | 0.5358 | |||
| 0.9922 | 1.1096 | 1.3869 | 0.0440 | 0.0440 | −0.1039 | 0.0379 | 0.5314 | −0.1142 | 0.0374 | 0.5277 | −0.1259 | 0.0420 | 0.5520 | ||||
| −0.3428 | 0.1402 | 0.5913 | 0.0195 | 0.0197 | −0.0015 | 0.0239 | 0.5311 | −0.0006 | 0.0235 | 0.5307 | −0.0098 | 0.0214 | 0.5483 | ||||
| −0.0854 | 0.0106 | 0.2243 | 0.0073 | 0.0073 | −0.0721 | 0.0069 | 0.1499 | −0.0714 | 0.0068 | 0.1500 | −0.0788 | 0.0080 | 0.1523 | ||||
| MLE | SELF | ELF c = −1.25 | ELF c = 1.25 | ||||||||||||||
|---|---|---|---|---|---|---|---|---|---|---|---|---|---|---|---|---|---|
| n | m | Bias | MSE | LACI | LBPCI | LBTCI | Bias | MSE | LCCI | Bias | MSE | LCCI | Bias | MSE | LCCI | ||
| 0.25 | 50 | 40 | 2.0064 | 3.0044 | 3.6840 | 1.2511 | 1.2028 | −0.0104 | 0.0304 | 0.6579 | −0.0098 | 0.0303 | 0.6573 | −0.0160 | 0.0313 | 0.6632 | |
| 0.9564 | 1.6736 | 3.4310 | 0.3479 | 0.3530 | −0.1153 | 0.0421 | 0.6372 | −0.1142 | 0.0415 | 0.6352 | −0.1253 | 0.0474 | 0.6561 | ||||
| −0.1017 | 0.0939 | 1.1388 | 0.1398 | 0.1398 | −0.2211 | 0.0835 | 0.6738 | −0.2192 | 0.0822 | 0.6683 | −0.2372 | 0.0948 | 0.7169 | ||||
| 0.0168 | 0.0166 | 0.5037 | 0.0476 | 0.0448 | −0.1152 | 0.0236 | 0.3450 | −0.1120 | 0.0216 | 0.3421 | −0.1415 | 0.0433 | 0.3710 | ||||
| 45 | 1.8139 | 2.5383 | 3.5678 | 0.8749 | 0.8467 | −0.0094 | 0.0301 | 0.6254 | −0.0088 | 0.0301 | 0.6245 | −0.0141 | 0.0302 | 0.6299 | |||
| 1.1395 | 1.6175 | 2.6660 | 0.3382 | 0.3369 | −0.1056 | 0.0367 | 0.6071 | −0.1046 | 0.0363 | 0.6060 | −0.1150 | 0.0401 | 0.6160 | ||||
| −0.1157 | 0.0744 | 0.9772 | 0.1086 | 0.1087 | −0.1875 | 0.0682 | 0.6357 | −0.1856 | 0.0670 | 0.6327 | −0.2047 | 0.0793 | 0.6619 | ||||
| −0.0191 | 0.0065 | 0.3103 | 0.0417 | 0.0424 | −0.1051 | 0.0210 | 0.3384 | −0.1033 | 0.0201 | 0.3373 | −0.1201 | 0.0271 | 0.3814 | ||||
| 100 | 80 | 1.1551 | 2.4586 | 3.0041 | 0.9165 | 0.9095 | −0.0130 | 0.0284 | 0.6773 | −0.0123 | 0.0284 | 0.6753 | −0.0194 | 0.0288 | 0.6881 | ||
| 1.0838 | 1.7566 | 1.9916 | 0.2634 | 0.2609 | −0.1689 | 0.0520 | 0.6223 | −0.1676 | 0.0514 | 0.6236 | −0.1813 | 0.0586 | 0.6199 | ||||
| −0.1120 | 1.4052 | 0.6363 | 0.0884 | 0.0886 | −0.3136 | 0.1232 | 0.5349 | −0.3117 | 0.1216 | 0.5342 | −0.3297 | 0.1367 | 0.5515 | ||||
| −0.0330 | 0.0061 | 0.2810 | 0.0410 | 0.0411 | −0.1046 | 0.0146 | 0.2099 | −0.1034 | 0.0143 | 0.2106 | −0.1148 | 0.0173 | 0.2047 | ||||
| 90 | 1.0137 | 1.3916 | 2.9271 | 0.2069 | 0.2072 | −0.0023 | 0.0322 | 0.6213 | −0.0017 | 0.0216 | 0.6224 | −0.0083 | 0.0233 | 0.6133 | |||
| 1.0712 | 0.0352 | 1.8461 | 0.0619 | 0.0628 | 0.0386 | 0.0264 | 0.4687 | 0.0395 | 0.0265 | 0.4655 | 0.0309 | 0.0257 | 0.4962 | ||||
| −0.1095 | 0.0383 | 0.5960 | 0.0216 | 0.0215 | −0.0397 | 0.0198 | 0.5221 | −0.0388 | 0.0197 | 0.5185 | −0.0476 | 0.0210 | 0.5417 | ||||
| −0.0306 | 0.0055 | 0.2648 | 0.0082 | 0.0082 | 0.0017 | 0.0042 | 0.1781 | 0.0025 | 0.0043 | 0.1776 | −0.0047 | 0.0037 | 0.2043 | ||||
| 0.5 | 50 | 40 | 1.1493 | 1.9397 | 2.9250 | 0.3391 | 0.3256 | 0.0030 | 0.0328 | 0.6871 | 0.0036 | 0.0328 | 0.6873 | −0.0031 | 0.0330 | 0.6869 | |
| 0.8450 | 1.1056 | 2.4541 | 0.0741 | 0.0738 | 0.0154 | 0.0300 | 0.6736 | 0.0160 | 0.0300 | 0.6741 | 0.0032 | 0.0301 | 0.6814 | ||||
| −0.2558 | 0.1263 | 0.9678 | 0.0323 | 0.0326 | −0.0268 | 0.0258 | 0.6327 | −0.0261 | 0.0257 | 0.6301 | −0.0351 | 0.0272 | 0.6393 | ||||
| −0.0293 | 0.0131 | 0.4338 | 0.0133 | 0.0135 | −0.0068 | 0.0080 | 0.3114 | −0.0059 | 0.0081 | 0.3119 | −0.0078 | 0.0074 | 0.3117 | ||||
| 45 | 0.7233 | 1.1610 | 2.3694 | 0.2909 | 0.2914 | 0.0029 | 0.0222 | 0.5789 | 0.0035 | 0.0222 | 0.5790 | −0.0011 | 0.0224 | 0.5823 | |||
| 0.8528 | 1.0648 | 2.2785 | 0.0693 | 0.0691 | 0.0118 | 0.0205 | 0.5564 | 0.0127 | 0.0205 | 0.5558 | 0.0030 | 0.0203 | 0.5589 | ||||
| −0.2507 | 0.1249 | 0.9772 | 0.0315 | 0.0323 | −0.0256 | 0.0181 | 0.5202 | −0.0245 | 0.0180 | 0.5223 | −0.0328 | 0.0188 | 0.5263 | ||||
| −0.0308 | 0.0126 | 0.4236 | 0.0133 | 0.0134 | 0.0020 | 0.0057 | 0.2794 | 0.0031 | 0.0056 | 0.2794 | −0.0071 | 0.0063 | 0.2788 | ||||
| 100 | 80 | 0.6045 | 1.1682 | 2.0854 | 0.1939 | 0.1876 | 0.0048 | 0.0309 | 0.6904 | 0.0055 | 0.0308 | 0.6906 | −0.0019 | 0.0310 | 0.6967 | ||
| 0.8505 | 0.8734 | 1.5194 | 0.0479 | 0.0482 | 0.0410 | 0.0284 | 0.6407 | 0.0419 | 0.0285 | 0.6418 | 0.0328 | 0.0275 | 0.6312 | ||||
| −0.2560 | 0.0942 | 0.6641 | 0.0203 | 0.0204 | −0.0538 | 0.0232 | 0.5558 | −0.0529 | 0.0231 | 0.5532 | −0.0623 | 0.0248 | 0.5665 | ||||
| −0.0440 | 0.0063 | 0.2604 | 0.0080 | 0.0080 | −0.0033 | 0.0032 | 0.2068 | −0.0026 | 0.0032 | 0.2068 | −0.0096 | 0.0032 | 0.2044 | ||||
| 90 | 0.5197 | 0.8831 | 1.9005 | 0.1894 | 0.1794 | −0.0072 | 0.0206 | 0.5717 | −0.0068 | 0.0205 | 0.5704 | −0.0011 | 0.0208 | 0.5749 | |||
| 0.7606 | 0.7900 | 1.4300 | 0.0449 | 0.0447 | 0.0283 | 0.0178 | 0.4949 | 0.0289 | 0.0178 | 0.4940 | 0.0230 | 0.0175 | 0.4965 | ||||
| −0.2537 | 0.0890 | 0.6151 | 0.0201 | 0.0203 | −0.0424 | 0.0196 | 0.4903 | −0.0417 | 0.0196 | 0.4897 | −0.0487 | 0.0202 | 0.5005 | ||||
| −0.0486 | 0.0062 | 0.2429 | 0.0078 | 0.0078 | −0.0031 | 0.0028 | 0.2069 | −0.0022 | 0.0028 | 0.2070 | −0.0010 | 0.0029 | 0.2037 | ||||
| Scheme | n | m | C1 | C2 | C3 | C4 | |
|---|---|---|---|---|---|---|---|
| I | 0.25 | 50 | 40 | 16.3206 | 0.0061 | 180.2384 | 1.7014 |
| 45 | 6.0414 | 0.0020 | 184.6583 | 1.4621 | |||
| 100 | 80 | 2.2000 | 0.0004 | 354.1789 | 1.8860 | ||
| 90 | 1.1367 | 0.0002 | 356.2299 | 1.6011 | |||
| 0.7 | 50 | 40 | 4.5528 | 0.0001 | 758.9591 | 0.8902 | |
| 45 | 2.3602 | 0.0001 | 1041.8315 | 0.8309 | |||
| 100 | 80 | 1.7095 | 0.0000 | 1012.1129 | 0.8804 | ||
| 90 | 0.8120 | 0.0000 | 1490.5832 | 0.8054 | |||
| II | 0.25 | 50 | 40 | 11.6987 | 0.0048 | 391.3110 | 1.3976 |
| 45 | 2.0260 | 0.0006 | 313.1369 | 1.4117 | |||
| 100 | 80 | 5.3355 | 0.0003 | 418.3329 | 1.3703 | ||
| 90 | 0.4786 | 0.0001 | 457.4760 | 1.3855 | |||
| 0.7 | 50 | 40 | 8.7456 | 0.0015 | 1780.0456 | 1.5195 | |
| 45 | 2.2929 | 0.0003 | 1781.0465 | 1.5845 | |||
| 100 | 80 | 0.3569 | 0.0000 | 2361.9466 | 1.6027 | ||
| 90 | 0.2268 | 0.0000 | 2927.2421 | 1.7028 |
| Scheme | n | m | C1 | C2 | C3 | C4 | |
|---|---|---|---|---|---|---|---|
| I | 0.25 | 50 | 40 | 27.7201 | 0.0098 | 139.3604 | 0.4791 |
| 45 | 25.8804 | 0.0063 | 146.8403 | 0.4327 | |||
| 100 | 80 | 26.0761 | 0.0010 | 269.3626 | 0.4494 | ||
| 90 | 1.0596 | 0.0002 | 284.6315 | 0.4192 | |||
| 0.5 | 50 | 40 | 21.4636 | 0.0047 | 182.4893 | 0.9768 | |
| 45 | 19.6311 | 0.0040 | 197.9801 | 0.5763 | |||
| 100 | 80 | 16.5668 | 0.0003 | 339.1911 | 0.7525 | ||
| 90 | 13.4178 | 0.0002 | 343.7374 | 0.5483 | |||
| II | 0.25 | 50 | 40 | 30.9083 | 0.0173 | 130.2885 | 0.4187 |
| 45 | 27.2336 | 0.0389 | 148.9823 | 0.4235 | |||
| 100 | 80 | 27.4830 | 0.0012 | 266.5808 | 0.4100 | ||
| 90 | 1.9883 | 0.0004 | 295.9238 | 0.4106 | |||
| 0.5 | 50 | 40 | 54.6397 | 0.0178 | 150.5007 | 0.5241 | |
| 45 | 19.8762 | 0.0178 | 164.4730 | 0.5210 | |||
| 100 | 80 | 27.8974 | 0.0007 | 287.5853 | 0.4947 | ||
| 90 | 21.2904 | 0.0004 | 321.4360 | 0.4917 |
| Estimate | SE | AIC | CAIC | BIC | HQIC | CVM | AD | KS | p-Value | |
|---|---|---|---|---|---|---|---|---|---|---|
| par1 | 209.5080 | 537.4003 | 1408.6145 | 1408.8431 | 1416.6886 | 1411.8889 | 0.0867 | 0.5489 | 0.0617 | 0.8003 |
| par2 | 0.2054 | 0.1619 | ||||||||
| par3 | 0.4679 | 0.1105 |
| m | Scheme | ||
|---|---|---|---|
| 80 | I | 1 4 4 7 11 13 15 15 17 18 19 19 20 20 22 23 28 29 31 32 36 37 47 48 49 50 54 54 55 59 59 61 61 66 72 72 75 78 78 81 93 96 99 108 113 114 120 120 120 123 124 129 131 137 145 151 156 171 176, 182 188 189 195 | 203 208 215 217 217 217 224 228 233 255 271 275 275 275 286 291 312 |
| II | 1 4 4 7 11 13 18 19 19 20 20 22 29 31 36 37 47 48 49 50 54 59 61 72 75 78 93 96 99 108 120 120 120 124 129 131 137 145 151 156 171 176 189 195 | 203 217 217 217 224 228 255 271 275 275 275 286 312 312 315 326 326 330 336 338 345 348 354 361 364 369 378 390 457 498 517 745 871 1312 1357 1613 | |
| 95 | I | 1 4 4 7 11 13 15 15 17 18 19 19 20 20 22 23 28 29 31 32 36 37 47 48 49 50 54 54 55 59 59 61 61 66 72 72 75 78 78 81 93 96 99 108 113 114 120 120 120 123 124 129 131 137 145 151 156 171 176 182 188 189 195 | 203 208 215 217 217 217 224 228 233 255 271 275 275 275 286 291 312 312 312 315 326 326 329 330 336 338 345 348 354 361 364 369 |
| II | 1 4 4 7 11 13 15 17 18 19 19 20 20 22 23 29 31 36 37 47 48 49 50 54 55 59 59 61 61 72 75 78 78 93 96 99 108 113 114 120 120 120 123 124 129 131 137 145 151 156 171 176 188 189 195 | 203 217 217 217 224 228 233 255 271 275 275 275 286 312 312 315 326 326 329 330 336 338 345 348 354 361 364 369 378 390 457 467 498 517 745 871 1312 1357 1613 1630 |
| Scheme | I | II | |||||||
|---|---|---|---|---|---|---|---|---|---|
| m | MLE | SELF | ELF c = −1.25 | ELF c = 1.25 | MLE | SELF | ELF c = −1.25 | ELF c = 1.25 | |
| 80 | 229.7518 | 256.6721 | 259.2273 | 233.5119 | 230.6366 | 283.9013 | 289.5624 | 229.1130 | |
| 0.2361 | 0.2450 | 0.2459 | 0.2370 | 0.1810 | 0.1936 | 0.1948 | 0.1817 | ||
| 0.0634 | 0.0686 | 0.0693 | 0.0620 | 0.0942 | 0.1032 | 0.1042 | 0.0934 | ||
| 0.5101 | 0.5049 | 0.5051 | 0.5026 | 0.5369 | 0.5297 | 0.5300 | 0.5263 | ||
| 95 | 229.9271 | 273.4300 | 276.5470 | 243.8001 | 230.5368 | 260.5656 | 264.4054 | 224.5377 | |
| 0.1928 | 0.2027 | 0.2036 | 0.1945 | 0.1850 | 0.1861 | 0.1871 | 0.1774 | ||
| 0.0882 | 0.0953 | 0.0960 | 0.0889 | 0.0884 | 0.0897 | 0.0906 | 0.0820 | ||
| 0.5347 | 0.5288 | 0.5290 | 0.5265 | 0.5399 | 0.5424 | 0.5427 | 0.5395 | ||
| Scheme | I | II | |||||||
|---|---|---|---|---|---|---|---|---|---|
| m | MLE | SELF | ELF c = −1.25 | ELF c = 1.25 | MLE | SELF | ELF c = −1.25 | ELF c = 1.25 | |
| 80 | 2634.8282 | 2490.4402 | 2452.2419 | 2880.1106 | 674.7867 | 656.0487 | 651.4561 | 707.7382 | |
| S1 | 0.000011 | 0.000017 | 0.000017 | 0.000013 | 0.0137 | 0.0138 | 0.0134 | 0.0173 | |
| S2 | 0.1490 | 0.1472 | 0.1450 | 0.1675 | 0.2160 | 0.2058 | 0.2014 | 0.2477 | |
| 95 | 863.4307 | 832.6288 | 827.7715 | 885.8488 | 784.8394 | 767.4241 | 761.1656 | 836.1470 | |
| S1 | 0.0042 | 0.0047 | 0.0046 | 0.0054 | 0.0063 | 0.0060 | 0.0059 | 0.0067 | |
| S2 | 0.1864 | 0.1813 | 0.1785 | 0.2077 | 0.1942 | 0.1871 | 0.1838 | 0.2186 | |
| Scheme | I | II | |||||||||||
|---|---|---|---|---|---|---|---|---|---|---|---|---|---|
| MLE | Bayesian | MLE | Bayesian | ||||||||||
| m | SE | Lower | Upper | SE | Lower | Upper | SE | Lower | Upper | SE | Lower | Upper | |
| 80 | 118.0578 | 96.1569 | 363.3467 | 73.0245 | 125.7197 | 398.2883 | 186.5222 | 67.1426 | 394.1305 | 113.8806 | 99.1169 | 420.4155 | |
| 0.0563 | 0.1258 | 0.3464 | 0.0420 | 0.1639 | 0.3223 | 0.0621 | 0.0593 | 0.3026 | 0.0443 | 0.1077 | 0.2820 | ||
| 0.0239 | 0.0166 | 0.1102 | 0.0205 | 0.0332 | 0.1094 | 0.0376 | 0.0206 | 0.1678 | 0.0289 | 0.0461 | 0.1555 | ||
| 0.0440 | 0.4238 | 0.5964 | 0.0321 | 0.4442 | 0.5647 | 0.0560 | 0.4271 | 0.6467 | 0.0402 | 0.4568 | 0.6118 | ||
| 95 | 137.4981 | 109.4047 | 350.4495 | 82.5557 | 118.9227 | 428.0149 | 157.0162 | 92.9060 | 368.1675 | 89.8255 | 113.3098 | 446.9009 | |
| 0.0522 | 0.0905 | 0.2951 | 0.0379 | 0.1354 | 0.2819 | 0.0538 | 0.0795 | 0.2904 | 0.0377 | 0.1233 | 0.2716 | ||
| 0.0291 | 0.0311 | 0.1453 | 0.0227 | 0.0541 | 0.1417 | 0.0318 | 0.0260 | 0.1508 | 0.0243 | 0.0437 | 0.1365 | ||
| 0.0463 | 0.4439 | 0.6254 | 0.0327 | 0.4673 | 0.5891 | 0.0493 | 0.4434 | 0.6365 | 0.0372 | 0.4787 | 0.6225 | ||
| m | Scheme | C1 | C2 | C3 |
|---|---|---|---|---|
| 80 | I | 13,937.641 | 0.0000007 | 23,735.354 |
| II | 34,790.557 | 0.0000023 | 22,146.579 | |
| 95 | I | 18,905.736 | 0.0000007 | 25,484.337 |
| II | 24,654.097 | 0.0000009 | 26,871.390 |
Publisher’s Note: MDPI stays neutral with regard to jurisdictional claims in published maps and institutional affiliations. |
© 2022 by the authors. Licensee MDPI, Basel, Switzerland. This article is an open access article distributed under the terms and conditions of the Creative Commons Attribution (CC BY) license (https://creativecommons.org/licenses/by/4.0/).
Share and Cite
Alotaibi, R.; Almetwally, E.M.; Kumar, D.; Rezk, H. Optimal Test Plan of Step-Stress Model of Alpha Power Weibull Lifetimes under Progressively Type-II Censored Samples. Symmetry 2022, 14, 1801. https://0-doi-org.brum.beds.ac.uk/10.3390/sym14091801
Alotaibi R, Almetwally EM, Kumar D, Rezk H. Optimal Test Plan of Step-Stress Model of Alpha Power Weibull Lifetimes under Progressively Type-II Censored Samples. Symmetry. 2022; 14(9):1801. https://0-doi-org.brum.beds.ac.uk/10.3390/sym14091801
Chicago/Turabian StyleAlotaibi, Refah, Ehab M. Almetwally, Devendra Kumar, and Hoda Rezk. 2022. "Optimal Test Plan of Step-Stress Model of Alpha Power Weibull Lifetimes under Progressively Type-II Censored Samples" Symmetry 14, no. 9: 1801. https://0-doi-org.brum.beds.ac.uk/10.3390/sym14091801