The Lotsberg Salt Formation in Central Alberta (Canada)—Petrology, Geochemistry, and Fluid Inclusions


1
Faculty of Geology, Geophysics and Environmental Protection, AGH UST, University of Science and Technology, 30 Mickiewicz Av., 30-059 Krakow, Poland
2
Kukiałka Consulting Ltd., Calgary, AB T3E 5B9, Canada
*
Author to whom correspondence should be addressed.
Minerals 2020, 10(10), 868; https://0-doi-org.brum.beds.ac.uk/10.3390/min10100868
Submission received: 5 August 2020
/
Revised: 24 September 2020
/
Accepted: 29 September 2020
/
Published: 30 September 2020
(This article belongs to the Special Issue Mineralogy, Petrology and Geochemistry of Evaporites)
Abstract
:The Lotsberg Salt Formation (LSF) of the Lower Devonian age occupies a large area in Alberta (Canada). It has been used for brine production, disposal, and storage purposes since the 1950s. Its petrological and geochemical features remain poorly understood up to now. Previous studies showed that these salt rocks are large crystalline and distinguishable by a very low bromine content (2–5 ppm). Our studies reveal that the main impurity is dolomite with an addition of haematite. It showed, also, a lack of sulphate minerals (anhydrite). Manganite also occurs within the halite crystals. Microthermometric measurements of primary fluid inclusions in halite show a large range of homogenization temperatures from 32.4 °C to 357.0 °C with the highest temperature in the upper part of the salt profile. Geochemical analysis confirms the low bromine contents, which is between 0.67–12.74 ppm. Potassium contents (166–3651 ppm) seem to be in the normal range for salt rocks, but magnesium content (25–177 ppm) is much lower than potassium. Rubidium is, as well, within the normal range, with values between <0.01 ppm and 3.13 ppm, while caesium contents (5.07–211.22 ppm) are almost sixty times higher in comparison to those of rubidium. The high concentration of Cs, Mn, Rb, and the high homogenization temperatures of the host minerals suggest that the LSF underwent extensive ion exchange related to hydrothermal inflow. These hydrothermal solutions originated from the basement of the LSF.
1. Introduction
Salt formations have been used for storage power sources (liquid hydrocarbons, gases, compressed air, and recently hydrogen) as well as disposal of industrial and nuclear waste for many decades. Their application is possible due to the properties of salt rock such as: low permeability, specific mechanical properties, high solubility in water, and a rather common occurrence [1,2]. A proper and safe use of salt deposits for storage and disposal of waste material requires detailed geological investigations. The design of a disposal or waste caverns is a very complicated technological process, which covers issues related to geological and mining conditions, modelling, and geomechanical testing, leaching problems etc. [3,4,5]. Mechanical properties of the salt rocks and leaching problems are directly connected to the petrological characteristics of the salts. It is generally accepted that the strength of salt rocks increases with the content of impurities [6,7,8], but as petrological studies have shown, the spatial distribution of impurities is also of great importance [9]. The type of impurities and their distribution also play an important role in leaching processes, primarily affecting the shape of the cavern [4].
Diagenetic processes and tectonic events can strongly influence the petrological and geochemical features of the salt and subsequent cavern formation [1,10,11,12,13]. In recent years, many studies on the petrology and fluid inclusions of the Upper Permian Zechstein Salt Formation in Poland have indicated that hydrothermal fluids influenced the formation of both salt domes [14,15,16,17] and bedded deposit [9,18].
Geochemical investigation of the salt formation provides very useful indicators of the origin of solutions from which evaporate minerals precipitated, as well as post-sedimentary transformations of salt rocks. Geochemical studies of salt-bearing formations began from the beginning of the 20th century. Particular attention was paid to the content of bromine, which was considered a very useful trace element for determining the origin of the brines, sedimentation conditions, nature of sedimentation basins, etc. [19,20,21,22,23,24,25,26,27,28,29,30]. The usefulness of bromine is mainly due to its geochemical properties, i.e., constant concentration in sea water, lack of its own minerals during evaporation and substitution of chlorine in chloride minerals. The content of Br in seawater is about 65 ppm and it reaches about 510 ppm at the moment when the seawater evaporation becomes saturated with respect to halite [24,25,27]. Therefore, using the bromine distribution coefficient, the first halite crystals should have 65–75 ppm Br [24,27]. Dissolution and recrystallization of primary salt rocks causes significant depletion of Br in the halite [24]. Therefore, based on bromine contents, it is possible to distinguish between primary and secondary salts.
Other elements, such as strontium, rubidium, and caesium also play an important role in evaporates characteristics. Strontium, due to its chemical similarity to calcium, can substitute calcium in sulfates and carbonates [24,25,31]. In salt rocks, strontium content is mainly related to the presence of anhydrite, and, to a lesser extent, calcite and dolomite. Rubidium and caesium have important influence in K-Mg salt deposits due to their possible substitution for K [24,25].
The Lotsberg Salt Formation (LSF) in central Alberta has been used for disposal and storage purposes since the 1950s [32,33,34,35]. Despite of this long term use, its petrological and geochemical features are poorly studied, mainly due to the great depths and geological data from borehole only. The first petrological outlines of the LSF were performed in the mid-twentieth century [36,37,38,39]. These works revealed that the salt rocks mainly consist of large crystalline, clear halite. In recent years, based on detailed petrological investigations, 3 types of the salts were distinguished and a lack of primary sedimentary structures was noticed [35]. The geochemical studies of LSF were limited only to the bromine content [20,26,36], which is extremely low (2–5 ppm), and two genetic models of salt formation were proposed by Holser et al. [26].
In this paper, we completed previous petrological studies [36,37,38,39,40,41] of the LSF by integrating them with results of our Raman microspectroscopic and fluid inclusion analyses. Apart from bromine, geochemical tests covered other elements such as Ba, Ca, Cs, K, Li, Mg, Mn, Rb that are useful in analyses of salt rocks. Overall, the aim of this study was to determine the origin of the LSF and its post-sedimentary transformations.
2. Geological Settings
The LSF is one of the three salt-bearing formations occurring in Alberta in the Western Canada Sedimentary Basin (WCSB) (Figure 1). The WCSB from the west is bounded by the Cordilleran Region, from the north by the Beaufort Sea, and from northeast to the east is bounded by the Canadian Shields [38]. It is composed of a largely undisturbed succession of Phanerozoic sedimentary rocks overlying the Precambrian basement [38,39,40,41], which comprises poorly known crystalline rocks. A small number of wells reaching Precambrian basement exist. In the Fort McMurray region, one of us (Kukialka) observed granite in the Precambrian basement.
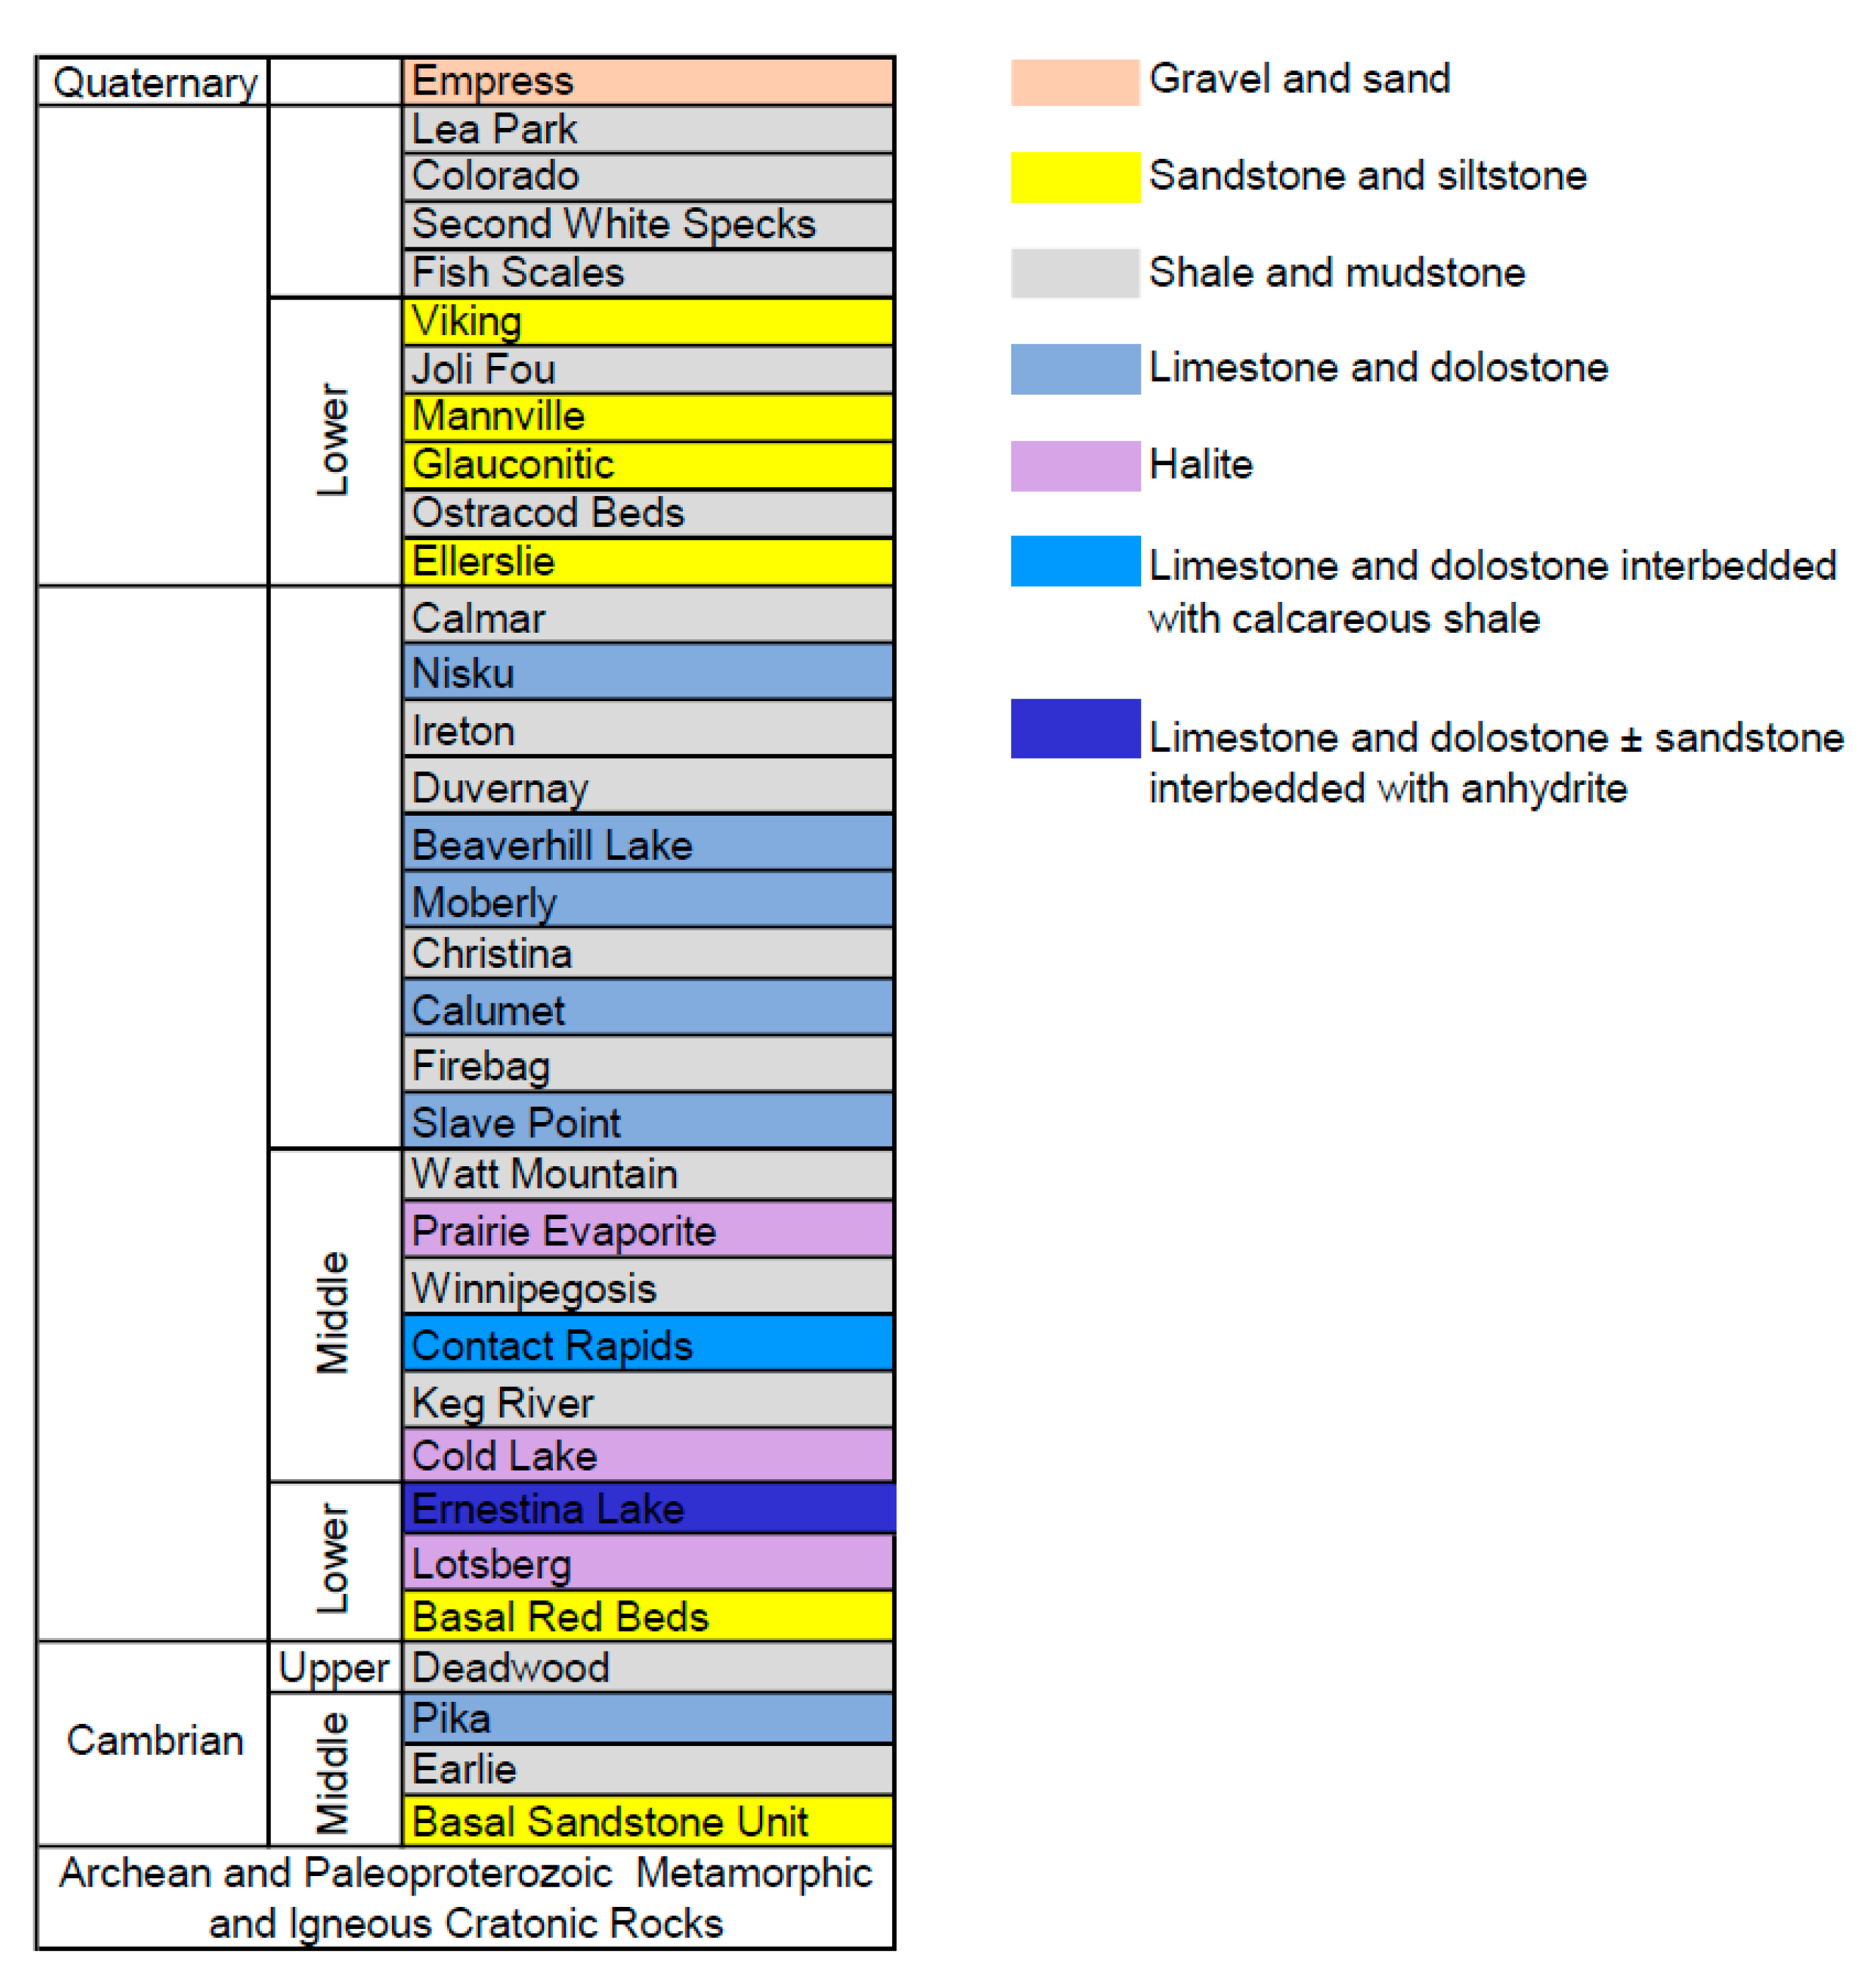
The WCSB has a form of an elongate monocline and it is a natural extension towards the north of the Great Plains sediments [38]. The sedimentary succession generally is divided into two parts, (1) from Paleozoic to mid-Jurassic, which is dominated by carbonates, and (2) from mid-Jurassic to Paleocene, where clastic rock dominates. In the Edmonton region mid-Jurassic formations are absent (Figure 2). These sediments are almost entirely covered with a thin coat of Quaternary glacial formations. The maximum thickness of the formations attains more than 6000 m in the southwestern part of the basin. The internal structure and sediment distribution of the platform succession were predominately determined by epeirogenic movements on several intracratonic arches [40].
The LSF together with Cold Lake and Prairie Evaporite is part of the strata of Middle Devonian age, which is called the Elk Point Group that directly overlays the Precambrian basement covered by thin Cambrian sediments. In Alberta, the Elk Point Group is divided into two subgroups Lower and Upper Elk Point [40] (Figure 2). The Lower Elk Point, in Central Alberta, consists of red and green sandstone interbedded with dolomitic and calcareous shale that do not have an official name, and are called “Basal Red Beds”, LSF, Ernestina Lake Fm, Cold Lake Salt Fm, and Contact Rapids Fm. The Upper Elk Point is composed of Winnipegosis Fm, Prairie Evaporite Salt Fm, Dawson bay Fm, and Watt Mountain [42].
The range of occurrence of individual salt formations in Alberta is shown in Figure 1. As shown, the range of the LSF is generally limited to central Alberta and only east of Saskatchewan.
The LSF is divided into two parts: the Lower and the Upper Lotsberg [37,38,40]. The Lower Lotsberg is composed of clear, translucent, very coarsely crystalline halite, which contains variable amounts of red dolomitic fragments between the halite crystals. Red shale is also present in the form of discontinuous interbeds. In the Edmonton area, there are observed two major interbeds (Kukialka personal information); the upper interbed separates the Lower and the Upper Lotsberg. The Upper Lotsberg consists of clear, translucent, and very coarse halite. Some crystals are up to a dozen centimeters (Kukialka personal information).
3. Materials and Methods
Petrological and geochemical analyses were performed at AGH University of Science and Technology in Kraków (Poland). Investigated samples were obtained from two boreholes: Pembina 22A (UWI 100/07-12-056-22-W4/0) and Pembina 21A (UWI 100/02-12-056-22-W4/1). Microscopic observations were conducted on double polished sections about 1–3 mm thick. They were obtained by cutting salt samples with a sharp blade parallel to the halite cleavage planes. The microscopic observations were carried out on Motic BA310Pol polarizing microscope equipped with 4×, 10×, 40×, 60× objectives and Motic SMZ168 Stereo Zoom microscope. As an additional UV source, an outside diode lamp (365 nm) was used.
Raman spectroscopy was used for identification of solid inclusions (impurities) within the halite crystals as well as gases and daughter minerals within fluid inclusions. Raman spectra were obtained using Thermo Scientific™ DXR™ with a 532 nm Nd-YAG laser passed through a confocal microscope Olympus, BX51 equipped with 100×, 50× and 10× objectives. The laser power was set at 5 mW for solid inclusions. The scattered light was collected by backscattered geometry with a 25 μm pinhole and a holographic notch filter, and finally dispersed using a 900 lines/mm grating and analysed by a cooled CCD detector of 256 × 1024 pixels. Spatial resolution was about 1 μm and wave number resolution about 1 cm−1. The acquisition time was 30 s. The Raman system was calibrated against the 520.4 cm−1 line of a Si-wafer.
Microthermometric measurements were carried on selected samples from borehole 22A. The measurements were carried out with Linkam THMSG600 Geology Heating and Freezing Stage mounted on NIKON ECLIPSE E600 microscope, using 20×, 50×, and 100× objectives. Stage was calibrated using pure CO2 synthetic inclusions (Tm = −56.6 °C) and known homogenization temperature of pure H2O inclusions. Heating-freezing rate 5 °C/min was applied with an accuracy of 0.1 °C. Individual halite specimens were measured only once in the case of heating over 150 °C in order to avoid the effect of inclusion stretching outside the observation field of the microscope, where inclusion cannot be directly observed. Cycling was attempted in all homogenization runs, in order to observe the proper homogenization temperatures [43]. Attention was paid to changes of inclusion shapes [44]. In the case of noticeable changes, the measurements were interrupted. In the case of one-phase (liquid) inclusions, the cryometric method, proposed by Roberts and Spencer [45] was applied at room temperature.
XRD analyses were carried out using Rigaku SmartLab 9.0 diffractometer with working parameters: reflective graphite monochromator, radiation CuKα, tube voltage 45 kV, tube current 200 mA, step 0.05°2Θ, count time per step 1 s. Spacing obtained from the X-ray diffraction (interface distances) was used to identify the mineral phases included in the test samples, based on the data stored in the database ICDD (International Centre for Diffraction Data) and software XRAYAN.
Geochemical analyses were performed on 80 samples from Pembina 21A (59 samples) and Pembina 22A (21 samples). In the cases of carbonate interbeds, only halite crystals were taken for the chemical analyses and the rest of the samples were used for petrological testing. At the first stage, all samples were broken and dried in a dryer at 110 °C for several hours. Next, they were weighed on an analytical balance with accuracy ±0.01 g. Then, each sample was dissolved in distillate water and filtered in the vacuum pump using 0.45 µm nylon membrane filter. The filtrate was collected and replenished to 500 mL. Each element content in solution was established by the ICP-MS method. The study was performed on a spectrometer ELAN 6100 Perkin Elmer.
4. Results
4.1. Petrography of Lotsberg Salt Rocks
Previous observations [36,37,38] indicated that the salts mainly consisted of clear, large crystalline halite, commonly reddish, and contained variable amounts of red concentration dispersed through the halite crystals. Recent studies [35] distinguish three types of salts in the whole formation profile i.e., (1) light brown, large crystalline salts (Figure 3A), (2) colourless, large halite crystals (Figure 3B), (3) brown and reddish large crystalline salts (Figure 3C). The first and second types prevail in the upper part of salt profile (1225 m a.s.l. (above sea level)) and the third in lower part of salt profile.
The first type of salts prevails throughout the whole profile. The halite crystal size varies from about 3 to over 20 cm. They have subhedral or euhedral shape (Figure 3A). They are mostly pure and transparent. On the halite boundary, as well as rarely within halite crystals, small (up to a few millimetres) concentrations of red-brown impurities occur. The second type is composed of clean and transparent halite crystals (Figure 3B). Their size varies from few to over a dozen centimetres (up to 1 m or so). In addition, impurities are developed similarly to the first type of salt, though they rarely occur.
The third type occurs the least often in the Lotsberg salts. These salts contain much more impurities than the first type (Figure 3C). This type of salts is also large crystalline but halite crystals appear smaller than in the first type. Their shape is most often subhedral or anhedral. The impurities are irregularly distributed within the rock, and they occur mainly on the boundary of halite crystals. They are brown but sometimes grey conglomerations of clay minerals are also visible. Within the halite crystals, inclusions of brown conglomerations of carbonates can reach up to a few millimetres.
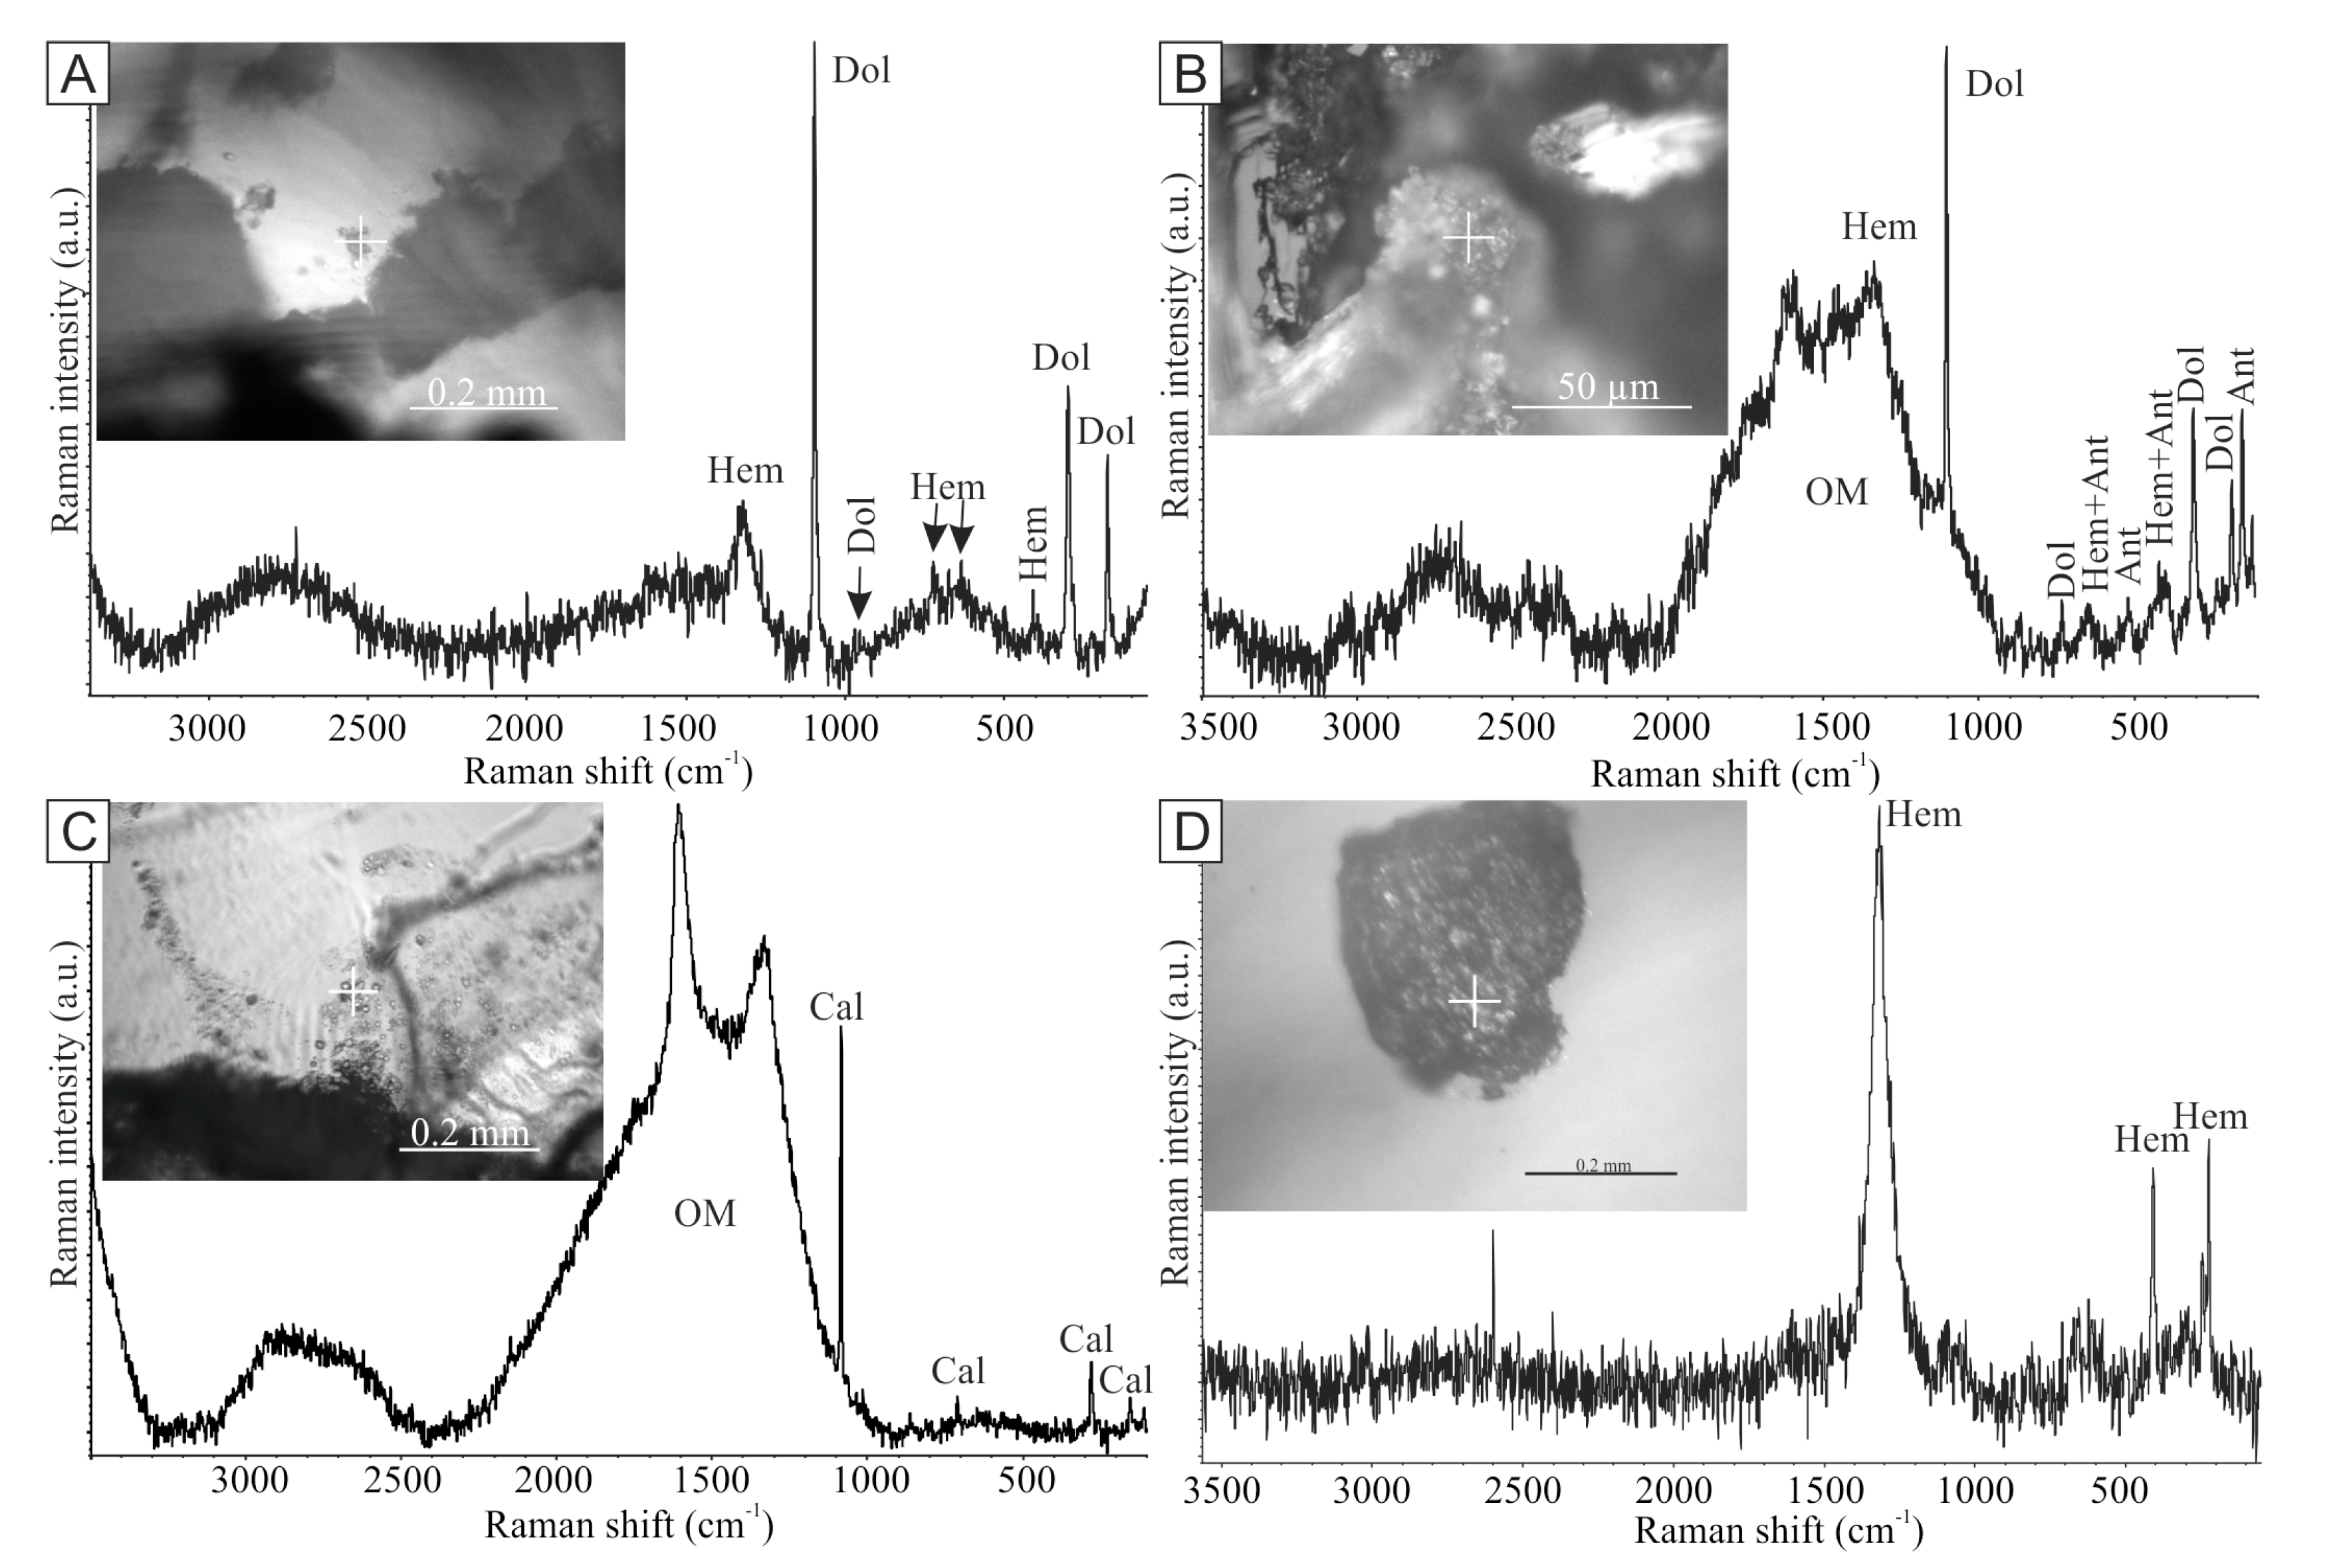
In all three salt rock types, brown impurities on the boundaries of halite crystals, as well as ingrowths in halite, are mostly composed of fine grained dolomite, determined by active Raman bands at 1097 (main band), 299, 725, 1443 cm−1 (Table 1, Figure 4A). Dolomite is often accompanied by haematite with the Raman bands at 223, 290, 409, 609, 1313 cm−1 (Table 1, Figure 4A). In some places, within impurities, small amount of organic matter occurs (Figure 4B), which shows wide area at 1000–1800 cm−1 of Raman scattering [46,47,48,49,50]. Within the organic matter, there are small amounts of anatase, detected by Raman spectroscopy (bands at 143, 396, 515, 638 cm−1) (Table 1, Figure 4B). Rare impurities detected by Raman spectroscopy at 156, 284, 711, 1085, 1435 cm−1 are composed of calcite or individual euhedral calcite crystals, occurring in the vicinity of impurity accumulation (Table 1, Figure 4C). Occasionally, clean and large hematite accumulations are also present (Table 1, Figure 4D).
Microscopic observations reveal that in all salt rock types halite crystals show similar features. Mostly, they are very clean and transparent. In most of the samples, birefringence of the halite crystals is observed, which is a very unusual phenomenon. Its intensity varies from light, slightly visible, blurred areas to strongly visible set of belts spreading at an angle of 45 in relation to the crystal axes, which disappear four times during microscopic stage rotation (Figure 5A). In some halite crystals, the birefringence is very strong and appears as two sets of belts intersecting at right angles (Figure 5B).
Fluid inclusion assemblages (FIAs) are relatively rare in the halite crystals. Two main types of FIA can be distinguished depending on their relationships to crystallographic axes and mode of occurrence i.e., primary and secondary (pseudosecondary) [43,51,52]. Secondary type FIAs prevails in the samples. This type of FIAs is composed of various kind of inclusions in respect of their size and shape as well as a liquid to gas phase ratio. They vary from small (from a few to dozen micrometers), cubic inclusions (Figure 5C) to large (over 200 µm), flattened, irregular inclusions (Figure 5D). FIAs made of small inclusions are often short and disappear in halite crystals. FIAs made of larger inclusions are longer and include almost whole halite crystals. Birefringent minerals sometimes occur within the large and irregular inclusions (Figure 5E,F). During heating, these minerals melt in a temperature range from 130.5 to 174.1 °C. This process is not fully reversible, i.e., during cooling two types of minerals appear, one with weaker birefringence and a second one anisotropic and cubic. Such behavior indicated that primary mineral was carnallite and during cooling crystallize bischofite and sylvite [15].
Primary FIAs are very rare. They form small areas of densely packed inclusions which diameter range from ~1 µm to ~10 µm (Figure 5G). These inclusions are filled only with liquid. Similarly distributed FIAs also occur, but they are composed of much larger inclusions reaching up to 100 µm (Figure 5H,I). Such spatial distribution enables their consideration as a primary FIA [43,51,52]. Contrarily to the FIAs made of small inclusions, inclusions in these FIAs are two phases, i.e., liquid–vapour (LG) (Figure 5H) or liquid–solid (LS) (Figure 5I). The ratio of liquid to gas or solid is constant (~5% and ~20% respectively).

Table 1.
Minerals in the Lotsberg Salt Formation (LSF) with diagnostic Raman bands.
| Mineral | Raman Bands (cm−1) | References |
|---|---|---|
| Anatase | 143, 396, 515, 638 | [53,54] |
| Anhydrite | 417, 500, 611, 629, 676 1018, 1130, 1160 | [54,55] |
| Calcite | 156, 284, 711, 1085, 1435 | [54,55] |
| Dolomite | 176, 299, 725, 1097, 1443 | [54] |
| Hematite | 223, 290, 409, 609, 1313, | [54] |
| Manganite | 358, 388, 528, 555, 620, 651 | [56] |
Large isolated inclusions are also present in halite crystals (Figure 6). These inclusions can be considered as a primary according to their arrangement in halite crystals. Their size varies from 100 to 600 µm and their shape is cubic or rectangular. These inclusions are two phases: LG, LS, or three phases: liquid-vapour-solid (LGS). Raman spectroscopy reveals three types of daughter or pseudo-daughter minerals, i.e., dolomite, anhydrite and manganite. Dolomite and anhydrite often co-occur in inclusions (Figure 6A). Dolomite forms small crystals, whereas the anhydrite occurs as large euhedral crystals (Figure 6A). The manganite indicated by active Raman bands at 145, 259, 358, 388, 528, 555, 620, 651 cm−1 was found only in the samples from the upper part of the salt member. It occurs in the form of densely packed, interspersed needles, occupying almost a whole inclusion and often ingrowing into ambient halite crystals (Figure 6B). In some places, anhydrite crystals occur between manganite needles (Figure 6C). As detected by the Raman spectroscopy, some inclusions (mainly filled with dolomite) also contain single manganite crystals with trace amounts of anhydrite (Figure 6D). Moreover, manganite is not only strictly connected with FIAs but also occurs in the form of concentration of very thin (~1 µm) and long (up to 1 mm), slightly bent and tangled needles (Figure 7A), shorter needles growing from one point (Figure 7B), separated needles (Figure 7C) or short and thick bars (Figure 7D).
The larger LG inclusions have mostly constant (~10% volume) liquid to gas ratio (Figure 7E) but some inclusions with larger vapour bubble also occur (Figure 7F). Both of them, in most cases, have rough walls and they are slightly elongated. From time to time, cracks are also visible, often marked by very tiny fluid inclusions (Figure 7F).
Microthermometric measurements carried out for primary inclusions in upper part of LSF show very wide homogenization temperature (Th) range. The Th varies from 32.4 °C to 357.0 °C but most is below 100 °C (Figure 8A). In this low range, the frequency varies from 9 to 15 and does not show any special kind of distribution. Above 100 °C, frequencies are in range from 1 to 3. These high Th values were noted in the uppermost part of the LSF profile, whereas the lower Th values occur in lower part of the profile. Therefore, the Th mean values in samples show an increase from bottom to the uppermost part of the profile (Figure 8B). The variability of Th values is smaller in the lower part of the profile than in upper part.
4.2. Petrology of Carbonates Intercalations in the LSF
The carbonate intercalations are represented by red-brownish to grey rocks. In those rocks single, euhedral or subhedral halite crystals (size up to 2 cm) occur (Figure 9A). The distribution and contents of halite crystals in the rocks are very diversified. The carbonates rocks very often are brecciated. They are composed of grey, light brown or dark brown small fragments cemented by red-brownish mass of carbonates (Figure 9B). Their shape is irregular, angular, in some cases strongly elongated or oval. Their size varies from millimetres scale to few centimetres scale. Sometimes they are cut by the vein of red fibrous halite (Figure 9C). Their course is often vertical, and its width is about 1 cm.
In the samples, X-ray diffraction reveals diversified presence of main minerals. In some samples dolomite prevails accompanied by smaller amount of halite and quartz (Figure 9D). Most of the samples are composed of a mixture of dolomite, ferroan dolomite, calcite, halite and quartz in varying proportions (Figure 9E). The clinochlore, microcline, and illite occur in all samples, but as accessory minerals.
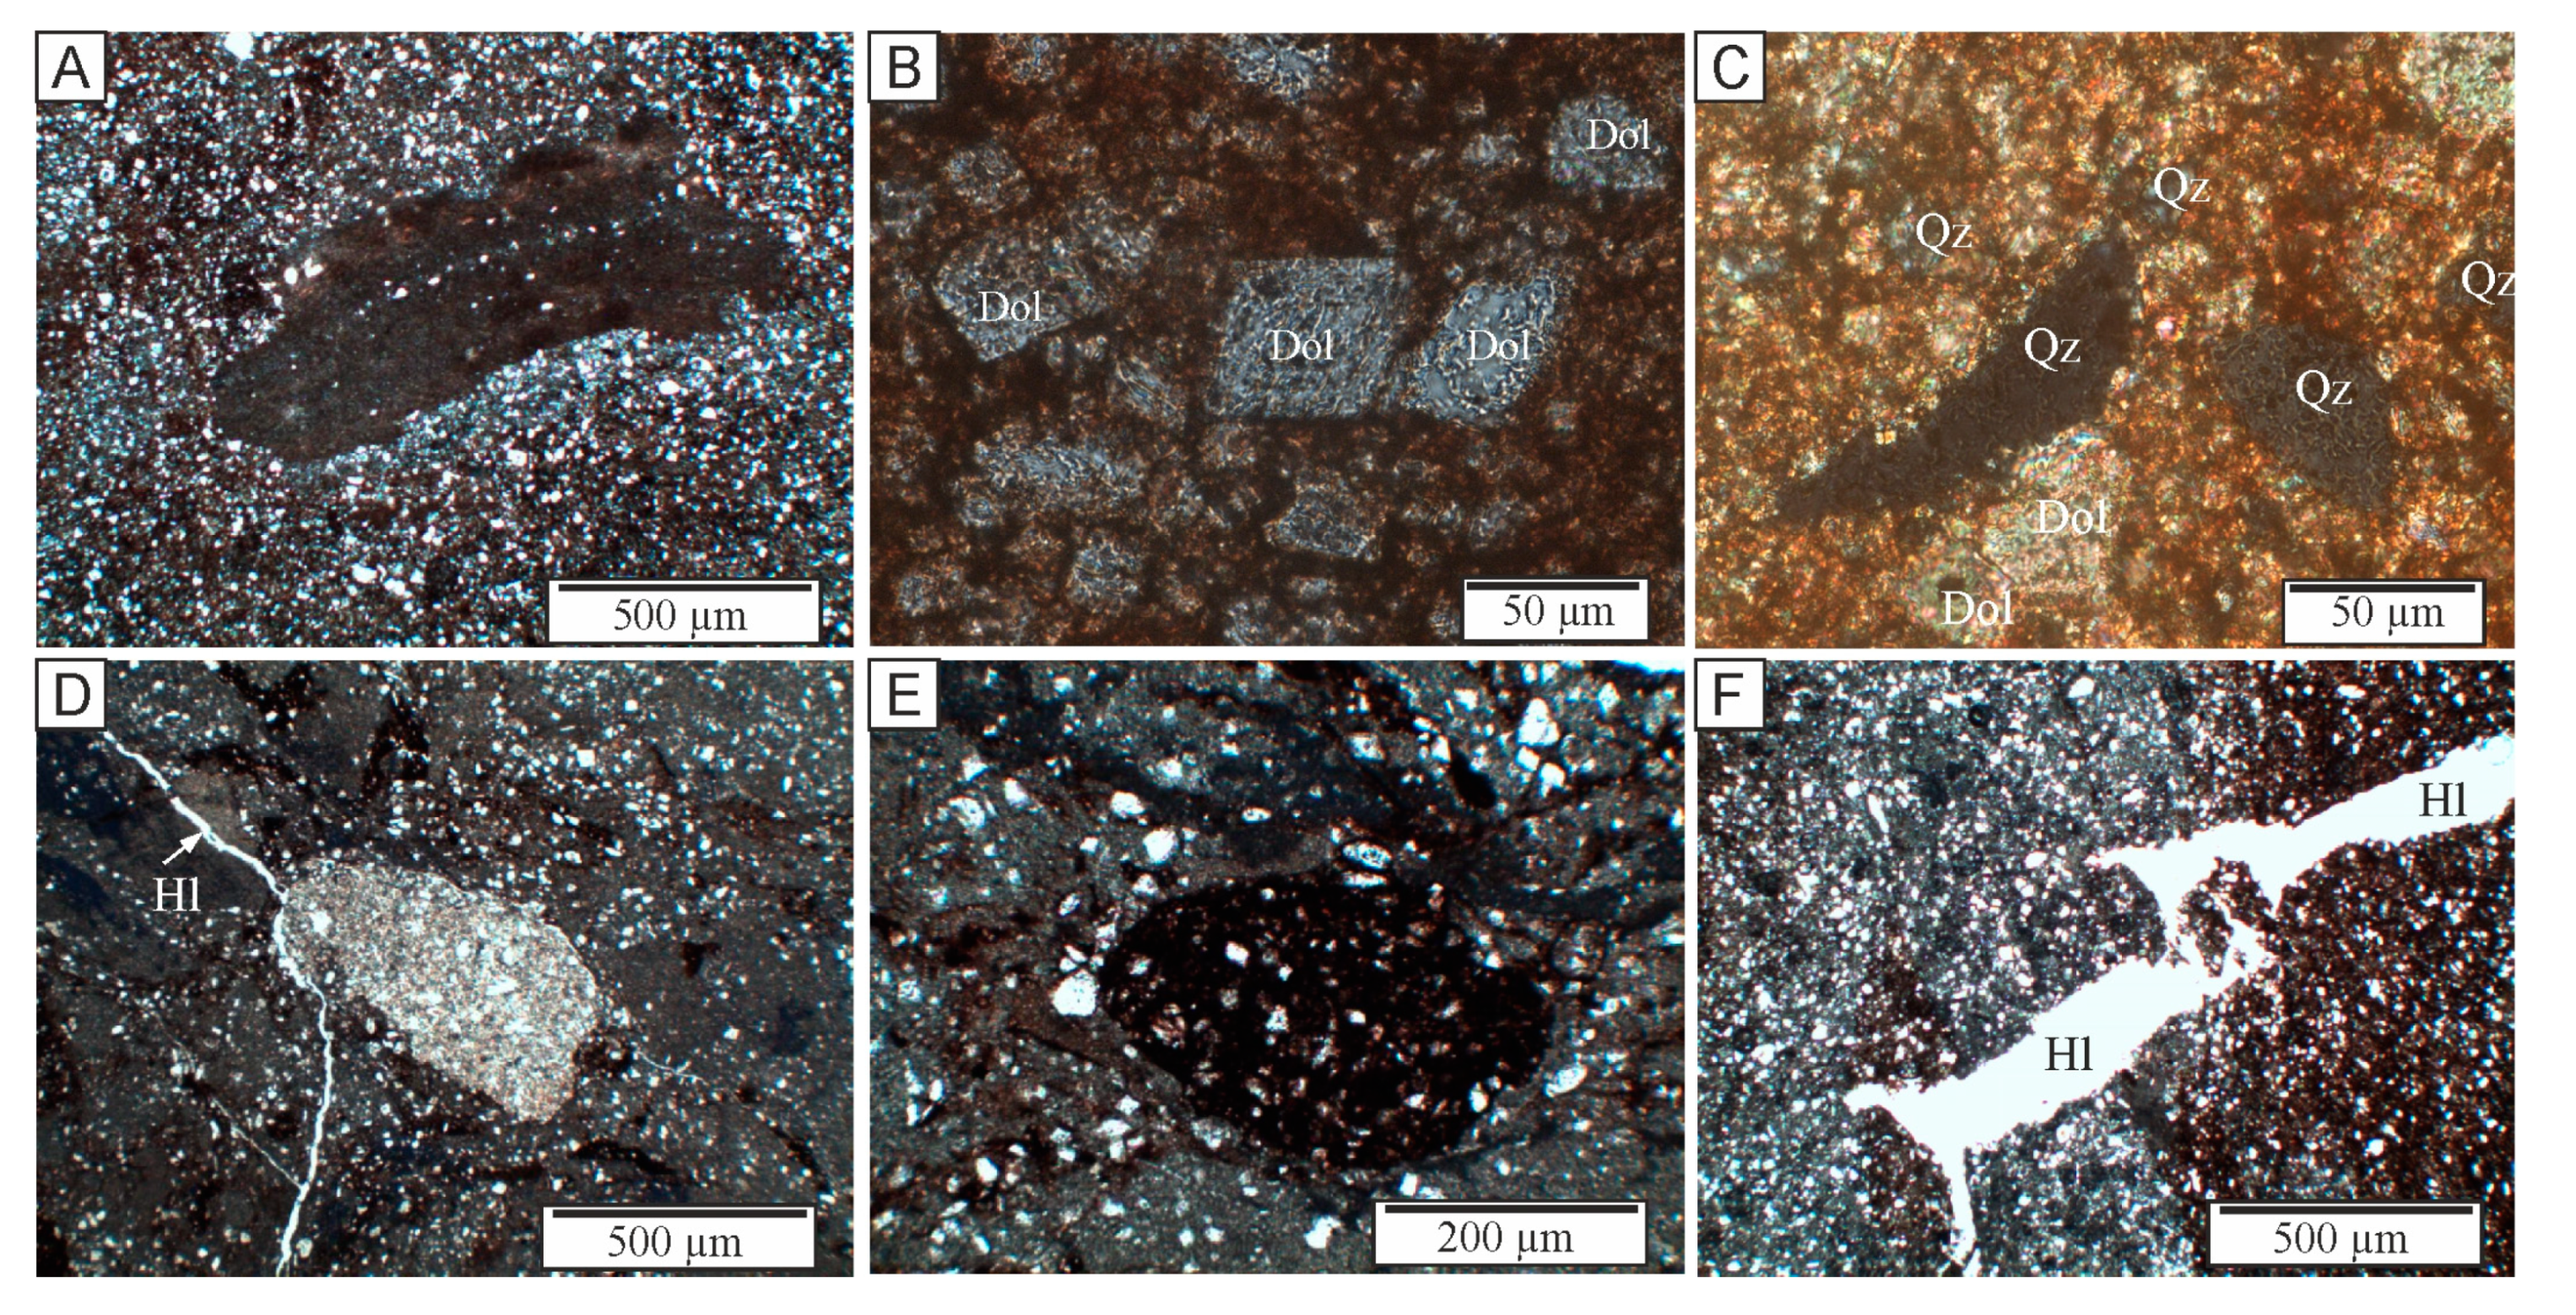
Microscopically, the intercalations are composed of the very fine grained and semi-translucent, red-brownish or greyish background within which are distributed larger crystals of dolomite and rarely quartz as well as fragments (Figure 10A). The size of dolomite crystals in the background is up to 50 µm and their shape is subhedral or anhedral. Less common larger dolomite crystals show euhedral, rhombohedral habit (Figure 10B) in some cases with slightly corroded borders. Quartz crystals are predominantly smaller and they are rarer than dolomite. Larger quartz crystals (up to 100 µm) were found only in a few places (Figure 10C). The fragments stand out from the background in colour and fabric. Usually, they are built as a uniform mass without larger dolomite crystals and sometimes with very slightly visible laminated fabric (Figure 10A). Usually, these fragments show irregular shapes with rounded edges. Rarely rounded, lighter (Figure 10D), or darker (Figure 10E) than background fragments occur, which contain larger dolomite crystals similarly developed as in the background. Moreover, visible thin veins filled by halite appear very often within the samples (Figure 10D,F). Their width is mostly in the range of a few microns and only occasionally reach up to 100 µm.
4.3. Geochemistry of the Lotsberg Salt Rocks
The profile of the LSF containing parts insoluble in water (PIW) in halite samples shows a diversified distribution (Figure 12). In the lowest part of profile (below −1228 m a.s.l.) samples show high variability from 0.2 to 18.34 wt% with the highest PIW contents in the lowest part of profile. Above depth −1228 m a.s.l. up to the −1199 m a.s.l., contents of PIW is more stable and mostly varies in the range from <0.01 to <1 wt%. Above −1999 m a.s.l. to the about −1192 m a.s.l. the PIW contents show high variation in the range <0.01 to 3.62 wt%. Again, low variation in the range <0.01 to <1 wt% of PIW contents is observed in the highest part of salt formation (Figure 12).
Bromine contents in Lotsberg salts is extremely low (Figure 12, Table 2). In the lowest part of profile (depth from −1250 to −1246 m a.s.l.) Br contents increases gradually from 2.2 to 4.5 ppm. Then it decreases to ~2 ppm and remains at this level up to about −1205 m a.s.l., with the exception of one spike (max 9.5 ppm) at depth from −1231.3 to −1228.8 m (Figure 12). Above depth −1205 m a.s.l. up to the top of salt formation, Br contents increases from ~1.0 to 12.7 ppm and show higher variability than in the lower part (Figure 12). The Cl/Br ratio varies from 4.75 to 90.44 (Table 2). In general, this ratio shows a slight increase in the lower part of salt profile up to its maximum value, which coincides with the point from which the bromine contents begins to increase and then gradually decreases to the top of salt formation (Figure 12).
Potassium and rubidium also show a bi-modal distribution (Figure 13). Potassium contents in Lotsberg salt rocks is within 166–3651 ppm (Table 2). In the lowest part of the profile (−1250 to −1247 m a.s.l.) it shows a decrease from 900 to 300 ppm and then its contents vary from ~220 to 330 ppm up to depth −1227 m a.s.l. Above the depth −1226 m a.s.l., there is an increase in the potassium content and high variability is observed (Figure 13). The uppermost part of the salt profile (from depth about -1210 m. a.s.l. to the top) shows a gradual decrease in potassium contents with high variability. Rubidium in salt rocks occurs in low quantity and varies from below detection (<0.01 ppm) up to 3.13 ppm (Table 2). It shows low contents (<0.01 ppm) and low variability in the lower part of profile (Figure 13). Above the depth about −1211 m a.s.l. contents of Rb sharply increases to ~2.3 ppm and to the top of salt profile in the range 1.3–3.1 ppm.
Magnesium contents in the Lotsberg salt rocks is almost one order of magnitude lower than potassium and vary in the range 25–177 ppm (Table 2). Similarly, to the potassium, magnesium shows bi-modal distribution in the salt profile (Figure 13). After increase in the lowest part of profile from 47 to 100 ppm, magnesium contents decrease to 27 ppm at depth −1242 m a.s.l. and then up to the depth −1221 m a.s.l. is in the range 26–50 ppm. Only in the depth range −1233 to −1228 m a.s.l., the magnesium contents reach up to 86 ppm (Figure 13). In the upper part of profile (from −1221 m a.s.l. to the top) magnesium contents increases up to 154 ppm and then show a large variation (Figure 13).
Calcium distribution has also bi-modal character. Its contents is generally below 500 ppm in the lower part of the salt profile and shows a low variation (Figure 14). In a depth range −1214 to −1197 m a.s.l. calcium contents increase, and is above 1000 ppm, reaching up to 2525 ppm. Above this depth up to the top of salt profile the calcium contents decrease, and is approximately in range 400–900 ppm, reaching up 1400 ppm in the uppermost part (Figure 14). Strontium contents shows fluctuated pattern. In the lower part of the profile (from the bottom to the depth −1216 m a.s.l.) its contents is generally in the range ~2–13 ppm and shows low variability. Two distinct peaks are visible at the depth −1248 m a.s.l. (38.4 ppm) and −1225 m a.s.l. (42.9 ppm). In the upper part of profile, strontium shows greater variability (in the range 1.4–23.0 ppm) than in lower part of the profile.
Caesium contents is almost sixty times higher than rubidium (Table 2) and its distribution in the salt profile is not so strictly bi-modal as potassium and rubidium (Figure 14). In the lower part (below −1227 m a.s.l), caesium shows small variations with two distinct peaks at about −1242 m a.s.l. and from −1229 to 1233 m a.s.l. (Figure 14). Above −1227 m a.s.l. up to the top of salt profile. The variation becomes higher.
Lithium contents vary from 0.04 to 0.58 ppm with an average of 0.18 (Table 2). In the lower part of the salt profile (from the bottom up to −1221 m a.s.l.) lithium contents is in the range 0.04–0.18 ppm (Figure 15). Above −1221 m a.s.l lithium contents increase up to 58 ppm and then show high variability. In the uppermost part of the profile, a rapid increase is visible again.
5. Discussion
5.1. Geological Position and Petrological Features
The LSF is widely distributed within the center of WCSB and it is sub-horizontally or locally horizontally spread in the east part of central Alberta. Despite such position, which suggests the typical deposition of the saline sediments, the petrological and geochemical characteristics of the salt rocks indicate their non-typical development. In the typical salt formations of marine origin, the anhydrite or gypsum layers commonly precede the salt rocks [10,11,12,57]. According to Borchert and Muir [10], in the theoretical evaporation of seawater, the average thickness of sulphates is about 3.6% of the total evaporates profile. In most worldwide evaporate formations, sulphates are more abundant than it should imply from the theoretical results [10,57].
The LSF is underlain directly by terrigenous rocks (Basal Red Beds). In its uppermost part, brick-red and green calcareous silty shale occur [36,38]. According to Wardlaw and Watson [36], only small amounts of anhydrite occur in these sediments. Taking into account Borchert and Muir’s [10] consideration of seawater evaporation, one should expect about 3m of anhydrite layer below the Lotsberg salts.
Within the salt rocks, anhydrite is very rare and mainly associated with fluid inclusions. Therefore, anhydrite may partly precipitate from secondary solutions during the recrystallization of halite. On the contrary to most world salt formation, Lotsberg salt rocks are enriched in carbonates with a large amount of iron oxides. Their large amount indicates that they had to be transported from the adjacent areas to the sedimentary basin by solutions. In the sedimentary basin, some crystals of dolomite or calcite recrystallized.
Halite belongs to the cubic system, and under microscopic observation in standard conditions do not show optical anisotropy. Nevertheless, birefringence in halite was observed in some salt formations. This very rare phenomenon was observed in the natural environment mainly in so-called “blue halite” [16,58,59,60]. It is worth noting that birefringence concerns not only blue coloured but also colourless crystals co-occurring with blue halite [60]. Moreover, the study of fluid inclusions in anhydrite crystals leaching from blue halite veins indicate a high-temperature origin of those sediments [16]. In the analysed Lotsberg salts, the birefringence is a common phenomenon especially intensive in the upper most part of the salt member. According to Shlichta [61], and Carter and Hansen [62], the birefringence could be considered as a result of high-stress and mechanical deformations of halite beds. Despite of the horizontal position of Lotsberg salts and not observed macroscopically deformation, high stress influence should be considered. During boreholes drilling, squeezing of the salts was noticed, that indicates salt’s creeping.
Manganese oxides crystallize in various environments [63]. Manganese minerals are often associated with iron oxides or carbonates deposits [63,64,65,66,67]. The most known and widely discussed are occurrences of marine manganese minerals in the form of nodules, crust or coatings on detritus and biogenic debris [63,68,69,70,71]. They are mostly associated with low-temperature hydrothermal environment [69,70,71].
In evaporates, manganese minerals are very rare and they are always trace minerals. In salts from the Palo Duro basin in Texas, Roedder [72] found manganese oxide phases (cryptomelane) closely related to fluid inclusions. Though their origin is questionable, the author suggested they may well be a primary precipitate, formed with the salt. Similarly, manganese minerals preserved within halite crystals were found as a deposit of hypersaline springs occurring on the eastern flanks of the Mount Sedom diapir [71].
In the Lotsberg salts, manganese minerals are represented by manganite which occurs only in the upper part of the profile. Similarly to cryptomelane in the Palo Duro Basin [72] manganite occurs in the form of needles. The manganite crystals are mainly associated with fluid inclusions, but their large amount and high variability, in relation to the volume of inclusions (Figure 6B,C), indicate that they are not real daughter minerals, and should be considered as a pseudo-daughter mineral [43,51,52].
The presence of manganite in halite may indicate that its origin is connected to relatively hot solution migration through the salt member as manganite is often considered a hydrothermal mineral [69,71]. Their petrographic relationships to the surrounding halite, e.g., ingrowing into the halite outside fluid inclusions, as well as its occurrence in halite crystals in form of concentration or separate needles without fluid inclusions, indicate that processes of halite recrystallization and fluid inclusions squeezing from the crystals took place during or after such migration.
The carbonate overgrowths positions in LSF are mostly recognized by geophysical methods and therefore its petrological features were not exactly known. Our study shows that these sediments are composed of carbonates and very often reveal a brecciated habit. In this context, they are similarly developed as brecciated anhydritic intercalation occurred in Zechstein layered salt deposit in Pre-Sudetic Monocline in Poland [73]. Such sediments in Zechstein salts resulted from sub-horizontal tectonic movements. In the case of the LSF, it is not excluded that small movements within the salt seam took place. The deep occurrence of LSF is conducive to the plasticization of salts and the creation of cracks. The cracks could have been a path of unsaturated solution migration that partly leached halite. These leaching processes provide accumulation of insoluble parts of water in forms of overgrowths in salt rocks bed. Therefore, it is probable that the carbonate overgrowths mark the main paths of solutions which altered the salt rocks. Such genesis of these sediments explains their petrological development in the form of breccia, and why they do not correlate to boreholes.
5.2. Microthermometric Measurements
Halite is susceptible to recrystallization and reaction with solutions contained in inclusions. These properties cause that fluid inclusions in halite are not suitable for being a good geothermometer [72]. High plasticity of halite crystals under the lithostatic pressure may cause shrinkage of the inclusions and disappearance of vapour bubble which has low pressure [72]. Such changes in the volume of inclusion significantly affect the measured Th [43,51,74]. In the Lotsberg salts, Th values are in a wide range from 32.4 to 357.0 °C. The highest values were obtained in the uppermost part of the salt seam (Figure 8). There are two possible explanations for this, i.e., hydrothermal influence and deeper burial than in present time, accompanied by stress-induced halite recrystallization. In the first case, the hydrothermal solution in some places percolate the salt formation and spread into its upper parts. The occurrence of such migration is in line with the theory of low bromine contents in the Lotsberg salts, presented by Wardlaw and Watson [36] and Holser et al. [26] and discussed below. The presence of manganite supports the migration of hydrothermal solutions because this mineral typically occurs in hydrothermal vein deposits [63,69].
The second scenario is probably connected with high pressure resulted from deeper burial than the current depth. As Roedder [72] noted, halite is very sensitive to pressure and fluid inclusions can be transformed, causing the vapour bubble to shrink and eventually disappear. Under high-pressure halite shows grain boundary migration [75,76,77] and in this way can recrystallize to form large crystals. The pressure also causes mineral contraction. The halite contraction is one of the highest in minerals due to its low strength and high compressibility [78,79,80]. The inclusions, sealed in this high temperature and pressure, have certain volume and their bulk molar volume dependents on temperature and pressure. During uplifting of the salt rocks, when the pressure and temperature decrease, the halite crystals relax and their volume increases. The same is true for the volume of inclusions. Therefore, the fluid bulk molar volume in inclusions increases and due to that fact the homogenization temperature increases [81,82]. During uplifting processes, such as cracking of crystals, etc., there is always possibility of unsealing of inclusions. This process can affect the molar volume by the escape of some fluid and therefore influence the microthermometric data.
The secondary types of FIA provide information on post-sedimentary events [43,51,52]. In the LSF, this type of inclusions often shows birefringent daughter minerals (Figure 5E,F) which under the microthermometric measurements behave like carnallite [15]. This indicates that fluids in such inclusions are enriched with respect to potassium and magnesium. Therefore it can be stated that solutions percolating through salt rocks have different chemical compositions. This very well supports geochemical aspects of LSF about the influence of deep background waters on salt rocks, which will be discussed below.
5.3. Geochemistry
In the LSF, Br contents is in the range 0.7–12.7 ppm. Similar values were obtained by a previous researcher [26,36]. Wardlaw and Watson [36] which, based on the calculation, suggest that such low Br values result from the dissolution of primary halite by freshwater and its re-precipitation. In the next paper [26] they consider two models which can lead to the very low Br contents, i.e., (1) continuous leaching by percolating freshwater through the primary salts and equilibration of the solution with remaining crystals and the new crystallization, and (2) leaching of the primary (marine) salts and the flow of the solution into a valley of the central Alberta Basin, and deposition of the salts as non-marine. In both cases, the bromide-rich residual fraction of the brine should be removed. Geochemical aspects of the Lotsberg salts in conjunction with fluid inclusion occurrence suggest that the first model seems to be the most probable way of alteration of these salt rocks. These processes would have occurred during the first period of the geological development of this region, as the overlying Prairie Evaporite Formation does not show such a transformation and has a normal bromine distribution [23,26].
Potassium and magnesium contents during evaporation of seawater gradually increase in solutions up to potash—magnesium facies [24,83]. In the halite crystal structure, incorporation of potassium is limited due to the larger ionic radius than sodium, and its distribution coefficient for halite is very low [24,83]. Therefore, Hite [84] connected its contents in halite with the solution in fluid inclusions. Despite this, potassium can serve as a good tool for genetic consideration of sedimentation [24,83]. The contents of potassium in halite succession is rarely analysed comprehensively. Research to date has shown that the potassium content varies in individual salt-bearing formations. In the Cretaceous Upper Khorat Series of Thailand, Hite [84] found a regular increase of potassium contents from 10 to 80 ppm. In Polish parts of Zechstein (Upper Permian) basin at the area of Żary Pericline, potassium contents are in the range 40–140 ppm, but in the surrounding area of the Fore-Sudetic Monocline the potassium contents are much higher with a range of 0.2–0.5 wg% [85]. In the Miocene (Badenian) salt in Poland, potassium is in the range 0.02–1.10 wg% and its higher concentration was associated with an admixture of clay minerals [86]. Potassium and magnesium contents in the salts usually very well correlate with each other and the magnesium contents is slightly lower than potassium [85,86]. In the Lotsberg salts, contents of potassium and magnesium are in a wide range. Potassium contents seem to be in the normal range for salt rocks, but magnesium is much lower [85,86]. This disproportion in both elements indicates that solutions from which crystallized or re-crystallized halite were not of marine origin and solutions were enriched in potassium. The origin of such solutions is probably connected with deep waters, whose chemical composition resulted from weathering of basement granites rich in K-feldspar, biotite, and other minerals containing potassium, e.g., [87]. This basement is poorly recognized in the Alberta area and some information may be obtained from Canadian shield research [88,89].
Other important trace element indicators for evaporate minerals are rubidium, caesium, and lithium. Rubidium and caesium substitute potassium and therefore they are mainly considered for potassium-magnesium facies while lithium concentrates regularly in the brines even through the potassium-magnesium facies [24,25,90]. They can be also used to determine the origin of brines. For the salt rocks there is no systematic research on all these elements and they are rarely considered because their substitution for Na+ ion is strongly limited [24,91]. In the LSF, caesium concentration is higher than rubidium while in marine waters their ratio is inverted [92,93]. Rubidium and caesium are not absorbed by evaporate minerals in carbonate and sulfate facies and therefore in brines originated from marine waters their ratio should be the same as in marine waters. The distribution coefficient for both elements in halite [91] indicate that rubidium should be incorporated in very small quantities in the halite crystal structure while caesium is not incorporated. Therefore, it is most probable that high concentrations of caesium and rubidium within the Lotsberg salts resulted from their occurrence in fluid inclusions and show difficulty to explain their inverted ratio. Origins of both elements should be considered as inflow of deep waters, which caused re-crystallization of halite bed and depletion of bromine. The waters, rich in rubidium, caesium and lithium, were likely connected with deep waters associated with the granitic basement of Alberta. This basement and shield underwent complex post-magmatic processes, which, up to hydrothermal stage, could strongly influence the covering sediments. All of these elements are often enriched in granitic pegmatites [94,95,96]. The weathering K-bearing minerals such as K-feldspar, biotite, and sericite could have released rubidium and caesium into the waters [87,97,98,99,100,101]. Therefore, the deep ground and hydrothermal waters in such environments enriched in rubidium, cesium, and lithium could have percolated into overlying sediments and caused re-crystallization of the halite bed.
Moreover, almost all analysed elements show distinct bi-modal distributions, i.e., sharp increase of their contents in upper part of the salt profile, which is generally associated with large concentration fluctuations. In the case of elements such as barium, strontium, and caesium, the increase is not visible, but their contents variations are very well visible. The geochemical data indicates that LSF is divided into two parts, i.e., upper and lower.
6. Conclusions
Petrological and geochemical investigation confirmed an earlier thesis considering an atypical LSF origin, and revealed that the LSF differs greatly from other salt formations. Distinguishing factors of this are:
- Lack of sulfate facies prior to precipitation of salt rocks as well as a lack of anhydrite accompanying halite. This suggests that halite crystallization took place from solutions significantly impoverished in sulfates.
- Lack of sedimentary structures such as lamination, the occurrence of striped salts, etc., which point to post-depositional transformations and disappearance of primary structures.
- Prevailing in the profile of salt rocks large crystalline halite with crystals exceeding several centimetres, which indicate recrystallization of halite.
- High concentration of rubidium and caesium, indicating deep background waters influence on the salt formations.
- Presence of fluid inclusions, which show high-temperature homogenization.
Taking into account these considerations, the LSF is concluded to be of non-marine origin and was strongly influenced by hydrothermal events. These hydrothermal waters were connected to a deep basement within, which probably extinction magmatic activity occurred. Our research confirmed Holser, Wardlaw, and Watson’s [26] thesis about the LSF origin as continuous leaching caused by percolating freshwater through the primary salts, and equilibration of the solution with remaining crystals and the new crystallization. In our opinion, these waters had high temperature and their flow caused halite dissolution. All other parts insoluble in water (carbonates, hematite) remained on site. Therefore, this process caused the formation of carbonate intercalations. Subsequently, cooling thus formed brines resulted in the precipitation of halite in the upper part of the profile. This explains bi-modal distribution of the trace elements and high homogenization temperature in uppermost part of the salt profile.
Author Contributions
Conceptualization, T.T. and P.K.; methodology, T.T.; validation, T.T., P.K.; formal analysis, T.T.; investigation, T.T. and P.K.; resources, T.T. and P.K.; data curation, T.T. and P.K.; writing—original draft preparation, T.T.; writing—review and editing, P.K.; visualization, T.T.; supervision, T.T.; project administration, T.T.; funding acquisition, P.K. All authors have read and agreed to the published version of the manuscript.
Funding
This research was funded by AGH University of Science and Technology (Krakow, Poland) as research project no. 16.16.140.315.
Acknowledgments
The authors would like to thank Pembina Pipeline Corporation for supporting research and permission to publish, and would also to thank new graduated geologist Simone Shelley for the time spent for language correction.
Conflicts of Interest
The authors declare no conflict of interest.
References
- Warren, J.K. Evaporites: Sediments, Resources and Hydrocarbons; Springer: Berlin/Heidelberg, Germany; New York, NY, USA, 2006; ISBN 3-540-26011-0. [Google Scholar]
- Lux, K.H. Design of salt caverns for the storage of natural gas, crude oil and compressed air: Geomechanical aspects of construction, operation and abandonment. In Underground Gas Storage: Worldwide Experiences and Future Development in the UK and Europe; Evans, D.J., Chadwick, R.A., Eds.; The Geological Society, London, Special Publications: London, UK, 2009; Volume 313, pp. 93–128. [Google Scholar]
- Cała, M.; Cyran, K.; Kowalski, M.; Wilkosz, P. Influence of the anhydrite interbeds on a stability of the storage caverns in the mechelinki salt deposit (Northern Poland). Arch. Min. Sci. 2018, 63, 1007–1025. [Google Scholar] [CrossRef]
- Cyran, K. Insight into a Shape of Salt Storage Caverns. Arch. Min. Sci. 2020, 65, 363–398. [Google Scholar] [CrossRef]
- Kunstman, A.; Poborska-Młynarska, K.; Urbańczyk, K. Solution Mining Salt Deposits Qutline of Recent Development Trends; AGH University of Science and Technology Press: Krakow, Poland, 2007; ISBN 978-83-7464-109-8. [Google Scholar]
- Liu, W.; Li, Y.; Yang, C.; Heng, S.; Wang, B. Analysis of physical and mechanical properties of impure salt rock. In Proceedings of the 47th U.S. Rock Mechanics/Geomechanics Symposium, San Francisco, CA, USA, 23–26 June 2013; pp. 1130–1139. [Google Scholar]
- Zhang, Q.; Liu, J.; Wang, L.; Luo, M.; Liu, H.; Xu, H.; Zou, H. Impurity Effects on the Mechanical Properties and Permeability Characteristics of Salt Rock. Energies 2020, 13, 1366. [Google Scholar] [CrossRef] [Green Version]
- Wang, G.; Xing, W.; Liu, J.; Hou, Z.; Were, P. Influence of water-insoluble content on the short-term strength of bedded rock salt from three locations in China. Environ. Earth Sci. 2015, 73, 6951–6963. [Google Scholar] [CrossRef]
- Cyran, K.; Toboła, T.; Kamiński, P. Effect of petrological features on mechanical properties of rock salt from the LGOM (Legnica-Głogów copper district). Biul. Panstw. Inst. Geol. 2016, 466. [Google Scholar] [CrossRef]
- Borchert, H.; Muir, R.O. Salt Deposits. The Origin, Metamorphism and Deformation of Evaporites; D. Van Nostrand Company, LTD.: London, UK, 1964. [Google Scholar]
- Braitsch, O. Salt Deposits Their Origin and Composition; Springer: New York, NY, USA, 1971. [Google Scholar]
- Warren, J.K. Evaporites. In Their Evolution and Economics; Blackwell Science Ltd.: Oxford, UK, 1999. [Google Scholar]
- Warren, J.K. Evaporites A Geological Compendium; Springer: Cham Heidelberg, Germany; New York, NY, USA, 2016; ISBN 9783319135113. [Google Scholar]
- Wachowiak, J.; Toboła, T. Phase transitions in the borate minerals from the Kłodawa salt dome (Central Poland) as indicators of temperature processes in salt diapirs. Geol. Q. 2014, 58, 543–554. [Google Scholar] [CrossRef] [Green Version]
- Toboła, T.; Wachowiak, J. Evidence of high-temperature rock salt transformations in areas of occurrence of borate minerals (Zechstein, Kłodawa salt dome, Poland). Geol. Q. 2018, 62, 134–145. [Google Scholar] [CrossRef] [Green Version]
- Toboła, T. Inclusions in anhydrite crystals from blue halite veins in the Kłodawa Salt Dome (Zechstein, Poland). Geol. Q. 2016, 60, 572–585. [Google Scholar] [CrossRef] [Green Version]
- Toboła, T.; Botor, D. Raman spectroscopy of organic matter and rare minerals in the Kłodawa Salt Dome (Central Poland) cap-rock and Triassic cover—Indicators of hydrothermal solution migration. Spectrochim. Acta Part A Mol. Biomol. Spectrosc. 2020, 231, 118121. [Google Scholar] [CrossRef]
- Toboła, T. Raman spectroscopy of organic, solid and fluid inclusions in the Oldest Halite of LGOM area (SW Poland). Spectrochim. Acta Part A Mol. Biomol. Spectrosc. 2018, 189, 381–392. [Google Scholar] [CrossRef]
- Stewart, F.H. Marine Evaporites. In Data of Geochemistry; Fleischer, M., Ed.; Geological Survey Professional Paper 440-Y; United States Government Printing Office: Washington, DC, USA, 1963; p. 52. [Google Scholar]
- Baar, C.A. Bromine Investigations on Eastern Canada Salt Deposits. In Proceedings of the Second Symposium on Salt; Rau, J.L., Ed.; The Northern Ohio Geological Society: Cleveland, OH, USA, 1966; Volume 1, pp. 276–292. [Google Scholar]
- Raup, O.B.; Hite, R.J. Bromine Distribution in Marine Halite Rocks. In Marine Evaporites; Dean, W.E., Schreiber, B.C., Eds.; SEPM Society for Sedimentary Geology: Tulsa, OK, USA, 1978; pp. 105–123. [Google Scholar]
- Herrman, A.G.; Knake, D.; Schneider, J.; Peters, H. Geochemistry of Modern Seawater and Brines from Salt Pans: Main Components and Bromine Distribution. Contrib. Mineral. Petrol. 1973, 40, 1–24. [Google Scholar] [CrossRef]
- Holser, W.T. Bromide geochemistry of salt rocks. In Proceedings of the Second Symposium on Salt, Volume 1; Rau, J.R., Ed.; The Northern Ohio Geological Society: Cleveland, OH, USA; 1966; Volume 75, pp. 248–275. [Google Scholar]
- Holser, W.T. Trace elements and isotopes in evaporites. In Reviews in Mineralogy; Burns, R.G., Ed.; Mineralogical Society of America: Chantilly, VA, USA, 1979; Volume 6, pp. 295–346. [Google Scholar]
- Kühn, R. Geochemistry of German potash deposits. In Saline Deposits; Mattox, R.B., Ed.; Special Papers no. 88; The Geological Society of America, INC.: Boulder, CO, USA, 1968; pp. 427–504. [Google Scholar]
- Holser, W.T.; Wardlaw, N.C.; Watson, D.W. Bromide in salt rocks: Extraordinarily low content in the Low Elk Point salt, Canada. Geol. Saline Depos. 1972, 7, 183–190. [Google Scholar]
- Valiashko, M.G. Geochemistry of Bromine in the Processes of Salt Deposition and the Use of the Bromine Content as a Genetic and Prospecting Criterion. Reprinted from Geochemistry, 6, 570–589 (1956). In Marine Evaporites: Origin, Diagenesis and Geochemistry; Kirkland, D.W., Evans, R., Eds.; Dowden, Hutchinson & Ross, Inc.: Stroudsburg, PE, USA, 1973; pp. 313–332. ISBN 0-87933-043-0. [Google Scholar]
- Zak, I. Sedimentology and Bromine Geochemistry of Marine and Continental Evaporites in the Dead Sea Basin. In Fourth Symposium on Salts; Coogan, A., Ed.; Northern Ohio Geological Society: Cleveland, OH, USA, 1974; Volume 1, pp. 349–361. [Google Scholar]
- Dean, W.E.; Anderson, R.Y. Trace and Minor Elements Variations in the Permian Castile Formation, Delevare Basin, Texas and New Mexico, Revealed by Varve Calibration. In Proceedings of the Fourth Symposium on Salt; Coogan, A.H., Ed.; Northern Ohio, Geol. Soc.: Cleveland, OH, USA, 1974; Volume 1, pp. 275–286. [Google Scholar]
- Dean, W.E. Trace and Minor Elements IN Evaporites. In Marine evaporates; Dean, W.E., Schreiber, B.C., Eds.; Tulsa, SEPM Society for Sedimentary Geology: Tulsa, OK, USA, 1987; pp. 86–104. ISBN 9781565762336. [Google Scholar]
- Hryniv, S.M. Peryt, T. Strontium distribution and celestite occurrence in Zechstein (Upper Permian) anhydrites of West Poland. Chem. Erde 2010, 70, 137–147. [Google Scholar] [CrossRef]
- Rabin, M.; Kukiałka, P. Lotsberg Salt Formation Solution mined Cavern for SAGD Solid Waste disposal, Cold Lake, Alberta. In Proceedings of the GeoConvention 2013, Integration, Calgary, AB, Canada, 6–12 May 2013; pp. 1–6. [Google Scholar]
- Kukiałka, P. Kawerny solne w prowincji Alberta, Zachodnia Kanada. Przegląd Solny 2015, 11, 83–90. [Google Scholar]
- Kukiałka, P. Złoża soli kamiennej w prowincji Alberta, Zachodnia Kanada. Przegląd Solny 2014, 10, 132–138. [Google Scholar]
- Kukiałka, P.; Toboła, T. Petrologiczna i geochemiczna charakterystyka soli kamiennych formacji Lotsberg w środkowej Albercie (Kanada). Przegląd Solny 2018, 14, 77–87. [Google Scholar]
- Wardlaw, N.C.; Watson, D.W. Middle Devonian Salt Formations and Their Bromide Content, Elk Point Area, Alberta. Can. J. Earth Sci. 1966, 3, 263–278. [Google Scholar] [CrossRef]
- Hamilton, W.N. Salt in East-Central Alberta; Bulletin no. 29L; Research Council of Alberta: Edmonton, AB, Canada, 1971. [Google Scholar]
- Meijer Drees, N.C. Evaporitic Deposits of Western Canada; Geological Survey of Canada: Ottawa, ON, Canada, 1986; ISBN 0660120259. [Google Scholar]
- Meijer Drees, N.C. Devonian Elk Point Group of the Western Canada Sedimentary Basin. In Geological Atlas of the Western Canada Sedimentary Basin; Canadian Society of Petroleum Geologists: Calgary, AB, Canada, 1994; pp. 129–147. [Google Scholar]
- Grobe, M. Distribution and Thickness of Slat Within the Devonian Elk Point Group, Western Canada Sedimentary Basin; Alberta Energy and Utilities Board, Alberta Geological Survey: Edmonton, AB, Canada, 2000. [Google Scholar]
- Grobe, M. Distribution and Thickness of Salt-Bearing Units within the Devonian Elk Point Group Ð a Useful Supplement to the Geological Atlas of the Western Canada Sedimentary Basin Matthias Grobe; Alberta Energy and Utilities Board, Alberta Geological Survey: Edmonton, AB, Canada, 1988; Volume 4. [Google Scholar]
- Glass, D.J. (Ed.) Lexicon of Canadian Stratigraphy; Canadian Society of Petroleum Geologists: Calgary, AB, Canada, 1997; Volume 4, ISBN 0-920230-23-7. [Google Scholar]
- Goldstein, R.H.; Reynolds, J.T. Systematics of Fluid Inclusions. In Diagenetic Minerals; Society for Sedimentary Geology: Tulsa, OK, USA, 1994; ISBN 1-56576-008-5. [Google Scholar]
- Vanko, D.A.; Bach, W. Heating and freezing experiments on aqueous fluid inclusions in anhydrite: Recognition and effects of stretching and the low-temperature formation of gypsum. Chem. Geol. 2005, 223, 35–45. [Google Scholar] [CrossRef]
- Roberts, S.M.; Spencer, R.J. Paleotemperatures preserved in fluid inclusions in halite. Geochmica Cosmochmica Acta 1995, 59, 3929–3942. [Google Scholar] [CrossRef]
- Beyssac, O.; Goffé, B.; Chopin, C.; Rouzaud, J.N. Raman spectra of carbonaceous material in metasediments: A new geothermometer. J. Metamorph. Geol. 2002, 20, 859–871. [Google Scholar] [CrossRef]
- Aoya, M.; Kouketsu, Y.; Endo, S.; Shimizu, H.; Mizukami, T.; Nakamura, D.; Wallis, S. Extending the applicability of the Raman carbonaceous-material geothermometer using data from contact metamorphic rocks. J. Metamorph. Geol. 2010, 28, 895–914. [Google Scholar] [CrossRef]
- Kouketsu, Y.; Mizukami, T.; Mori, H.; Endo, S.; Aoya, M.; Hara, H.; Nakamura, D.; Wallis, S. A new approach to develop the Raman carbonaceous material geothermometer for low-grade metamorphism using peak width. Isl. Arc 2014, 23, 33–50. [Google Scholar] [CrossRef]
- Lünsdorf, N.K.; Dunkl, I.; Schmidt, B.C.; Rantitsch, G.; von Eynatten, H. Towards a Higher Comparability of Geothermometric Data obtained by Raman Spectroscopy of Carbonaceous Material. Part I: Evaluation of Biasing Factors. Geostand. Geoanal. Res. 2014, 38, 73–94. [Google Scholar] [CrossRef]
- Lünsdorf, N.K.; Lünsdorf, J.O. Evaluating Raman spectra of carbonaceous matter by automated, iterative curve-fitting. Int. J. Coal Geol. 2016, 160–161, 51–62. [Google Scholar] [CrossRef]
- Roedder, E. Fluid Inclusions. Rev. Mineral. Vol. 12 Fluid Inclusions. Mineral. Soc. Am. 1984, 12, 1–644. [Google Scholar]
- Goldstein, R.H. Petrographic Analysis of Fluid Inclusions. In Fluid Inclusions: Analysis and Interpreation. Short Course Series; Samson, I.M., Anderson, A., Marshall, D., Eds.; Mineralogical Association of Canada: Quebec, QC, Canada, 2001; Volume 32. [Google Scholar]
- Andò, S.; Garzanti, E. Raman spectroscopy in heavy-mineral studies. Geol. Soc. Spec. Publ. 2013, 386, 395–412. [Google Scholar] [CrossRef]
- Frezzotti, M.L.; Tecce, F.; Casagli, A. Raman spectroscopy for fluid inclusion analysis. J. Geochem. Explor. 2012, 112, 1–20. [Google Scholar] [CrossRef]
- White, S.N. Laser Raman spectroscopy as a technique for identification of seafloor hydrothermal and cold seep minerals. Chem. Geol. 2009, 259, 240–252. [Google Scholar] [CrossRef]
- Bernard, M.-C. Electrochromic Reactions in Manganese Oxides. J. Electrochem. Soc. 1993, 140, 3065–3070. [Google Scholar] [CrossRef]
- Holser, W.T. Mineralogy of evaporites. In Reviews in Mineralogy; Mineralogical Society of America: Chantilly, VA, USA, 1979; Volume 6, pp. 211–294. [Google Scholar]
- Sonnenfeldüü, P. The color of rock salt—A review. Sediment. Geol. 1995, 94, 267–276. [Google Scholar] [CrossRef]
- Heflik, W.; Natkaniec-Nowak, L.; Toboła, T. Microscopic investigation of blue salts. In Blue halite of the Kłodawa Salt Dome; Toboła, T., Natkaniec-Nowak, L., Eds.; AGH University of Science and Technology Press: Kraków, Poland, 2008; pp. 56–69, (In Polish with English summary). [Google Scholar]
- Zelek, S.M.; Stadnicka, K.M.; Toboła, T.; Natkaniec-Nowak, L. Lattice deformation of blue halite from Zechstein evaporite basin: Kłodawa Salt Mine, Central Poland. Mineral. Petrol. 2014, 108. [Google Scholar] [CrossRef] [Green Version]
- Shlichta, P.J. Growth, Deformation, and Defect Structure of Salt Crystals. In Saline Deposits; Mattox, R., Ed.; Special Papers no. 88; The Geological Society of America, INC.: Boulder, CO, USA, 1968; pp. 597–617. [Google Scholar]
- Carter, N.L.; Hansen, F.D. Creep of rocksalt. Tectonophysics 1983, 92, 275–333. [Google Scholar] [CrossRef]
- Nicholson, K.; Hein, J.R.; Bühn, B.; Dasgupta, S. (Eds.) Manganese Mineralization: Geochemistry and Mineralogy of Terrestrial and Marine Deposits; Special Publication No. 119; The Geological Society London: London, UK, 1997; ISBN 1897799748. [Google Scholar]
- Dasgupta, S.; Roy, S.; Fukuoka, M. Depositional Models for Manganese Oxide and Carbonate Deposits of the Precambrian Sausar Group, India. Econ. Geol. 1992, 87, 1412–1418. [Google Scholar] [CrossRef]
- Ciobotǎ, V.; Salama, W.; Tarcea, N.; Rösch, P.; Elaref, M.M.; Gaupp, R.; Popp, J. Identification of minerals and organic materials in Middle Eocene ironstones from the Bahariya Depression in the Western Desert of Egypt by means of micro-Raman spectroscopy. J. Raman Spectrosc. 2012, 43, 405–410. [Google Scholar] [CrossRef]
- Baioumy, H.M.; Khedr, M.Z.; Ahmed, A.H. Mineralogy, geochemistry and origin of Mn in the high-Mn iron ores, Bahariya Oasis, Egypt. Ore Geol. Rev. 2013, 53, 63–76. [Google Scholar] [CrossRef]
- Hazen, R.M.; Downs, R.T.; Jones, A.P.; Kah, L. Carbon mineralogy and crystal chemistry. Rev. Mineral. Geochem. 2013, 75, 7–46. [Google Scholar] [CrossRef]
- Burns, R.G.; Burns, V.M. Manganese Oxides. In Reviews in Mineralogy; Burns, R.G., Ed.; Mineralogical Society of America: Chantilly, VA, USA, 1979; pp. 1–46. [Google Scholar]
- Post, J.E. Manganese oxide minerals: Crystal structures and economic and environmental significance. Proc. Natl. Acad. Sci. USA 1999, 96, 3447–3454. [Google Scholar] [CrossRef] [Green Version]
- Taitel-Goldman, N.; Ezersky, V.; Mogilyanski, D. High-resolution transmission electron microscopy study of Fe-Mn oxides in the hydrothermal sediments of the Red Sea deeps system. Clays Clay Miner. 2009, 57, 465–475. [Google Scholar] [CrossRef]
- Taitel-Goldman, N. Crystallization of Fe and Mn Oxides-Hydroxides in Saline and Hypersaline Environments and In Vitro. In Advanced Topics in Crystallization; Mastai, Y., Ed.; IntechOpen: London, UK, 2015; pp. 323–339. ISBN 978-953-51-4224-9. [Google Scholar]
- Roedder, E. The fluids in salt. Am. Mineral. 1984, 69, 413–439. [Google Scholar]
- Toboła, T. The influence of tectonics on petrological characteristics of anhydrite and anhydrite-halite intercalations in the Oldest Halite (Na1) (Zechstein, Upper Permian) of the Bądzów area (SW poland). Geol. Q. 2014, 58, 531–542. [Google Scholar] [CrossRef] [Green Version]
- Hardie, L.A.; Lowenstein, T.K.; Spencer, R.J. The Problem of Distinguishing Between Primary and Secondary Features in Evaporites. In Sixth International Symposium on Salt; Salt Institute: La Jolla, CA, USA, 1983; pp. 11–39. [Google Scholar]
- den Brok, B.; Zahid, M.; Passchier, C.W. Stress induced grain boundary migration in very soluble brittle salt. J. Struct. Geol. 1999, 21, 147–151. [Google Scholar] [CrossRef]
- den Brok, B.; Zahid, M.; Passchier, C.W. Pressure solution compaction of sodium chlorate and implications for pressure solution in NaCl. Tectonophysics 1999, 307, 297–312. [Google Scholar] [CrossRef]
- den Brok, B.; Zahid, M.; Passchier, C. Cataclastic solution creep of very soluble brittle salt as a rock analogue. Earth Planet. Sci. Lett. 1998, 163, 83–95. [Google Scholar] [CrossRef]
- Adams, L.H.; Williamson, E.D.; Johnston, J. The determination of the compressibility of solids at high pressures. J. Am. Chem. Soc. 1919, 41, 12–42. [Google Scholar] [CrossRef] [Green Version]
- Adams, L.H.; Williamson, E.D. On the compressibility of minerals and rocks at high pressures. J. Franklin Inst. 1923, 195, 475–529. [Google Scholar] [CrossRef]
- Richards, T.W.; Jones, G. The Compressibilities of the Chlorides, Bromides, and Iodides of Sodium, Potassium, Silver and Thallium. J. Am. Chem. Soc. 1909, 32, 158–191. [Google Scholar] [CrossRef] [Green Version]
- Bodnar, R.J.; Vityk, M.O. Interpretation of microthermometric data for H2O-NaCl fluid inclusions. In Fluid inclusions in Minerals: Methods and Applications; De Vivo, B., Frezzotti, M.L., Eds.; Virginia Tech: Blacksburg, VA, USA, 1994; pp. 117–130. [Google Scholar]
- Diamond, L.W. Systematics of H2O Inclusions. Fluid Inclusions Anal. Interpreation 2003, 32, 55–80. [Google Scholar]
- McCaffrey, M.A.; Lazar, B.; Holland, H.D. The Evaporation Path of Seawater and the Coprecipitation of Br- and K + With Halite. J. Sediment. Petrol. 1987, 57, 928–937. [Google Scholar]
- Hite, R.J. Evaporite Deposits of the Khorat Plateau, Northeastern Thailand. In Fourth Symposium on Salt; Coogan, A.H., Ed.; Northern Ohio, Geol. Soc.: Cleveland, OH, USA, 1974; Volume 1, pp. 135–146. [Google Scholar]
- Tomassi-Morawiec, H.; Czapowski, G.; Bornemann, O.; Schramm, M.; Misiek, G. Wzorcowe profile bromowe dla solnych utworów cechsztynu w Polsce. Gospod. Surowcami Miner. 2009, 25, 75–143. [Google Scholar]
- Toboła, T. Study of potassium and magnesium contents in salt deposit Bochnia (Southern Poland). Prz. Geol. 2000, 48, 688–693. [Google Scholar]
- Wilamowski, A. Chloritization and polytypism of biotite in the Łomnica granite, Karkonosze Massif, Sudetes, Poland: Stable isotope evidence. Chem. Geol. 2002, 182, 529–547. [Google Scholar] [CrossRef]
- Fritz, P.; Frape, S.K. Saline groundwaters in the Canadian Shield—A first overview. Chem. Geol. 1982, 36, 179–190. [Google Scholar] [CrossRef]
- Frape, S.K.; Fritz, P.; McNutt, R.H. Water-rock interaction and chemistry of groundwaters from the Canadian Shield. Geochim. Cosmochim. Acta 1984, 48, 1617–1627. [Google Scholar] [CrossRef]
- Zherebtsova, I.K.; Volkova, N.N. Experimental study of behavior of trace elements in the process of natural solar evaporation of Black Sea water and Sasyk–Sivash brine. Geochem. Int. 1966, 7, 656–670. [Google Scholar]
- Schock, H.H.; Puchelt, H. Rubidium and cesium distribution in salt minerals-I. Experimental investigations. Geochim. Cosmochim. Acta 1971, 35, 307–317. [Google Scholar] [CrossRef]
- Shamaev, V.I.; Chudinovskich, T.V. Determination of Cesium in Seawater by Radiochemical Methods. Anal. Chim. Acta 1982, 139, 177–186. [Google Scholar] [CrossRef]
- Stowe, K. Ocean Science; John Wiley & Sons: Hoboken, NJ, USA, 1983. [Google Scholar]
- Norton, J.J. Lithium, Cesium, and Rubidium—The Rare Alkali Metals; United States Mineral Resources: Washington, DC, USA, 1973; pp. 365–378.
- Kretz, R.; Loop, J.; Hartree, R. Petrology and Li-Be-B geochemistry of muscovite-biotite granite and associated pegmatite near Yellowknife, Canada. Contrib. Mineral. Petrol. 1989, 102, 174–190. [Google Scholar] [CrossRef]
- Černý, P.; Chapman, R.; Teertstra, D.K.; Novák, M. Rubidium- and cesium-dominant micas in granitic pegmatites. Am. Mineral. 2003, 88, 1832–1835. [Google Scholar] [CrossRef]
- Michard, G. Behaviour of major elements and some trace elements (Li, Rb, Cs, Sr, Fe, Mn, W, F) in deep hot waters from granitic areas. Chem. Geol. 1990, 89, 117–134. [Google Scholar] [CrossRef]
- Hall, A.; Jarvis, K.E.; Walsh, J.N. The variation of cesium and 37 other elements in the Sardinian granite batholith, and the significance of cesium for granite petrogenesis. Contrib. Mineral. Petrol. 1993, 114, 160–170. [Google Scholar] [CrossRef]
- Drake, H.; Tullborg, E.L.; Annersten, H. Red-staining of the wall rock and its influence on the reducing capacity around water conducting fractures. Appl. Geochem. 2008, 23, 1898–1920. [Google Scholar] [CrossRef] [Green Version]
- Loges, A.; Wagner, T.; Kirnbauer, T.; Göb, S.; Bau, M.; Berner, Z.; Markl, G. Source and origin of active and fossil thermal spring systems, northern Upper Rhine Graben, Germany. Appl. Geochem. 2012, 27, 1153–1169. [Google Scholar] [CrossRef]
- Mathurin, A.; Drake, H.; Tullborg, E.; Berger, T.; Peltola, P.; Kalinowski, B.E.; Åström, M.E. High cesium concentrations in groundwater in the upper 1.2 km of fractured crystalline rock—Influence of groundwater origin and secondary minerals. Geochim. Cosmochim. Acta 2014, 132, 187–213. [Google Scholar] [CrossRef]
Figure 1.
Map Distribution of salt formations within the Devonian Elk Point Group in Alberta (after [40]).
Figure 1.
Map Distribution of salt formations within the Devonian Elk Point Group in Alberta (after [40]).

Figure 2.
Table of formations in the investigated region.

Figure 3.
Lithological types of the Lotsberg Salt Formation: (A) large crystalline salt rocks with large halite crystals containing small amounts of impurities (depth −1291.8 m a.s.l.). (B) Clean and very large halite crystal (depth −1191.2 m a.s.l.). (C) Large crystalline salt rocks with a large number of impurities (depth −1193.8 m a.s.l.).

Figure 4.
Microscopic images with location of the points of analysis and Raman spectra of: (A) dolomite (Dol) and hematite (Hem) inclusions in halite (depth −1193.8 m a.s.l). (B) Dolomite (Dol) and hematite (Hem) inclusions in halite accompanied by small amounts of organic matter (OM) and finely dispersed anatase (Ant) crystals (depth −1187.6 m a.s.l.). (C) Calcite (Cal) inclusions with larger amount of organic matter (OM) (depth −1187.6 m a.s.l.). (D) Clean and large hematite (Hem) accumulation (depth −1190.4 m a.s.l.).

Figure 5.
Microscopic images of halite crystals: (A) birefringent set of belts in halite crystal (depth −1190.7 m a.s.l.). (B) Two birefringent sets of belts which intersect at a right angle (depth −1187.6 m a.s.l.). (C) Small secondary or pseudosecondary fluid inclusion assemblages (FIAs) (depth −1190.8 m a.s.l.). (D) Large secondary or pseudosecondary FIAs (depth −1190.8 m a.s.l.). (E,F) Secondary flatten inclusions filled with liquid-solid-vapour (E-1N, F-XN) (depth −1190.8 m a.s.l.). (G) Primary FIA composed of small, liquid inclusions (depth −1190.5 m a.s.l.). (H) Primary FIA composed of larger liquid-vapour (LG) inclusions (depth −1195.8 m a.s.l.). (I) Primary FIA composed of larger liquid-solid (LS) inclusions (depth −1195.8 m a.s.l.).

Figure 6.
Microscopic images of fluid inclusion and Raman spectra of: (A) euhedral anhydrite (Anh) crystal (point 1) and fine crystalline dolomite (Dol, point 2) in liquid inclusion (depth −1190.5 m a.s.l.). (B) Densely packed needles of manganite (Man) in fluid inclusion (depth −1187.6 m a.s.l.). (C) Needles of manganite (Man) with anhydrite (Anh) (depth −1187.6. m a.s.l.). (D) Inclusion filled by fine crystalline, opaque dolomite (Dol) with manganite (Man) (depth −1187.6 m a.s.l.).

Figure 7.
Microscopic images (1N) of: (A) concentration of very thin and long, bent and tangled needles of manganite within halite crystal (depth −1190.4 m a.s.l.). (B) Set of manganite needles growing from one point (depth −1187.6 m a.s.l.). (C) Single or in pairs manganite needles in clean halite crystal (depth −1187.6 m a.s.l.). (D) Manganite prismatic crystals in inclusion (depth −1187.6 m a.s.l.). (E) Large LG inclusion with rough walls (depth −1195.8 m a.s.l.). (F) Large LG inclusion with larger vapor bubble and tracks of small fluid inclusions (depth −1190.7 m a.s.l.).

Figure 8.
(A) Histogram of homogenization temperatures. (B) Distribution of mean homogenization temperatures in the samples (the horizontal line represents standard deviation).
Figure 8.
(A) Histogram of homogenization temperatures. (B) Distribution of mean homogenization temperatures in the samples (the horizontal line represents standard deviation).

Figure 9.
(A) Fragments of carbonates intercalations with halite crystals. (B) The polished side of carbonates intercalations shows brecciated fabric. (C) Example of red fibrous halite vein cutting through carbonates. (D,E) X-ray diffraction pattern for sample of intercalations (Dol—dolomite, Dol(Fe)—ferroan dolomite, Cal—calcite, Qz—quartz, Hl—halite, Clc—clinochlore, Mc—microcline, Ilt—Illite).

Figure 10.
Thin section photographs of: (A) fine grained and semi-translucent, red-brownish, or greyish background with larger crystals of dolomite and rarely quartz (white spots). There is a fragment composed of only very fine grained semi-translucent dolomitic, dark mass in the centre of the image. (B) Euhedral, larger dolomite crystals (Dol—dolomite). (C) Anhedral, large quartz crystals (Qz—quartz). (D) The light colour, rounded dolomitic fragment and halite vein (Hl—halite). (E) The dark coloured rounded fragment. (F) Irregular halite veins (Hl—halite).

Figure 11.
Microscopic images and Raman spectra of dolomite contaminated by organic matter and anatase.
Figure 11.
Microscopic images and Raman spectra of dolomite contaminated by organic matter and anatase.

Figure 12.
Distribution of parts insoluble in water (PIW), bromide, and chloride-bromide ratio in Lotsberg salt profile. (1) Basal Red Beds sediments, (2) salt rocks, (3) main carbonate intercalations, (4) Ernestina Lake, (5) measurement points
Figure 12.
Distribution of parts insoluble in water (PIW), bromide, and chloride-bromide ratio in Lotsberg salt profile. (1) Basal Red Beds sediments, (2) salt rocks, (3) main carbonate intercalations, (4) Ernestina Lake, (5) measurement points

Figure 13.
Distribution of potassium, rubidium, and magnesium in Lotsberg salt profile. Explanation as at Figure 12.
Figure 13.
Distribution of potassium, rubidium, and magnesium in Lotsberg salt profile. Explanation as at Figure 12.

Figure 14.
Distribution of calcium, strontium, and caesium in Lotsberg salt profile. Explanation in Figure 12.
Figure 14.
Distribution of calcium, strontium, and caesium in Lotsberg salt profile. Explanation in Figure 12.

Figure 15.
Distribution of lithium, barium, and magnesium in Lotsberg salt profile. Explanation as at Figure 12.
Figure 15.
Distribution of lithium, barium, and magnesium in Lotsberg salt profile. Explanation as at Figure 12.

Table 2.
The main statistical parameters of salt rocks chemical composition.
| Parameters | PIW (wt%) | Br (ppm) | Ba (ppm) | Ca (ppm) | Cs (ppm) | K (ppm) | Li (ppm) | Mg (ppm) | Mn (ppm) | Rb (ppm) | Cl/Br |
|---|---|---|---|---|---|---|---|---|---|---|---|
| Min. | <0.01 | 0.67 | 3.63 | 104.20 | 5.07 | 165.84 | 0.04 | 25.96 | 0.10 | <0.01 | 4.75 |
| Max. | 18.34 | 12.74 | 126.60 | 2525.39 | 211.22 | 3651.34 | 0.58 | 176.89 | 1.59 | 3.13 | 90.44 |
| Average | 0.96 | 3.10 | 31.60 | 772.90 | 56.99 | 1060.33 | 0.18 | 64.85 | 0.63 | 0.93 | 28.54 |
| S.D. | 2.32 | 2.34 | 25.37 | 465.06 | 44.75 | 853.93 | 0.15 | 35.07 | 0.38 | 0.86 | 16.11 |
| CV (%) | 242.27 | 75.44 | 80.27 | 60.17 | 78.53 | 80.53 | 83.96 | 54.08 | 60.59 | 92.49 | 56.44 |
S.D., Standard deviation. CV, Coefficient of variation (relative standard deviation).
© 2020 by the authors. Licensee MDPI, Basel, Switzerland. This article is an open access article distributed under the terms and conditions of the Creative Commons Attribution (CC BY) license (http://creativecommons.org/licenses/by/4.0/).
Share and Cite
MDPI and ACS Style
Toboła, T.; Kukiałka, P. The Lotsberg Salt Formation in Central Alberta (Canada)—Petrology, Geochemistry, and Fluid Inclusions. Minerals 2020, 10, 868. https://0-doi-org.brum.beds.ac.uk/10.3390/min10100868
AMA Style
Toboła T, Kukiałka P. The Lotsberg Salt Formation in Central Alberta (Canada)—Petrology, Geochemistry, and Fluid Inclusions. Minerals. 2020; 10(10):868. https://0-doi-org.brum.beds.ac.uk/10.3390/min10100868
Chicago/Turabian StyleToboła, Tomasz, and Piotr Kukiałka. 2020. "The Lotsberg Salt Formation in Central Alberta (Canada)—Petrology, Geochemistry, and Fluid Inclusions" Minerals 10, no. 10: 868. https://0-doi-org.brum.beds.ac.uk/10.3390/min10100868
Note that from the first issue of 2016, this journal uses article numbers instead of page numbers. See further details here.