Soil Carbon Sequestration Due to Salt-Affected Soil Amelioration with Coal Bio-Briquette Ash: A Case Study in Northeast China


1
Department of Environmental Chemistry and Chemical Engineering, School of Advanced Engineering, Kogakuin University, Tokyo 192-0015, Japan
2
College of Marine and Environmental Sciences, Tianjin University of Science and Technology, Tianjin 300457, China
*
Author to whom correspondence should be addressed.
Minerals 2020, 10(11), 1019; https://0-doi-org.brum.beds.ac.uk/10.3390/min10111019
Submission received: 14 October 2020
/
Revised: 11 November 2020
/
Accepted: 13 November 2020
/
Published: 16 November 2020
(This article belongs to the Section Mineral Processing and Extractive Metallurgy)
Abstract
:Increasing soil carbon storage and biomass utilization is an effective process for mitigating global warming. Coal bio-briquettes (CBB) are made using two low-ranked coals with high sulfur content, corn stalks, and calcium hydroxide, and the combustion ash can ameliorate the physicochemical properties in salt-affected soil. CBB ash contains mainly calcium compounds, such as calcium sulfate, calcium hydroxide, and calcium carbonate, and coal fly ash and biomass ash. In this paper, changes in soil carbon and nitrogen content through salt-affected soil amelioration during 5 months using two CBB ashes and pig manure were examined in Northeast China. Application rates of CBB ash were 0 tha−1 (control), 11.6 tha−1, 23.2 tha−1, 46.4 tha−1, and 69.6 tha−1. Consequently, total carbon content in topsoil (0–0.15 m) after harvest of maize in all test fields indicated a range between 27.7 tCha−1 and 50.2 tCha−1, and showed increased levels compared to untreated salt-affected soil. In a 3.0% (69.6 tha−1) application plot of only CBB ash with higher carbon and higher exchangeable Ca2+, the carbon content increased by 51.5% compared to control plot, and changes in carbon sequestration compared to untreated soil was roughly twice that of the control plot. CBB ash contributed to carbon application and pig manure supply as a form of N fertilization in the case of all test plots. Changes in carbon content due to soil amelioration have a significant relationship with changes in corn production and soil chemical properties, such as pH, Na+, Cl−, sodium adsorption ratio (SAR), and exchangeable sodium percentage (ESP). Therefore, CBB production from low-ranked coal and waste biomass, and the use of CBB ash in agriculture is advocated as an effective means for sequestering carbon.
1. Introduction
Over the past 60 years (1951–2012), an increase in atmospheric greenhouse gases (GHGs), such as carbon dioxide (CO2), has seen the global mean surface temperature rise by 0.72 °C [1]. Since soil stores two to three times more carbon than atmosphere, a relatively small increase in carbon stocks in soil can exert a significant impact on mitigating GHG emissions. According to the Paris Agreement at the United Nations Climate Change Conference 2015 (the twenty-first session of the Conference of the Parties, COP 21), the 4 per mille initiative aspires to increase global soil organic matter stocks by 0.4% per year to compensate for the global emission of GHGs by anthropogenic sources. Soil organic carbon (SOC) sequestration is considered a possible solution for mitigating climate change, by converting atmospheric CO2 into long-life soil carbon [2]. SOC plays a crucial role in the maintenance of soil productivity, due to its significant contribution to the physical, chemical, and biological properties of soil [3]. Furthermore, large amounts of insoluble inorganic carbon exist in the subsoil of sodic soil and also on limestone soils has the potential to play an important role in carbon cycling [4]. The global area of saline-sodic soil is estimated at 1.0 × 10⁹ ha [5], and there were approximately 34 million ha of saline-alkali land in China at the end of 2015 [6]. Soil salinity and sodicity are considered the most important impediments to agricultural development in Northeast China. North, northwest, and southwest China, where low soil C content was observed, indicate potential for carbon sequestration [7,8]. Arid soils represent a potentially significant reservoir of soil inorganic carbon (SIC) in China, which may in the past have made an important contribution to carbon sequestration. In addition, there has been a rapid decrease in SOC density in Northeast China during the past two decades, making soil susceptible to erosion under intensive dryland agricultural conditions [9]. To estimate C storage and fluxes in terrestrial environments, both organic and inorganic pools must be considered. Therefore, it is necessary to examine the total soil carbon containing not only SOC, but also SIC. However, little work has been done on carbon sequestration in salt-affected soil in China.
China is considered the largest contributor of carbon emissions in the world, with the residential sector being particularly relevant in this regard [10,11]. Coal is the dominant primary energy source in China, and accounted for roughly 64% of the total primary energy consumption in 2015 [12]. China has made remarkable progress in recent years in the development of clean coal technologies (CCTs). Briquetting, a method that compresses powdered coal into briquettes, has long been considered a CCT [13,14,15]. Moreover, biomass utilization and renewable energy development has been a field of inquiry for many decades in China. Biomass resources such as agricultural and forestry residues, firewood, and organic discharges from farms are abundant in China. Particularly in rural areas, biomass is an important renewable energy resource commonly used for heating and cooking. In addition, compressed biomass fuels such as biomass pellets are on the rise in selected areas [16] and other countries [17,18,19]. We installed a coal bio-briquette (CBB) manufacturing machine in Northeast China utilizing coal, biomass, and desulfurizer, and examined a reduction in sulfur dioxide emissions, alongside overall better health conditions as a result of their use [20]. In addition, leftover ash following the combustion of CBB indicated salt-affected soil amelioration in production, and improvement in overall soil chemical and physical properties in Northeast China [21,22,23].
Recently, both biochar production from bio-waste and effecting soil amendment to agricultural soils have shown significant potential in terms of mitigating the impact of climate change, while improving crop production [24]. Organic carbon (C) in biochar-added soil increases the stability of organic molecules, which helps to bind soil aggregates for long periods of time, compared to easily degradable molecules arising from other organic amendments [25,26,27]. The use of biochar when reclaiming salt-affected soil has recently received much attention [28,29]. In alkaline soils, plant productivity is restricted by high pH resultant low availability of P, Fe, Mg, and sometimes Cu and Zn [30]. Biochar will supply mineral nutrients such as K, Ca, Mg, and P, and improve the soil’s physical, chemical, and biological properties, such as bulk density, hydrological properties, aggregate structure, ion exchange capacity, and microbial activity [31,32]. Moreover, biochar application can reduce salt stress in plants in saline conditions, due to its high salt-adsorption capability [33]. For example, in biochar from maize corn cob rachis, total carbon content, and exchangeable Ca2+ is 785.8 g kg−1 and 2.02 cmol kg−1, respectively [34,35], and these figures show higher carbon content and lower exchangeable Ca2+ content compared to CBB ashes. Theoretically, reclamation of sodic soil requires removal of Na+ from the colloid’s cation exchange sites and leaching of the replaced Na+ out of the root zone in percolating water [36]. CBB ash contains calcium sulfate, calcium hydroxide, and calcium carbonate, which are effective for salt-affected soil amelioration [37]. CBB ash provide a source of Ca2+ to replace exchangeable Na+ from the cation exchange complex. In addition, CBB ash contains not only biomass ash, but also coal fly ash, which is a repository of nutrients that assist in reclaiming salt-affected soils, and in improving soil water retention [38]. Heavy metal concentrations of CBB ashes were substantially below the control standards for pollutants in fly ash for agricultural use, and CBB ashes can be considered safe for use as a soil amendment on salt-affected soils [23]. Biomass ash has important macro-nutrient contents and relevant soil liming capacity, and can be recycled to soils [39]. Fly ash can enhance the formation of soil macroaggregates, and the soil macroaggregates promote the formation of stable micro-aggregates, in which carbon is stabilized and sequestered long term [40]. Sakai et al. examined amelioration in soil physicochemical properties via the application of CBB ash in salt-affected soils in Northeast China [21,22,23]. Consequently, not only soil chemical properties such as pH and exchangeable sodium percentage (ESP), but also saturated hydraulic conductivity as physical properties, were improved in salt-affected soils using CBB ash [23]. Because CBB ash contains a larger amount of exchangeable calcium compared to biochar and fly ash, which is essential for improving salt-affected soil [23]. In addition, a small amount of coal fly ash and biomass ash in CBB ash has the possibility of contributing to increase in soil carbon. However, research on carbon sequestration with soil amelioration due to the application of CBB ash has not yet been reported. Moreover, improvements in soil organic matter stock have been shown to benefit soil productivity and ecosystem services for China’s agriculture [41]. Reinforcing soil organic matter in croplands has been adopted as a long-term approach in the national strategy aimed at protecting soil health, and to recycle biomass waste in agriculture [42].
In this paper, changes in total soil carbon and nitrogen content, prior to and following salt-affected soil amelioration in the application of both CBB ash and pig manure, was examined in Northeast China. In order to estimate the carbon and nitrogen sequestration in soil amelioration during 5 months, soil carbon and nitrogen contents in original (untreated) soil, control soil (only pig manure application), and CBB ash application plots were compared. Additionally, the relationship between soil carbon and nitrogen content and soil chemical properties was investigated. Considering the salt-affected soil amelioration effect with CBB ash, this study could supply a new knowledge concerning biomass and low-ranked coal utilization and the carbon sequestration. The goal was to provide soil carbon sequestration due to salt-affected soil amelioration with CBB ashes.
2. Materials and Methods
2.1. CBBs Manufacturing
To create CBB, we collected low-ranked coal, biomass, and a desulfurization agent. The coal analysis resulted in two coals, as described in Table 1. We selected two high sulfur content coals (A and B), and collected corn stems as a biomass, and calcium hydroxide as a desulfurization agent. CBBs using these materials were made by a coal bio-briquetting manufacturing machine in Shenyang, China [20]. The mixed coal was four times the biomass weight ratio, and calcium hydroxide was mixed at a ratio of Ca/S = 2.0. CBBs using Coal A and B were produced, roughly 2.7 tons, respectively. Thus, two types of CBB (CBB A and CBB B) were made from low-quality coal (sulfur content = 2.1% (Coal A) and 4.1% (Coal B)) (Table 1), corn stems as a biomass, and calcium hydroxide as a desulfurizer. Thereafter, these CBBs were used in households as fuel for heating and cooking in Kangping County, Liaoning Province, during the 2007 winter season, and their CBB ashes (CBB ash A and CBB ash B) were collected in March 2008.
2.2. Study Area and Soil Amelioration Test
This study was undertaken in a semi-arid area in Dang Lan village in Kangping county (42°70′ N, 123°50′ E) in 2008, which is located roughly 130 km north of Shenyang city, Liaoning Province, in Northeast China which is the same as that reported by Sakai et al. [23]. The area is characterized by a warm continental climate, and a humid continental climate near a cold semi-arid climate, with mean annual maximum and minimum temperatures of 14.3 and 2.2 °C, respectively, and average annual precipitation of roughly 516 mm. The total rainfall from May to September for crop growth was 394 mm, representing roughly 76% of annual precipitation. The average temperatures in May, June, July, August, and September were 18.0, 23.0, 25.5, 24.0, and 17.5 °C, respectively.
Four treatments (60 experimental plots) were conducted at the study site as follows: F1, CBB ash A and pig manure; F2, CBB ash A; F3, CBB ash B and pig manure; and F4, CBB ash B (Table 2). In these four treatment test fields (F1, F2, F3, and F4), the CBB ash application rate was 0% (control), 0.5% (11.6 tha−1), 1.0% (23.2 tha−1), 2.0% (46.4 tha−1), and 3.0% (69.6 tha−1), effected in three replications (Table 2) [23]. Each test plot size was 3.6 m × 3.6 m. The soil is classified as Kastanozem, according to the World Reference Base for Soil Resources (WRB) [43]. The soil amelioration test fields were leveled using a ground-leveling device, and soil amendments (CBB ashes) were incorporated into the plow layer (0–15 cm) of the soil by mixing with a scoop in the first year. An ammoniacal fertilizer was added to all plots at an application rate of 0.23 tha−1 on sowing date and pig manure was added as an organic fertilizer to two experimental plots (F1 and F3) at an application rate of 30 tha−1 before sowing date [23].
2.3. Soil Sampling and Measurements and Physicochemical Properties of Soil and CBB Ash
Soil samples were taken from topsoil (0–15 cm), air-dried, and ground to pass through a 2 mm sieve, and stored at room temperature for measuring carbon and nitrogen content. In this paper, changes in carbon and nitrogen content, before and after soil amelioration using CBB ash and/or organic manure application, are reported. Therefore, measured soil samples were the untreated soil near the amelioration test plots, the original salt-affected soil prior to the amelioration test (before the application of CBB ash (only pig manure)) in May 2008, and soils at all test plots (60 plots) in September 2008 (after harvesting). The amelioration test period was five months, and it was defined as season in this paper. Soil bulk density was measured by using separately collected soil cores (100 cm3) using the volumetric ring method at the untreated soil before soil amelioration experiment [21].
The total C and N content of soil samples and CBB ash were determined using a carbon nitrogen analyzer (SUMIGRAPH NC-22A, Sumika Chemical Analysis Service, Ltd., Osaka, Japan). All soil sample measurements were performed in triplicate for three samples. For the correlation relationship analysis among C and N content in soil, the experimental data on physicochemical properties of soil and CBB ash reported in a previous paper [23] was employed. pH, EC, solution cations, and anions in soil were measured using 1:5 water extracts. Exchangeable bases were extracted using 1 M ammonium acetate (at pH 7) and Na, Ca, Mg, and K were measured using ICP-AES (SPS3520UV, SII, Japan). Cation exchange capacity (CEC) was determined using 1N NaOAc at pH 8.2 [23]. The ESP was calculated from the sodium adsorption ratio (SAR) of the soil solution [44] and was calculated as exchangeable Na+/CEC. Moreover, pH, EC and solution cations (or exchangeable cations) in CBB ash (CBB ash A and CBB ash B) were measured using 1:10 water (or 1N NaOAc) extracts [23].
Total soil carbon and nitrogen content, carbon-to-nitrogen (C/N) ratio, and physicochemical properties of untreated soil near the amelioration test plots are shown in Table 3. Total carbon and nitrogen content after soil amelioration is estimated by using the same bulk density of the untreated soil before amelioration in Table 3. The carbon, nitrogen, phosphorus, and potassium content of pig manure were 11.2% dry matter, 10.1 g kg−1 dry matter, 10.5 g kg−1 dry matter, and 11.0 g kg−1 dry matter, respectively [45]. Thus, the dry matter of pig manure was 63.9%, and the carbon, nitrogen, phosphorus, and potassium content of the applied pig manure were 2.15, 0.194, 0.201, and 0.211 tha−1, respectively. Therefore, C/N ration of pig manure was 11.1.
The carbon and nitrogen content, and the physicochemical properties of CBB ash A and B are shown in Table 4.
2.4. Quantification of Increased Total Carbon and Nitrogen Content According to Soil Amelioration Test
In the soil amelioration test plots for F1, F2, F3, and F4, the increase in carbon and nitrogen due to soil amelioration with the input of CBB ash was calculated using Equations (1) and (2), respectively.
where:
- ∆CAM_CBB (tCha−1): change in the carbon increase alongside the soil amelioration test with CBB ash.
- CAFT_S (tCha−1): soil carbon content in soil at plow layer (0–15 cm) after harvest of maize.
- CCONT_S (tCha−1): soil carbon content in soil at plow layer (0–15 cm) of control plot (0%) after harvest of maize.
- CCBB (tCha−1): carbon content in the application quantity of CBB ash A or CBB ash B.
- ∆NAM_CBB (tha−1): change in the nitrogen increase alongside the soil amelioration test with CBB ash.
- NAFT_S (tha−1): soil nitrogen content in soil at plow layer (0–15 cm) after harvest of maize.
- NCONT_S (tha−1): soil nitrogen content in soil at plow layer (0–15 cm) of control plot (0%) after harvest of maize.
- NCBB (tha−1): nitrogen content in the application quantity of CBB ash A or CBB ash B.
Next, in the soil amelioration test plots for F1, F2, F3, and F4, the increase in carbon and nitrogen due to soil amelioration with both CBB ash and pig manure was calculated using Equations (3) and (4), respectively.
where:
- ∆CAM_CBBPM (tCha−1): change in the carbon increase alongside the soil amelioration test with CBB ash and pig manure.
- CAFT_S (tCha−1): soil carbon content in soil at plow layer (0–15 cm) after harvest of maize.
- CORIG_S (tCha−1): soil carbon content in untreated soil at plow layer (0–15 cm) prior to amelioration.
- CCBB (tCha−1): carbon content in the application quantity of CBB ash A or CBB ash B.
- CPM (tCha−1): carbon content in the application quantity of pig manure.
- ∆NAM_CBBPM (tha−1): change in the nitrogen increase alongside the soil amelioration test with CBB ash and pig manure.
- NAFT_S (tha−1): soil nitrogen content in soil at plow layer (0–15 cm) after harvest of maize.
- NORIG_S (tha−1): soil nitrogen content in untreated soil at plow layer (0–15 cm) prior to amelioration.
- NCBB (tha−1): nitrogen content in the application quantity of CBB ash A or CBB ash B.
- NPM (tha−1): nitrogen content in the application quantity of pig manure.
2.5. Data Analysis
Analysis of variance was used to determine the significant differences among different treatments. Dunnett’s multiple comparison method was used to calculate the minimum significant differences between control and treatment means. The SPSS Statistics software package version 25.0 (SPSS Inc., Chicago, IL, USA) was employed for the statistical analysis of data processing. Comparison and correlation analyses at a significance level of 0.05 were conducted using SPSS 25.0.
3. Results and Discussion
3.1. Changes in Soil Carbon and Nitrogen Content as per the Application Rate in Test Fields (F1–F4)
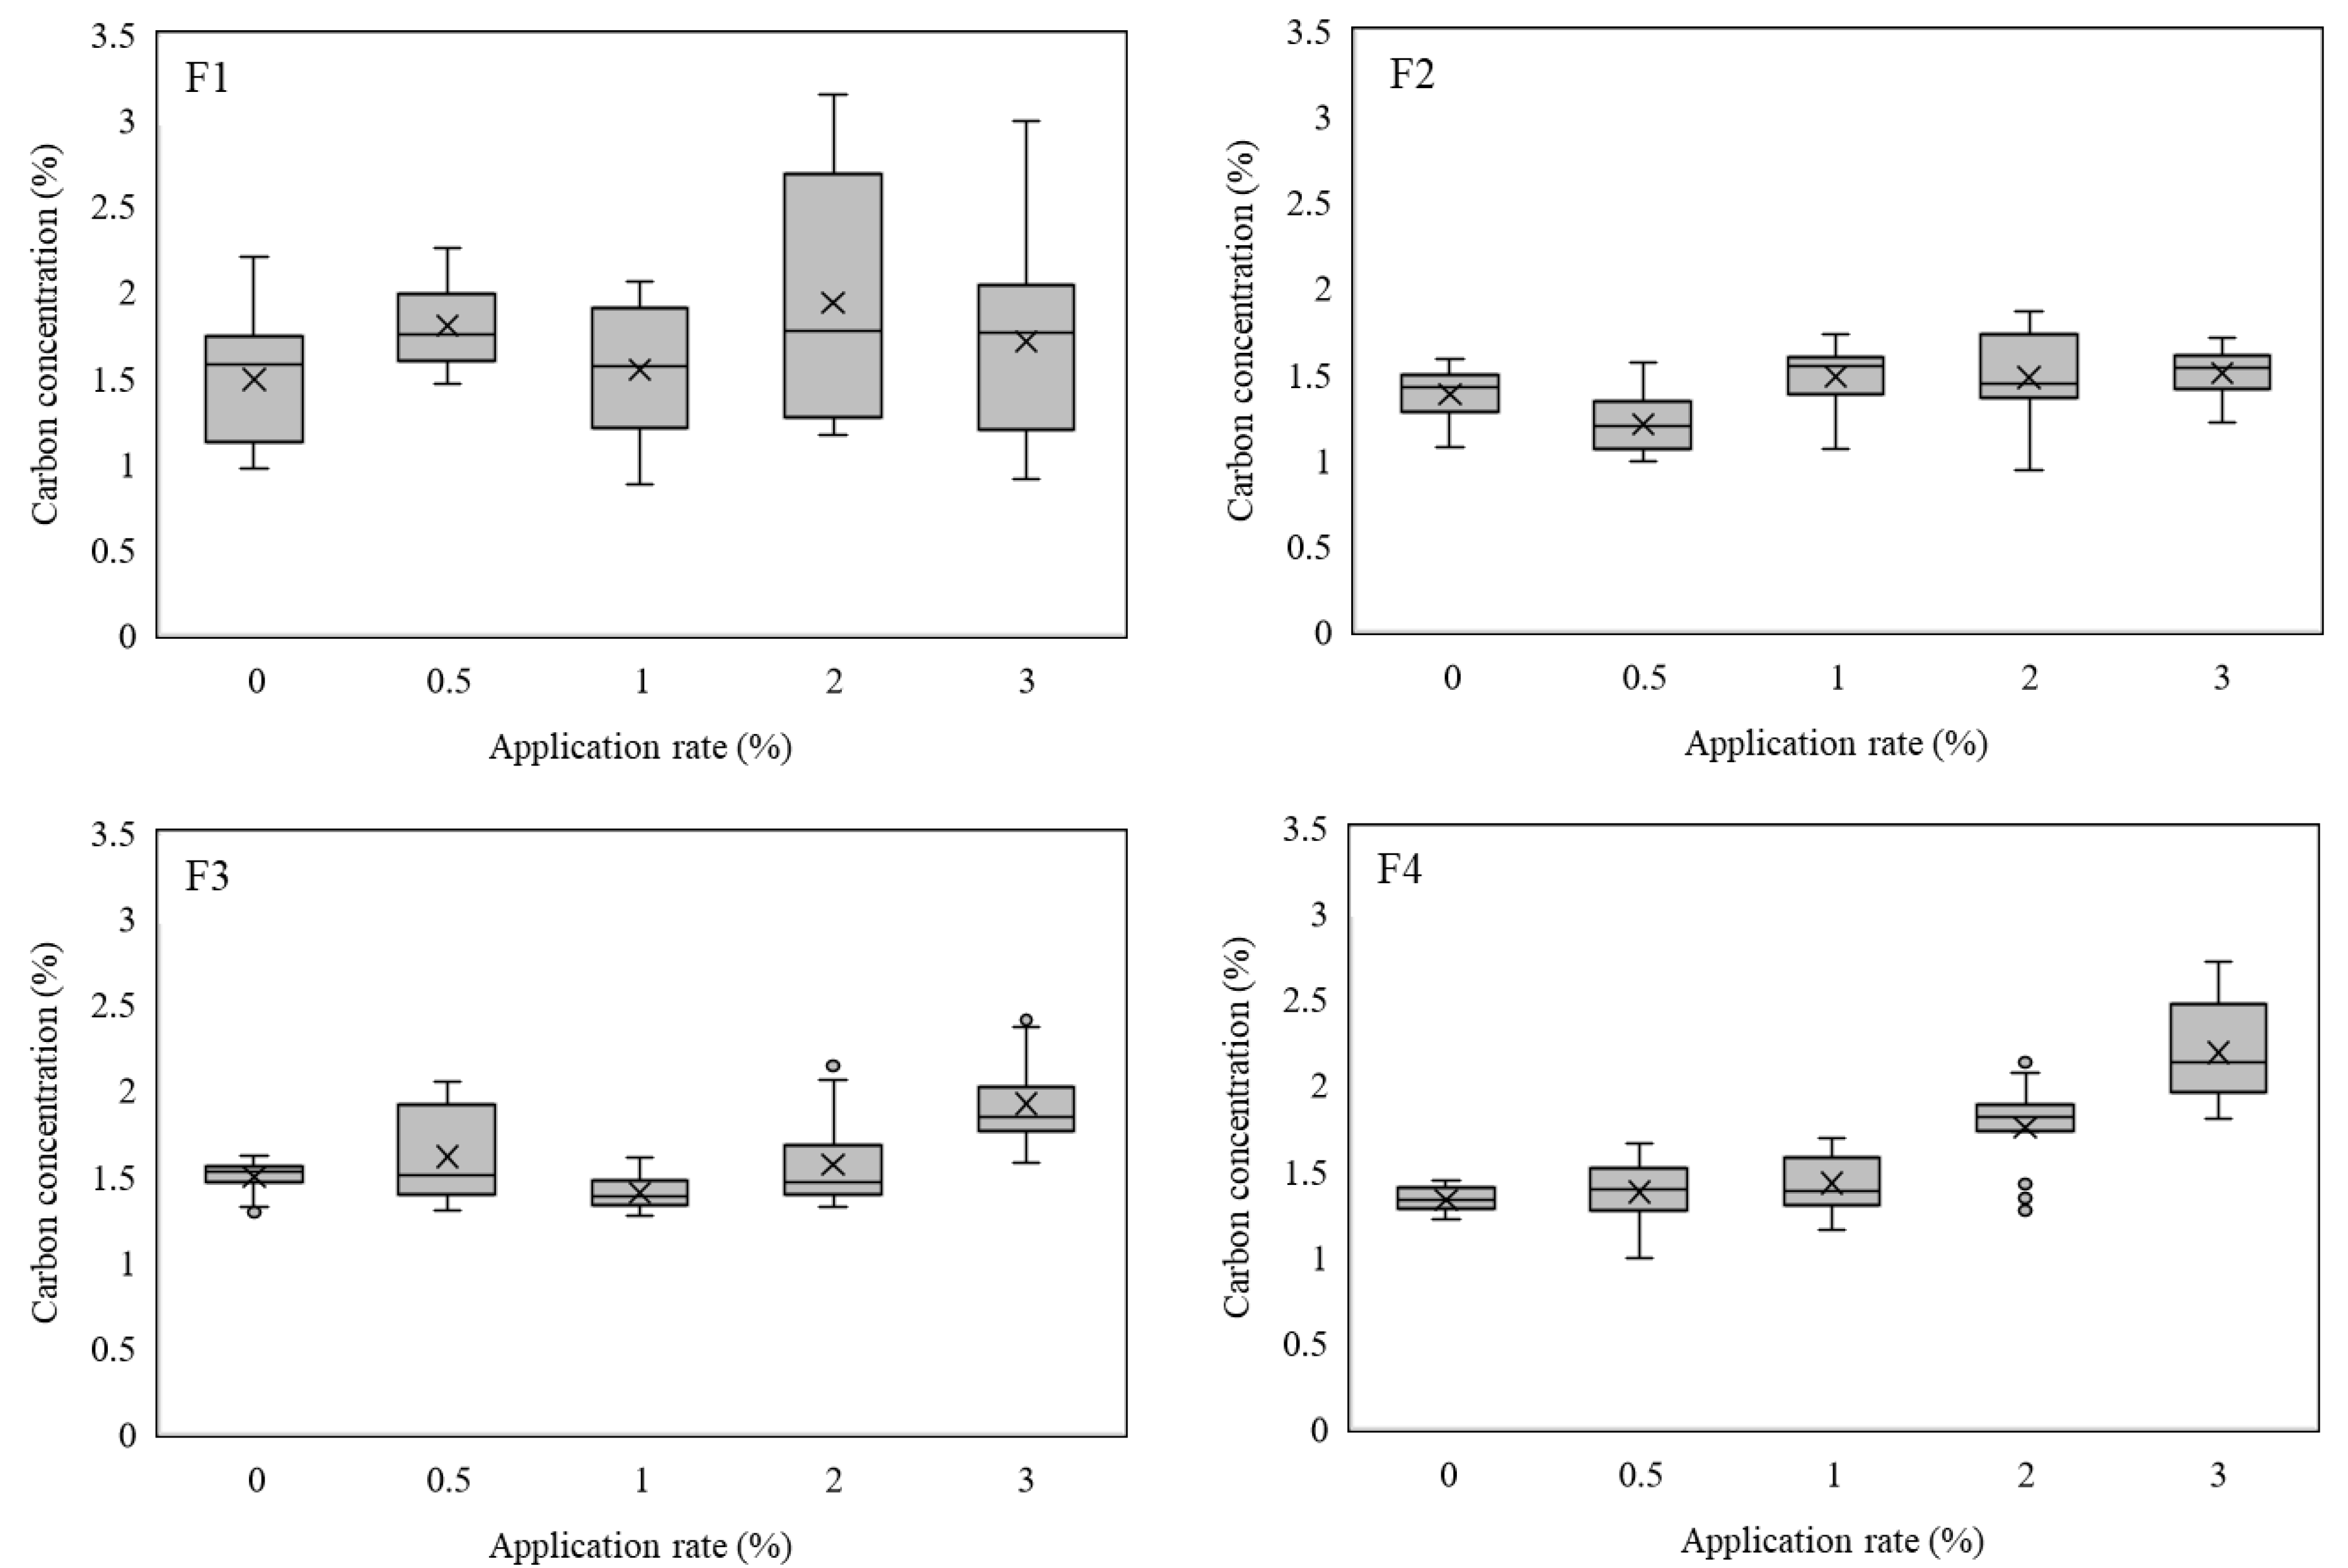
Changes in soil carbon content according to the application rate in F1, F2, F3, and F4 are shown in Figure 1. In Figure 1, Figure 2 and Figure 3, boxes represent interquartile ranges, the horizontal line within the box indicates the median, and the cross mark indicates the mean, whiskers are the 5th and 95th percentiles, and the points are outliers. An increase in carbon content alongside an increase in application rate could not be confirmed for F1 and F2 (Figure 1). However, there were differences between the two groups, such as 0% and 3.0%, 1.0% and 3.0%, and 2.0% and 3.0% in F3 (Figure 1). In F4, there were differences between other groups in the case of 2.0% and 3.0% (Figure 1). These results indicated an increase in carbon content when CBB ash B was used as a soil amendment. There was a larger amount of carbon in CBB ash B compared to CBB ash A (Table 4).
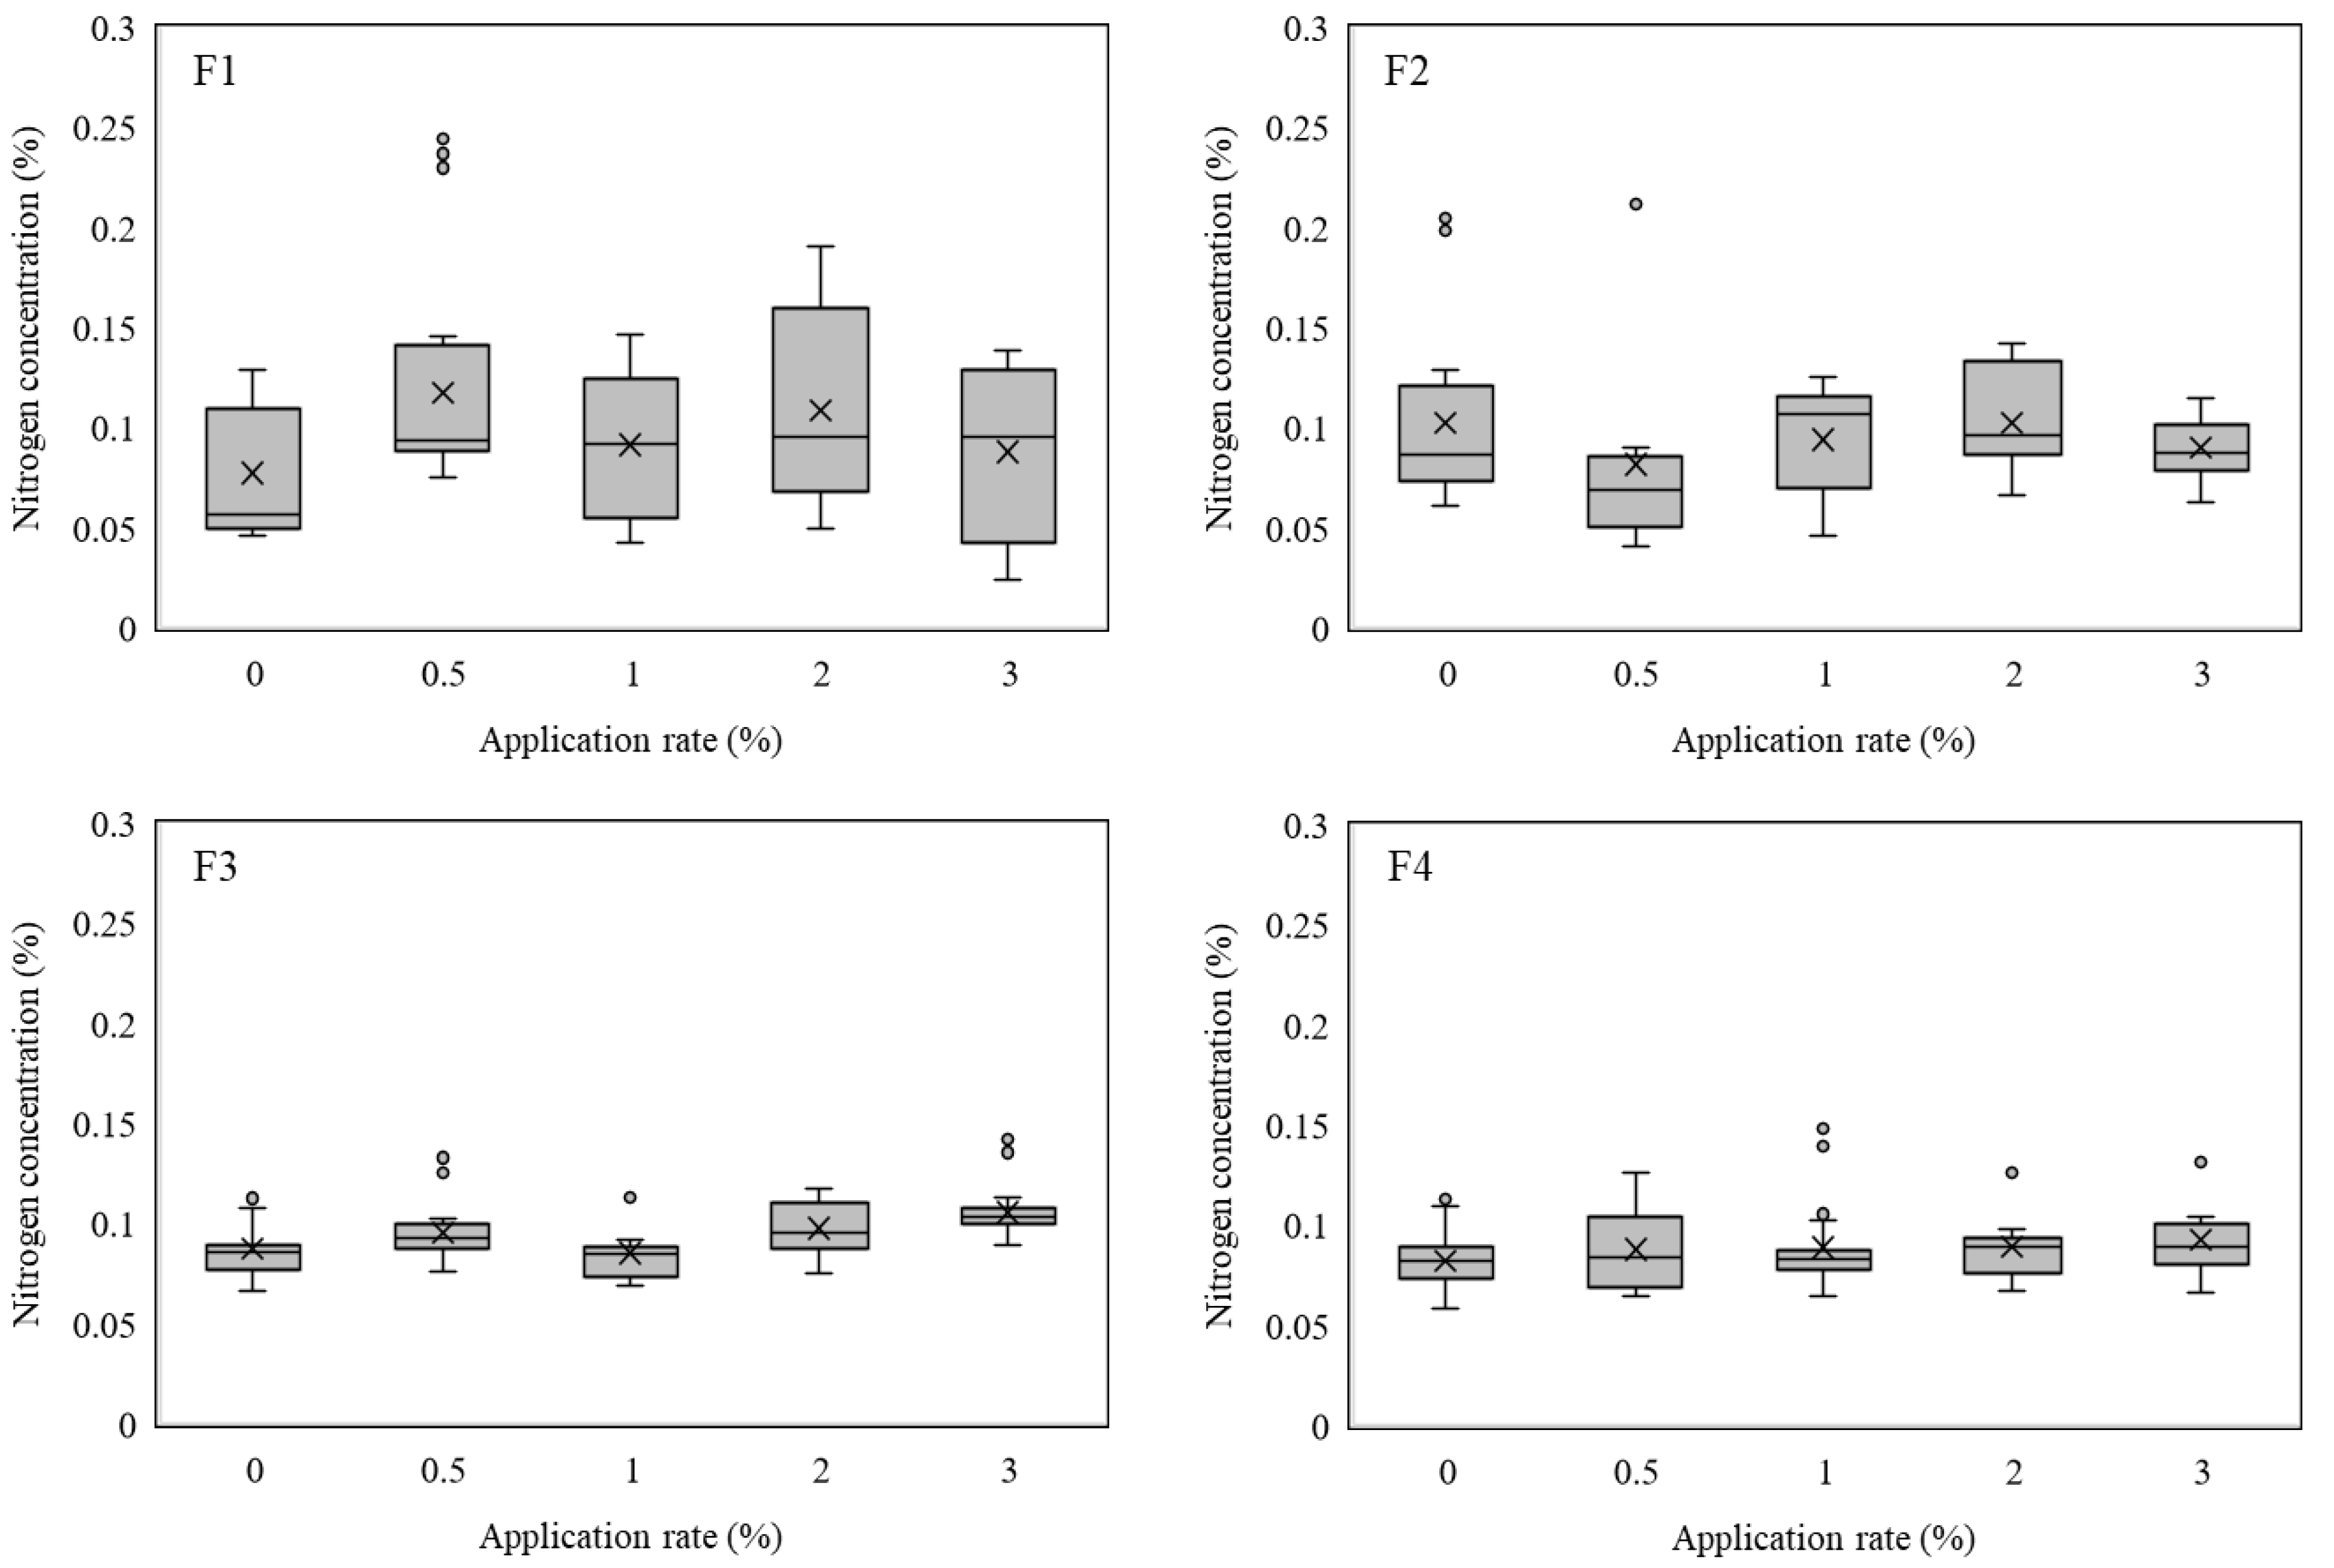
Changes in soil nitrogen content alongside the application rates in F1, F2, F3, and F4 are shown in Figure 2. Considering carbon content alongside application rate, no differences were observed among the application rates for F1 and F2 (Figure 2). In F3, the difference between 0% and 3.0%; and 1.0% and 3.0% was confirmed (Figure 2). Unlike carbon content, in the case of nitrogen content, there was no difference among the application rates applied for F4 (Figure 1 and Figure 2). Since the nitrogen content in CBB ash A and B was lower than in pig manure (Table 4), the application of CBB ashes had little effect on the increase and/or decrease of nitrogen content following soil amelioration. The nitrogen content in CBB ashes was lower than in pig manure. Most nitrogen in pig manure is in organic form that is mineralized by the microbial population to mineral nitrogen such as nitrate and ammoniacal form. However, the nitrogen content following soil amelioration in F1 and F3 took on a slightly greater value than in F2 and F4, respectively (Figure 2). This result indicates the necessity of additional fertilizer.
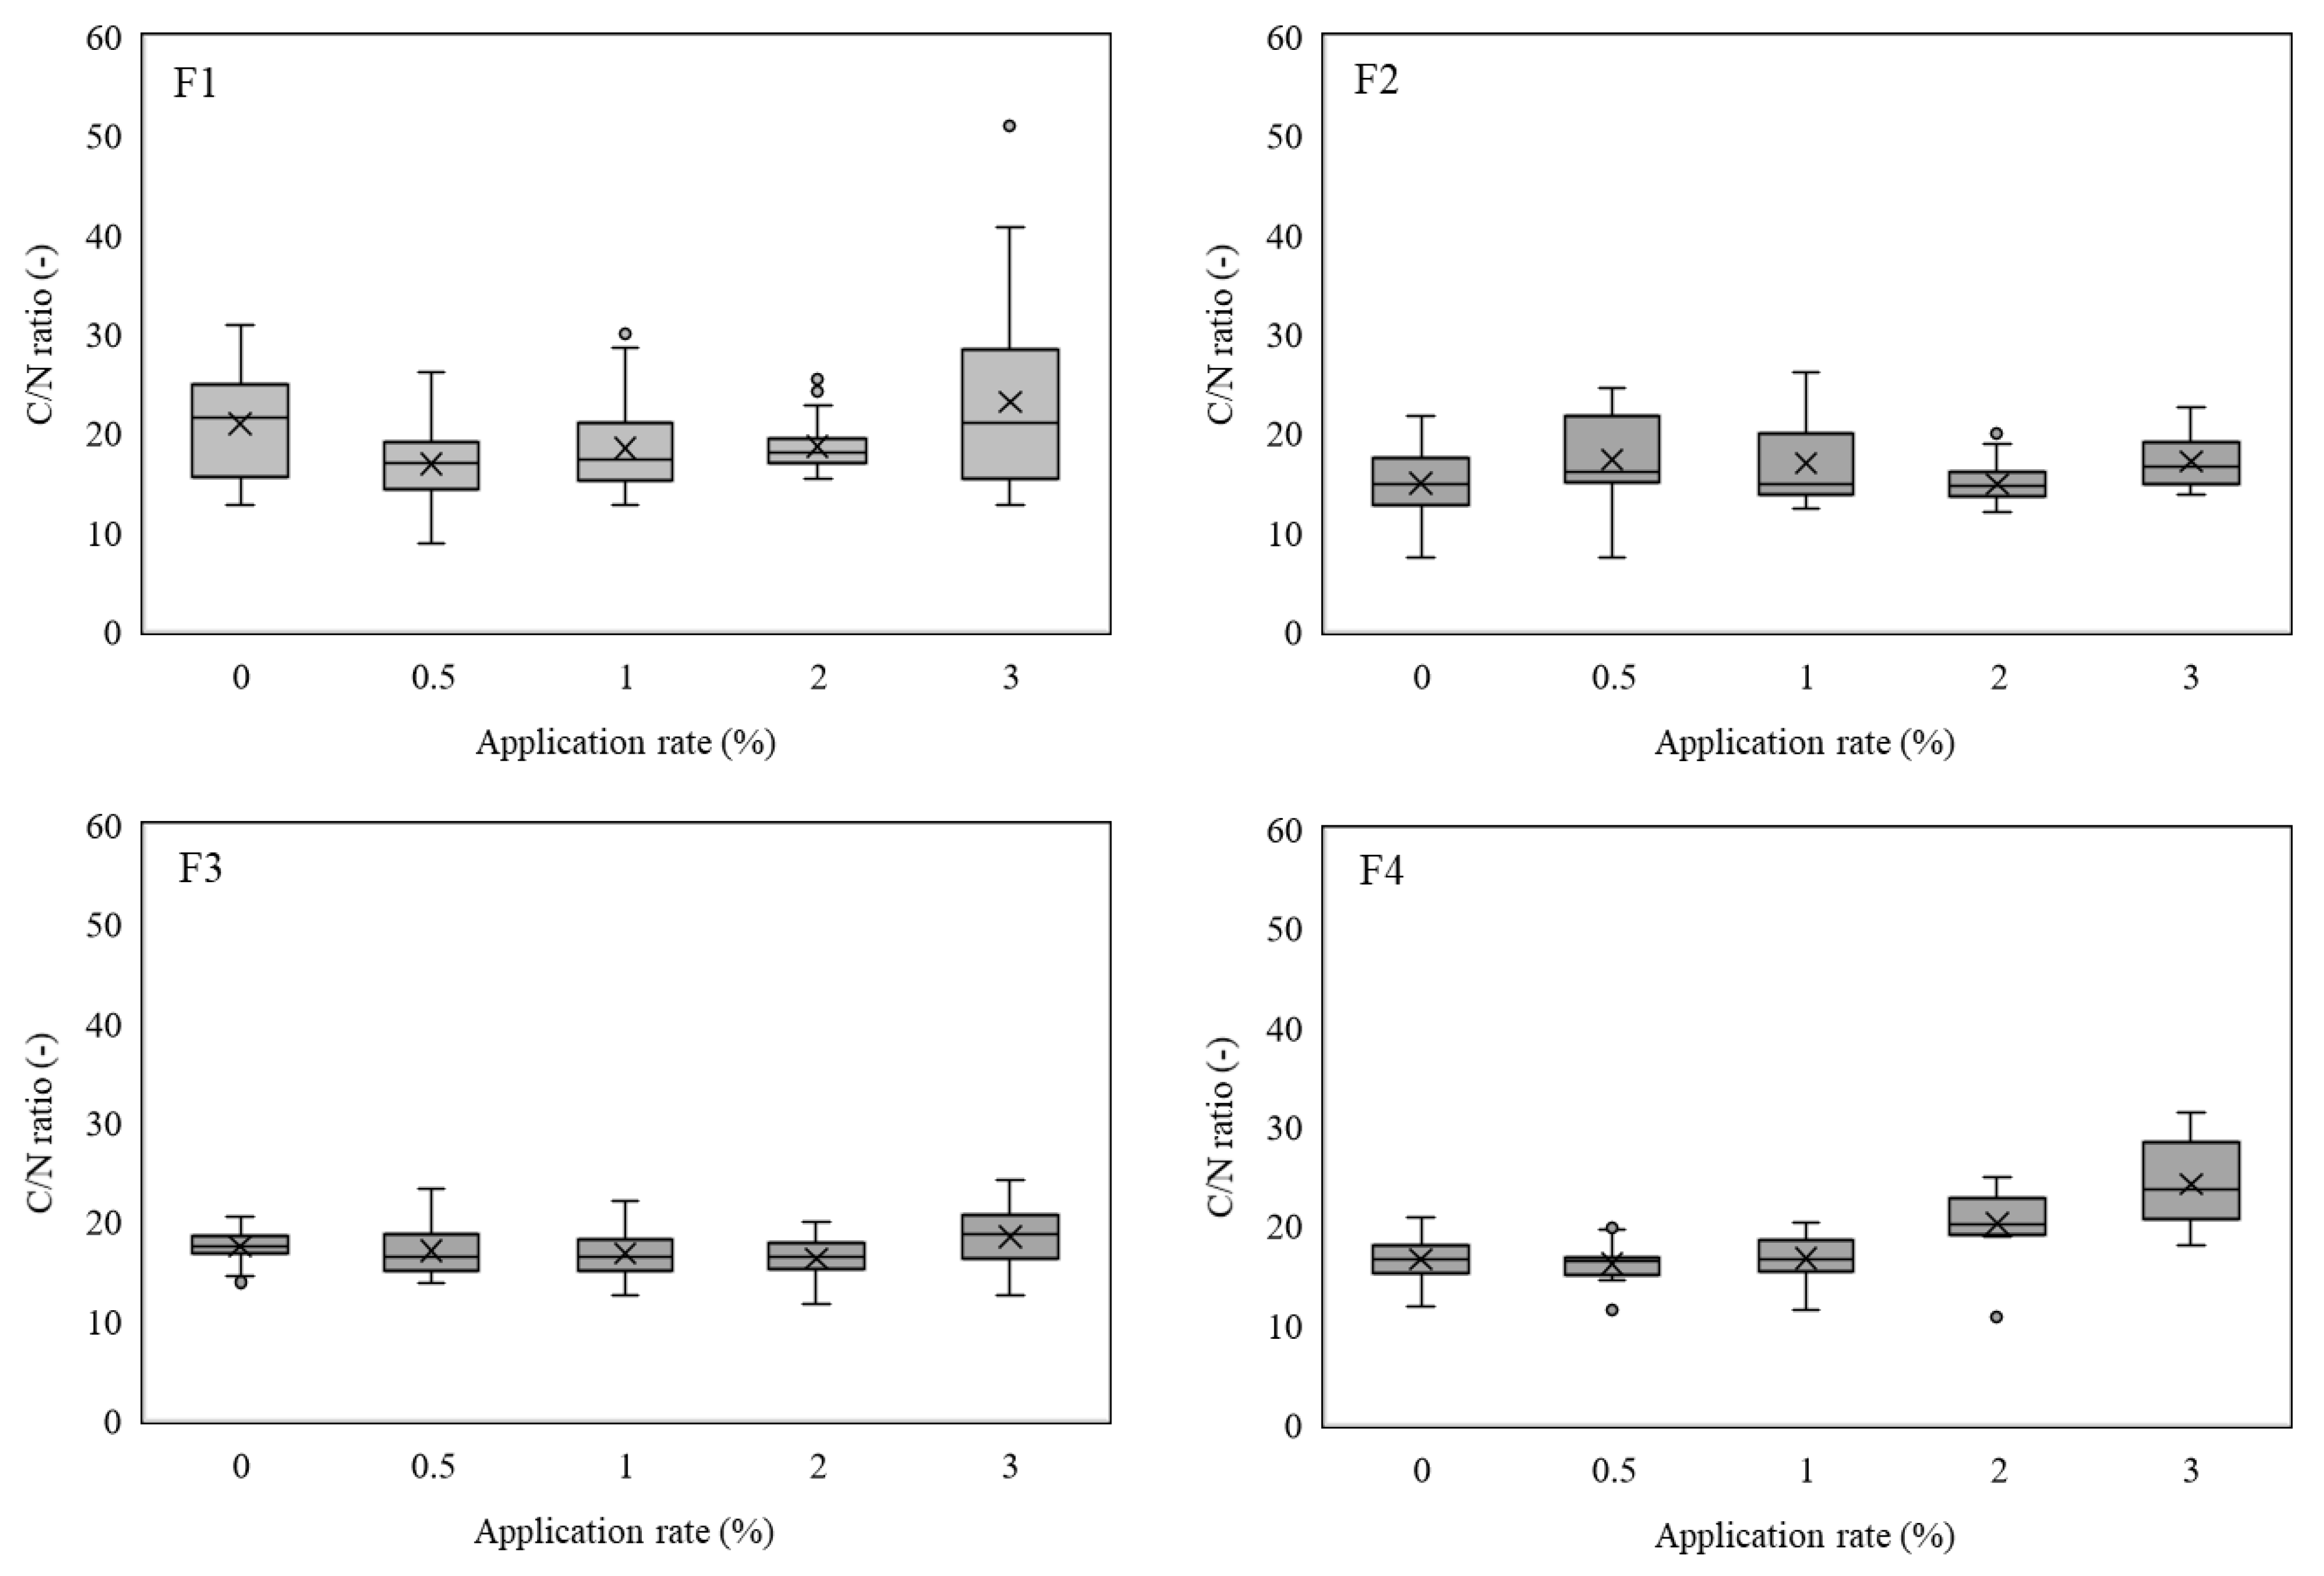
Finally, changes in soil C/N ratio alongside application rates in F1, F2, F3, and F4 are shown in Figure 3. The C/N ratio in CBB ash A, B, and in pig manure took a different value, respectively (Table 4). However, no differences were observed among each application rate in F1, F2, and F3 (Figure 3). In the case of F4, differences were observed between both 2.0% and 3.0% applications, compared to three application rates of 0%, 0.5%, and 1.0% (Figure 3). This phenomenon was similar to the carbon content results (Figure 1), and, therefore, indicates the possibility of carbon content in CBB ashes.
3.2. Quantification of Increased Total Carbon and Nitrogen Content According to Soil Amelioration Test
Changes in total carbon and nitrogen content according to soil amelioration using CBB ash and pig manure in salt-affected soil were estimated. At first, in the soil amelioration test plots for F1, F2, F3, and F4, the increase in carbon and nitrogen due to soil amelioration with the input of CBB ash was calculated using Equations (1) and (2), respectively.
Total carbon content after soil amelioration in F1, F2, F3, and F4 are indicated from roughly 27.7 tCha−1 to 50.2 tCha−1 (Table 5). Moreover, total nitrogen content after soil amelioration in F1, F2, F3, and F4 are indicated from roughly 1.77 tha−1 to 2.68 tha−1 (Table 6). In addition, changes in carbon and nitrogen content between 0% (untreated) application plot and other CBB ash application plots were calculated (Table 5 and Table 6). Consequently, the increase in carbon content in the case of 0.5% in F1, 3.0% in F3, and 2.0% and 3.0% in F4, and the decrease in carbon content in the case of 0.5% in F2 and 1.0% in F3 were confirmed (Table 5). These carbon contents increased by 8.4 ± 3.9 tCha−1, 7.5 ± 7.1 tCha−1, 9.2 ± 1.9 tCha−1, and 15.7 ± 7.4 tCha−1, and decreased by 4.8 ± 2.5 tCha−1 and 4.0 ± 2.2 tCha−1, respectively (Table 5). Next, in case of nitrogen, the increase in the case of 0.5% in F1 and 3.0% in F3 were confirmed, their nitrogen contents increased by 1.72 ± 0.94 tha−1 and 0.43 ± 0.19 tha−1, respectively (Table 6). Therefore, the carbon content in case of 3.0% application rate in CBB ash B in F3 and F4 increased by 21.9% and 51.5% compared to control plot (Table 5). This drastic increase was caused by the higher carbon content and higher exchangeable Ca content in CBB ash B compared to CBB ash A (Table 4). In addition, the increase in nitrogen content in case of 3.0% application rate in CBB ash B in F3 only increased by 21.5% compared to control plot (Table 6). This tendency is presumed to be caused by interaction due to the simultaneous application in CBB ash and organic manure.
The total SOC pool in the top 0.3 m was estimated to account for 54% of the carbon stock in the top 1 m soil layer [46]. The average C content for agricultural soils was 83.4 tCha−1 in the top 1 m and 41.6 tCha−1 in the top 0.3 m [47]. Thus, this was roughly estimated as 20.8 tCha−1 for a depth range of 0–0.15 m. SIC storages were reported as 4.6 and 10.6 Pg for a depth range of 0–0.1 m and 0.1–0.3 m, for an area of 3.44 × 10⁶ km2 [48], and could therefore be estimated as roughly 21.1 tCha−1 for a depth range of 0–0.15 m. Total soil carbon was calculated as roughly 41.9 tCha−1 from the estimated values for both SOC and SIC. Therefore, 44.4 tCha−1 at an application rate of 2.0% in F1 and 44.0 and 50.2 tCha−1, at an application rate of 3.0% in F3 and F4, indicated higher soil carbon values than the estimated average values (Table 5).
Next, in the soil amelioration test plots for F1, F2, F3, and F4, the increase in carbon and nitrogen due to soil amelioration with both CBB ash and pig manure was calculated using Equations (3) and (4), respectively.
Total carbon and nitrogen content in original (untreated) soil was 15.1 tCha−1 and 0.470 tha−1, respectively (Table 3). In case of pig manure application only (0% in Table 7), average values in changes in carbon and nitrogen in soil were about 16.3 tCha−1 and 1.43 tha−1, respectively. Pig manure application only could contribute to increases in carbon and nitrogen content in soil and corn growth [23]. Changes indicated in total carbon content after soil amelioration in F1, F2, F3, and F4 ranged roughly from 12.1 tCha−1 season−1 to 31.9 tCha−1 season−1 (Table 7). In F1, F2, F3, and F4, drastic increases in total carbon content was confirmed at an application rate of 3.0% in F3, and 2.0% and 3.0% in F4 (Table 5). Given the estimates for the SOC stock top 1 m soil layer, the required national sequestration rate according to the 4 per 1000 initiative is 360 Mtyear−1, corresponding to 0.41 tCha−1. The C stocks in dry croplands was 10.1 Gt (80 tha−1), indicating required sequestration rates of 40 Mtyear−1 (0.33 tCha−1 year−1 = 0.14 tCha−1 season−1) [2]. Accordingly, changes in carbon levels due to the application of CBB ashes in dry untreated soil ranged between roughly 88 to 232 times. In the case of the F4 application test, changes in carbon sequestration in a 3.0% application plot was roughly twice that of the control plot (Table 7). In the case of nitrogen, the increase in total content could not be confirmed as for carbon. However, this tendency was similar to changes effected in soil carbon and nitrogen content, according to the application rate effected for test fields (Figure 1, Figure 2 and Figure 3). This indicated that CBB ash contributed to carbon application and pig manure supply as a form of N fertilization in the case of all test plots.
3.3. Relationship between Soil Carbon and Nitrogen Content and Soil Chemical Properties in Field Experiments
Correlation coefficients and levels of significance (* significant at p < 0.05; ** significant at p < 0.01) among carbon, nitrogen, C/N ratio, application rate, corn production, and soil chemical properties (pH, EC, SAR, ESP, and soluble ions) were calculated (Table S1). The result for carbon (Table 8) shows a positive correlation for corn production and nitrogen content, and a negative correlation for pH, Na+, Cl−, sodium adsorption ratio (SAR), exchangeable sodium percentage (ESP) and C/N ratio for all fields (F1, F2, F3, and F4). The positive correlation between carbon content, corn production, and nitrogen resulted from the application of both CBB ash and pig manure at levels higher than soil carbon content (Table 3 and Table 4). Moreover, inorganic soil carbon in the form of carbonates is frequently present in sodic and saline-sodic soils. Revegetation of these areas with trees or crops, which can enhance the dissolution of SIC, has facilitated soil reclamation in areas where vegetation can tolerate adverse soil conditions [49], and where there is the potential for accumulating SOC. The increase in carbon content alongside a decrease in soil pH was caused primarily by CaCO3 dissolution. In addition, CO2 from plant root respiration dissolved in soil solutions increasing the partial pressure of CO2 due to microbial decomposition processes, which also caused a decrease in pH through the production of H2CO3. Furthermore, H+ is also released from plant roots. These processes facilitate the dissolution of carbonate minerals, including CaCO3, which increases the concentration of Ca2+ and displaces exchangeable Na+ [50,51]. Decomposition of the added manure caused an increase in the partial pressure of CO2, which increased the solubility of CaCO3.
The increase in carbon content as a result of a decrease in Na+, SAR, and ESP resulted from salt-affected soil amelioration reactions replacing exchangeable Na+ with Ca2+ at the cation exchange sites of colloids [52,53]. In addition, the decline in Na+ may have been caused by adsorption on clay soil surfaces and/or CBB ash. High Na+ concentrations can also cause rapid desorption of SOC adsorbed on clay surfaces, by altering the exchange site composition, while increasing the electrical conductivity (EC) can cause soils to flocculate, thus offsetting the sodicity effect [54]. Furthermore, a Cl− decrease was indicated as one of the reasons for an increase in carbon. Carbon mineralization decreased alongside increasing salinity, due to decreased microbial activity [55]. Increasing levels of salinity also decreased soil enzyme activity [56], as well as the inhibition of enzymatic and microbial activities with NaCl, rather than with CaCl2 or Na2SO4 [57].
The positive correlation between carbon content and application rates for F2, F3, and F4 are shown in Table 8. The high correlation coefficient (r = 0.832, p < 0.01) in F4 was confirmed (Table 8). In F3 and F4, the decrease in HCO3− and CO32− may have potentially increased carbon content. Losses in total C increased during decomposition of organic material, alongside increasing concentrations of Na2CO3 [58]. With increasing Na2CO3 concentrations, exchangeable Na+ increased, resulting in a higher ESP; while pH increased as a result of rising CaCO3 and MgCO3 levels, resulting in a decline in SOC. This phenomenon indicated the tendency of Ca2+ and Mg2+ to increase alongside a decline in pH and an increase in carbon. CBB ash is considered a direct source of mineral nutrients including Ca2+, Mg2+, and K+ (Table 4). The high Ca2+ and Mg2+ content released by CBB ash can displace Na+ on the exchange site, further permitting Na+ leaching and lower salinity, and thereby enhancing soil structure stability and characteristics [23].
Next, the negative correlation of pH, Na+, Cl−, SAR, ESP, and C/N ratio with nitrogen is shown in Table 9 using Pearson’s correlation coefficient. As with the relationship coefficient in the case of carbon (Table 8), changes in the primary soil chemical properties related to salt-affected soil improvement indicated a relationship with increases in nitrogen. Moreover, according to Pearson’s correlation coefficient, the positive links between pH, Na+, Cl−, SAR, and ESP with C/N ratio are shown in Table 10. This result indicated that salt-affected soil had the highest C/N ratio prior to soil amelioration changes, where increased application rates aimed to lower the ratio.
4. Conclusions
Application of CBB ash and pig manure to salt-affected soil indicated soil carbon and nitrogen sequestration, compared to untreated soil prior to amelioration. The effect on soil carbon sequestration was high in case of CBB ash with higher carbon and higher exchangeable Ca. Total carbon storage at an application rate of 3.0% in the CBB ash indicated a higher than the estimated average value by references. Moreover, changes in carbon levels due to the application of CBB ash were significant, compared to dry croplands. Pig manure as an organic fertilizer was complimentary in terms of supplementing a shortage in nitrogen in CBB ash. These CBB ashes could be considered safe for use as soil amendment on salt-affected soil in our previous research. However, in case of using other CBB ash, it is necessary to check the heavy metal content and examine the application rate in pig manure. Changes in carbon content due to soil amelioration had a significant relationship with changes in corn production and soil chemical properties, such as pH, Na+, Cl−, SAR, and ESP in salt-affected soil amelioration. Therefore, CBB production from low-ranked coal and waste biomass, and the use of CBB ash in agriculture is advocated as an effective means for sequestering carbon and reducing GHG from soils.
Supplementary Materials
The following are available online at https://0-www-mdpi-com.brum.beds.ac.uk/2075-163X/10/11/1019/s1, Table S1: Mean values in corn production, soil chemical properties, carbon, nitrogen, and C/N after harvest of maize with different application rate in F1, F2, F3, F4, and F1–4.
Author Contributions
Conceptualization, validation, writing—review and editing, visualization, supervision, project administration and funding acquisition; Y.S.; methodology, formal analysis and writing—original draft preparation, Y.S., M.N., and C.W. All authors have read and agreed to the published version of the manuscript.
Funding
This research was funded by the Strategic Research Cooperative Program of JST (Japan Science and Technology Agency) and JSPS KAKENHI Grant Number JP16K00603.
Acknowledgments
We would like to express our appreciation to Dan Liu and Hong Yan for their assistance in this experiment and investigation.
Conflicts of Interest
The authors declare no conflict of interest.
References
- IPCC. Climate Change 2014: Synthesis Report. In Contribution of Working Group I, II, and III to the Fifth Assessment Report of the Intergovernmental Panel on Climate Change; IPCC: Geneva, Switzerland, 2014. [Google Scholar]
- Minasny, B.; Malone, B.; McBratney, A.B.; Angers, A.D.; Arrouays, D.; Chambers, A.; Chaplot, V.; Chen, Z.-S.; Cheng, K.; Das, B.S.; et al. Soil carbon 4 per mille. Geoderma 2017, 292, 59–86. [Google Scholar] [CrossRef]
- Lal, R.; Lorenz, K.; Hüttl, R.; Schneider, B.; von Braun, J. Ecosystem Services and Carbon Sequestration in the Biosphere; Springer: Dordrecht, The Netherlands, 2013. [Google Scholar]
- Wong, V.N.L.; Greene, R.S.B.; Dalal, R.C.; Murphy, B.W. Soil carbon dynamics in saline and sodic soils: A review. Soil Use Manag. 2010, 26, 2–11. [Google Scholar] [CrossRef]
- Rengasamy, P. World salinization with emphasis on Australia. J. Exp. Bot. 2006, 57, 1017–1023. [Google Scholar] [CrossRef] [PubMed] [Green Version]
- Zhao, Y.; Wang, S.; Li, Y.; Liu, J.; Zhuo, Y.; Zhang, W.; Wang, J.; Xu, L. Long-term performance of flue gas desulfurization gypsum in a large-scale application in a saline-alkali wasteland in northwest China. Agric. Ecosyst. Environ. 2018, 261, 115–124. [Google Scholar] [CrossRef]
- Song, G.H.; Li, L.Q.; Pan, G.X. Topsoil organic carbon storage of China and its loss by cultivation. Biogeochemistry 2005, 74, 47–62. [Google Scholar] [CrossRef]
- Cheng, K.; Zheng, J.; Nayak, D.; Smith, P.; Pan, G. Reevaluating biophysical and technologically attainable potential of topsoil carbon sequestration in China’s croplands. Soil Use Manag. 2013, 29, 501–509. [Google Scholar] [CrossRef]
- Sun, W.; Huang, Y.; Zhang, W.; Yu, Y. Carbon sequestration and its potential in agricultural soils of China. Global Biogeochem. Cy. 2010, 24, 1302–1307. [Google Scholar] [CrossRef]
- Lu, B.; Kong, S.; Han, B.; Wang, X.; Bai, Z. Inventory of atmospheric pollutants discharged from biomass burning in China continent in 2007. China Environ. Sci. 2011, 31, 186–194. [Google Scholar]
- Liu, C.; Chung, C.E.; Zhang, F.; Yin, Y. The colors of biomass burning aerosols in the atmosphere. Sci. Rep. 2016, 6, 28267. [Google Scholar] [CrossRef]
- National Bureau of Statistics. National Economy and Social Development Statistic Bulletin; National Bureau of Statistics of the People’s Republic of China: Beijing, China, 2016; (In Chinese). Available online: http://www.stats.gov.cn/tjsj/zxfb/201602/t20160229_1323991.html (accessed on 21 December 2019).
- Chen, Y.; Zhi, G.; Feng, Y.; Tian, C.; Bi, X.; Li, J.; Zhang, G. Increase in polycyclic aromatic hydrocarbon (PAH) emissions due to briquetting: A challenge to the coal briquetting policy. Environ. Pollut. 2015, 204, 58–63. [Google Scholar] [CrossRef]
- Li, H.M.; Zhao, X.F.; Yu, Y.Q.; Wu, T.; Qi, Y. China’s numerical management system for reducing national energy intensity. Energy Policy 2016, 94, 64–76. [Google Scholar] [CrossRef]
- Zhao, C.; Luo, K. Household consumption of coal and related sulfur, arsenic, fluorine and mercury emissions in China. Energy Policy 2018, 112, 221–232. [Google Scholar] [CrossRef]
- Sun, J.; Zhi, G.; Hitzenberger, R.; Chen, Y.; Tian, C.; Zhang, Y.; Feng, Y.; Cheng, M.; Zhang, Y.; Cai, J.; et al. Emission factors and light absorption properties of brown carbon from household coal combustion in China. Atmos. Chem. Phys. 2017, 17, 4769–4780. [Google Scholar] [CrossRef] [Green Version]
- Onukak, I.E.; Mohammed-Dabo, I.A.; Ameh, A.O.; Okoduwa, S.I.; Fasanya, O.O. Production and characterization of biomass briquettes from tannery solid waste. Recycling 2017, 2, 17. [Google Scholar] [CrossRef]
- Brunerová, A.; Roubík, H.; Brožek, M.; Haryanto, A.; Hasanudin, U.; Iryani, D.A.; Herák, D. Valorization of bio-briquette fuel by using spent coffee ground as an external additive. Energies 2020, 13, 54. [Google Scholar] [CrossRef] [Green Version]
- Kpalo, S.Y.; Zainuddin, M.F.; Manaf, L.A.; Roslan, A.M. A review of technical and economic aspects of biomass briquetting. Sustainability 2020, 12, 4609. [Google Scholar] [CrossRef]
- Sakai, Y.; Nakano, S.; Wang, C.; Kito, H. Evaluation of SO2 emissions and health effects following the installation of desulfurization facilities and coal bio-briquette technology in China. J. Chem. Eng. Jpn. 2015, 48, 491–497. [Google Scholar] [CrossRef]
- Sakai, Y.; Seto, H.; Nagamoto, H. Evaluation of salt transport in the amelioration of salt-affected soil in China by using low-quality coal bio-briquette ash. J. Arid Land Stud. 2014, 24, 81–84. [Google Scholar]
- Sakai, Y.; Murata, H.; Ebato, C.; Liu, D.; Wang, C.; Nagamoto, H.; Sadakata, M. Salt-affected soil amelioration with low-quality coal bio-briquette ash in northeastern China. J. Arid Land Stud. 2015, 25, 93–96. [Google Scholar]
- Sakai, Y.; Shimizu, C.; Murata, H.; Seto, H.; Fukushima, R.; Koga, T.; Wang, C. Changes in soil physicochemical properties and maize production following improvement of salt-affected soils using coal bio-briquette ash in northeast China. Agronomy 2020, 10, 348. [Google Scholar] [CrossRef] [Green Version]
- Singh, B.; Singh, B.P.; Cowie, A.L. Characterization and evaluation of biochars for their application as a soil amendment. Soil Res. 2010, 48, 516–525. [Google Scholar] [CrossRef]
- Lei, O.; Zhang, R. Effects of biochars derived from different feedstocks and pyrolysis temperatures on soil physical and hydraulic properties. J. Soils Sediments 2013, 13, 1561–1572. [Google Scholar] [CrossRef]
- Bhaduri, D.; Saha, A.; Desai, D.; Meena, H.N. Restoration of carbon and microbial activity in salt-induced soil by application of peanut shell biochar during short-term incubation study. Chemosphere 2016, 148, 86–98. [Google Scholar] [CrossRef] [PubMed]
- Mia, S.; Dijkstra, F.A.; Singh, B. Long-term ageing of biochar: A molecular understanding with agricultural and environmental implications. Adv. Agron. 2017, 141, 1–51. [Google Scholar]
- Chaganti, V.N.; Crohn, D.M.; Šimůnek, J. Leaching and reclamation of a biochar and compost amended saline–sodic soil with moderate SAR reclaimed water. Agric. Water Manag. 2015, 158, 255–265. [Google Scholar] [CrossRef] [Green Version]
- Amini, S.; Ghadiri, H.; Chen, C.; Marschner, P. Salt-affected soils, reclamation, carbon dynamics, and biochar: A review. J. Soils Sediments 2016, 16, 939–953. [Google Scholar] [CrossRef]
- Yu, H.; Zou, W.; Chen, J.; Chen, H.; Yu, Z.; Huang, J.; Tang, H.; Wei, X.; Gao, B. Biochar amendment improves crop production in problem soils: A review. J. Environ. Manage. 2019, 232, 8–21. [Google Scholar] [CrossRef]
- Lehmann, J.; Rillig, M.C.; Thies, J.; Masiello, C.A.; Hockaday, W.C.; Crowley, D. Biochar effects on soil biota—A review. Soil Biol. Biochem. 2011, 43, 1812–1836. [Google Scholar] [CrossRef]
- Xiao, Q.; Zhu, L.X.; Shen, Y.F.; Li, S.Q. Sensitivity of soil water retention and availability to biochar addition in rainfed semi-arid farmland during a three-year field experiment. Field Crops Res. 2016, 196, 284–293. [Google Scholar] [CrossRef]
- Thomas, S.C.; Frye, S.; Gale, N.; Garmon, M.; Launchbury, R.; Machado, N.; Melamed, S.; Murray, J.; Petroff, A.; Winsborough, C. Biochar mitigates negative effects of salt additions on two herbaceous plant species. J. Environ. Manage. 2013, 129, 62–68. [Google Scholar] [CrossRef]
- Raya-Moreno, I.; Cañizares, R.; Domene, X.; Carabassa, V.; Josep, A.M. Comparing current chemical methods to assess biochar organic carbon in a Mediterranean agricultural soil amended with two different biochars. Sci. Total Environ. 2017, 598, 604–618. [Google Scholar] [CrossRef] [PubMed]
- Andrés, P.; Rosell-Melé, A.; Colomer-Ventura, F.; Denef, K.; Cotrufo, M.F.; Riba, M.; Alcañiz, J.M. Belowground biota responses to maize biochar addition to the soil of a Mediterranean vineyard. Sci. Total Environ. 2019, 660, 1522–1532. [Google Scholar] [CrossRef] [PubMed]
- Ilyas, M.; Qureshi, R.H.; Qadir, M.A. Chemical changes in a saline-sodic soil after gypsum application and cropping. Soil Technol. 1997, 10, 247–260. [Google Scholar] [CrossRef]
- Nitta, Y.; Sadakata, M.; Matsumoto, S.; Yoshioka, K. Possible incentive to diffuse desulfurization equipment in China. J. Jpn. Inst. Energy 2006, 85, 191–196. (In Japanese) [Google Scholar]
- Kumar, D.; Singh, B. The use of coal fly ash in sodic soil reclamation. Land Degrad. Dev. 2003, 14, 285–299. [Google Scholar] [CrossRef]
- Silva, F.C.; Cruz, N.C.; Tarelho, L.A.; Rodrigues, S.M. Use of biomass ash-based materials as soil fertilisers: Critical review of the existing regulatory framework. J. Clean. Prod. 2019, 214, 112–124. [Google Scholar] [CrossRef]
- Palumbo, A.V.; McCarthy, J.; Amonette, J.; Fisher, L.; Wullschleger, S.D.; Daniels, W. Prospects for enhancing carbon sequestration and reclamation of degraded lands with fossil-fuel combustion by-products. Adv. Environ. Res. 2004, 8, 425–438. [Google Scholar] [CrossRef]
- Pan, G.; Li, L.Q.; Zheng, J.F.; Cheng, K.; Zhang, X.H.; Zheng, J.W.; Li, Z.C. Benefits of SOM in agro-ecosystems: The case of China. (Chap 27). In Soil Carbon: Science, Management and Policy for Multiple Benefits; Banwart, S., Ed.; CAB International: Wallingford, UK, 2015; Volume 71, pp. 383–401. [Google Scholar]
- Ministry of Agriculture of the People’s Republic China; Reform and Development Commission of China; Ministry of Science and Technology of China; Ministry of Financing of China; Ministry of Land Resource and Territory of China; Ministry of Environment Protection; Ministry of Water Resources of China; National Bureau of Forestry of China. A National Plan of Sustainable Agriculture 2015–2030. Policy Report of Agricultural Panning No. 145. 2015; (In Chinese). Available online: http://www.mof.gov.cn/mofhome/mof/zhengwuxinxi/zhengcefabu/201505/t20150528_1242763.htm (accessed on 21 December 2019).
- FAO. World reference base for soil resources 2014 International soil classification system for naming soils and creating legends for soil maps. World Soil Resour. Rep. 2015, 106, 162–163. [Google Scholar]
- US Salinity Laboratory Staff. Diagnosis and Improvement of Saline and Alkali Soils; US Department of Agriculture Handbook 60; US Government Printing Office: Washington, DC, USA, 1954; p. 5.
- Xu, Y.G.; Yu, W.T.; Ma, Q.; Zhou, H. Potential risk of cadmium in a soil-plant system as a result of long-term (10 years) pig manure application. Plant Soil Environ. 2015, 61, 352–357. [Google Scholar]
- Wang, S.; Huang, M.; Shao, X.; Mickler, R.A.; Li, K.; Ji, J. Vertical distribution of soil organic carbon in China. Environ. Manag. 2004, 33, S200–S209. [Google Scholar] [CrossRef]
- Pan, G.; Xu, X.; Smith, P.; Pan, W.; Lal, R. An increase in topsoil SOC stock of China’s cropland between 1985 and 2006 revealed by soil monitoring. Agric. Ecosyst. Environ. 2010, 136, 133–138. [Google Scholar] [CrossRef]
- Mi, N.; Wang, S.Q.; Liu, J.Y.; Yu, G.R.; Zhang, W.J.; Jobb’agy, E.G. Soil inorganic carbon storage pattern in China. Global Change Biol. 2008, 14, 2380–2387. [Google Scholar] [CrossRef]
- Qadir, M.; Oster, J.D.; Schubert, S.; Noble, A.D.; Sahrawat, K.L.; Donald, L.S. Phytoremediation of sodic and saline-sodic soils. Adv. Agron. 2007, 96, 197–247. [Google Scholar]
- Mishra, A.; Sharma, S.D. Leguminous trees for the restoration of degraded sodic wasteland in Eastern Uttar Pradesh, India. Land Degrad. Dev. 2003, 14, 245–261. [Google Scholar] [CrossRef]
- Qadir, M.; Noble, A.D.; Oster, J.D.; Schubert, S.; Ghafoor, A. Driving forces for sodium removal during phytoremediation of calcareous sodic and saline-sodic soils: A review. Soil Use Manag. 2005, 21, 173–180. [Google Scholar] [CrossRef]
- Oster, J.D.; Frenkel, H. The chemistry of the reclamation of sodic soil with gypsum and lime. Soil Sci. Soc. Am. J. 1980, 44, 41–45. [Google Scholar] [CrossRef]
- Frenkel, H.; Gerstl, Z.; Alperovitch, N. Exchange-induced dissolution of gypsum and the reclamation of sodic soils. J. Soil Sci. 1989, 40, 599–611. [Google Scholar] [CrossRef]
- Shainberg, I.; Letey, J. Response of soils to sodic and saline conditions. Hilgardia 1984, 52, 1–57. [Google Scholar] [CrossRef] [Green Version]
- Pathak, H.; Rao, D.L.N. Carbon and nitrogen mineralization from added organic matter in saline and alkali soils. Soil Biol. Biochem. 1998, 30, 695–702. [Google Scholar] [CrossRef]
- Batra, L.; Manna, M.C. Dehydrogenase activity and microbial biomass carbon in salt-affected soils of semiarid and arid regions. Arid Soil Res. Rehab. 1997, 11, 295–303. [Google Scholar] [CrossRef]
- Frankenberger, W.T.; Bingham, F.T. Influence of salinity on soil enzyme activities. Soil Sci. Soc. Am. J. 1982, 46, 1173–1177. [Google Scholar] [CrossRef]
- Laura, R.D. Effects of sodium carbonate on carbon and nitrogen mineralization of organic matter added to soil. Geoderma 1973, 9, 15–26. [Google Scholar] [CrossRef]
Figure 1.
Box plot graph showing the soil carbon content with different application rate in F1, F2, F3, and F4. (F1: CBB ash A and pig manure; F2: CBB ash A; F3: CBB ash B and pig manure; F4: CBB ash B).
Figure 1.
Box plot graph showing the soil carbon content with different application rate in F1, F2, F3, and F4. (F1: CBB ash A and pig manure; F2: CBB ash A; F3: CBB ash B and pig manure; F4: CBB ash B).

Figure 2.
Box plot graph showing the soil nitrogen content with different application rate in F1, F2, F3, and F4. (F1: CBB ash A and pig manure; F2: CBB ash A; F3: CBB ash B and pig manure; F4: CBB ash B).
Figure 2.
Box plot graph showing the soil nitrogen content with different application rate in F1, F2, F3, and F4. (F1: CBB ash A and pig manure; F2: CBB ash A; F3: CBB ash B and pig manure; F4: CBB ash B).

Figure 3.
Box plot graph showing the soil C/N with different application rate in F1, F2, F3, and F4. (F1: CBB ash A and pig manure; F2: CBB ash A; F3: CBB ash B and pig manure; F4: CBB ash B).
Figure 3.
Box plot graph showing the soil C/N with different application rate in F1, F2, F3, and F4. (F1: CBB ash A and pig manure; F2: CBB ash A; F3: CBB ash B and pig manure; F4: CBB ash B).


Table 1.
Coal analysis results for coal bio-briquettes (CBB) manufacturing.
| Coal | Calorific Value | T-Moisture 1 | Proximate Analysis (% db 2) | Ultimate Analysis (wt% daf 3) | |||||||
|---|---|---|---|---|---|---|---|---|---|---|---|
| (MJ/kg) | (%) | Moisture | Ash | VM 4 | Fixed C | C | H | N | O | S | |
| A | 22.9 | 6.0 | 0.9 | 23.3 | 14.2 | 51.9 | 85.3 | 4.7 | 1.1 | 3.2 | 2.1 |
| B | 8.1 | 3.0 | 1.6 | 70.4 | 11.8 | 17.4 | 68.1 | 5.4 | 1.0 | 3.4 | 4.1 |
1 T-Moisture; Total Moisture; 2 db: Dry Basis; 3 daf; Dry Ash Free; 4 VM: Volatile Matter.
Table 2.
Soil amendments and application rate in the experimental fields [20].
Table 2.
Soil amendments and application rate in the experimental fields [20].
| Field | CBB Ash | Pig Manure 3 | Application Rate (CBB Ash) 4 (tha−1 (%)) |
|---|---|---|---|
| F1 | A 1 | + | 0(0), 11.6(0.5), 23.2(1.0), 46.4(2.0), 69.6(3.0) |
| F2 | A 1 | − | |
| F3 | B 2 | + | |
| F4 | B 2 | − |
1 CBB ash A: ash from coal bio-briquettes (S content in coal A = 2.1%), 2 CBB ash B: ash from coal bio-briquettes (S content in coal B = 4.1%) 3 Application rate of pig manure: 30 tha−1, 4 Three experimental plots at the same application rates (0, 0.5, 1.0, 2.0, and 3.0%) were examined in F1, F2, F3, and F4, respectively.
Table 3.
Soil carbon and nitrogen content, and the physicochemical properties of untreated soil.
| C | N | C/N | Particles | Soil Texture 1 | Bulk Density | pH | CEC | EC | ESP 2 | Soluble Cations and Anions | |||||||||
|---|---|---|---|---|---|---|---|---|---|---|---|---|---|---|---|---|---|---|---|
| Sand | Silt | Clay | Na+ | Ca2+ | Mg2+ | K+ | HCO3− | CO32– | Cl− | SO42– | |||||||||
| (%) | (-) | (%) | (kg m−3) | (-) | (cmol kg−1) | (dS m−1) | (%) | (cmol L−1) | |||||||||||
| 0.66 | 0.0205 | 32.2 | 85.0 | 8.9 | 6.1 | LS | 1530 | 9.7 | 13.3 | 0.30 | 7.2 | 2.57 | 0.24 | 0.11 | 0.02 | 0.70 | 0.09 | 0.09 | 0.20 |
Table 4.
Carbon and nitrogen content, and physicochemical properties of CBB ash A and B.
| CBB Ash | C | N | C/N | Diameter (%) | pH | EC | CEC | ESP 1 | Soluble Cations (cmol L−1) | Exchangeable Cations (cmol kg−1) | ||||||||
|---|---|---|---|---|---|---|---|---|---|---|---|---|---|---|---|---|---|---|
| (%) | (%) | (-) | <1.0 | 1.0–2.0 (mm) | >2.0 | (-) | (dS m−1) | (cmol kg−1) | (%) | Na+ | Ca2+ | Mg2+ | K+ | Na+ | Ca2+ | Mg2+ | K+ | |
| A | 3.76 | 0.0703 | 53.5 | 60.7 | 3.7 | 35.6 | 8.5 | 2.3 | 23.3 | 7.3 | 0.23 | 9.56 | 1.35 | 0.79 | 1.69 | 19.4 | 1.49 | 0.71 |
| B | 5.73 | 0.126 | 45.7 | 51.2 | 9.5 | 10.9 | 10.9 | 2.4 | 44.3 | 4.5 | 0.83 | 10.0 | 0.99 | 1.82 | 1.97 | 35.5 | 6.03 | 0.86 |
1 ESP: exchangeable sodium percentage (exchangeable Na+/CEC × 100), Data other than C, N, and C/N in this table were sourced from Ref. [23].
Table 5.
Total soil carbon content in test fields following soil amelioration (tCha−1) and changes in soil carbon content for test fields following soil amelioration compared to control soil (tCha−1 season−1).
Table 5.
Total soil carbon content in test fields following soil amelioration (tCha−1) and changes in soil carbon content for test fields following soil amelioration compared to control soil (tCha−1 season−1).
| AR (%) | CAFT_S | ∆CAM_CBB | ||||||
|---|---|---|---|---|---|---|---|---|
| F1 | F2 | F3 | F4 | F1 | F2 | F3 | F4 | |
| 0 | 34.1 ± 8.2 a | 31.6 ± 3.3 a | 34.2 ± 2.1 a | 30.5 ± 1.7 a | - | - | - | - |
| 0.5 | 41.3 ± 5.6 b | 27.7 ± 3.9 b | 37.0 ± 6.2 a | 31.5 ± 4.1 a | 8.4 ± 3.9 (23) | −4.8 ± 2.5 (25) | - | - |
| 1.0 | 35.5 ± 8.5 a | 34.0 ± 4.1 a | 32.1 ± 2.2 b | 32.7 ± 3.6 a | - | - | −4.0 ± 2.2 (24) | - |
| 2.0 | 44.4 ± 15.6 a | 33.9 ± 5.8 a | 35.9 ± 5.4 a | 40.1 ± 5.5 b | - | - | - | 9.2 ± 1.9 (21) |
| 3.0 | 39.2 ± 13.4 a | 34.4 ± 3.4 a | 44.0 ± 5.5 c | 50.2 ± 6.4 c | - | - | 7.5 ± 7.1 (22) | 15.7 ± 7.4 (27) |
Different lower-case superscript letters in a column indicate significant differences. ∆CAM_CBB was calculated by using the same plus or minus sign figures between different lower-case superscript letters in a column. The number in parenthesis indicates the data number used for calculation.
Table 6.
Total soil nitrogen content in test fields following soil amelioration (tha−1) and changes in soil nitrogen content for test fields following soil amelioration compared to control soil (tha−1 season−1).
Table 6.
Total soil nitrogen content in test fields following soil amelioration (tha−1) and changes in soil nitrogen content for test fields following soil amelioration compared to control soil (tha−1 season−1).
| AR (%) | NAFT_S | ∆NAM_CBB | ||||||
|---|---|---|---|---|---|---|---|---|
| F1 | F2 | F3 | F4 | F1 | F2 | F3 | F4 | |
| 0 | 1.77 ± 0.72 a | 2.34 ± 0.95 a | 2.00 ± 0.33 a | 1.89 ± 0.31 a | - | - | - | - |
| 0.5 | 2.68 ± 1.11 b | 1.87 ± 1.09 a | 2.19 ± 0.32 ab | 2.01 ± 0.46 a | 1.72 ± 0.94 (18) | - | - | - |
| 1.0 | 2.10 ± 0.85 a | 2.16 ± 0.62 a | 1.95 ± 0.29 a | 2.03 ± 0.52 a | - | - | - | - |
| 2.0 | 2.49 ± 1.07 a | 2.35 ± 0.59 a | 2.23 ± 0.31 ab | 2.04 ± 0.38 a | - | - | - | - |
| 3.0 | 2.01 ± 0.96 a | 2.06 ± 0.35 a | 2.42 ± 0.31 b | 2.12 ± 0.42 a | - | - | 0.43 ± 0.19 (22) | - |
Different lower-case superscript letters in a column indicate significant differences. ∆NAM_CBB was calculated by using the same plus or minus sign figures between different lower-case superscript letters in a column. The number in parenthesis indicates the data number used for calculation.
Table 7.
Changes in soil carbon and nitrogen content for test fields following soil amelioration compared to original (untreated) soil (t(C)ha−1 season−1).
Table 7.
Changes in soil carbon and nitrogen content for test fields following soil amelioration compared to original (untreated) soil (t(C)ha−1 season−1).
| AR (%) | ∆CAM_CBBPM | ∆NAM_CBBPM | ||||||
|---|---|---|---|---|---|---|---|---|
| F1 | F2 | F3 | F4 | F1 | F2 | F3 | F4 | |
| 0 | 16.8 ± 8.2 a | 16.4 ± 3.3 a | 16.8 ± 2.1 a | 15.3 ± 1.7 a | 1.11 ± 0.72 a | 1.87 ± 0.95 a | 1.33 ± 0.33 a | 1.41 ± 0.31 a |
| 0.5 | 23.6 ± 5.6 b | 12.1 ± 3.9 b | 19.0 ± 6.2 a | 15.7 ± 4.1 a | 2.01 ± 1.11 b | 1.39 ± 1.09 a | 1.51 ± 0.32 ac | 1.52 ± 0.46 a |
| 1.0 | 17.3 ± 8.5 a | 18.0 ± 4.1 a | 13.4 ± 2.2 b | 16.2 ± 3.6 a | 1.42 ± 0.85 a | 1.67 ± 0.62 a | 1.26 ± 0.29 ad | 1.53 ± 0.52 a |
| 2.0 | 25.4 ± 15.6 a | 17.0 ± 5.8 a | 15.9 ± 5.4 a | 22.3 ± 5.5 b | 1.79 ± 1.07 a | 1.84 ± 0.59 a | 1.51 ± 0.31 ac | 1.51 ± 0.38 a |
| 3.0 | 19.3 ± 13.4 a | 16.7 ± 3.4 a | 22.7 ± 5.5 c | 31.9 ± 6.4 c | 1.30 ± 0.96 a | 1.54 ± 0.35 a | 1.66 ± 0.31 b | 1.57 ± 0.42 a |
Different lower-case superscript letters in a column indicate significant differences. In case of 0% in application rate (AR), a pig manure only was added to the control experimental plot.
Table 8.
Pearson’s correlation coefficient among carbon, application rate, corn production, and soil chemical properties.
Table 8.
Pearson’s correlation coefficient among carbon, application rate, corn production, and soil chemical properties.
| AR | Prod | pH | EC | Mg2+ | Ca2+ | Na+ | K+ | Cl− | SO42− | HCO3− | CO32− | SAR | ESP | N | C/N | |
|---|---|---|---|---|---|---|---|---|---|---|---|---|---|---|---|---|
| F1 | - | 0.476 ** | −0.670 ** | - | 0.537 ** | 0.536 ** | −0.473 ** | - | −0.669 ** | - | - | - | −0.381 ** | −0.395 ** | 0.903 ** | −0.680 ** |
| F2 | 0.330 * | 0.440 ** | −0.610 ** | −0.654 ** | - | - | −0.815 ** | 0.824 ** | −0.797 ** | - | - | - | −0.665 ** | −0.682 ** | 0.822 ** | −0.789 ** |
| F3 | 0.489 ** | 0.455 ** | −0.809 ** | - | 0.467 ** | 0.453 ** | −0.711 ** | 0.824 ** | −0.804 ** | 0.424 ** | −0.316 * | −0.825 ** | −0.713 ** | −0.704 ** | 0.878 ** | −0.630 ** |
| F4 | 0.832 ** | 0.667 ** | −0.813 ** | 0.396 ** | 0.527 ** | 0.488 ** | −0.762 ** | 0.720 ** | −0.642 ** | 0.419 ** | −0.398 ** | −0.427 ** | −0.670 ** | −0.617 ** | 0.720 ** | −0.274 * |
| F1–4 | 0.391 ** | 0.436 ** | −0.418 ** | 0.205 ** | 0.358 ** | 0.342 ** | −0.385 ** | - | −0.445 ** | 0.286 ** | −0.230 ** | −0.205 ** | −0.366 ** | −0.351 ** | 0.701 ** | −0.260 ** |
* Significant at p < 0.05; ** significant at p < 0.01; a hyphen (−) indicates no significant difference, AR: application rate, ions: soluble cations and anions.
Table 9.
Pearson’s correlation coefficient among nitrogen, application rate, corn production, and soil chemical properties.
Table 9.
Pearson’s correlation coefficient among nitrogen, application rate, corn production, and soil chemical properties.
| AR | Prod | pH | EC | Mg2+ | Ca2+ | Na+ | K+ | Cl− | SO42− | HCO3− | CO32− | SAR | ESP | C/N | |
|---|---|---|---|---|---|---|---|---|---|---|---|---|---|---|---|
| F1 | - | 0.514 ** | −0.779 ** | - | 0.465 ** | 0.558 ** | −0.549 ** | - | −0.659 ** | - | - | - | −0.474 ** | −0.490 ** | −0.807 ** |
| F2 | - | - | −0.536 ** | −0.515 ** | - | - | −0.666 ** | 0.662 ** | −0.671 ** | - | −0.292 * | - | −0.558 ** | −0.572 ** | −0.856 ** |
| F3 | 0.373 * | 0.371 * | −0.894 ** | - | 0.378 ** | 0.396 ** | −0.831 ** | 0.891 ** | −0.854 ** | 0.336 * | −0.359 ** | −0.892 ** | −0.820 ** | −0.808 ** | −0.864 ** |
| F4 | - | - | −0.742 ** | - | 0.355 ** | 0.343 * | −0.641 ** | 0.830 ** | −0.746 ** | 0.324 * | - | - | −0.454 ** | −0.458 ** | −0.784 ** |
| F1–4 | - | 0.306 ** | −0.337 ** | - | - | 0.156 * | −0.431 ** | - | −0.477 ** | - | −0.222 ** | −0.237 ** | −0.378 ** | −0.384 ** | −0.731 ** |
* Significant at p < 0.05; ** significant at p < 0.01; a hyphen (−) indicates no significant difference, AR: application rate, ions: soluble cations and anions.
Table 10.
Pearson’s correlation coefficient among C/N ratio, application rate, corn production, and soil chemical properties.
Table 10.
Pearson’s correlation coefficient among C/N ratio, application rate, corn production, and soil chemical properties.
| AR | Prod | pH | EC | Mg2+ | Ca2+ | Na+ | K+ | Cl− | SO42− | HCO3− | CO32− | SAR | ESP | |
|---|---|---|---|---|---|---|---|---|---|---|---|---|---|---|
| F1 | - | −0.315 * | 0.590 ** | - | - | - | 0.525 ** | - | 0.732 ** | - | - | - | 0.339 * | 0.353 ** |
| F2 | - | - | 0.543 ** | 0.549 ** | - | - | 0.753 ** | −0.833 ** | 0.831 ** | - | - | - | 0.591 ** | 0.611 ** |
| F3 | - | - | 0.858 ** | - | - | - | 0.837 ** | −0.875 ** | 0.805 ** | - | 0.327 * | 0.876 ** | 0.796 ** | 0.812 ** |
| F4 | 0.677 ** | 0.554 ** | 0.544 ** | - | - | - | 0.369 ** | −0.754 ** | 0.711 ** | - | - | - | - | - |
| F1–4 | 0.249 ** | - | 0.301 ** | 0.231 ** | - | - | 0.412 ** | - | 0.549 ** | - | - | 0.188 ** | 0.288 ** | 0.311 ** |
* Significant at p < 0.05; ** significant at p < 0.01; a hyphen (−) indicates no significant difference, AR: application rate, ions: soluble cations and anions.
Publisher’s Note: MDPI stays neutral with regard to jurisdictional claims in published maps and institutional affiliations. |
© 2020 by the authors. Licensee MDPI, Basel, Switzerland. This article is an open access article distributed under the terms and conditions of the Creative Commons Attribution (CC BY) license (http://creativecommons.org/licenses/by/4.0/).
Share and Cite
MDPI and ACS Style
Sakai, Y.; Nakamura, M.; Wang, C. Soil Carbon Sequestration Due to Salt-Affected Soil Amelioration with Coal Bio-Briquette Ash: A Case Study in Northeast China. Minerals 2020, 10, 1019. https://0-doi-org.brum.beds.ac.uk/10.3390/min10111019
AMA Style
Sakai Y, Nakamura M, Wang C. Soil Carbon Sequestration Due to Salt-Affected Soil Amelioration with Coal Bio-Briquette Ash: A Case Study in Northeast China. Minerals. 2020; 10(11):1019. https://0-doi-org.brum.beds.ac.uk/10.3390/min10111019
Chicago/Turabian StyleSakai, Yuji, Masataka Nakamura, and Chang Wang. 2020. "Soil Carbon Sequestration Due to Salt-Affected Soil Amelioration with Coal Bio-Briquette Ash: A Case Study in Northeast China" Minerals 10, no. 11: 1019. https://0-doi-org.brum.beds.ac.uk/10.3390/min10111019
Note that from the first issue of 2016, this journal uses article numbers instead of page numbers. See further details here.