Egyptian Blue Pellets from the First Century BCE Workshop of Kos (Greece): Microanalytical Investigation by Optical Microscopy, Scanning Electron Microscopy-X-ray Energy Dispersive Spectroscopy and Micro-Raman Spectroscopy

 ,
,
Abstract
:
1. Introduction
2. Materials and Methods
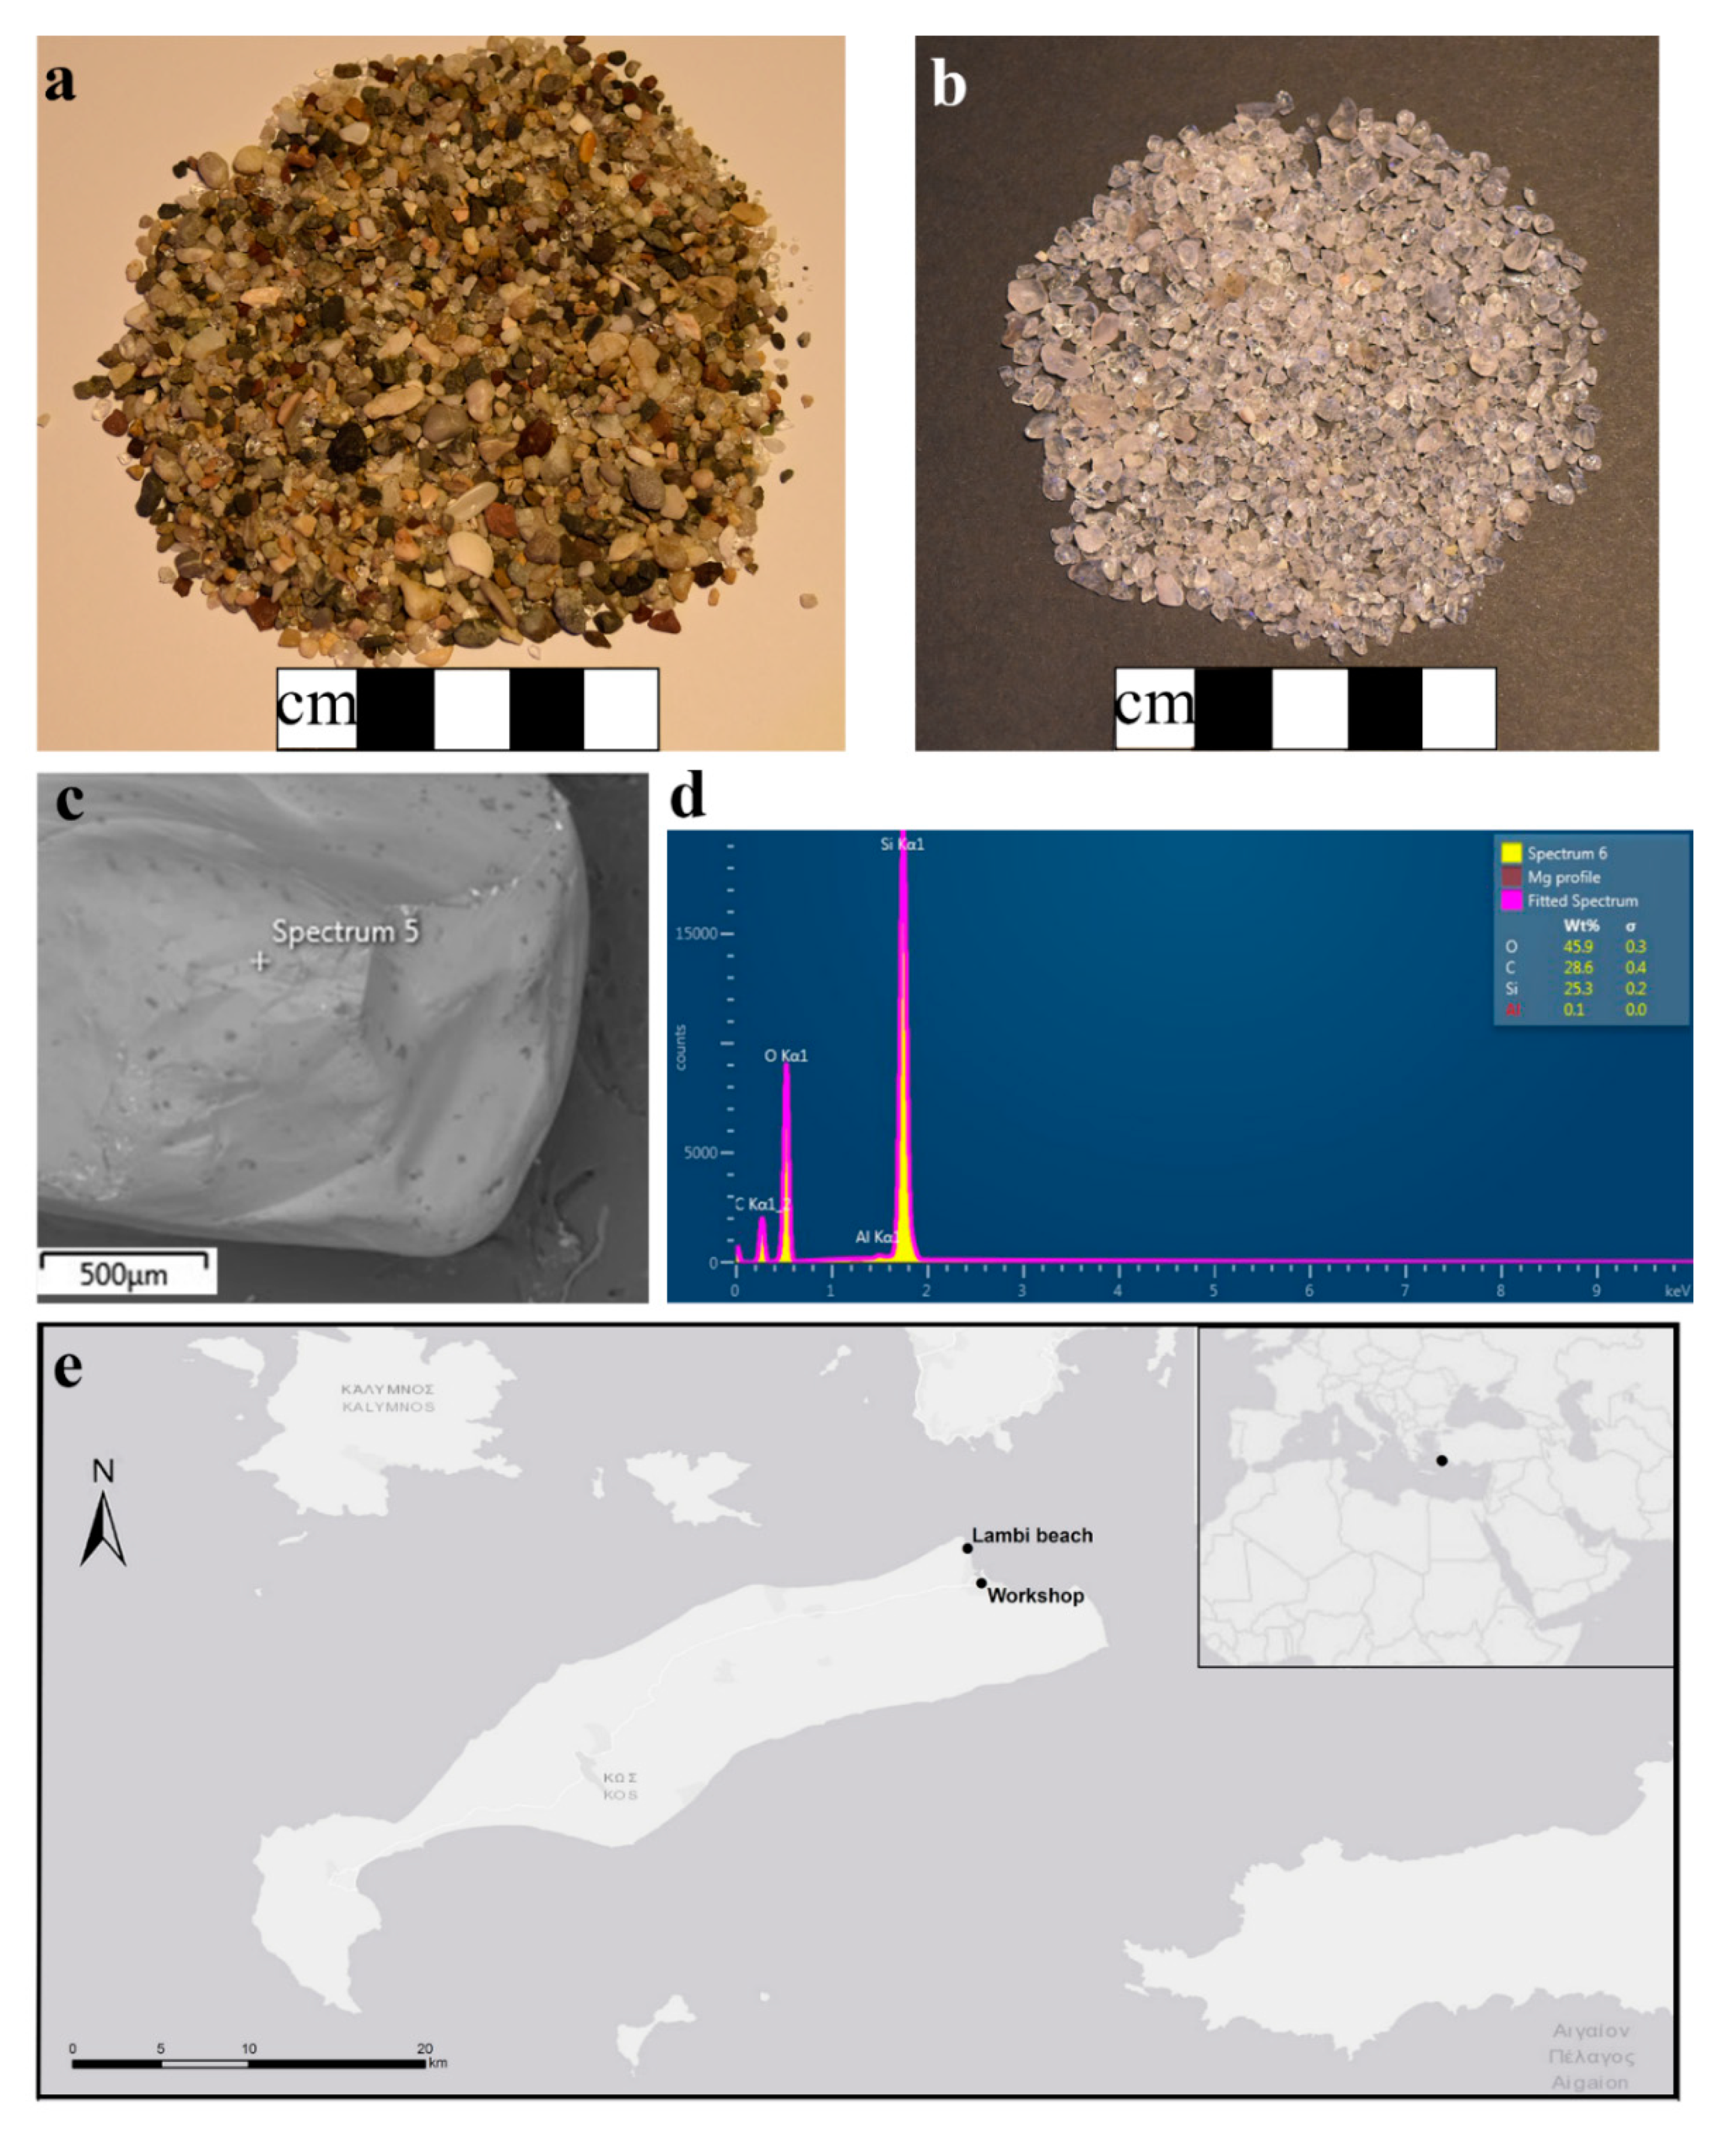
2.1. Sampling and Sample Preparation
2.2. Optical Microscopy
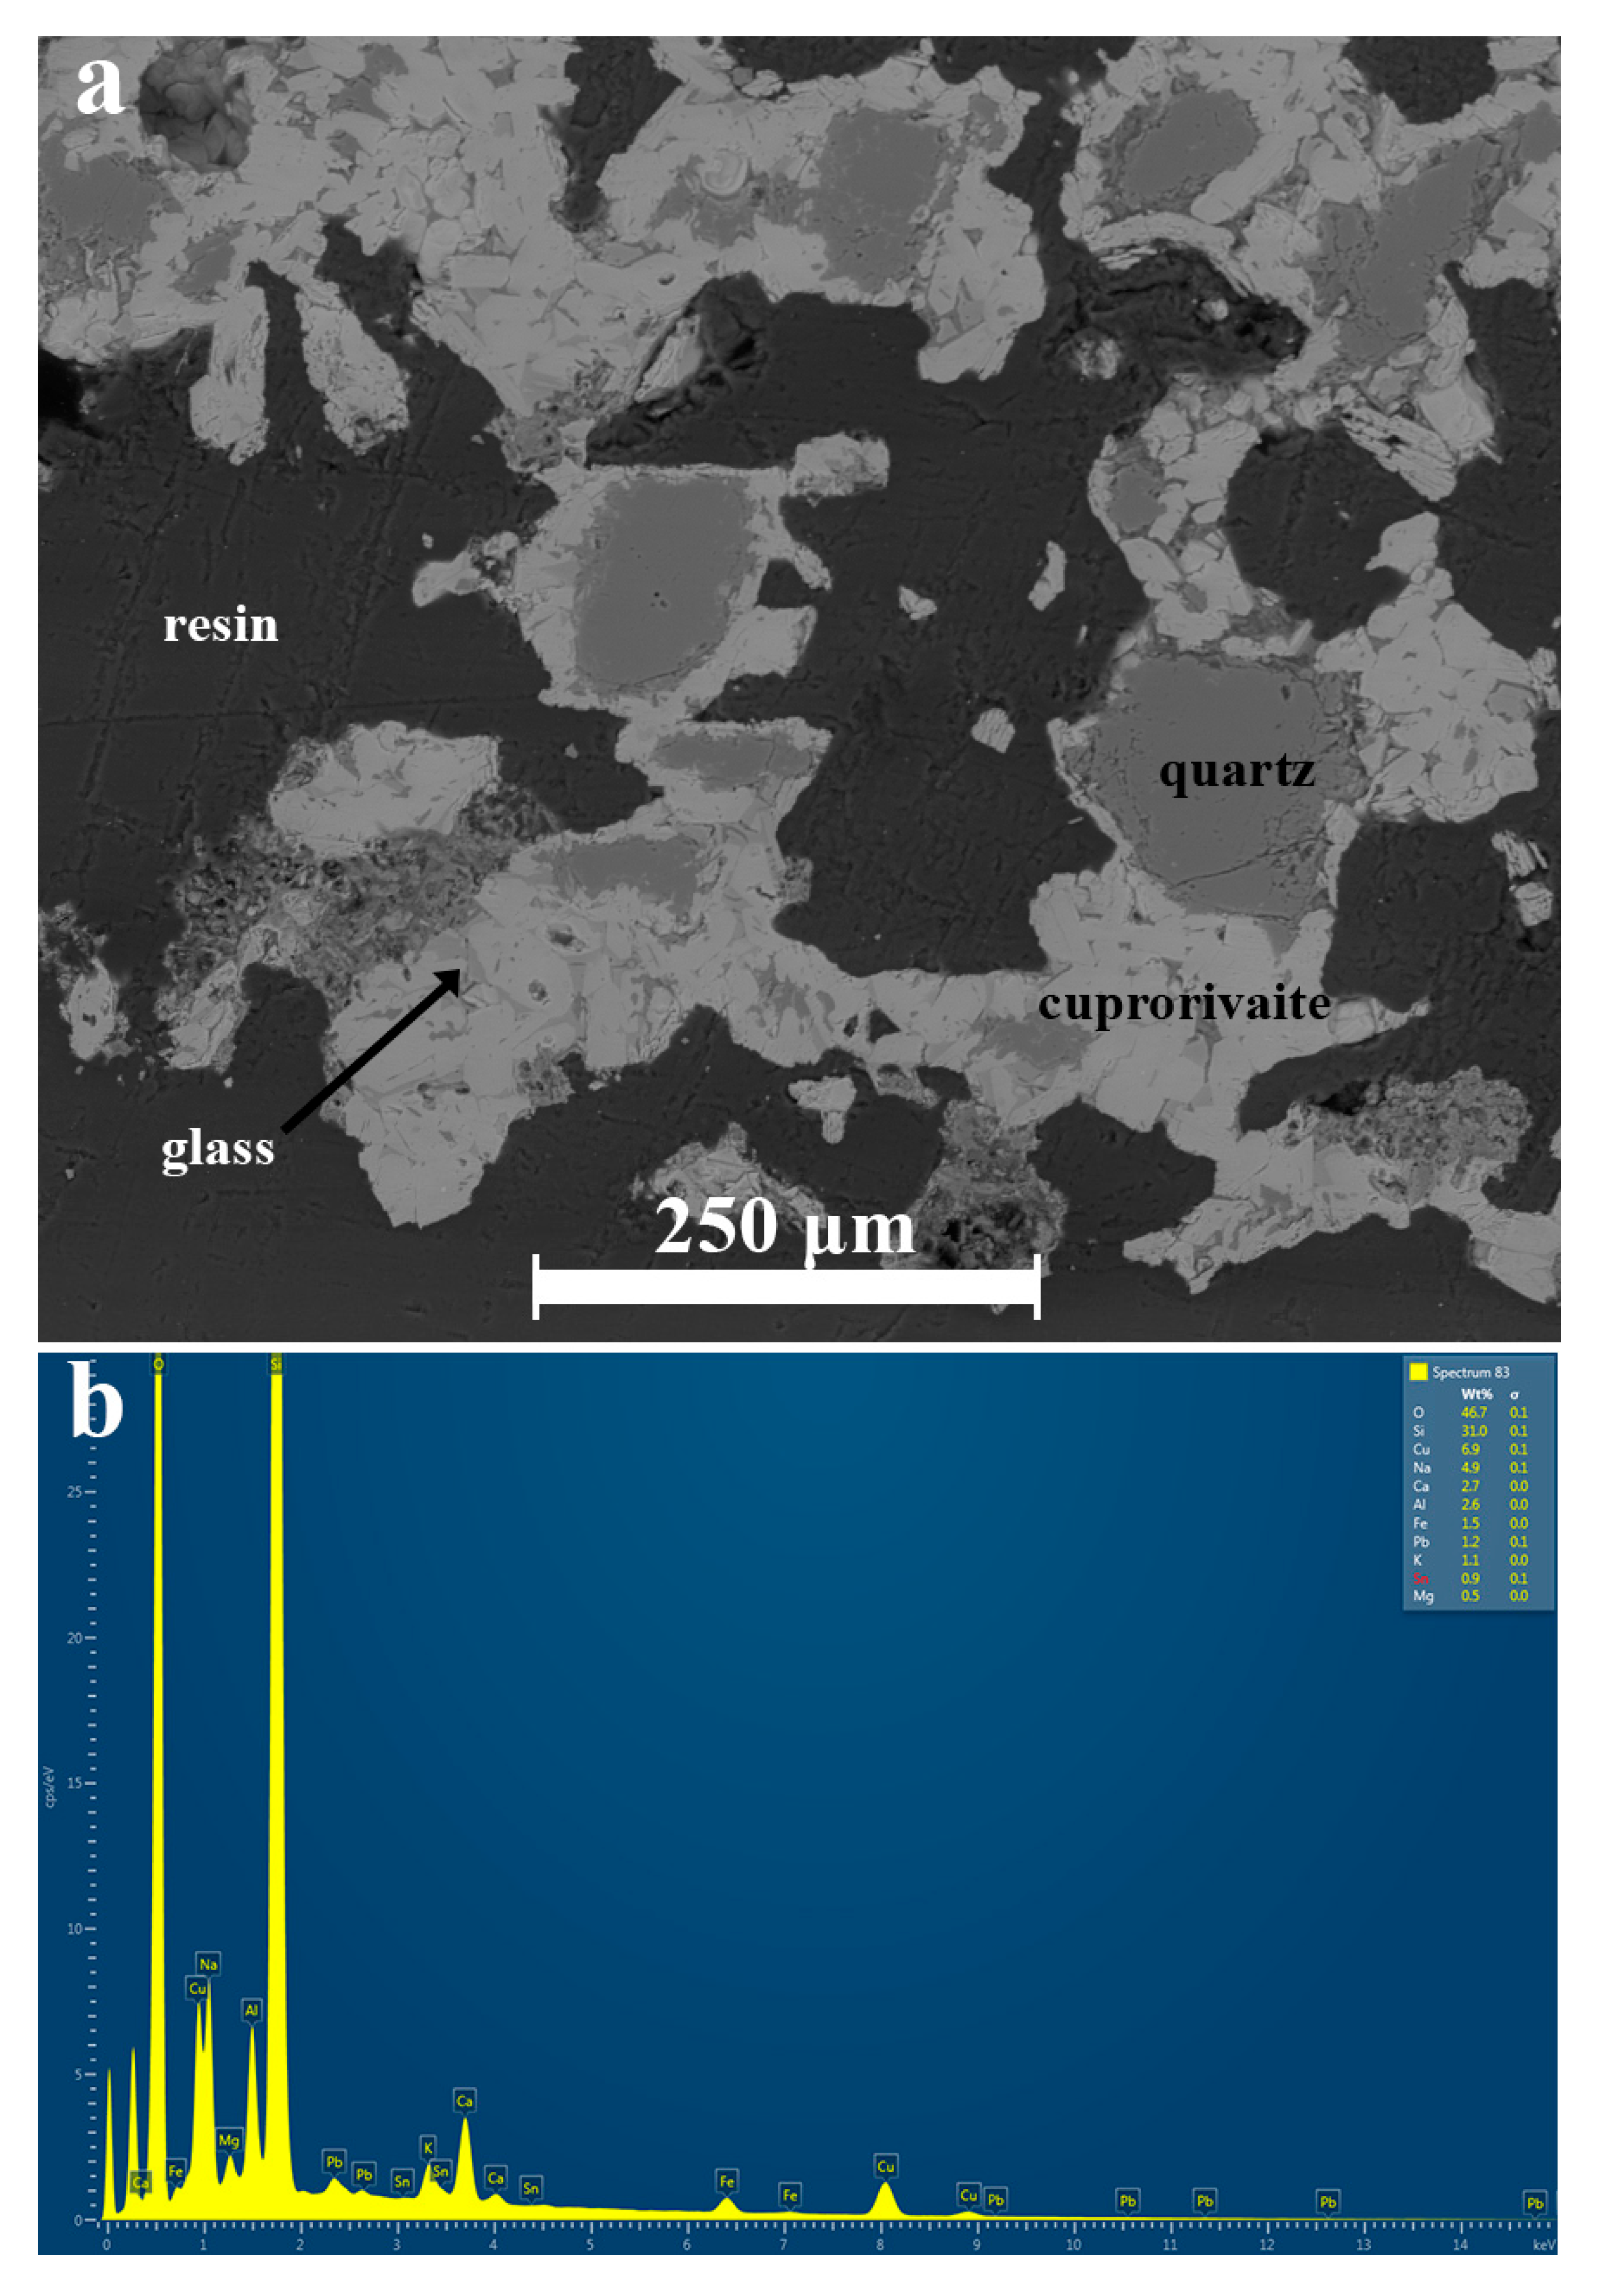
2.3. Scanning Electron Microscopy Energy-Dispersive X-ray Spectroscopy
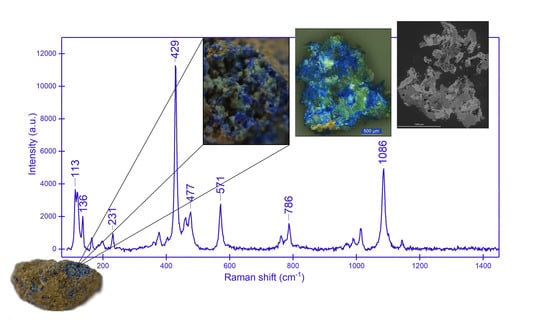
2.4. Micro-Raman Spectroscopy
3. Results and Discussion
4. Conclusions
Author Contributions
Funding
Acknowledgments
Conflicts of Interest
Appendix A


Appendix B

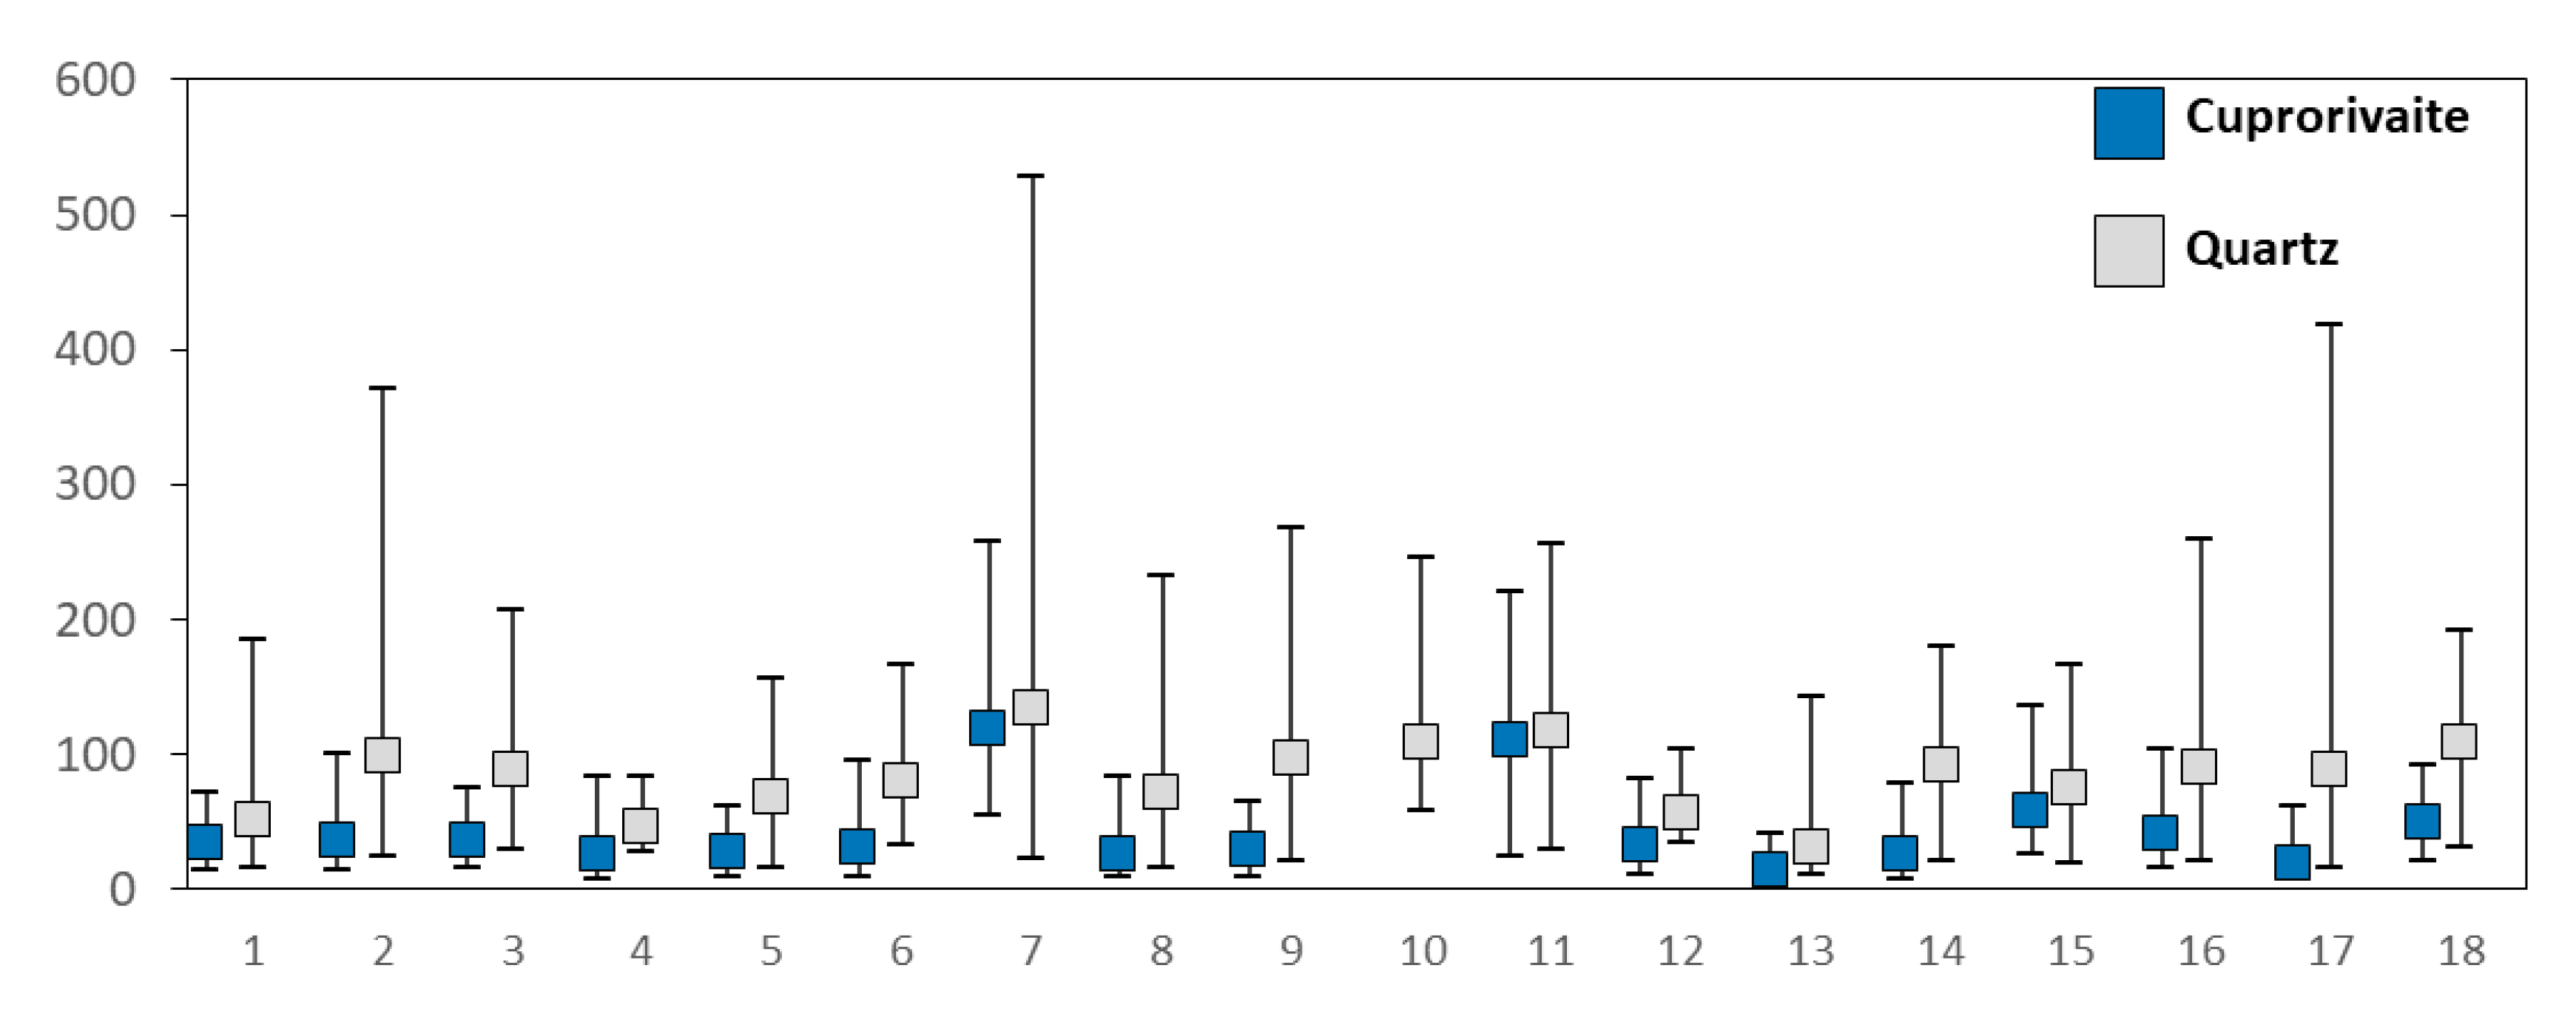
| Cuprorivaite | Quartz | Cuprorivaite Agglomerates | |||||||||||||
|---|---|---|---|---|---|---|---|---|---|---|---|---|---|---|---|
| Sample | No. of Particles Measured | Mean | SD | Min | Max | No. of Particles Measured | Mean | SD | Min | Max | No. of Agglomerates Measured | Mean | SD | Min | Max |
| 1 | 100 | 34 | 14 | 14 | 72 | 58 | 51 | 30 | 16 | 185 | 7 | 123 | 40 | 71 | 184 |
| 2 | 101 | 37 | 16 | 15 | 101 | 51 | 99 | 66 | 24 | 371 | 9 | 325 | 144 | 137 | 537 |
| 3 | 70 | 37 | 13 | 16 | 76 | 33 | 89 | 51 | 29 | 207 | 5 | 228 | 84 | 135 | 349 |
| 4 | 71 | 26 | 16 | 8 | 85 | 4 | 46 | 25 | 28 | 83 | 5 | 132 | 58 | 71 | 222 |
| 5 | 100 | 29 | 10 | 10 | 62 | 34 | 69 | 38 | 17 | 157 | 10 | 148 | 60 | 79 | 255 |
| 6 | 183 | 31 | 14 | 10 | 96 | 12 | 80 | 41 | 33 | 166 | 10 | 221 | 109 | 69 | 369 |
| 7 | 41 | 119 | 53 | 55 | 258 | 30 | 134 | 98 | 23 | 528 | 4 | 514 | 66 | 417 | 561 |
| 8 | 92 | 27 | 12 | 10 | 84 | 25 | 71 | 57 | 17 | 232 | 10 | 150 | 71 | 56 | 272 |
| 9 | 100 | 29 | 10 | 10 | 66 | 15 | 97 | 79 | 21 | 267 | 10 | 186 | 99 | 105 | 424 |
| 10 | 15 | 108 | 51 | 59 | 246 | 0 | |||||||||
| 11 | 100 | 111 | 42 | 25 | 221 | 25 | 117 | 47 | 30 | 256 | 11 | 470 | 192 | 219 | 807 |
| 12 | 35 | 34 | 21 | 11 | 83 | 5 | 56 | 29 | 34 | 104 | 2 | 91 | 7 | 86 | 96 |
| 13 | 211 | 15 | 7 | 3 | 43 | 55 | 30 | 22 | 10 | 143 | 0 | ||||
| 14 | 100 | 27 | 12 | 8 | 80 | 15 | 92 | 47 | 21 | 181 | 10 | 111 | 76 | 47 | 299 |
| 15 | 100 | 59 | 24 | 27 | 137 | 10 | 75 | 50 | 19 | 167 | 10 | 189 | 47 | 112 | 257 |
| 16 | 126 | 41 | 17 | 16 | 105 | 46 | 91 | 43 | 21 | 259 | 11 | 193 | 47 | 117 | 252 |
| 17 | 100 | 21 | 10 | 8 | 62 | 30 | 88 | 89 | 15 | 418 | 12 | 77 | 30 | 32 | 130 |
| 18 | 95 | 50 | 16 | 22 | 92 | 15 | 109 | 45 | 32 | 192 | 15 | 308 | 123 | 154 | 575 |
| Sample | Phase | %Area | MinThr | MaxThr | Normalised |
|---|---|---|---|---|---|
| 1 | Quartz | 16.75 | 80 | 181 | 45.5 |
| Cuprorivaite | 12.94 | 221 | 255 | 35.1 | |
| Glass | 7.16 | 182 | 220 | 19.4 | |
| Total area without resin | 36.85 | 80 | 255 | 100.0 | |
| 2 | Quartz | 17.78 | 69 | 105 | 43.9 |
| Cuprorivaite | 22.33 | 106 | 255 | 55.1 | |
| Total area without resin | 40.51 | 68 | 255 | 99.0 | |
| 3 | Quartz | 19.72 | 72 | 100 | 56.0 |
| Cuprorivaite | 15.68 | 100 | 138 | 44.5 | |
| Cu-particles | 0.26 | 139 | 255 | 0.7 | |
| Total area without resin | 35.22 | 71 | 255 | 101.2 | |
| 4 | Quartz | 6.86 | 100 | 115 | 21.5 |
| Cuprorivaite | 18.63 | 133 | 255 | 58.4 | |
| Glassy phase | 6.03 | 116 | 132 | 18.9 | |
| Total area without resin | 31.91 | 99 | 255 | 98.8 | |
| 5 | Quartz | 13.41 | 77 | 110 | 35.1 |
| Cuprorivaite | 19.17 | 126 | 255 | 50.2 | |
| Glassy phase | 5.43 | 111 | 125 | 14.2 | |
| Total area without resin | 38.17 | 76 | 255 | 99.6 | |
| 6 | Quartz | 12.37 | 57 | 83 | 38.1 |
| Cuprorivaite | 16.35 | 97 | 255 | 50.4 | |
| Glassy phase | 3.74 | 84 | 96 | 11.5 | |
| Total area without resin | 32.46 | 57 | 255 | 100.0 | |
| 7 | Quartz | 19.21 | 76 | 107 | 52.7 |
| Cuprorivaite | 10.69 | 120 | 255 | 29.4 | |
| Glassy phase | 6.21 | 108 | 119 | 17.1 | |
| Total area without resin | 36.42 | 75 | 255 | 99.1 | |
| 8 | Quartz | 13.56 | 145 | 183 | 27.3 |
| Cuprorivaite | 10.58 | 209 | 255 | 21.3 | |
| Glassy phase | 6.48 | 184 | 208 | 13.1 | |
| Carbon | 19.57 | 85 | 145 | 39.4 | |
| Total area without resin | 49.63 | 85 | 255 | 101.1 | |
| 9 | Quartz | 8.26 | 82 | 101 | 28.7 |
| Cu-particles | 0.02 | 145 | 255 | 0.1 | |
| Cuprorivaite | 15.75 | 116 | 144 | 54.8 | |
| Glassy phase | 4.59 | 102 | 115 | 16.0 | |
| Total area without resin | 28.76 | 81 | 255 | 99.5 | |
| 10 | Quartz | 23.44 | 107 | 170 | 56.5 |
| Cu-Si crystals | 3.75 | 212 | 255 | 9.0 | |
| Glassy phase | 13.99 | 171 | 211 | 33.7 | |
| Total area without resin | 41.46 | 106 | 255 | 99.3 | |
| 11 | Quartz | 17.86 | 60 | 97 | 41.3 |
| Cuprorivaite | 25 | 98 | 142 | 57.8 | |
| Sn particles | 0.13 | 142 | 255 | 0.3 | |
| Total area without resin | 43.27 | 59 | 255 | 99.4 | |
| 12 | Quartz and soil particles | 25.01 | 70 | 110 | 88.4 |
| Cuprorivaite | 4.85 | 111 | 152 | 17.1 | |
| Total area without resin | 28.29 | 73 | 255 | 105.5 | |
| 13 | Quartz | 7.82 | 106 | 127 | 43.5 |
| Cuprorivaite | 9.88 | 129 | 255 | 54.9 | |
| Total area without resin | 17.99 | 106 | 255 | 98.4 | |
| 14 | Quartz | 17.43 | 55 | 92 | 49.5 |
| Cuprorivaite | 14.47 | 105 | 140 | 41.1 | |
| Sn particles | 0.14 | 140 | 255 | 0.4 | |
| Glassy phase | 3.19 | 93 | 104 | 9.1 | |
| Total area without resin | 35.21 | 55 | 255 | 100.1 | |
| 15 | Quartz | 12.56 | 50 | 87 | 40.7 |
| Cuprorivaite | 17.88 | 88 | 120 | 58.0 | |
| Sn particles | 0.11 | 121 | 255 | 0.4 | |
| Total area without resin | 30.85 | 49 | 255 | 99.0 | |
| 16 | Quartz | 14.07 | 94 | 154 | 46.1 |
| Cuprorivaite | 16.27 | 155 | 239 | 53.3 | |
| Sn particles | 0.16 | 240 | 255 | 0.5 | |
| Total area without resin | 30.5 | 94 | 255 | 100.0 | |
| 17 | Quartz | 18.59 | 130 | 159 | 56.7 |
| Cuprorivaite | 14.2 | 160 | 255 | 43.3 | |
| Total area without resin | 32.79 | 130 | 255 | 100.0 | |
| 18 | Quartz | 13.8 | 97 | 161 | 38.5 |
| Cuprorivaite | 22.29 | 161 | 210 | 62.2 | |
| Sn particles | 0.06 | 211 | 255 | 0.2 | |
| Total area without resin | 35.85 | 97 | 255 | 100.8 |
References
- Delamare, F. Egyptian blue, the blue pigment of Mediterranean antiquity: From Egyptian hsbḏ iryt to Roman caeruleum. In Blue Pigments: 5000 Years of Art and Industry; Archetype Publications: London, UK, 2013; pp. 1–36. [Google Scholar]
- Kakoulli, I. Egyptian blue in Greek painting between 2500 and 50 BC. In From Mine to Microscope: Advances in the Study of Ancient Technology; Shortland, A., Freestone, I., Rehren, T., Eds.; Oxbow Books: Oxford, UK, 2009; pp. 79–92. [Google Scholar]
- Berke, H. The invention of blue and purple pigments in ancient times. Chem. Soc. Rev. 2007, 36, 15–30. [Google Scholar] [CrossRef] [PubMed]
- Delamare, F. German azurite and English blue verditer. In Blue Pigments: 5000 Years of Art and Industry; Archetype Publications: London, UK, 2013; pp. 119–144. [Google Scholar]
- Riederer, J. Egyptian blue. In Artists’ Pigments: A Handbook of Their History and Characteristics; FitzHugh, E.W., Ed.; National Gallery of Art: Washington, DC, USA, 1997; Volume 3, pp. 23–46. [Google Scholar]
- Ullrich, D. Egyptian blue and green frit: Characterization, history and occurrence, synthesis. In Datation-Characterisation des Peintures Parietales and Murales; PACT: Ravello, Italy, 1987; pp. 323–332. [Google Scholar]
- Caley, E.R.; Richards, J.F. Theophrastus: On Stones, Introduction, Greek Text, English Translation, and Commentary; The Ohio State University: Columbus, OH, USA, 1956. [Google Scholar]
- Filippakis, S.E.; Perdikatsis, B.; Paradellis, T. An analysis of blue pigments from the Greek Bronze Age. Stud. Conserv. 1976, 21, 143–153. [Google Scholar]
- Profi, S.; Weier, L.; Filippakis, S. X-ray analysis of Greek Bronze Age pigments from Knossos. Stud. Conserv. 1976, 21, 34–39. [Google Scholar]
- Profi, S.; Weier, L.; Filippakis, S. X-ray analysis of Greek Bronze Age pigments from Mycenae. Stud. Conserv. 1974, 19, 105–112. [Google Scholar] [CrossRef]
- Panagiotaki, M.; Tite, M.S.; Maniatis, Y. Egyptian blue in Egypt and beyond: The Aegean and the Near East. In Proceedings of the Tenth International Congress of Egyptologists, University of the Aegean, Rhodes, Greece, 22–29 May 2008; Kousoulis, P., Lazaridis, N., Eds.; Peeters: Leuven, Belgium; Paris, France; Bristol, UK, 2015; Volume II, pp. 1769–1789. [Google Scholar]
- Pantermalis, D.; Vlassopoulou, C.; Katsaros, T.; Panagiotidou, D.; Merkouri, E.; Kokkinou, L. Archaic Colors; Acropolis Museum: Athens, Greece, 2012. [Google Scholar]
- Kouzeli, K.; Beloyannis, N.; Dogani, Y. Study of remaining colour on the architectural surfaces of the Parthenon. In Proceedings of the Superfici dell’ Architettura: Le Finiture. Atti del Convegno di Studi Bressanone, Bressanone, Italy, 26–29 June 1990; Biscontin, G., Ed.; Libreria Progetto: Bressanone, Italy, 1990; pp. 241–250. [Google Scholar]
- Brecoulaki, H. La Peinture Funéraire de Macédoine: Emplois et Fonctions de La Couleur (IVe–IIe s. av. J. –C.); Centre de Recherches de L’antiquité Grecque et Romaine, Fondation Nationale de la Recherche Scientifique: Athens, Greece, 2006. [Google Scholar]
- Brecoulaki, H.; Fiorin, E.; Vigato, P.A. The funerary klinai of tomb 1 from Amphipolis and a sarcophagus from ancient Tragilos, eastern Macedonia: A physico-chemical investigation on the painting materials. Cult. Herit. 2006, 7, 301–311. [Google Scholar] [CrossRef]
- Bordignon, F.; Postorino, P.; Dore, P.; Trojsi, G. Raman identification of green and blue pigments in Etruscan polychromes on architectural terracotta panels. J. Raman Spectrosc. 2007, 38, 255–259. [Google Scholar] [CrossRef]
- Tite, M.S.; Hatton, G.D. The production technology of, and trade in, Egyptian blue pigment in the Roman world. In Communities and Connections: Essays in Honour of Barry Cunliffe; Oxford University Press: Oxford, UK, 2007; pp. 75–92. [Google Scholar]
- Béarat, H. Quelle est la gamme exacte des pigments Romains? Confrontation des resultats d’analyse et des textes de Vitruve et de Pline. In Proceedings of the International Workshop, Fribourg, Switzerland, 7–9 March 1996; Béarat, H., Fuchs, M., Maggetti, M., Paunier, D., Eds.; Institute of Mineralogy and Petrography: Fribourg, Switzerland, 1997; pp. 11–34. [Google Scholar]
- Mateos, L.D.; Cosano, D.; Mora, M.; Muñiz, I.; Carmona, R.; Jiménez-Sanchidrián, C.; Ruiz, J.R. Raman microspectroscopic analysis of decorative pigments from the Roman villa of El Ruedo (Almedinilla, Spain). Spectrochim. Acta Part A Mol. Biomol. Spectrosc. 2015, 151, 16–21. [Google Scholar] [CrossRef]
- Duran, A.; Jimenez De Haro, M.C.; Perez-Rodriguez, J.L.; Franquelo, M.L.; Herrera, L.K.; Justo, A. Determination of pigments and binders in Pompeian wall paintings using Synchrotron Radiation—High-resolution X-ray powder diffraction and conventional spectroscopy—Chromatography. Archaeometry 2010, 52, 286–307. [Google Scholar] [CrossRef]
- Aliatis, I.; Bersani, D.; Campani, E.; Casoli, A.; Lottici, P.P.; Mantovan, S.; Marino, I.G. Pigments used in Roman wall paintings in the Vesuvian area. J. Raman Spectrosc. 2010, 41, 1537–1542. [Google Scholar] [CrossRef]
- Delaney, J.K.; Dooley, K.A.; Radpour, R.; Kakoulli, I. Macroscale multimodal imaging reveals ancient painting production technology and the vogue in Greco-Roman Egypt. Sci. Rep. 2017, 7, 15509. [Google Scholar] [CrossRef] [Green Version]
- Radpour, R.; Fischer, C.; Kakoulli, I. New Insight into Hellenistic and Roman Cypriot Wall Paintings: An Exploration of Artists’ Materials, Production Technology, and Technical Style. Arts 2019, 8, 74. [Google Scholar] [CrossRef] [Green Version]
- Kakoulli, I. Roman Wall Paintings in Cyprus: A Scientific Investigation of their Technology. In Proceedings of the International Workshop on Roman Wall Painting, Fribourg, Switzerland, 7–9 March 1996; Béarat, H., Fuchs, M., Maggetti, M., Paunier, D., Eds.; Institute of Mineralogy and Petrology, Fribourg University: Fribourg, Switzerland, 1997. [Google Scholar]
- Augusti, S. I Colori Pompeiani; De Luca Editore: Rome, Italy, 1967. [Google Scholar]
- Rosenqvist, A.M. Analyser av sverd og skjold fra Bø-funnet. Viking 1959, 23, 29–34. [Google Scholar]
- Tite, M.S.; Bimson, M.; Cowell, M.R. Technological examination of Egyptian blue. In Archaeological Chemistry-III; American Chemical Society: Washington, DC, USA, 1984; pp. 215–242. [Google Scholar]
- Boschetti, C. Vitreous materials in early mosaics in Italy: Faience, Egyptian blue, and glass. J. Glass Stud. 2011, 53, 59–91. [Google Scholar]
- Cavassa, L. La production du bleu égyptien durant l’époque hellenistique et l’Empire romain (III s.av. J.-C.-I s. apr. J.-C.). In Bulletin de Correspondance Hellénique. Supplément. Les Arts de la Couleur en Gréce Ancienne… et Ailleurs. Approches Interdisciplinaires; Jockey, P., Ed.; École Française d’ Athènes: Athens, Greece, 2018; Volume 56, pp. 13–34. [Google Scholar]
- Petrie, W.M.F.; Walker, J.H. Memphis I; School of Archaeology in Egypt University College: London, UK, 1909. [Google Scholar]
- Nicholson, P.T. Working in Memphis: The Production of Faience at Roman Period Kom Helul; Egypt Exploration Society: London, UK, 2013. [Google Scholar]
- Cavassa, L.; Delamare, F.; Repoux, M. La fabrication du bleu égyptien dans les champs phlégréens (Campanie, Italie) durant le Ier siècle de notre ère. Aspects de L’artisanat en Milieu Urbain Gaule et Occident Romain Suppléments à la Revue Archéologique de L’Est 2010, 28, 235–249. [Google Scholar]
- Lazzarini, L.; Verità, M. First evidence for 1st century AD production of Egyptian blue frit in Roman Italy. J. Archaeol. Sci. 2015, 53, 578–585. [Google Scholar] [CrossRef]
- Grifa, C.; Cavassa, L.; Bonis, A.D.; Germinario, C.; Guarino, V.; Izzo, F.; Kakoulli, I.; Langella, A.; Mercurio, M.; Morra, V. Beyond Vitruvius: New insight in the technology of Egyptian blue and green frits. J. Am. Ceram. Soc. 2016, 99, 3467–3475. [Google Scholar] [CrossRef] [Green Version]
- Kantzia, C.; Kouzeli, K. Workshop for the manufacture of pigments in the ancient Agora of Kos [original title: Το εργαστήριο παρασκευής χρωμάτων στην Aρχαία Aγορά της Κω: Το Aιγυπτιακό μπλε]. Athens Ann. Archaeol. 1991, 20, 210–250. [Google Scholar]
- Kostomitsopoulou Marketou, A. The Pigment Production Site of the Ancient Agora of Kos (Greece): Revisiting the material evidence. Thiasos J. Archaeol. Anc. Archit. 2019, 8, 61–80. [Google Scholar]
- Kostomitsopoulou Marketou, A.; Kouzeli, K.; Facorellis, Y. Colourful earth: Iron-containing pigments from the Hellenistic pigment production site of the ancient agora of Kos (Greece). J. Archaeol. Sci. Rep. 2019, 26, 101843. [Google Scholar] [CrossRef]
- Berke, H. Chemistry in ancient times: The development of blue and purple pigments. Angew. Chemie Int. Ed. 2002, 41, 2483–2487. [Google Scholar] [CrossRef]
- Chase, W.T. Egyptian blue as a pigment and ceramic material. In Science and Archaeology; Brill, R.H., Ed.; MIT Press: Cambridge, MA, USA, 1971; pp. 80–90. [Google Scholar]
- Wiedemann, H.G.; Bayer, G. The bust of Nefertiti. Anal. Chem. 1982, 54, 619–628. [Google Scholar] [CrossRef]
- Jaksch, H.; Seipel, W.; Weiner, K.L.; El Goresy, A. Egyptian blue—Cuprorivaite a window to ancient Egyptian technology. Nature 1983, 70, 525–535. [Google Scholar] [CrossRef]
- Bianchetti, P.; Talarico, F.; Vigliano, M.G.; Ali, M.F. Production and characterization of Egyptian blue and Egyptian green frit. J. Cult. Herit. 2000, 1, 179–188. [Google Scholar] [CrossRef]
- Bouherour, S.; Berke, H.; Wiedemann, H.-G. Ancient man-made copper silicate pigments studied by Raman microscopy. Chim. Int. J. Chem. 2001, 55, 942–951. [Google Scholar]
- Pagès-Camagna, S.; Colinart, S.; Coupry, C. Fabrication processes of archaeological Egyptian blue and green pigments enlightened by Raman microscopy and scanning electron microscopy. J. Raman Spectrosc. 1999, 30, 313–317. [Google Scholar] [CrossRef]
- Pagès-Camagna, S.; Reiche, I.; Brouder, C.; Cabaret, D.; Rossano, S.; Kanngießer, B.; Erko, A. New insights into the colour origin of archaeological Egyptian blue and green by XAFS at the Cu K-edge. X-Ray Spectrom. 2006, 35, 141–145. [Google Scholar] [CrossRef]
- Pagès-Camagna, S.; Colinart, S. The Egyptian green pigment: Its manufacturing process and links to Egyptian blue*. Archaeometry 2003, 45, 637–658. [Google Scholar] [CrossRef]
- Pradell, T.; Salvado, N.; Hatton, G.D.; Tite, M.S. Physical processes involved in production of the ancient pigment, Egyptian Blue. J. Am. Ceram. Soc. 2006, 89, 1426–1431. [Google Scholar] [CrossRef]
- Hatton, G.D.; Shortland, A.J.; Tite, M.S. The production technology of Egyptian blue and green frits from second millennium BC Egypt and Mesopotamia. J. Archaeol. Sci. 2008, 35, 1591–1604. [Google Scholar] [CrossRef]
- Delamare, F. Sur les processus physiques intervenant lors de la synthèse du bleu égyptien. ArchéoSciences Revue D’Archéométrie 1997, 21, 103–119. [Google Scholar] [CrossRef]
- Schiegl, S.; Weiner, K.L.; El Goresy, A. Zusammensetzung und Provenienz von blau-und grünpigmenten in altägyptischen Wandmalereien: Ein Beitrag zur exakten Chronologie der Bronzetechnologie in Altägypten. Erzmetall 1990, 43, 265–272. [Google Scholar]
- Pozza, G.; Ajò, D.; Chiari, G.; De Zuane, F.; Favaro, M. Photoluminescence of the inorganic pigments Egyptian blue, Han blue and Han purple. J. Cult. Herit. 2000, 1, 393–398. [Google Scholar] [CrossRef]
- Pabst, A. Structures of some tetragonal sheet silicates. Acta Crystallogr. 1959, 12, 733–739. [Google Scholar] [CrossRef]
- Mazzi, F.; Pabst, A. Re-examination of cuprorivaite. Am. Mineral. 1962, 47, 409–411. [Google Scholar]
- Bensch, W.; Schur, M. Crystal structure of calcium copper phyllo-decaoxotetrasilicate, CaCuSi4O10. Z. Kristallogr. Cryst. Mater. 1995, 210, 530. [Google Scholar] [CrossRef]
- Delamare, F.; Monge, G.; Repoux, M. À la recherche de différentes qualités marchandes dans les bleus égyptiens trouvés à Pompéi. Rivista di Studi Pompeiani 2004, 15, 89–107. [Google Scholar]
- Pliny the Elder. Natural History, Books 33–35, with an English Translation by H. Rackham; Harvard University Press: Cambridge, MA, USA, 1968; Volume IX. [Google Scholar]
- Vitruvius, M.V.P. On Architecture, Books 6–10, Edited and Translated by Frank Granger; Harvard University Press: Cambridge, MA, USA, 1934; Volume II. [Google Scholar]
- Schindelin, J.; Arganda-Carreras, I.; Frise, E.; Kaynig, V.; Longair, M.; Pietzsch, T.; Preibisch, S.; Rueden, C.; Saalfeld, S.; Schmid, B.; et al. Fiji: An open-source platform for biological-image analysis. Nat. Methods 2012, 9, 676–682. [Google Scholar] [CrossRef] [Green Version]
- Schneider, C.A.; Rasband, W.S.; Eliceiri, K.W. NIH Image to ImageJ: 25 years of image analysis. Nat. Methods 2012, 9, 671–675. [Google Scholar] [CrossRef]
- Adams, A.E.; MacKenzie, W.S.; Guilford, C. Atlas of Sedimentary Rocks under the Microscope; Longman: Harlow, Essex, UK, 1984. [Google Scholar]
- Feller, R.L. Artists’ Pigments: A Handbook of Their History and Characteristics; Feller R., L., Ed.; Archetype Publications: London, UK, 1986; Volume 1. [Google Scholar]
- Lafuente, B.; Downs, R.T.; Yang, H.; Stone, N. The power of databases: The RRUFF project. In Highlights in Mineralogical Crystallography; Armbruster, T., Danisi, R.M., Eds.; De Gruyter: Berlin, Germany, 2015; pp. 1–30. [Google Scholar]
- Bruni, S.; Cariati, F.; Casadio, F.; Toniolo, L. Spectrochemical characterization by micro-FTIR spectroscopy of blue pigments in different polychrome works of art. Vib. Spectrosc. 1999, 20, 15–25. [Google Scholar] [CrossRef]
- Bell, I.M.; Clark, R.J.H.; Gibbs, P.J. Raman spectroscopic library of natural and synthetic pigments (pre- ≈ 1850 AD). Spectrochim. Acta Part A Mol. Biomol. Spectrosc. 1997, 53, 2159–2179. [Google Scholar] [CrossRef]
- Guineau, B.; Gratuze, B.; Blet-Lemarquand, M. Caractérisation de boules de bleu égyptien: Analyse par absorption visible et par activation avec des neutrons rapides de cyclotron. ArchéoSciences Revue D’Archéométrie 1997, 21, 121–130. [Google Scholar]
- Warner, T.E. Artificial cuprorivaite CaCuSi4O10 (Egyptian blue) by a salt-flux method. In Synthesis, Properties and Mineralogy of Important Inorganic Materials; Warner, T.E., Ed.; John Wiley & Sons, Ltd.: West Sussex, UK, 2011; pp. 26–49. [Google Scholar]
- Stiegeler, S.E. A Dictionary of Earth Sciences; Palgrave Macmillan: London, UK, 1976. [Google Scholar]
- Giménez, J.; Espriu-Gascon, A.; Bastos-Arrieta, J.; de Pablo, J. Effect of NaCl on the fabrication of the Egyptian blue pigment. J. Archaeol. Sci. Rep. 2017, 14, 174–180. [Google Scholar] [CrossRef]
- Nicola, M.; Seymour, L.M.; Aceto, M.; Priola, E.; Gobetto, R.; Masic, A. Late production of Egyptian blue: Synthesis from brass and its characteristics. Archaeol. Anthropol. Sci. 2019, 11, 5377–5392. [Google Scholar] [CrossRef]
- Hatton, G.D. The Technology of Egyptian Blue. Ph.D. Thesis, University of Oxford, Oxford, UK, 2005. [Google Scholar]
- El Goresy, A. Polychromatic wall painting decorations in monuments of Pharaonic Egypt: Compositions, chronology and painting techniques. In The Wall Paintings of Thera, Proceedings of the First International Symposium, Petros M. Nomikos Conference Centre, Thera, Hellas, 30 August–4 September 1997; Sherratt, S., Ed.; Petros M. Nomikos and the Thera Foundation: Athens, Greece, 2000; pp. 49–70. [Google Scholar]
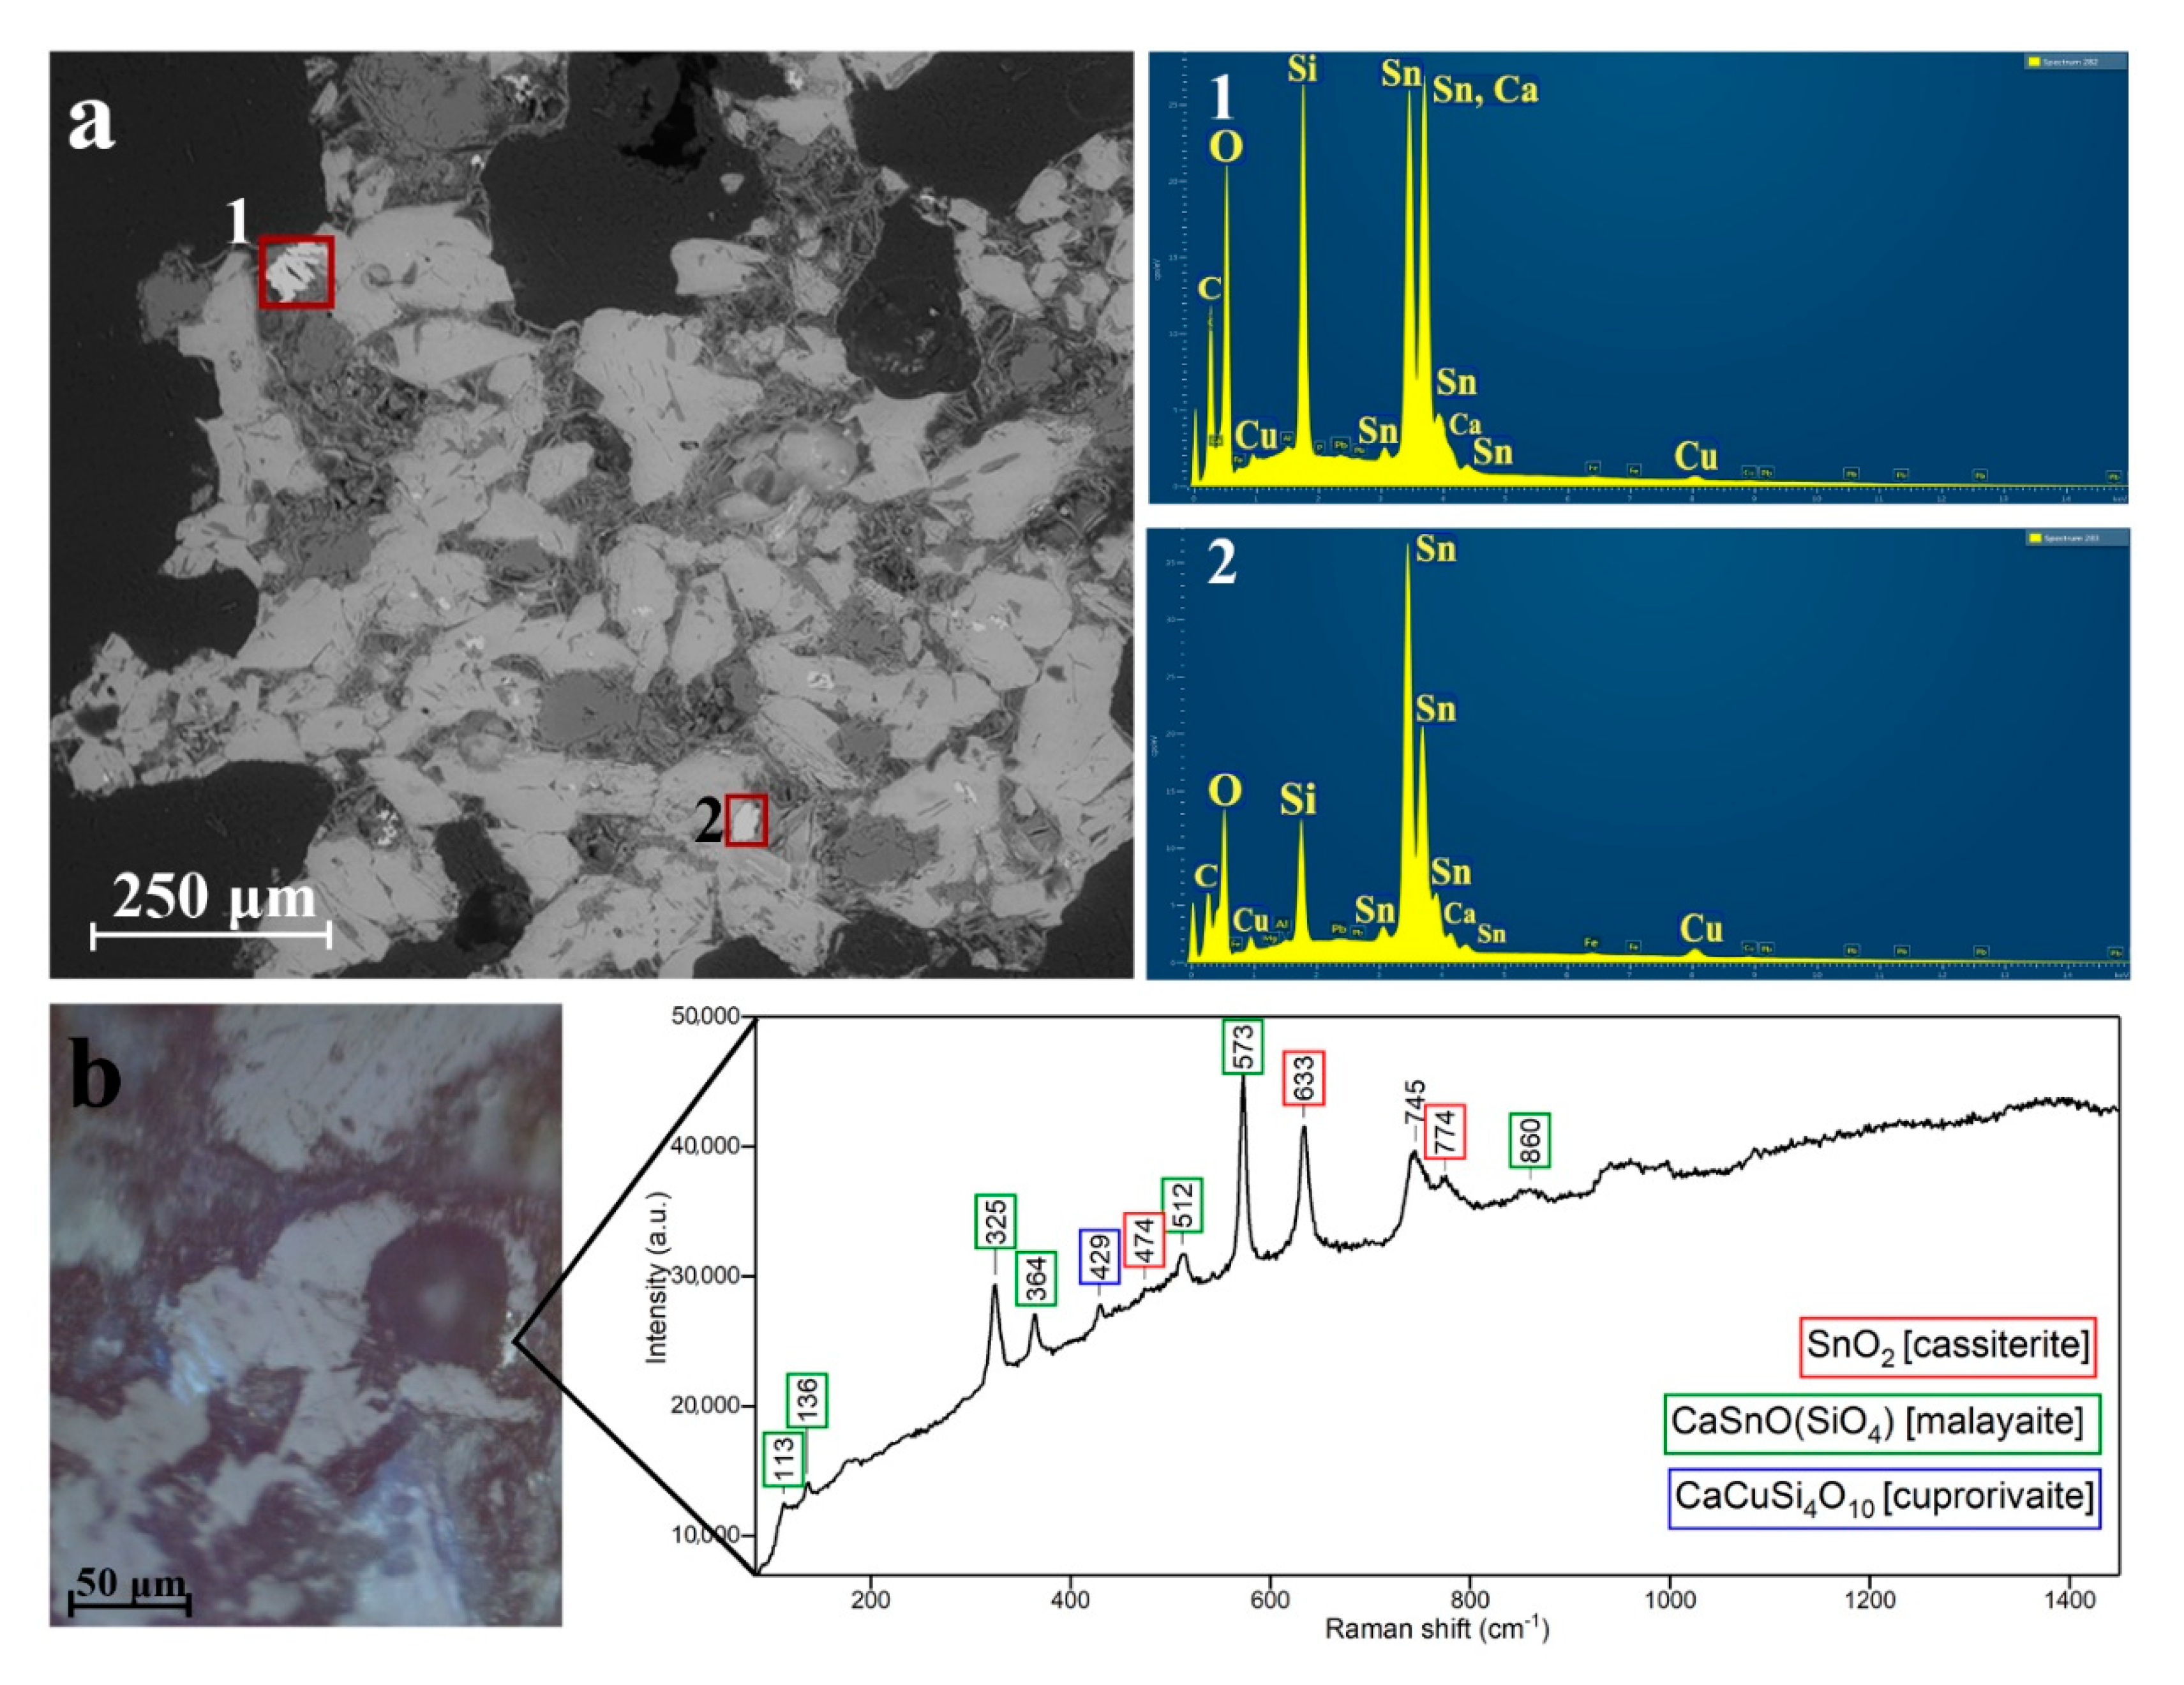
- Scott, J.F. Raman Spectrum of SnO2. J. Chem. Phys. 1970, 53, 852–853. [Google Scholar] [CrossRef]
- Yang, X.-L.; Wan, X.-X. Analysis of the spectral reflectance and color of mineral pigments affected by their particle size. Color Res. Appl. 2020, 45, 246–261. [Google Scholar] [CrossRef]
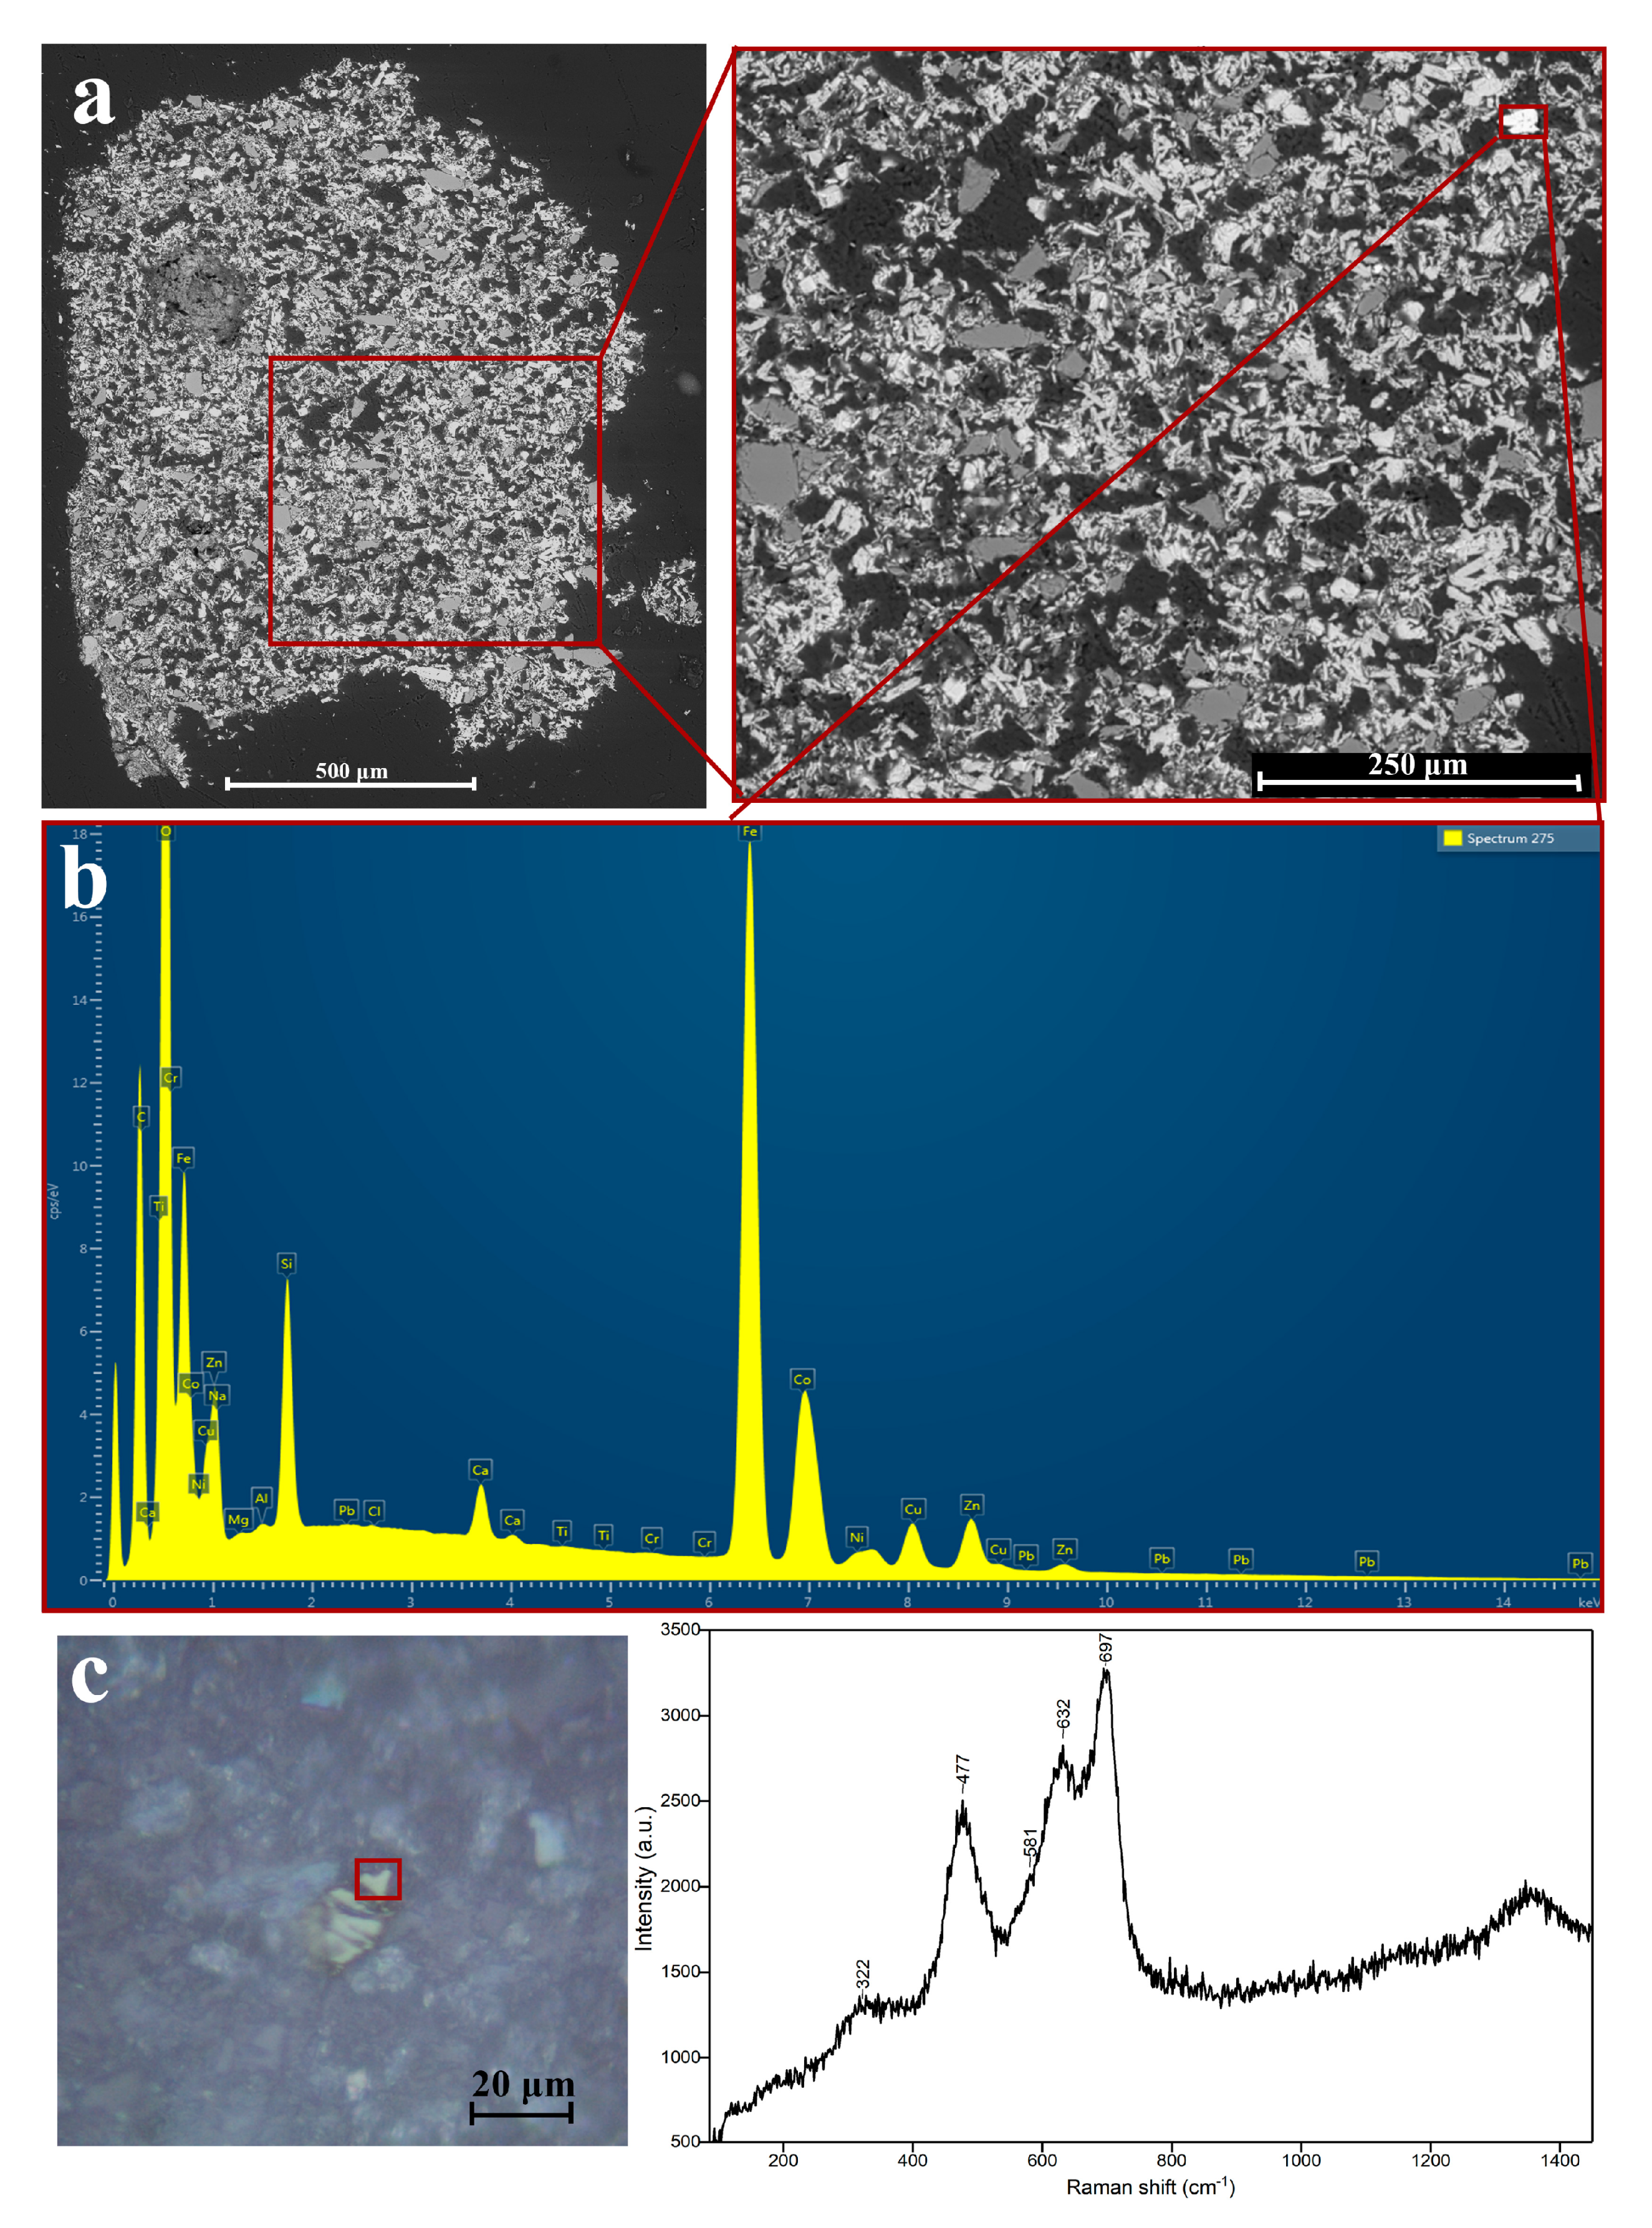
- Wang, W.H.; Ren, X. Flux growth of high-quality CoFe2O4 single crystals and their characterization. J. Cryst. Growth 2006, 289, 605–608. [Google Scholar] [CrossRef]
- Wang, T.; Zhu, T.; Brunet, M.; Deshayes, C.; Sciau, P. Raman study of Yuan Qinghua porcelain: The highlighting of dendritic CoFe2O4 crystals in blue decorations. J. Raman Spectrosc. 2017, 48, 267–270. [Google Scholar] [CrossRef]
- Shortland, A.J.; Tite, M.S.; Ewart, I. Ancient exploitation and use of cobalt alums from the Western Oases of Egypt. Archaeometry 2006, 48, 153–168. [Google Scholar] [CrossRef]
- Shortland, A.J.; Tite, M.S. Technological study of Ptolemaic–Early Roman faience from Memphis, Egypt. Archaeometry 2005, 47, 31–46. [Google Scholar] [CrossRef]


| Sample | Find | Location | Description of Find |
|---|---|---|---|
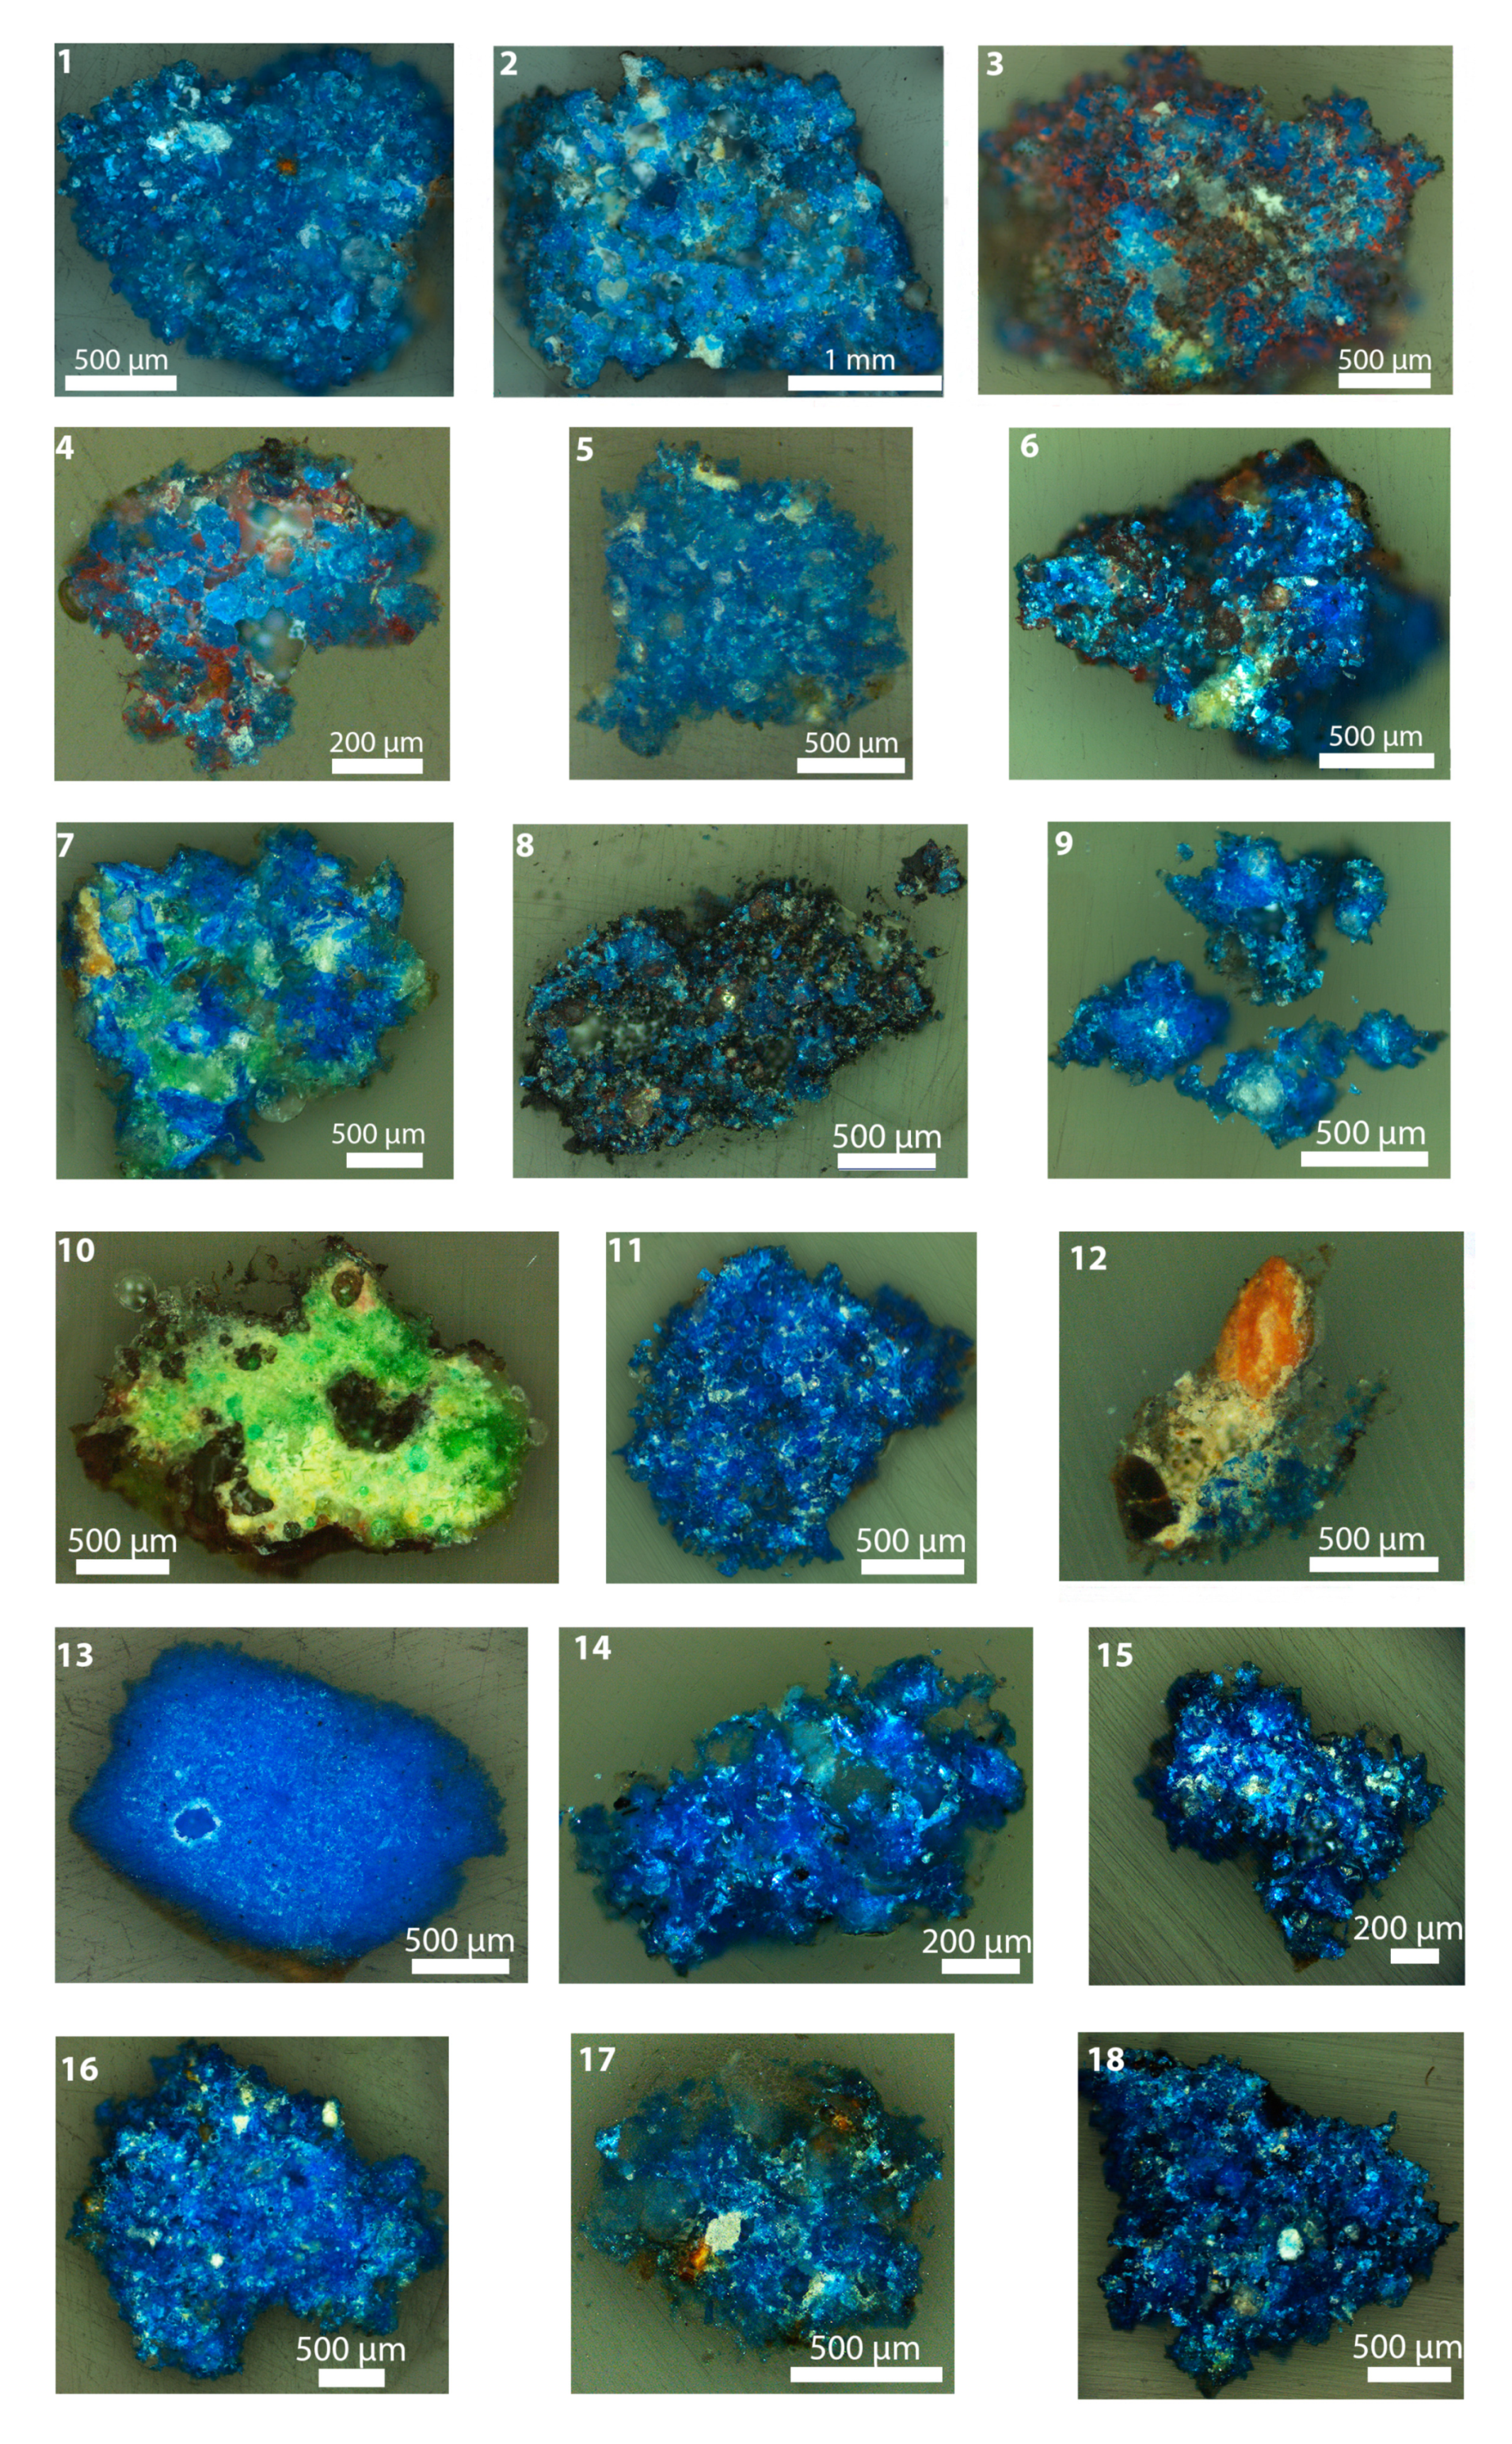
| 1 | AE 879 | W of FS2/NE of FS3 | EB fragments observed among a soil sample. |
| 2 | AE 714 a 34 | FS1 | EB fractured pellet, with limited brown areas. |
| 3 | AE 882 a | NW of FS3 | EB fractured pellet, light blue to grey. |
| 4 | AE 714 a 47 | FS1 | Fragment from EB pellet. |
| 5 | unlabelled | unknown | Fragment from EB pellet. |
| 6 | AE 863 b | FS1 | EB pellet of dark-blue tone. |
| 7 | AE 372 b | south room | Fragment from EB pellet; very coarse blue and green grains, loosely connected agglomerates. |
| 8 | AE 714 a 46 | FS1 | Fragment from EB pellet of dark blue tone; very coarse, loosely connected agglomerates with brown encrustations. |
| 9 | AE 728 | Wall 4 | Fractured EB pellet. |
| 10 | AE 714 a 6 | FS1 | Unsuccessfully produced EB pellet; grey-green surface with red metallic granules adhered. |
| 11 | AE 771 a | south room | Fragment from EB pellet. |
| 12 | AE 1844 | Stoa, W of workshop | Fine-grained EB material mixed with soil, found attached on a pottery sherd. |
| 13 | AE 1085 | E of workshop | Light blue, fine-grained lump with high tinting power. |
| 14 | AE 999 | sporadic find | Fractured EB pellet. |
| 15 | AE 1598 | EW street, E of workshop | Fractured EB pellet. |
| 16 | AE 1635 | E of workshop | Fractured EB pellet. |
| 17 | AE 1702 | E of south room | Fractured light blue, fine-grained pellet. |
| 18 | AE 714 a 41 | FS1 | Fractured EB pellet. |
| Sample | EDS | Raman Spectroscopy | ||
|---|---|---|---|---|
| Major | Minor | Trace | ||
| 1 | O, C, Si, Cu, Ca | Fe | Pb, S, Al, Mg, K, Na, Sn, Au | Cuprorivaite, quartz |
| 2 | O, C, Si, Cu, Ca | Fe, Al | S, Na, As, P, Cl, Pb, Mg, Al, Sn, K, Ti | Cuprorivaite, quartz, calcite |
| 3 | O, C, Si, Cu, Ca | Fe | Al, Pb, S, Mg, Na, Sn, Au, As, P, K, Na, Ti, Cl | Cuprorivaite, quartz, tenorite |
| 4 | O, C, Si, Cu, Ca | Fe, Al | P, K, Na, Fe, Mg, Pb, Sn, Na, Cl | Cuprorivaite, quartz, calcite |
| 5 | O, C, Si, Cu, Ca | Fe, Al | Pb, Sn, K, Mg, Na, S | Cuprorivaite, quartz, calcite |
| 6 | O, C, Si, Cu, Ca | Fe, Al, Na | Sn, Mg, Pb, K, P, Na, S, Ti, Cl | Cuprorivaite, quartz, amorphous silica |
| 7 | O, C, Si, Cu, Ca | Fe, Al | Mg, K, S, Na, P, Ti, Sn, Pb | Cuprorivaite, quartz, calcite, anatase |
| 8 | O, C, Si, Cu, Ca | Fe, Al, Pb | K, Na, Mg, Cl, S, P, Na, Sn, Au | Cuprorivaite, quartz, graphite, crystalline silicon |
| 9 | O, C, Si, Cu, Ca | Fe, Al, Pb, Na | Cl, Na, Pb, K, Sn, Mg, Ti, P | Cuprorivaite, quartz, tenorite |
| 10 | O, C, Si, Cu, Ca | Fe, Al, Pb | Mg, K, Cl, P, Sn, Ti | Quartz, chrysocolla |
| 11 | O, C, Si, Cu, Ca | Sn | Pb, Fe, Na, Al, P, Mg, Cl, K, Ti | Cuprorivaite, quartz, malayaite |
| 12 | O, C, Si, Cu, Ca | Al, Mg, Cl, Na, K, Fe, Pb | P, Mn, Na, Sn, Ti | Cuprorivaite, quartz, amorphous carbon, magnetite |
| 13 | O, C, Si, Cu, Ca | Fe, Co | Ni, Sn, Mg, Na, Al, K, Zn, Pb, Cr, S | Cuprorivaite, quartz, rutile, anatase, CoFe2O4 particles |
| 14 | O, C, Si, Cu, Ca | Sn, Al, Na | Fe, K, Pb, Cl, Mg | Cuprorivaite, quartz |
| 15 | O, C, Si, Cu, Ca | Sn | Na, Fe, Al, P, Mg, Cl, K, Ti | Cuprorivaite |
| 16 | O, C, Si, Cu, Ca | Sn | K, Sn, Na, Cl, Al, Zr, S, Pb, P | Cuprorivaite, quartz, anatase, amorphous carbon |
| 17 | O, C, Si, Cu, Ca | Sn | Al, Fe, Na, K, Zr, Mo, P, Ti, S, Mn, Ni | Cuprorivaite, quartz |
| 18 | O, C, Si, Cu, Ca | Sn | Al, Fe, K, Na, Mg, Pb, S, Cl, Ti, P | Cuprorivaite, quartz |
| Sample | Quartz | Cuprorivaite |
|---|---|---|
| 1 | High sphericity angular | Euhedral and subhedral, striated platy particles |
| 2 | Low sphericity subangular | Subhedral, striated and cleaved platy particles |
| 3 | High sphericity subangular to rounded | Subhedral, striated and cleaved platy particles |
| 4 | Low sphericity subangular to rounded | Euhedral platy particles |
| 5 | High sphericity rounded, subangular | Euhedral platy particles |
| 6 | Midsphericity subrounded | Euhedral platy particles |
| 7 | Subrounded elongated | Subhedral, striated and cleaved particles |
| 8 | Rounded to subangular high sphericity | Euhedral platy particles, cleaved |
| 9 | Angular to subangular low to medium sphericity | Euhedral platy particles |
| 10 | Subrounded high sphericity | No cuprorivaite particles observable |
| 11 | Rounded high sphericity | Euhedral platy particles |
| 12 | Rounded high sphericity | Euhedral and cleaved particles |
| 13 | Angular mid sphericity | Subhedral to anhedral particles |
| 14 | Subangular low to high sphericity | Euhedral platy particles |
| 15 | Subangular to angular high to low sphericity | Euhedral platy particles |
| 16 | Angular to subangular high to low sphericity | Euhedral platy particles |
| 17 | Angular to subangular mid sphericity | Euhedral, cleaved particles |
| 18 | Angular to subrounded mid to high sphericity | Euhedral platy particles |
Publisher’s Note: MDPI stays neutral with regard to jurisdictional claims in published maps and institutional affiliations. |
© 2020 by the authors. Licensee MDPI, Basel, Switzerland. This article is an open access article distributed under the terms and conditions of the Creative Commons Attribution (CC BY) license (http://creativecommons.org/licenses/by/4.0/).
Share and Cite
Kostomitsopoulou Marketou, A.; Andriulo, F.; Steindal, C.; Handberg, S. Egyptian Blue Pellets from the First Century BCE Workshop of Kos (Greece): Microanalytical Investigation by Optical Microscopy, Scanning Electron Microscopy-X-ray Energy Dispersive Spectroscopy and Micro-Raman Spectroscopy. Minerals 2020, 10, 1063. https://0-doi-org.brum.beds.ac.uk/10.3390/min10121063
Kostomitsopoulou Marketou A, Andriulo F, Steindal C, Handberg S. Egyptian Blue Pellets from the First Century BCE Workshop of Kos (Greece): Microanalytical Investigation by Optical Microscopy, Scanning Electron Microscopy-X-ray Energy Dispersive Spectroscopy and Micro-Raman Spectroscopy. Minerals. 2020; 10(12):1063. https://0-doi-org.brum.beds.ac.uk/10.3390/min10121063
Chicago/Turabian StyleKostomitsopoulou Marketou, Ariadne, Fabrizio Andriulo, Calin Steindal, and Søren Handberg. 2020. "Egyptian Blue Pellets from the First Century BCE Workshop of Kos (Greece): Microanalytical Investigation by Optical Microscopy, Scanning Electron Microscopy-X-ray Energy Dispersive Spectroscopy and Micro-Raman Spectroscopy" Minerals 10, no. 12: 1063. https://0-doi-org.brum.beds.ac.uk/10.3390/min10121063