Article

The Irreplaceable Contribution of Cross Sections Investigation: Painted Plasters from the Sphinx Room (Domus Aurea, Rome)

by
Alessia Coccato
1,
Maria Cristina Caggiani
1,*,
Roberta Occhipinti
1,
Paolo Mazzoleni
1,
Alessandro D’Alessio
2,
Alfonsina Russo
2 and
Germana Barone
1
1
Department of Biological, Geological and Environmental Sciences, University of Catania, 95127 Catania, Italy
2
Parco Archeologico del Colosseo, 00186 Rome, Italy
*
Author to whom correspondence should be addressed.
Submission received: 1 December 2020 / Revised: 17 December 2020 / Accepted: 18 December 2020 / Published: 22 December 2020

Abstract

:
Fragments and micro-fragments of painted plasters from the Sphinx Room, recently discovered in the Domus Aurea Esquiline wing (Rome, Italy), were studied. They were respectively taken from the debris in the vicinity of the walls and from already damaged edges of the decorated walls. A previous study, mainly based on non-destructive and non-invasive investigations, proved effective in giving a general overview of the employed palette, allowing the comparison with paintings from the same palace and other coeval contexts, and also providing some preliminary hints concerning the pictorial technique. Nevertheless, some issues remained unsolved, concerning the pigment mixtures (e.g., lead-/iron-based yellow to red colors; copper-/iron-based green/greyish areas), and the a fresco/a secco painting technique debate. Therefore, cross sections of the above-mentioned fragments were observed by means of Optical (OM) and Scanning Electron (SEM) Microscopy and analyzed with micro-Raman spectroscopy and Energy Dispersive X-Ray Spectroscopy (EDS), with the aims of: studying the paint layer composition through point analysis and mapping of the elemental distribution; comparing these in relation to what was observed with previously reported non-destructive analyses; studying the stratigraphy of the painted plaster, focusing on the contact between the plaster and the paint.

Graphical Abstract

1. Introduction

Nero’s (37–68 AD) Domus Aurea was built by Severus and Celer after 64 AD, and decorated by the famous painter Fabullus ([1] XXXV, 120). Pre-existing structures impart a different orientation to the Esquiline wing of the Domus [2]. Room 72/bis was discovered at the beginning of 2019, during maintenance works in room 72: it was named “Sphinx room” after the mythological landscape of the North wall.
To our knowledge, investigations on Domus Aurea decorated surfaces were carried out mainly to address conservation issues [3,4,5,6,7], while the studies concerning the mural paintings composition aimed at understanding the pigments and painting techniques employed are very few [5,8,9,10]. Table 1 summarizes the pigments found in each context.
The previously used approach [10] did not allow to unequivocally identify the painting technique, and some unclear points remained concerning the pigmenting agents. Even though lately a non-destructive, complementary, minimally invasive approach is favored in archaeometric research, with the extensive in situ application of multi-analytical approaches, it often leaves numerous questions unresolved, such as the painting technique and the mixtures used [5,8,10,11].
A deeper understanding of painted plaster samples from the Sphinx Room of Domus Aurea is achieved, with optical and electron microscopy, with the contribution from X-rays micro-analysis and micro-Raman spectroscopy.
The Roman painting technique remains a debated topic as discrepancies are observed between historical sources such as Pliny and Vitruvius and the analytical results of dedicated investigations [12,13,14,15,16,17]. The a fresco technique requires a fresh lime mortar, on which a dispersion of the pigment in water is applied [13]. A variant of this technique (mezzo fresco) requires the dispersion of the pigment in lime water or lime paste [16,17], applied on a plaster which has partially dried. In both cases, the binding of the pigment to the wall is due to calcite. On the other hand, secco painting adheres to a dry plaster thanks to an organic binder [13]. In the archaeometric literature on Roman paintings, either the question of the painting technique is not raised and the paintings simply called frescoes [12,13,14,15,16,17], or when searched for, the a fresco and a secco techniques are alternately found [18,19]. Concerning Domus Aurea paintings, this aspect was never considered through cross sections observation. [10] tried to identify possible organic binding media by means of spectroscopic techniques: Traces of an organic matter were found on few spots and tentatively attributed to a proteinaceous binder or to microbial biomass, seen the extensive biological attack in some areas.
The pigments of Roman artists and artisans were mainly of mineral origin, with the white being calcium carbonate (either calcite or aragonite) or lead white; the yellows ochres, Pb-containing or As-containing; the reds, browns and purples ochres or the precious cinnabar and Tyrian purple; the blue Egyptian blue; the greens celadonite/glauconite or mixtures including yellow, green and blue; the black carbon. A hierarchical use of decorative materials is assessed in Roman and pre-Roman archaeology: Paintings were the cheaper option to cover walls, while marbles were the most expensive. Nevertheless, some pigments, called floridi, were selectively used in important rooms [9,18,19,20]. The archaeometric investigation of paintings ([19] and references therein) confirms what known from literary sources, as Vitruvius (1st century BC [21]) and Pliny (1st century AD [1]). Apart from variations due to the craftsmen’s skills, local availability, the patron’s wishes and budget, and the room’s size and purpose, a general common cultural and technical background is evident [9,18,19,22,23,24,25,26]. In order to identify the pigments, a multi-analytical approach based on complementary techniques is often beneficial [5,8,9,27,28,29,30,31,32], with the availability of portable instrumentation being necessary for minimizing the impact of analyses on the archaeological record.
In the present work, for the first time, a systematic study of cross sections was carried out with two specific aims:
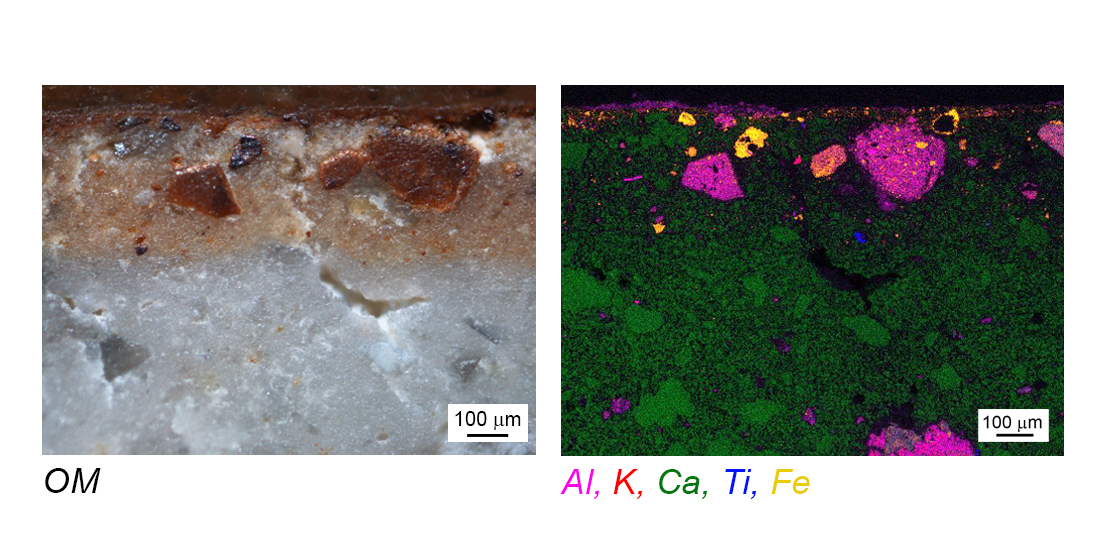
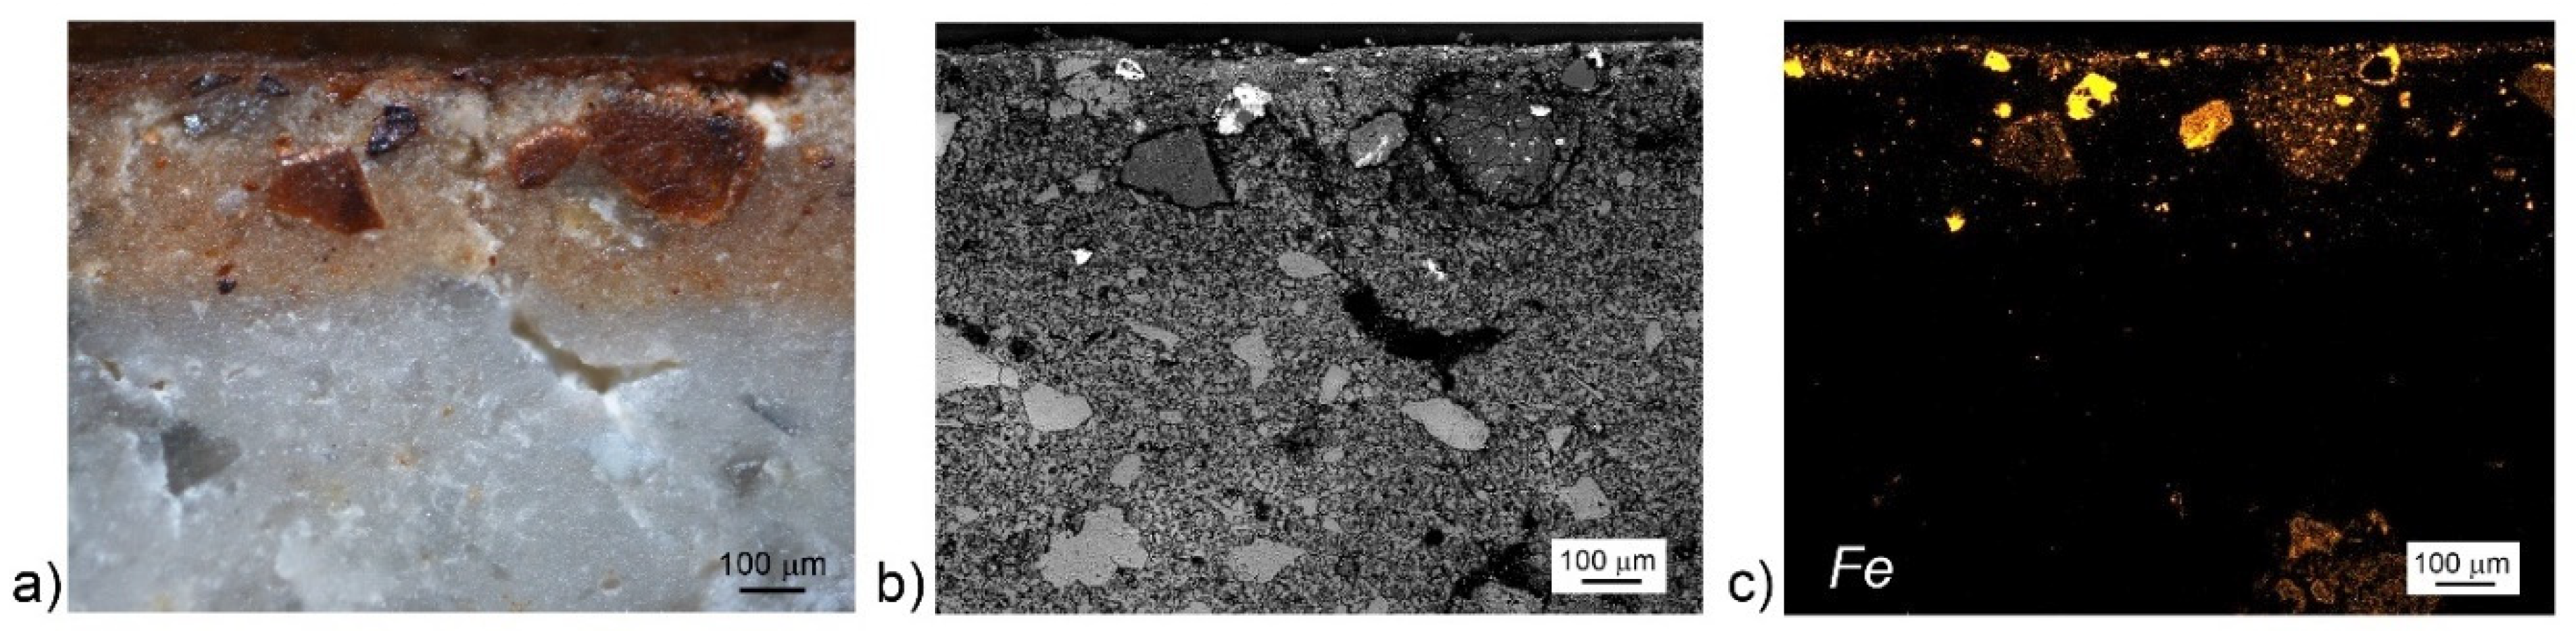
  • Obtaining new information concerning the painting technique of Domus Aurea, both observing the boundary between the plaster and the painted layers and studying the elemental distribution in the various layers, exploiting the unique potential of optical and electron microscopy in this field [33];
  • Confirming and expanding the previous knowledge on Sphinx Room pigmenting agents, as obtained on samples as such [10].

2. Materials and Methods

The Sphinx room (room 72/bis) was discovered in 2019 in the Domus Aurea complex while installing scaffoldings in room 72: From a small birch in its northern wall, the polychrome decorations on white background of a barrel-vaulted room were visible. The “fourth style” paintings represent on the North wall (Figure 1B-B’) a small temple and a mythological figure, hence the denomination of the room. On the visible part of the vault terminating in the East (Figure 1A-A’) and West (Figure 1D-D’) walls—the rest being filled with soil—anthropomorphic and zoomorphic figures are surrounded by vegetal motives and enclosed in red frames; on the South wall (Figure 1C-C’), fewer traces of painting are present. Six fragments were collected from the debris in proximity of the South wall, B1 and B2 (blue) and BL (black), and of the corner between the vault, the South and the West wall, BR (brown), Y (yellow) and YR (yellow-red) (Figure 1). Three much smaller fragments were instead sampled from the walls themselves, choosing hidden, already mechanically damaged edges: R1 (red) and G (green) from the vault and R2 (red) from the North wall [10] (Figure 1).
  • Optical microscopy (OM)
Eight of the nine samples were embedded in epoxy resin and polished with SiC paper (up to 5000 grit size) to obtain cross sections. Only R2 was excluded due to its extremely minute dimensions (Figure 1) that did not allow this preparation without the risk of wasting the pictorial surface. The other samples’ stratigraphy was observed by means of a Nikon Eclipse E400 POL microscope in reflected light, employing external fiber optics illumination source.
  • Scanning Electron Microscopy—Energy Dispersive X-Ray Spectroscopy (SEM-EDS)
The microanalyses were performed using a Tescan Vega LMU scanning electron microscope (SEM), equipped with an EDAX energy dispersive spectrometer (EDS). Data were collected focusing the e-beam on the sample at energy of 20–30 kV and a beam current of 0.2 nA.
All specimens (cross sections and R2 fragment) were made conductive with a graphite coating, with the exception of sample BL, whose color is due to a carbon-based pigment [10], which was analyzed without cover in low vacuum mode. Additionally, more detailed information about the distribution of the relevant elements for each sample has been achieved by X-ray mappings. Mappings were obtained with an acceleration voltage of 20kV.
  • Micro-Raman Spectroscopy
Micro-Raman analyses were carried out using the 50× LWD and 100× objectives of a Jasco NRS3100 spectrometer. The instrument is provided with a Notch filter and a Peltier-cooled (−50 °C) 1024 × 128 CCD detector. Two adjustable-power solid-state laser sources (532 and 785 nm) were used. A spectral resolution of 1 cm−1 is reached (1800 gr/mm grating), while the minimum lateral and depth resolutions can be as low as 1 μm by means of a confocal slit. Calibration was checked with the 520.7 cm−1 Raman band of silicon before each experimental session. The parameters of acquisition were adjusted for each sample taking into account its color and the arising fluorescence. The power values were kept between 0.3 and 10 mW, the time between 10 and 60 s and the accumulations between 3 and 100.

3. Results

3.1. Painting Technique

One of the insights of optical and electronic microscopy observations of the eight samples’ cross sections was on their stratigraphy, with the aim of examining the number and thickness of pigmented layers, as well as the features of the contact between them, such as morphology and sharpness.
All this information can be compared with objective microstratigraphic criteria experimentally searched for in order to distinguish between fresco and lime-painting [34]. These observations lead to the distinction of two groups of samples respectively showing:
  • I. More than one pigmented layer (BL and BR);
  • II. One pigmented layer (YR, Y, B1, B2, G and R1).
Group I. Concerning the black fragment BL, the optical microscope observation at very low magnifications (Figure 2a) shows, superimposed on a coarse plaster base, a quite thick (~5 mm) light red layer. Zooming in on the black pigment, it actually appears constituted of two black layers one on top of the other (Figure 2a), both of variable thickness, but the superficial one markedly thinner (~50 μm) than the undercoat (up to ~500 μm). The former also appears much denser in color, whereas the latter black color appears more diluted in the plaster medium. The presence of coarse aggregate grains in the undercoat (Figure 2a) and the indefinite boundaries between the two layers, also remarkable from the SEM-BSE image of a different portion of the cross section (Figure 2b), which does not highlight any discontinuity, lead to think that both were applied with the fresco technique.
The case of the brown sample BR is somehow analogous, since it exhibits a thick (~350 μm) and coarse light brown undercoat covered by a much thinner (~70 μm) and denser coat (Figure 3a). Once again the fresco technique can be hypothesized: The SEM-BSE observation does not exhibit any carbonation surface between the layers [34] (Figure 3b). Moreover, the chemical map of iron, showing its higher concentration in the most superficial layer, also highlights its dispersion in the plaster (Figure 3c).
The presence of such pigmented layers underlying the visible pictorial surface is attested for Roman paintings, generally of red or yellow color, to obtain the desired shade [14,16,19]. The last application of plaster, i.e., the ground of the paint, could use a mixture in which fine ochre was added [16].
Whereas the grey and light brown undercoats in BL and BR samples, respectively, are clearly applied on purpose, the intentional coloration of the light red layer in the black sample cannot be ascertained. Iron could not be found in detectable concentrations, which could mean that its quantity might be very limited and accidental.
Group II. All the other cross sections show one single pigmented layer. Within this group, clear differences between the samples emerged from the microscopic observations. The yellow (Y) and yellow-red (YR) samples are similar (Figure 1); the latter was cut in correspondence of a tiny red speck of color adjacent to the yellow one (Figure 4c). In both cases, the optical microscopy observation neatly highlighted (1) the variable thickness of the pigmented surface following the shape and unevenness of the base (Figure 4a), (2) the gradual dispersion of color in the plaster, and (3) the total absence of a true pictorial layer with a clear boundary (Figure 4a–c). The penetration of color through a fresh plaster is also evident from the iron distribution map of sample Y (Figure 4d).
The results are different for the other four samples, all showing a sharp contact between the base and the pigmented layer.
The blue samples (B1, B2) clearly exhibit a bright white layer (~10 μm thick) on the surface of the plaster and underneath the painting [34]. It is visible both in the optical microphotographs (Figure 5a) and in the SEM-BSE ones (Figure 5b and Figure 6b); furthermore, the calcium distribution map highlights a higher concentration of this element in correspondence of this interface (Figure 5c). This can be therefore interpreted as the carbonation surface of the dry substrate before the pigment application (mezzo fresco). Lime-paint technique employ can be hypothesized. The other expected Ca-rich layer on the outermost surface, which would unequivocally point at this technique [34], is more evident in some areas of B2 sample (Figure 6c). Natural alteration processes could have caused the erosion of the first few micrometers of surface and could explain its discontinuity or its absence in other samples.
It must also be remarked that, in correspondence of the intermediate carbonation layer a discontinuity surface is formed, and a fracture can become visible in SEM-BSE images following its profile (Figure 6c).
The dark border visible in the SEM-BSE microphotographs of green (G) and red (R1) cross sections could be ascribed to a discontinuity surface (Figure 7b,d, respectively). This sort of contact line is attested in the literature for Byzantine wall paintings and assigned to the application of paint on a dry wall [35], probably also in this case with lime binder, as inferable from the Ca-rich line sometimes visible on the top. The sharp contact between the pigmented layer and the substrate is evident also in OM images (Figure 7a,c) and in the iron distribution map (Figure 7e), especially if compared with those of the samples classified as a fresco (Figure 2a, Figure 3a,c and Figure 4). Actually, in Figure 7d, a double border is visible, probably ascribable to two separate interventions.

3.2. Pigmenting Materials

Micro-Raman analyses on the surface layer of the black sample BL are reported in [10]. The presence of carbon-based black was also ascertained by SEM-EDS point analyses. These were carried out on the uncoated sample, using low vacuum. As carbon is present both in the pigment and in the carbonatic plaster, a 4-point transect was acquired, and the variation of carbon and calcium peak intensities observed from EDS spectra. As expected, calcium is at its highest in the unpigmented plaster (Figure 2c, Spectrum 1); calcium and carbon are both present in the grey undercoat (Figure 2c, Spectra 2 and 3), with calcium diminishing drastically in the top layer, where carbon is conversely higher (Figure 2c, Spectrum 4). Therefore, a carbon-based black pigment has been used in both layers.
Sample BR shows a brick-red shade both on the surface layer and in some large crystals in the thick light red underlayer. The iron distribution from EDS maps (Figure 3c) clearly shows an iron-based pigment for these similarly colored areas. The Raman spectra acquired on these grains all show similar features: Spectrum BR (Figure 8) is the average of 3 points. The broad bands at 350, 497, and 637–717 cm−1 can support the identification of maghemite γFe2O3 [36,37,38,39]. Maghemite is a yellowish brown compound, which has been reported to form by heating of lepidocrocite γFeO(OH) [37]. As Raman spectra were acquired with 10 mW of a 785 nm laser, this option has to be considered.
Both samples Y and YR show iron in the pigmented areas as depicted by SEM-EDS analyses (Figure 4d). From micro-Raman analyses, the spectrum of goethite α-FeOOH can be recognized by bands at 204, 300, 393, and 555 cm−1 [37] (Figure 8, spectrum Y). Moreover, both samples interestingly show the presence of dark crystals (Figure 4c), which were identified as pyroxene, diopside CaMgSi2O6 or augite (Ca,Mg,Fe2+,Fe3+,Ti,Al)2(Si,Al)2O6, thanks to the bands at 327, 389, 662, and 1005 cm−1 [40] (Figure 8, spectrum YR).
The red iron-rich pigment was identified as red ochre in the red portion of sample YR, as well as in samples R1 and R2. The bands of hematite α-Fe2O3 are recognized at 227, 298, 413, 500, 614, 670 cm−1 [37]. Moreover, sample R2 (spectrum R2, Figure 8) from the North wall also shows the main Raman bands of barium sulphate BaSO4 at 988 cm−1 and of calcite at 1087 cm−1 [41], as well as the X-ray lines of Al, Si, S, Ca, Ba, and Fe. Iron-rich clay minerals are present in the carbonated layer. Ba and S, whose presence was already highlighted in [10], are present on the surface of the painted plaster in the form of platelet-like BaSO4 crystals (Figure S1). Barium sulphate has also been identified in sample BR by EDS analysis. This compound could be linked to wall constituents or to environmental contamination associated with bio-induced precipitation [10].
The green sample G clearly shows the use of a mixture of pigments, as also blue grains are visible in the OM photo (Figure 7a). Green paint layers are often complex mixtures, where green earths are mixed with other pigments, such as yellow ochres (which contain both iron oxi-hydroxides and aluminosilicate clay minerals), other iron-rich green minerals such as serpentine, and/or copper-containing pigments (Egyptian blue or green, which are silicates; malachite) [42]. The discrimination between glauconite and celadonite is possible using infrared or Raman spectroscopies, XRD, and chemical data [42,43,44]. Ratios among Na, Mg, Al, Si, K, and Fe elemental contents have been used to propose criteria for discrimination [42,43,44]. The acquisition of good quality Raman spectra on green earths is not straightforward on archaeological samples [41], and the EDS point analyses are likely to simultaneously detect the elemental signatures of the various components of the inhomogeneous pigmented layer, therefore, hampering the quantitative information on the composition of the analyzed point. The distinction between glauconite and celadonite remains unclear [42].
The elemental distribution from SEM-EDS (Figure 9a) shows the elements Cu, Fe and K: the first corresponds to blue grains in OM images (Figure 7a), while the other two are associated in the green matrix and are considered markers for green earths [45]. The blue grains were successfully identified as Egyptian blue thanks to Raman bands at 428, 473, 569, 1008, and 1083 cm−1 [41,46] (Figure 8, spectrum G). The band at 279 cm−1 is interpreted as a calcite vibrational mode, whose ν1-symmetric CO3 stretching overlaps with the band at 1083 cm−1 of Egyptian blue [47].
The correspondence between the distribution of blue particles in OM images (Figure 5a and Figure 7a) and the copper distribution from SEM-EDS maps (Figure 9) is evident.
Egyptian blue is recognized also on sample B2 (Figure 8 and Figure 10). The simultaneous presence of silicon, calcium and copper in the EDS spectra on the blue areas suggests the presence of cuprorivaite and of other non-stoichiometric compounds associated with the production process of Egyptian blue [46,48,49,50]. The intensity ratios between these elements have been demonstrated to vary, as cuprorivaite and non-stoichiometric compounds are formed according to fabrication processes [50,51]. On the other hand, the darker area indicated as 1 in Figure 10 has a different composition, including also Na, Mg, Cl, K, and Fe. This has been interpreted in literature as a glassy phase of blue color, formed in the production of Egyptian blue, which suggests a specific recipe based on alkali flux, possibly natron (Na2CO3·10H2O), together with costal plant ashes [46,48,49]. The Raman spectra B2–1 and B2–2 in Figure 8 correspond to point 2 analyzed by EDS in Figure 10. The Raman bands of Egyptian blue are clearly visible, and display the doublet at 358–376 cm−1, which is attributed to polarization effects and not to manufacturing processes [46,50].

4. Discussion

Concerning the painting technique, varied results emerged from the optical and electron microscopy observations: Some samples showed one (Y, YR) or more (BL, BR) a fresco pigmented coats, some others, a unique lime paint pictorial layer (B1, B2, G, R1). Being most of this sampling forcefully coming from the debris, here it is not possible to refer the different techniques to specific spots of the paintings, also given that there is no connection between them and the areas of collection, neither there is with their colors or employed pigment. All this taken into account, together with the small number of investigated samples, it can be deduced that a variety of painting techniques could be used in the same room, obtaining different pictorial effects even if starting with the same raw materials.
Indeed, the palette identification did not reflect the techniques variety and mainly confirmed the results reported in [10]. Egyptian blue, carbon-based black, red, and yellow ochres usage was ascertained. On the other hand, the knowledge on the composition of almost all the colors was considerably deepened. For brown, iron oxides different from hematite were found: previously, magnetite was identified [10] and in this work maghemite, which could constitute the laser-induced heating product of lepidocrocite. The presence of green earths in the green sample was better ascertained and the addition in the same of Egyptian blue was found. This mixture has been revealed in numerous contexts [43,52], including Domus Aurea [8]. The observation and analysis of the blue sample B2 resulted in the detection of a glassy phase as residual of the pigment production and of its manufacturing recipe [46,51]. Pyroxenes presence was revealed in both yellow layers. As they are not used as pigmenting agents, they are most likely related to the plaster: Diopside has been found in Pompeii in the preparation layers of yellow and red paint [53]. Even though Pb-pigments were used in some areas of the Sphinx room decoration [10], the available samples did not allow to identify them neither with Raman nor with SEM-EDS in the yellow and red shades.

5. Conclusions

In the balance between non-invasive and destructive or micro-destructive cultural heritage investigation, cross sections study can result vital for wall paintings, both for the observation of layers and boundaries and for their analysis [11]. This study allowed to widen the knowledge on the range of solutions and materials used by Roman artists and artisans to apply polychromy on walls, and specifically in the Domus Aurea exceptional context.
A variety of painting techniques has been highlighted by cross-section observation, both with optical and electron microscopy, encompassing one or more a fresco layers, as well as the use of lime paint. It appears therefore that, in the same room, different painting techniques were employed.
As the pigmenting agents are concerned, the general palette of the Sphinx Room is composed of Egyptian blue, carbon-based black, red and yellow ochres, and green earths. Interesting results were obtained by the combination of elemental and molecular analyses on cross sections, namely, the presence of elemental markers for Egyptian blue fabrication (Na, Cl), the addition of Egyptian blue to green earths in green areas, and the detection of the iron hydroxide maghemite, suggesting the use of lepidocrocite. The two former results confirm the knowledge on synthetic pigments and on mixtures, while the latter points out the need for careful analysis of iron-rich pigments, as the range of used materials is likely wider than the commonly inferred oxi-hydroxides hematite and goethite/limonite.

Supplementary Materials

The following are available online at https://0-www-mdpi-com.brum.beds.ac.uk/2075-163X/11/1/4/s1. Figure S1: SEM-BSE microphotograph of R2 sample, and respective ED spectra, stacked for clarity.

Author Contributions

Conceptualization, G.B., A.D. and P.M.; methodology, G.B., M.C.C., A.C., P.M. and R.O.; formal analysis and investigation, G.B., M.C.C., A.C., P.M. and R.O.; writing—original draft preparation, M.C.C., A.C., A.D. and R.O.; funding acquisition, G.B. and P.M.; supervision, A.R. All authors read and approved the final manuscript. All authors have read and agreed to the published version of the manuscript.

Funding

This work is supported by found of the “Programma Ricerca di Ateneo UNICT 2020-22 linea 2” of the Department of Biological, Geological and Environmental Sciences, University of Catania.

Data Availability Statement

Data is contained within the article or supplementary material.

Acknowledgments

The authors thank Maria Bartoli, restorer of the PArCo, and all the Domus Aurea staff, and particularly Architect Stefano Borghini, technical manager; Elisabetta Segala, archaeologist; Landscape Architect Gabriella Strano; and Surveyor Maurizio Pesce, technology official. Giulia Giovanetti, archaeologist, is thanked for fruitful discussions.

Conflicts of Interest

The authors declare no conflict of interest.

References

  1. Elder, P.T. The Natural History; Taylor and Francis: London, UK, 1855. [Google Scholar]
  2. Ball, L.F. The Domus Aurea and the Roman Architectural Revolution; Cambridge University Press: Cambridge, UK, 2003. [Google Scholar]
  3. Albertano, P.; Luongo, L.; Grilli Caiola, M. Influence of different lights of mixed cultures of microalgae from ancient frescoes. Int. Biodeterior. 1991, 27, 27–38. [Google Scholar] [CrossRef]
  4. Giavarini, C. Domus Aurea: The conservation project. J. Cult. Herit. 2001, 2, 217–228. [Google Scholar] [CrossRef]
  5. Paradisi, A.; Sodo, A.; Artioli, D.; Botti, A.; Cavezzali, D.; Giovagnoli, A.; Polidoro, C.; Ricci, M.A. Domus aurea, the “Sala delle maschere”: Chemical and spectroscopic investigations on the fresco paintings. Archaeometry 2012, 54, 1060–1075. [Google Scholar] [CrossRef]
  6. Albero, S.; Giavarini, C.; Santarelli, M.L.; Vodret, A. CFD modeling for the conservation of the Gilded Vault Hall in the Domus Aurea. J. Cult. Herit. 2004, 5, 197–203. [Google Scholar] [CrossRef]
  7. Barone, P.M.; Mattei, E.; Lauro, S.E.; Pettinelli, E. Non-destructive technique to investigate an archaeological structure: A GPR survey in the Domus Aurea (Rome, Italy). In Proceedings of the XIII Internarional Conference on Ground Penetrating Radar, Lecce, Italy, 21–25 June 2010; pp. 1–4. [Google Scholar]
  8. Clementi, C.; Ciocan, V.; Vagnini, M.; Doherty, B.; Tabasso, M.L.; Conti, C.; Brunetti, B.G.; Miliani, C. Non-invasive and micro-destructive investigation of the Domus Aurea wall painting decorations. Anal. Bioanal. Chem. 2011, 401, 1815–1826. [Google Scholar] [CrossRef] [PubMed]
  9. Payne, E.; Booms, D. Analysis of pigment palettes as evidence for room status in Nero’s Golden House. Tech. Res. Bull. 2014, 8, 117–126. [Google Scholar]
  10. Caggiani, M.C.; Coccato, A.; Mazzoleni, P.; D’Alessio, A.; Russo, A.; Barone, G. Integrated analytical approach to unveil the secrets of the recently discovered “Sphinx Room”: A new piece of Domus Aurea puzzle—Accepted. Herit. Sci. 2020, 8, 1–21. [Google Scholar] [CrossRef]
  11. Bracci, S.; Bartolozzi, G. Wall paintings—Diagnostic and archaeometric studies. Phys. Sci. Rev. 2019, 4, 1–12. [Google Scholar] [CrossRef]
  12. Amadori, M.L.; Barcelli, S.; Poldi, G.; Ferrucci, F.; Andreotti, A.; Baraldi, P.; Colombini, M.P. Invasive and non-invasive analyses for knowledge and conservation of Roman wall paintings of the Villa of the Papyri in Herculaneum. Microchem. J. 2014, 118, 183–192. [Google Scholar] [CrossRef]
  13. Apostolaki, C.; Perdikatsis, V.; Repuskou, E.; Brecoulaki, H.; Lepinski, S. Analysis of Roman wall paintings from ancient Corinth/Greece. Adv. Miner. Resour. Manag. Environ. Geotechnol. Hania 2006, 729–734. [Google Scholar]
  14. Bakiler, M.; Kirmizi, B.; Ormanci Öztürk, Ö.; Boso Hanyali, Ö.; Dağ, E.; Çağlar, E.; Köroğlu, G. Material characterization of the Late Roman wall painting samples from Sinop Balatlar Church Complex in the black sea region of Turkey. Microchem. J. 2016, 126, 263–273. [Google Scholar] [CrossRef]
  15. Linn, R. Layered pigments and painting technology of the Roman wall paintings of Caesarea Maritima. J. Archaeol. Sci. Rep. 2017, 11, 774–781. [Google Scholar] [CrossRef]
  16. Weber, J.; Prochaska, W.; Zimmermann, N. Microscopic techniques to study Roman renders and mural paintings from various sites. Mater. Charact. 2009, 60, 586–593. [Google Scholar] [CrossRef]
  17. Ergenç, D.; La Russa, M.F.; Ruffolo, S.A.; Fort, R.; Sánchez Montes, A.L. Characterization of the wall paintings in La Casa de los Grifos of Roman city Complutum. Eur. Phys. J. Plus 2018, 133, 355. [Google Scholar] [CrossRef]
  18. Moormann, E.M. Roman Wall Painting. Encycl. Glob. Archaeol. 2018, 1–22. [Google Scholar] [CrossRef]
  19. Siddall, R. Not a day without a line drawn: Pigments and painting techniques of Roman Artists. InFocus Mag. Proc. R. Microsc. Soc. 2006, 2, 18–31. [Google Scholar] [CrossRef] [Green Version]
  20. Barone, G.; Mazzoleni, P.; Cecchini, A.; Russo, A. In situ Raman and pXRF spectroscopic study on the wall paintings of Etruscan Tarquinia tombs. Dyes Pigments 2018, 150, 390–403. [Google Scholar] [CrossRef]
  21. Vitruvius. Ten Books on Architecture; Cambridge University Press: New York, NY, USA, 2001. [Google Scholar]
  22. Birolo, L.; Tomeo, A.; Trifuoggi, M.; Auriemma, F.; Paduano, L.; Amoresano, A.; Vinciguerra, R.; de Rosa, C.; Ferrara, L.; Giarra, A.; et al. A hypothesis on different technological solutions for outdoor and indoor Roman wall paintings, Archaeol. Anthropol. Sci. 2017, 9, 591–602. [Google Scholar]
  23. De Vos, M. La bottega di pittori di via Castricio. In POMPEI 1748-1980 I Tempi Della Documentazione; Multigrafica Editrice: Rome, Italy, 1981. [Google Scholar]
  24. Mazzocchin, G.A.; Agnoli, F.; Mazzocchin, S.; Colpo, I. Analysis of pigments from Roman wall paintings found in Vicenza. Talanta 2003, 61, 565–572. [Google Scholar] [CrossRef]
  25. Baraldi, P.; Baraldi, C.; Curina, R.; Tassi, L.; Zannini, P. A micro-Raman archaeometric approach to Roman wall paintings. Vib. Spectrosc. 2007, 43, 420–426. [Google Scholar] [CrossRef]
  26. Mazzocchin, G.A.; Orsega, E.F.; Baraldi, P.; Zannini, P. Aragonite in roman wall paintings of the Viiia regio, aemilia, and Xa regio, venetia et histria. Ann. Chim. 2006, 96, 377–387. [Google Scholar] [CrossRef] [PubMed]
  27. Artioli, G.; Angelini, I. (Eds.) Scientific Methods and Cultural Heritage: An Introduction to the Application of Materials Science to Archaeometry and Conservation Science; Oxford University Press: Oxford, UK, 2010. [Google Scholar]
  28. Bersani, D.; Lottici, P.P. Raman spectroscopy of minerals and mineral pigments in archaeometry. J. Raman Spectrosc. 2016, 47, 499–530. [Google Scholar] [CrossRef]
  29. Janssens, K.; Van Grieken, R. (Eds.) Non-Destructive Microanalysis of Cultural Heritage Materials; Elsevier: Amsterdam, The Netherlands, 2004. [Google Scholar]
  30. Seccaroni, C.; Moioli, P.; Luchinat Acidini, C. Fluorescenza X: Prontuario per l’analisi XRF Portatile Applicata a Superfici Policrome; Nardini Editore: Firenze, Italy, 2002. [Google Scholar]
  31. Uda, M.; Demortier, G.; Nakai, I. (Eds.) X-rays for Archaeology; Springer: Dordrecht, The Netherlands, 2005. [Google Scholar]
  32. Vandenabeele, P.; Donais, M.K. Mobile Spectroscopic Instrumentation in Archaeometry Research. Appl. Spectrosc. 2016, 70, 27–41. [Google Scholar] [CrossRef] [PubMed]
  33. Piovesan, R. Archaeometrical Investigations on Mortars and Paintings at Pompeii and Experiments for the Determination of the Painting Technique; Univeristy of Padua: Padua, Italy, 2009. [Google Scholar]
  34. Piovesan, R.; Mazzoli, C.; Maritan, L.; Cornale, P. Fresco and lime-paint: An experimental study and objective criteria for distinguishing between these painting techniques. Archaeometry 2012, 54, 723–736. [Google Scholar] [CrossRef]
  35. Demir, S.; Şerifaki, K.; Böke, H. Execution technique and pigment characteristics of Byzantine wall paintings of Anaia Church in Western Anatolia. J. Archaeol. Sci. Rep. 2018, 17, 39–46. [Google Scholar] [CrossRef]
  36. Froment, F.; Tournié, A.; Colomban, P. Raman identification of natural red to yellow pigments: Ochre and iron-containing ores. J. Raman Spectrosc. 2008, 39, 560–568. [Google Scholar] [CrossRef]
  37. De Faria, D.L.A.; Venâncio Silva, S.; de Oliveira, M.T. Raman microspectroscopy of some iron oxides and oxyhydroxides. J. Raman Spectrosc. 1997, 28, 873–878. [Google Scholar] [CrossRef]
  38. Caggiani, M.C.; Barone, G.; de Ferri, L.; Laviano, R.; Mangone, A.; Mazzoleni, P. Raman and SEM-EDS insights into technological aspects of Medieval and Renaissance ceramics from Southern Italy. J. Raman Spectrosc. 2020. [Google Scholar] [CrossRef]
  39. Nieuwoudt, M.K.; Comins, J.D.; Cukrowski, I. The growth of the passive film on iron in 0.05 M NaOH studied in situ by Raman micro-spectroscopy and electrochemical polarisation. Part I: Near-resonance enhancement of the Raman spectra of iron oxide and oxyhydroxide compounds. J. Raman Spectrosc. 2011, 42, 1335–1339. [Google Scholar] [CrossRef]
  40. Andò, S.; Garzanti, E. Raman spectroscopy in heavy-mineral studies. Geol. Soc. Spec. Publ. 2014, 386, 395–412. [Google Scholar] [CrossRef]
  41. Bell, I.M.; Clark, R.J.H.; Gibbs, P.J. Raman spectroscopic library of natural and synthetic pigments (pre- ≈ 1850 AD), Spectrochim. Acta Part A Mol. Biomol. Spectrosc. 1997, 53, 2159–2179. [Google Scholar] [CrossRef]
  42. Hradil, D.; Píšková, A.; Hradilová, J.; Bezdička, P.; Lehrberger, G.; Gerzer, S. Mineralogy of bohemian green earth pigment and its microanalytical evidence in historical paintings. Archaeometry 2011, 53, 563–586. [Google Scholar] [CrossRef]
  43. Perez-Rodriguez, J.L.; de Haro M del, C.J.; Siguenza, B.; Martinez-Blanes, J.M. Green pigments of Roman mural paintings from Seville Alcazar. Appl. Clay Sci. 2015, 116–117, 211–219. [Google Scholar] [CrossRef]
  44. Moretto, L.M.; Orsega, E.F.; Mazzocchin, G.A. Spectroscopic methods for the analysis of celadonite and glauconite in Roman green wall paintings. J. Cult. Herit. 2011, 12, 384–391. [Google Scholar] [CrossRef]
  45. Coccato, A.; Mazzoleni, P.; Spinola, G.; Barone, G. Two centuries of painted plasters from the Lateran suburban villa (Rome): Investigating supply routes and manufacturing of pigments. J. Cult. Herit. 2020. submitted. [Google Scholar] [CrossRef]
  46. Pagès-Camagna, S.; Colinart, S.; Coupry, C. Fabrication processes of archaeological Egyptian blue and green pigments enlightened by raman microscopy and scanning electron microscopy. J. Raman Spectrosc. 1999, 30, 313–317. [Google Scholar] [CrossRef]
  47. Gunasekaran, S.; Anbalagan, G.; Pandi, S. Raman and infrared spectra of carbonates of calcite structure. J. Raman Spectrosc. 2006, 37, 892. [Google Scholar] [CrossRef]
  48. Grifa, C.; Cavassa, L.; De Bonis, A.; Germinario, C.; Guarino, V.; Izzo, F.; Kakoulli, I.; Langella, A.; Mercurio, M.; Morra, V.; et al. Beyond Vitruvius: New Insight in the Technology of Egyptian Blue and Green Frits. J. Am. Ceram. Soc. 2016, 99, 3467–3475. [Google Scholar] [CrossRef] [Green Version]
  49. Ingo, G.M.; Çilingiroǧlu, A.; Di Carlo, G.; Batmaz, A.; De Caro, T.; Riccucci, C.; Parisi, E.I.; Faraldi, F. Egyptian Blue cakes from the Ayanis fortress (Eastern Anatolia, Turkey): Micro-chemical and -structural investigations for the identification of manufacturing process and provenance. J. Archaeol. Sci. 2013, 40, 4283–4290. [Google Scholar] [CrossRef]
  50. Kostomitsopoulou Marketou, A.; Andriulo, F.; Steindal, C.; Handberg, S. Egyptian Blue Pellets from the First Century BCE Workshop of Kos (Greece): Microanalytical Investigation by Optical Microscopy, Scanning Electron Microscopy-X-ray Energy Dispersive Spectroscopy and Micro-Raman Spectroscopy. Minerals 2020, 10, 1063. [Google Scholar] [CrossRef]
  51. Mazzocchin, G.A.; Rudello, D.; Bragato, C.; Agnoli, F. A short note on Egyptian blue. J. Cult. Herit. 2004, 5, 129–133. [Google Scholar] [CrossRef]
  52. Baraldi, P.; Bonazzi, A.; Giordani, N.; Paccagnella, F.; Zannini, P. Analytical characterization of Roman plasters of the “Domus farini” in Modena. Archaeometry 2006, 48, 481–499. [Google Scholar] [CrossRef]
  53. Piovesan, R.; Siddall, R.; Mazzoli, C.; Nodari, L. The Temple of Venus (Pompeii): A study of the pigments and painting techniques. J. Archaeol. Sci. 2011, 38, 2633–2643. [Google Scholar] [CrossRef]
Figure 1. Extract of the Domus Aurea planimetry focusing on “Sphinx Room” and relative sections, with photos of the fragments collected in the debris (B1, B2, BL, BR, Y, YR) and from hidden edges of the paintings (R1, R2, G). Credits for the sections: A. Blanco, D. Nepi, F.Vozzolo; Copyright of the planimetry: PArCo.
Minerals 11 00004 g001
Figure 2. (a) Optical and (b) SEM-BSE microphotographs of BL sample cross section and (c) respective ED spectra. Spectra are stacked for clarity.
Minerals 11 00004 g002
Figure 3. (a) Optical and (b) SEM-BSE microphotographs of BR sample cross section and (c) respective iron distribution map.
Minerals 11 00004 g003
Figure 4. (a,b) Optical microphotographs of Y and (c) YR samples and (d) iron distribution map for an area of Y sample.
Minerals 11 00004 g004
Figure 5. (a) Optical and (b) SEM-BSE microphotographs of B1 sample cross section and (c) respective calcium distribution map. The red arrows indicate the intermediate carbonation layer.
Minerals 11 00004 g005
Figure 6. SEM-BSE microphotographs of B2 sample cross section: (a) general view, (b) carbonated intermediate layer, and (c) top carbonation layer and discontinuity.
Minerals 11 00004 g006
Figure 7. (a,c) Optical and (b,d) SEM-BSE microphotographs of respectively G and R1 samples cross section and (e) R1 iron distribution map.
Minerals 11 00004 g007
Figure 8. Baseline subtracted micro-Raman representative spectra of the pigmented layers. Spectra are stacked for clarity.
Minerals 11 00004 g008
Figure 9. SEM-EDS elemental distribution of elements copper, iron and potassium and detail optical microscopy images. (a) sample G, (b) sample B1.
Minerals 11 00004 g009
Figure 10. (a) Optical and (b) SEM-BSE microphotographs of B2 sample, and (c) respective ED spectra, stacked for clarity.
Minerals 11 00004 g010
Table 1. Overview of published results concerning pigments used in Domus Aurea.
BlackRedYellowBlueGreenWhitePurpleBrown
Corridor 92 [9] Red ochres/Red lead, (Cinnabar on Pegasus) Egyptian BlueGreen earth
Room 119 [9] Red ochres/Red lead, Cinnabar Egyptian BlueCu-green
Gilded vault [8] Red ochres/Red lead, Cinnabar, Madder lake Egyptian BlueGreen earth + Egyptian Blue Egyptian Blue + Anthraquinonic lake
Sala delle maschere [5]Carbon blackRed ochres/Red lead Egyptian BlueGreen earthCalcite Lead white Fe-based earth
Sphinx room [10]Carbon blackRed ochres/Pb-compoundYellow Ochres/Pb compound (also in orange)Egyptian Blue + GypsumGreen earth + Egyptian Blue?Calcite Gypsum Red ochres Magnetite
Publisher’s Note: MDPI stays neutral with regard to jurisdictional claims in published maps and institutional affiliations.

