Article

Laboratory Study of Deformational Characteristics and Acoustic Emission Properties of Coal with Different Strengths under Uniaxial Compression

College of Mining, Liaoning Technical University, Fuxin 123000, China
*
Author to whom correspondence should be addressed.
Submission received: 21 July 2021 / Revised: 26 September 2021 / Accepted: 28 September 2021 / Published: 29 September 2021
(This article belongs to the Special Issue Minerals Impact on CO2 Geo-sequestration in Deep Reservoirs)

Abstract

:
Acoustic emission (AE) can reflect the dynamic changes in a material’s structure, and it has been widely used in studies regarding coal mechanics, such as those focusing on the influence of loading rate or water content change on the mechanical properties of coal. However, the deformational behavior of coals with various strengths differs due to the variation in microstructure. Hard coal presents brittleness, which is closely related to certain kinds of geological disasters such as coal bursts; soft coal exhibits soft rock properties and large deformation mechanical characteristics. Therefore, conclusions drawn from AE characteristics of a single coal sample have application limitations. This paper studies the deformation patterns and AE characteristics of coals with different strengths. A uniaxial compression experiment was carried out using coal samples with average uniaxial compressive strengths of 30 MPa and 10 MPa; the SAEU2S digital AE system was used to measure the AE counts, dissipation energy, and fracturing point distributions at each deformation stage of the different coals. The results show that the bearing capacity of hard coal is similar to that of the elastic stage and plastic deformation stage, but it may lose its bearing capacity immediately after failure. Soft coal has a relatively distinct stress-softening deformation stage and retains a certain bearing capacity after the peak. The AE counts and dissipation energy of hard coal are significantly higher than those of soft media, with average increases of 49% and 26%, respectively. Via comparative analysis of the distribution and development of internal rupture points within soft coal and hard coal at 15%, 70%, and 80% peak loads, it was observed that hard coal has fewer rupture points in the elastic deformation stage, allowing it to maintain good integrity; however, its rupture points increase rapidly under high stress. Soft coal produces more plastic deformation under low loading conditions, but the development of the fracture is relatively slow in the stress-softening stage. We extracted and summarized the AE characteristics discussed in the literature using one single coal sample, and the results support the conclusions presented in this paper. This study subdivided the deformation process and AE characteristics of soft and hard coals, providing a theoretical guidance and technical support for the application of AE technology in coal with different strengths.

1. Introduction

When a rock mass is subjected to external load, the internal stress of the material is redistributed and its structure is altered, causing stress concentration in the rock mass and sudden energy release accompanied by elastic waves. This phenomenon is called acoustic emission (AE), which has been implemented as an effective technique to study the deformation and failure mechanism of rock, coal, and other geo-materials [1,2]. The deformational behavior and failure mechanism of the rock can be inferred through dynamic observations of the AE reflections. AE technology has played an important role in safety monitoring in underground coal mines [3,4].
Most research regarding AE characteristics focuses on hard rocks [5,6,7,8,9]. Result shows that the AE properties of hard rock rely on the rheology of the rock [7] and are closely related to its failure mode [8]. In underground coal mines, more than 80% of the roadway is excavated in the coal seam, and, as such, the stability and failure mechanism of the coal mass are critical to ensuring roadway stability. Therefore, the application of AE technology is of great significance to the studies of coal mass. In the literature, AE properties were used to investigate the water contents of coal mass to prevent water inrush [10,11,12] and to study the proneness of coal bump for rock burst prevention [13,14]. As the stress path induced by mining activities is a key factor affecting coal mass stability [15,16,17], AE technology has also been used to detect the stress state of coal mass [18,19].
While coal is a typical soft rock, its deformational behavior is dominated by two aspects: its microstructure and gas migration [20,21,22]. The structure of coal mass contributes to its geological conditions, including cleats and joints generated before and after the formation of the coal [23,24,25,26,27,28,29,30,31]. The gas contents and migration rules are dominated by the coal grade, pore structure, and permeability, which, in turn, affect the structural stability of the coal mass [32,33,34,35].
The coal matrix, microstructure, and gas contents are considerably differ from case to case. In practice, coal is classified as either hard coal or soft coal from the perspective of excavation. Their deformational behaviors considerably differ, and, therefore, their AE properties may also greatly vary. In the literature, we found only one article [36] studying the AE reflection of the coal deformation undertaken with consideration of different coal strengths; however, the testing procedure was not clearly described, not even addressing the strength of the coal samples. This paper investigated the characteristics and distinctions of AE reflections on the deformation of hard coal and soft coal under uniaxial compression. It provided a basis for the structural stability and failure mechanism of different coals using AE technology in underground coal mining.

2. Materials and Methods

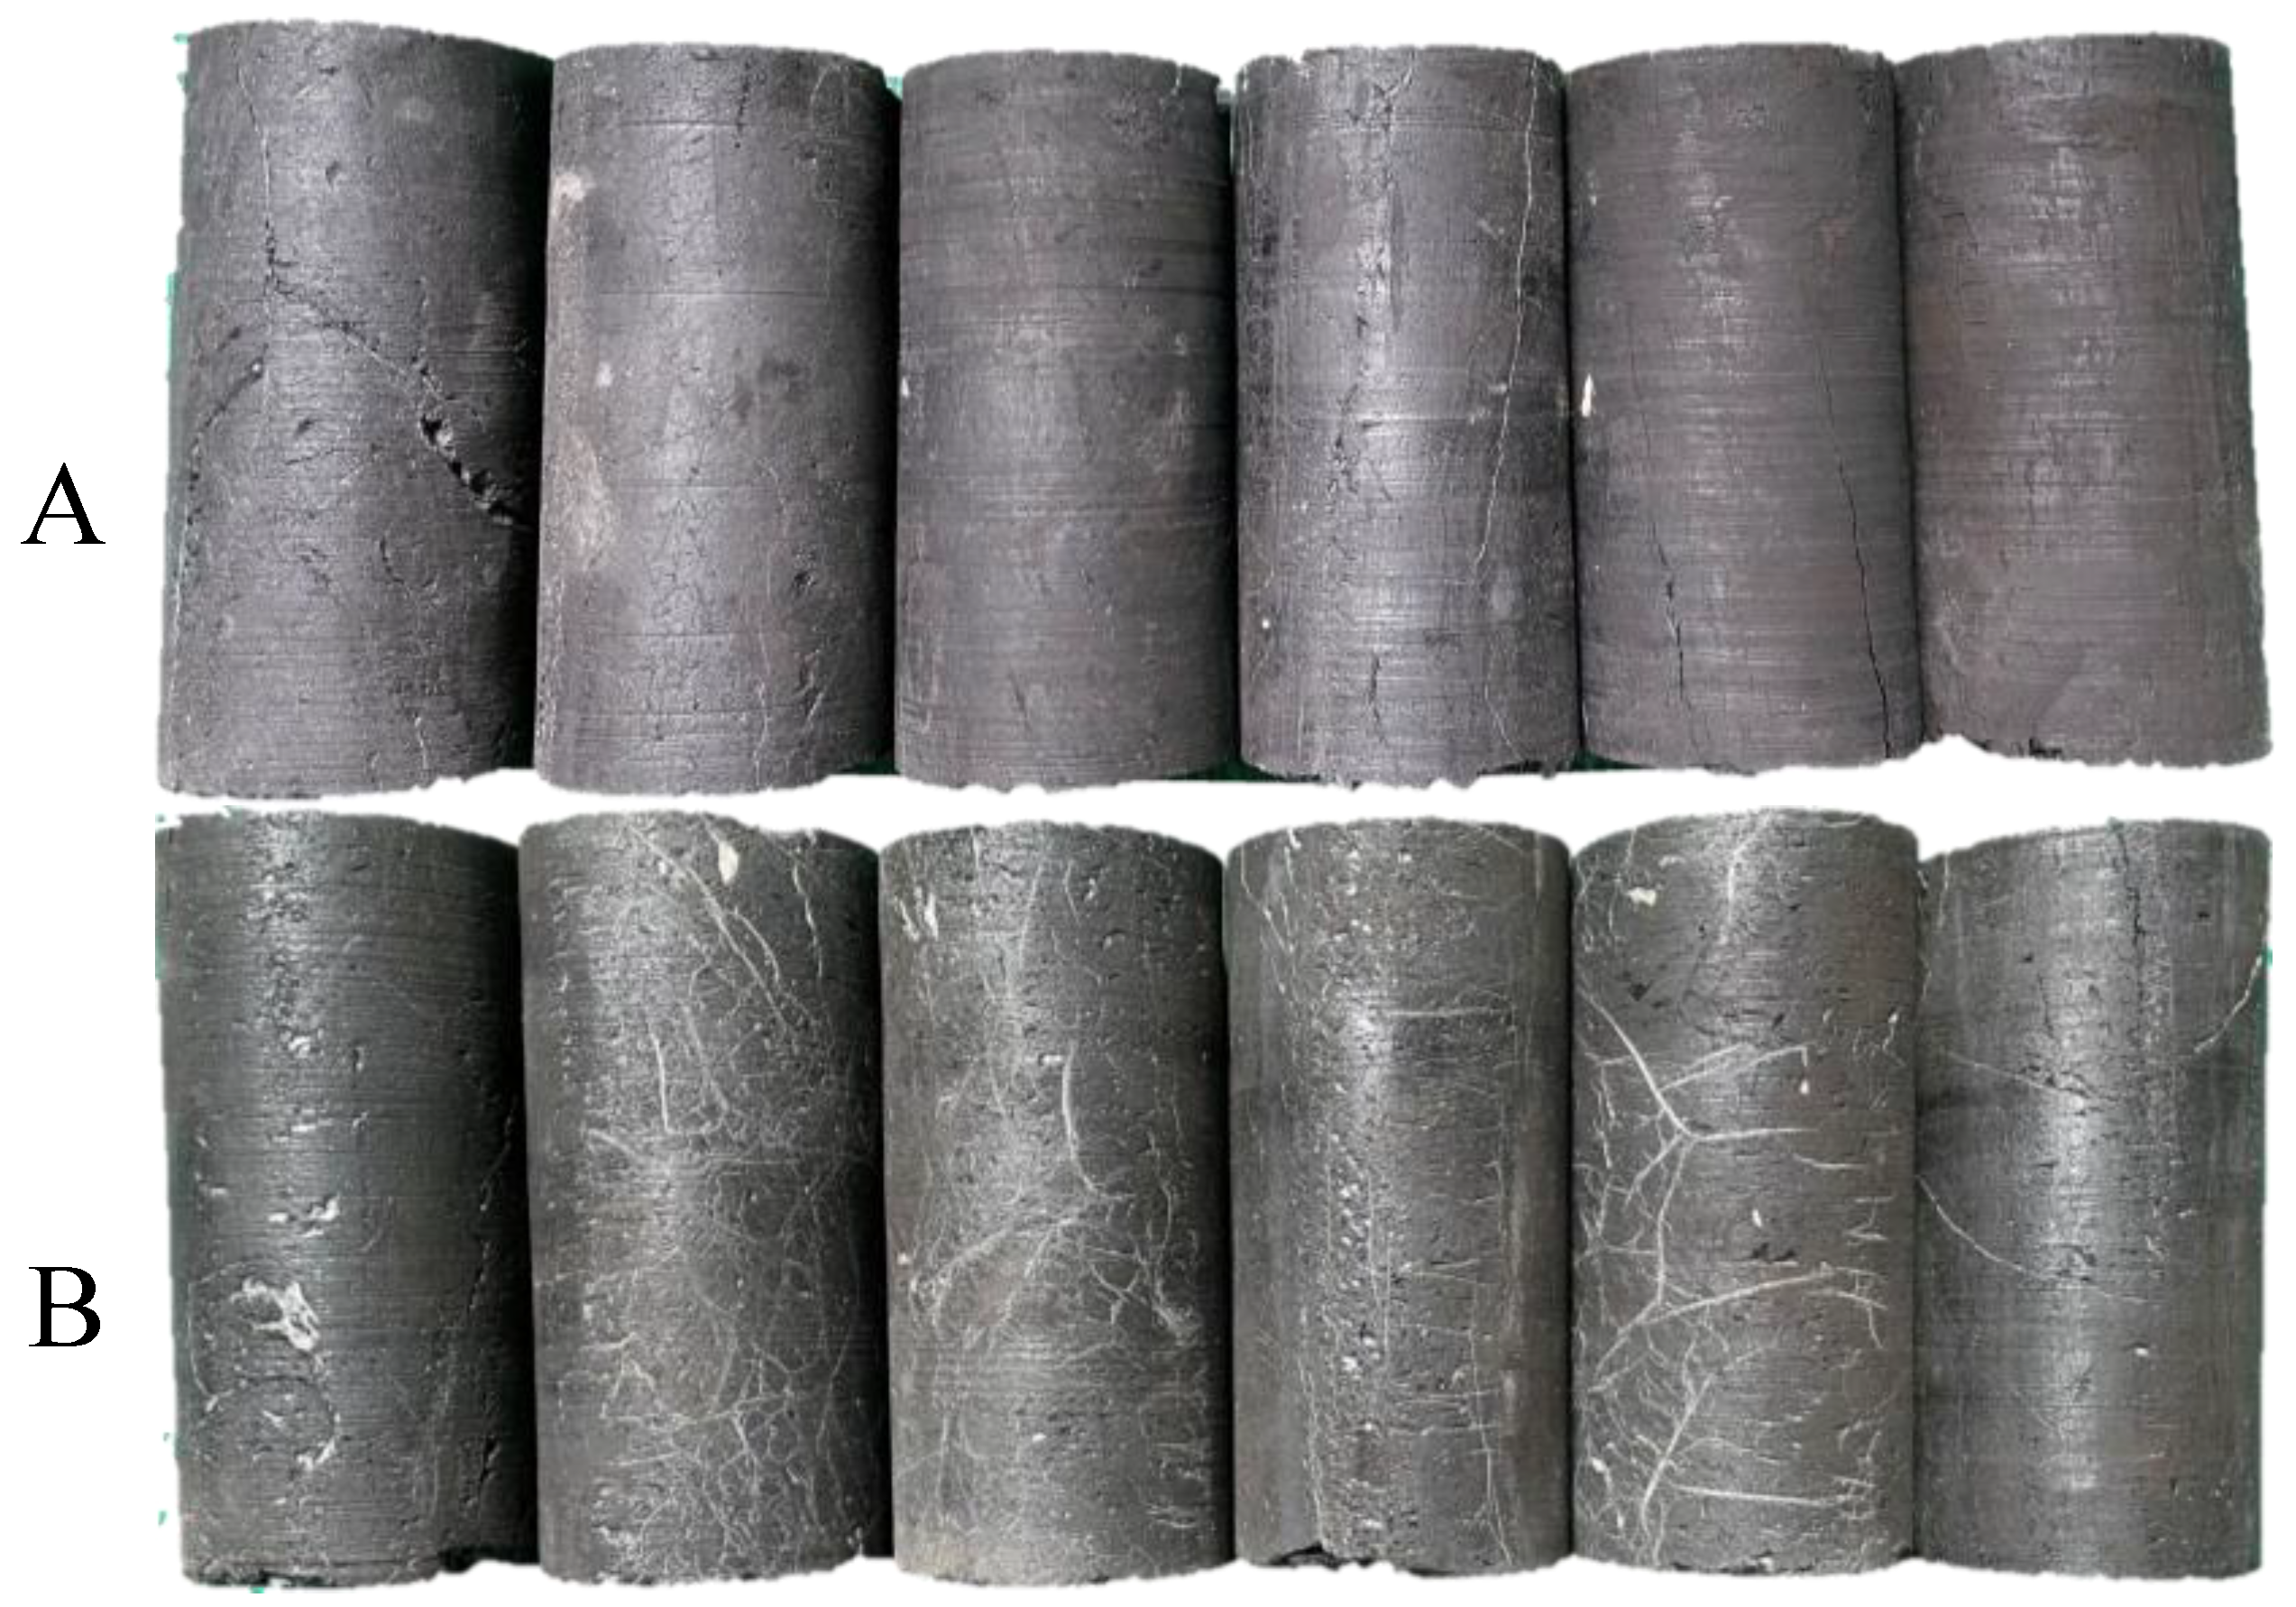
2.1. Sample Preparation

The coal samples studied in this paper were taken from Xinzhouyao Coal Mine, Datong, China, and from Dongronger Mine, Shuangyashan, China. The average compressive strength of the coal samples from the former is over 30 MPa, while that of the coal samples from the latter is around 10 MPa, and, as such, they represent hard and soft coals in China, respectively, presenting typical AE reflections in the process of deformation.
Standard rock mechanics testing was conducted to measure the physical and mechanical parameters of the coals, including compressive, Brazilin tensile, and varying angle shearing. The test results of the samples from different coal mines are shown in Table 1.
For the AE test, the coal blocks were cut by a cutting machine, and then the core was obtained via use of a coring machine. Coal samples were finally processed into standard cylindrical specimens with dimensions of 50 mm in diameter and 100 mm in length, as shown in Figure 1. Sample preparation was conducted in accordance with the International Rock Mechanics Test Recommendation (IRTM), which requires that the error of the parallelism depth between the upper and lower surface is within 0.02 mm. To assure the accuracy of the experiments, 6 coal specimens were prepared for each coal mine (i.e., a total of 12 specimens). We refer to the specimens from Xinzhouyao Mine and Dongronger Mine as Specimen X and Specimen D, respectively.

2.2. Experiment Equipments

2.2.1. Acoustic Emission Device

The use of AE technology is an effective method for detecting dynamic changes in the material structure under the action of external loading through instrumentation. Each channel of the data acquisition system consists of a measuring instrument, digital signal processor, computation program, and other peripheral apparatus, which are finally connected to a computer. The components of each channel include an AE sensor, a preamplifier, and a data acquisition card, as shown in Figure 2. A total of 4 sensors were used for the location of AE sources and the measurements of AE count and AE energy, two on the top sample and two on the bottom sample, with these pairs positioned opposite each other.

2.2.2. Loading Machine

The WAW-600C computer-aided electro-hydraulic servo universal testing machine (Jinan Chenda Testin Machine Manufacturing Co., Ltd., Beijing, China) was used to conduct the compressive test, as shown in Figure 3. The AE monitoring device was simultaneously instrumented to observe the dynamic response of the specimen structure under uniaxial loading. The maximum loading capability is 600 kN, the measuring amplitude ranges from 2% to 100% of the maximum loads, the maximum piston rising velocity is 70 mm/min, the lifting velocity of the loading plate is 150 mm/min, the maximum piston stroke is 250 mm, and the maximum distance between the compression plates is 500 mm.

2.3. Experimental Procedure

The uniaxial compression testing system and the AE monitoring system were used to dynamically monitor the experimental data. The uniaxial compression testing machine is controlled by displacement with a loading rate of 0.5 mm/min. For parameters of the AE instrument, the threshold of the AE monitoring was set as 45 dB to minimize the effect of the surrounding noises. The peak definition time (PDT), the hit definition time (HDT), and the hit locking time (HLT) were set at 300 μs, 600 μs, and 1000 μs, respectively. The sound velocity should be set based on the relationship between the compressive wave velocity and material properties; however, it was set at a common value of 1.8 km/s in this study.
After parameter setting was completed, a fusing test was conducted on the specimen to verify the sensitivity of each sensor to guarantee the reliability of the experiment. Coupling agents need be evenly pasted on the interface between the sensor and the testing sample for high-quality acquisition data. A piece of paper was placed between the testing machine and the specimen to eliminate friction. After the parameter setting and fusing testing were completed, uniaxial compression tests were carried out. The stress loading system and the AE monitoring system were turned on simultaneously. The experimental arrangement and the post-testing samples are shown in Figure 4.

3. Experimental Results

3.1. Results of Uniaxial Compression Tests

Figure 5 shows all the stress–strain curves of the tested samples. It shows that the deformational behaviors of soft and hard coal are considerably different. After the compaction stage, the compressive stiffness of the hard coal remains somewhat uniform until sample failure. However, there is a platform around the peak load for the soft coal. This suggests that the internal deformations of hard coal and soft coal are different.
The conceptualized typical stress–strain curves of hard coal and soft coal as well as the traditional description of coal deformation under uniaxial load are displayed in Figure 6. Traditionally, the deformation of coal under uniaxial compression, represented by curve I in Figure 6, can be divided into the following five stages: In the compaction stage, (1) OA, the pore space and primary microcracks are compressed with an increase in stress. Stages (2) AB and (3) BC are elastic and elastoplastic stages featured by a linear relationship between the stress and strain. The specimen is tightly compressed, and microcracks begin to develop within the specimen. Stage (4) CD is strain softening, during which cracks propagate rapidly to form a macrofracture. The peak stress is point D, indicating failure of the coal sample. Stage (5) DE is the residual strength stage of the coal.
Curves II and III in Figure 6 represent the stress–strain curves of typical coal Specimens X and D under uniaxial compression, respectively. It can be observed that curve III is similar to the traditional description of the deformational behavior. However, curve II, which represents the stress–strain relationship of Specimen X, is considerably different from curve I. Specimen X shows a typical brittleness property.

3.2. Acoustic Emission Characteristics

The AE monitoring device identifies the locations of the fractural sources in the coal specimen through sound waves released in the failing process of the specimen. Figure 7 and Figure 8 show the distributions of the sound sources at the peak stress levels of 15%, 70%, and 80%. In the figures, the blue points are sensors, and the black points are sound sources.
Figure 7 and Figure 8 show that along with the increase in the axial load, the AE activities in the specimen increase, and the AE events are distributed nearly symmetrically along the central axis of the specimen. The AE events of the hard coal specimens are mainly concentrated near the central axis of the specimen, indicating there is strong energy accumulation around the central axis. The AE events of the soft coal specimens are more sparsely distributed in the coal specimens and slightly concentrated near the middle part of the specimens.
By comparing the fractural source locations of two kinds of specimens, it can be found that the AE events of Specimen X increase slightly at the early stage of uniaxial compression. Then, they increase steadily in the linear elastic stage and sharply after the linear elastic stage. For Specimen D, the distribution of the fractured points is similar to that of Specimens X. However, the most fractural sources appear in the middle of the linear elastic stage.
Combining the AE events with the stress levels in the testing process, it can be observed that the specimen undergoes primary crack coalescence, expansion, stable propagation, and, ultimately, macroscopic failure. For Specimen X, it has less AE events when the loading stress is within the range of 10% to 20% of the peak stress. When the stress increases to 70–80% of the peak value, the AE events became more active, suggesting rapid crack propagation in the coal specimen. After the peak stress exceeds 80%, sudden failure of the specimen occurs due to macro fracture. However, the space distribution of the AE events in Specimen D is different and more scattered. It has less AE events than that of hard coal at the early stage, displaying a softening feature. In addition, the development of AE events is more gentle than that in hard coal at 70–80% peak load.
Based on the above analysis, it can be concluded that the crack development and propagation are most likely in the elastoplastic and strain softening stages for soft coal. For hard coal, the cracks develop during the later linear stage.

4. Analysis and Discussion of AE Properties vs. Stress States

In the test, the stress was measured using the testing machine, and the AE count and AE energy were simultaneously obtained via the AE monitoring system. The collected data were used to analyze the AE patterns corresponding with stress states. Since the generation of AE signals changes with time, the horizontal axis of the coordinate system was set as time and the vertical axis as the stress to describe the AE count and AE energy variation in the coal specimens under dynamic loading conditions.

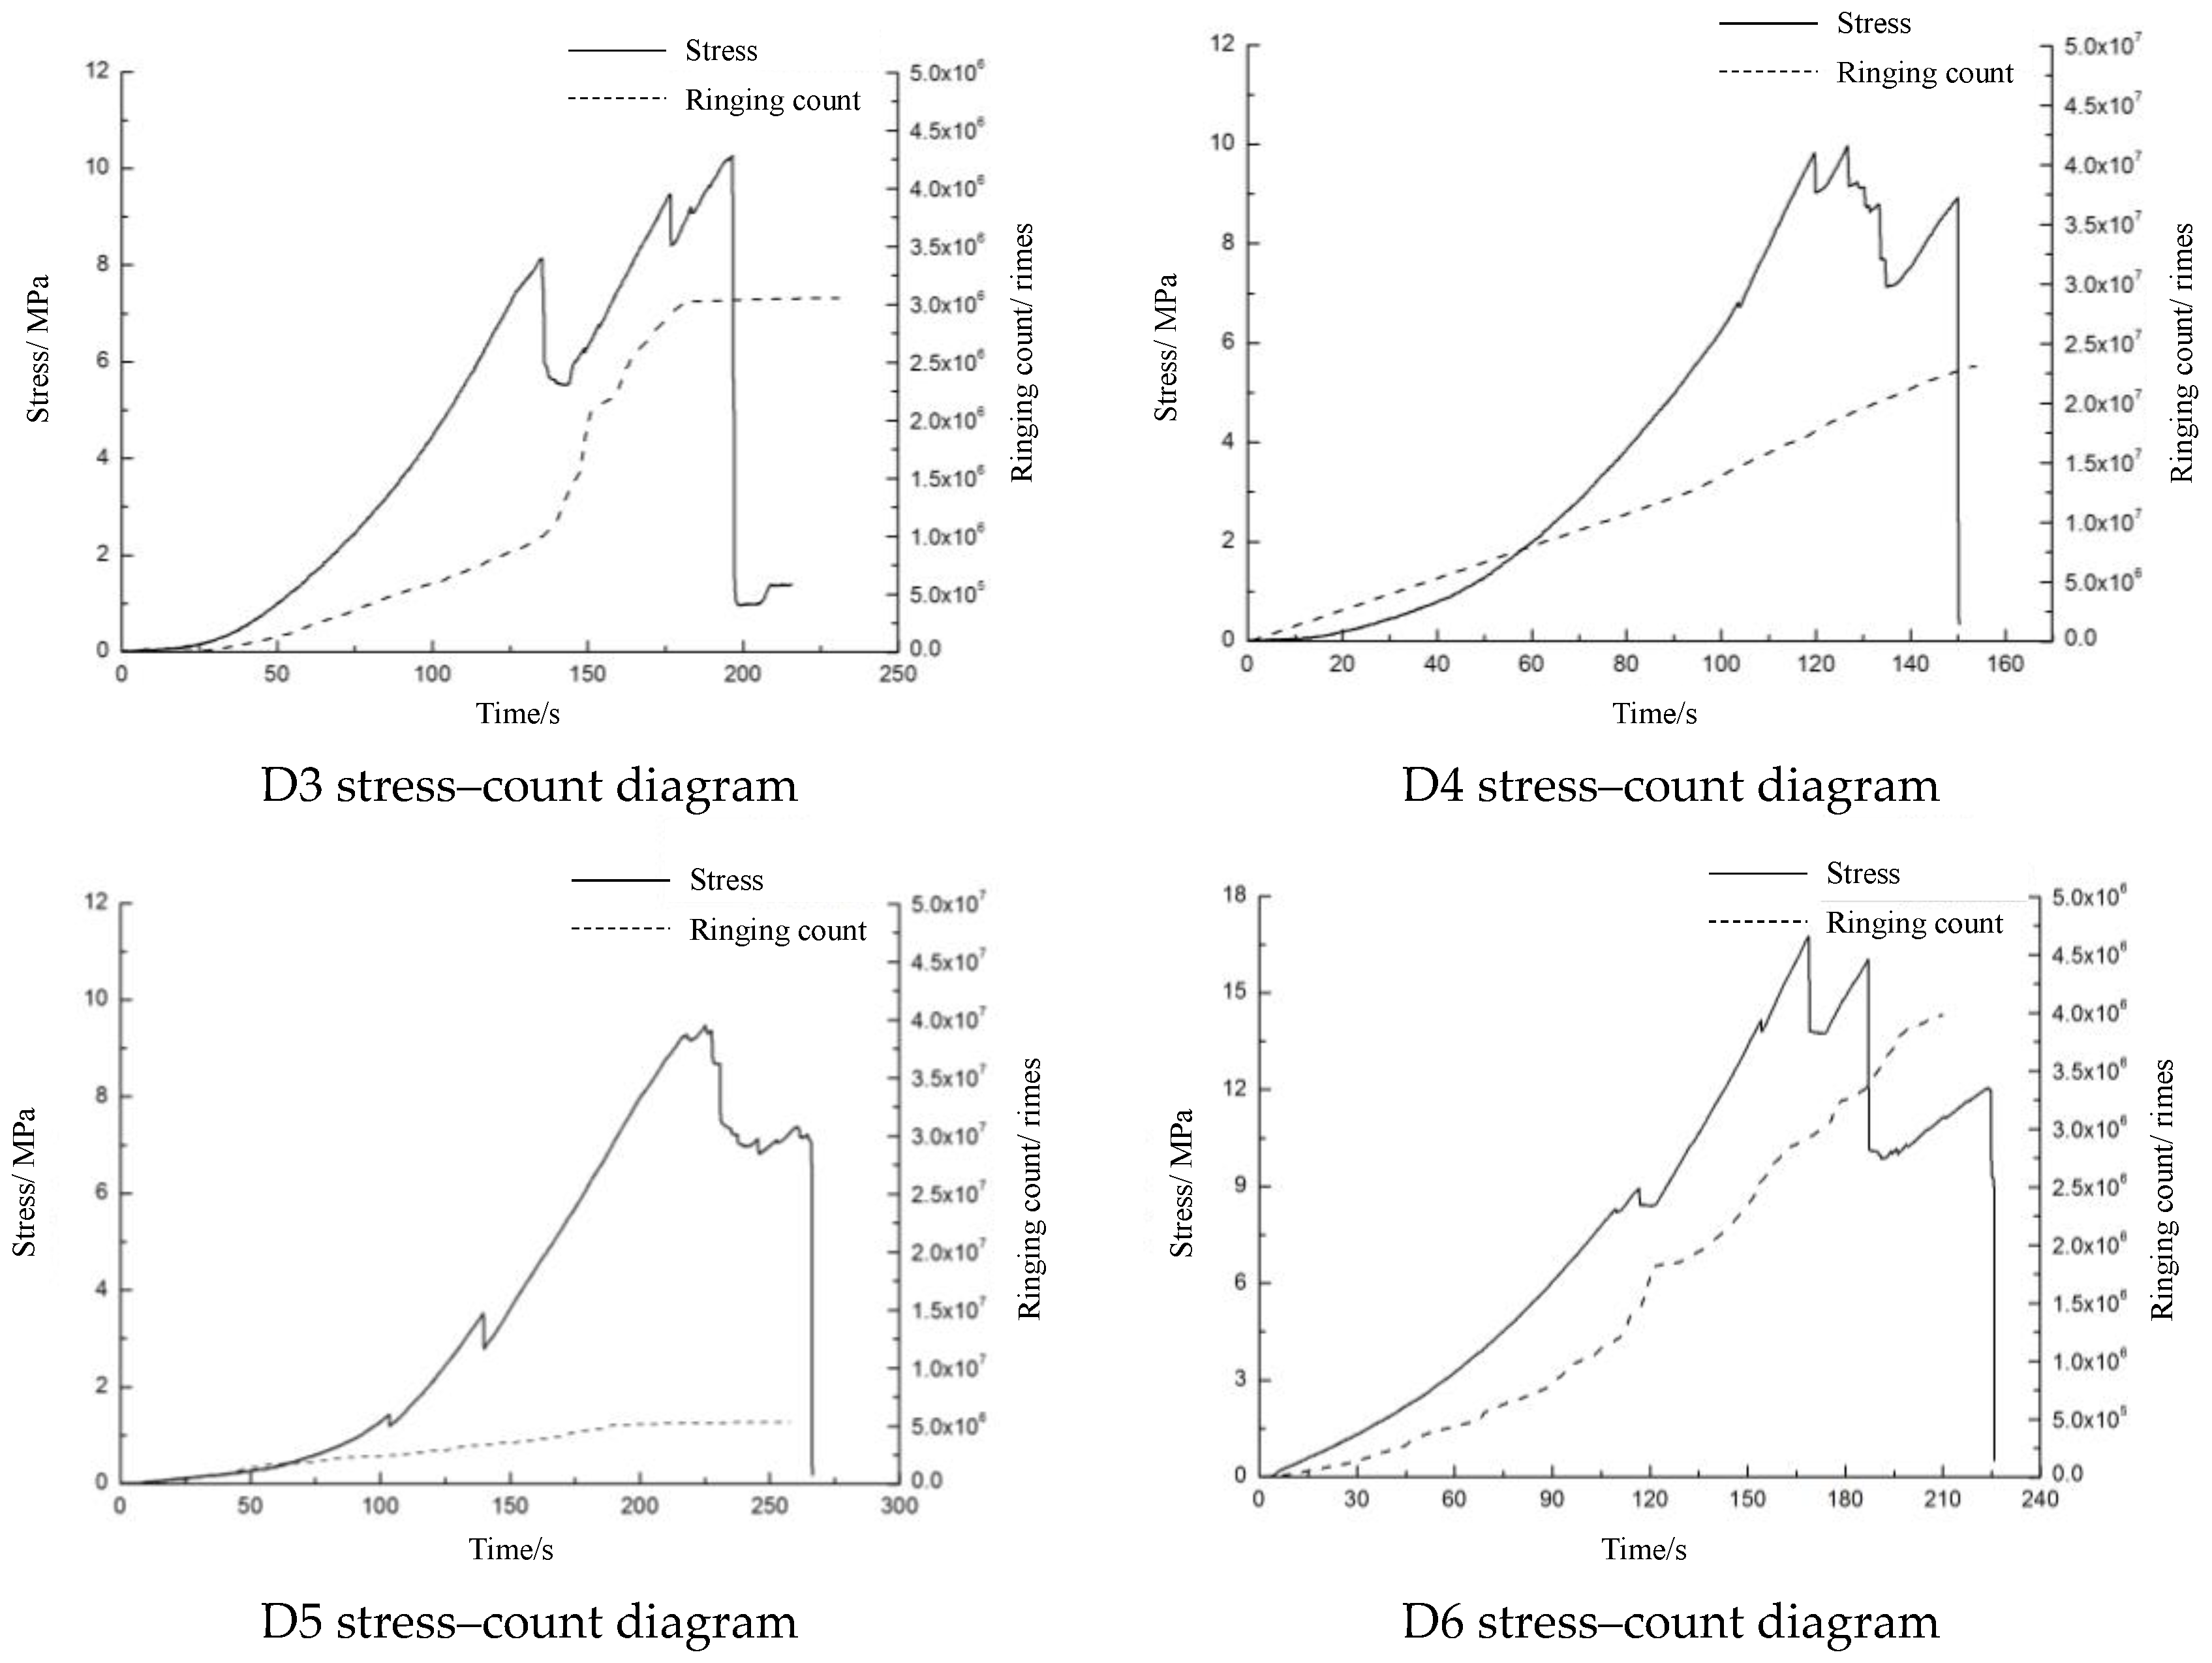
4.1. Stress and AE Count
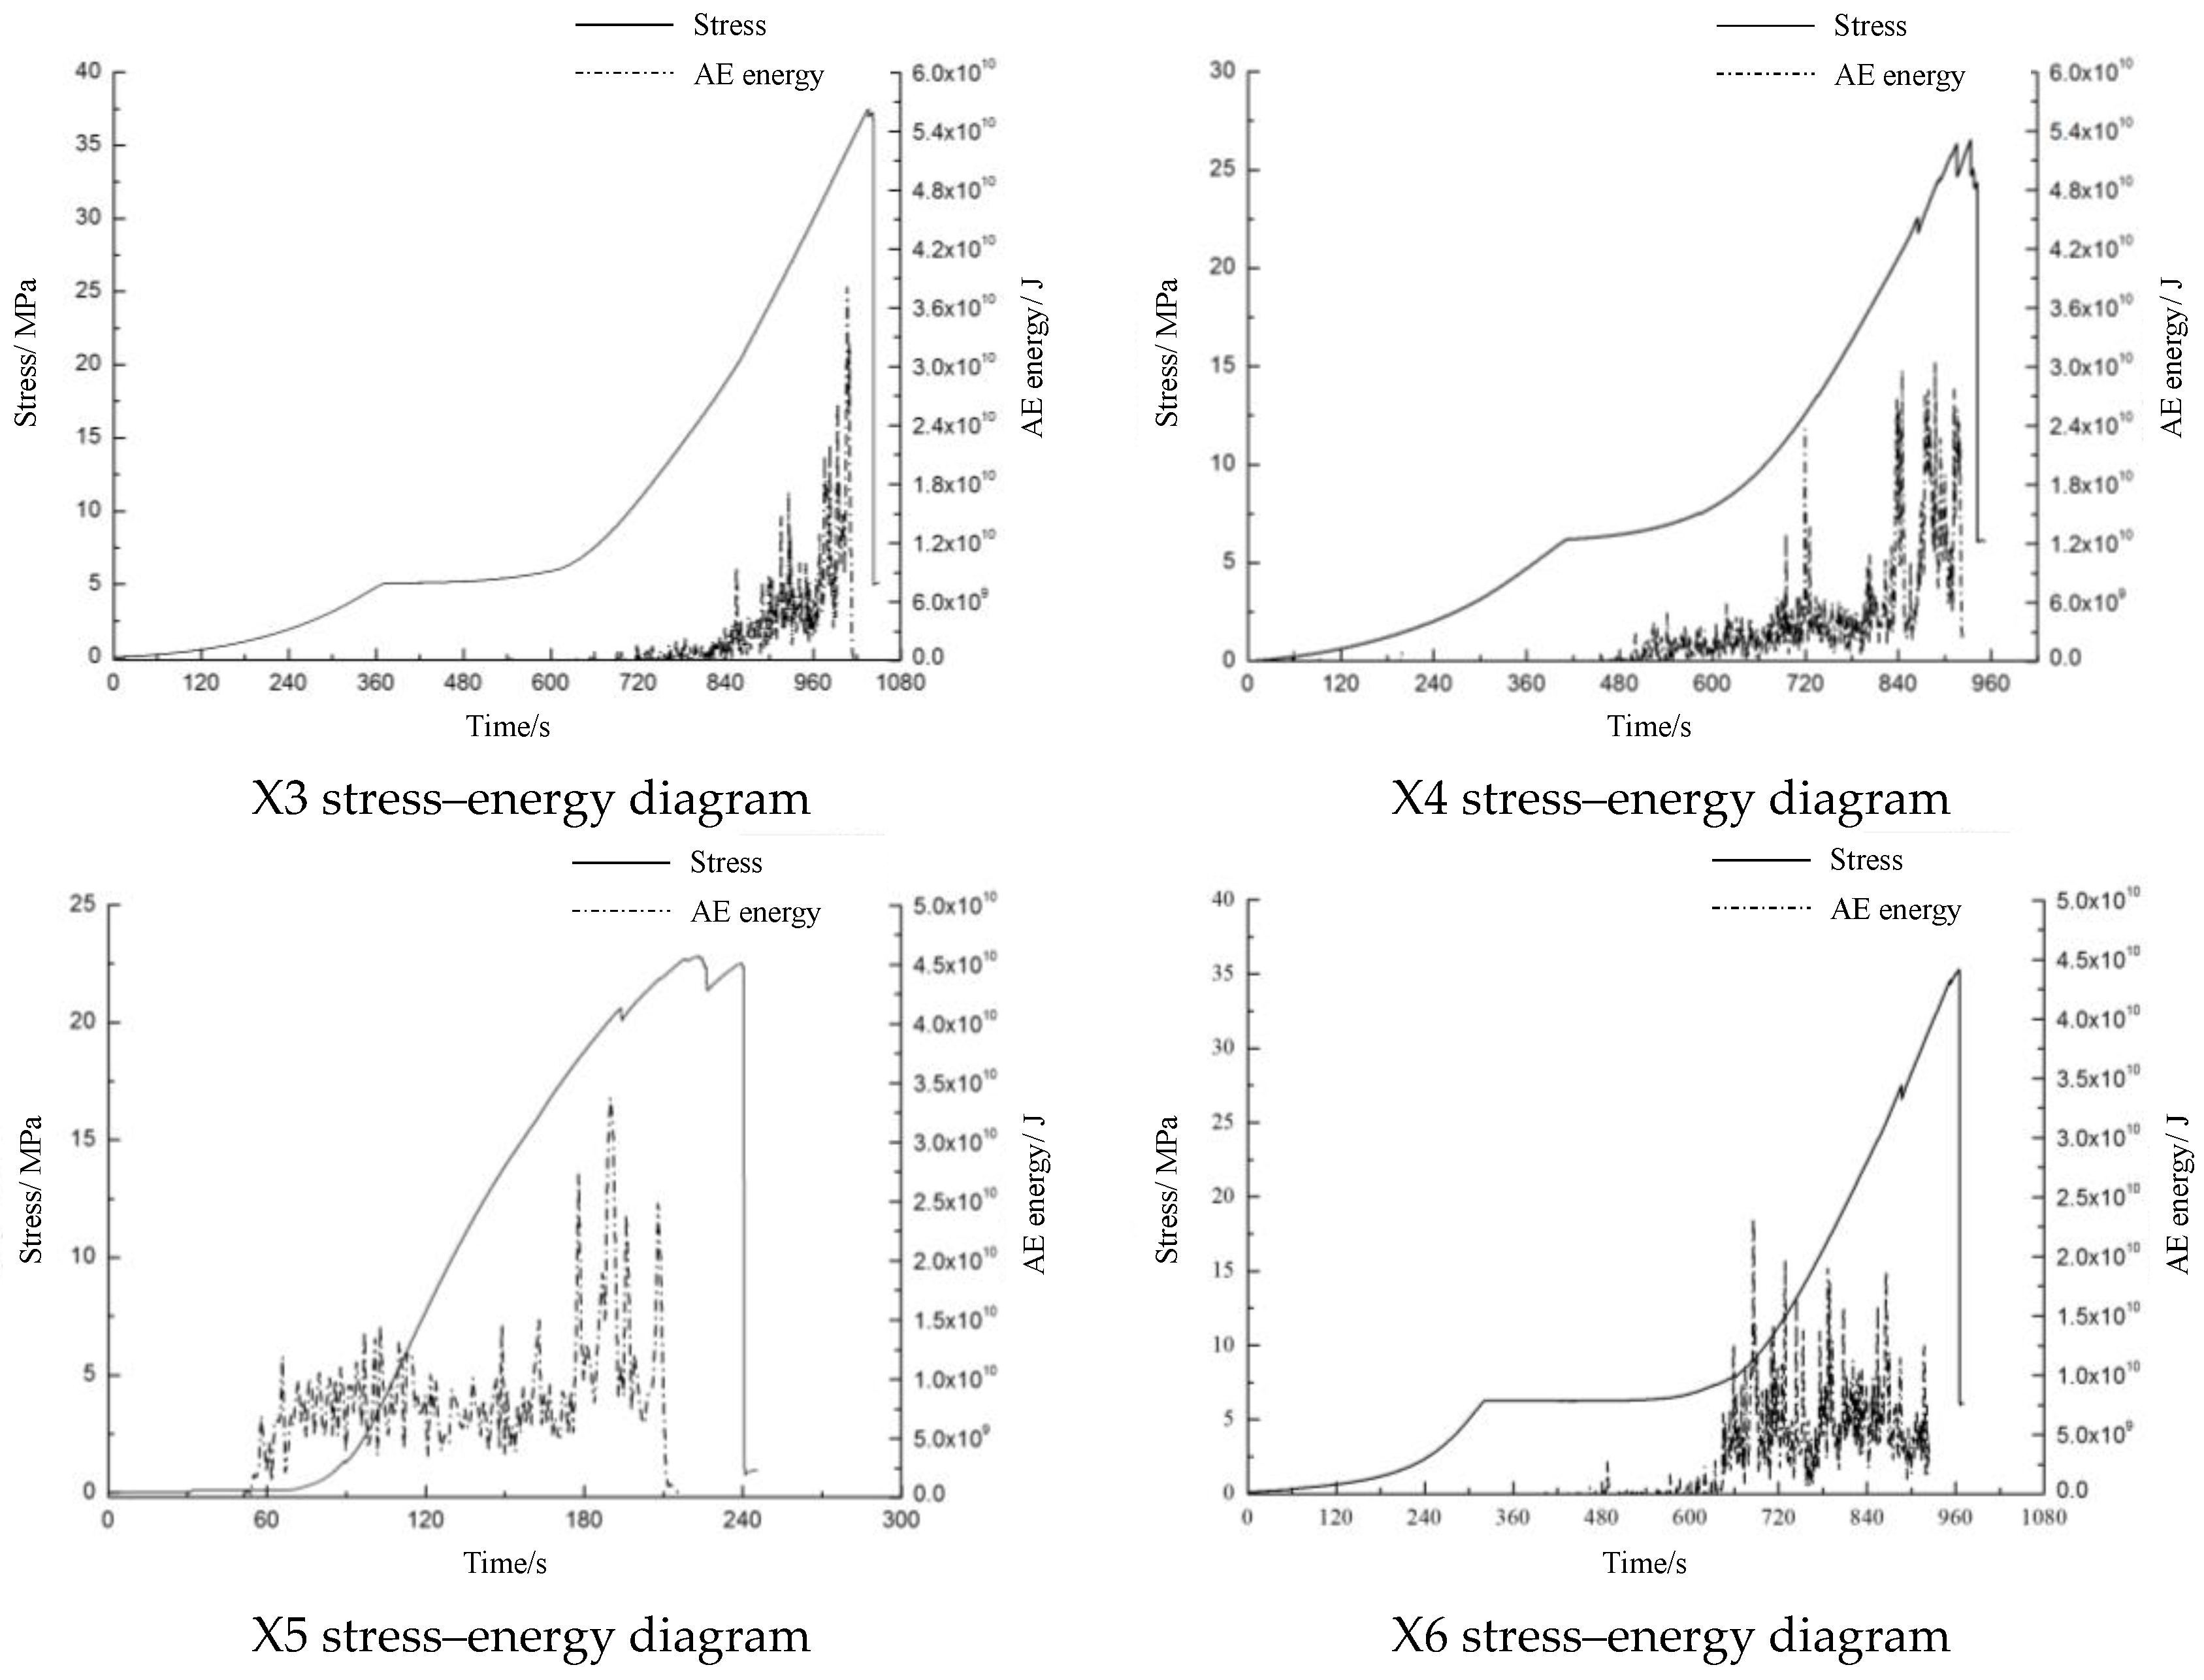
AE count, also known as ringing count and ringdown count, refers to the number of times that the wave signals formed in acoustic emission cross the threshold value. In this experiment, each wave signal exceeding the threshold is recorded as one AE count, which is regarded as one crack damage in the specimen. The more AE counts, the more damage in the specimen at that moment. The number of AE counts changes with time, as illustrated in Figure 9 and Figure 10.
Figure 9 shows that the AE counts of Specimen X appear during the high-stress stage, and the maximum number is from 3.8 × 10⁶ to 8.2 × 10⁶ with an average of 6.0 × 10⁶. Figure 10 shows that the AE count of Specimen D appears during the initial stage of loading, i.e., the linear elastic stage, and gradually increases afterwards. The peak count of AE events for Specimen D is from 2.4 × 10⁶ to 5.7 × 10⁶ with an average of 4.1 × 10⁶. The result shows that the number of the AE counts of hard coal is 48.1% higher than that of soft coal.

4.2. AE Energy

AE energy is the energy released from all AE events in the specimen. By comparing the AE energy of different specimens, the difference in the energy release between different specimens can be identified. The AE energies for hard and soft coals are shown in Figure 11 and Figure 12, respectively.
Figure 11 shows that the AE energy of the Specimen X is from 2.4 × 10¹⁰ to 4.8 × 10¹⁰ with an average of 3.6 × 10¹⁰. Figure 12 shows that the AE energy of the Specimen D is from 1.8 × 10¹⁰ to 5.0 × 10¹⁰ with an average of 3.4 × 10¹⁰. The AE energy of hard coal is 5.9% higher than that of soft coal.
For most hard coal samples, the peak AE energy appears between the end of the linear elastic stage and peak stress. Only for a few variations of Specimen X is its energy released at the end of the compaction stage and the early phase of the linear elastic stage. For the AE energy of coal Specimen D, the AE energy is accumulated in the compaction and the linear elastic stages. After the linear elastic stage, energy accumulation becomes more gentle than that of hard coal.

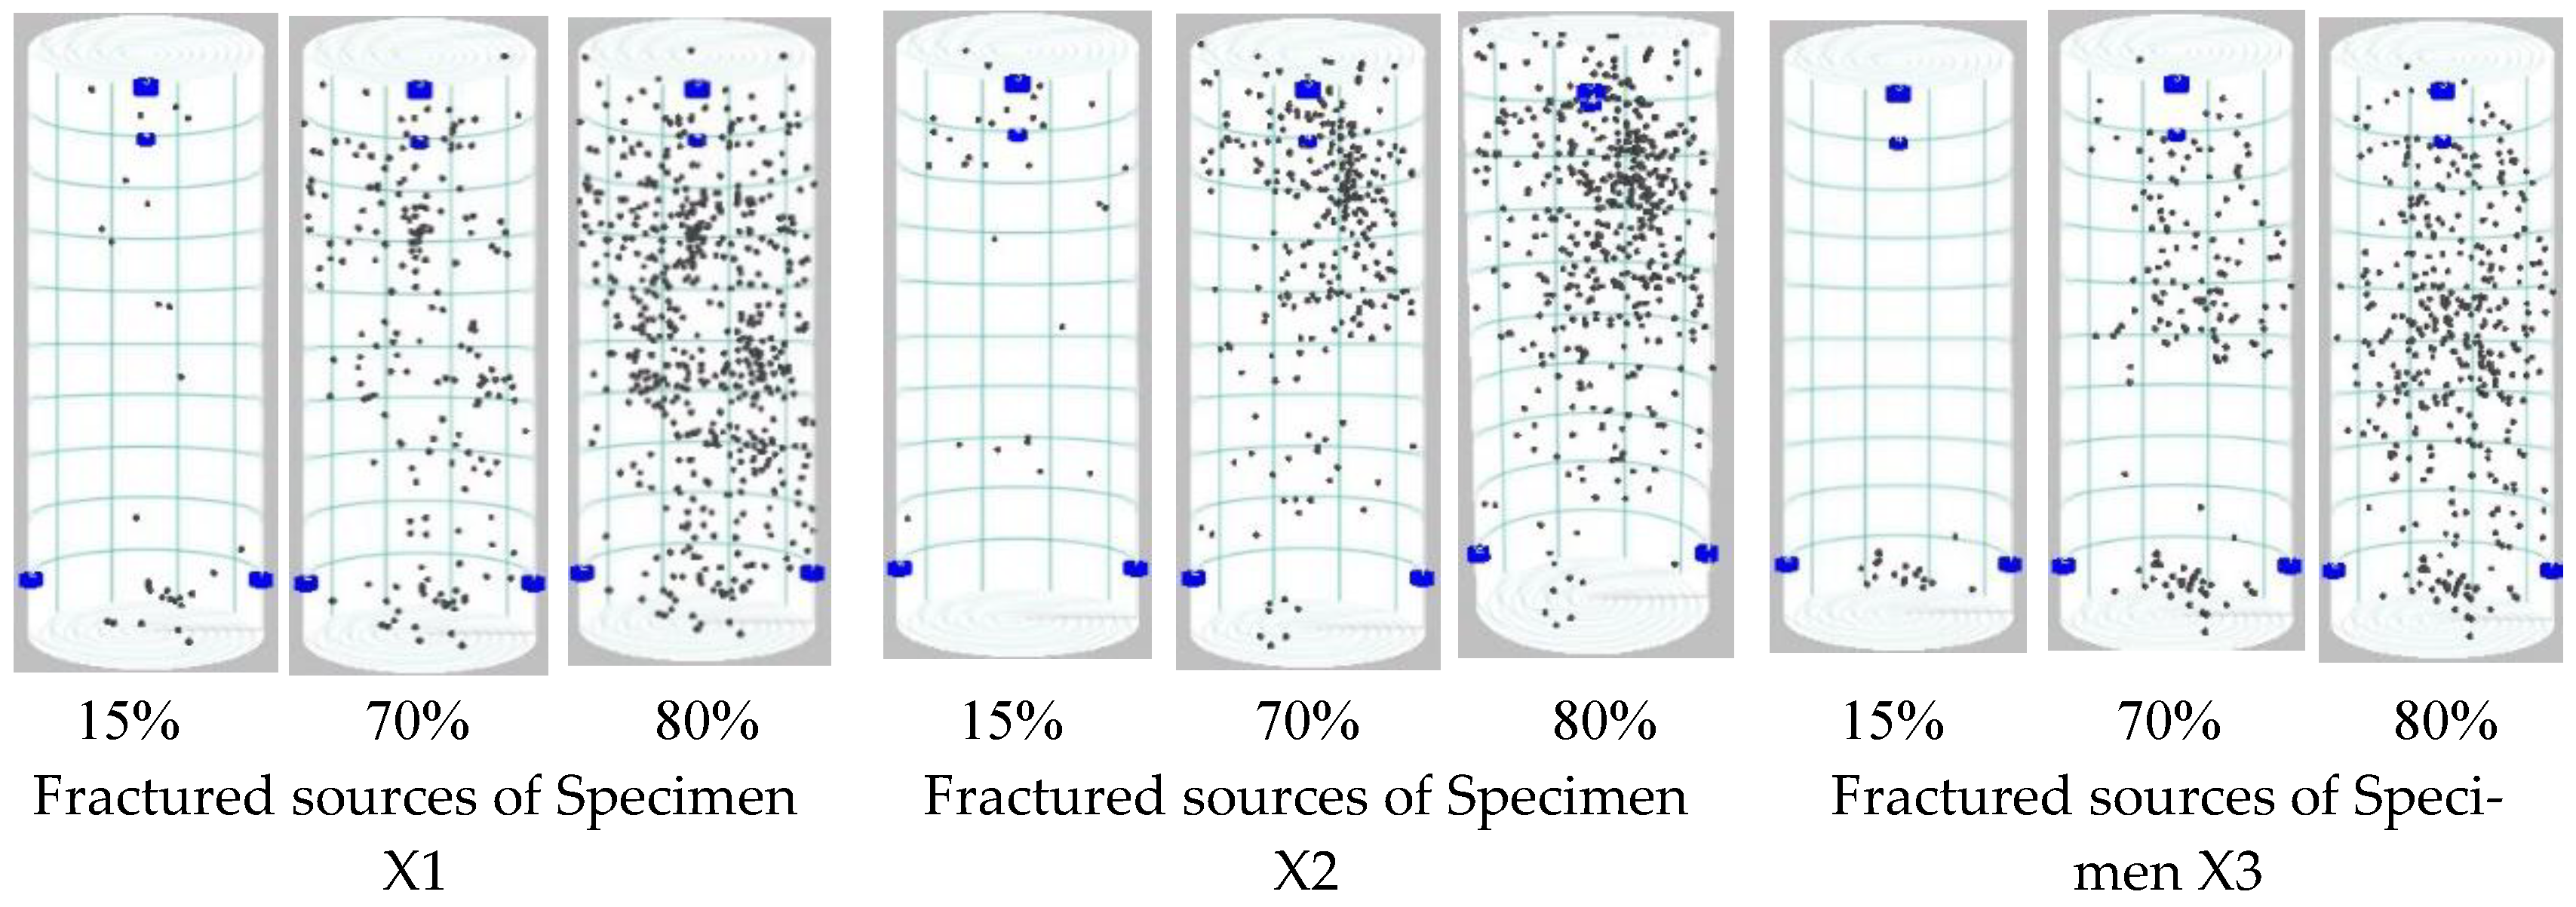
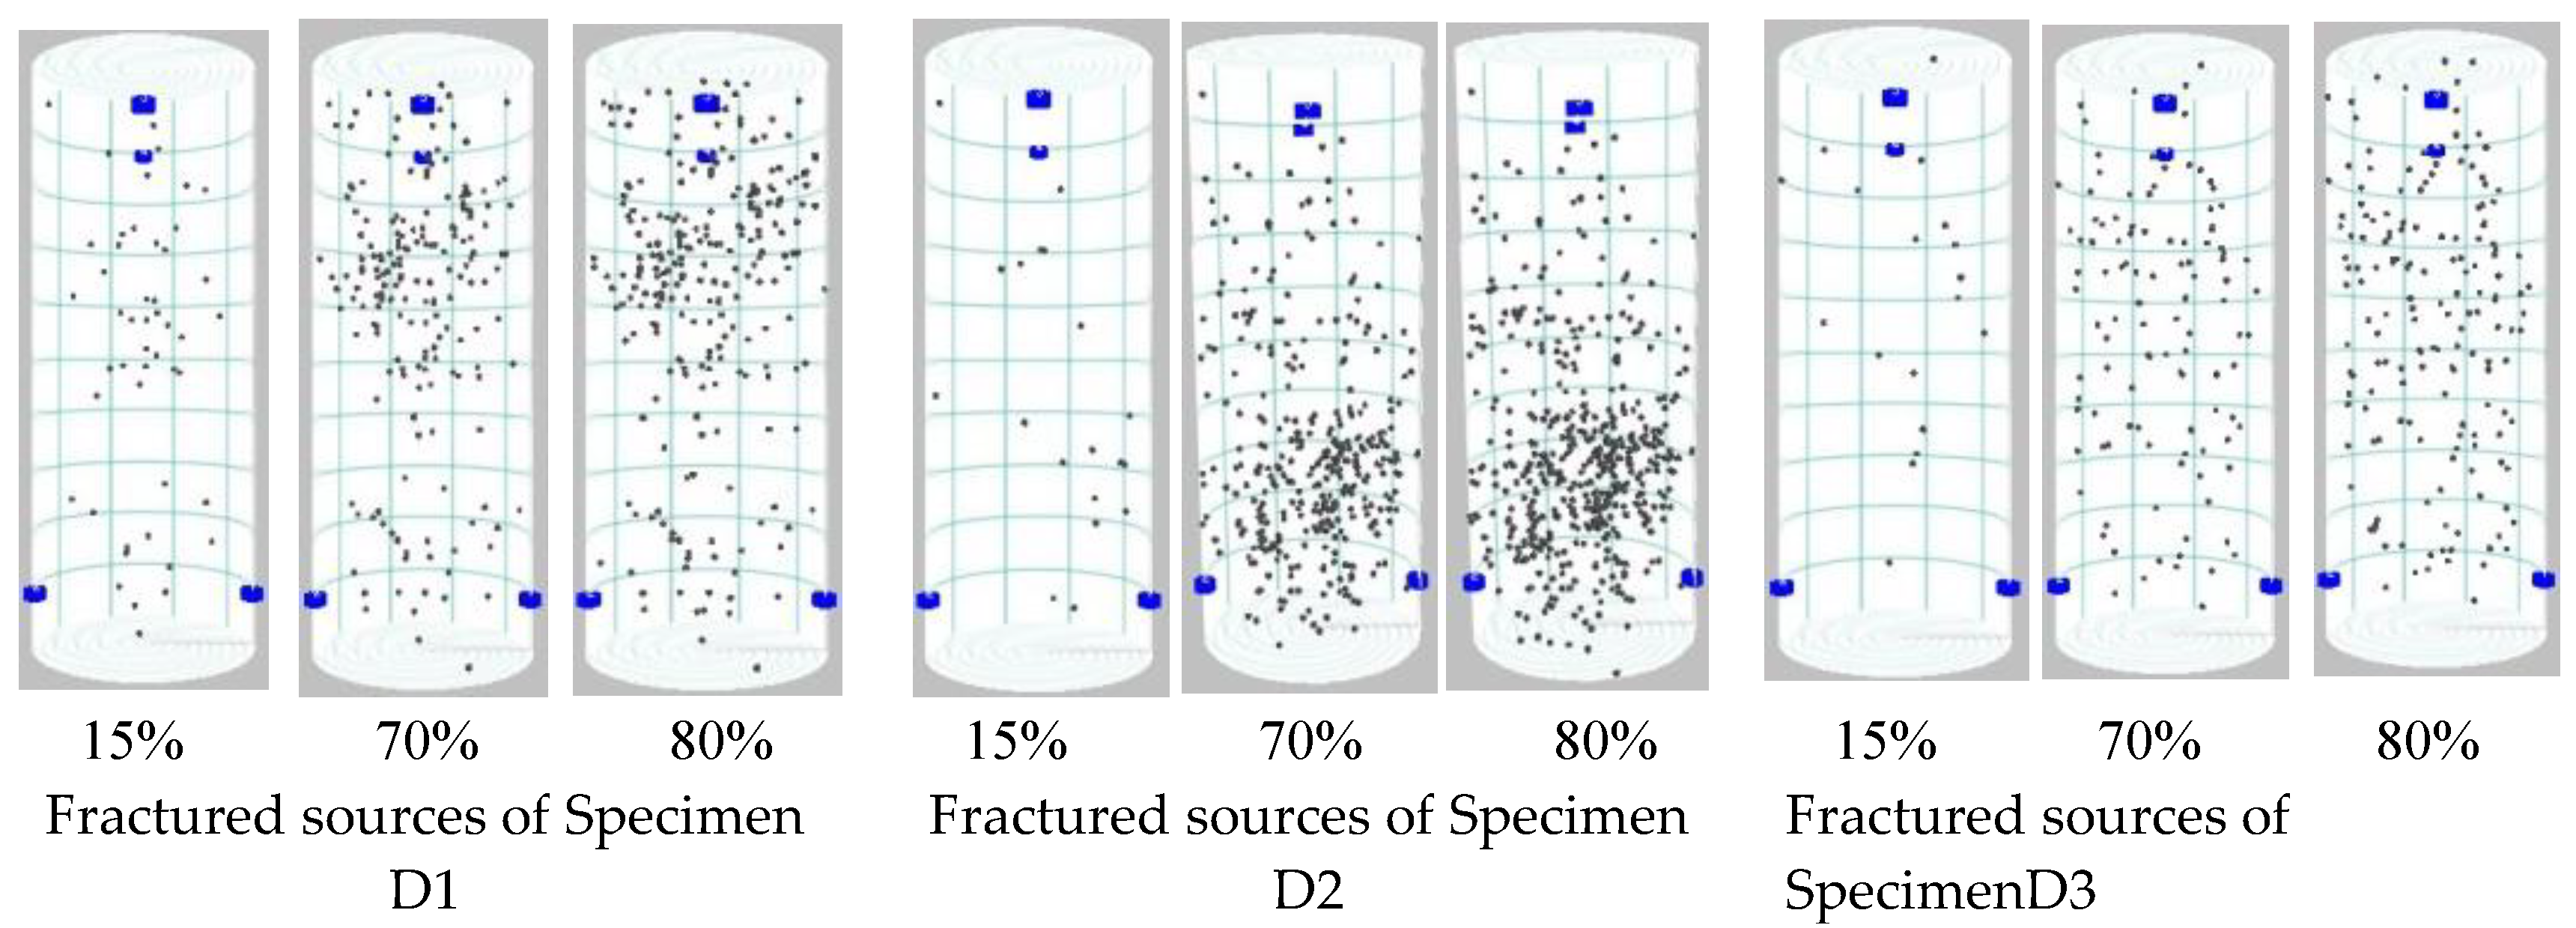
4.3. Relationship between Stress and AE Events

Figure 9 and Figure 10 suggest that the coal specimens with high strength have a slow growth of AE events at the early stage of the loading process. At the middle of the linear elastic stage, the fractural sources increase gradually, and at the end of the linear elastic stage, the AE-fractured points increase sharply. For Specimens D with low strength, the fractured points are distributed almost randomly. However, there are fewer fractural sources than for Specimen X during the loading period. Most of the fractures appear at the middle of the linear elastic stage, and there are more fractural sources than for Specimen X during this stage, mainly owing to the influence of primary cracks in the specimen.
Table 2 shows the initiation stages of the AE count and the peak AE energy. It is concluded that the occurrence of the peak energy of coal specimens change with the crack initiation rate during the failure process. That is, the increase in crack initiation causes earlier release of energy, while the energy accumulation time becomes shorter accordingly.
In summary, under the loading condition, coal specimens with the same strength have similar AE features, which allow for the accurate identification of the failure process of different coals. The AE counts of the coal specimens with high strength comply with the growth of exponential function, while the AE count curves of the coal specimens with low strength present an S-shape variation. The peak AE energy of the coal specimen with high strength takes place before the peak stress. Since the failure mode of the specimen is brittle failure, the energy dissipates rapidly after the peak stress, while the AE energy of the coal specimen with low strength presents a bell distribution curve.

4.4. Discussion

Experimental results suggest that there is a relationship between coal strengths and the AE parameters of fractural sources, AE count, and AE energy. The test results of the specimen X indicate the following:
(1) During the compaction and elastic stages, only a few AE events appear, and the number of the AE counts grows gradually, indicating slow accumulation of deformation energy. The primary cracks begin to expand, and the stress has a linear relationship with time. There may be a sudden drop in peak energy, likely caused by redistribution and reconcentration of the stress in the specimen.
(2) In the plastic stage, the original microcracks and new cracks in the specimen develop. When the peak stress reaches 60%~80%, the cracks in the specimen propagate rapidly, and a large number of AE events occur. The AE count and peak AE energy increase sharply, reaching their maximum values before the peak stress.
(3) During the fracture stage, the number of the AE events decreases after the specimen fails at peak stress, and the peak energy drops rapidly after at the residual strength stage.
The AE characteristics for Specimens D are given below:
(1) During the compaction stage, the primary microcracks and pores are compacted, resulting in few AE counts and low AE energy. After entering the elastic stage, the AE count and AE energy begin to grow rapidly, reaching their maximum values at the end of the linear elastic stage. This is mainly caused by the coalescence of cracks and pores, the initiation of new cracks, and the relative sliding of internal particles in the specimen.
(2) During the plastic and softening stages, the number of the AE counts slowly increases, while the AE energy begins to slowly decline. The coal specimen accumulates sufficient energy and begins to be damaged and loses its partial-bearing capacity.
(3) During the residual stage, its residual strength is relatively large and lasts for a long displacement time, during which AE signals are still active.
Coal specimens with the same strength nearly have the same AE characteristics that are capable of inducing the coal failure process. The AE count curve of the hard coal corresponds to exponential function growth, while the AE count curve of soft coal presents an S-style alteration. The maximum AE energy of the coal specimens with high strength appears before the peak stress. Since the failure mode of the specimen is brittle failure, the post-peak energy rapidly dissipates.
From the viewpoint of engineering practice, AE technology has been used successfully in industrial applications, such as in interlayer identification, coal bump proneness, gas contents and migration, and tremor source positioning [1,2,37,38]. From this study, it was found that that the AE properties between of hard coal and soft coal are quite different. For example, the AE count initiation for the high strength coal appears later than that of low strength coal, but the density and intensive of the AE counts and the AE energy of hard coal is much larger than that of the soft coal. Consequently, the pattern of AE property of the coal seam should be recognized in advance to obtain the real deformational state of the coal mass in the field.

5. Conclusions

The AE signals in the failure process of coal specimens are analyzed. There are differences in the AE event distribution, AE counts, and AE energy between the hard coal and soft coal specimens under uniaxial compression conditions. Their AE properties change significantly, especially during the linear elastic and peak stress stages.
(1) AE events of the coal specimens with high strength are mainly concentrated near the central axis of the specimens, indicating that there is a strong ability of energy accumulation around the central axis. The AE events of the coal specimens with low strength are distributed in a more dispersed manner and more evenly in the specimens, and the AE events is slightly concentrated near the middle part of the specimens.
(2) The AE characteristics of the coal specimens with different strengths vary, especially during the linear elastic and peak stress stages, where the AE features have significant variations.
(3) The AE count initiation for the coal specimens with high strength appears later than that of the coal specimens with low strength, but the increase in amplitude of the AE counts and peak AE energy is larger than that of soft coal.

Author Contributions

C.C. conceived and designed the experiments. H.L. and S.M. conducted the experiments. C.C. and H.L. analysed the data. H.L. wrote a draft manuscript and C.C. revised the paper. All authors have read and agreed to the published version of the manuscript.

Funding

This research received no external funding.

Data Availability Statement

All data of this article has been included in this manuscript.

Conflicts of Interest

The authors declare no conflict of interest.

References

  1. Yuan, Z.; Ma, Y.; He, Z. Technology and Application of Acoustic Emission; China Machine Press: Beijing, China, 1985. [Google Scholar]
  2. Yang, Y.; Chen, S.; Han, G. Experimental on acoustic emission during compression rupture procedure of coal sample. J. China Coal Soc. 2006, 31, 562–565. [Google Scholar]
  3. Katsuyama, K. Application of AE Techniques; Metallurgy Industry Press: Beijing, China, 1996; pp. 13–16. [Google Scholar]
  4. Majewska, Z.; Ziętek, J. Acoustic emission and sorptive deformation induced in coals of various rank by the sorption-desorption of gas. Acta Geophys. 2007, 55, 324–343. [Google Scholar] [CrossRef]
  5. Xue, D.; Lu, L.; Zhou, J.; Lu, L.; Liu, Y. Cluster modeling of the short-range correlation of acoustically emitted scattering signals. Int. J. Coal Sci. Technol. 2021, 8, 575–589. [Google Scholar] [CrossRef]
  6. Cao, A.; Jing, G.; Dou, L.; Wang, G.; Liu, S.; Wang, C.; Yao, X. Damage evolution law based on acoustic emission of sandy mudstone under different uniaxial loading rate. J. Min. Saf. Eng. 2015, 32, 923–928. [Google Scholar]
  7. Yin, Z.; Tang, L.; Li, Y. Study on the acoustic emission of rock through experiment. J. Min. Saf. Eng. 2005, 22, 95–97. [Google Scholar]
  8. Wu, X.; Liu, J.; Liu, X.; Zhao, K.; Zhang, Y. Study on the coupled relationship between AE accumulative ring-down count and damage constitutive model of rock. J. Min. Saf. Eng. 2015, 32, 28–34. [Google Scholar]
  9. Dou, L.; Yang, K.; Chi, X. Fracture behavior and acoustic emission characteristics of sandstone samples with inclined precracks. Int. J. Coal Sci. Technol. 2021, 8, 77–87. [Google Scholar] [CrossRef]
  10. Xiao, X.; Jin, C.; Ding, X.; Pan, Y. Experimental study on rock burst tenency of coal with different moisture content based on acoustic emission time-frequency signals. J. China Coal Soc. 2018, 43, 34–41. [Google Scholar]
  11. Tong, M.; Hu, J.; Tang, S.; Dai, X. Study of Acoustic Emission Signal Characteristic of Water-Containing Coal and Rock Under Different Stress Rates. J. Min. Saf. Eng. 2009, 26, 97–100. [Google Scholar]
  12. Gao, B.; Li, H.; Li, H.; Li, L.; Su, C. Acoustic emission and fractal characteristics of saturated coal samples in the failure process. J. Min. Saf. Eng. 2015, 32, 665–670. [Google Scholar]
  13. Li, H.; Kang, L.; Xu, Z.; Qi, Q.; Zhao, S. Precursor information analysis on acoustic emission ofcoal with different outburst proneness. J. China Coal Soc. 2014, 39, 384–388. [Google Scholar]
  14. Li, H.; Sun, Z.; Qi, Q.; Li, F.; Zhao, S. Deformation rules and acoustic emission characteristics of coal with different outburst proneness. J. Liaoning Tech. Univ. Nat. Sci. Ed. 2017, 36, 1251–1256. [Google Scholar]
  15. Xue, D.; Wang, J.; Zhao, Y.; Zhou, H. Quantitative determination of mining-induced discontinuous stress drop in coal. Int. J. Rock Mech. Min. Sci. 2018, 111, 1–11. [Google Scholar] [CrossRef]
  16. Xue, D.; Zhou, H.; Zhao, Y.; Zhang, L.; Deng, L.; Wang, X. Real-time SEM observation of mesoscale failures under ther-mal-mechanical coupling sequences in granite. Int. J. Rock Mech. Min. Sci. 2018, 112, 35–46. [Google Scholar] [CrossRef]
  17. Xue, D.; Zhou, J.; Liu, Y.; Gao, L. On the excavation-induced stress drop in damaged coal considering a coupled yield and failure criterion. Int. J. Coal Sci. Technol. 2020, 7, 58–67. [Google Scholar] [CrossRef] [Green Version]
  18. He, J.; Pan, J.; Wang, A. Acoustic emission characteristics of coal specimen under triaxial cyclic loading and unloading. J. China Coal Soc. 2014, 39, 84–90. [Google Scholar]
  19. Ai, T.; Zhang, R.; Liu, J.; Zhao, X.; Ren, L. Space-time evolution rules of acoustic emission locations under triaxial compression. J. China Coal Soc. 2011, 36, 2048–2057. [Google Scholar]
  20. Zhang, L.; Chen, S.; Zhang, C.; Fang, X.; Li, S. The characterization of bituminous coal microstructure and permeability by liquid nitrogen fracturing based on μCT technology. Fuel 2020, 262, 116635. [Google Scholar] [CrossRef]
  21. Lin, J.; Ren, T.; Cheng, Y.; Nemcik, J.; Wang, G. Cyclic N2 injection for enhanced coal seam gas recovery: A laboratory study. Energy 2019, 188, 116115. [Google Scholar] [CrossRef]
  22. Xue, D.J.; Liu, Y.T.; Zhou, H.; Wang, J.Q.; Liu, J.F.; Zhou, J. Fractal Characterization on Anisotropy and Fractal Reconstruction of Rough Surface of Granite Under Orthogonal Shear. Rock Mech. Rock Eng. 2019, 53, 1225–1242. [Google Scholar] [CrossRef]
  23. Wang, J.; Yang, J.; Wu, F.; Hu, T.; Al Faisal, S. Analysis of fracture mechanism for surrounding rock hole based on water-filled blasting. Int. J. Coal Sci. Technol. 2020, 7, 704–713. [Google Scholar] [CrossRef]
  24. Cao, D.; Wang, A.; Ning, S.; Li, H.; Guo, A.; Chen, L.; Liu, K.; Tan, J.; Zheng, Z. Coalfield structure and structural controls on coal in China. Int. J. Coal Sci. Technol. 2020, 7, 220–239. [Google Scholar] [CrossRef]
  25. Mao, S. Development of coal geological information technologies in China. Int. J. Coal Sci. Technol. 2020, 7, 320–328. [Google Scholar] [CrossRef]
  26. Han, J.; Liang, H.; Cao, C.; Bi, Z.; Zhu, Z. A mechanical model for sheared joints based on Mohr–Coulomb material properties. Géotechnique Lett. 2018, 8, 92–96. [Google Scholar] [CrossRef]
  27. Małkowski, P.; Niedbalski, Z.; Balarabe, T. A statistical analysis of geomechanical data and its effect on rock mass numerical modeling: A case study. Int. J. Coal Sci. Technol. 2021, 8, 312–323. [Google Scholar] [CrossRef]
  28. Cao, C.; Ren, T.; Cook, C. Calculation of the effect of Poisson’s ratio in laboratory push and pull testing of resin-encapsulated bolts. Int. J. Rock Mech. Min. Sci. 2013, 64, 175–180. [Google Scholar] [CrossRef]
  29. Li, L.; Li, F.; Zhang, Y.; Yang, D.; Liu, X. Formation mechanism and height calculation of the caved zone and water-conducting fracture zone in solid backfill mining. Int. J. Coal Sci. Technol. 2020, 7, 208–215. [Google Scholar] [CrossRef] [Green Version]
  30. Chen, B. Stress-induced trend: The clustering feature of coal mine disasters and earthquakes in China. Int. J. Coal Sci. Technol. 2020, 7, 676–692. [Google Scholar] [CrossRef]
  31. Lian, X.; Hu, H.; Li, T.; Hu, D. Main geological and mining factors affecting ground cracks induced by underground coal mining in Shanxi Province, China. Int. J. Coal Sci. Technol. 2020, 7, 362–370. [Google Scholar] [CrossRef] [Green Version]
  32. Zhang, L.; Li, J.; Xue, J.; Zhang, C.; Fang, X. Experimental studies on the changing characteristics of the gas flow capacity on bituminous coal in CO2-ECBM and N2-ECBM. Fuel 2021, 291, 120115. [Google Scholar] [CrossRef]
  33. Lin, J.; Ren, T.; Wang, G.; Booth, P.; Nemcik, J. Experimental investigation of N2 injection to enhance gas drainage in CO2-rich low permeable seam. Fuel 2018, 215, 665–674. [Google Scholar] [CrossRef]
  34. Wu, X.; Peng, Y.; Xu, J.; Yan, Q.; Nie, W.; Zhang, T. Experimental study on evolution law for particle breakage during coal and gas outburst. Int. J. Coal Sci. Technol. 2019, 7, 97–106. [Google Scholar] [CrossRef] [Green Version]
  35. Xue, D.; Zhou, H.; Liu, Y.T.; Deng, L.S.; Zhang, L. Study of Drainage and Percolation of Nitrogen–Water Flooding in Tight Coal by NMR Imaging. Rock Mech. Rock Eng. 2018, 51, 3421–3437. [Google Scholar] [CrossRef]
  36. Jia, Q.; Ni, X.; Zhang, L. Analysis of Acoustic Emission and Damage Characteristics of Coal Samples with Different Strength in Loading Process. J. China Coal Soc. 2017, 48, 232–234. [Google Scholar]
  37. Gan, Y. Research of Paramerer Characterization of Rock Fracturing and Optimizing of Locating Methods of AE Monitoring in Underground Engineering; University of Science and Technology Beijing: Beijing, China, 2020. [Google Scholar]
  38. Zhang, X.; Xiong, Q.; Jiang, X. Design and Implementation of Acoustic Emission Real-time Monitoring System for the Mine Safety. Met. Mine 2015, 7, 119–122. [Google Scholar]
Figure 1. Pictures of coal specimens. (A) Specimens X (B) Specimens D.
Minerals 11 01070 g001
Figure 2. Basic composition of acoustic emission system.
Minerals 11 01070 g002
Figure 3. Testing machinery.
Minerals 11 01070 g003
Figure 4. (a) Testing procedure and (b) post-testing samples. (A) Specimens X (B) Specimens D.
Minerals 11 01070 g004
Figure 5. Stress–strain curves of tested samples.
Minerals 11 01070 g005
Figure 6. Comparison of traditional and typical stress–strain curves of tested hard and soft coals.
Minerals 11 01070 g006
Figure 7. Distributions of the fractured sources of Specimen X.
Minerals 11 01070 g007
Figure 8. Distributions of the fractured sources of Specimen D.
Minerals 11 01070 g008
Figure 9. AE count results of Specimen X.
Minerals 11 01070 g009
Figure 10. AE count results of Specimen D.
Minerals 11 01070 g010aMinerals 11 01070 g010b
Figure 11. AE energy results of Specimen X.
Minerals 11 01070 g011aMinerals 11 01070 g011b
Figure 12. AE energy results of Specimen D.
Minerals 11 01070 g012aMinerals 11 01070 g012b
Table 1. Physical and mechanical parameters of the coal samples.
CoalDensity
kg/m3
Compressive Strength
MPa
Tensile Strength
MPa
Cohesion
MPa
Internal Friction Angle
Elastic Modulus
GPa
Poisson Ratio
Xinzhouyao135030.003.895.1629.274.620.32
Dongronger150010.001.892.1626.121.380.28
Table 2. Statistics of coal specimen failure stage.
SampleSpecimenAE Count
Initiation Stage
Peak Energy
Initiation Stage
XX1End of stage OAEnd of stage AB
X2Middle of stage OAPeak stress stage
X3Middle of stage OAPeak stress stage
X4Start of stage OAEnd of stage AB
X5End of stage OAEnd of stage AB
X6End of stage OAStart of stage AB
DD1Middle of stage ABEnd of stage AB
D2End of stage OAPeak stress stage
D3End of stage OAEnd of stage AB
D4Start of stage OAEnd of stage AB
D5Start of stage OAEnd of stage OA
D6Start of stage OAMiddle of stage AB
Publisher’s Note: MDPI stays neutral with regard to jurisdictional claims in published maps and institutional affiliations.

