Article

Nb–Ta Behaviour during Magma-to-Pegmatite Transformation Process: Record from Zircon Megacrysts in Pegmatite

1
Beijing Research Institute of Uranium Geology, China National Nuclear Corporation, Beijing 100029, China
2
Saudi Geological Survey, Jeddah 21514, Saudi Arabia
*
Author to whom correspondence should be addressed.
Submission received: 29 August 2021 / Revised: 4 October 2021 / Accepted: 14 October 2021 / Published: 17 October 2021

Abstract

:
Due to the absence of early magma records in pegmatites, it is difficult to investigate the behavior of Nb and Ta during the transformation from magma to pegmatite melt. Zircon megacrysts in an NYF-type (Nb-Y-HREE-F) pegmatite from the Arabian Shield could be divided into three phases from core to margin. The Phase Ι zircon in the core of the zircon megacrysts had typical magma oscillatory zonation with ∑REE content from 300 to 400 ppm, Th/U ratios of less than 0.1 and Nb/Ta ratios of less than 1.0. Phase ΙΙ zircon had oscillatory zonation and was enriched with LREEs mostly with Th/U ratios of 0.1–0.2 and Nb/Ta ratios of 1.0–3.0. Phase ΙΙΙ unzoned zircon had the highest ∑REE content, from 8000 to 15,000 ppm, with Th/U ratios higher than 3.0 and Nb/Ta ratios higher than 5.0. The Hf-O isotopic composition was similar in the different phases of zircon with initial 176Hf/177Hf ratios of 0.28258–0.28277, εHf(t) values from 8.0 to 12.0 and δ18OVSMOW from +4.0‰ to +5.0‰. Zircon megacrysts in the NYF-type pegmatite from the Arabian Shield record the transformation from magma to pegmatite melt. Similar Hf-O isotopic compositions mean a closed magmatic system without contamination by external melt, rock or fluid. The proposed modeling shows that magma with low Nb and Ta concentrations and Nb/Ta ratios could evolve into residual pegmatite melt with a high Nb content and superchondrite Nb/Ta ratio during several stages of melt extraction and fractional crystallization of Ti-rich minerals, such as rutile and titanite. The Nb/Ta ratio can be used as an effective indicator of the transformation process from magma to pegmatite melt.

1. Introduction

The Nb-Ta behavior during the transformation from magma to pegmatite melt has always been a key issue in the study of pegmatites and this barrier has also restricted a further understanding of the transition mechanism from magma to hydrothermal fluid [1,2]. NYF-type (Nb-Y-HREE-F) pegmatite could produce Nb deposits; however, the Nb-Ta fractionation mechanism is also a conundrum. Stepanov et al. [3] compiled the major and trace elements composition of granite and Ta ore and discovered that mica crystallization in granite source results in the formation of LCT-type (Li-Cs-Ta) pegmatite with a high Ta content and Tb/Nb ratio. Černý et al. [2] indicated that NYF-type pegmatite usually has a high Nb concentration and Nb/Ta ratio, but it is not clear whether the Nb and Ta features of pegmatite represent that of the source or whether these two elements are fractionated due to an aspect of the mineralogy or fluid chemistry of their parental alkaline magmas. Due to the absence of early magma crystallization records in pegmatites, it is difficult to study the transformation in detail [4]. The zircon megacrysts that record the transition from magma to pegmatite melt studied in this article are very rare [1,2,4] and, from it, we can analyze the trace elements and isotopic composition and describe the transformation and element fractionation from magma to pegmatite melt.
Zircon is commonly used for dating and tracing and its trace elements and Hf-O isotopic composition could provide effective indications in terms of the magmatic source and evolution [5,6]. Limited by crystallization temperature and condition, zircon commonly records a certain stage of the magmatic evolution process. To the best of our knowledge, few published reports introduced the evolution process from magma to pegmatite melt.
This paper studies the occurrence, Hf-O isotopic composition and trace elements composition of zircon megacrysts in a pegmatite from our working area and discusses that Phase Ι and ΙΙ zircon was crystallized from early magma and Phase ΙΙΙ zircon formed in pegmatite melt. The Nb/Ta ratio could indicate the transformation process.

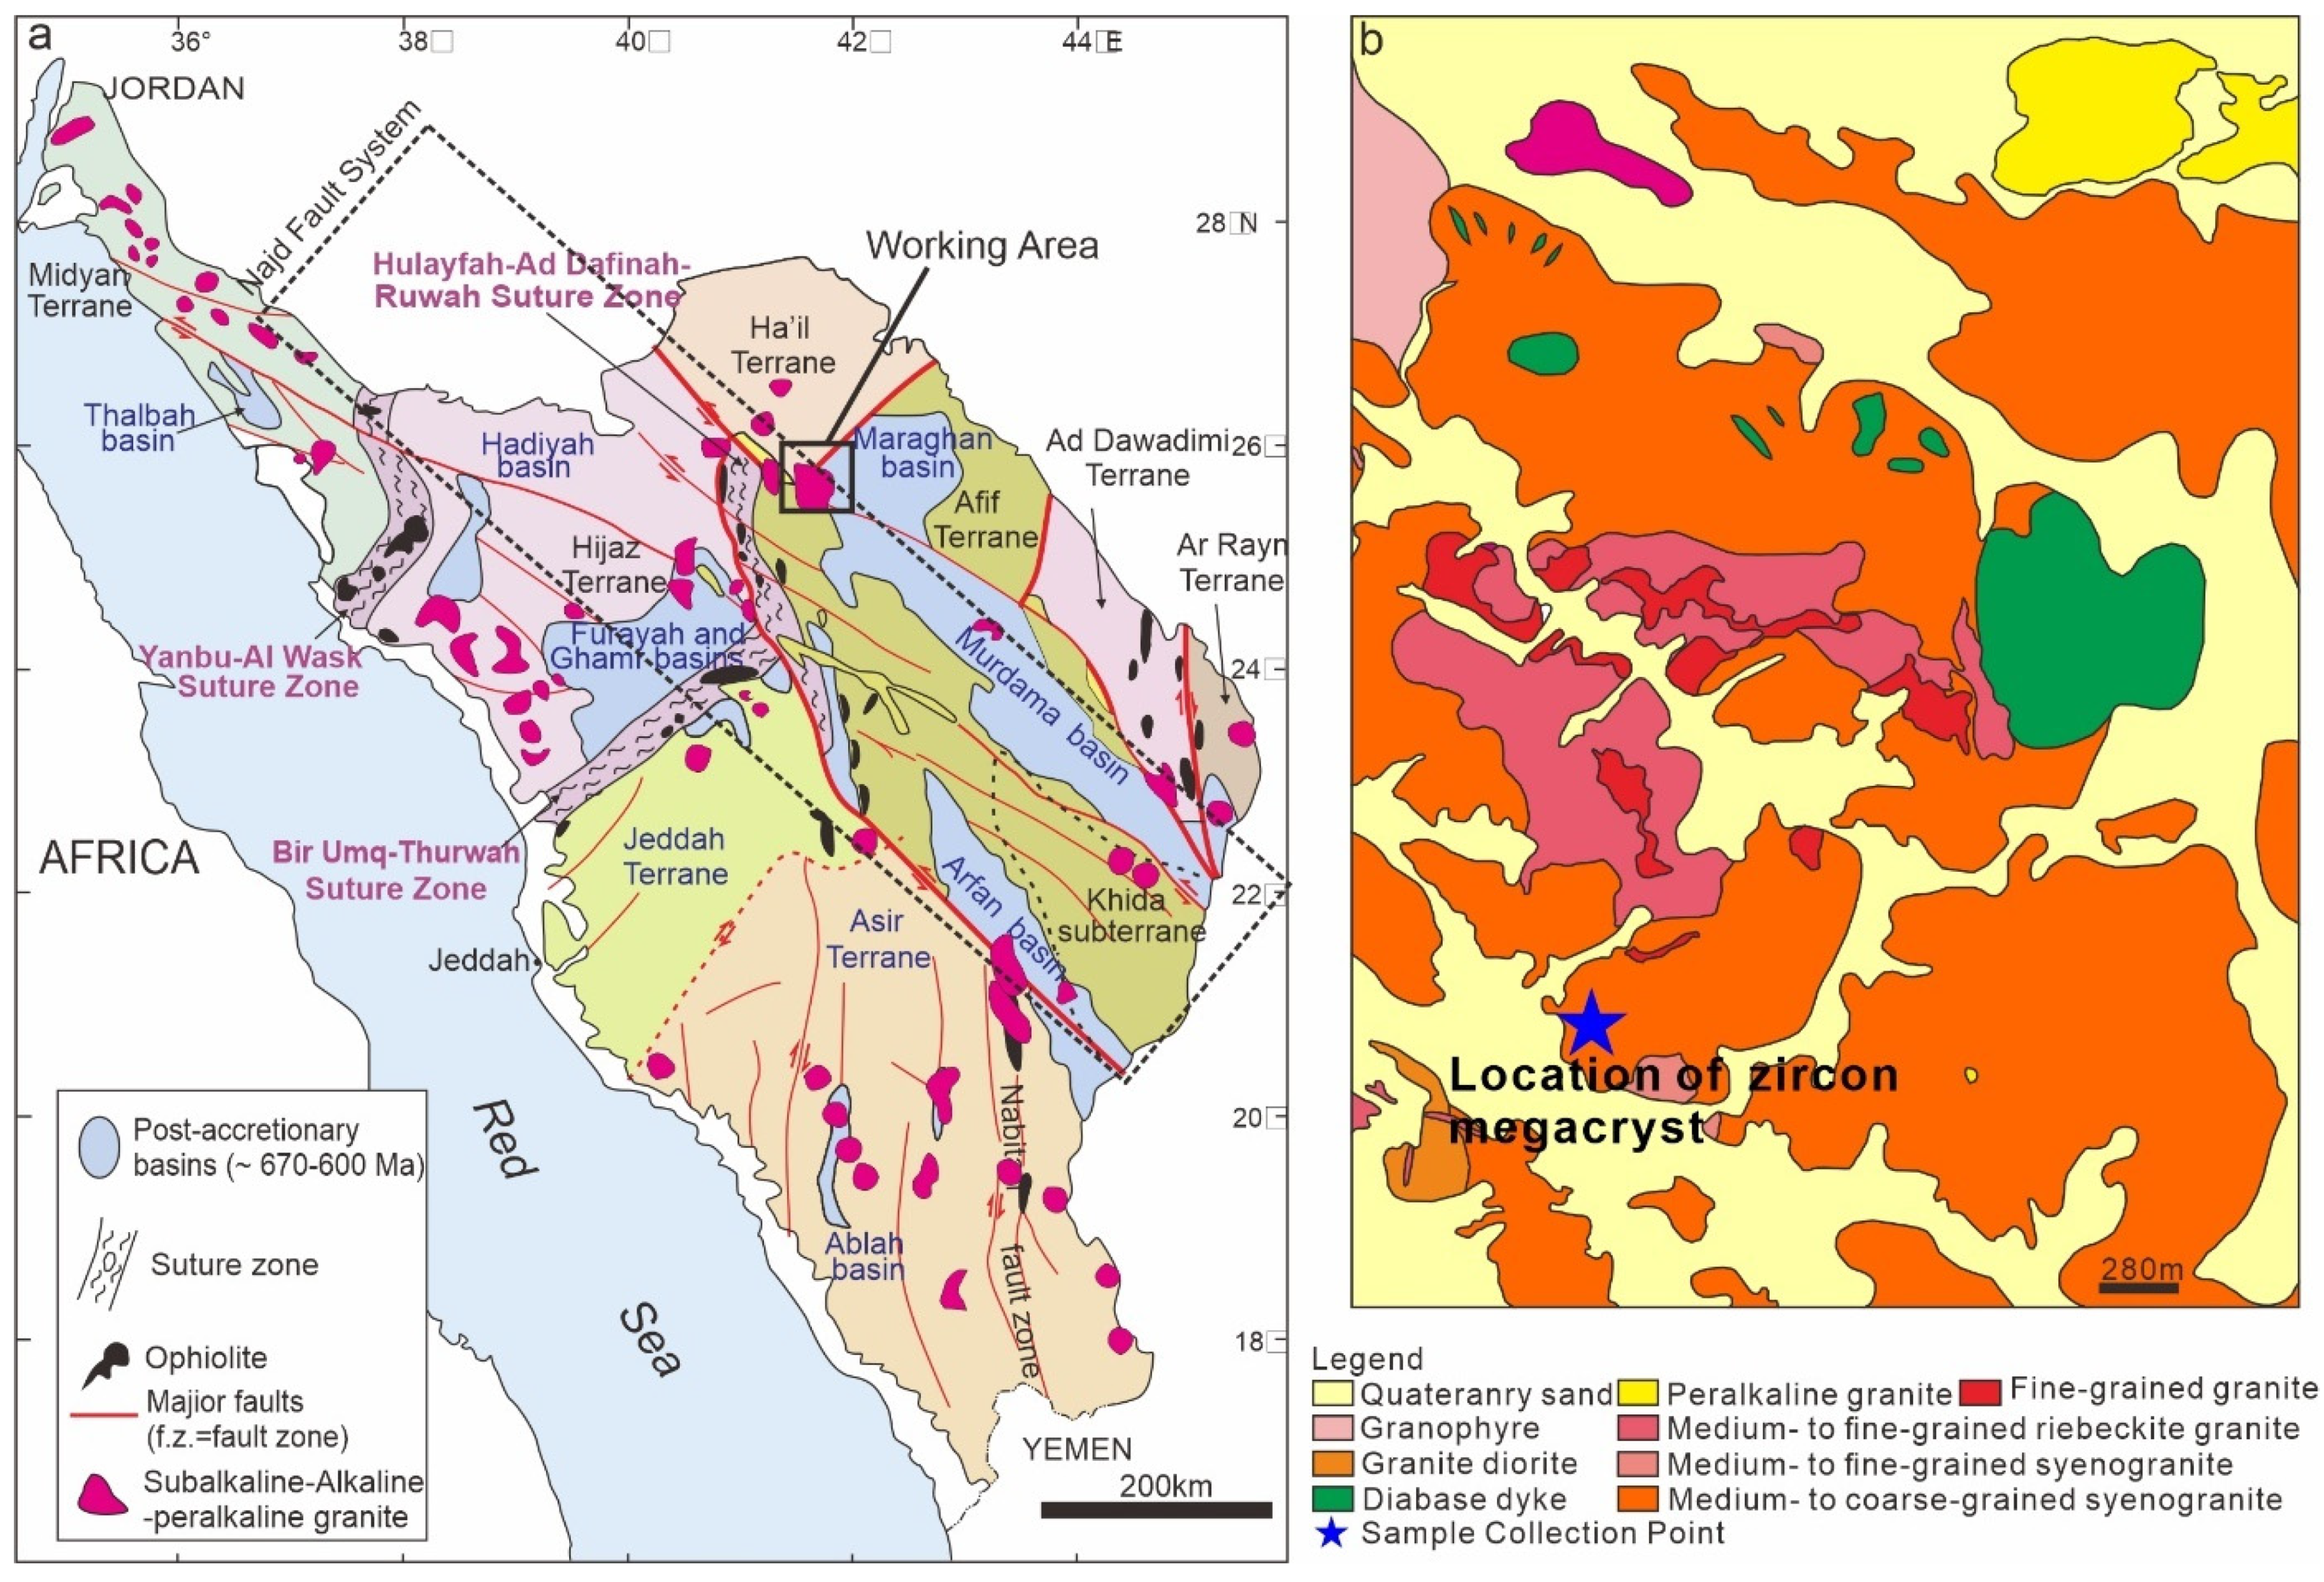
2. Geological Background

The Arabian-Nubian Shield (ANS) is a geological crustal province of the Neoproterozoic age exposed in NE Arabia and Africa, along margin of the Red Sea from Ethiopia in the south to Jordan in the north [7,8]. It evolved through the accretion of juvenile island-arc during the closure of the Mozambique Ocean over more than 250 Ma and maturated crust in early Ediacaran time as a granitoid-dominated continental, following a compressional deformation along the northern part of the East-African orogeny (Figure 1) [7,9]. The magmatic pattern is consistent with the generally accepted view that magmatism in the Arabian-Nubian Shield evolved during the Cryogenian and Ediacaran from an early episode of island-arc tholeiite and calc-alkaline tonalite-trondhjemite-granodiorite (TTG) assemblages to collisional calc-alkaline TTG and granite assemblages to post-collisional within-plate, extensional and anorogenic A-type alkaline assemblages during the Cryogenian and Ediacaran [7,10,11,12,13,14,15]. Syenogranite and monzogranite intrusions were emplaced sporadically during the Cryogenian (850~630 Ma), but became abundant after approximately 650 Ma. Alkali granites and alkali-feldspar granites overlapped with syenogranites and monzogranite from 640 Ma onward, with peaks at approximately 630~590 Ma [13]. The timing of the cessation of the TTG formation and the Ediacaran peak of granitic magmatism are comparable to the timing of the transition from I-type to A-type magmatism in Sinai at 610 Ma [16,17].
The study area is composed of medium- to coarse-grained syenogranite, medium- to fine-grained riebeckite granite, peralkaline granite, granophyre, etc. Pegmatite forms as lenses in syenogranite (Figure S1) and can be divided into margin and core parts. The marginal part was mainly composed of quartz and feldspar with fine-grained granitic texture; the core part was mainly composed of coarse-grained to pegmatitic quartz and feldspar. Zircon megacrysts picked out from the pegmatite were brown and opaque, euhedral to subhedral crystals up to 5 cm in diameter, well preserved, composed of several magma crystallization phases, often stuffed with Fe-oxides mineral inclusions in the marginal part (Figure 2).

3. Methods

3.1. SIMS Zircon U-Pb Dating

The zircon megacrysts were mounted in epoxy resin along with Plešovice, Qinghu zircon standards. The mounts were polished to expose the internal parts of the grains. The mounts were ultrasonically cleaned with deionized water and alcohol and coated with gold prior to the SIMS (secondary ion mass spectrometry) analysis. Prior to U-Pb isotopic analysis, the zircon grains were examined with transmitted and reflected light and cathodoluminescence (CL) images to reveal their internal textures. U-Pb dating of the zircon was conducted using a CAMECA IMS-1280HR ion microprobe (Gennevilliers, France) at the Beijing Research Institute of Uranium Geology. We used the shaped and monocollector modes to determine the zircon U-Pb ages.
The O2- primary ion beam was accelerated at −13 kV. The aperture illumination mode (Kohler illumination) was used with a 200 μm primary beam mass filter (PBMF) aperture. The ellipsoidal spot was about 20 μm × 30 μm in size. Positive secondary ions were extracted with a 10 kV potential. Oxygen flooding was used to increase the O2 pressure to ~2.0 × 10⁻⁵ mbar in the sample chamber, enhancing the Pb+ sensitivity.
In the secondary ion beam optics, a 50 eV energy slit was used, together with a mass resolution of 4500 (defined at 10% peak height) to separate the Pb+ peaks from isobaric interferences. The field aperture was set to 6000 μm and the entrance slit was adjusted to about 120 μm. Rectangular lenses were activated in the secondary ion optics to increase the transmission at high mass resolution. The monocollector mode was used to measure secondary ion beam intensities by peak jumping sequence: 90Zr216O, 92Zr216O, 200.5, 94Zr216O, 204Pb, 206Pb, 207Pb, 208Pb, 238U, 232Th16O, 238U16O and 238U16O2. Each measurement consisted of 7 cycles and the total analytical time was about 11 min. A correction for common Pb was made by measuring the 204Pb amount. Generally, normal zircon has a lower concentration than common Pb and measured zircon 206Pb/204Pb ratios are mostly higher than 10,000. The data were calculated by Isoplot 4.15. The 207Pb/206Pb-204Pb/206Pb isochron age of standard Plešovice zircon was 335 ± 11 Ma (MSWD = 0.93) (Table S3), similar to the commonly accepted age of 337 Ma [18]. More details can be found in Li et al. [19].

3.2. SIMS Zircon Oxygen Isotopic Analysis

The oxygen isotopic analysis of zircon was conducted using a CAMECA IMS-1280HR ion microprobe at the Beijing Research Institute of Uranium Geology and the Guangzhou Institute of Geochemistry, Chinese Academy of Sciences. We used the Gaussian and multicollector modes to determine the zircon O isotopic composition. The 133Cs primary ion beam was accelerated at 10 kV with an intensity of ~2 nA. The Gaussian mode was used with a 400 μm mass aperture. The ion beam was approximately 10 μm in size and a raster with 10 μm was used to scan an area of approximately 20 μm. Positive secondary ions were extracted with a ~10 kV negative potential.
In order to compensate for sample charging during the analysis, a normal incidence electron flood gun was applied with a homogeneous electron density over a 100 μm elliptical area. In the secondary ion beam optics, a 50eV energy slit was used, together with a mass resolution of 2400 (defined at 10% peak height) to separate the peaks from isobaric interferences. The entrance silt and exit silt were set to 150 μm and 405 μm, respectively; the field aperture and contrast aperture were adjusted to 5000 μm and 400 μm, respectively. A multicollection mode was adopted to measure the oxygen isotope compositions. Secondary 16O and 18O ions were measured simultaneously using two Faraday cup detectors. Each analysis was composed of 20 cycles and per-sputtering of approximately 3 min and 40 s [20].
The standards (Penglai and Qinghu) were analyzed simultaneously to apply the instrumental mass bias correction. The instrumental mass fraction factor (IMF) was accounted for using the Penglai zircon standard with δ18OVSMOW = +5.31 ± 0.1‰ [20] or the Qinghu zircon standard with δ18OVSMOW= +5.39 ± 0.1‰ [21]. The standards analyses and measured values precision of individual analyses were better than 0.3‰ by 2SD. The results of the18O/16O ratios are reported in per mil notation relative to the Vienna Standard Mean Ocean Water (VSMOW, 18O/16O = 0.0020052).
During the analytical session, the Qinghu zircon standard was measured as an unknown. The Qinghu oxygen isotopic results of SIMS at the Beijing Research Institute of Uranium Geology and Guangzhou Institute of Geochemistry, Chinese Academy of Sciences, during samples oxygen isotopic testing, yielded a weighted mean of δ18OVSMOW = +5.46 ± 0.13‰(1σ), which is consistent within the error in the reported value of +5.39 ± 0.1‰ (1σ) (Table S5).

3.3. LA-ICP-MS Zircon Hf Isotopic Analysis

The zircon Hf isotopic analyses were conducted at the Beijing Research Institute of Uranium Geology using a Nu Plasma ΙΙ multi-collector (MC)-ICP-MS (Wrexham, United Kindom) with an attached GeoLasPro 193 nm excimer laser-ablation system. During the Hf analysis, a laser repetition rate of 10 Hz and energy of 15J/cm2 were used and the spot size was 40 μm. The raw count rates for 172Yb, 173Yb, 175Lu, 176(Hf+Yb+Lu), 177Hf, 178Hf, 179Hf, 180Hf and 182W were collected and the isobaric interference corrections for 176Lu and 176Yb on 176Hf were precisely determined. The total analytical time was approximately 1 min, including 20 s of blank gas collection and 30 s of laser ablation. The detailed analytical procedure and correction for interferences followed those described by Wu et al. [22]. During the analyses, the 176Hf/177Hf ratios of the Plešovice zircon standard were 0.282481 ± 23 (1SD, n = 13), similar to the commonly accepted 176Hf/177Hf ratio of 0.282482 ± 23 (2SD) [18]. The 176Hf/177Hf ratios of 91,500 zircon standard were 0.282303 ± 22 (1SD, n = 29), similar to the commonly accepted 176Hf/177Hf ratio of Z 0.282308 ± 6 (2SD) [23]. The 176Hf/177Hf ratios of Mud Tank zircon standard were 0.282507 ± 20 (1SD, n = 29), similar to the commonly accepted 176Hf/177Hf ratio of 0.282523 ± 10 (2SD) [24] (Table S7).

3.4. LA-ICP-MS Trace Elements Analysis

Zircon trace elements experiments were carried out on an Analytik Jena AG PlasmaQuant MS Plus, ICP-MS instrument (Jena, Germany) in combination with an excimer 193 nm laser ablation system (NewWave, NWR193 UItra Compact). The rutile trace elements were analyzed by using an Element XR SF-ICP-MS instrument (Thermo Fisher Scientific, Massachusetts, USA) with a GeoLas HD 193 nm ArF excimer laser-ablation system at the Beijing Research Institute of Uranium Geology. Generally speaking, LA-ICP-MS measurements of zircons were carried out using a time-resolved analysis in fast, peak jumping mode. Each spot a nalysis consisted of approximately 30 s of background acquisition followed by 40 s of data acquisition from the sample. The excimer laser system was equipped with apertures, which imaged the laser beam onto the sample surface. This optical configuration allows a constant fluence to be selected, which is independent of crater diameters. Helium was used as carrier gas. Calibration was performed using NIST SRM610 and -612 as the external calibrants in conjunction with internal standardization using Si according to Anczkiewicz et al. [25]. Data reduction was performed by using the GLITTER 4.0 software (Macquarie University). The concentration values of NIST SRM 610 used for external calibration were taken from Pearce et al. [26]. Trace elements measurements of rutile were carried out using low mass resolution to maximize sensitivity. Helium was used as the carrier gas to enhance the efficiency of transportation. A repetition rate of 3 Hz and a laser energy density of 3 J cm−2 were used.

4. Results

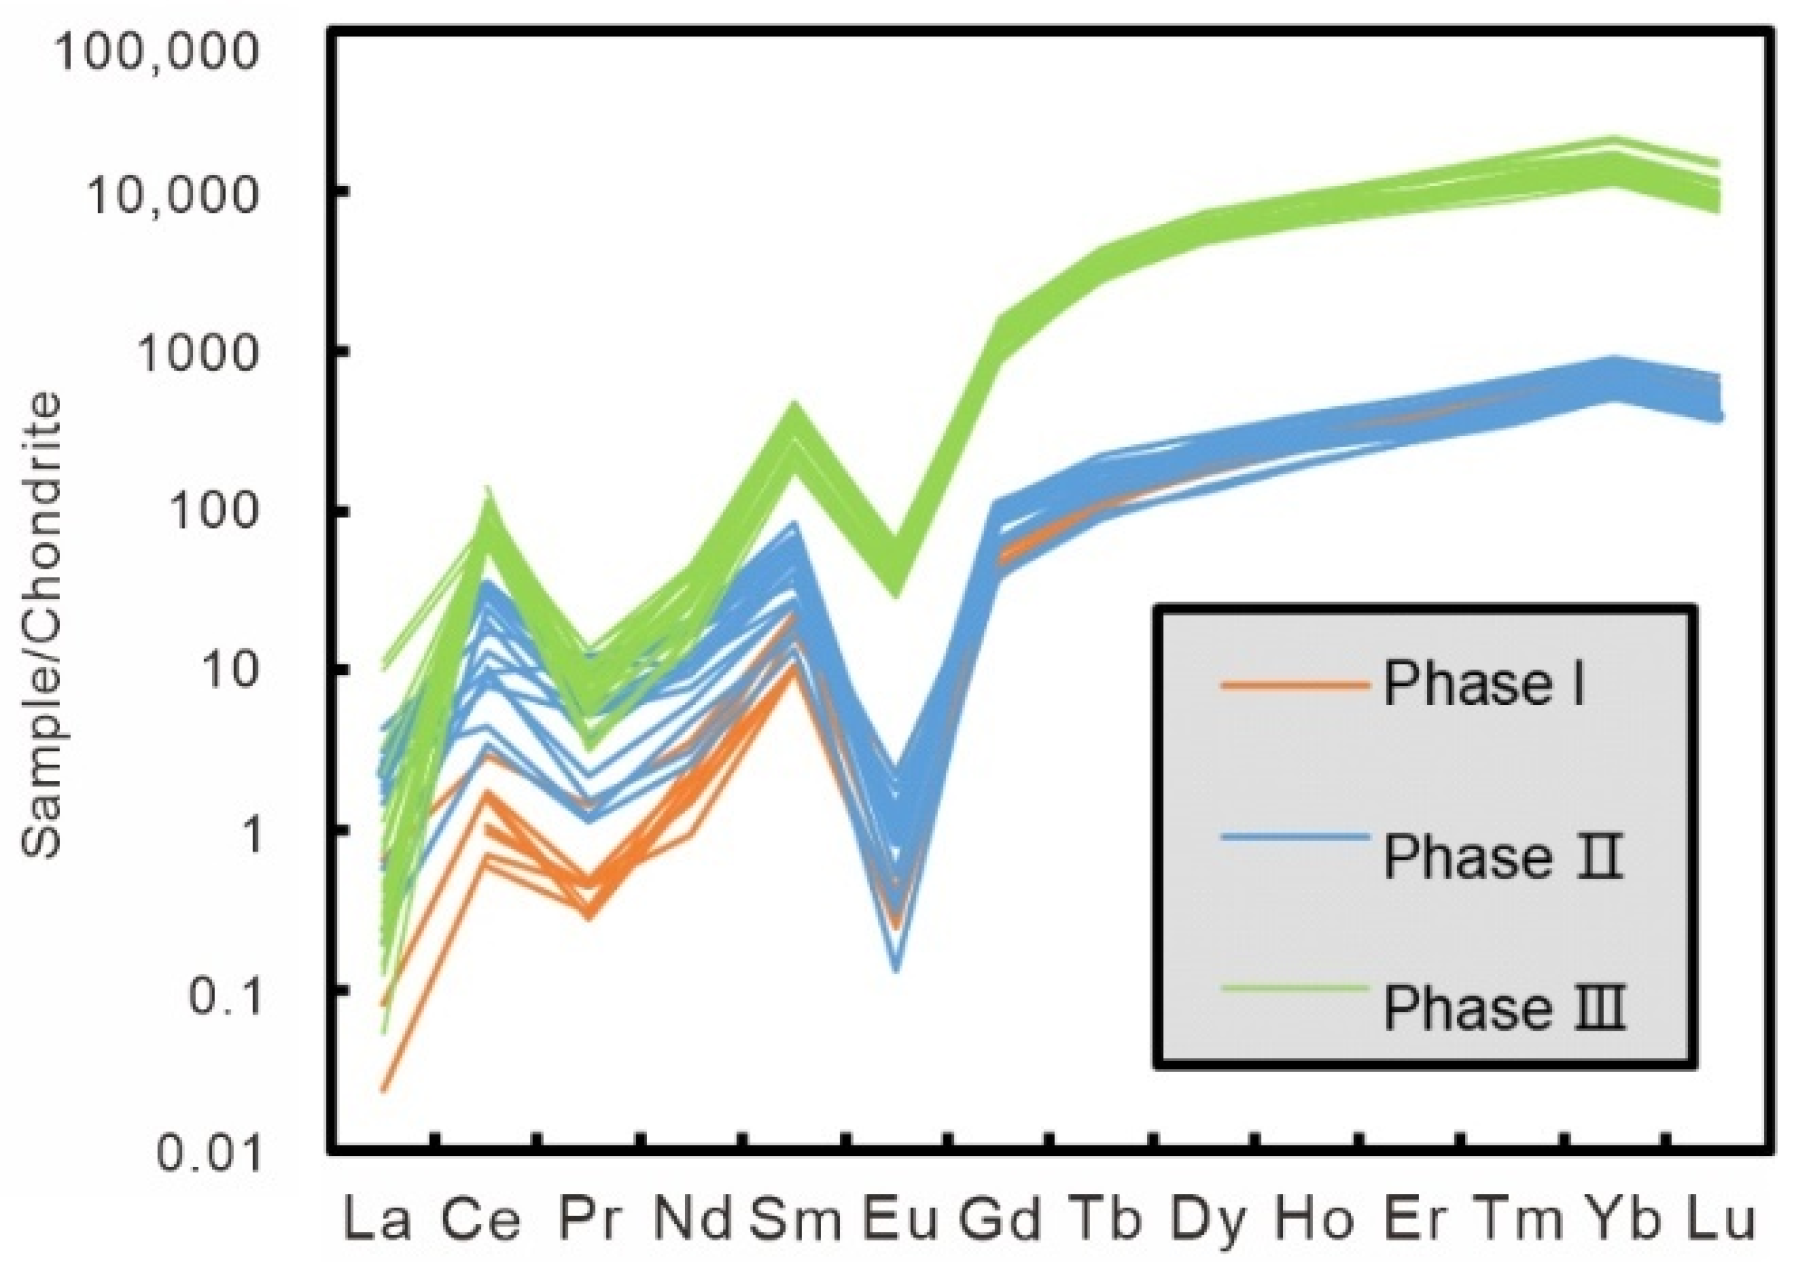
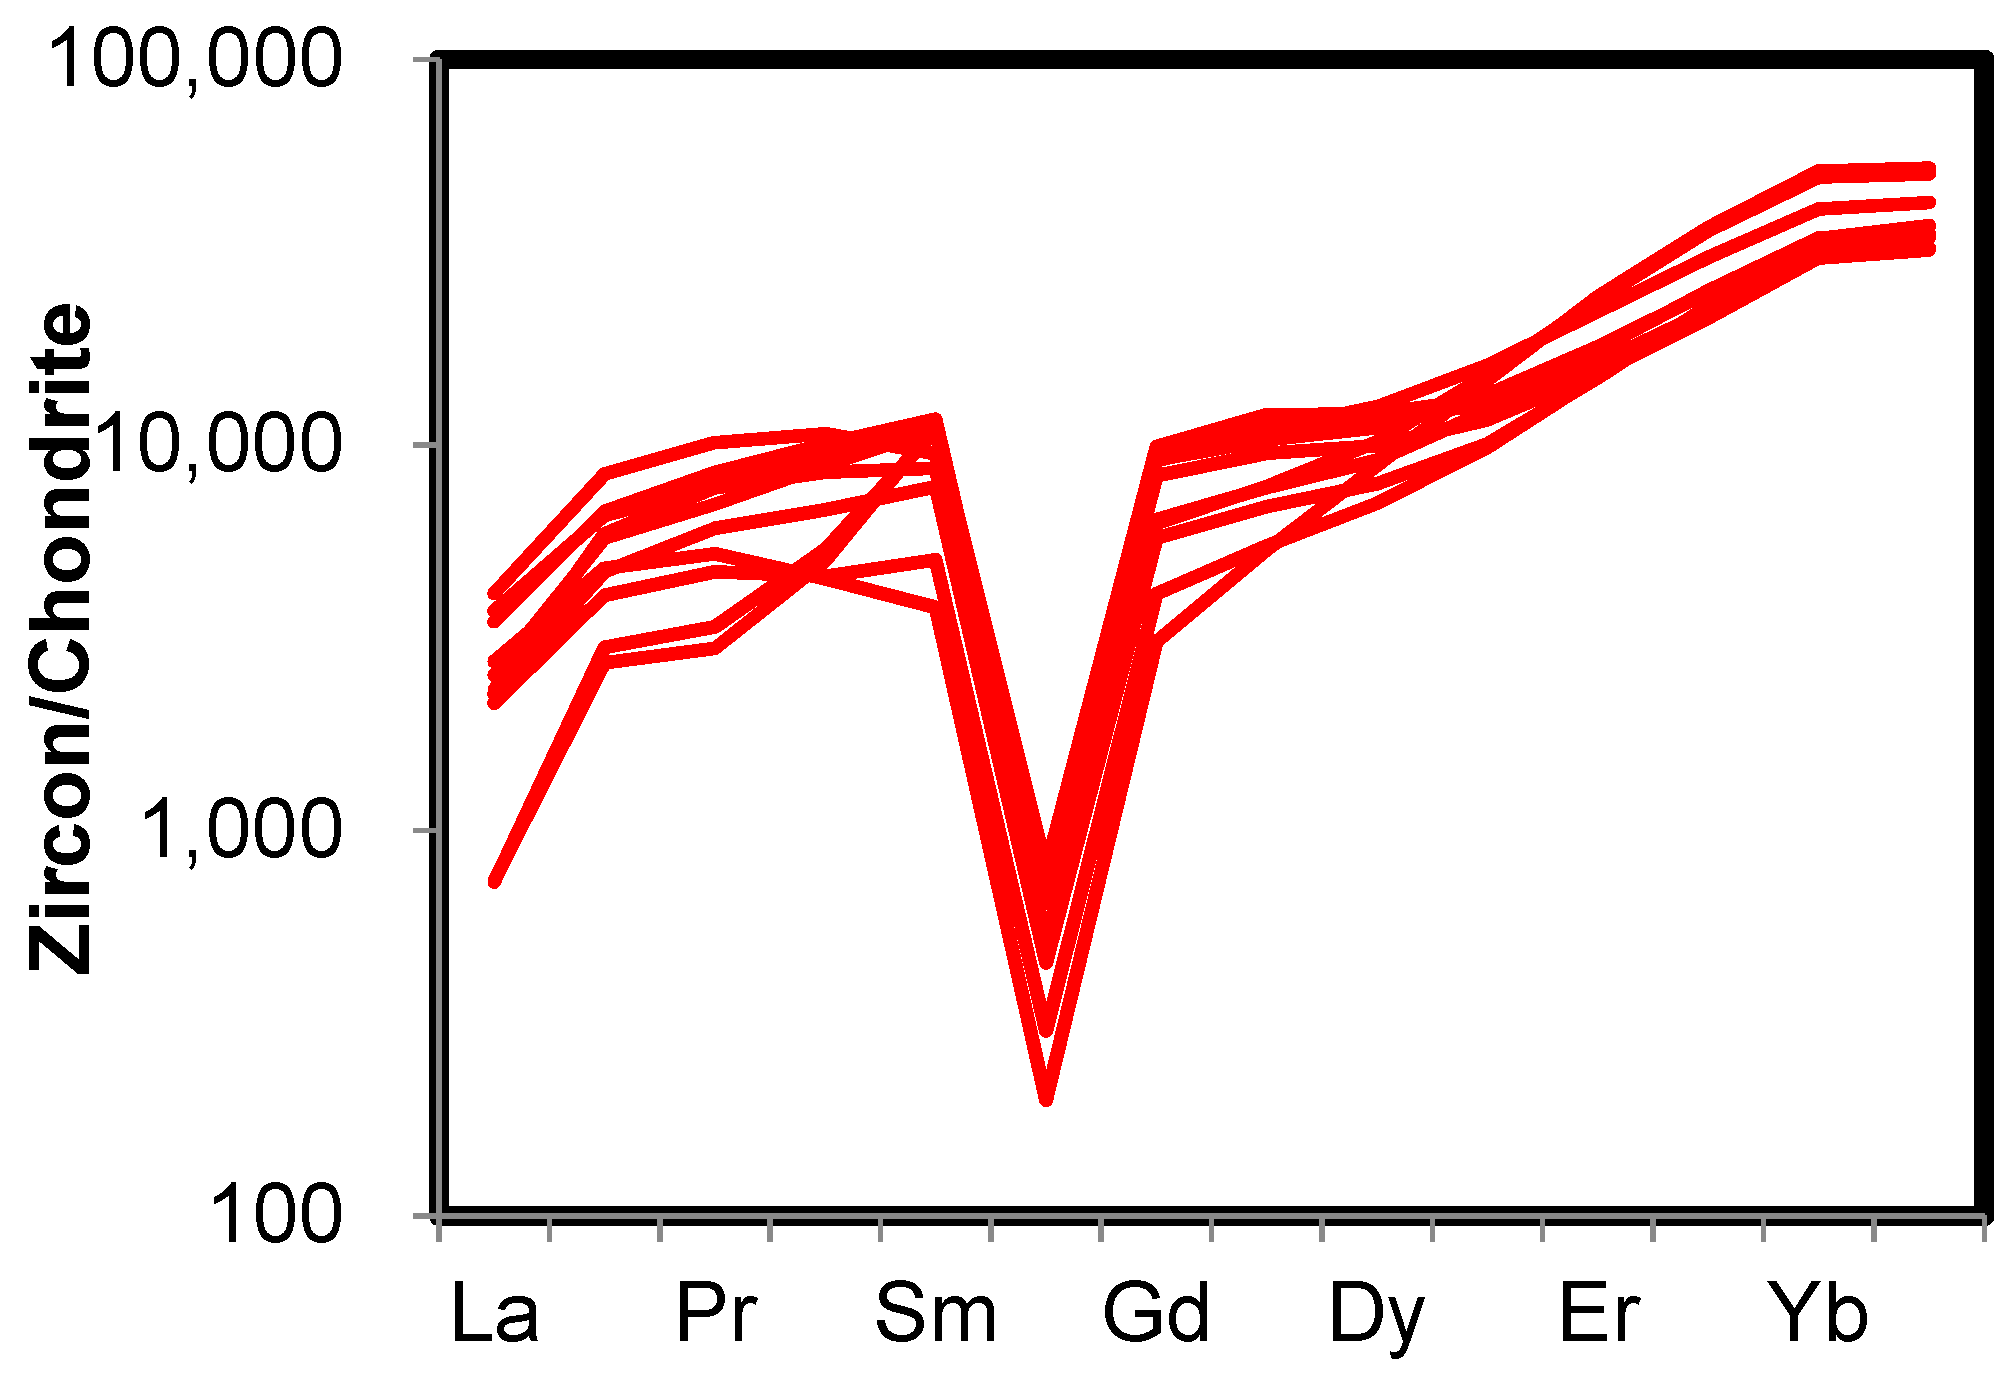
4.1. Trace Elements Composition of Zircon Megacrysts

We collected spectacularly large (up to several centimetres in size), brown, opaque zircons with subhedral to euhedral shapes in pegmatites. Three phases of zircon could be distinguished. The characteristics of Phase Ι zircons in the core of the zircon megacrysts included typical magma oscillatory zonation, sizes from 100 μm to 1000 μm, Th/U ratios of less than 0.1, ∑REE content from 315 ppm to 417 ppm and low contents of light REE (LREEs), heavy REE (HREEs), U, Th, Y, a positive Ce anomaly and a negative Eu anomaly. Phase ΙΙ zircons had clear oscillatory zonation with HREE concentrations similar to Phase Ι. Phase II were enriched with LREEs with Th/U ratios from 0.1 to 0.3 and more abundant than Phase I. The characteristics of Phase ΙΙΙ unzoned zircons were Th/U ratios higher than 2.0 (even up to 10.0), a higher concentration of HREEs, U, Th, P and Y and higher positive Ce anomaly. Phase ΙΙΙ, in the marginal parts of the zircon megacryst, contained abundant hematite mineral inclusions. The minerals associated with zircon megacrysts were bastnaesite, fluorite, arfvedsonite, rutile and titanite (Figure 3 and Figure 4; Supplementary Figures S2 and S4). The Ce/Ce* of Phase Ι, ΙΙ and ΙΙΙ zircons changed sequentially from ~2 to ~100 and the degree of magma oxidation evolved from a reducing (corresponding to Iron-wüstite) to an oxidizing environment (corresponding to Magnetite-hematite) (Figure S7), which corresponds with the occurrence of hematite inclusions in Phase ΙΙΙ zircon.
Phase Ι zircons had the lowest Nb and Ta concentrations and Nb/Ta ratios, while Phase ΙΙ and ΙΙΙ zircons had similar Nb concentrations; however, Ta concentrations decreased from Phase ΙΙ to ΙΙΙ zircons. The Nb/Ta ratio of the zircon megacrysts continuously increased from Phase I to ΙΙΙ from <1.0 to > 5.0 (Figure 4).

4.2. Timing Evolution of Zircon Megacrysts

Considering the variable trace elements content in the zircon phases, especially the Th content and possible matrix effect, the in situ zircon U–Pb age determination was not a suitable method for determining the time of zircon crystallization, although the dating results show that the U-Pb isotopic system remained almost closed and without an obvious Pb loss. In order to minimize the matrix effect, we chose to use the 207Pb/206Pb-204Pb/206Pb isochron age to date. All Phase Ι to Phase ΙΙΙ zircon showed a close correlation between the measured 204Pb/206Pb and 207Pb/206Pb ratios. The Isochron ages of Phase Ι, II and ΙΙΙ zircon were obtained; Phase Ι, ΙΙ and ΙΙΙ zircon were 640 ± 12 Ma (MSWD = 0.74), 642 ± 17 Ma (MSWD = 0.53) and 636.1 ± 4.3 Ma (MSWD = 0.62), respectively. The timing of the zircon phases by SIMS were too close to distinguish the duration of the crystallization (Figure S9, Table S3).

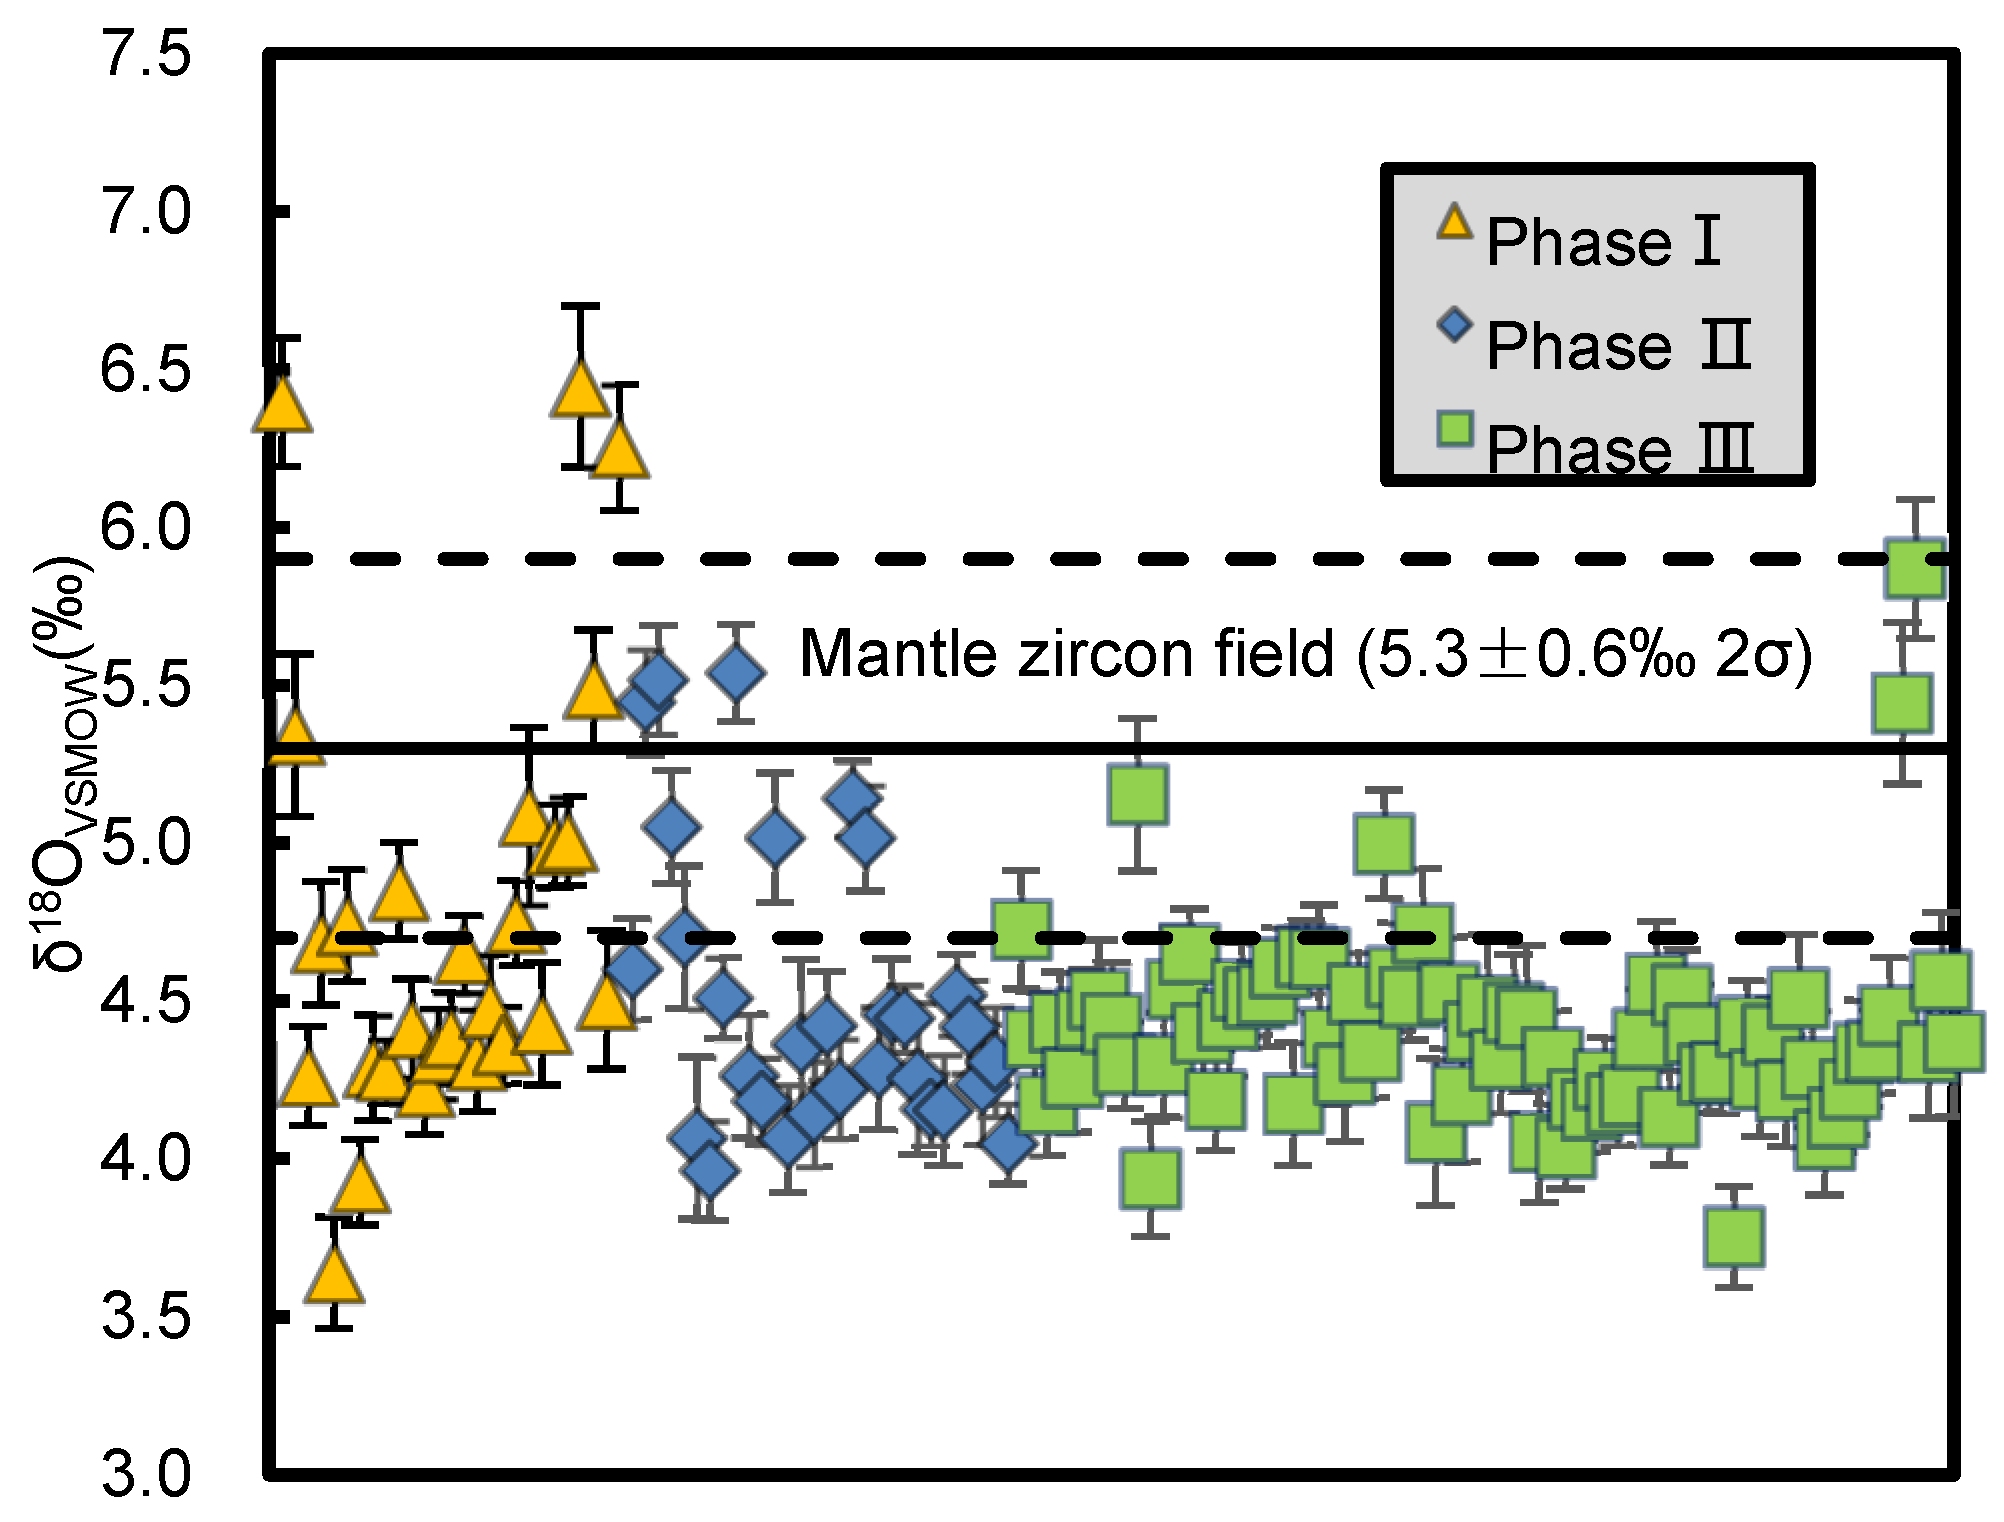
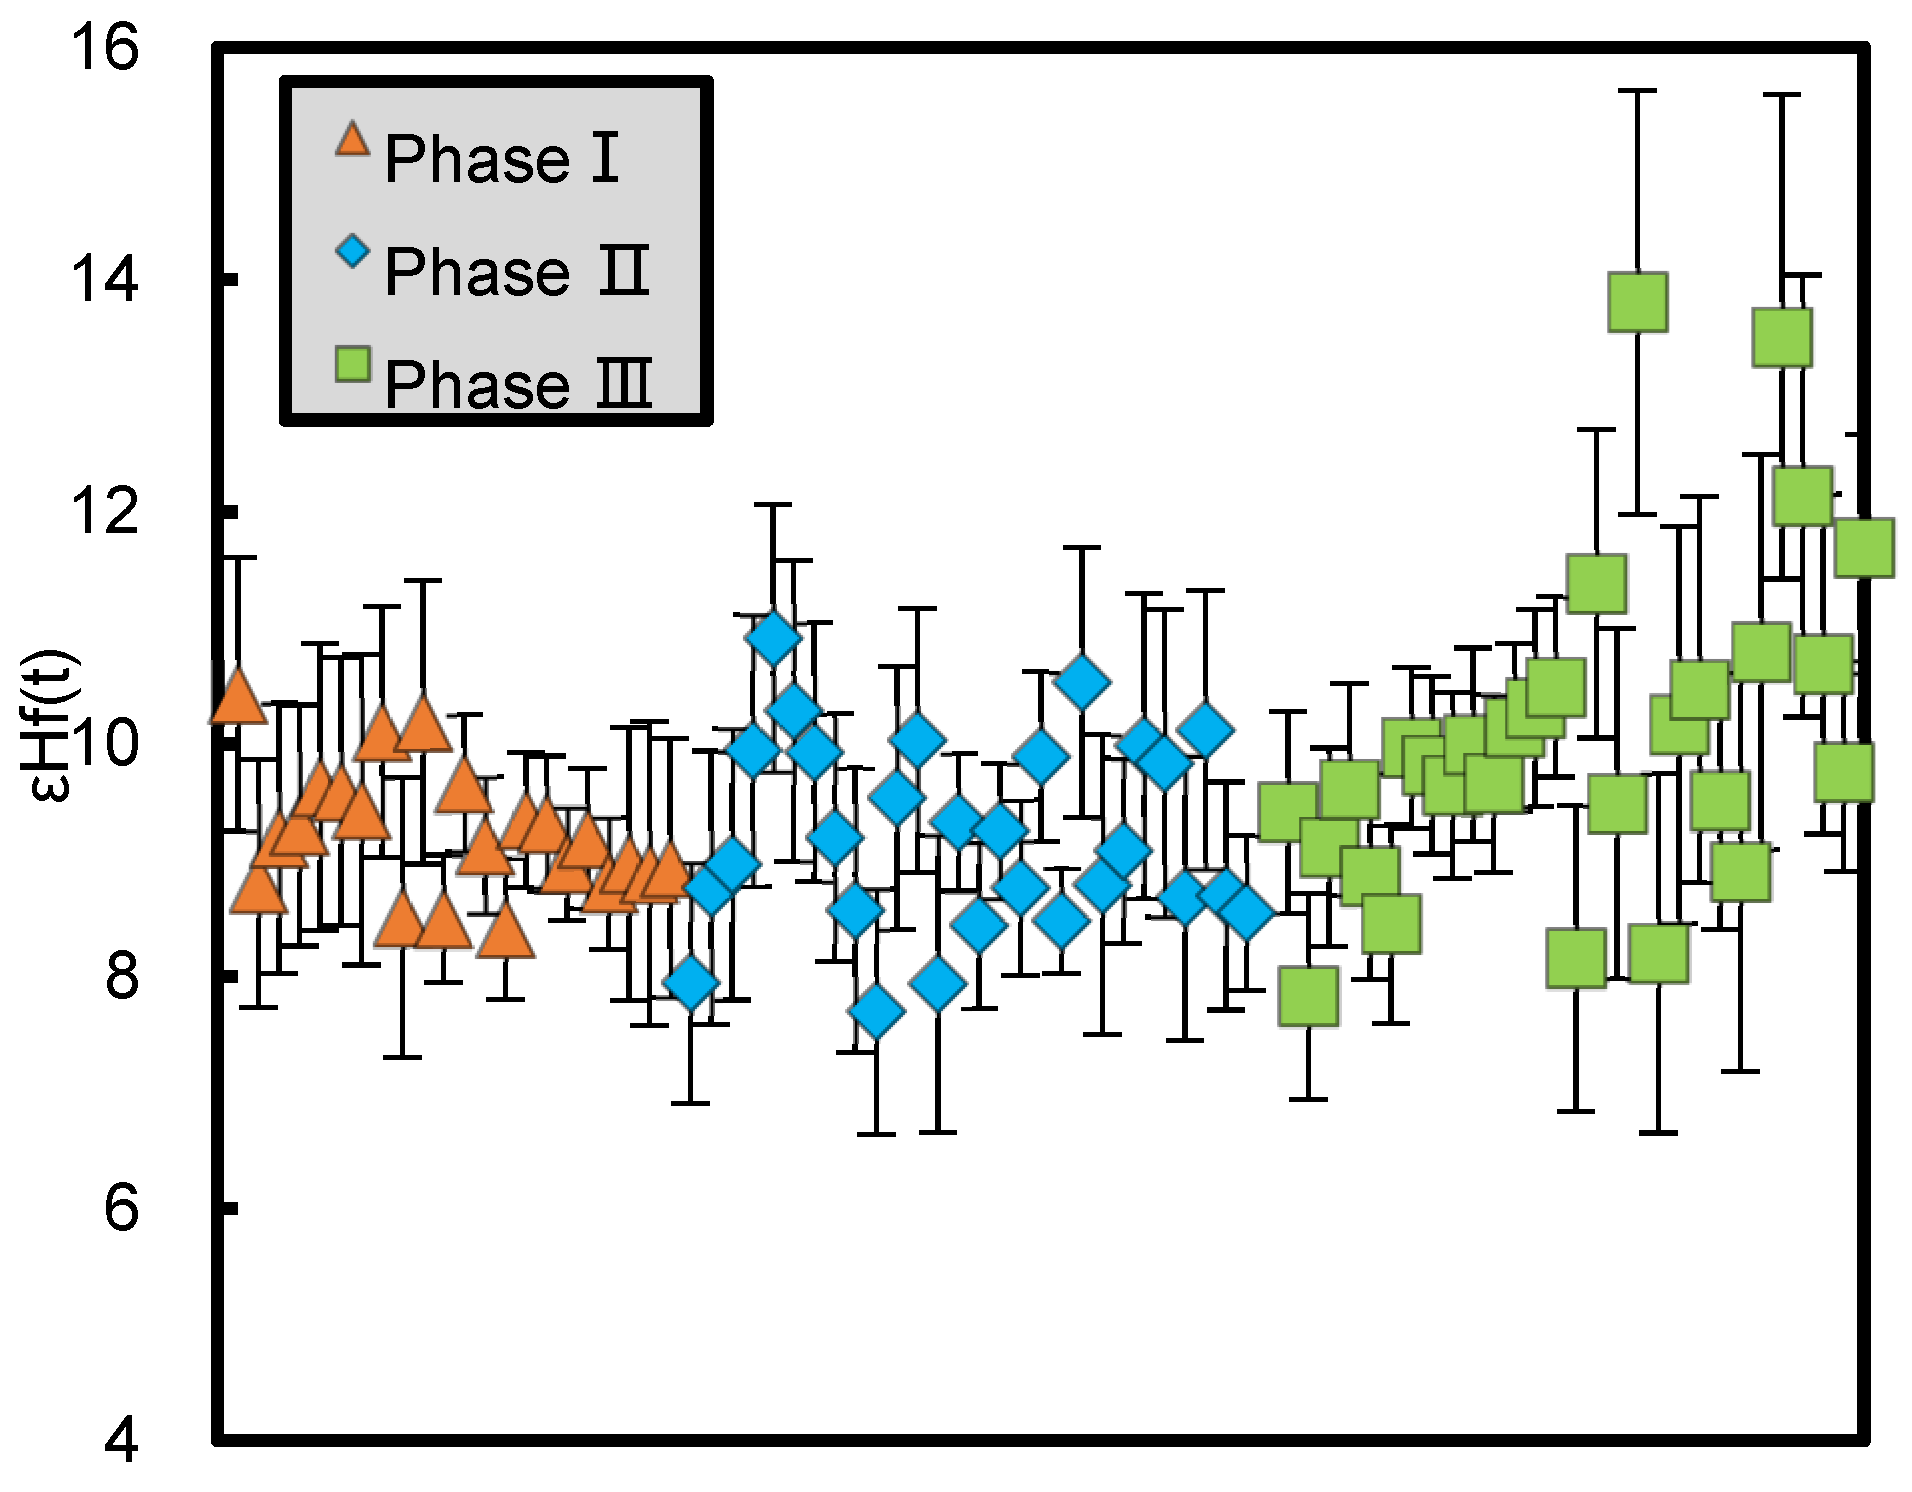
4.3. Hf-O Isotopic Characteristics of Zircon Megacrysts

The δ18OVSMOW values of Phase Ι and ΙΙ showed a larger range than those of Phase ΙΙΙ of zircon megacrysts (from +3.6‰ to +6.8‰), most of which fell between +4.0‰ and +5.0‰, partly in the mantle δ18OVSMOW range. The δ18OVSMOW values of Phase ΙΙΙ mostly ranged from +4.0‰ to +5.0‰ and some values showed mantle values. The δ18OVSMOW values of zircons of different phases were mostly similar from the core to the margin (Figure 5). Higher values of > +6.0‰ usually had higher internal precisions of 16O counts, indicating contamination by the inclusions (Figure 5; Figure S10, Table S4).
Zircons of different phases had similar initial 176Hf/177Hf ratios and εHf(t) values. Phase Ι had initial 176Hf/177Hf ratios from 0.28261 to 0.28267 and εHf(t) values from +8.4 to +10.4, calculated at 640 Ma, with TDM ages from 810 Ma to 890 Ma. Phase ΙΙ had initial 176Hf/177Hf ratios from 0.28259 to 0.28268 and εHf(t) values from +7.7 to +10.9, calculated at 642 Ma, with TDM ages from 790 Ma to 920 Ma. Phase ΙΙΙ had initial 176Hf/177Hf ratios from 0.28258 to 0.28277 and εHf(t) values from +7.1 to +13.8, calculated at 636.1 Ma, with TDM ages from 680 Ma to 990Ma. Higher εHf(t) values of >12.0 in Phase ΙΙΙ may have resulted from the high Yb content and inaccurate correction of 176Yb (Figure S11). The εHf(t) values of zircon megacrysts were mostly from +8.0 to +12.0 and the εHf(t) values of different phases zircons from the core to the margin were stable, indicating that there were no obvious variations of Hf isotope composition during the magma crystallization (Figure 6, Table S6).

4.4. Petrological Characteristics and Trace Elements Composition of Marginal Zone

Marginal zone of pegmatite had a fine-grained texture, massive structure. The main minerals were K-feldspar, quartz and the accessory minerals included zircon, rutile, titanite, hematite, fluorite, columbite and other minerals rich in REEs or uranium. Quartz commonly has typical oscillatory zonation. Arfvedsonite is rare and no biotite nor muscovite were found in pegmatite. The SiO2 concentration of marginal zone ranged from 68% to 69%, which is lower than that of typical granite. Marginal zone had a relatively higher alkali concentration with K2O + Na2O of 7.63%~ 7.70% and the content of K2O was much greater than that of Na2O. Chondrite-normalized REE patterns of marginal zone showed a slight fractionation of LREE and HREE with ∑HREE/∑LREE from 0.36 to 0.43 and an obviously negative Eu anomaly, which may mean the crystallization of plagioclase occurred before the formation of marginal zone (Supplementary Figure S1). Marginal zone was enriched with REE and Nb; however, the enrichment of Li, Ta and Cs was limited. Pegmatite, particularly, had a superchondritic Nb/Ta ratio of ~18.0 (Table S8).
Pegmatites can be classified into two compositional classes. One consists of the NYF-type characterized by an enrichment in Nb, Y (and HREE) and F, formed at a higher temperature, usually accompanied by a small amount of biotite and a large amount of monazite and zircon; the other, the LCT-type, is enriched with Li, Cs and Ta, derived from H2O-rich low-temperature granitic magma with a low LREE and Zr content [1,2,3,28]. Marginal zone of pegmatite belongs to NYF-type pegmatite.
Zircons crystallized from marginal zone of pegmatite were in sizes ranging from ~100 µm to ~600 µm, with Th/U ratios of 0.2~0.7, ∑REE content from ~20,000 ppm to ~40,000 ppm, Nb content from 918 ppm to 1325 ppm, Ta content from 79 ppm to 108 ppm, relatively lower content of LREEs, high content of HREEs and Y, a slightly positive Ce anomaly and a negative Eu anomaly (Figure 7; Table S11).

4.5. Trace Elements Composition of Rutile in Marginal Zone

Rutile and titanite, two typical Ti-rich accessory minerals, disseminated in marginal zone in the sizes of <50 µm and <20 µm, respectively. Titanite was too small to acquire in situ trace elements compositions by LA-ICP-MS. Chondrite-normalized REE patterns of rutile showed a slight fractionation of LREE and HREE with ∑HREE/∑LREE from 0.9 to 3.2 and obviously negative Eu anomalies from 0.04 to 0.09, which also means that the crystallization of plagioclase occurred before the formation of marginal zone and the crystallization of rutile may not have significantly affected the ∑HREE/∑LREE of the residual melt. The Nb and Ta concentrations of rutile ranged from 24,003 to 40,924 ppm and from 4413 to 7246 ppm, respectively. The Nb/Ta ratios of rutile ranged from 4.8 to 6.9, which are obviously lower than those in marginal zone (Table S9).

5. Discussion

5.1. Closed Mgmatic Evolution System

Zircon megacrysts were predominantly pure at all stages, lacking in impurities and pores. Hematite mineral inclusions occurred in the margin of Phase ΙΙΙ, but mineral inclusions rich in U, Th and Y were rare. The Th/U ratios increased from Phase Ι to Phase ΙΙΙ, the marginal Phase ΙΙΙ zircons surrounding the hematite inclusions usually had REE characteristics similar to that of pure Phase ΙΙΙ zircons and there was no obvious loss of radiogenic lead, which is different from the zircon formed by a dissolution-reprecipitation process [29,30].
Normally, zircon has δ18O values of < +5‰, which requires that the parental magma is either directly assimilated, or mixed with partial melts of low-δ18O rocks that had previously undergone relatively high-temperature hydrothermal alteration by surface waters or seawater [31,32,33], corresponding to contamination with lower continental crust or oceanic crust. Only one of the δ18O values was higher than normal mantle δ18O values, probably resulting from mixing with heterogeneously altered crust.
The εHf(t) values, ranging from ~8 to ~11, were lower than the depleted mantle (DM) εHf(t) of 14.75, that was calculated using the DM present-day Lu-Hf isotopic ratio; however, we realized that the isotopic composition of new continental crust was different from that of the DM. The Hf isotope compositions and crystallization ages of thousands of zircons worldwide show that very few zircons plotted close to the DM [34]. Dhuime et al. [34] argued that model ages should be calculated using the composition of new continental crust. By using the εHf(t) values of 13.2 ± 1.1 as the best estimate for the present-day composition of average new crust, we calculated the εHf(t) of new continental crust, which yielded values from 10.4 to 12.3.
Plenty of evidence indicate that the lower crust and lithospheric mantle of the region formed during the Neoproterozoic [8,35]. The great majority of detrital zircons in the late Neoproterozoic Elat conglomerate displayed positive εHf(t) values. Moreover, the εHf(t) values in the zircons were from 3.6 to 11.6, representing island-arc magmatism at ~880–760 Ma, and from 4.9 to 9.2, representing the younger, post-collisional magmas from ~660 to 580 Ma. To some extent, the εHf(t) values can be representative of the Arabian lower crust. We can calculate the εHf(t) values of ~5 for the typical lower crust by using the average εHf(t) value of the island-arc group and the average crustal 176Lu/177Hf ratio of 0.0113 [9]. The εHf(t) values can be estimated from 6.5 to 11.9 for the Arabian lower crust using εNd(t) data from Arabian lower crust granulite xenoliths [35] and a terrestrial Hf–Nd array of εHf(t) = 1.36εNd(t)+2.95 [36,37], which is similar to the εHf(t) value of arc-derived metasediments as described by Morag et al. [38]. In conclusion, we propose that the εHf(t) value for the Arabian lower crust varies from 5.0 to 12.0.
We consider that the contamination of continental crust with the lower εHf(t) and δ18O value is a reasonable explanation for the lower εHf(t) and δ18O value of zircon megacrysts.
The similar Hf-O isotopic composition of zircons of different phases indicates that the original magma may not have been subjected to the mixing of external magma, rock and fluid and the magmatic evolution system is closed without contamination.

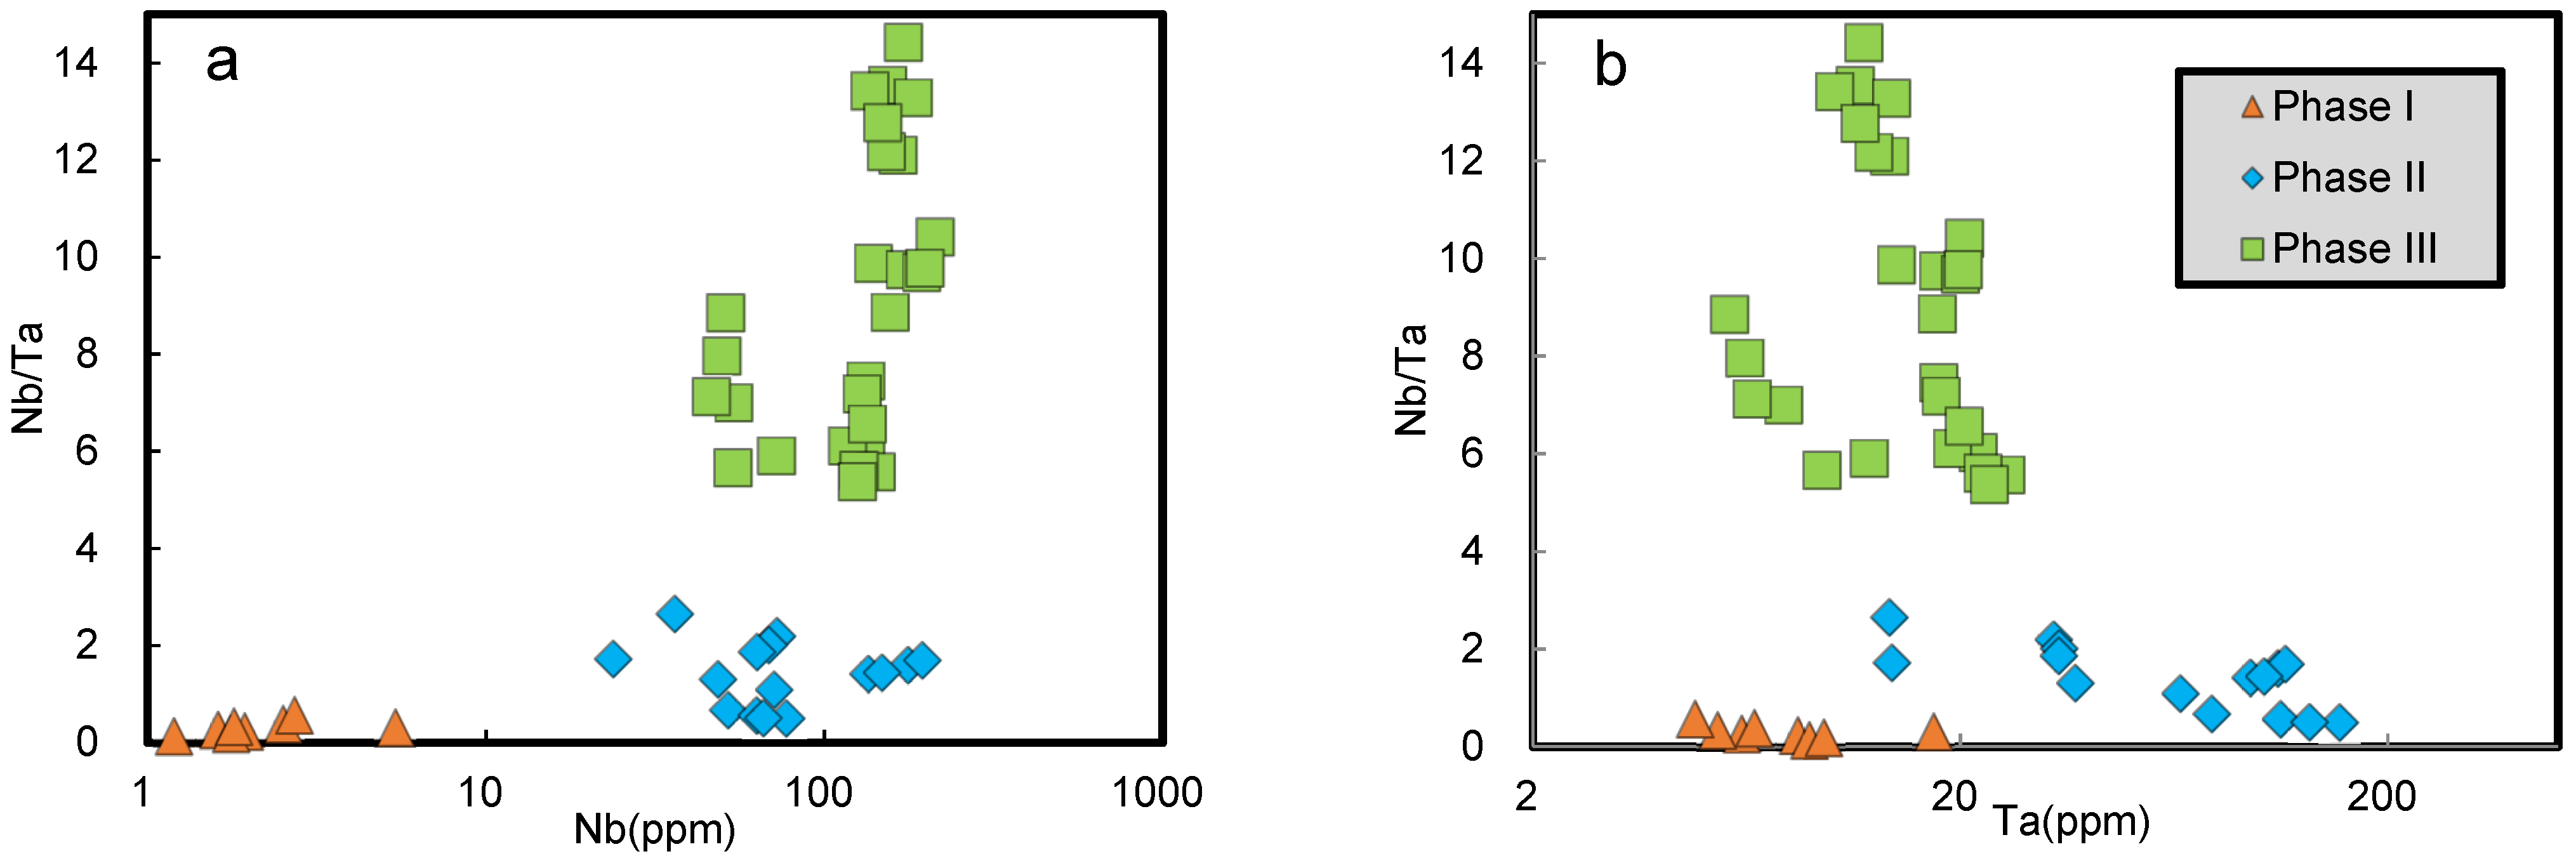
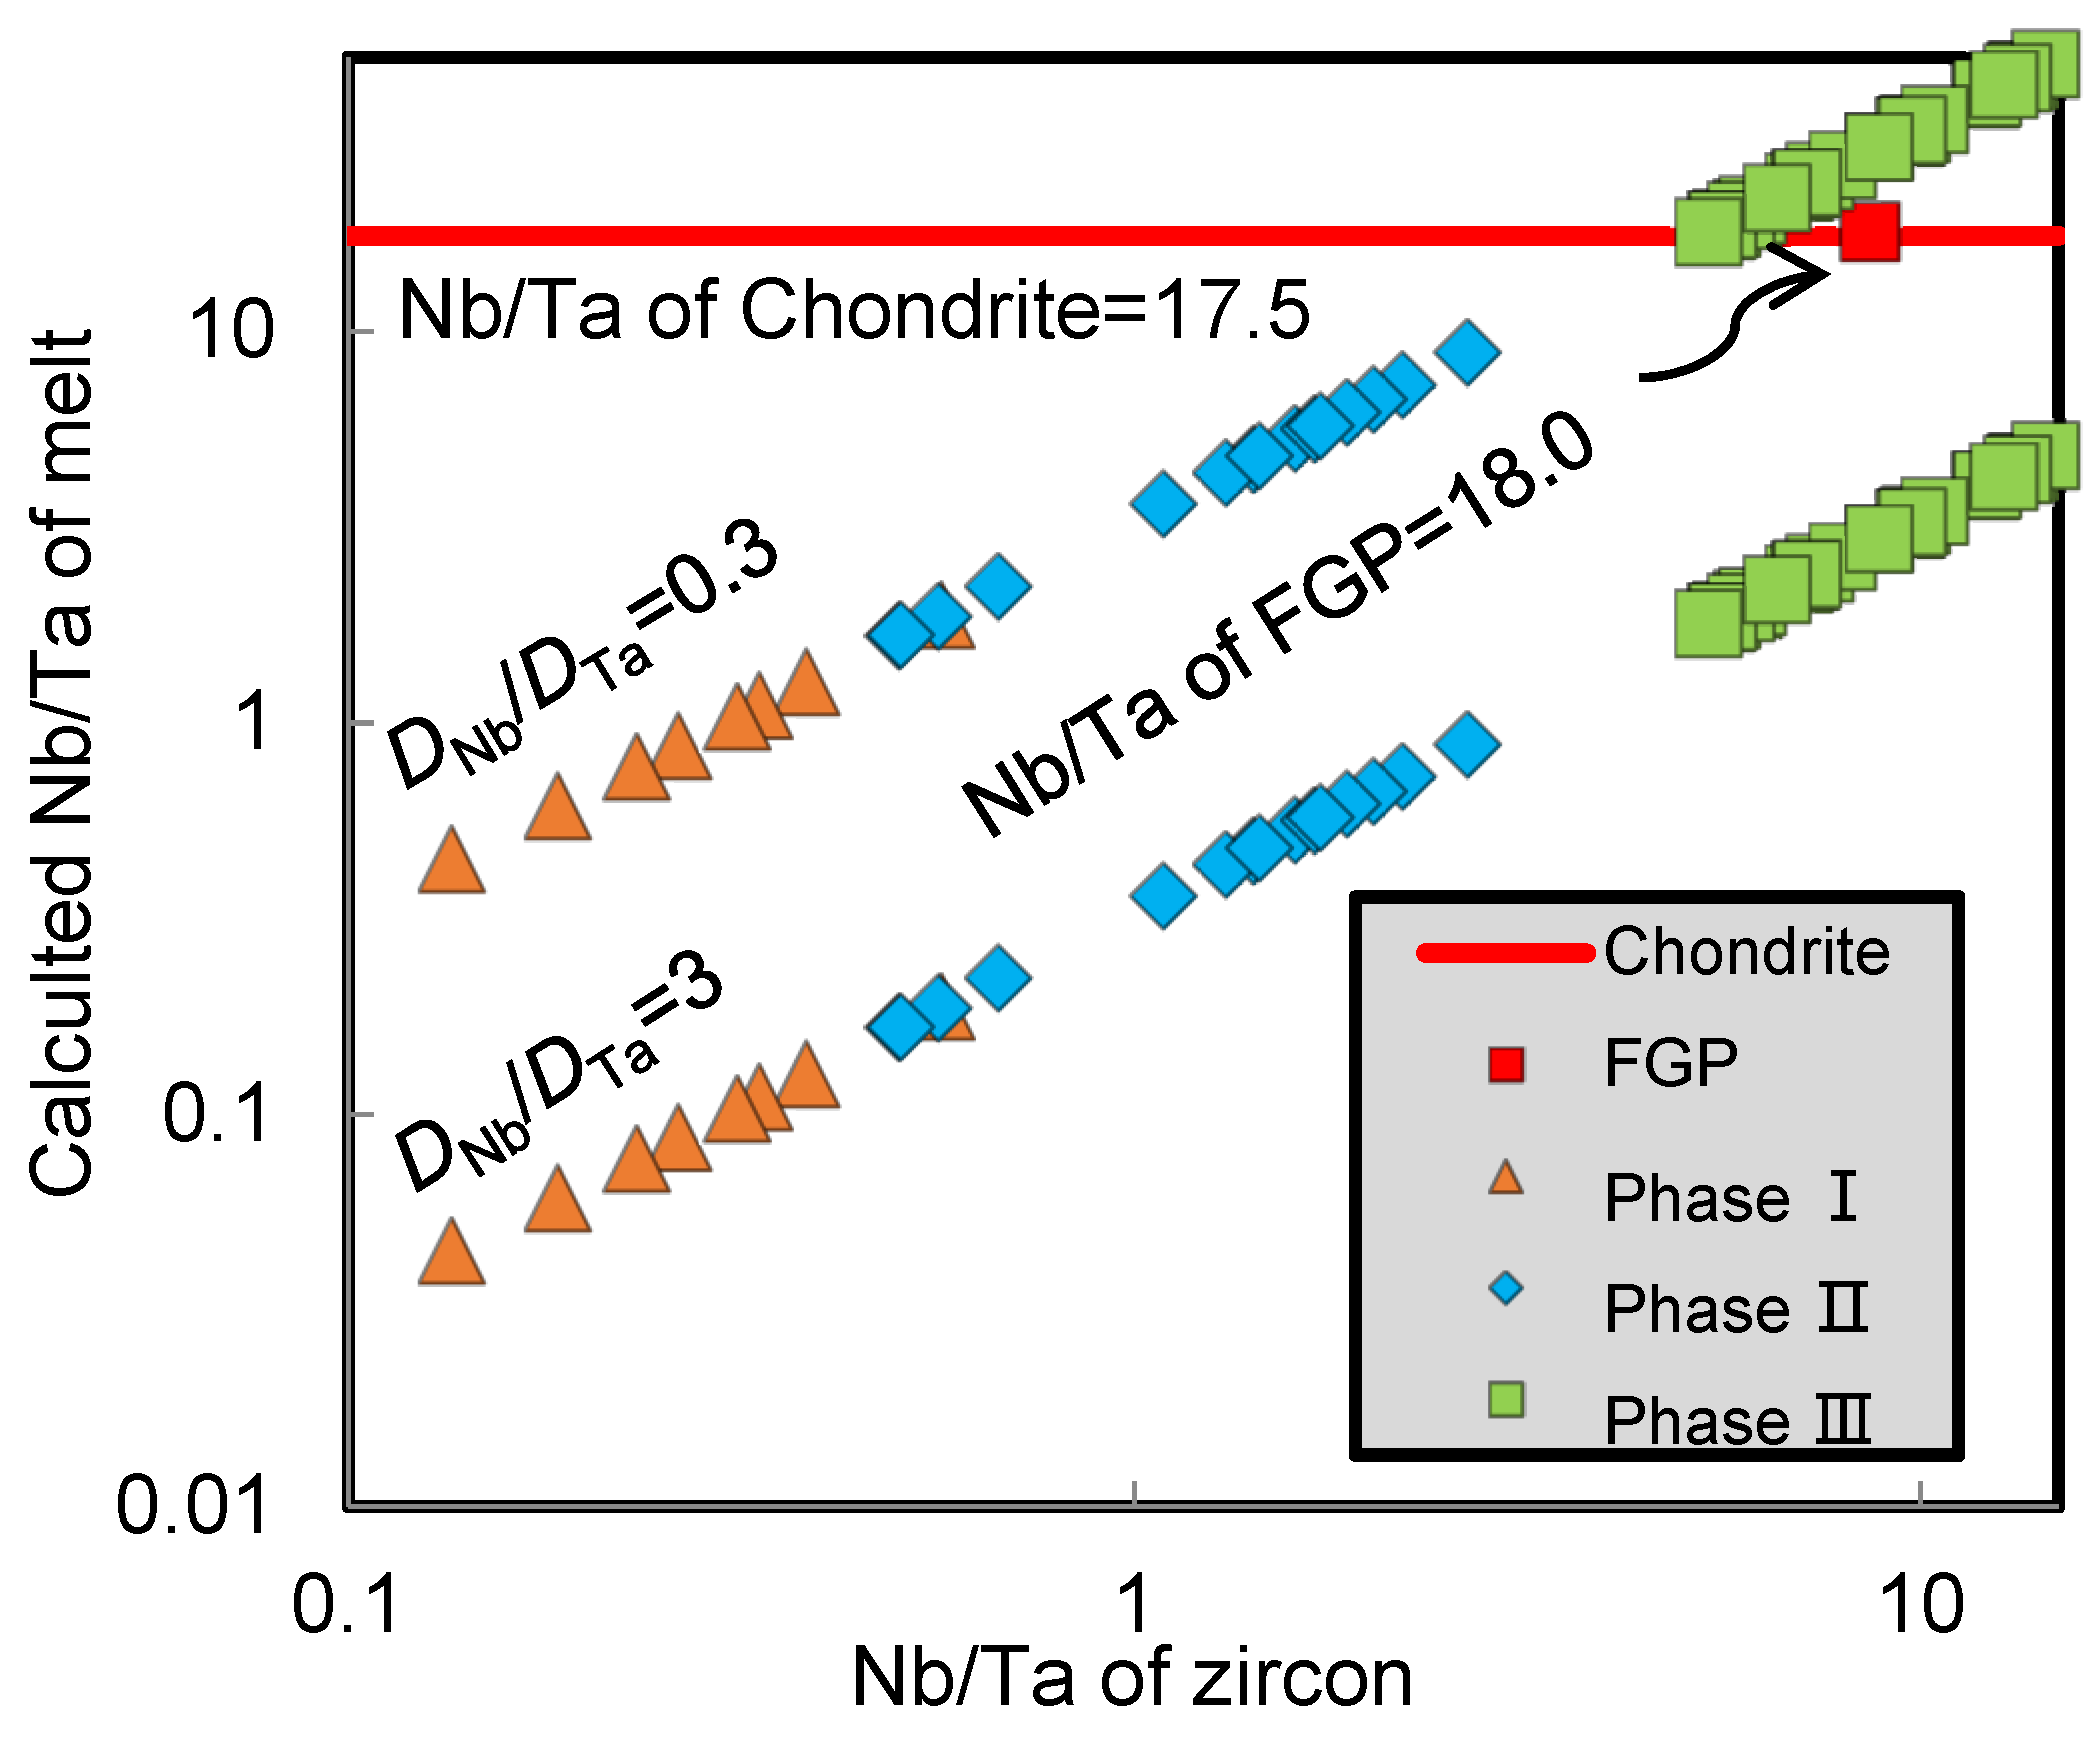
5.2. Nb–Ta Behaviour from Magma to Pegmatite Melt

The research study shows significant differences in the partition coefficients of Nb and Ta (expressed as DNb and DTa) and the DNb/DTa value (expressed as DNb = Nbin mineral/Nbin melt, DTa = Tain mineral/Tain melt) in different types of rocks or melts (Table S13). The two relatively extreme values of DNb/DTa = 0.3 and DNb/DTa = 3 were used to calculate the Nb/Ta ratios of melts [39,40,41,42]. Even if DNb/DTa = 0.3 in Phase I and DNb/DTa = 3 in Phase ΙΙΙ, the Nb/Ta ratio in the melt still rose (Table S14). Therefore, it is reliable to infer that the Nb/Ta ratio in the melt increased (Figure 8), which is contrary to the conclusion drawn by Stepanov et al. [3] on LCT-type pegmatite. The mean Nb/Ta ratio of marginal zone of pegmatite was ~18.0, which is higher than the chondritic value of 17.5 [27], and the DNb/DTa value was ~0.5, which also verifies this conclusion.
To understand the evolution in the Nb and Ta contents and the Nb/Ta ratio of zircon megacrysts more rationally and easily by using the partition coefficient theory, the DNb and DTa calculated by marginal zone and zircons crystallized from marginal zone were used as parameters to study the Nb and Ta contents and the Nb/Ta ratio of the melt, corresponding to Phase Ι, ΙΙ and ΙΙΙ zircons. The specific partition coefficients were as follows: DNb = the mean Nb content of the zircons/the mean Nb content of the marginal zone = 1078.2 ppm/13016 ppm = ~0.08; DTa = the mean Ta content of zircons/the mean Ta content of the marginal zone = 94.0 ppm/723.5 ppm = ~0.13; the DNb/DTa value was ~0.6.
The variations in the Nb and Ta contents and the Nb/Ta ratio in the melt are shown in Figure 9 (Table S15). The results show that Nb content in the melt continuously increased from 10–100 ppm in Phase I to 500–2000 ppm in Phase ΙΙΙ, whereas the Ta content increased and then decreased, varying from 10–100 ppm in Phase I to 100–1000 ppm in Phase ΙΙ and then to 50–200 ppm in Phase ΙΙΙ; the Nb/Ta ratio continuously increased from < 1 in Phase I to > 10 in Phase ΙΙΙ.

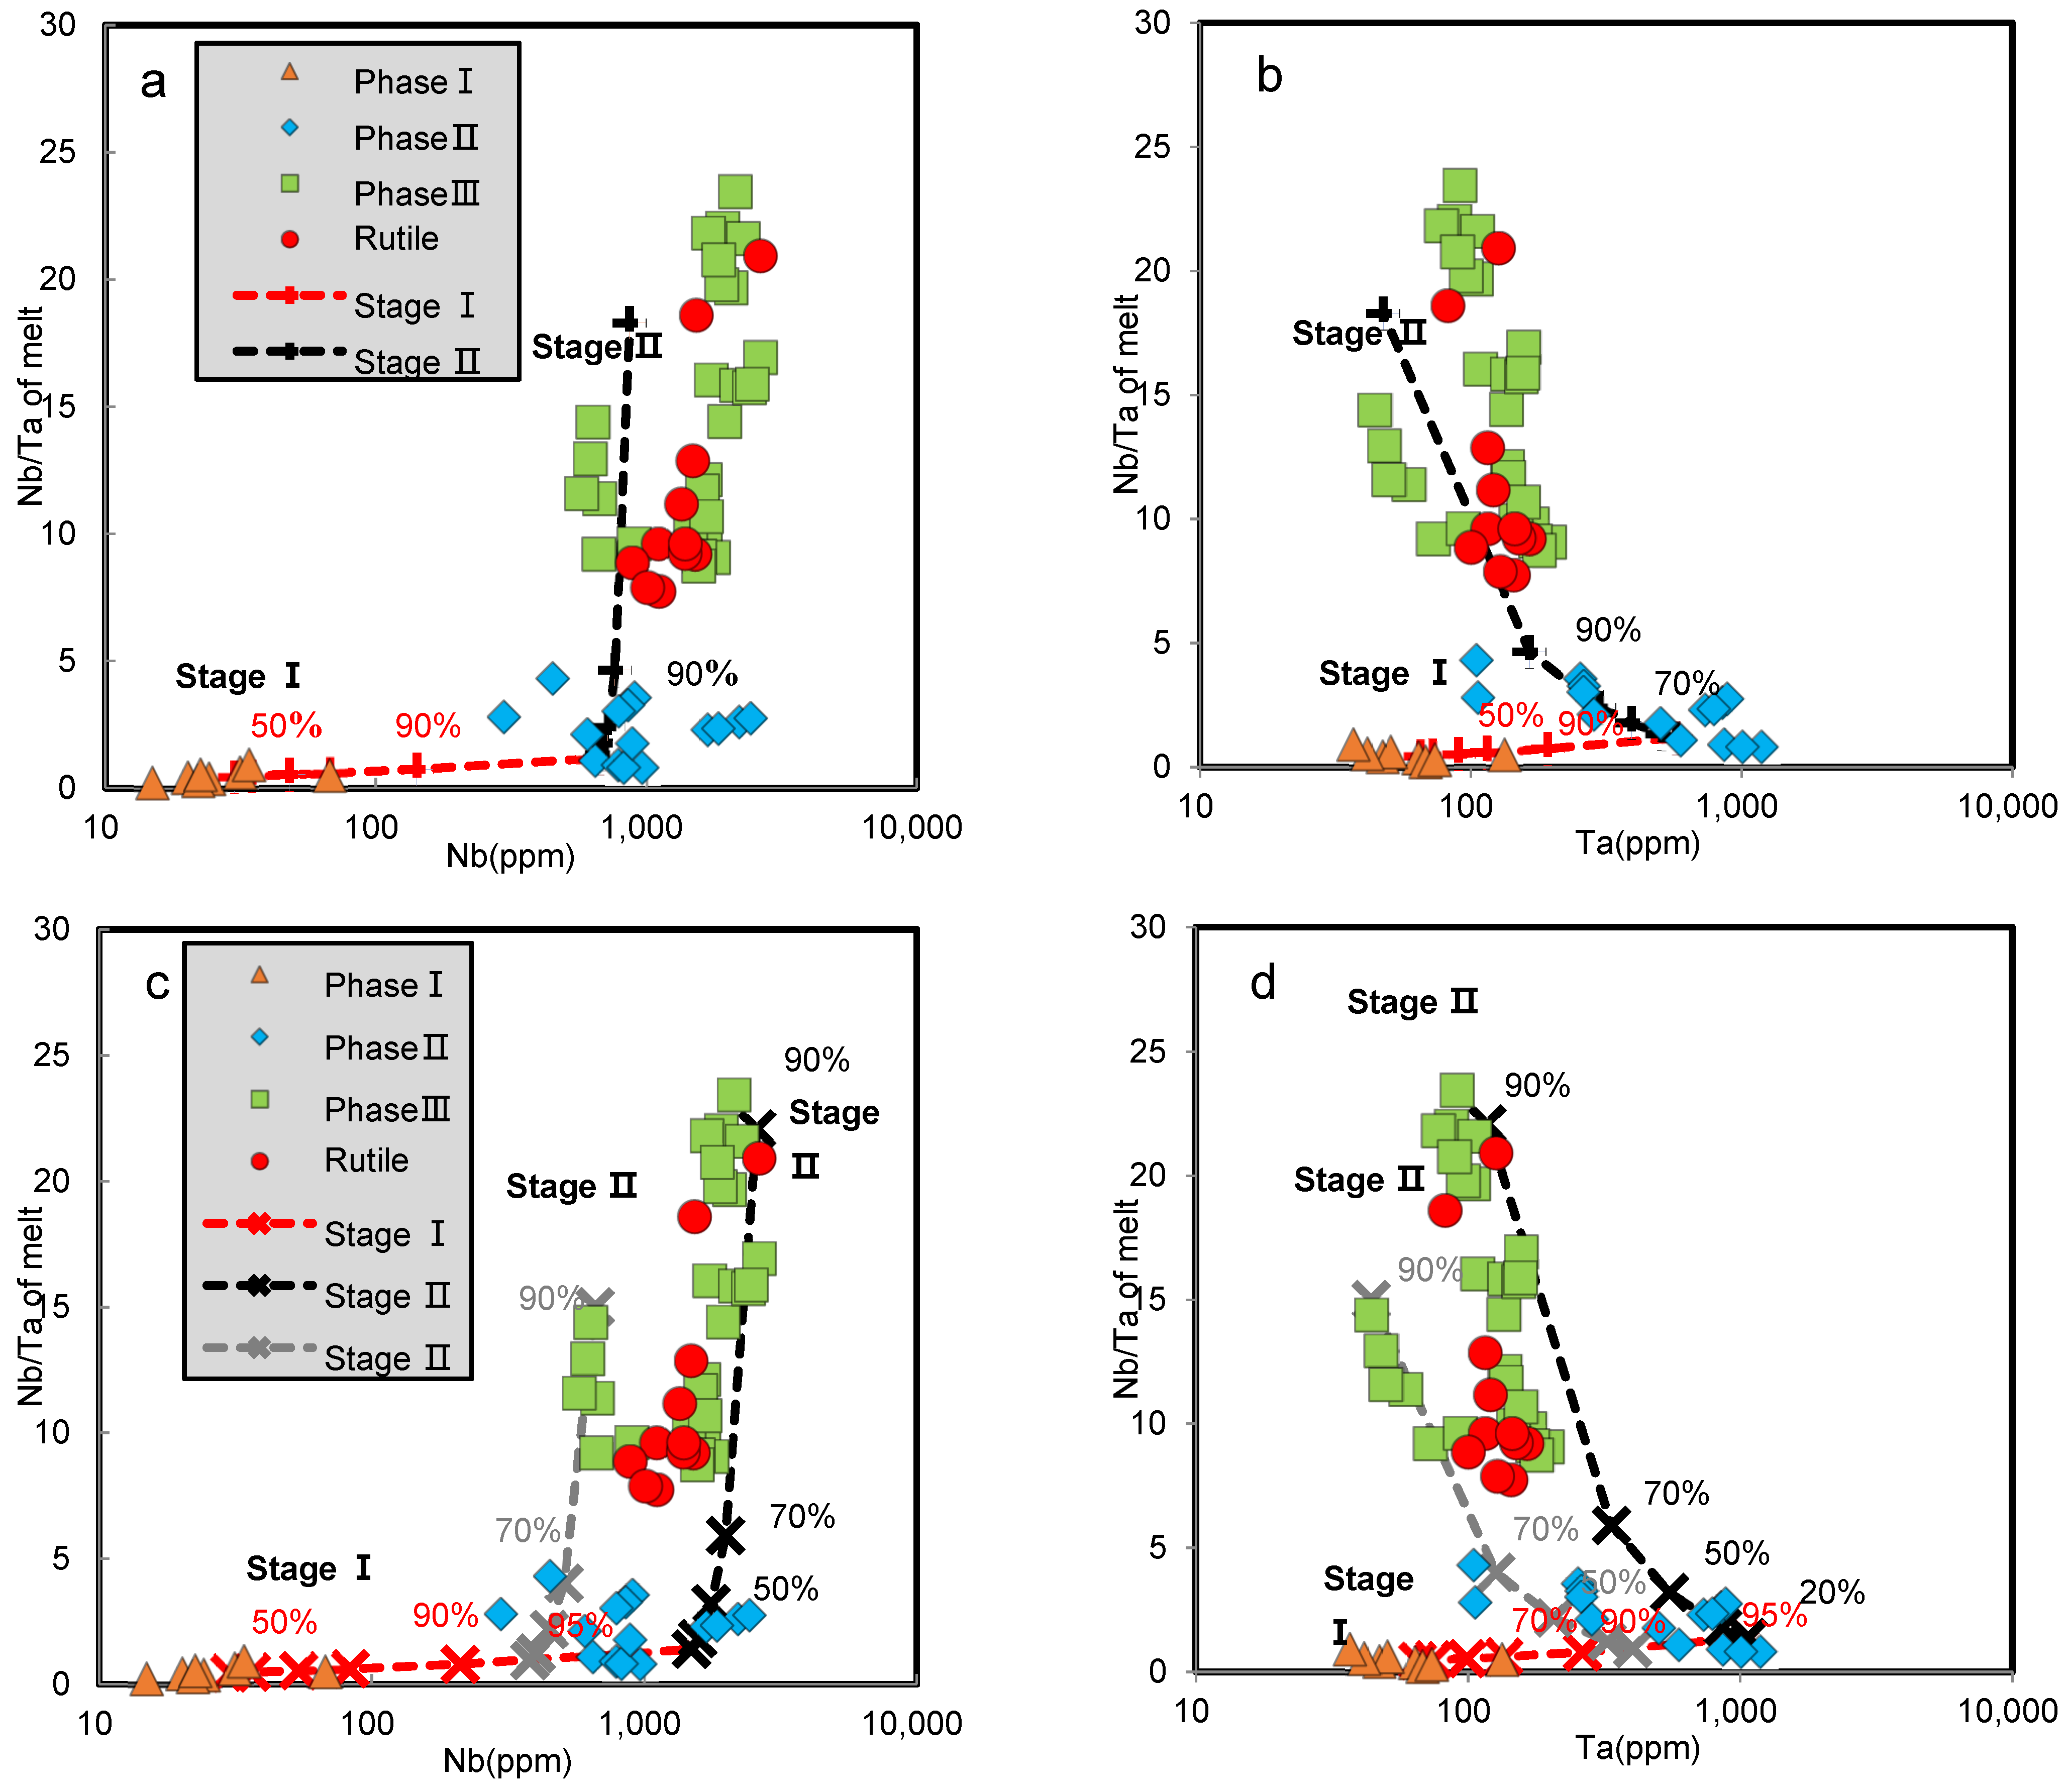
5.3. Nb-Ta Fractionation Caused by Crystallization Differentiation

Low-degree partial melting tended to form melts that were rich in incompatible elements and the zircon crystallized from such melts had high REE, Nb, Ta, Th, U and other incompatibility element contents, which conflicts with the characteristics of Phases I, II and III zircon. Therefore, the partial melting cannot explain the evolution of zircon megacryst. The study of Burnham and Berry [43] showed that there is no obvious correlation among DNb, DTa and magma oxygen fugacity; therefore, oxygen fugacity is not the main parameter for Nb and Ta fractionation.
High-temperature melts usually have high Ti and low H2O contents, which indicates that melts tended to crystallize Ti-rich minerals, such as rutile and titanite, rather than H2O-bearing minerals, such as biotite, muscovite and amphibole [3], corresponding to the minerals’ occurrence in FGP (Figure S4).
Rutile has a higher compatibility with Ta than Nb (DNb = 27 and DTa = 44, DNb/DTa <1) [44]; therefore, fractional crystallization of rutile can cause the Nb/Ta ratio of the residual melt to increase. As shown in Figure 9a,b, the Nb and Ta contents in the initial melt were low and the Nb/Ta ratio was lower than 1. After fractional crystallization (approximately 99 wt.%), in which rutile accounted for 1.2%, the Nb and Ta contents and the Nb/Ta ratio in the residual melt of Stage I increased. Subsequently, the residual melt underwent 99 wt.% fractional crystallization, in which rutile accounted for 3.5 wt.% and the Nb and Ta contents and the Nb/Ta ratio in the melt of Stage II increased further to ~870 ppm, ~50 ppm and ~18, respectively. The Nb and Ta compositions of the melt calculated by rutile composition are consistent with the melt evolution curve and show that rutile crystallization differentiation may have caused Nb and Ta fractionation (Figure 9).
Titanite also has higher compatibility with Ta than Nb (DNb = 4.6 and DTa = 46.4) [45]; the DNb/DTa value was about 0.1, which is much lower than that of rutile. Compared to rutile, the fractional crystallization of titanite had a stronger effect on the differentiation of Nb and Ta in the melt. As shown in Figure 9c,d, the Nb and Ta contents and the Nb/Ta ratio of the Stage I melt could be simulated well by 95 wt.%–99 wt.% fractional crystallization, in which titanite accounted for 2%. The residual melt of Stage I was extracted as the initial melt of Stage II and the Nb and Ta composition of the Stage II melt agreed well with the theoretical simulation results of 90% fractional crystallization, in which titanite accounted for 10% (Figure 9). The DDy/DTb and DGd/DSm values of titanite were both close to 1, while the DYb/DNd value was significantly less than 1 [45]; therefore, the fractional crystallization of titanite simultaneously caused slight changes in the DyN/YbN and GdN/SmN values of the residual melt and led to an obvious increase in the YbN/NdN value, which is consistent with the content of rare earth elements, including Sm, Gd, Dy and Yb, in zircon megacryst (Figure S6). There was little titanite crystallized in Stage I and the behavior of REE was more susceptible to other crystalline minerals. This is also a possible reason for the higher YbN/NdN of Phase I zircon. The fractional crystallization of titanite is another possible controlling factor in the differentiation of Nb and Ta.
It should be noted that the fractional crystallization of biotite, muscovite and amphibole (DNb/DTa > 1) directly affects the evolution trend of the Nb and Ta contents and the Nb/Ta ratio [3]. However, NYF-type pegmatite melts are poor in water and difficult to crystallize a large amount of H2O-bearing minerals, which resulted in the absence of biotite and muscovite in marginal zone and their influence on the Nb/Ta ratio was not significant. The DNb and DTa values of feldspar and quartz were too small to have an influence on the Nb/Ta ratio; however, extensive crystallization of feldspar and quartz caused an increase in Nb and Ta content [2,3,46]. The crystallization of columbite was too low to affect the Nb/Ta ratio of the residual melt. If columbite had crystalized significantly from the melt, the Nb content of the residual melt would have decreased, which does not correspond to the results. In addition, columbite has higher compatibility with Nb than Ta; therefore, fractional crystallization of columbite could cause the Nb/Ta ratio of the residual melt to decrease. In fact, the Nb/Ta ratio of the residual melt increased; therefore, the fractional crystallization of columbite cannot explain the result.
In addition, the escape of residual melts from a magma system with a high degree of fractional crystallization of 90% or more is a problem, which is also important when studying whether high-silica magma could be derived from basaltic magma through fractional crystallization. However, most geologists still believe that rhyolitic magma can be evolved from a basaltic magma chamber through large-scale crystallization differentiation but that the evolution mechanism needs to be reevaluated [47,48,49]. We assume that the residual melt that had undergone a high degree of fractional crystallization could be a separate magma system to continue fractional crystallization, which corresponds to Stages I and II of the crystallization of rutile or titanite. Moreover, high-density zircon megacrysts during magma fractional crystallization could have undergone multiple stages of magmatic activity, which indicates that the residual melt and zircon had the crystallization space. Besides that, magma fractional crystallization reached 90% in Stage II, which can overall explain the variation in the contents of Nb and Ta (Figure 9c,d).

5.4. Nb-Ta Marker of Transformation from Magma to Pegmatite Melt

The Phases I, II and III of zircon megacrysts recorded the transformation from magma to pegmatite melt, indicating that pegmatite melt could carry and retain the early crystallization material. It also proves that pegmatite melt has a close genetic relationship with deep magma. The obvious difference in the Nb/Ta ratio between magma and pegmatite melt makes it a key indicator to distinguish the transformation. In addition, Phases I, II and Phase III had significant variation of REEs composition, which indicates that judging the source and evolution of pegmatite by the REEs characteristics of zircon or by the pegmatite itself may be one-sided. It may explain why NYF-type pegmatite is often enriched in HREE, while the source of pegmatite and alkaline magma is often enriched with LREE [2]. It is worth noting that zircon Hf–O isotopic compositions remained relatively constant during fractional crystallization, which indicates that zircon Hf–O isotopic compositions may be a reasonable choice for identifying the source and evolution process of pegmatite.

6. Conclusions

Zircon megacrysts occurring in NYF-type pegmatite recorded the evolution process from the initial magma to pegmatite melts. The REEs composition of zircon indicates that judging the source of pegmatite by the REE characteristics of zircon or by the pegmatite itself may be incorrect. The modeling of fractional crystallization proposed by this study shows that the Nb content and the Nb/Ta ratio of melts increased during several stages of melt extraction and fractional crystallization of Ti-rich minerals in a closed magma system without contamination by extraneous melt, rock, or fluid. The Nb/Ta ratios were an effective indicator for recording the magma-to-pegmatite conversion process. It is conceivable that several stages of melt extraction and fractional crystallization are required for the formation of NYF-type pegmatite melt with economic concentrations of Nb.

Supplementary Materials

The following are available online at https://0-www-mdpi-com.brum.beds.ac.uk/article/10.3390/min11101139/s1, Figure S1: Typical outcrop photo of pegmatite, Figure S2: AMICS-SEM image of marginal zone of pegmatite, Figure S3: Chondrite-normalized REE patterns of marginal zone of pegmatite, Figure S4: Arfvedsonite, hematite, titanite and rutile occur in marginal zone of pegmatite, Figure S5: Th/U ratios vs. U and Th content of Phases I, II and III zircon, Figure S6: REE evolution characteristics of Phases I, II and III in zircon megacryst, Figure S7: Magnitude of Ce anomaly vs 104/T (K−1) for Phases I, II and III, Figure S8: REE evolution characteristics of rutile, Figure S9: 207Pb/206Pb-204Pb/206Pb isochron for zircon megacryst (from Phase I to Phase III zircon), Figure S10: The δ18O value vs. internal precision of 16O counts, Figure S11: The 176Yb/177Hf value vs. εHf(t), Table S1: The major elements content of marginal zone of pegmatite (%), Table S2: Trace elements content of different phases of zircon megacryst (ppm), Table S3: Dating results of zircon megacryst, Table S4: δ18OVSMOW of zircon megacryst, Table S5: Standard and reference material data of oxygen isotopic testing, Table S6: Hf isotopic composition of zircon megacryst, Table S7: Hf isotopic composition of standards, Table S8: Trace elements composition of marginal zone of pegmatite (ppm), Table S9: Major and trace elements composition of rutile in marginal zone of pegmatite (ppm), Table S10: Major and trace elements composition of standards (ppm), Table S11: Trace elements composition of zircon in marginal zone of pegmatite (ppm), Table S12: Trace elements composition of standards (ppm), Table S13: Nb and Ta partition coefficient compiled from previous studies, Table S14: Nb/Ta ratio of melt calculated by zircon Nb/Ta ratio, Table S15: Nb and Ta content and Nb/Ta ratio of melt calculated by DNb = 0.08, DTa = 0.13.

Author Contributions

Conceptualization, S.H. and Z.L.; methodology, S.H.; formal analysis, S.H.; investigation, S.H. and Z.L.; data curation, S.H. and Y.Z.; writing—original draft preparation, S.H.; writing—review and editing, Z.L., S.H., S.H., Z.L., A.A.J., D.G., Z.H. and Y.Z.; supervision, D.G. and Y.Z.; project administration, Z.L.; funding acquisition, Z.L. and S.H. All authors have read and agreed to the published version of the manuscript.

Funding

This research was funded by the following: National Key R&D Program of China, grant number 2017YFC0602600; CNNC Science Fund for Talented Young Scholars, grant number QNYC2019-2; National Natural Science Foundation of China Key Project, grant number 41630103; China Nuclear Industry Corporation’s Longcan project, grant number LCEQ01.

Acknowledgments

We are very grateful to the staff of the Saudi Geological Survey for their support and help, thank Wang Hongzuo for providing samples, Leonid Shumlyanskyy for article revision, Liu Ruiping, Yangqing, Wuyong for LA-ICP-MS and SIMS testing assistance. Constructive comments from reviewers and editors significantly improved the clarity and presentation of this paper.

Conflicts of Interest

The authors declare no conflict of interest.

References

  1. London, D.; Morgan, G.B. The pegmatite puzzle. Elements 2012, 8, 263–268. [Google Scholar] [CrossRef]
  2. Černý, P.; London, D.; Novak, M. Granitic pegmatites as reflections of their sources. Elements 2012, 8, 289–294. [Google Scholar] [CrossRef]
  3. Stepanov, A.; Mavrogenes, J.A.; Meffre, S.; Davidson, P. The key role of mica during igneous concentration of tantalum. Contrib. Mineral. Petrol. 2014, 167, 1009. [Google Scholar] [CrossRef]
  4. London, D. Granitic pegmatites: An assessment of current concepts and directions for the future. Lithos 2005, 80, 281–303. [Google Scholar] [CrossRef]
  5. Zhu, Y.S.; Yang, J.H.; Sun, J.F.; Wang, H. Zircon Hf O isotope evidence for recycled oceanic and continental crust in the sources of alkaline rocks. Geology 2017, 45, 407–410. [Google Scholar] [CrossRef]
  6. Belousova, E.; Griffin, W.; O’Reilly, S.Y.; Fisher, N. Igneous zircon: Trace element composition as an indicator of source rock type. Contrib. Mineral. Petrol. 2002, 143, 602–622. [Google Scholar] [CrossRef]
  7. Stern, R.J.; Johnson, P. Continental lithosphere of the Arabian Plate: A geologic, petrologic, and geophysical synthesis. Earth Sci. Rev. 2010, 101, 29–67. [Google Scholar] [CrossRef]
  8. Krienitz, M.-S.; Haase, K. The evolution of the Arabian lower crust and lithospheric mantle—Geochemical constraints from southern Syrian mafic and ultramafic xenoliths. Chem. Geol. 2011, 280, 271–283. [Google Scholar] [CrossRef]
  9. Morag, N.; Avigad, D.; Gerdes, A.; Harlavan, Y. 1000–580Ma crustal evolution in the northern Arabian-Nubian Shield revealed by U–Pb–Hf of detrital zircons from late Neoproterozoic sediments (Elat area, Israel). Precambrian Res. 2012, 208-211, 197–212. [Google Scholar] [CrossRef]
  10. Stern, R.J.; Hedge, C.E. Geochronologic and isotopic constraints on late Precambrian crustal evolution in the Eastern Desert of Egypt. Am. J. Sci. 1985, 285, 97–127. [Google Scholar] [CrossRef]
  11. Jackson, N.J. Petrogenesis and evolution of Arabian felsic plutonic rocks. J. Afr. Earth Sci. 1986, 4, 47–59. [Google Scholar] [CrossRef]
  12. Beyth, M.; Stern, R.J.; Altherr, R.; Kröner, A. The Late Precambrian Timna igneous complex, Southern Israel: Evidence for comagmatic-type sanukitoid monzodiorite and alkali granite magma. Lithos 1994, 31, 103–124. [Google Scholar] [CrossRef]
  13. Be’eri-Shlevin, Y.; Katzir, Y.; Whitehouse, M. Post-collisional tectonomagmatic evolution in the northern Arabian-Nubian Shield: Time constraints from ion-probe UPb dating of zircon. J. Geol. Soc. 2009, 166, 71–85. [Google Scholar] [CrossRef]
  14. Stacey, J.S.; Hedge, C.E. Geochronologic and isotopic evidence for early Proterozoic crust in the eastern Arabian Shield. Geology 1984, 12, 310–313. [Google Scholar] [CrossRef]
  15. Windley, B.F.; Whitehouse, M.J.; Ba-Bttat, M.A.O. Early Precambrian gneiss terranes and Pan-African island arcs in Yemen: Crustal accretion of the eastern Arabian shield. Geology 1996, 24, 131–134. [Google Scholar] [CrossRef]
  16. Johnson, P.R.; Fayek, H.K. The Geology of the Saudi Arabian Shield; King Fahd National Library Cataloging; Saudi Geological Survy Press: Jeddah, Saudi Arabia, 2012. [Google Scholar]
  17. Johnson, P.R.; Kattan, F.H. Lithostratigraphic revision in the Arabian shield: The impacts of geochronology and tectonic analysis. Arab. J. For. Eng. 2008, 33, 3–16. [Google Scholar]
  18. Sláma, J.; Košler, J.; Condon, D.; Crowley, J.; Gerdes, A.; Hanchar, J.; Horstwood, M.; Morris, G.; Nasdala, L.; Norberg, N.; et al. Plešovice zircon—A new natural reference material for U-Pb and Hf isotopic microanalysis. Chem. Geol. 2008, 249, 1–35. [Google Scholar] [CrossRef]
  19. Li, X.H.; Liu, Y.; Li, Q.L.; Guo, C.H.; Chamberlain, K.R. Precise determination of Phanerozoic zircon Pb/Pb age by multicollector SIMS without external standardization. Geochem. Geophys. Geosyst. 2009, 10, 1–21. [Google Scholar] [CrossRef]
  20. Li, X.H.; Long, W.G.; Li, Q.L.; Liu, Y.; Zheng, Y.F.; Yang, Y.H.; Chamberlain, K.; Wan, D.F.; Guo, C.H.; Wang, X.C.; et al. Penglai zircon megacrysts: A potential new working reference material for microbeam determination of Hf–O isotopes and U–Pb age. Geostand. Geoanal. Res. 2010, 34, 117–134. [Google Scholar] [CrossRef]
  21. Li, X.H.; Tang, G.Q.; Gong, B.; Yang, Y.H.; Hou, K.J.; Hu, Z.C.; Li, Q.L.; Liu, Y.; Li, W.X. Qinghu zircon: A working reference for microbeam analysis of U-Pb age and Hf and O isotopes. Chin. Sci. Bull. 2013, 58, 4647–4654. [Google Scholar] [CrossRef]
  22. Wu, F.Y.; Yang, Y.H.; Xie, L.W.; Yang, J.H.; Xu, P. Hf isotopic compositions of the standard zircons and baddeleyites used in U–Pb geochronology. Chem. Geol. 2006, 234, 105–126. [Google Scholar] [CrossRef]
  23. Blichert-Toft, J. The Hf isotopic composition of zircon reference material 91500. Chem. Geol. 2008, 253, 252–257. [Google Scholar] [CrossRef]
  24. Gain, S.E.M.; Greau, Y.; Henry, H.; Belousova, E.; Dainis, I.; Griffin, W.L.; O’Reilly, S.Y. Mud tank zircon: Long-term evaluation of a reference material for U-Pb dating, Hf-isotope analysis and trace element analysis. Geostand. Geoanal. Res. 2019, 43, 339–354. [Google Scholar] [CrossRef]
  25. Anczkiewicz, R.; Oberli, F.; Burg, J.P.; Villa, I.M.; Günther, D.; Meier, M. Timing of normal faulting along the Indus Suture in Pakistan Himalaya and a case of major 231Pa/235U initial disequilibrium in zircon. Earth Planet Sci. Lett. 2001, 191, 101–114. [Google Scholar] [CrossRef]
  26. Pearce, N.; Perkins, W.; Westgate, J.; Gorton, M.; Jackson, S.; Neal, C.; Chenery, S. A compilation of new and published major and trace element data for NIST SRM 610 and NIST SRM 612 glass reference materials. Geostand. Geoanal. Res. 1997, 21, 115–144. [Google Scholar] [CrossRef]
  27. McDonough, W.; Sun, S.S. The composition of the Earth. Chem. Geol. 1995, 120, 223–253. [Google Scholar] [CrossRef]
  28. Černý, P.; Ercit, T.S. The classification of granitic pegmatites revisited. Can. Mineral. 2005, 43, 2005–2026. [Google Scholar] [CrossRef] [Green Version]
  29. Geisler-Wierwille, T.; Schaltegger, U.; Tomaschek, F. Re-equilibration of zircon in aqueous fluids and melts. Elements 2007, 3, 43–50. [Google Scholar] [CrossRef]
  30. Kusiak, M.A.; Dunkley, D.J.; Slaby, E.; Martin, H.; Budzyn, B. Sensitive high-resolution ion microprobe analysis of zircon reequilibrated by late magmatic fluids in a hybridized pluton. Geology 2009, 37, 1063–1066. [Google Scholar] [CrossRef]
  31. Bindeman, I.; Gurenko, A.; Carley, T.; Miller, C.; Martin, E.; Sigmarsson, O. Silicic magma petrogenesis in Iceland by remelting of hydrothermally altered crust based on oxygen isotope diversity and disequilibria between zircon and magma with implications for MORB. Terra Nova 2012, 24, 227–232. [Google Scholar] [CrossRef]
  32. Bindeman, I.; Valley, J. Low-δ18O rhyolites from Yellowstone: Magmatic evolution based on analyses of zircons and individual phenocrysts. J. Petrol. 2001, 42, 1491–1517. [Google Scholar] [CrossRef] [Green Version]
  33. Muehlenbachs, K.; Andersonjr, A.; Sigvaldason, G. Low-O18 basalts from Iceland. Geochim. Cosmochim. Acta 1974, 38, 577–588. [Google Scholar] [CrossRef]
  34. Dhuime, B.; Hawkesworth, C.; Cawood, P. When continents formed. Science 2011, 331, 154–155. [Google Scholar] [CrossRef] [PubMed]
  35. McGuire, A.; Stern, B. Granulite xenoliths from western Saudi Arabia: The lower crust of the late Precambrian Arbian-Nubian Shield. Contrib. Mineral. Petrol. 1993, 114, 395–408. [Google Scholar] [CrossRef]
  36. Vervoort, J.; Patchett, P.J.; Albarède, F.; Blichert-Toft, J.; Rudnick, R.; Downes, H. Hf-Nd isotopic evolution of the lower crust. Earth Planet Sci. Lett. 2000, 181, 115–129. [Google Scholar] [CrossRef]
  37. Vervoort, J.; Patchett, P.J.; Blichert-Toft, J.; Albarède, F. Relationships between Lu-Hf and Sm-Nd isotopic systems in the global sedimentary system. Earth Planet Sci. Lett. 1999, 168, 79–99. [Google Scholar] [CrossRef]
  38. Morag, N.; Avigad, D.; Gerdes, A.; Belousova, E.; Harlavan, Y. Crustal evolution and recycling in the northern Arabian-Nubian Shield: New perspectives from zircon Lu–Hf and U–Pb systematics. Precambrian Res. 2011, 186, 101–116. [Google Scholar] [CrossRef]
  39. Burnham, A.D.; Berry, A.J. Formation of hadean granites by melting of igneous crust. Nat. Geosci. 2017, 10, 457–461. [Google Scholar] [CrossRef]
  40. Thomas, J.B.; Bodnar, R.J.; Shimizu, N.; Sinha, A.K. Determination of zircon/melt trace element partition coefficients from SIMS analysis of melt inclusions in zircon. Geochim. Cosmochim. Acta 2002, 66, 2887–2901. [Google Scholar] [CrossRef]
  41. Nardi, L.V.S.; Formoso, M.L.L.; Müller, I.F.; Fontana, E.; Jarvis, K.; Lamarāo, C. Zircon/rock partition coefficients of REEs, Y, Th, U, Nb, and Ta in granitic rocks: Uses for provenance and mineral exploration purposes. Chem. Geol. 2013, 335, 1–7. [Google Scholar] [CrossRef]
  42. Bachmann, O.; Dungan, M.A.; Bussy, F. Insights into shallow magmatic processes in large silicic magma bodies: The trace element record in the Fish Canyon magma body, Colorado. Contrib. Mineral. Petrol. 2005, 149, 338–349. [Google Scholar] [CrossRef] [Green Version]
  43. Burnham, A.D.; Berry, A.J. An experimental study of trace element partitioning between zircon and melt as a function of oxygen fugacity. Geochim. Cosmochim. Acta 2012, 95, 196–212. [Google Scholar] [CrossRef]
  44. Green, T.H. Significance of Nb/Ta as an indicator of geochemical processes in the crust-mantle system. Chem. Geol. 1995, 120, 347–359. [Google Scholar] [CrossRef]
  45. Prowatke, S.; Klemme, S. Effect of melt composition on the partitioning of trace elements between titanite and silicate melt. Geochim. Cosmochim. Acta 2005, 69, 695–709. [Google Scholar] [CrossRef]
  46. Ballouard, C.; Poujol, M.; Boulvais, P.; Branquet, Y.; Tartèse, R.; Vigneresse, J.-L. Nb-Ta fractionation in peraluminous granites: A marker of the magmatic-hydrothermal transition. Geology 2016, 44, 231–234. [Google Scholar] [CrossRef]
  47. Byerly, G. The nature of differentiation trends in some volcanic rocks from the Galapagos Spreading Center. J. Geophys. Res. 1980, 85, 3797. [Google Scholar] [CrossRef]
  48. Juster, T.C.; Grove, T.L.; Perfit, M.R. Experimental constraints on the generation of FeTi basalts, andesites, and rhyodacites at the Galapagos Spreading Center, 85° W and 95° W. J. Geophys. Res. Atmos. 1989, 94, 9251–9274. [Google Scholar] [CrossRef]
  49. Marsh, B.D. Dynamics of magmatic systems. Elements 2006, 2, 287–292. [Google Scholar] [CrossRef]
Figure 1. Simplified geological map: (a) the simplified geology of the study area showing the tectonic setting of subalkaline-alkaline-peralkaline granite, modified after Johnson and Fayek [16]; (b) simplified lithological map of the sampling area where pegmatite is exposed. The location of a sampling site of the zircon megacrysts from pegmatite (41°2.44′, 25°33.49′) discussed in this study is shown as a blue star.
Minerals 11 01139 g001
Figure 2. CL images of zircon megacrysts from pegmatite, showing different phases (from Ι to ΙΙΙ) of zircon. (ae) Phase Ι represents zoned igneous zircon. Phase ΙΙ zircons have an oscillatory zonation similar to Phase Ι, but a different trace elements content. Phase ΙΙΙ represent unzoned zircon with a high Th and REE content and contain abundant hematite inclusions.
Minerals 11 01139 g002
Figure 3. REE patterns of different phases zircons from pegmatite. Chondrite-normalized values are from McDonough and Sun [27]. The plots show the REE profiles of zircon (from Phase Ι to Phase ΙΙΙ) with greater than approximately 200 ppm Fe analyses removed to avoid contamination by inclusions.
Minerals 11 01139 g003
Figure 4. Nb/Ta ratio vs. Nb and Ta content of Phase Ι, ΙΙ and ΙΙΙ zircon. (a) Nb/Ta ratio vs. Nb content of Phase Ι, ΙΙ and ΙΙΙ; (b) Nb/Ta ratio vs. Ta content of Phase Ι, ΙΙ and ΙΙΙ.
Minerals 11 01139 g004
Figure 5. The δ18O values of Phase Ι, ΙΙ and ΙΙΙ zircons. Error bars are 2σ.
Minerals 11 01139 g005
Figure 6. Variations of εHf(t) values in zircons of different phases. Phase Ι, ΙΙ and ΙΙΙ had similar εHf(t) values. Error bars are 1σ.
Minerals 11 01139 g006
Figure 7. REE patterns of different phases zircons crystallized from marginal zone of pegmatite. Chondrite-normalized values are from McDonough and Sun [27].
Minerals 11 01139 g007
Figure 8. Nb/Ta ratio of zircon vs. Nb/Ta ratio of melt. Nb/Ta ratio of melt was calculated by using Nb/Ta ratio of zircon and DNb/DTa, assuming the two relatively extreme values of DNb/DTa = 0.3 and 3.
Minerals 11 01139 g008
Figure 9. Nb/Ta ratio vs. Nb (a,c) and Ta (b,d) abundances for Phase I, III and III melts. Colored curves in (a,b) represent the evolution model of Nb and Ta during crystallization fractionation, assuming that the initial composition of the Stage I melt is Nb = 30ppm, Ta = 65ppm and Nb/Ta = 0.55, the proportion of rutile in Stage I crystallization assemblage is 1.2% and the proportion in Stage II is 3.5%. Colored curves in (c,d) assume that the initial composition of Stage I is the same as in (a,b), the proportion of titanite in Stage I is 2% and in Stage II is 10%. The influence of pyroxene, feldspar and quartz crystallization on the Nb/Ta ratio was not considered because of low DNb and DTa. Amphiboles were also not considered because of a low distribution in FGP. In addition, NYF-type pegmatite is poor in water and it is impossible to crystallize a large amount of biotite and muscovite. The DNb and DTa of rutile and titanite are from Green [44], Prowatke and Klemme [45], respectively. Numbers close to curves represent the amount of fractional crystallization. Stages I and II in Figure 9 refer to the residual melt produced after fractional crystallization as an independent magma system to continue crystallization. The difference between Stage II in (c,d) is the amount of fractional crystallization in Stage I.
Minerals 11 01139 g009
Publisher’s Note: MDPI stays neutral with regard to jurisdictional claims in published maps and institutional affiliations.

