Article

Specific Mixing Energy of Cemented Paste Backfill, Part II: Influence on the Rheological and Mechanical Properties and Practical Applications

Research Institute on Mines and the Environment (RIME), Université du Québec en Abitibi-Témiscamingue (UQAT), 445 Boul. de l’Université, Rouyn-Noranda, QC J9X 5E4, Canada
*
Author to whom correspondence should be addressed.
Submission received: 26 August 2021 / Revised: 4 October 2021 / Accepted: 14 October 2021 / Published: 21 October 2021
(This article belongs to the Special Issue Backfilling Materials for Underground Mining, Volume II)

Abstract

:
The rheological properties (yield stress, flow index and infinite dynamic viscosity) and mechanical properties (unconfined compressive strength, UCS) of different cemented paste backfill (CPB) recipes must be determined during the laboratory optimization phase. However, the influence of the mixing procedure on these properties has scarcely been studied so far. The objective of this paper is to assess to what extent these properties depend on the specific mixing energy (SME) for a given type of mixer. CPB recipes were prepared based on two types of tailing (CPB-T1 and CPB-T2, also referred to as T1 and T2) at a fixed solid percentage for each type of tailing using the Omcan laboratory mixer. A mixture of 80% slag and 20% GU was used as a binder. The mixing time and the rotation speed of the mixer were successively varied. For each recipe prepared, we determined the SME, the rheological properties of fresh CPB (at the end of mixing) and the UCS at 7, 28 and 90 days of curing. The results show that yield stress and infinite viscosity decreased when SME increased in an interval going from 0.3 to 3.8 Wh/kg and 0.6 to 6 Wh/kg for CPB-T1 and CPB-T2, respectively. An increasing trend in UCS with increasing SME was also observed. Empirical equations describing the change of the rheological properties with the SME are used to estimate the change in rheological properties of CPB along the distribution system, considering the specific energy dissipation during CPB transportation. A mixing procedure for obtaining CPB mixtures that are representative of CPB deposited in underground mine stopes is suggested for laboratories who currently use a same mixing procedure, irrespective of the variable field specific energy.

1. Introduction

The reuse of mine tailings in cemented paste backfill (CPB) to fill excavations left by the extraction of mineral resources has become a common practice used widely in underground mines. CPB can be used as a field support, a self-supporting pillar, and as a working platform [1,2]. CPB is a composite material obtained after mixing filtered tailings (with a solids content of 70% to 85% by weight of wet mass of tailings), a relatively small amount of hydraulic binder (2% to 8% relative to the mass of dry tailings) and mixing water (water content of 15% to 30%) [3,4,5]. The binder types used in the CPB were reviewed by [6]. General use Portland cement (Type GU) is often used in the mining industry as a binder. CPBs containing only this type of cement as a binder can, however, be vulnerable to internal sulphate attack, which destabilizes the mechanical integrity of the CPB matrix, especially in the presence of sulfidic tailings or mixing water containing high concentrations of sulphate ions [7]. Knowing that the portlandite (the hydrate responsible for the sulphate attack) released during hydration reactions can be consumed during pozzolanic reactions, Portland cement is sometimes mixed with other compounds rich in silicate minerals with pozzolanic properties such as fly ashes, blast furnace slag or silica fume [8,9].
The mixing of the CPB consists of a mechanical agitation of the aforementioned constituents to create and maintain the homogenization of the solid phase suspension in the liquid [4,10]. Obtaining a homogeneous mixture after mixing is necessary in the preparation of CPB recipes to guarantee high performance of the rheological and mechanical properties of CPB.
The rheological properties of CPB are most often evaluated in the laboratory by measuring the flow and viscosity curves, which yield stress and dynamic viscosity. These rheological parameters must be known beforehand to estimate the pumping pressure necessary for transporting the CPB by pipeline at a given flow rate and, therefore, to optimize the consumption of pumping energy [11,12,13]. When the rheological properties are more favorable, a gravity backfill transport system can even be considered to minimize the costs associated with the backfill operation. Knowledge of rheological behavior is, therefore, important in the design of pumping or transport systems of the CPB. Once transported and installed, the CPB must then develop adequate mechanical strength to ensure the stability of the backfilled site. In mining practice, this mechanical stability is most often evaluated in terms of simple compressive strength (UCS).
Researchers have shown that the rheological behavior of cementitious materials during the hours following their mixing is strongly influenced by the mixing method [14]. In general, it has been observed that a cement paste prepared with high mixing energy has more favorable rheological properties than a paste prepared with low energy [15,16,17,18,19]. In addition, studies have noted that the compressive strength of cementitious materials can be improved by almost 30% just by optimizing the mixing procedure [17,20,21]. Indeed, the high performance concrete UCS can increase with the duration of mixing [17]. Moreover, high mixing speed can reduce mixing time, while providing the necessary mixing energy. However, the rheological and mechanical properties of certain cementitious materials can be negatively affected by mixing at very high speed. In support of this, there is an optimal mixing speed above which a loss of fluidity of the concrete is observed, characterized by lower slump values depending on the water–cement ratio in concrete [20].
Numerous studies have been carried out to correlate the rheological and mechanical properties of CPB with different influence parameters [22,23,24,25,26,27,28], but the influence of the mixing procedure on these properties has scarcely been studied so far. A companion paper [29] has shown that the various mixing parameters (mixing time, mixing speed and load mass) can be expressed in terms of specific mixing energy (SME), and showed that the slump height determined with the Abrams cone increased with the SME. The purpose of this article is to investigate the influence of mixing parameters (focusing on mixing time and speed) and SME on the rheological and mechanical properties of CPB. The objective is to reproduce the CPB shear field conditions during the mixing process in the laboratory to obtain CPB mixtures that are representative of CPB deposited in underground mine stopes.

2. Materials and Methods

2.1. Tailings Characterization

The materials used in this study are two filtered mine tailings denoted T1 and T2, sampled on two mine sites located in Abitibi-Témiscamingue (Quebec, Canada). A mixture of 20% Portland cement Type GU and 80% blast furnace slag was used as binder at a content of 4.5%. Tap water was used as mixing water. The physical and geotechnical characterization, as well as the chemical and mineralogical composition of these CPB tailings, as well as the chemical composition of the binder were presented in detail in the first part of this article. Analysis of the particle size curves showed D10 and D60 of 4.9 µm, 43.4 µm (for T1) and 4.4 µm, 28.0 µm (for T2). The uniformity coefficients CU for T1 and T2 were 8.9 and 6.4, respectively. Solid grain density values (Gs) were 3.14 and 2.97 for T1 and T2, respectively. These solid grains had specific surfaces of 2.6 and 2.7 m2/g respectively for T1 and T2. The fractions of fine (P80µm) and ultrafine (P20µm) particles were 79.7 and 36.4% for T1, and 88.4 and 48.5% for T2, respectively. The main mineral phases in T1 were quartz (59%), pyrite (18%), and albite (12%). These tailings also contained low percentages of chlorite (4%), gypsum (3%), and muscovite (4%). For T2, the mineral phases detected were quartz (49%), albite (12%), chlorite (9%), muscovite (10%), pyrite (11%) and corundum (2%)

2.2. Cemented Paste Backfill (CPB) Proportioning and Measurement of the Specific Mixing Energy (SME)

CPB mixtures were prepared at solids content of 75% and 70% for T1 and T2, respectively. Table 1 shows the mixtures of CPBs prepared (mixtures M01 to M08 for T1 and M09 to M16 for T2) to study the effect of the three mixing parameters on the rheological and mechanical properties of CPB. CPB mixtures prepared with T1 and T2 are henceforth referred to as CPB-T1 and CPB-T2, respectively.
Table 1 shows that two variable mixing parameters were considered in this investigation: mixing time and mixing speed. Two of the three mixing parameters were kept constant while the third was varied. For example, when the influence of the mixing time was studied, mixing speed and load mass were kept constant. Variable parameters include mixing time, which was varied from 5 to 30 min, and mixing speed with values of 91, 166 and 282 rpm. The mass load was kept constant for all tests (4.7 and 4.2 kg for T1 and T2, respectively). The SP300AT mixer (Omcan Food Machinery, Mississauga, ON, Canada) was the only type of mixer used to prepare all mixtures. The instantaneous recording of the power consumed by the mixer during the preparation of CPB recipes was carried out using the Acuvim IIR-D-333-P2 power meter (Accuenergy Canada Inc., Toronto, ON, Canada). Figure 1 below shows the mounting of the wattmeter on a laboratory mixer during the preparation of the backfill.
The specific mixing energy (SME; in Wh/Kg) was determined from the power consumed during mixing P. To do this, Equation (1) was used (see Part I of this article). The parameters P (W), and Pi (W) refer to the loaded mixer running, while P0 and P0i refer to empty mixer running.
SME   = 1 m 0 t f [ ( P ( t ) P 0 ( t ) ] dt = 1 m 1 n t i ( P i P 0 i )

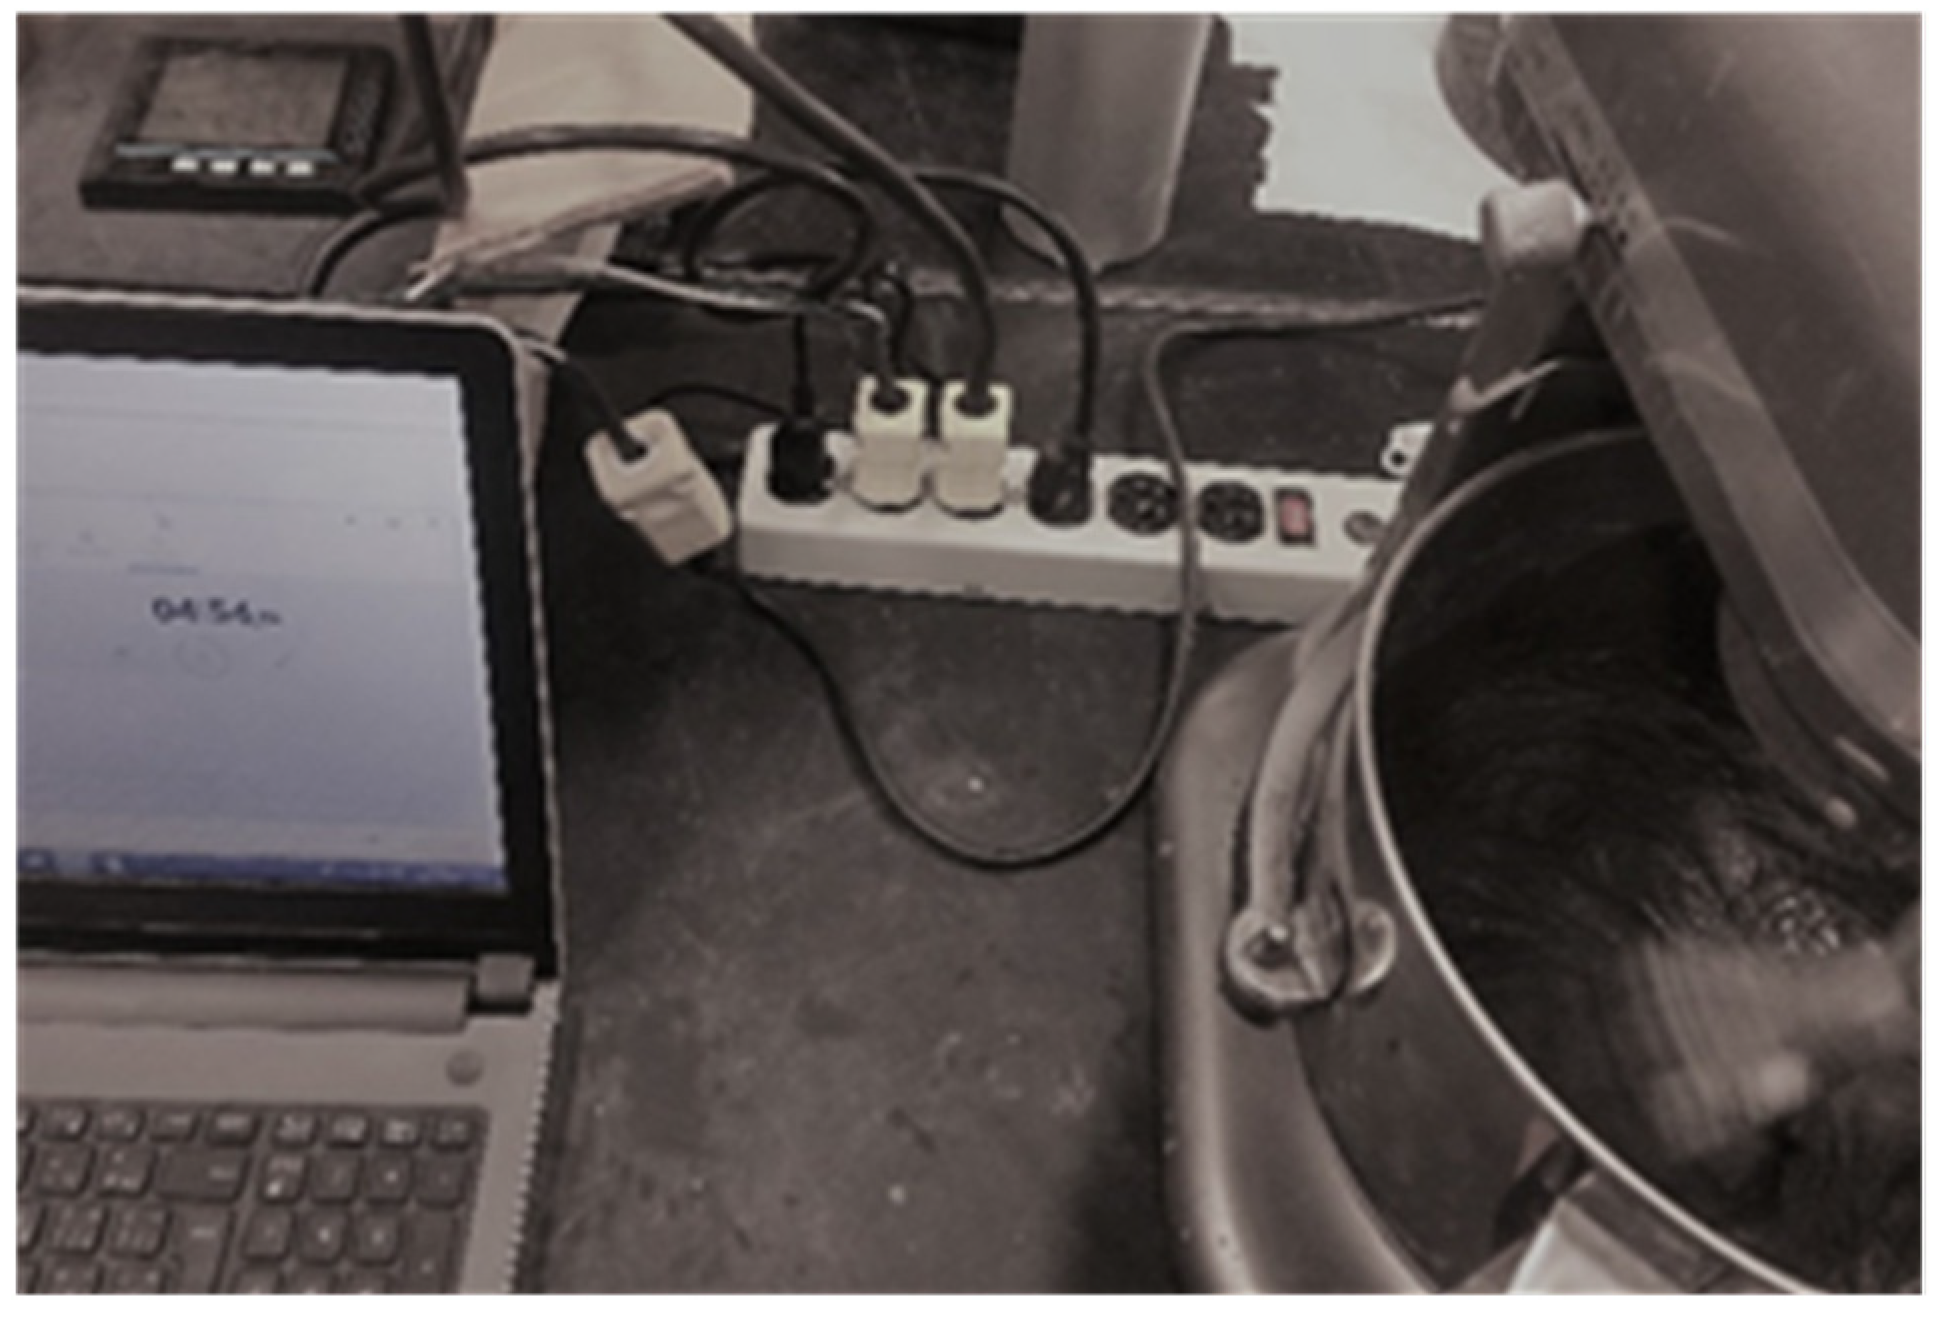
2.3. Rheological and Mechanical Characterisation of CPB

At the end of the mixing of each batch, the temperature of the CPB was taken using a technical thermometer. The rheological characterization of the CPB recipes was then carried out by determining the flow and viscosity curves with the AR2000 rotational rheometer from TA Instruments (New Castle, DE., USA). A vane (or rotor) was used to shear the material placed in a cylindrical cup (or stator) with a diameter of 30 mm. The vane measured 28 mm in diameter and 42 mm in height. Its gaps relative to the bottom and inner wall of the cylindrical cup were 4 mm and 1 mm, respectively. The steady state flow step procedure was used to shear the CPB in the rheometer. This procedure involved applying a constant shear rate to the material and observing the change in shear stress. At the equilibrium point corresponding to the stabilization of the observed variable, the value was recorded and an automatic increase of the shear rate was carried out. The increase of the variable was carried out in up and down flow modes. The shear rate zone considered was from 0 to 100 s−1 and 100 to 0 s−1 for the upward and downward paths, respectively. The tests were carried out in triplicate. Data processing was conducted using TA Instrument’s data analysis software (rheological data analysis advantage). The three rheograms obtained were replaced by an average rheogram, obtained using the merge function during data processing. The best fitting model function was used to generate the rheological behavior closest to the experimental data by determining the smallest standard error. A model was considered acceptable when its standard error was less than 2%. The Herschel–Buckley (Equation (2)) and the Cross (Equation (3)) models were found most suitable for smoothing the flow and viscosity curves.
τ = τ 0 + K   γ ˙ n
μ   μ   μ 0   μ = 1 1 + β (   γ ˙ ) n c
In Equation (2), τ (Pa) is the shear stress, γ ˙ (s−1) the shear rate, τ0 the yield stress, K (Pa.sn) the consistency index and n refers to the structure (or behavior) index. In Equation (3), µ is the dynamic viscosity (Pas), μ0 and μ represent the viscosity at low and high shear rates (or initial viscosity and viscosity at infinity), respectively. β and nc (<1) are experimental parameters. When the flow curves are linear, n = 1 and the Herschel–Bulkley model then corresponds to that of the Bingham model.
As mentioned, the main objective of this study was to analyze the influence of specific mixing energy on the rheological properties. Emphasis was placed on yield stress (τ0), flow index (n) and infinity viscosity (μ), which are the most important properties for the design of the CPB transport system in pipelines. The link between the parameters K and n of the Herschel–Bulkley model is addressed in the discussion. As the CPB is sheared in the plant and by the pump (if applicable) before arriving in the pipeline, the rheological properties determined on the flow and viscosity curves obtained in descending mode are suitable for the design of the flow in CPB pipelines [30].
The mechanical characterization of the CPB was carried out by determining the value of the UCS. The rigid electromechanical servo press MTS 10/GL (MTS Systems Corp., Eden Prairie, MN, USA) with a maximum capacity of 50 kN was used for this purpose. Cylindrical plastic molds 50.8 mm in diameter and 101.6 mm in height were filled in three layers. Twenty-five strokes of the 1 cm-diameter metal bar were applied to each layer to release the maximum amount of air bubbles trapped in the mass of CPB before shaving off the excess. The hermetically sealed molds were then placed in a curing chamber (relative humidity >90% and temperature = 23 ± 2 °C). A procedure followed to determine whether the UCS of the CPB cylinders was in accordance with ASTM C39. This procedure consists of applying a normal compression force on the cross section of the CPB specimen until its elastic limit is exceeded, which is manifested by the failure of the sample. The displacement rate of the applied load was 1 mm/min. Three different curing times were considered: 7, 28 and 90 days. A precision balance was used to weigh the filled molds for the determination of their apparent density ρ (required in Section 4.3). For each curing time, the samples were tested in triplicate; an average of the three results obtained was calculated and presented as a single value. The coefficients of variation for the triplicate results were 3.8% and 3.2% for T1 and T2, respectively.

3. Results

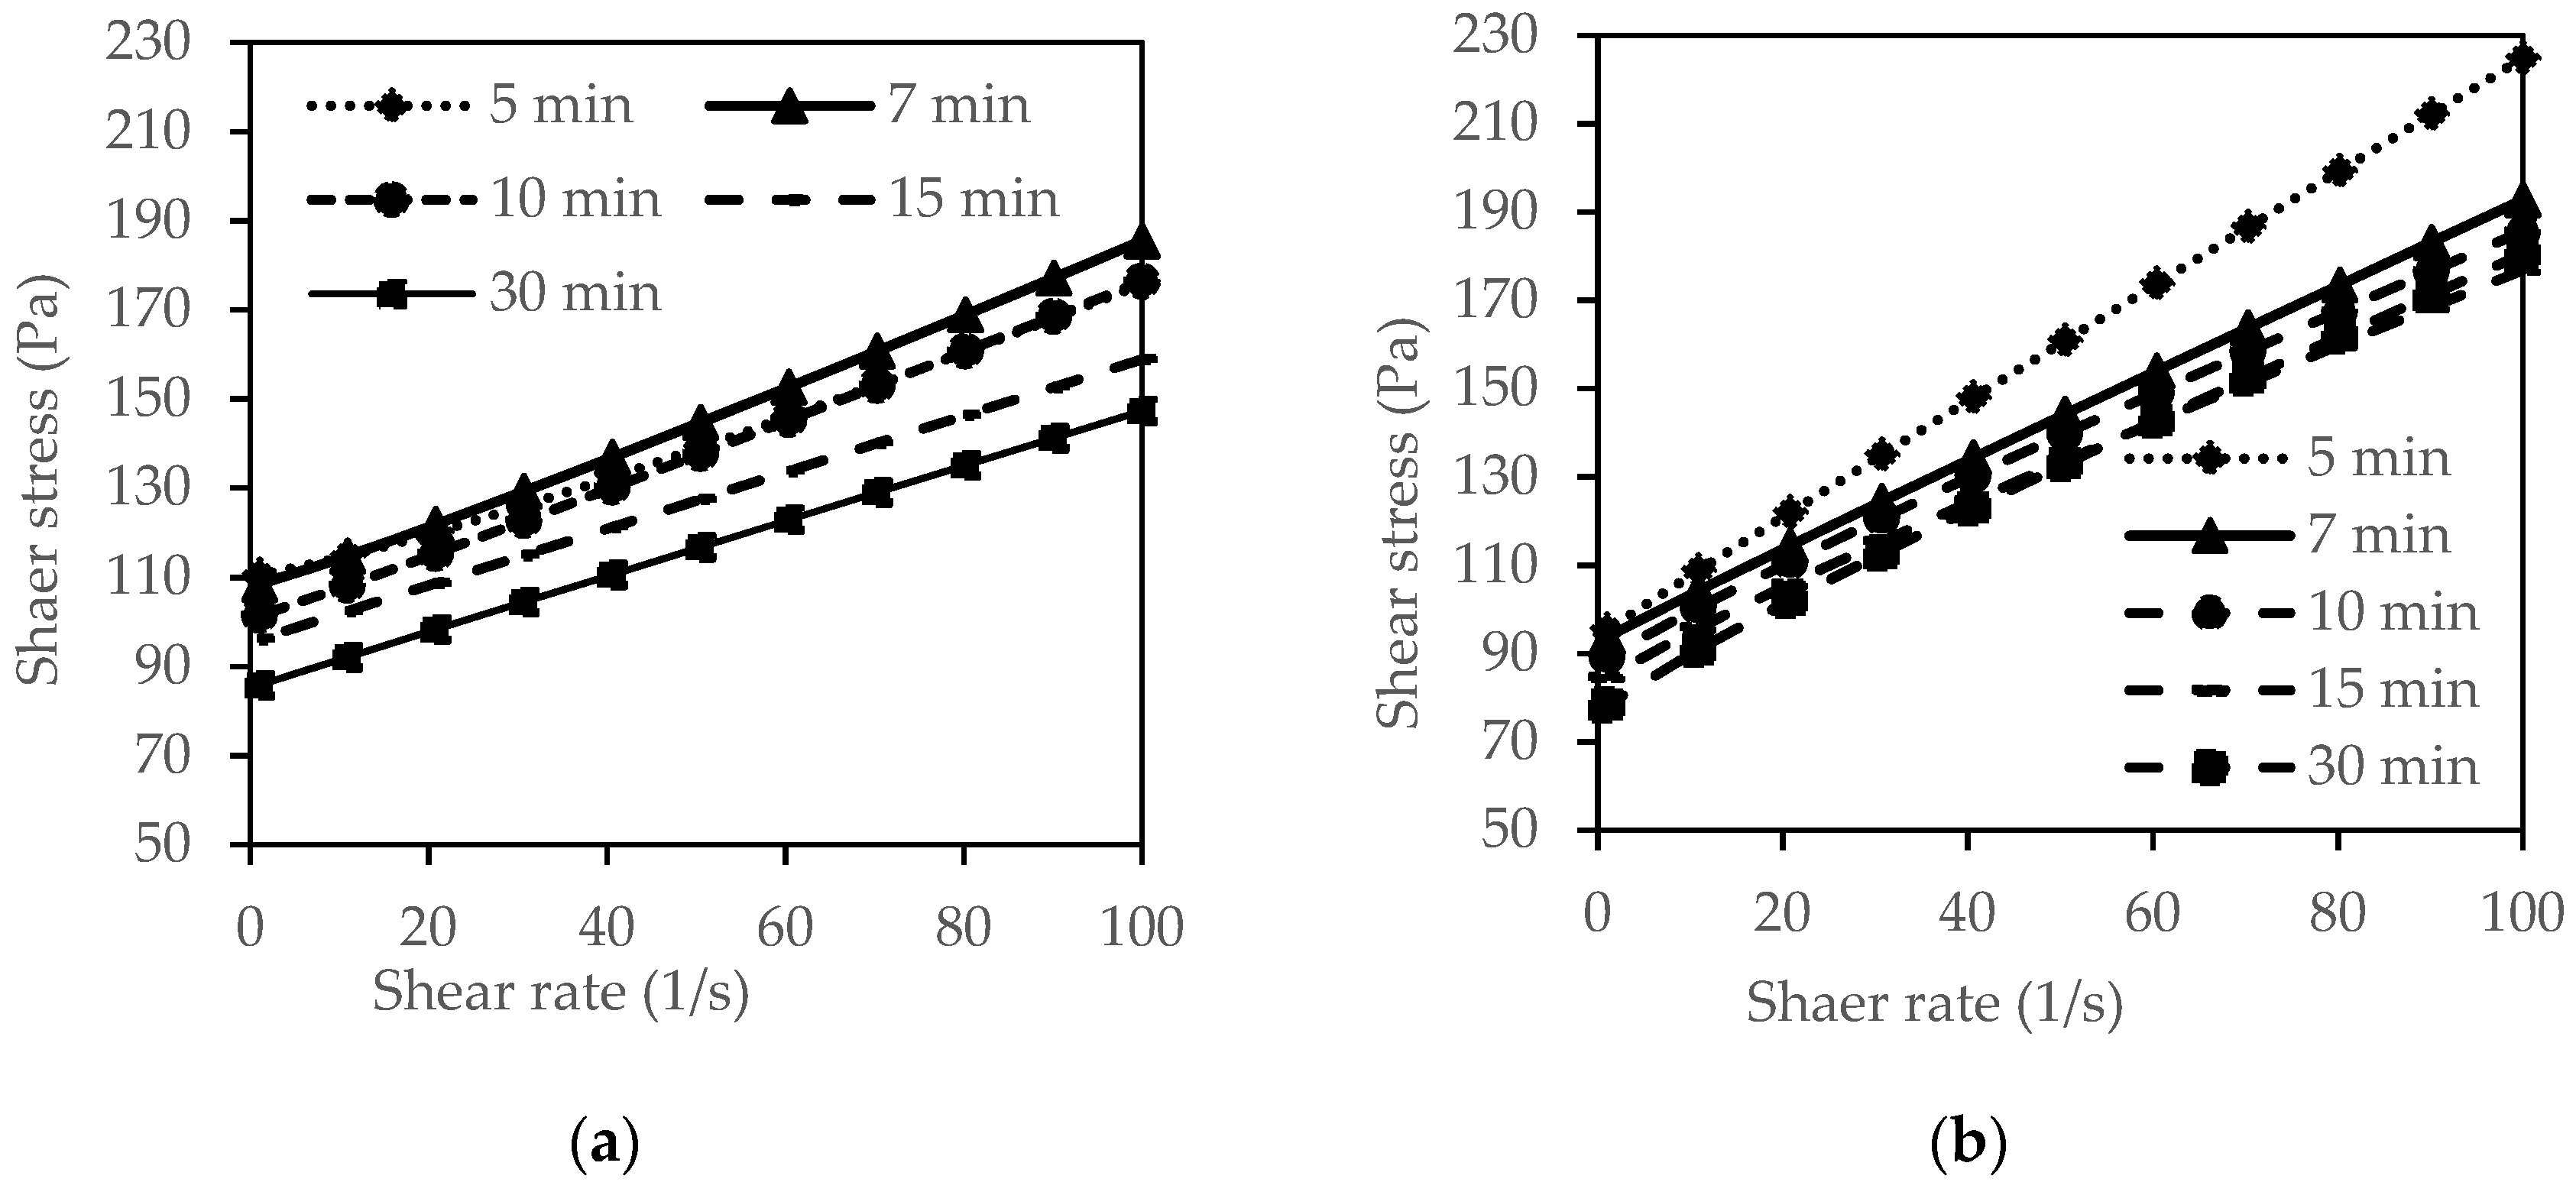
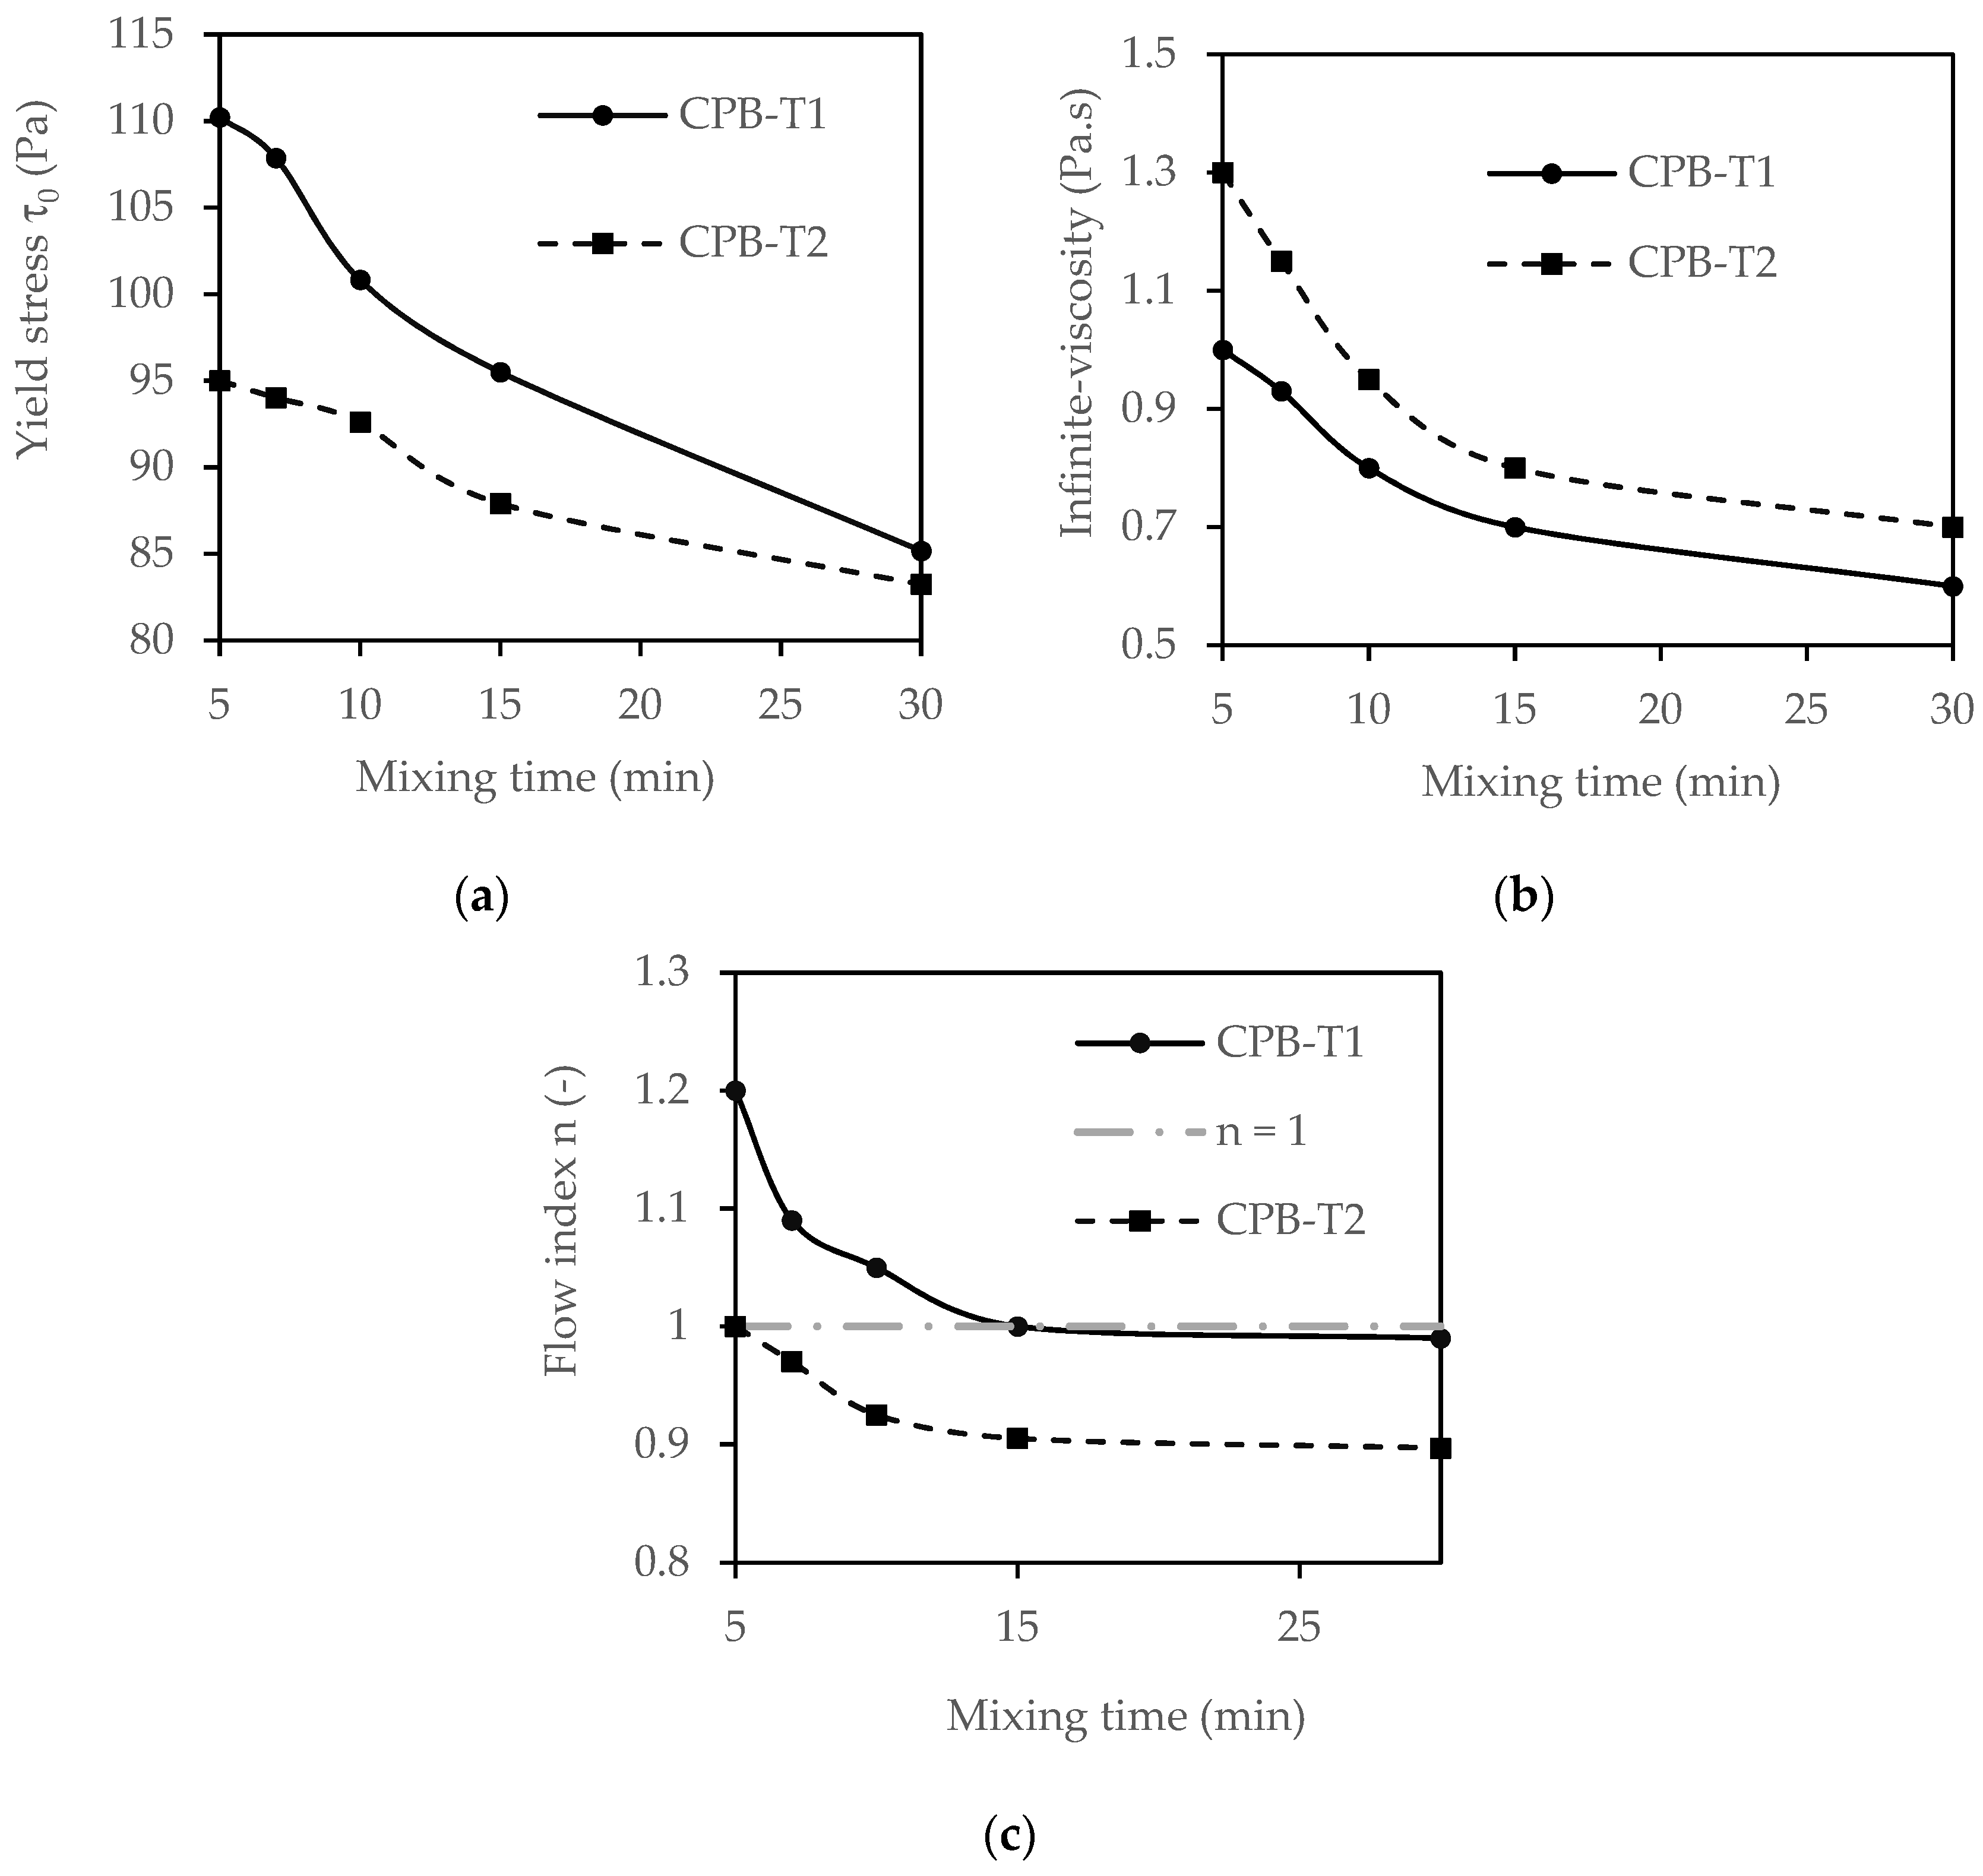
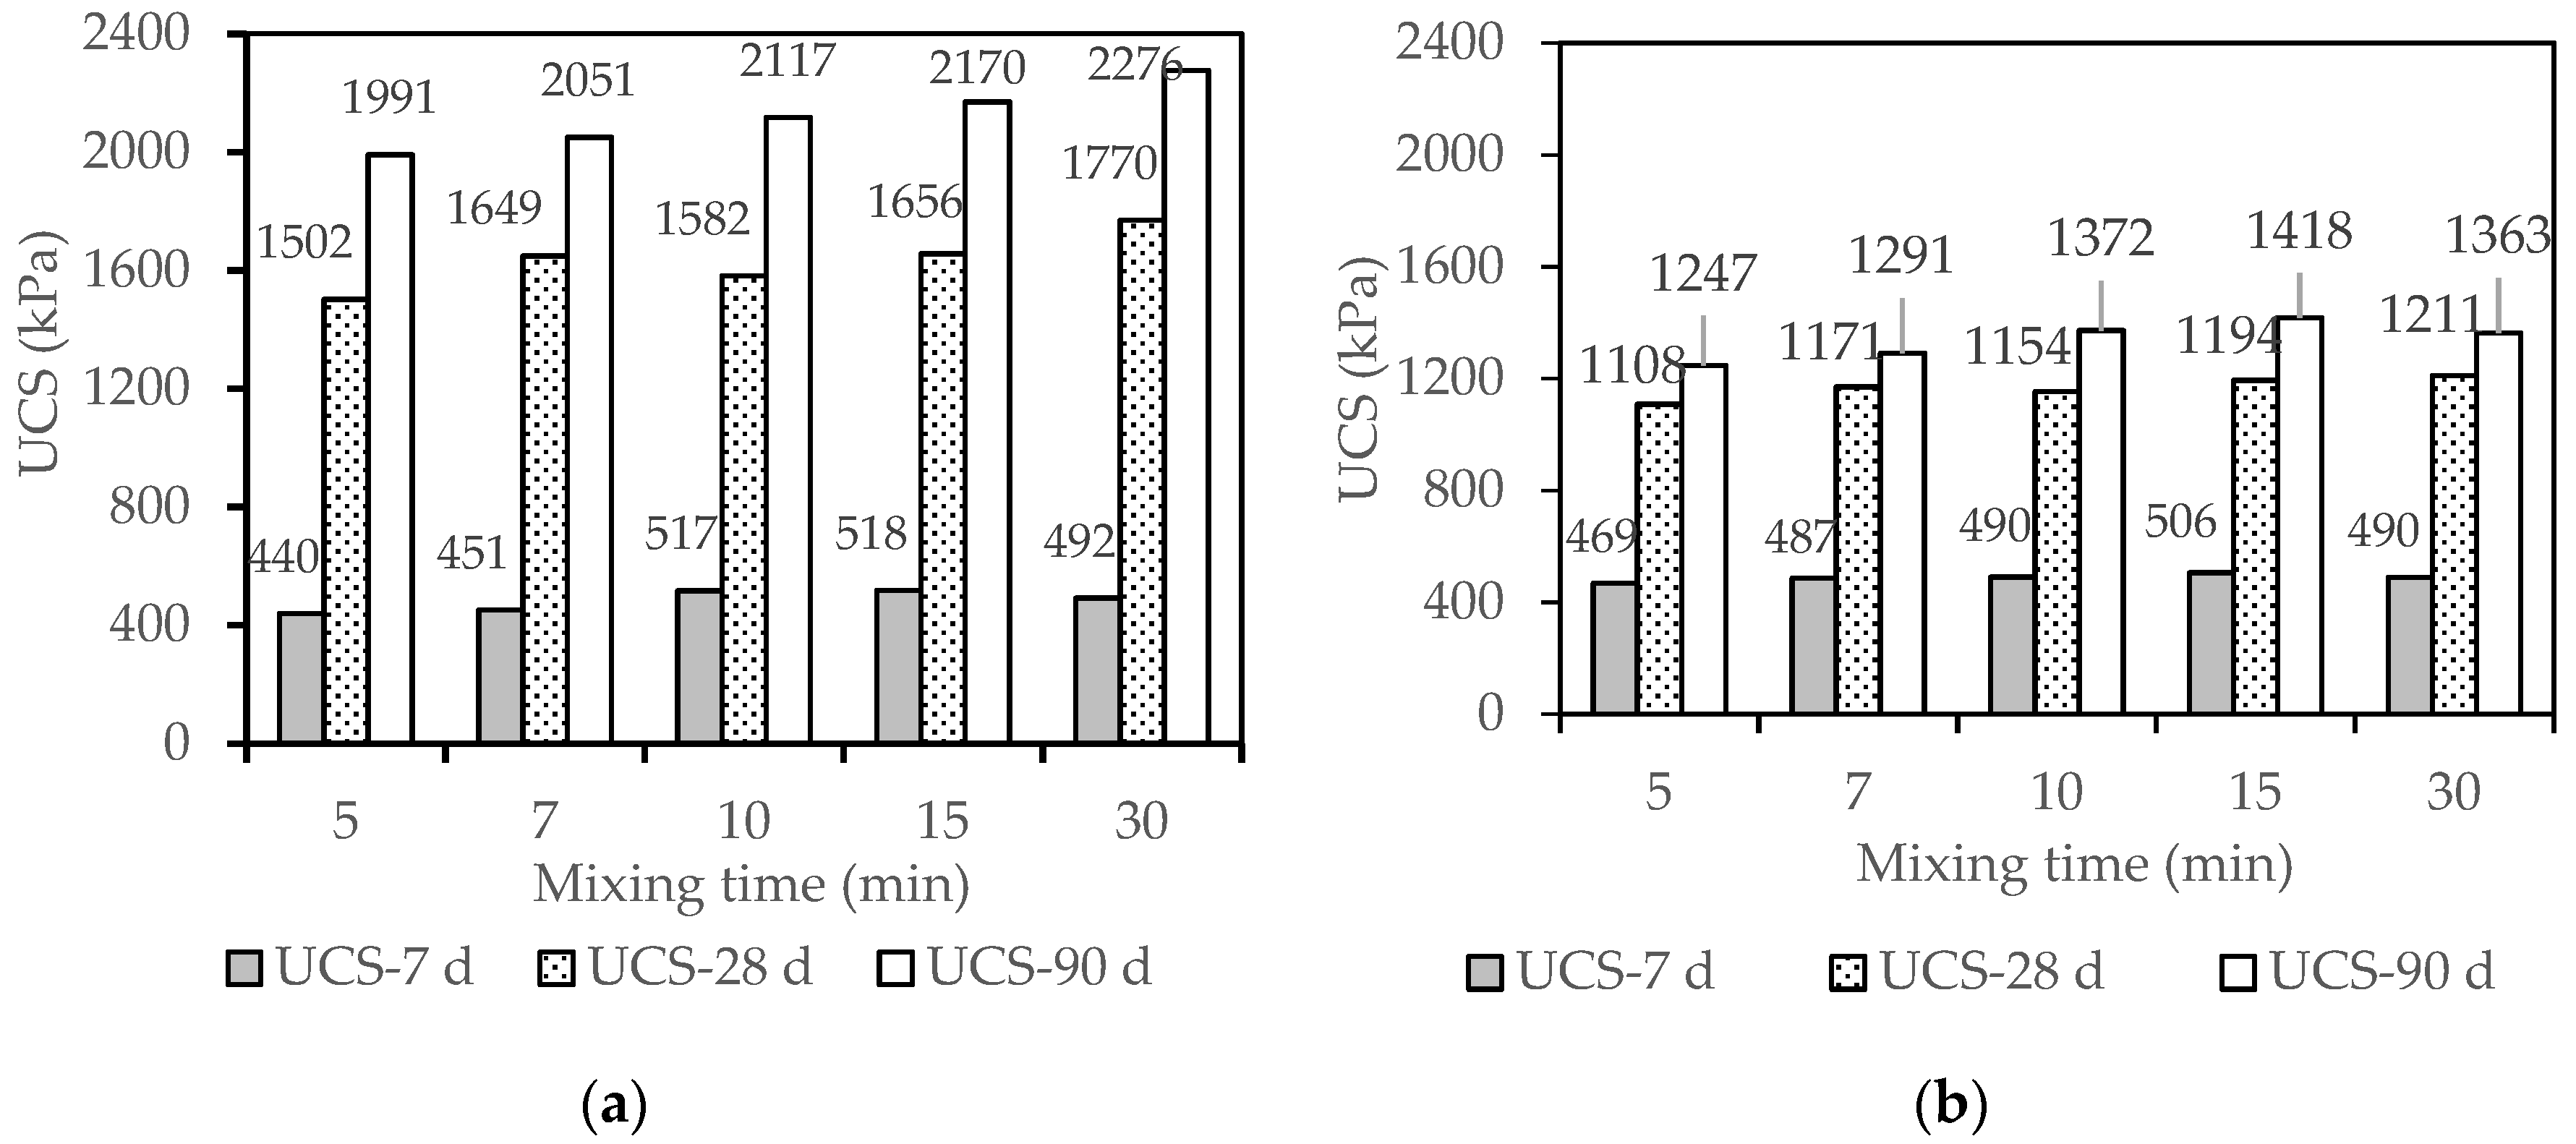
3.1. Effect of Mixing Time on the Rheological and Mechanical Properties of CPB

The results presented in this section relate to mixtures M01 to M05 (for CPB-T1) and M09 to M13 (for CPB-T2) as summarized in Table 1. As mentioned above, the temperature of the CPB was measured at the end of the mixing of each CPB recipe. The temperature values measured on the CPB mixtures based on T1 and T2 increased from 24.5 °C to 25.5 °C for the mixing times varying from 5 min to 30 min. The downward flow curves obtained by varying the mixing time from 5 to 30 min are presented in Figure 2a,b for CPB-T1 and CPB-T2, respectively. Based on the analysis of these figures, it appears that, in general, shear stress tends to decrease with the mixing duration for a given shear rate. In the case of mixing at 5 min for the residues T1, a rather different behavior is observed: the shear stresses are lower than those induced by the mixing at 7 min when the shear rates are greater than 10 s−1. This influence of mixing time on shear stress is, however, more remarkable on the embankment mixtures based on T1 residues than on those based on T2 residues. This difference in rheological behavior of CPB-T1 and CPB-T2 can be explained by the proportion of ultrafine particles (<P20 µm) present in the mixtures. Studies have shown that although colloidal effects are predominant for particles smaller than 1 µm in size, colloidal forces begin to play a role when the particle size is less than about 100 µm [31,32]. The ultrafine fraction of the solid phase constitutes the main particles associated with the colloids in the mixture. The resulting colloidal forces, which are all the most important when the proportion of ultrafine particles is large, serve to hold the solid particles together. It is necessary to neutralize the colloidal forces to keep the solid particles separated from each other and to ensure a homogeneous dispersion of the particles in the liquid. In the case of T1 and T2, the ultrafine fractions are 36.4% and 48.5% respectively. This implies that colloidal interactions are more important in CPB-T2 than CPB-T1. A longer mixing time is, therefore, required in the case of CPB-T2 to observe the same rheological behavior compared to CPB-T1.
Figure 3 shows the variation with mixing time of yield stress (τ0), infinite viscosity (μ) and flow index (n) for CPB mixtures prepared with T1 and T2. Results show that τ0 and n decrease with increasing mixing time. When the mixing time increased from 5 and 30 min, the yield stress of CPB-T1 and CPB-T2 decreased from 110 to 85 Pa (i.e., a reduction of 23%) and from 94 to 83 Pa (i.e., a reduction of 12%), respectively. The yield stress of CPB-T1 seems more sensitive to the variation of mixing time. Figure 3b shows the variation of the infinite viscosity at infinity (μ) with mixing time for CPB-T1 and CPB-T2 mixtures. There is a significant decrease in infinite viscosity with an increase in mixing time. At a given mixing time, the viscosity is slightly higher for CPB-T2 than CPB-T1. This can be explained by the greater colloidal interactions in T2 compared to T1 as mentioned above. Figure 3c also shows that CPB-T1 mixtures exhibited rheo-thickening behavior (n > 1) when mixing time was shorter than 15 min. The CPB-T2 mixtures are shear thinning (n < 1) for the mixing times studied.
Figure 4 shows the variation of the UCS of CPB-T1 (Figure 4a) and CPB-T2 (Figure 4b) with the mixing time for curing times of 7, 28 and 90 days. The UCS tends to increase with mixing time for any curing time considered. When mixing time increased from 5 to 30 min, the UCS of CPB-T1 varied from 440 to 492 kPa (curing time of 7 days), 1502 to 1770 kPa (28 days) and 1991 to 2276 kPa (90 days). The UCS of CPB-T2 varied from 469 to 490 kPa (curing time of 7 days), 1108 to 1211 kPa (28 days) and 1247 to 1363 kPa (90 days). Increasing mixing time helps balance the limiting gaps of agglomerates and dispersion of solid particles in cementitious materials [15]. Homogeneous dispersion of the binder on the surface of tailing particles promotes the hydration process of the binder in CPB. Through the mixing action, the voids initially occupied by the air are reduced and the porosity of the mixture decreases [33]. This has the effect of consolidating the solid skeleton of the CPB. This explains the trend in UCS increase with the duration of mixing. In the short term (curing time of 7 days), one can observe a peak on the UCS of CPB at a mixing time of 15 min. Depending on the mineralogy of the tailings studied, the drop in resistance observed with the significant extension of mixing time (approximately 30 min) could be due to the microstructural modification of the CPB matrix.
These results showing an improvement in the rheological and mechanical properties of CPB mixtures with mixing time are also supported by other research on cement paste slurry [34,35,36].

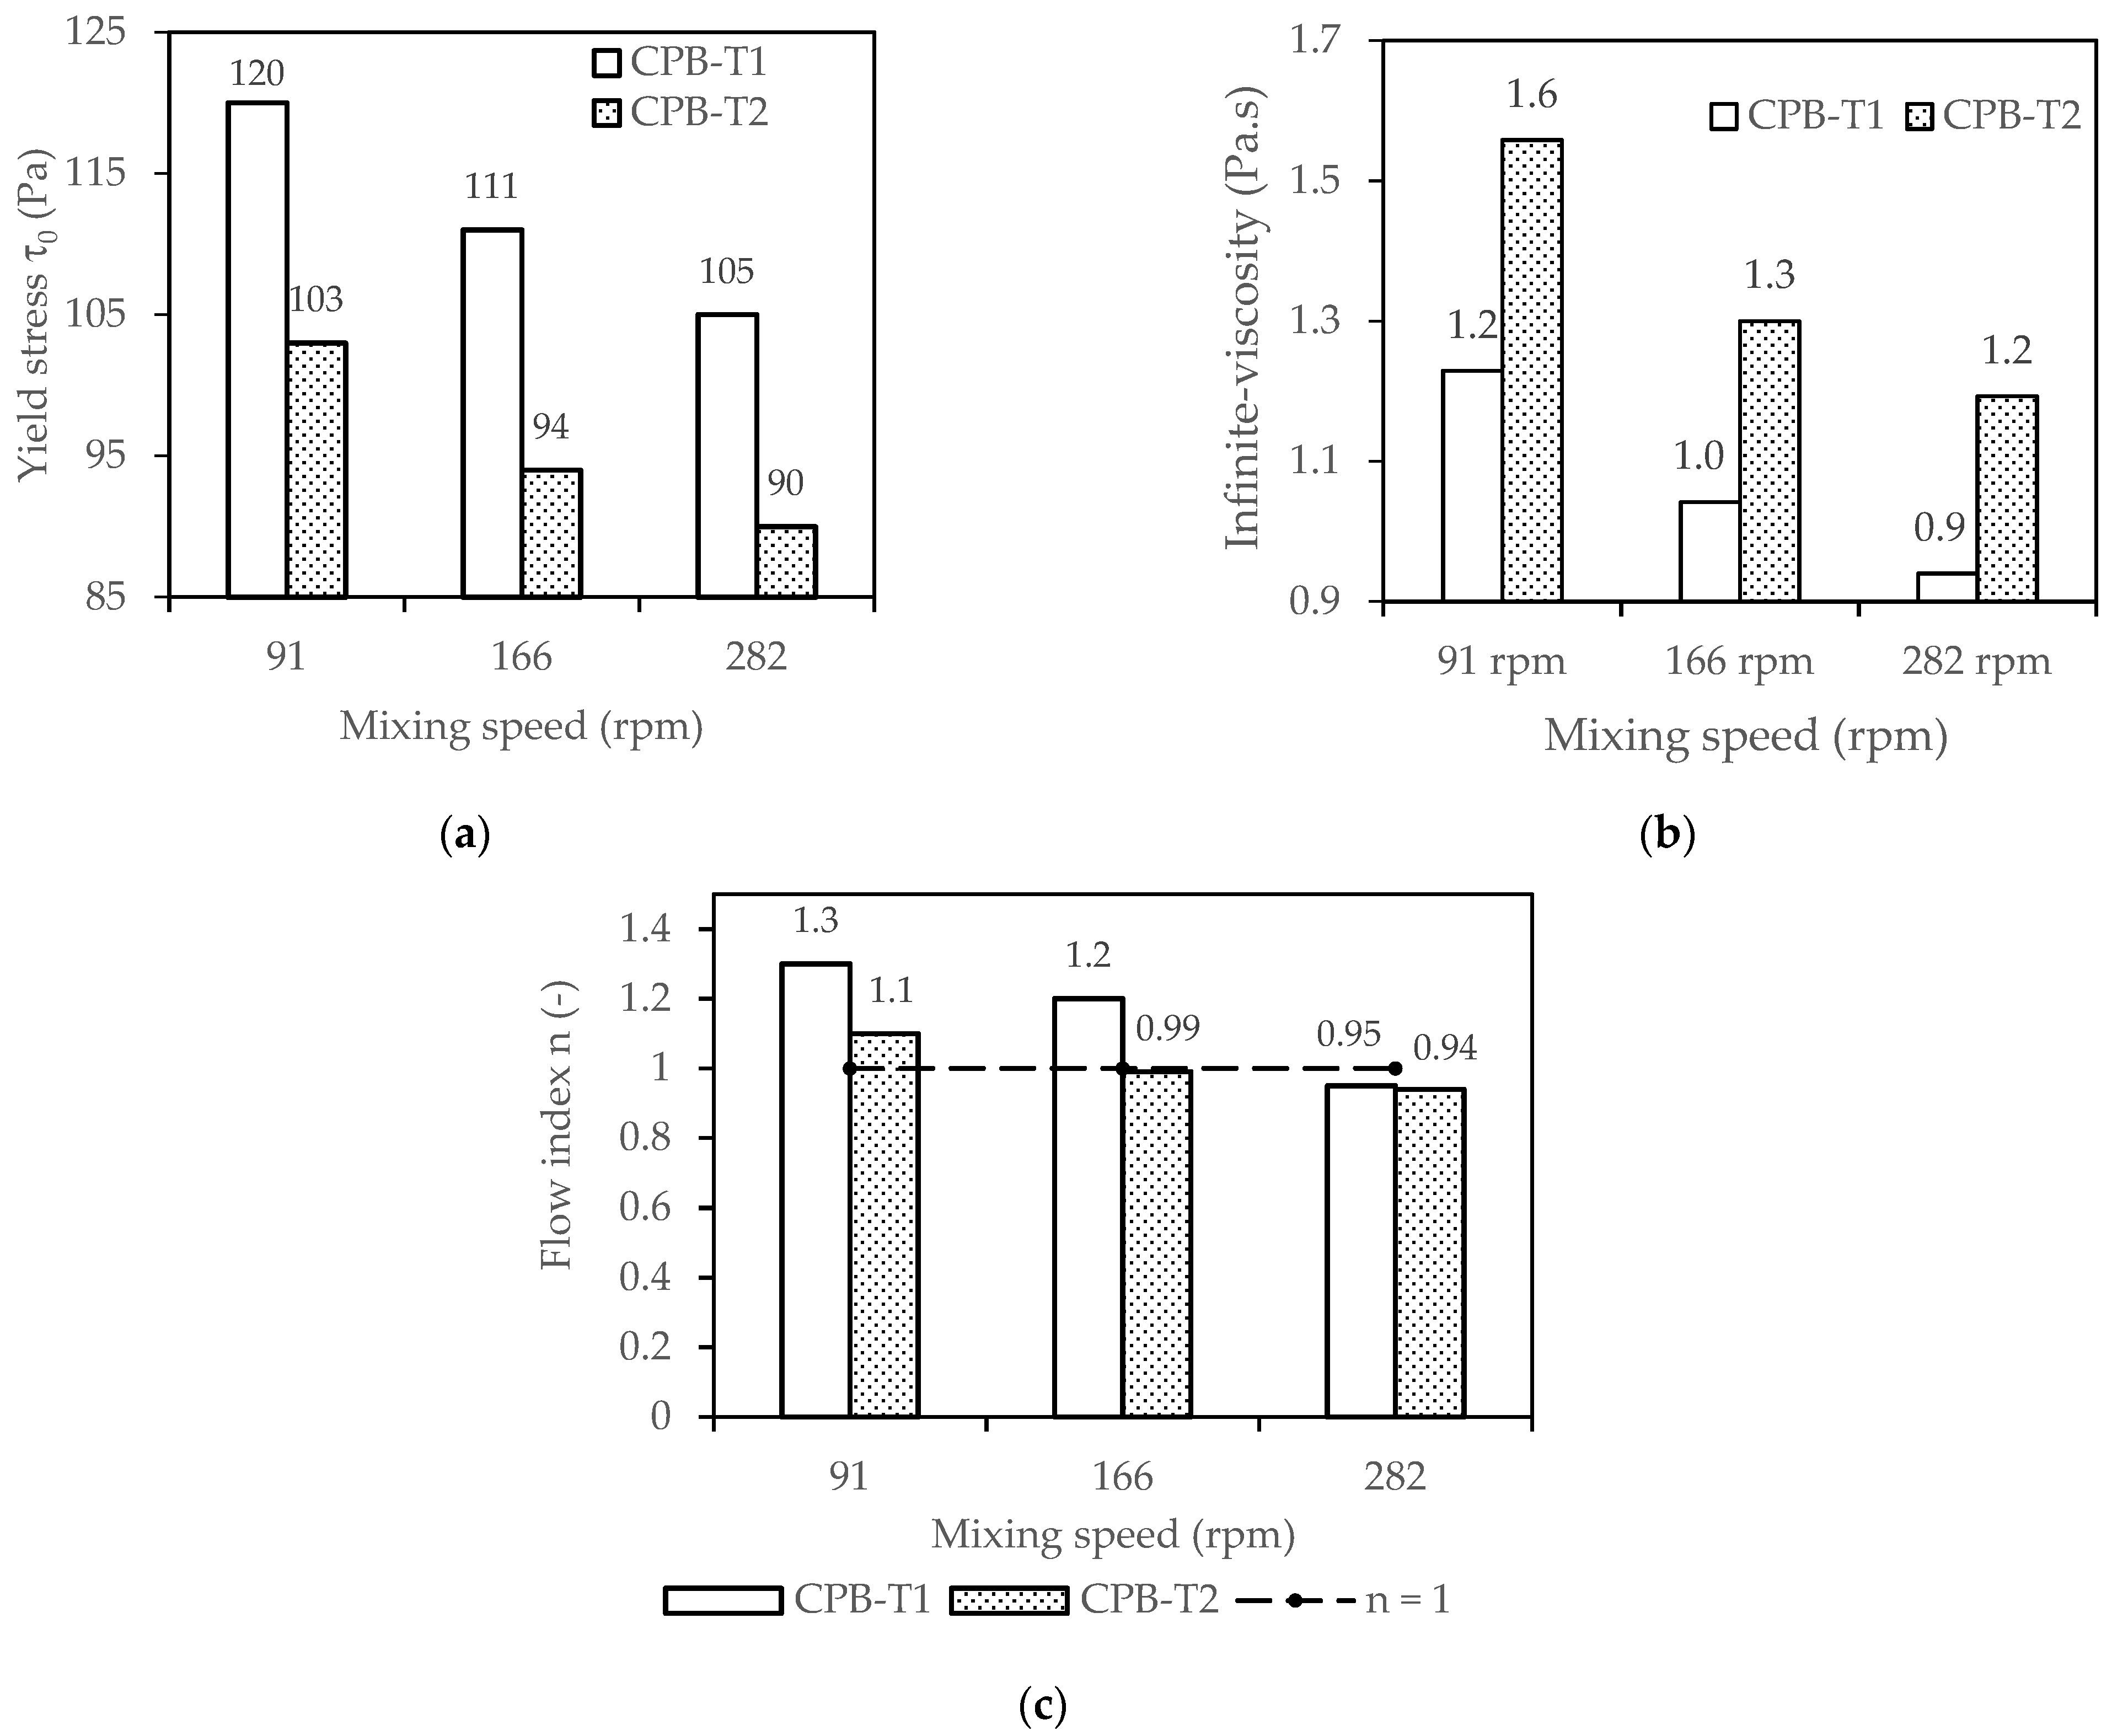
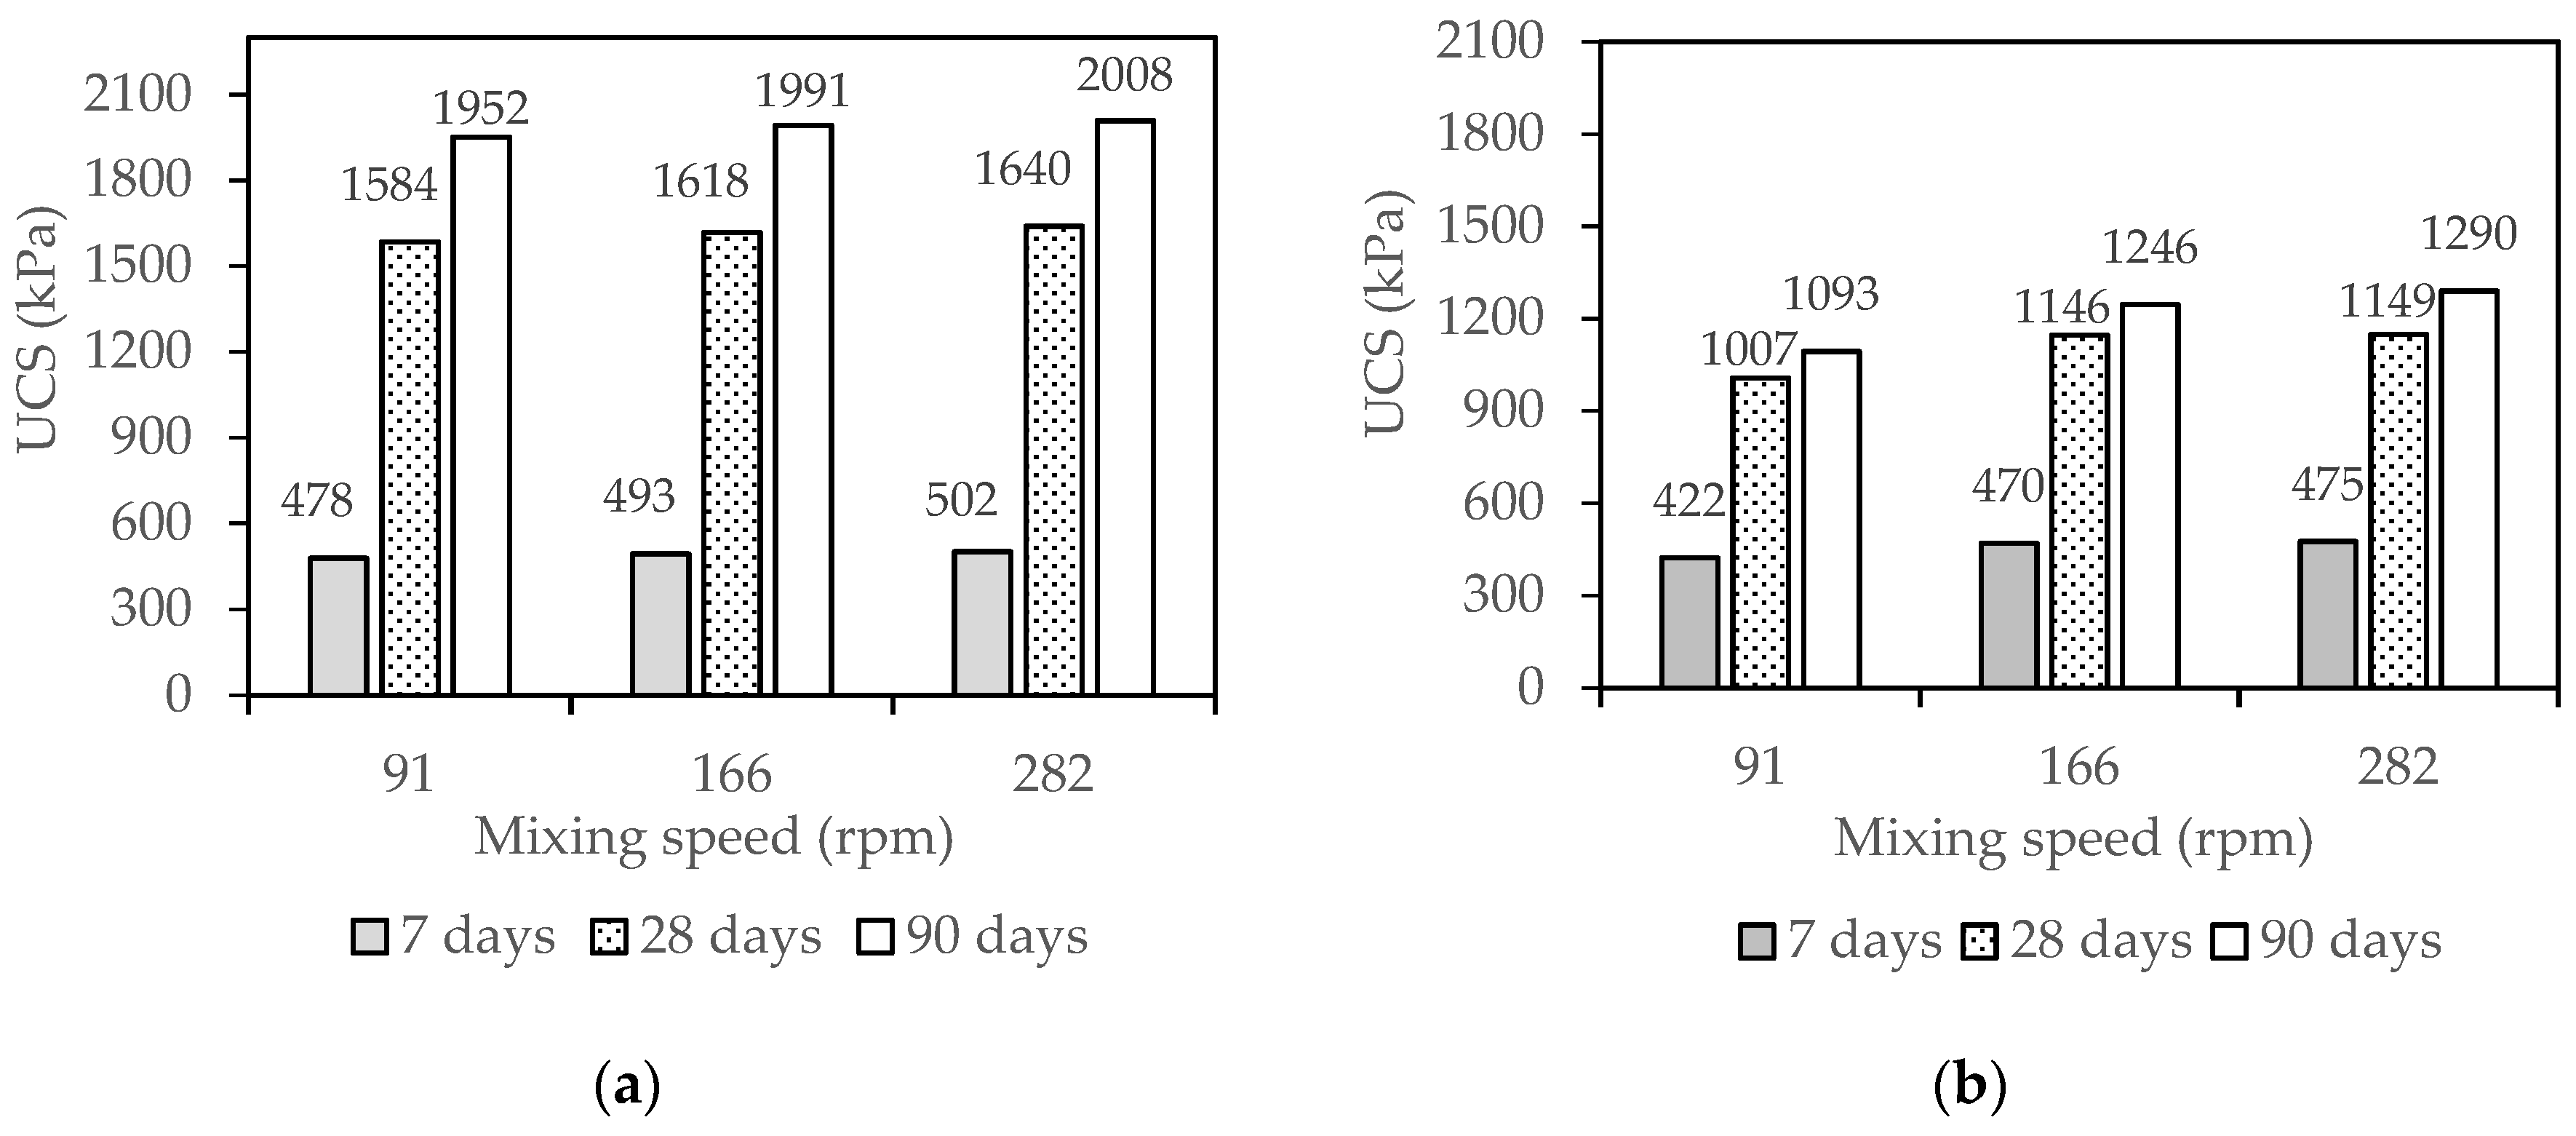
3.2. Effect of Mixing Speed on the Rheological and Mechanical Properties of CPB

The effect of mixing speed (91 rpm, 166 rpm and 282 rpm) on the rheological and mechanical properties of CPB was studied on CPB-T1 mixtures M06 to M08, and CPB-T2 mixtures M14 to M16. The temperatures measured after mixing varied from 24.7 °C to 25.4 °C. Figure 5 shows the variation of yield stress, infinite viscosity, and flow index with mixing speed.
This figure shows a decrease in yield stress with increasing mixing speed. For mixing speeds of 91, 166 and 282 rpm, the yield stress varied from 120, to 111 and to 105 Pa for CPB-T1, and from 103, to 94, to 90 Pa for CPB-T2, respectively. Many previous studies have shown that yield stress increases with increasing solids content Cw [11,37,38,39,40,41]. The higher solids content in mixtures CPB-T1 (76%) compared to CPB-T2 (70%) corroborates the higher yield stress observed in the case of CPB-T2. The infinite viscosity also decreased as mixing speed increased. At a given mixing speed, contrary to yield stress, infinite viscosity values are higher for CPB-T2 (1.6, 1.3 and 1.2 Pa.s at speeds of 91, 166 and 282 rpm, respectively) than CPB-T1 (1.3, 1.0 and 0.9 Pa.s at speeds of 91, 166 and 282 rpm, respectively). The viscosity of cementitious materials represents the internal friction between the layers of CPB and rather depends on the physical, mineralogical and chemical nature of the material constituents [28,42]. This variation observed in infinite viscosity could be explained by the contrast in the particle size distribution. The solid grains in the CPB-T1 mixture are more well-graded than those in the CPB-T2 mixture due to a higher uniformity coefficient (CU = 9 in the case of CPB-T1 versus 6 for CPB-T2). This promotes relative movement between the fluid threads during the shearing of the CPB, resulting in relatively low values of infinite viscosity.
It can also be observed in Figure 5c that the flow index is almost constant, with a slight tendency to decrease when the mixing speed increases. The CPB-T1 flow index values are 1.3, 1.2 and 0.95 at mixing speeds of 91, 166 and 282 rpm, respectively. For CPB-T2, these values of μ are 1.1, 0.99 and 0.94 respectively for each of the same mixing speeds. This result indicates that the CPB mixtures, for the two types of tailings studied, exhibited shear-thinning behavior at the mixing speed of 282 rpm. Therefore, one can expect a decrease in the apparent viscosity of CPB mixtures prepared at this speed (282 rpm) when the shear gradient increases. A sufficiently high mixing speed is necessary to overcome the inter-particle attractive forces and to change from rheo-thickening to rheo-thinning behavior [43]. However, the mixing speed threshold, which is necessary to carry out such a modification of the shear behavior, can vary according to the physicochemical and mineralogical characteristics of the constituents of the CPB present.
The variation of the UCS (at curing times of 7, 28 and 90 days) of CPB-T1 and CPB-T2 with the mixing speed is presented in Figure 6. One can observe a slight increase in the UCS depending on mixing speed for the two types of CPB considered. For example, the UCS of CPB-T1 (Figure 6a) varied depending on curing time from 478 to 502 kPa (7 days), from 1584 to 1640 kPa (28 days) and from 1952 to 2008 kPa (90 days) when the mixing speed was increased from 91 to 282 rpm. The estimated gain in resistance when the mixing speed increased from 166 to 282 rpm is relatively low (on average 1.3% gain for CPB-T1 and 1.6% gain for CPB-T2) compared to the gain recorded when speed increased from 91 at 166 rpm (2.4% gain for CPB-T1 and 13.0% gain for CPB-T2). When mechanical agitation is greater, the structure of the CPB matrix begins to be affected. Previous studies have shown that when the mixing speed increases until it approaches a certain threshold, the double electric layer formed around the particle-water interfaces can gradually begin to be affected [29,43,44]. This can subsequently reduce the electronic repulsion between the solid particles and allow the attractive forces, favoring the agglomeration process of the binder. This alteration in the structure of the CPB could explain the slowdown in the acquisition of mechanical properties observed when the mixing speed increases to 282 rpm.

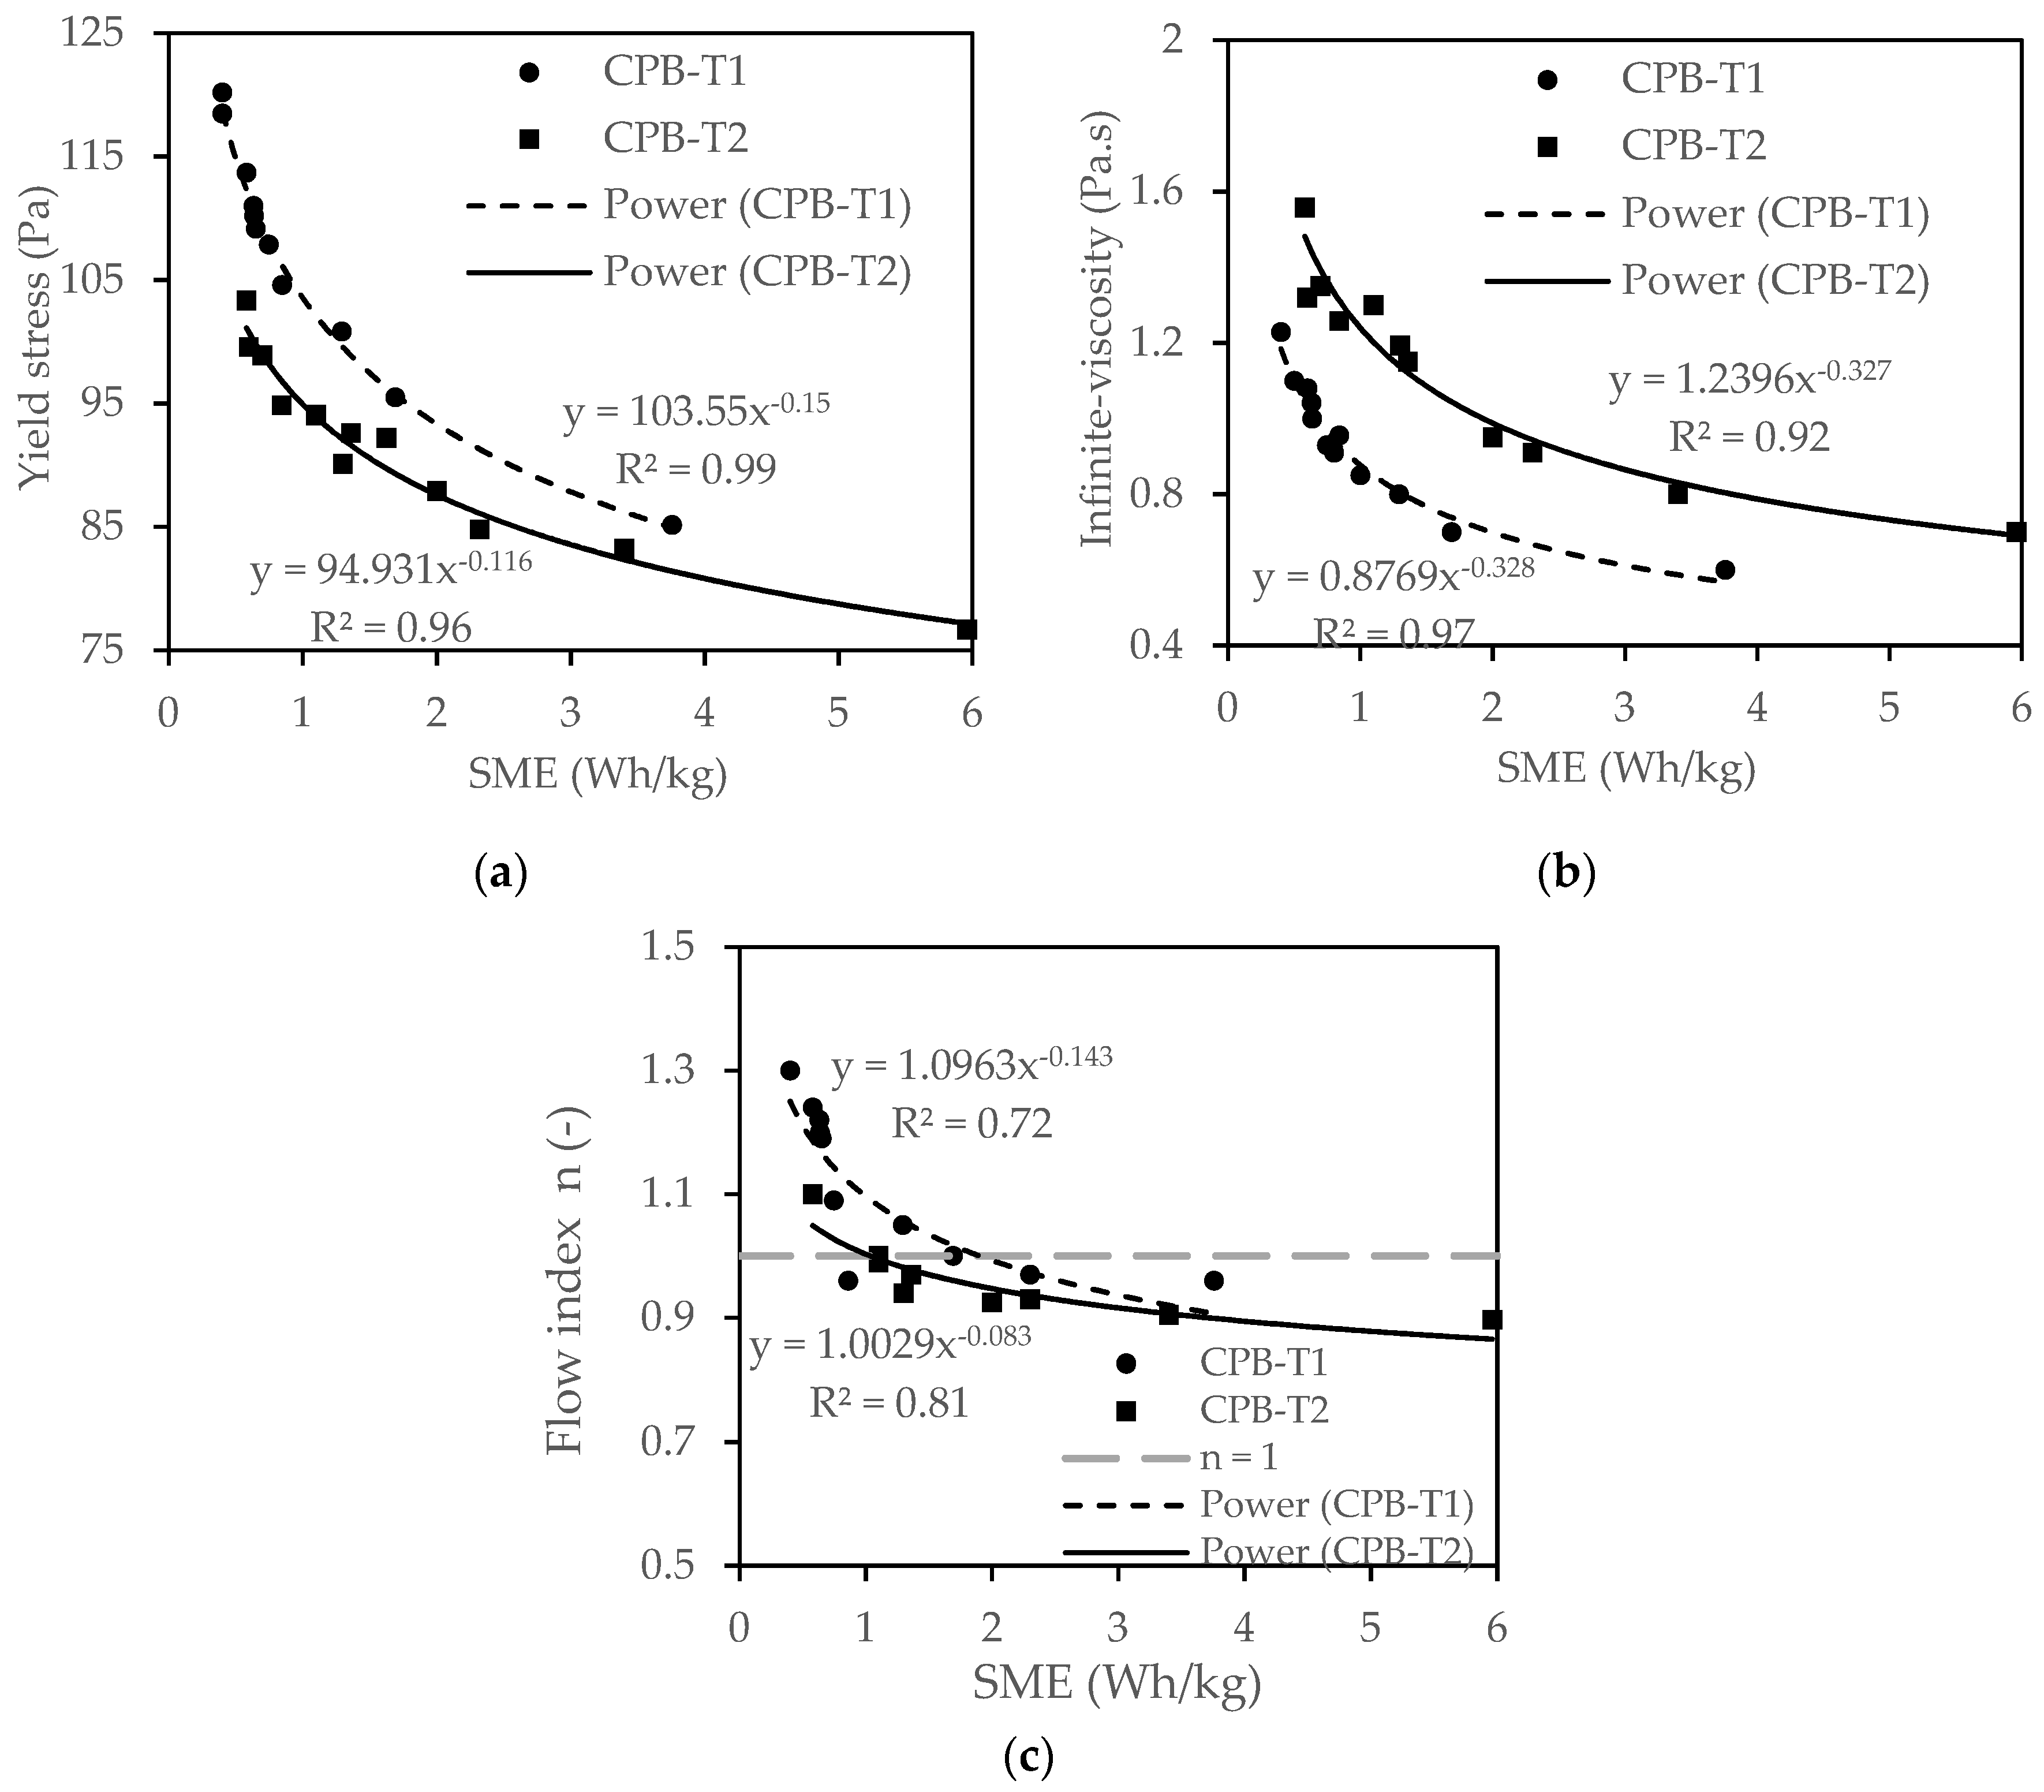
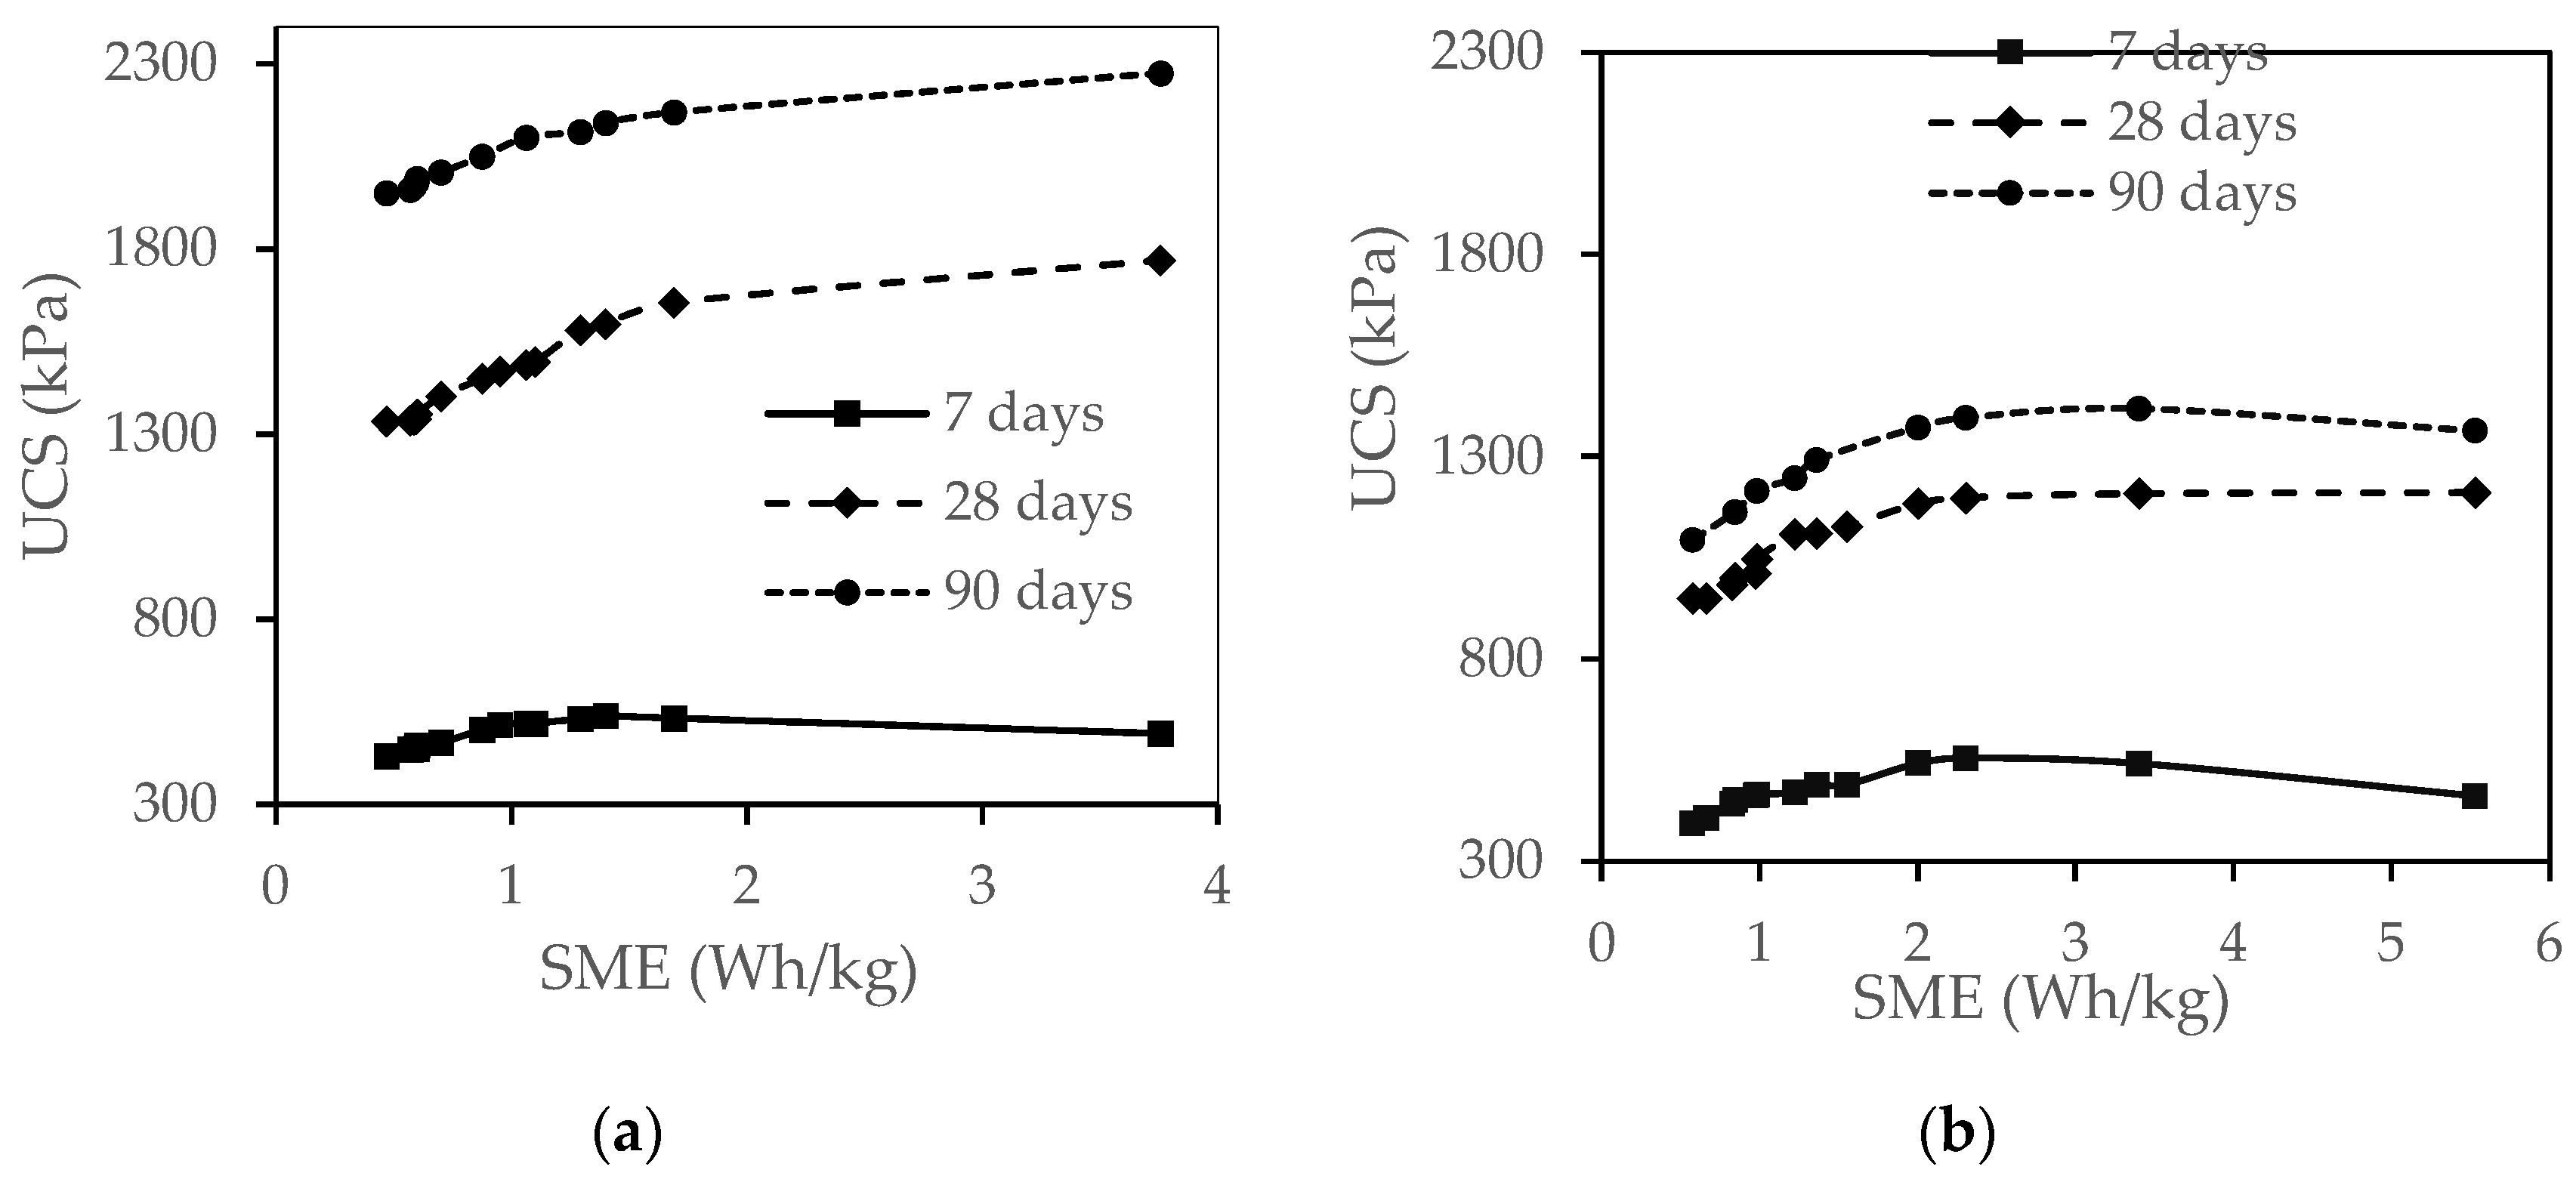
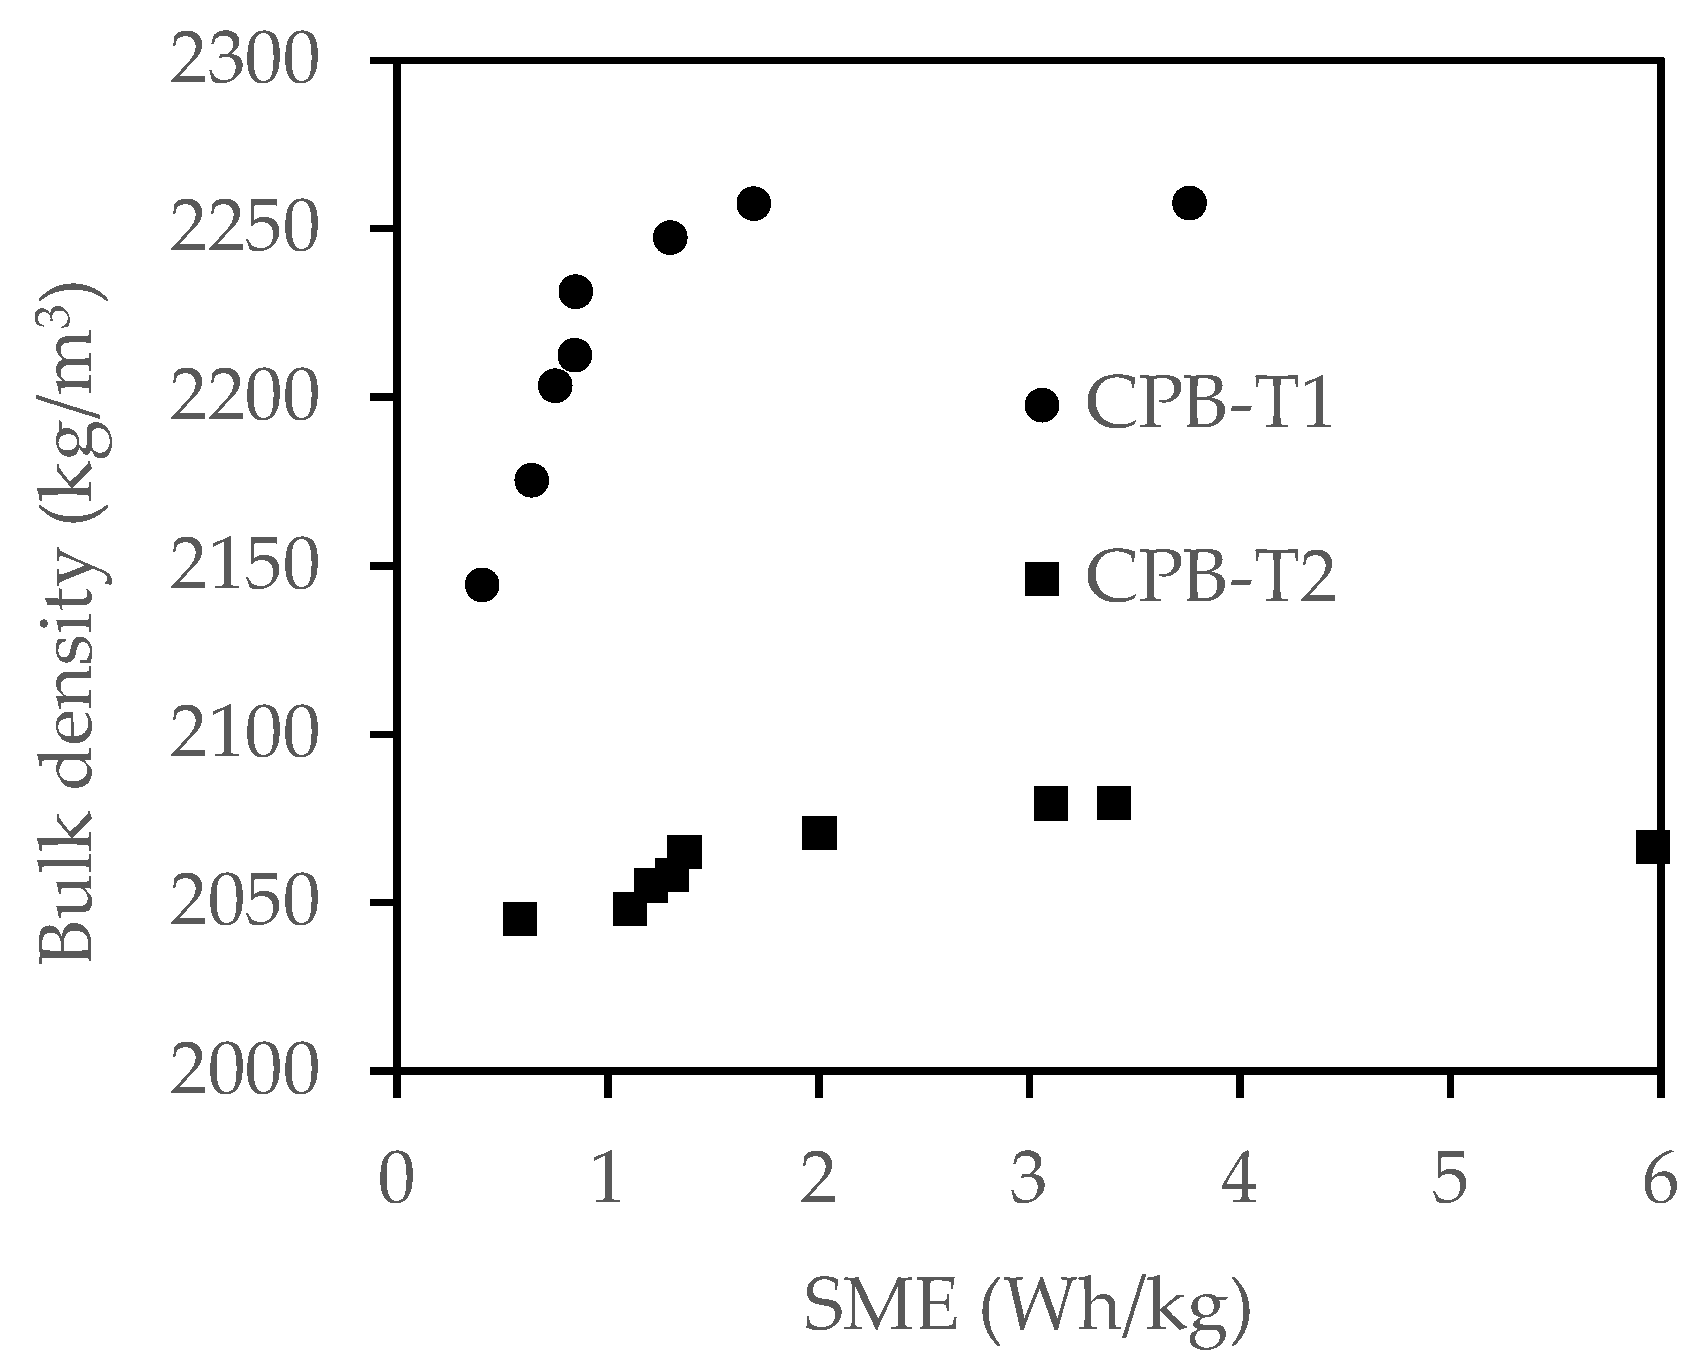
3.3. Effect of the SME on the Rheological and Mechanical Properties of CPB

Mixing time, mixing speed and load mass can be combined as the specific mixing energy (SME). The SME measured during the preparation of all the mixtures presented in Table 1 are given in the companion paper [29]. The SME can be used as a single parameter to express the effect of the three mixing parameters on the rheological and mechanical properties of CPBs. Figure 7 shows the variation of the yield stress, infinite viscosity, and flow index with the SME for CPB-T1 and CPB-T2 mixtures. Figure 7a,b show a decrease in yield stress and infinite viscosity with the SME. A strong rate of decrease in these rheological properties is observed for SME below about 2 Wh/kg.
For a given value of the SME, the yield stress is lower, and the infinite viscosity is higher for CPB-T2 than CPB-T1. Decreasing power law equations can be used to fit the curves presented in Figure 7a,b with acceptable coefficients of determination (≥95%). These equations are valid for 0.3 Wh/kg ≤ SME ≤ 3.8 Wh/kg and 0.6 Wh/kg ≤ SME ≤ 6 Wh/kg, respectively, for CPB-T1 and CPB-T2. A potential application of these equations is presented in the discussion. Figure 7c shows the variation of the flow index with the SME. It is generally observed that the flow index tends to decrease slightly with the increase in the SME. For the two types of tailings studied, the decrease in the flow index is more remarkable for SME ≤ 2 Wh/kg. In contrast, for SME > 2 Wh/kg, the flow index remains almost constant. The decrease observed in the flow index was important to modify the rheological behavior of the fluid and to pass from a shear-thickening to a shear-thinning behavior (when the SME > 1 and 2 Wh/kg for CPB-T1 and CPB-T2, respectively).
As shown in Figure 7, power-law regressions were suitable to correlate the SME to the yield stress and the infinite viscosity with coefficients of determination R2 higher than 0.95. The correlations between the flow index and the SME remain weak (with coefficients of determination of 0.73 for CPB-T1 and 0.81 for CPB-T2). The typical use of such correlations is explained in the discussion section.
The effect of the SME on the UCS of CPB-T1 and CPB-T2 is presented in Figure 8. The results show that the UCS increased for SME lower than 2 Wh/kg and became almost constant for SME greater than 2 Wh/kg.
Therefore, it appears from Figure 7 and Figure 8 that the rheological properties and the UCS of the studied CPB improved with increasing SME. This could be explained by the deflocculating mechanism of the solid particles (binder and tailings) due to increased shear stresses induced by the paddles of the mixer. This deflocculating mechanism promotes good contact between the solid grains and the mixing water which improves the acquisition of mechanical properties by hydration reactions. It also promotes the phenomenon of the release of water and air initially trapped in the agglomerations of fine particles contained in the mixture. The water that is released can participate in the fluidization of the CPB which explains the decrease in observed rheological properties. Recent investigations by different researchers on CPB [45] and cement paste slurry [35] obtained similar results as the current study. However, a few reports have shown that the consistency of cementitious materials can decrease with the duration of mixing according to the constituents present in the mixture [46,47]. Depending on the proportion of the binder in the mixture, this behavior can be explained by the precipitation of the hydrates formed after the initiation of the hydration process [8,48]. Indeed, the entanglement of the C-S-H gel, not broken under the mixing action, can cause a loss in fluidity of the mixture [14,20]. The low cement content used in this study (less than 1% in the mixture) would justify the observed improvement of the rheological properties observed in this study.
For a given mixture, the increase of the UCS with the SME may also be explained by the bulk density of the cylindrical probes at a given curing time. Typical results are presented in Figure 9 for specimens used to determine the UCS of CPB-T1 and CPB-T2 at a curing time of 7 days.
The apparent density of the CPB specimens increases with the SME and reaches a maximum density when the SME is approximately around 2 Wh/kg. Afterward, the density is less sensitive to the change in the SME. This trend is the same with the change in UCS with respect to the SME. The increase of the density with increasing SME can in turn be explained by the rheological properties. The sedimentation of solid particles makes the specimen denser. In non-Newtonian fluids such as CPB that is still pasty, the setting velocity of solid particles increases when the yield stress and dynamic viscosity decrease [49,50]. Figure 7 indicates exactly that the yield stress and infinite viscosity decreases rapidly with increasing SME up to 2 Wh/kg, which supports the increase of the density. For the testing conditions of this study, a SME of 2 to 3 Wh/kg seems to be the optimal value to reach. Empirical equations developed in the companion paper [29] can then be used to optimize the mixing parameters (mixing speed, mixing time and load mass) to ensure such optimal SME.

4. Discussion

Different issues that were not addressed are discussed in this section: the link between the consistency index K and the low behavior index n of the Herschel–Bulkley model, the effect of the tailings type on the relationship between the UCS and the SME and the applicability of the concept of SME for predicting the evolution of the rheological properties of CPB along the distribution system and of the mixing time required for CPB preparation in the laboratory.

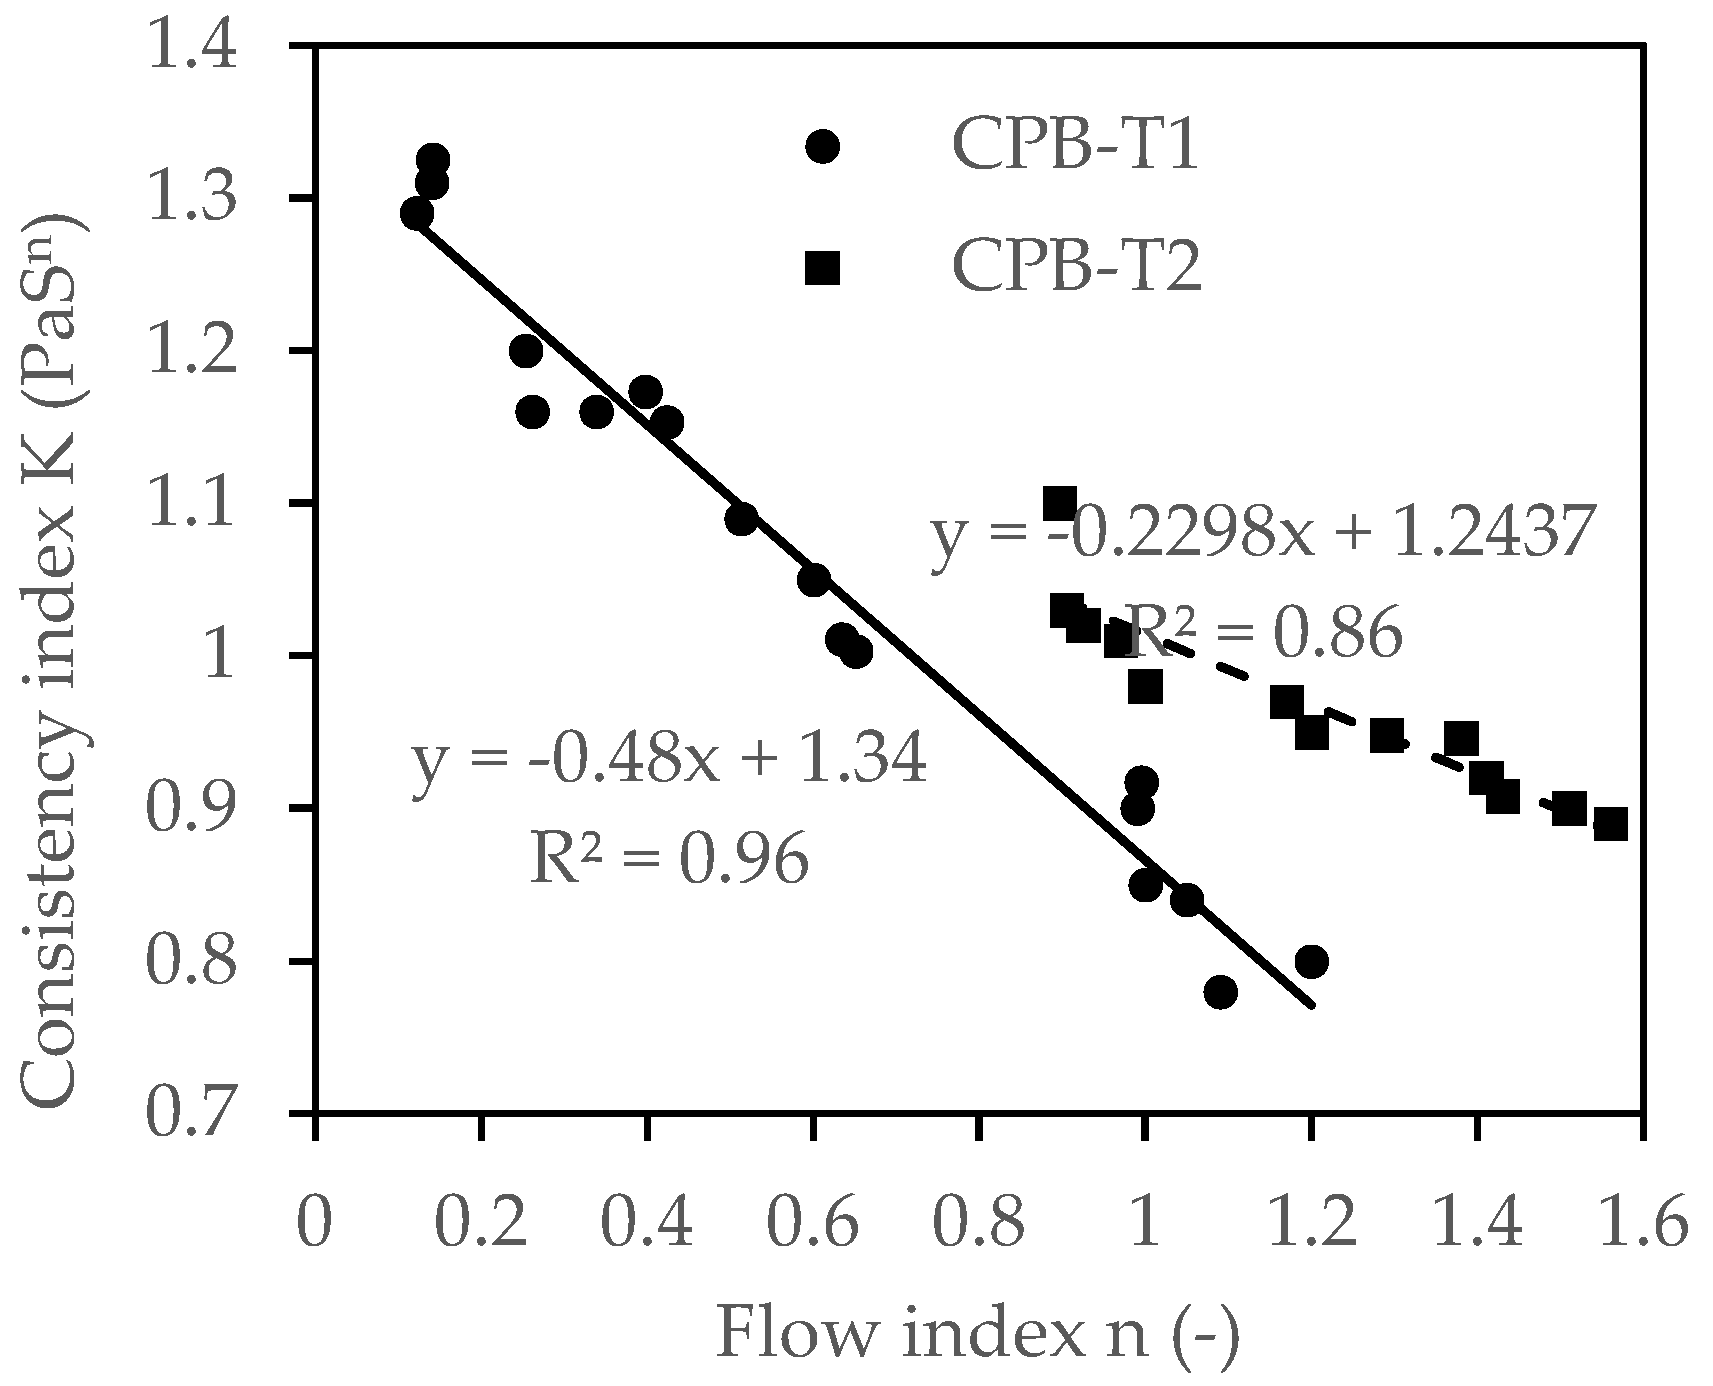
4.1. Link between Consistency (K) and Flow Behavior (n) Indexes

As mentioned, the emphasis was put on yield stress (τ0), infinite viscosity and on the flow index (n) of the Herschel-Bulkley model to illustrate the impact of mixing energy on the rheological properties of the CPB, without specifically considering the consistency index K. Consideration of this consistency index K may be essential, particularly in the theoretical design of CPB transport systems [51,52,53]. As discussed below in Section 4.3, the consistency index is involved in the calculation of the pressure gradient and pumping pressure. K is linked to n [54,55]. Figure 10 shows the correlation between the consistency index (K) and the flow index (n).
The consistency index K decreases linearly with increasing flow index (n). The negative slope of the correlation line depends on the type of tailings: 23% for CPB-T2 compared to 48% for CPB-T1. Rather than linear relationships, a decreasing logarithmic relationship between K values (ranging between 0.001 and 30 Pasn) and n (values between 0.5 and 3.3) was found for CPB mixtures prepared at a solids content Cw of 80% with tailings T1 and incorporating superplasticizers [54]. The linearity observed in Figure 10 is linked to the small range of K and n values obtained for the CPB mixtures involved in this study (0.78 Pasn ≤ K ≤ 1.33 Pasn and 0.12 ≤ n ≤ 1.56). In all cases, the K-n correlation is specific to each material.

4.2. Effect of the Type of Tailings on the Variation of the Unconfined Compressive Strength (UCS) with the SME

The influence of the SME on the UCS of CPB is different depending on the type of tailings used in the mixtures. Figure 8 shows that the UCS were higher for CPB-T1 than CPB-T2 mixtures at curing times of 7, 28 and 90 days. This would be explained in particular by the higher solids content in CPB-T1 (75%) than CPB-T2 (70%) mixtures and by the higher density of the cured specimen for CPB-T1 than CPB-T2 (see Figure 9).
The size distribution of tailings used for the CPB preparation is another parameter that can influence the process of acquiring mechanical strength [7,56,57]. As shown in the companion paper [29], the coefficient of uniformity (CU) can be used to assess this distribution of grain size. The higher this coefficient, the better the solid grains are distributed according to their size in mass of the CPB. The solid grain size of T1 with a coefficient of uniformity (CU) of 9 is, therefore, well distributed compared to T2 with a CU of 6. The proportion of the ultrafine fraction P20µm is lower in T1(36%) than T2 (49%) in T2). The relative density of solids grains is higher for T1 (3.14) than T2 (2.97) which possibly leads to the addition of a larger quantity of binder T1 (the binder content being similar for all mixtures: 4.5%). This could explain the better acquisition of the mechanical resistance of the CPB-T1 [7,58].
Furthermore, the mineral phases in the tailings can explain this influence of the type of tailings both on the density and on the UCS of the CPB. Indeed, the results of the X-ray diffraction analysis showed that clay minerals of the family of silicates such as chlorite and muscovite are more preponderant in T2 (19%) compared to T1 (8%). As previously pointed out by [23], the high water-retention capacity of silicates could also explain the relatively low density and UCS values of CPB-T2.
Finally, chemical analyzes revealed a predominance of total sulfur content (14%) in T1 compared T2 (7%) [29]. Raising the total sulfur content in tailings can promote the development of CPB in the short and medium term [59,60]. This supports the values of UCS higher for T1 than T2.

4.3. Practical Application 1: Preliminary Prediction of the Change in Rheological Properties of CPB along the Distribution System

The results of this study help in understanding the SME effects on the rheological and mechanical properties of CPB. When preparing a given CPB mixture in the laboratory, the rheological properties after mixing should be representative of those that the CPB would have at the point of the deposit underground. After the CPB has been prepared at the backfill plant, it continues to undergo shearing in pipelines and boreholes during its transportation before being deposited. This shearing is induced by the internal shearing between neighboring layers in the CPB matrix and the friction on the wall of the pipeline/borehole. This results in a pressure drop accompanied by energy dissipation in the form of heat. Determining this specific energy dissipation is important in mine backfill operations. First, it allows optimal transport of CPB by considering its impact on changes in the rheological properties. Second, the CPB optimization process in the laboratory must ensure that the mixture used to assess the UCS has the same rheological properties as those of CPB deposited underground.

4.3.1. Assessing the Specific Energy Dissipation during CPB Transportation

During the pipeline flow of CPB, which is a non-Newtonian and incompressible fluid, the principle of energy conservation per unit of mass along the pipe can be expressed by the generalized Bernoulli equation [61,62]:
g Δ Z + 1 2 Δ ( u 2 ) + P r 1 P r 2 dP r ρ + W e + F = 0
In this equation, g (m/s2) is the gravitational acceleration, z (m) the elevation, u (m/s) the flow speed, Pr (N/m2) the pressure, and ρ (kg/m3) the density. The mathematical expressions gΔZ (m2/s2 ou J/kg, 1/2 Δ(u2)(m2/s2 ou J/kg), ∫dPr)/ρ (J/kg) represent the potential energy, kinetic energy, and pressure energy per unit of mass, respectively. We represents the energy supplied by an external source (pump or turbine, if applicable) to compensate for the pressure losses and ∑F (J/kg) is the dissipation of the specific energy and can be deduced from the Darcy–Weisbach equation as follows [52,63]:
F = 2 f F Lu 2 d = Jg
where J (m) represents the linear head loss over the whole line, also called regular pressure drops. L (m) and d (m) represent the total length and diameter of the pipe/borehole, respectively. fF is the coefficient of friction. Different authors have developed empirical expressions making it possible to determine it for different types of Newtonian and non-Newtonian fluids [13,51,52,64,65]. For Herschel–Bulkley fluids, the coefficient of friction fF required in Equation (5) to determine the head loss J (m) can be estimated as follows for laminar flow [52,66]:
f F = 64 Re + 64 Re [ He [ 36 + ( 1.5 / n ) 2.46 ] 0.5 Re ] 0.958 n / ( 2 n )
Re = 8   D n u 2 n ρ K ( 0.5 n 1 + 3 n ) n
He = D 2 ρ K ( τ 0 K ) ( 2 n ) / n
where He and Re are the Hedstrom and Reynolds numbers, respectively.
The flow is assumed to be linear if the Reynolds number Re remains below a critical value Recr that was defined by [52]. Once J is determined, the pressure drop in the pipe/borehole can then be written as follows:
P r = ρ gJ
However, it has been shown that in paste transport, the solid phase generally constitutes the contact load (particles supported by granular contact) and that water is used as a lubricant to facilitate transport [67]. In this case, the specific transport energy ∑F (in Wh/kg = 3600 J/kg) can be calculated using the dry mass of the solid phase of the CPB [67,68,69]:
F = ( P r L ) 10 3 3.6 C w ρ × l
where l (km) is the distance travelled by the CPB at a given time t, and Cw is the solid content (%), ρ is in kg/m3, and ∆Pr/L is in kPa/m.

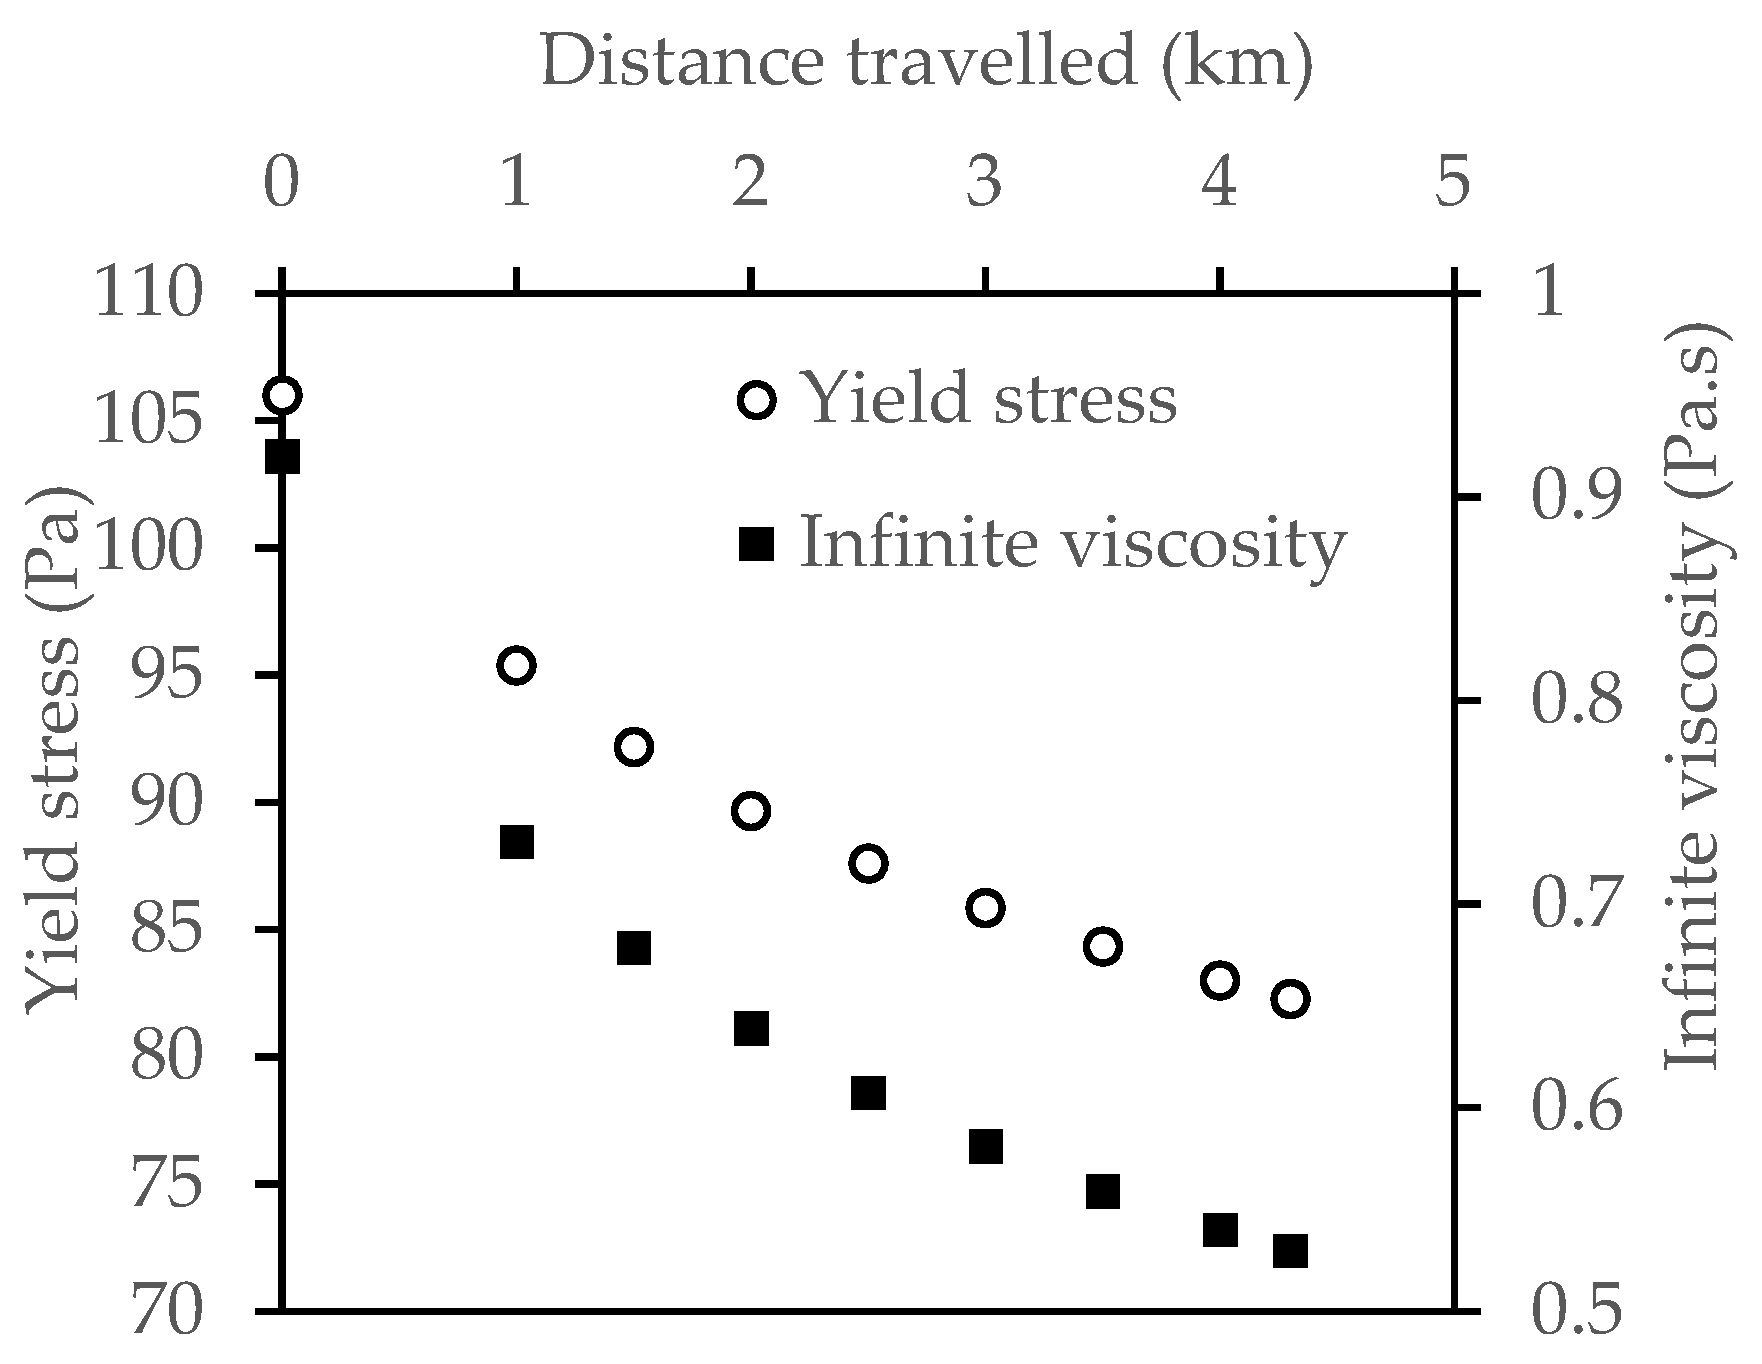
4.3.2. Prediction of the Change in Yield Stress and Infinite Viscosity of CPB along the Pipeline

The variation in the rheological properties of CPB along the pipeline is a complex process that would depend on the combined effects of internal shearing, pipe wall friction, geothermal gradient and even binder hydration. Indeed, laboratory tests showed an increase in yield stress with increasing of temperature and curing time of CPB [24,70]. However, field measurements demonstrated that the decrease in rheological properties caused by friction shear can predominate over temperature and binder hydration effects during CPB transport [45]. In the field, a reduction in the yield stress of 150 Pa was measured over distances travelled of 3.5 km and 1 km for two mines, A and B, respectively [45]. The difference in the distance travelled for the same drop in yield stress would be due in particular the pressure drop (ΔPr/L) that was 3.2 times greater in mine B than in mine A. The prediction of this change in the rheological properties CPB along the pipeline constitutes an interesting issue.
Assuming that the total specific field energy (SFE) and the specific mixing energy (SME) in the laboratory have similar effects on the rheological properties of CPB, the change in rheological properties of CPB along the pipeline can be predicted using the SFE calculated above, and the empirical equations presented in Figure 7 (valid for SME ≤ 3.8 Wh/kg). To illustrate this exercise, the characteristics of the CPB transport system (diameter, length of the pipe to a given stope and average fluid flow speed) of the mine where T1 were sampled and the rheological properties of mixture M02 (see Table 2) were used.
For the entry data given in Table 2, the critical Reynolds number Recr was estimated at 4214 while the Reynolds number Re calculated with Equation (7) equals to 303, indicating a laminar flow (Re < Recr). A linear pressure drop ∆Pr/L of 4.85 kPa/m was thus determined using Equation (9). According to Equation (10), a SFE (i.e., ∑F) ≤ SME = 3.8 Wh/kg leads to a CPB distribution system with l ≤ 4.3 km. Figure 11 below shows the variation of yield stress and infinite viscosity of mixture M02 depending on the travel distance l.
Figure 11 shows that yield stress and infinite viscosity decrease with increasing travel distance of the CPB in the pipeline and boreholes. Over a travel distance of 4.3 km, a decrease in infinite viscosity of 0.4 Pa.s (from 0.92 to 0.52 Pa.s) and in yield stress of 24 Pa (from 106 to 82 Pa) was observed. This prediction approach of the rheological properties along the pipeline remains preliminary as it does not consider a few factors including the impact of temperature change considering that the rheological properties of CPB are temperature dependent [24,71,72,73]. The temperature changes within the CPB material during its transportation along the pipeline are induced by wall friction, internal shearing, external heat exchanges (including geothermal gradient), as demonstrated by [74].

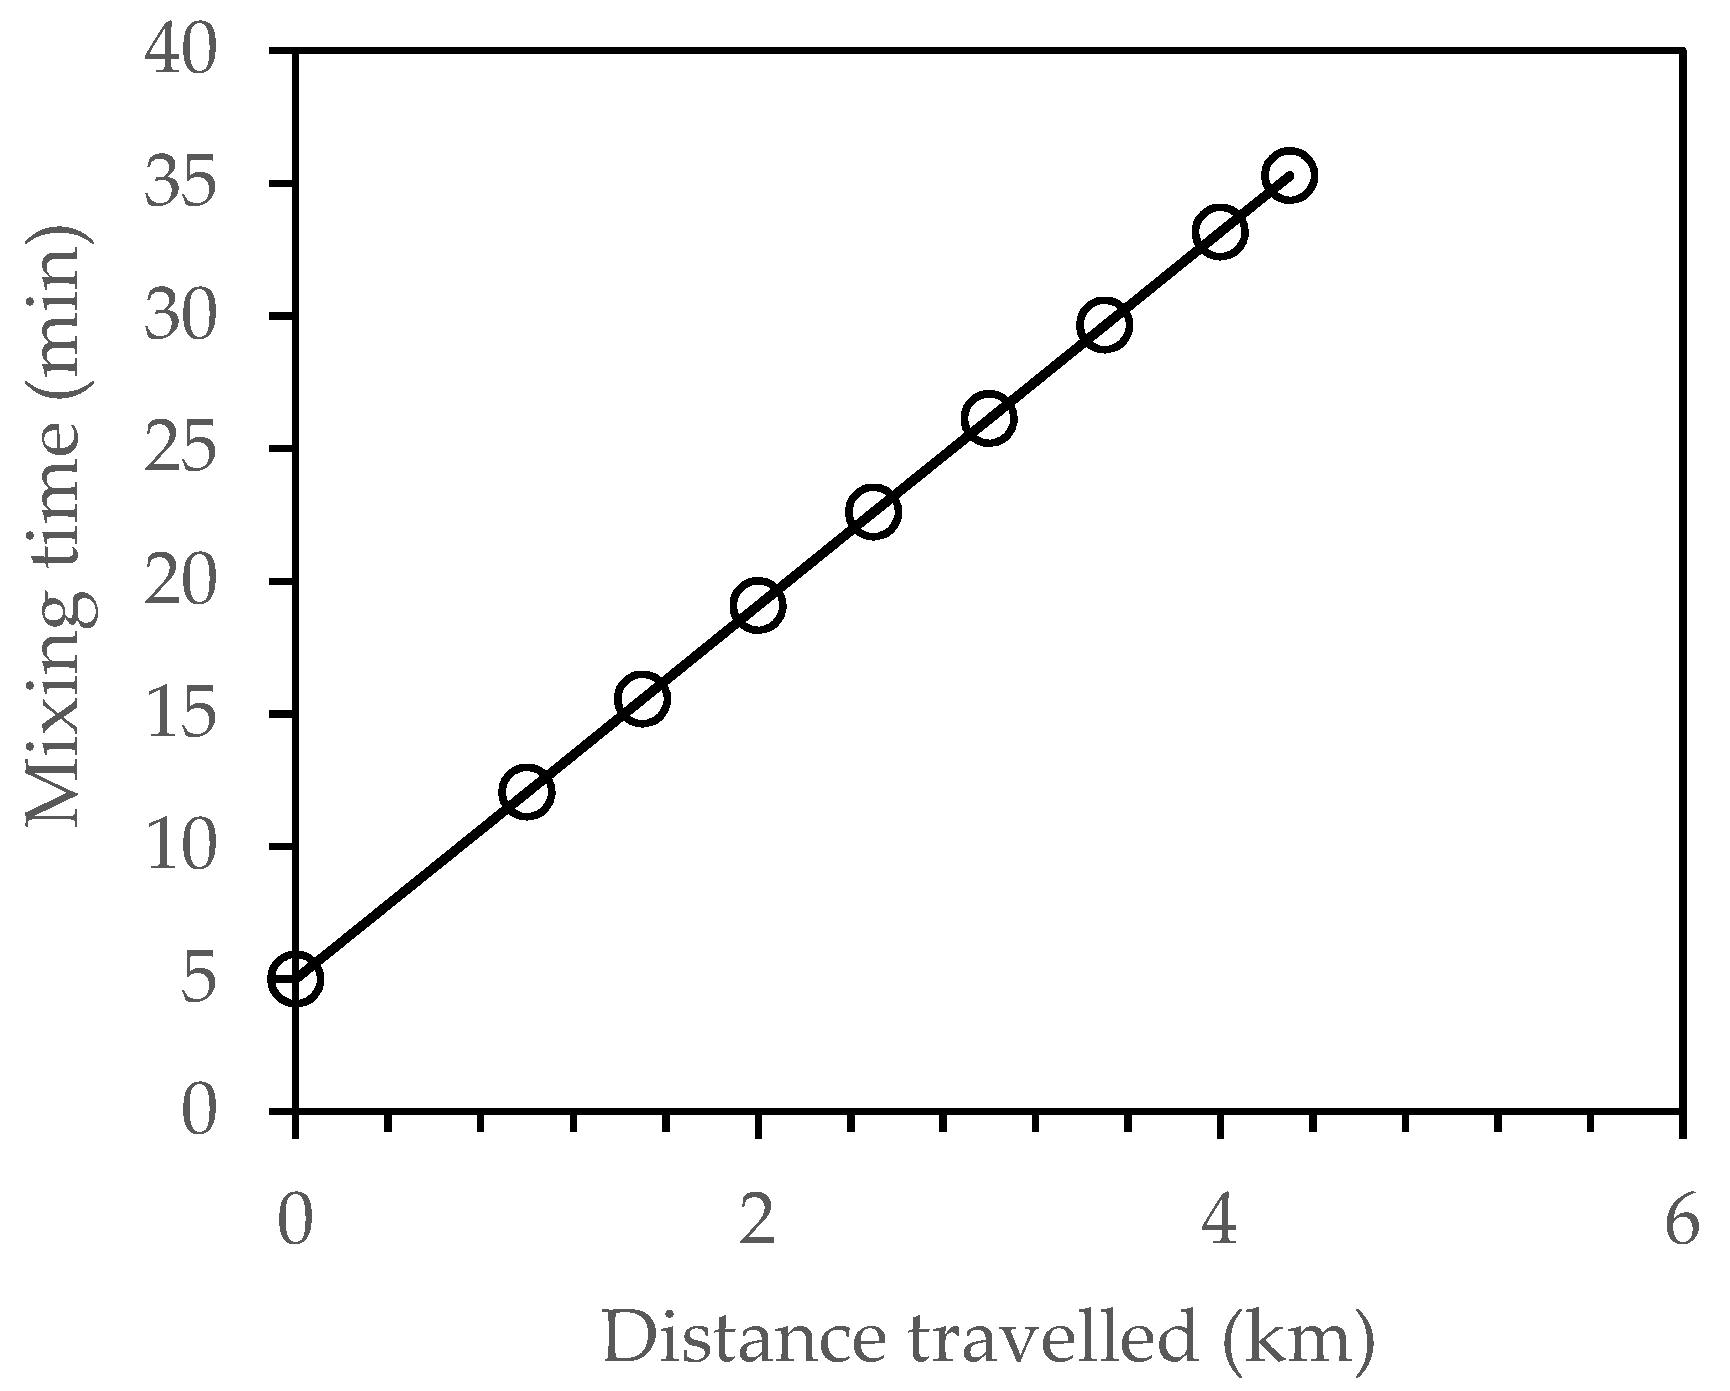
4.4. Practical Application 2: Assessment of Mixing Time during the Optimization Phase of CPB in the Laboratory

Even if scale effects, which affect the hardening of the CPB (after deposit), cannot easily be reproduced in the laboratory, it would be important that the properties of CPBs prepared in the laboratory are representative of those of CPBs deposited underground. This can be achieved by optimizing the specific energy used during the mixing process in the laboratory, particularly by controlling mixing time. To do this, one needs to reproduce, in the laboratory, the energy dissipated during the transport of CPB (see Equation (10)). However, the laboratory mixing SME can be expressed in terms of the mixing parameters by the following equation in the case of CPB-T1 mixtures (an equivalent equation was also developed for CPB-T2) [29]:
SME T 1 = t   0.663 10000 ( 1.07 m 2 19.64 m + 110.01 m 0.001 m )
with SME in Wh/kg, the mixing time t in min, the mixing speed Ω in rpm, and the load mass m in kg.
In the case of mixture M02 (see data in Table 1 and Table 2), Figure 12 shows the mixing time required in the laboratory to obtain a CPB recipe representative of field conditions (in terms of specific energy) changes with respect to the travel distance (or pipe length to the stope to be backfilled), when the Omcan mixer rotates at 166 rpm.
Results presented in Figure 12 are valid for a load mass 4.7 kg (see Table 1). It can be observed that the required mixing time increases with the distance travelled by the CPB. Thus, to backfill a stope located at a distance of 1 km from the backfill plant, for example, M02 must be mixed for 12 min at a speed of 166 rpm with the Omcan mixer used in this study. We suggest that mixing procedures be changed in all laboratories where constant mixing time and speed are generally applied, irrespective of the load mass and travel distance. However, it should be noted that the result presented in Figure 12 does not make it possible to determine the optimal mixing time that guarantees the best rheological and mechanical properties (as presented in Figure 7 and Figure 8). Rather, results show the mixing time that makes it possible to obtain a CPB recipe which represents the reality of field conditions (in terms of equal specific energy in the laboratory and field).

5. Conclusions

This paper assesses the individual effects of mixing parameters (mixing time and mixing speed) on the rheological and mechanical properties of CPB prepared with two tailings (CPB-T1 and CPB-T2), at respective solids contents of 75% and 70%, and binder content of 4.5% (a blend of 20% GU and 80% slag was used as binder). The emphasis was placed on yield stress, infinite viscosity, and flow index. The mechanical strength of the CPB was determined by measuring the UCS of CPB specimens cured at 7, 28 and 90 days. The results showed that increasing the mixing time and speed has a positive effect on both the rheological and mechanical properties of the CPB prepared in the Omcan mixer. Indeed, the increase in mixing time and speed resulted in a decrease in yield stress and in the flow behavior index (according to the Herschel–Bulkley model), a decrease in infinite viscosity (according to the Cross model), as well as in an increase of the UCS. This behavior is justified by more homogeneous mixtures between the different constituents of the CPB prompted by intense mixing energy.
Subsequently, the three mixing parameters were expressed in terms of specific mixing energy (SME) and its influence on the rheological and mechanical properties of CPB was shown. It was observed that increasing the SME has a positive effect on the rheological and mechanical properties for both CPB-T1 and CPB-T2. This behavior of the CPB following the increase in the SME could be explained by the deflocculating mechanism of the particles of the binder and of the tailings, due to the higher shear stresses induced by the paddles of the mixer.
Practical applications of the results ensuing from this study were discussed in conjunction with those presented in the companion paper [29]. The results allow for a preliminary prediction of the variation of the rheological properties of CPB during its transportation in pipelines and boreholes and suggest a mixing procedure for obtaining CPB mixtures that are representative of CPB deposited underground at mine stopes.

Author Contributions

Conceptualization, M.M., T.B. and R.K.D.; methodology, R.K.D. and M.M.; validation, R.K.D. and M.M.; formal analysis, R.K.D.; investigation, R.K.D.; resources, M.M.; data curation, R.K.D. and M.M.; writing—original draft preparation, R.K.D.; writing—review and editing, M.M. and T.B.; visualization, R.K.D. and M.M.; supervision, M.M. and T.B.; project administration, M.M.; funding acquisition, M.M. All authors have read and agreed to the published version of the manuscript.

Funding

This research was funded by the NSERC (Discovery Grants Program–RGPIN-2015-05172 to Mbonimpa) at https://www.nserc-crsng.gc.ca/professors-professeurs/grants-subs/dgigp-psigp_eng.asp.

Acknowledgments

The authors would like to thank Benjamin Aubin (UQAT), who greatly helped with the electrical installation of the wattmeter. The authors would also like to acknowledge the contribution of the copy editor, Margaret McKyes.

Conflicts of Interest

The authors declare no conflict of interest. The funders had no role in the design of the study; in the collection, analyses, or interpretation of data; in the writing of the manuscript, or in the decision to publish the results.

References

  1. Hassani, F.; Archibald, J. Mine Backfill (on CD-ROM); Canadian Institute of Mining, Metallurgy and Petroleum: Montreal, QC, Canada, 1998. [Google Scholar]
  2. Belem, T.; Benzaazoua, M.; Bussière, B. Mechanical behaviour of cemented paste backfill. In Proceedings of the 53rd Annual Conference of the Canadian Geotechnical Society, Montreal, QC, Canada, 15–18 October 2000; Volume 1, ISBN 0-920505-15-5. [Google Scholar]
  3. Landriault, D. The present state of paste fill in Canadian underground mining. In Proceedings of the 97th Annual General Meeting of CIM Rock Mechanics and Strata Control, Halifax, NS, Canada, 14–18 May 1995; pp. 229–238. [Google Scholar]
  4. Landriault, D.; Verburg, R.; Cincilla, W.; Welch, D. Paste technology for underground backfill and surface tailings disposal applications. In Proceedings of the Short Course Notes in CIM Technical Workshop, Vancouver, BC, Canada, 27 April 1997; p. 120. [Google Scholar]
  5. Belem, T.; El Aatar, O.; Bussière, B.; Benzaazoua, M. Gravity-driven 1-D consolidation of cemented paste backfill in 3-m-high columns. Innov. Infrastruct. Solut. 2016, 1, 37. [Google Scholar] [CrossRef] [Green Version]
  6. Tariq, A.; Yanful, E.K. A review of binders used in cemented paste tailings for underground and surface disposal practices. J. Environ. Manag. 2013, 131, 138–149. [Google Scholar] [CrossRef]
  7. Benzaazoua, M.; Fall, M.; Belem, T. A contribution to understanding the hardening process of cemented pastefill. Miner. Eng. 2004, 17, 141–152. [Google Scholar] [CrossRef]
  8. Benzaazoua, M.; Belem, T.; Bussière, B.; Ouellet, S. Évolution des propriétés des remblais en pâte: Principaux paramètres d’influence. In Proceedings of the 20th Colloque en Contrôle de Terrain, Association Minière du Québec, Val d’Or, QC, Canada, 22–23 March 2005; p. 23. [Google Scholar]
  9. Ercikdi, B.; Kesimal, A.; Cihangir, F.; Deveci, H.; Alp, İ. Cemented paste backfill of sulphide-rich tailings: Importance of binder type and dosage. Cem. Concr. Compos. 2009, 31, 268–274. [Google Scholar] [CrossRef]
  10. Hashem, M. Study on the Homogenization Speed in a Tank Equipped with Maxblend Impeller. Master’s Thesis, École Polytechnique de Montréal, Montreal, QC, Canada, 2012. [Google Scholar]
  11. Nguyen, Q.; Boger, D. Application of rheology to solving tailings disposal problems. Int. J. Miner. Process. 1998, 54, 217–233. [Google Scholar] [CrossRef]
  12. Wennberg, T.; Sellgren, A. Pumping evaluations with paste tailings thickened close to the surface disposal area. In Proceedings of the 17th International Conference on the Hydraulic Transport of Solids, Cape Town, South Africa, 7–10 May 2007; pp. 561–574. [Google Scholar]
  13. Paterson, A. Pipeline transport of high-density slurries: A historical review of past mistakes, lessons learned and current technologies. Min. Technol. 2012, 121, 37–45. [Google Scholar] [CrossRef]
  14. Han, D.; Ferron, R.D. Influence of high mixing intensity on rheology, hydration, and microstructure of fresh state cement paste. Cem. Concr. Res. 2016, 84, 95–106. [Google Scholar] [CrossRef] [Green Version]
  15. Yang, M.; Jennings, H. Influences of mixing methods on the microstructure and rheological behavior of cement paste. Adv. Cem. Based Mater. 1995, 2, 70–78. [Google Scholar] [CrossRef]
  16. Banfill, P.; Swift, D. The effect of mixing on the rheology of cement-based materials containing high performance superplasticisers. In Proceedings of the Nordic Rheology Conference, Reykjavik, Iceland, 4–6 August 2004; pp. 9–20. [Google Scholar]
  17. Schießl, P.; Mazanec, O.; Lowke, D. SCC and UHPC—Effect of Mixing Technology on Fresh Concrete Properties. In Advances in Construction Materials 2007; Grosse, C.U., Ed.; Springer: Berlin, Germany, 2007; pp. 513–522. [Google Scholar]
  18. Mazanec, O.; Lowke, D.; Schießl, P. Mixing of high-performance concrete: Effect of concrete composition and mixing intensity on mixing time. Mater. Struct. 2010, 43, 357–365. [Google Scholar] [CrossRef]
  19. Wallevik, J.E.; Wallevik, O.H. Analysis of shear rate inside a concrete truck mixer. Cem. Concr. Res. 2017, 95, 9–17. [Google Scholar] [CrossRef]
  20. Dils, J.; De Schutter, G.; Boel, V. Influence of mixing procedure and mixer type on fresh and hardened properties of concrete: A review. Mater. Struct. 2012, 45, 1673–1683. [Google Scholar] [CrossRef]
  21. Fládr, J.; Bílý, P. Influence of mixing procedure on mechanical properties of high-performance concrete. In Proceedings of the IOP Conference Series: Materials Science and Engineering, Fibre Concrete 2017, Prague, Czech Republic, 13–16 September 2017; Volume 246, p. 012012. [Google Scholar]
  22. Benzaazoua, M.; Ouellet, J.; Servant, S.; Newman, P.; Verburg, R. Cementitious backfill with high sulfur content physical, chemical, and mineralogical characterization. Cem. Concr. Res. 1999, 29, 719–725. [Google Scholar] [CrossRef]
  23. Kesimal, A.; Yilmaz, E.; Ercikdi, B.; Alp, I.; Deveci, H. Effect of properties of tailings and binder on the short-and long-term strength and stability of cemented paste backfill. Mater. Lett. 2005, 59, 3703–3709. [Google Scholar] [CrossRef]
  24. Wu, D.; Fall, M.; Cai, S. Coupling temperature, cement hydration and rheological behaviour of fresh cemented paste backfill. Miner. Eng. 2013, 42, 76–87. [Google Scholar] [CrossRef]
  25. Koohestani, B.; Belem, T.; Koubaa, A.; Bussière, B. Experimental investigation into the compressive strength development of cemented paste backfill containing Nano-silica. Cem. Concr. Compos. 2016, 72, 180–189. [Google Scholar] [CrossRef]
  26. Deng, X.; Zhang, J.; Klein, B.; Zhou, N.; Dewit, B. Experimental characterization of the influence of solid components on the rheological and mechanical properties of cemented paste backfill. Int. J. Miner. Process. 2017, 168, 116–125. [Google Scholar] [CrossRef]
  27. Ouattara, D.; Belem, T.; Mbonimpa, M.; Yahia, A. Effect of superplasticizers on the consistency and unconfined compressive strength of cemented paste backfills. Constr. Build. Mater. 2018, 181, 59–72. [Google Scholar] [CrossRef]
  28. Ouattara, D.; Yahia, A.; Mbonimpa, M.; Belem, T. Effects of superplasticizer on rheological properties of cemented paste backfills. Int. J. Miner. Process. 2017, 161, 28–40. [Google Scholar] [CrossRef]
  29. Dikonda, R.K.; Mamert, M.; Tikou, B. Specific mixing energy of cemented paste backfill: Part I. Laboratory determination and influence on the consistency. Minerals. submitted.
  30. Pullum, L. Pipelining tailings, pastes, and backfill. In Proceedings of the Paste 2007: The Tenth International Seminar on Paste and Thickened Tailings, Perth, Australia, 13–15 March 2007. [Google Scholar]
  31. Schmidt, C.; Thieme, J.; Neuhäusler, U.; Jacobsen, C.; Kaulich, B.; Salome, M.; Susini, J. Spectromicroscopy of soil colloids. J. Phys. IV Fr. 2003, 104, 405–408. [Google Scholar] [CrossRef]
  32. Coussot, P. Rhéophysique: La Matière dans Tous ses États; CNRS Éditions: Paris, France, 2012. [Google Scholar]
  33. Yilmaz, E.; Belem, T.; Bussière, B.; Benzaazoua, M. Relationships between microstructural properties and compressive strength of consolidated and unconsolidated cemented paste backfills. Cem. Concr. Compos. 2011, 33, 702–715. [Google Scholar] [CrossRef]
  34. Varma, M. Effect of Change in Mixing Time of Mixer on Wet Density, Dry Density, Workability and Compressive Strength of M-20 Grade Concrete. Int. J. Eng. Res. Technol. 2016, 5, 71–78. [Google Scholar]
  35. Yang, L.; Wang, H.; Wu, S.; Wu, A.; Wang, Y.; Zhou, X.; Zhang, L.; Yang, X. The effects of mixing time on cement paste slurry transport and mechanical property. In Proceedings of the Paste 2017: The 20th International Seminar on Paste and Thickened Tailings, Beijing, China, 15–18 June 2017; pp. 141–148. [Google Scholar]
  36. Mahboub, K.; Cutshaw, Q. Effects of Fresh Concrete Temperature and Mixing Time on Compressive Strength of Concrete. Mater. J. 2001, 98, 59–62. [Google Scholar]
  37. Clark, C.; Vickery, J.; Backer, R.R. Transport of Total Tailings Paste Backfill: Results of Full-Scale Pipe Test Loop Pumping Tests. Report of Investigation RI 9593; United States Department of the Interior: District of Columbia, DC, USA, 1995.
  38. Gawu, S.K.; Fourie, A. Assessment of the modified slump test as a measure of the yield stress of high-density thickened tailings. Can. Geotech. J. 2004, 41, 39–47. [Google Scholar] [CrossRef]
  39. Alejo, B.; Barrientos, A. Model for yield stress of quartz pulps and copper tailings. Int. J. Miner. Process. 2009, 93, 213–219. [Google Scholar] [CrossRef]
  40. Ouattara, D.; Mbonimpa, M.; Belem, T. Rheological Properties of Thickened Tailings and Cemented Paste Tailings and the Effect of Mixture Characteristics on Shearing Behaviour. In Proceedings of the 63rd Canadian Geotechnical Conference and 1st Joint CGS/CNC-IPA Permafrost Specialty Conference, Calgary, AB, Canada, 12–16 September 2010; pp. 12–16. [Google Scholar]
  41. Wu, A.; Wang, Y.; Wang, H. Estimation model for yield stress of fresh uncemented thickened tailings: Coupled effects of true solid density, bulk density, and solid concentration. Int. J. Miner. Process. 2015, 143, 117–124. [Google Scholar] [CrossRef]
  42. Barnes, H.A.; Hutton, J.F.; Walters, K. An Introduction to Rheology; Elsevier: Amsterdam, The Netherlands, 1989; Volume 3. [Google Scholar]
  43. Yang, L.; Wang, H.; Li, H.; Zhou, X. Effect of high mixing intensity on rheological properties of cemented paste backfill. Minerals 2019, 9, 240. [Google Scholar] [CrossRef] [Green Version]
  44. Takahashi, K.; Bier, T.A. Mechanisms of degradation in rheological properties due to pumping and mixing. Adv. Civ. Eng. Mater. 2014, 3, 25–39. [Google Scholar] [CrossRef]
  45. Creber, K.J.; McGuinness, M.; Kermani, M.F.; Hassani, F.P. Investigation into changes in pastefill properties during pipeline transport. Int. J. Miner. Process. 2017, 163, 35–44. [Google Scholar] [CrossRef]
  46. Vandanjon, P.-O.; de Larrard, F.; Dehousse, B.; Villain, G.; Maillot, R.; Laplante, P. Homogénéisation des bétons en centrale de fabrication discontinue. Influence du temps de malaxage et du mode d’introduction des additions minérales. Bull.-Lab. Des. Ponts Chaussées 2000, 228, 35–46. [Google Scholar]
  47. Chopin, D. Malaxage des Bétons à Hautes Performances et des Bétons Auto-Plaçants: Optimisation du Temps de Fabrication. Ph.D. Thesis, École Centrale de Nantes et Université de Nantes, Nantes, France, 2003. [Google Scholar]
  48. Lea, F. The Chemistry of Cement and Concrete; Chemical Publishing Company: New York, NY, USA, 1971. [Google Scholar]
  49. Van Kesteren, W.; Talmon, A.; Pennekamp, J.G.; Costello, M.; Flynn, W. Dredged material placement under non-segregating conditions. In Proceedings of the Eighteenth World Dredging Congress (WODCON XVIII), Lake Buena Vista, FL, USA, 27 May–1 June 2007; pp. 1559–1570. [Google Scholar]
  50. Pirouz, B.; Kavianpour, M.R.; Williams, P. Sheared and un-sheared segregation and settling behavior of fine sand particles in hyperconcentrated homogeneous sand-water mixture flows. J. Hydraul. Res. 2008, 46, 105–111. [Google Scholar] [CrossRef]
  51. Swamee, P.K.; Aggarwal, N. Explicit equations for laminar flow of Bingham plastic fluids. J. Pet. Sci. Eng. 2011, 76, 178–184. [Google Scholar] [CrossRef]
  52. Swamee, P.K.; Aggarwal, N. Explicit equations for laminar flow of Herschel–Bulkley fluids. Can. J. Chem. Eng. 2011, 89, 1426–1433. [Google Scholar] [CrossRef]
  53. Garcia, E.J.; Steffe, J.F. Comparison of friction factor equations for non-newtonian fluids in pipe flow. J. Food Process. Eng. 1986, 9, 93–120. [Google Scholar] [CrossRef]
  54. Ouattara, D.; Mbonimpa, M.; Yahia, A.; Belem, T. Assessment of rheological parameters of high density cemented paste backfill mixtures incorporating superplasticizers. Constr. Build. Mater. 2018, 190, 294–307. [Google Scholar] [CrossRef]
  55. Björn, A.; de La Monja, P.S.; Karlsson, A.; Ejlertsson, J.; Svensson, B.H. Rheological characterization. Biogas 2012, 1, 63–76. [Google Scholar]
  56. Belem, T.; Benzaazoua, M.; El Aatar, O.; Yilmaz, E.; Belem, T.; Benzaazoua, M.; El Aatar, O.; Yilmaz, E. Effect of drainage and the pore water pressure dissipation on the backfilling sequencing. In Proceedings of the 23rd World Mining Congress, Montreal, QC, Canada, 11–15 August 2013; pp. 1–10. [Google Scholar]
  57. Hane, I.; Belem, T.; Benzaazoua, M.; Maqsoud, A. Laboratory investigation into the compressive strength of cemented paste tailings aggregate fills. In Proceedings of the First International Conference on Underground Mining Technology, Sudbury, ON, Canada, 11–13 October 2017; pp. 363–373. [Google Scholar]
  58. Fall, M.; Benzaazoua, M.; Ouellet, S. Experimental characterization of the influence of tailings fineness and density on the quality of cemented paste backfill. Miner. Eng. 2005, 18, 41–44. [Google Scholar] [CrossRef]
  59. Benzaazoua, M.; Belem, T.; Ouellet, S.; Fall, M. Utilisation du remblai en pâte comme support de terrain. Partie II: Comportement à court, a moyen et à long terme. In Proceedings of the Après-Mines, Nancy, France, 5–7 February 2003. [Google Scholar]
  60. Benzaazoua, M.; Belem, T.; Bussiere, B. Chemical factors that influence the performance of mine sulphidic paste backfill. Cem. Concr. Res. 2002, 32, 1133–1144. [Google Scholar] [CrossRef]
  61. Bouzaiene, R. On the Flow Mechanics of Mine Backfill Slurries in Pipelines; McGill University Libraries: Montréal, QC, Canada, 1995. [Google Scholar]
  62. Qi, C.; Chen, Q.; Fourie, A.; Zhao, J.; Zhang, Q. Pressure drop in pipe flow of cemented paste backfill: Experimental and modeling study. Powder Technol. 2018, 333, 9–18. [Google Scholar] [CrossRef]
  63. Valiantzas, J.D. Explicit power formula for the Darcy–Weisbach pipe flow equation: Application in optimal pipeline design. J. Irrig. Drain. Eng. 2008, 134, 454–461. [Google Scholar] [CrossRef]
  64. Moody, L.F. Friction factors for pipe flow. Trans. Am. Soc. Mech. Eng. 1944, 66, 671–684. [Google Scholar]
  65. Darby, R. Determination and Utilization of Rheological Properties for Prediction of Flow Behavior of Pseudohomogeneous Slurries. In Proceedings of the 9th ITCOST, STA, Carson City, NV, USA, 21–22 March 1984. [Google Scholar]
  66. Csizmadia, P.; Till, S. The Effect of Rheology Model of an Activated Sludge on to the Predicted Losses by an Elbow. Period. Polytech. Mech. Eng. 2018, 62, 305–311. [Google Scholar] [CrossRef] [Green Version]
  67. Wilson, K.C.; Addie, G.R.; Sellgren, A.; Clift, R. Slurry Transport Using Centrifugal Pumps; Springer Science & Business Media: Berlin/Heidelberg, Germany, 2006. [Google Scholar]
  68. Paterson, A. High density slurry and paste tailings, transport systems. In Proceedings of the International Platinum Conference: Platinum Adding Value, Sun City, South Africa, 3–7 October 2004; pp. 159–166. [Google Scholar]
  69. Ouattara, D. Étude Expérimentale des Propriétés Rhéologiques Et Mécaniques des Remblais Miniers en Pâte Cimentés Incorporant des Superplastifiants. Ph.D. Thesis, Université du Québec en Abitibi-Témiscamingue, Rouyn-Noranda, QC, Canada, 2017. [Google Scholar]
  70. Kalonji, K. Étude des Propriétés Rhéologiques et du Transport du Remblai Cimenté en Pâte en Conditions Nordiques. Master’s Thesis, Université du Québec en Abitibi-Témiscamingue, Rouyn-Noranda, QC, Canada, 2016. [Google Scholar]
  71. Wu, D.; Cai, S.-J.; Huang, G. Coupled effect of cement hydration and temperature on rheological properties of fresh cemented tailings backfill slurry. Trans. Nonferrous Met. Soc. China 2014, 24, 2954–2963. [Google Scholar] [CrossRef]
  72. Kalonji, K.; Mbonimpa, M.; Belem, T.; Benzaazoua, M.; Beya, F.; Ouellet, S. Preliminary investigation of the effect of temperature and salinity on the rheological properties of fresh cemented paste backfills. In Proceedings of the 68th Canadian Geotechnical Conference and 7th Canadian Permafrost Conference, Quebec City, QC, Canada, 21–23 September 2015; pp. 20–23. [Google Scholar]
  73. Xiapeng, P.; Fall, M.; Haruna, S. Sulphate induced changes of rheological properties of cemented paste backfill. Miner. Eng. 2019, 141, 105849. [Google Scholar] [CrossRef]
  74. Kalonji, K.; Mbonimpa, M.; Belem, T.; Benzaazoua, M.; Beya, F.K.; Ouellet, S. Calage D’un Modèle Numérique de Prédiction de L’évolution de la Température Pendant le Transport du Remblai en Pâte Cimenté. In Proceedings of the 69th Conférence Canadienne de Géotechnique: GéoVancouver 2016, Vancouver, BC, Canada, 2–5 October 2016. [Google Scholar]
Figure 1. Installation for recording the power consumed by a laboratory mixer during the preparation of CPB mixtures.
Minerals 11 01159 g001
Figure 2. Effect of mixing time on the downwards flow curves of (a) CPB-T1 and (b) CPB-T2.
Minerals 11 01159 g002
Figure 3. Effect of mixing time on (a) yield stress, (b) flow index and (c) infinite viscosity for CPB-T1 and CPB-T2 mixtures.
Minerals 11 01159 g003
Figure 4. Effect of the mixing time on the UCS for mixtures at curing times of 7, 28 and 90 days for: (a) CPB-T1 and (b) CPB-T2.
Minerals 11 01159 g004
Figure 5. Effect of mixing speed on: (a) yield stress, (b) flow index and (c) infinite viscosity, for CPB-T1 and CPB-T2 mixtures.
Minerals 11 01159 g005
Figure 6. Variation of the unconfined compressive strength (UCS) at curing times of 7, 28 and 90 days with mixing speed for: (a) CPB-T1 and (b) CPB-T2.
Minerals 11 01159 g006
Figure 7. Effect of the SME on: (a) yield stress, (b) infinite viscosity and (c) flow index for CPB-T1 and CPB-T2.
Minerals 11 01159 g007
Figure 8. Effect of SME on UCS at curing times of 7, 28 and 90 days for: (a) CPB-T1 and (b) CPB-T2.
Minerals 11 01159 g008
Figure 9. Effect of the SME on the bulk density of cylindrical probes used to determine the UCS of CPB-T1 and CPB-T2 at a curing time of 7 days.
Minerals 11 01159 g009
Figure 10. Correlation between the consistency index (K) and the flow behavior index (n) of the Herschel–Bulkley model for CPB-T1 and CPB-T2 mixtures presented in Table 1.
Minerals 11 01159 g010
Figure 11. Effect of travel distance on the variation of yield stress and infinite viscosity for mixture M02 (data given in Table 2 with l ≤ 4.3 km).
Minerals 11 01159 g011
Figure 12. Effect of travel distance (between the backfill plant and the stope to be backfilled) on the variation of mixing time for mixture M02 (data given in Table 2 with l ≤ 4.3 km).
Minerals 11 01159 g012
Table 1. Mixtures used to investigate the influence of specific mixing energy (SME) on rheological and mechanical properties of cemented paste backfill (CPB) prepared with CPB-T1 and CPB-T2.
Variable Mixing Parameters Constant Mixing Parameters
CPB-T1
Mixtures
Mixing time (min)
M01
5
M02
7
M03
10
M04
15
M05
30
Mixing speed (166 rpm)
Load mass (4.7 kg)
Mixtures
Mixing speed (rpm)
M06
91
M07
166
M08
282
Mixing time (5 min)
Load mass (4.7 kg)
CPB-T2
Mixtures
Mixing time (min)
M09
5
M10
7
M11
10
M12
15
M13
30
Mixing speed (166 rpm)
Load mass (4.2 kg)
Mixtures
Mixing speed (rpm)
M14
91
M15
166
M16
282
Mixing time (5 min)
Load mass (4.2 kg)
Table 2. Data used to determine the linear pressure drops and the specific energy dissipated during the transport of the CPB-T1 mixture M02.
ParametersValuesParametersValues
Mixing time t (min)7Infinite viscosity μ (Pa.s)0.92
Mixing speed (rpm) 166Hydraulic diameter D (m)0.15
Load mass of mixer m (Kg)4.7Pipeline length L (m) 6445
Yield stress τ 0 (Pa)106Mean flow velocity U (m/s)1
Consistency index K (Pa.sn)1.2Bulk Density ρ (Kg/m3)2043
Flow index n (-)0.97Solids content Cw (%)75
Publisher’s Note: MDPI stays neutral with regard to jurisdictional claims in published maps and institutional affiliations.

