Article

VIS-IR Spectroscopy of Mixtures of Water Ice, Organic Matter, and Opaque Mineral in Support of Small Body Remote Sensing Observations

1
Istituto di Astrofisica e Planetologia Spaziali, Istituto Nazionale di Astrofisica, 00133 Rome, Italy
2
German Aerospace Center (DLR), 12489 Berlin, Germany
3
University Grenoble Alpes, CNRS, IPAG, 38000 Grenoble, France
4
Physique Des Interactions Ioniques et Moléculaires, Aix-Marseille University, UMR CNRS 7345, 13013 Marseille, France
5
Laboratoire d’Astrophysique de Marseille, UMR CNRS 7326, 13013 Marseille, France
6
Institute of Physics and Astronomy, University of Potsdam, 14476 Potsdam-Golm, Germany
7
Physikalisches Institut, University of Bern, 3012 Bern, Switzerland
8
Institut d’Astrophysique Spatiale, Université Paris-Saclay, CNRS, 91405 Orsay, France
9
Osservatorio Astronomico di Capodimonte, Istituto Nazionale di Astrofisica, 80131 Naples, Italy
*
Author to whom correspondence should be addressed.
Submission received: 28 September 2021 / Accepted: 8 October 2021 / Published: 3 November 2021

Abstract

:
Visual-to-infrared (VIS-IR) remote sensing observations of different classes of outer solar system objects indicate the presence of water ice and organics. Here, we present laboratory reflectance spectra in the 0.5–4.2 μ m spectral range of binary particulate mixtures of water ice, organics analogue (kerite), and an opaque iron sulphide phase (pyrrhotite) to investigate the spectral effects of varying mixing ratios, endmember grain size, and mixing modality. The laboratory spectra are also compared to different implementations of the Hapke reflectance model (Hapke, 2012). We find that minor amounts (≲1 wt%) of kerite (investigated grain sizes of 45–63 μ m and <25 μ m) can remain undetected when mixed in coarse-grained (67 ± 31 μ m) water ice, suggesting that organics similar to meteoritic insoluble organic matter (IOM) might be characterized by larger detectability thresholds. Additionally, our measurements indicate that the VIS absolute reflectance of water ice-containing mixtures is not necessarily monotonically linked to water ice abundance. The latter is better constrained by spectral indicators such as the band depths of water ice VIS-IR diagnostic absorptions and spectral slopes. Simulation of laboratory spectra of intimate mixtures with a semi-empirical formulation of the Hapke model suggests that simplistic assumptions on the endmember grain size distribution and shape may lead to estimated mixing ratios considerably offset from the nominal values. Finally, laboratory spectra of water ice grains with fine-grained pyrrhotite inclusions (intraparticle mixture) have been positively compared with a modified version of the Hapke model from Lucey and Riner (2011).

1. Introduction

Water ice and organic compounds have been found to be associated on the surface of several classes of outer solar system objects, encompassing comets, asteroids, icy moons, rings, and trans-Neptunian objects (TNOs), as evidenced by the VIS-IR (visual-to-infrared) spectroscopic observations summarized below.
Remote sensing observations of 67P/Churyumov-Gerasimenko performed by the Rosetta spacecraft [1] revealed a low-albedo surface [2,3] dominated by widespread aliphatic organics [4,5,6], in addition to ammonium salts [7], hydroxylated silicates [8], and opaque minerals [4,5,9], and showed the occurrence of water ice [10,11,12], with local abundances up to ≈50% in resolved features [13], and water ice diurnal and seasonal cycles [14,15,16].
Widespread water ice and organic material have been also identified on the surface of the asteroids (24) Themis and (65) Cybele from ground-based IR observations [17,18,19]. In a similar spectral range, remote sensing observations by the VIR-Dawn spectrometer were used to identify water ice [20,21] and organics [22] in separate locations on the surface of the dwarf planet Ceres.
Mixed with water ice dominating the surfaces of the icy moons and rings of Saturn [23], organic compounds have been identified by means of VIS-IR observations on Iapetus, Phoebe, and Hyperion [24], and references therein], possibly in the C ring [25,26] and Cassini Division [26], and suggested as UV-absorbers for the major moons [23,27] and rings [28,29,30].
Finally, hydrocarbon features have been also identified by VIS-IR spectroscopy on Jupiter’s icy moons Callisto and Ganymede [31,32], and visual color investigations suggest that water ice and organic materials are mixed at the sub-wavelength scale in some TNOs [33].
The investigation of the surface composition and physical properties of a given target from VIS-IR spectroscopy relies on the possibility to compare its spectrum with as large as possible a set of laboratory spectra of samples with known characteristics (e.g., endmember mixing ratios, mixing modality, grain size distribution). Laboratory measurements of the reflectance of water ice-refractory particulate mixtures have been published previously. Visible and near infrared spectra of water ice mixed with high- (kaolinite), medium- (iron oxide rich soil), and low-albedo (charcoal) particulates, showing the variations of spectral continuum and of the depth of water ice absorption bands, were provided by [34]. Ref. [35] measured mixtures of water ice grains with nanometric particles of carbon, iron, and hematite. Recently, methods were developed to produce water ice particles of well-controlled size and shape and mix them with dust components in reproducible ways, as reviewed in [36]. Refs. [37,38] have measured the photometric properties (albedo, spectral slopes) at visible and near infrared wavelengths of particulate mixtures of water ice and refractory materials (Martian soil simulants, charcoal, carbon black) and organic matter analogues (tholin) by systematically changing their relative abundance, the water ice grain sizes, and the mixing modality, with applications to the polar regions of the Moon, Mercury, and small bodies. Visible and near infrared spectroscopy of similar mixtures was performed by [39,40,41]. In addition to the laboratory-based investigations, quantitative estimates of the composition and physical properties of planetary surfaces are often based on the comparison with fits from radiative transfer models [42,43,44], which allow us to simulate the spectral properties of a given surface starting from the endmembers’ optical properties and to simultaneously explore large numbers of combinations that have not been and/or cannot all be produced and measured in the lab. Nonetheless, in this respect, the accuracy of the result depends on the ability of the adopted model to describe the observed spectrophotometric response of a given target as a function of its physical and compositional properties that can be tested by comparison with laboratory measurements on materials with known characteristics.
Starting from these premises, and with the aim to support the spectroscopic investigation of water ice- and organics-bearing planetary surfaces by extending the dataset of laboratory data for direct comparison to past/future remote sensing VIS-IR observations and testing the application of radiative transfer models, we expand previous works by measuring the reflectance spectra of mixtures including water ice and/or organic materials, over a larger (0.5–4.2 μ m) wavelength range. The mixtures were prepared in order to investigate the effects of varying mixing ratios, endmember grain size, and mixing modalities. Here, we present the results of this set of measurements, and, in addition, we compare the laboratory spectra with the outcome of the widely applied Hapke reflectance model [42]. In this respect, we test (1) a semi-empirical implementation of the Hapke theory for intimate mixtures, in order to characterize the ability of this approach to fit the observed spectral behaviour and infer accurate endmember mixing ratios, and (2) we compare the results of two modellizations based on the Effective Medium Theory [45] and on the modification proposed by Lucey and Riner (2011) [46], respectively, to test their ability for describing intraparticle mixtures.
The adopted methods and selected mixture materials are described in Section 2; the spectral behaviour of the investigated mixtures is presented in Section 3; the description of the Hapke model implementations and the outcome of the comparison with the measured spectra are detailed in Section 4; finally, a summary and discussion of the main results are given in Section 5.

2. Methods and Materials

Our measurements were performed at the Cold Surface Spectroscopy facility at IPAG (Institut de Planétologie et d’Astrophysique de Grenoble), taking advantage of the spectro-gonio radiometer SHINE [47], which allowed us to perform measurements of bidirectional reflectance at VIS-IR wavelengths. The SHINE instrument was coupled to the environmental chamber Carbon-IR [48], where the sample was stored at a temperature of 173 K in 1.5 mbar of N 2 . The N 2 gas allows one to keep the sample thermalized at a stable and controlled temperature and prevents frost formation from air humidity re-condensation.
Measurements were performed at “standard” observation geometry (incidence angle = 0 , emission angle = 30 , and phase angle = 30 ). The spectra were recorded over the 0.5–4.2 μ m range with a sampling of 50 nm from 0.5 to 1.0 μ m and 20 nm from 1.0 μ m to 4.2 μ m (except minor sampling differences in a few cases: see spectra and associated information in the SSHADE data repository at https://0-doi-org.brum.beds.ac.uk/10.26302/SSHADE/EXPERIMENT_MC_20181026_1). The spectral resolution was 5 nm for wavelengths up to 0.65 μ m, 10 nm in the 0.65–1.4 μ m interval, 19 nm at 1.4–3.0 μ m, and 39 nm above 3.0 μ m. The absolute photometric accuracy of the SHINE setup is ∼3% in the investigated spectral range (See Section S1 in the Supplementary Material for further details on the experimental setup).
For some of the water ice-free samples, for which the cryogenic setup was not required, the measurements have been performed with the SHADOWS spectro-gonio radiometer, also available at the Cold Surface Spectroscopy facility [49], with a spectral sampling of 20 nm from 0.5 to 4.2 μ m and spectral resolution of 5 nm for wavelengths up to 0.66 μ m, 10 nm in the 0.66–1.42 μ m interval, 19 nm at 1.42–2.66 μ m, and 39 nm above 2.66 μ m.

2.1. Materials

The endmembers used in the mixture preparation are water-ice particles, kerite powders as analogues for extraterrestrial organic materials, and pyrrhotite powders as analogues for optically opaque and spectrally bland extraterrestrial compounds. These are described below:
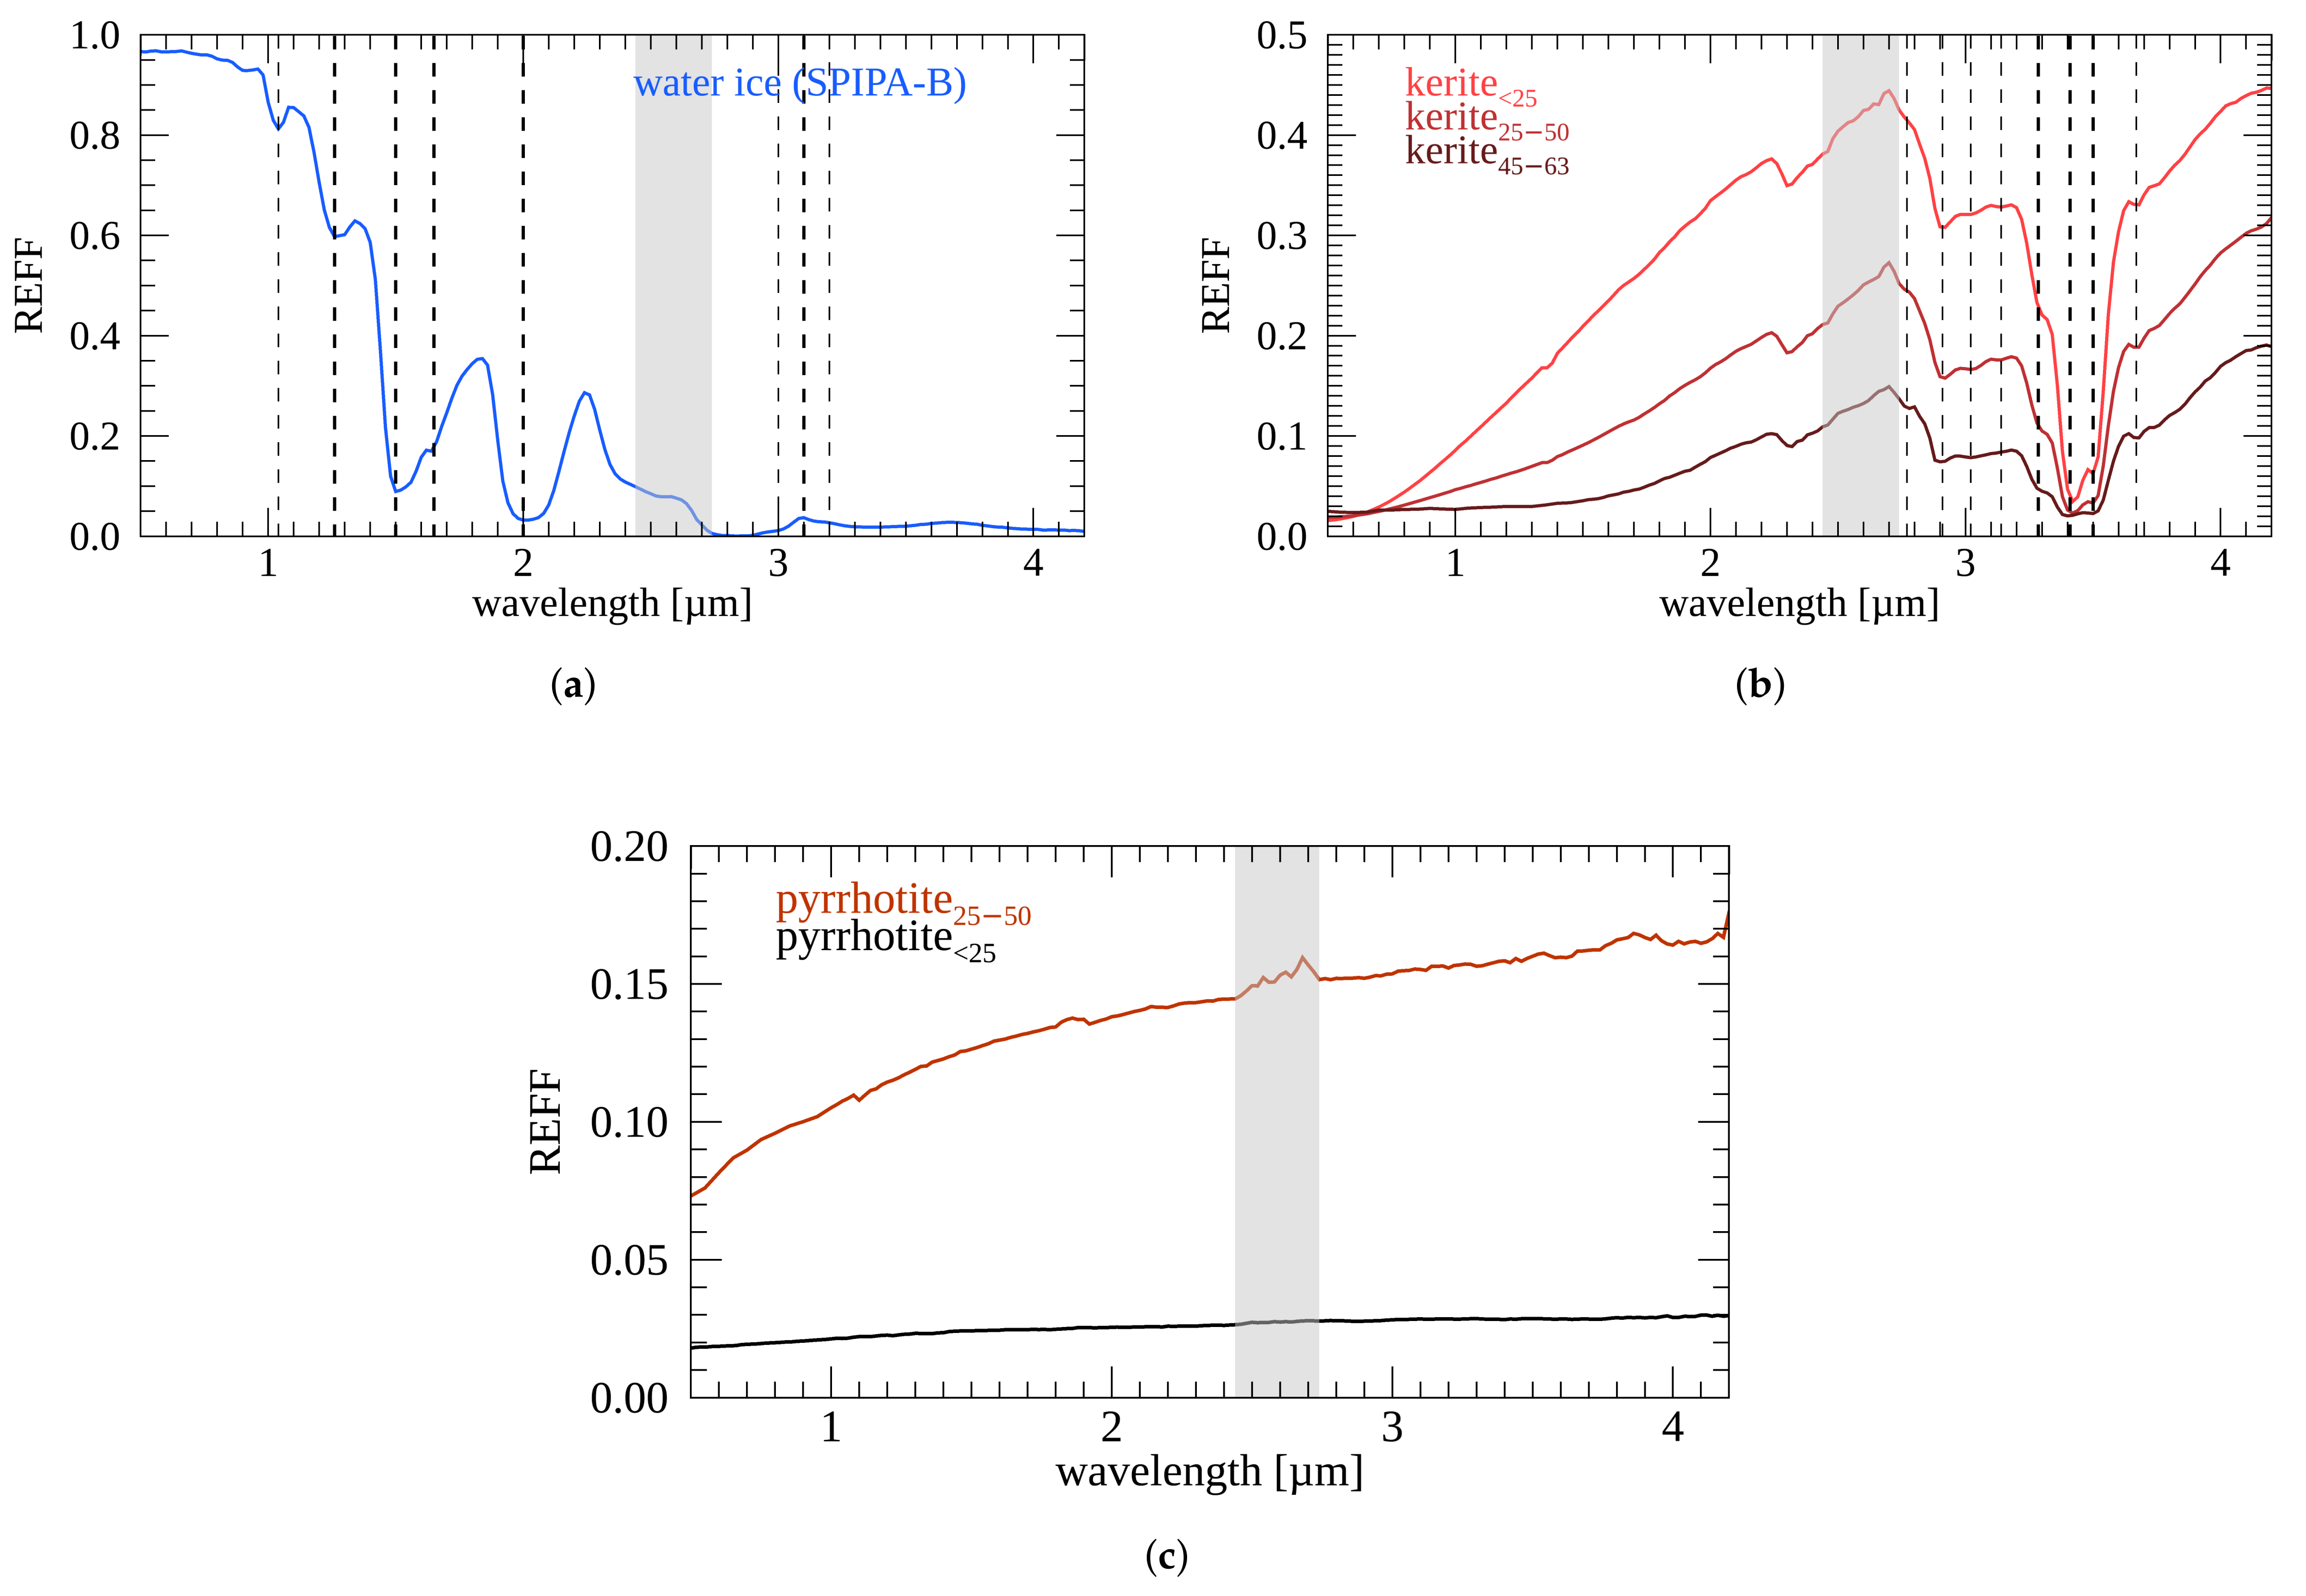
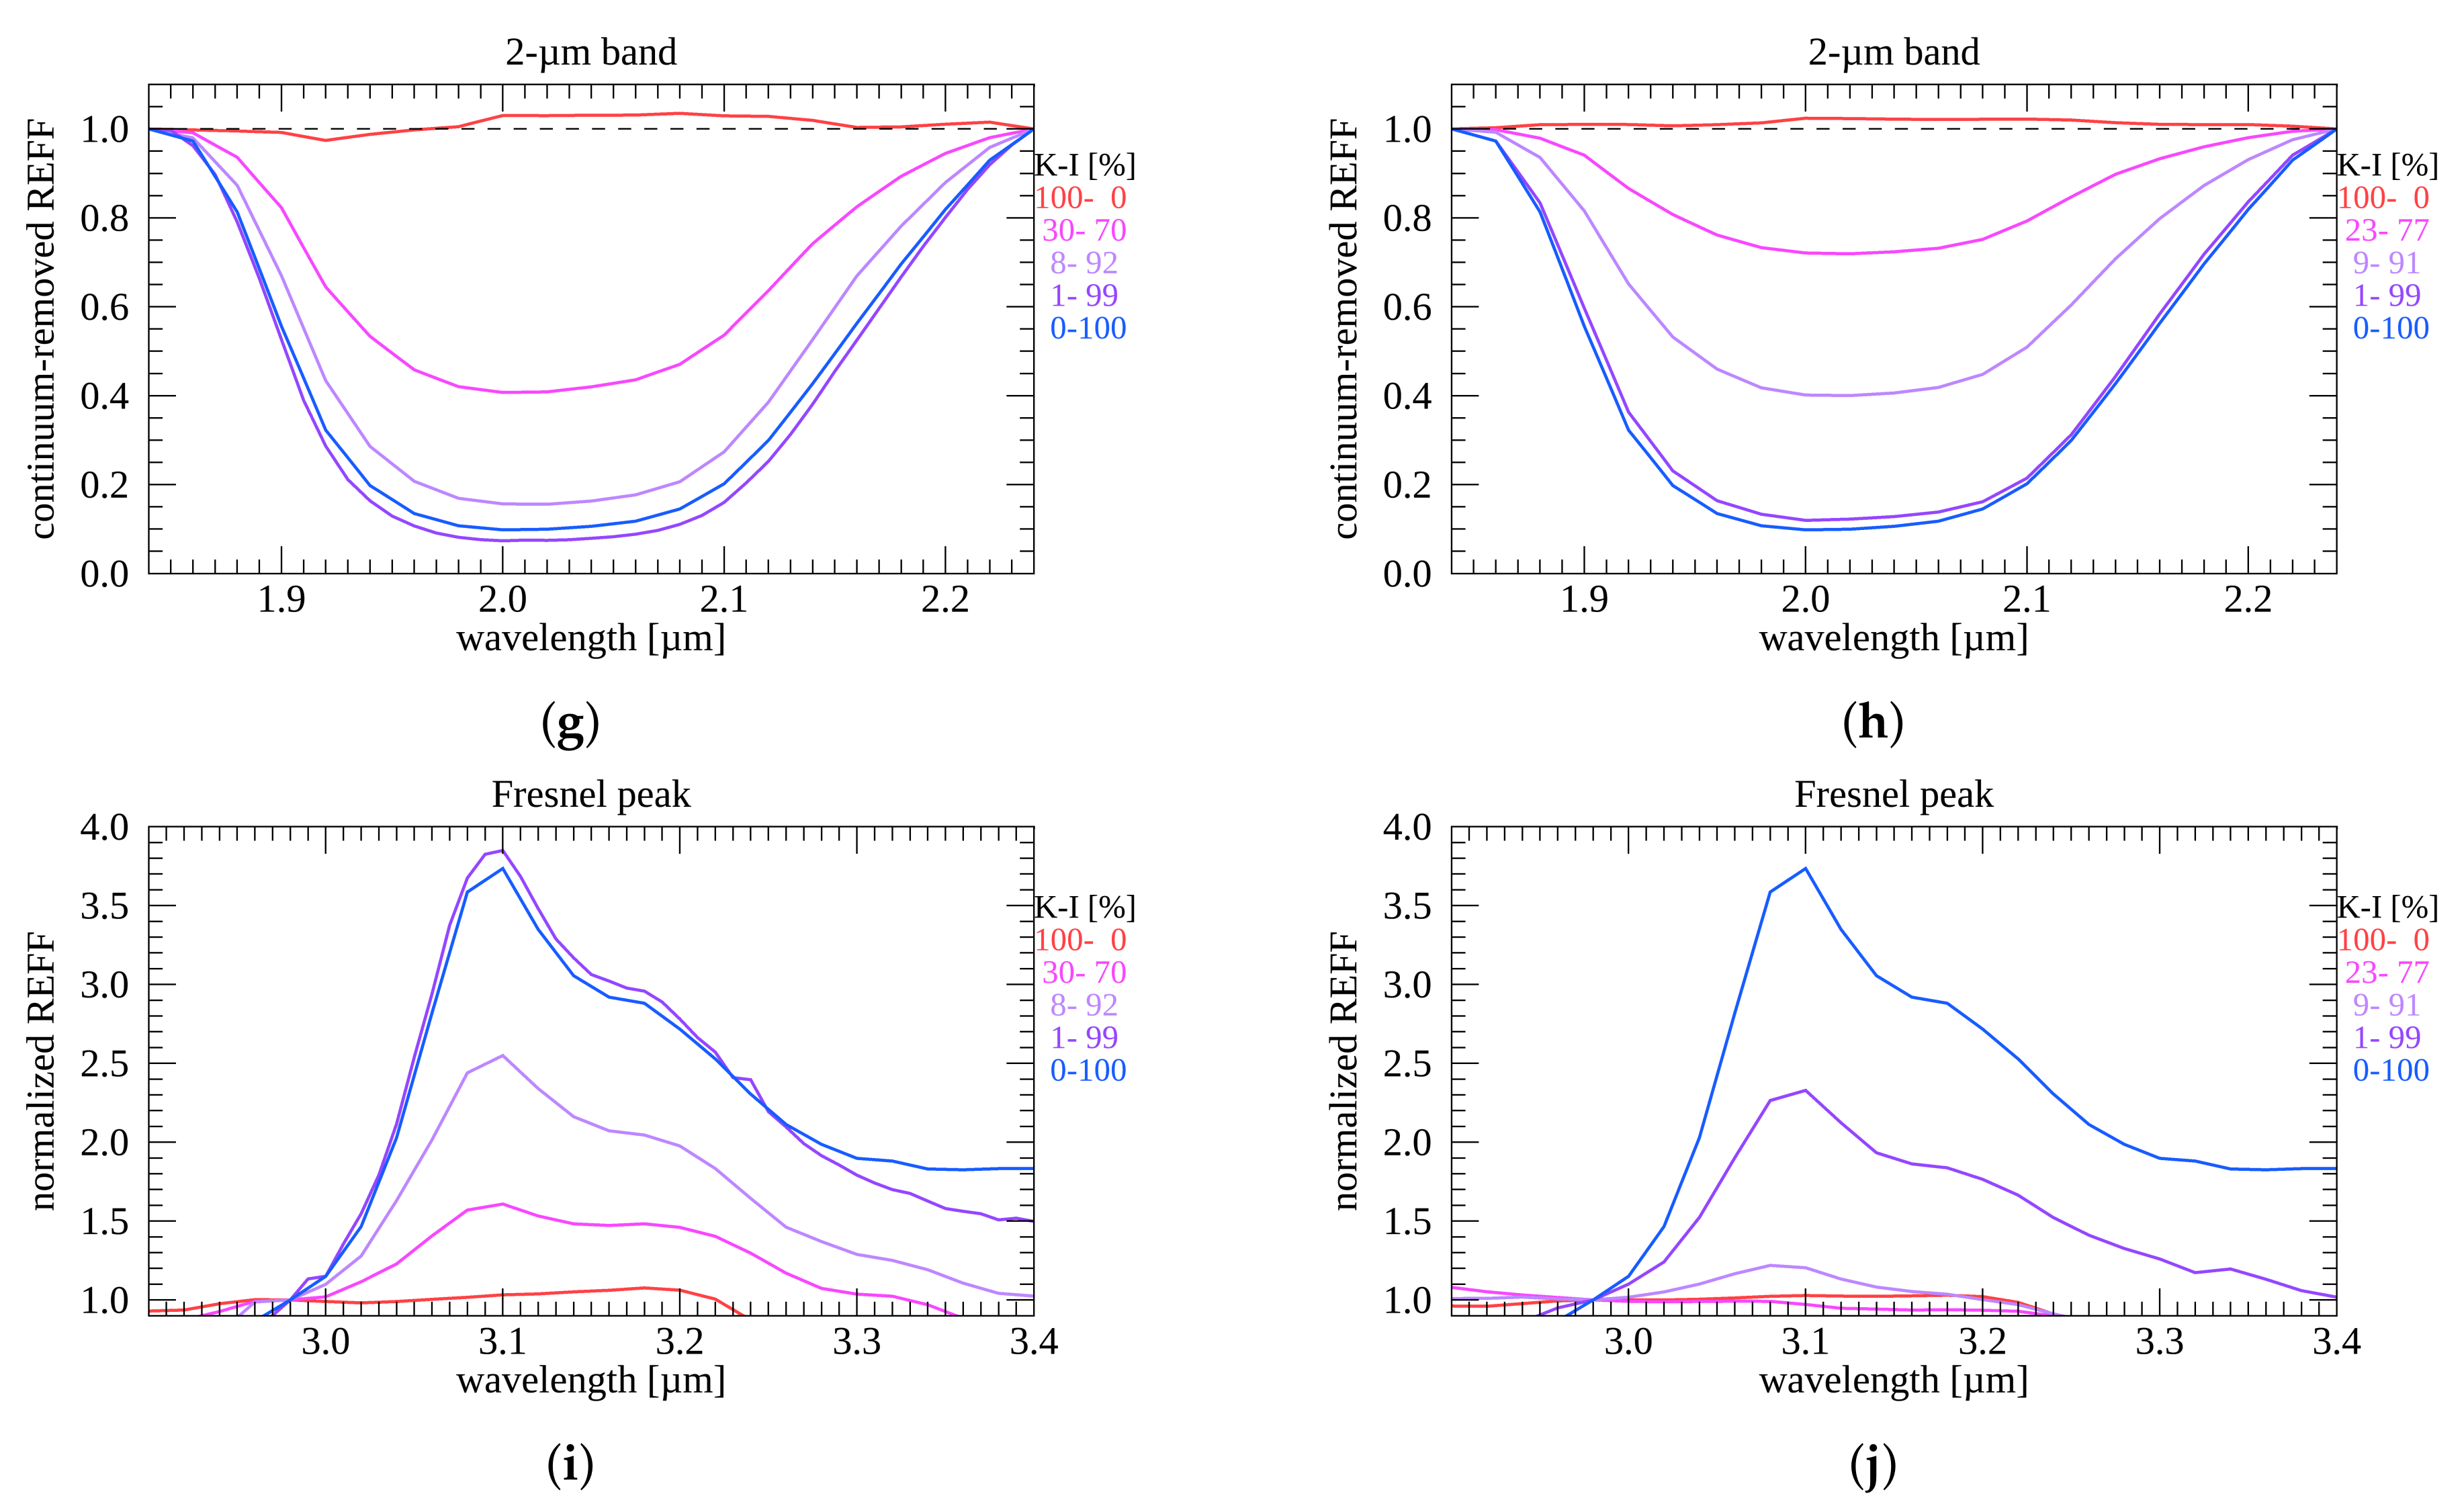
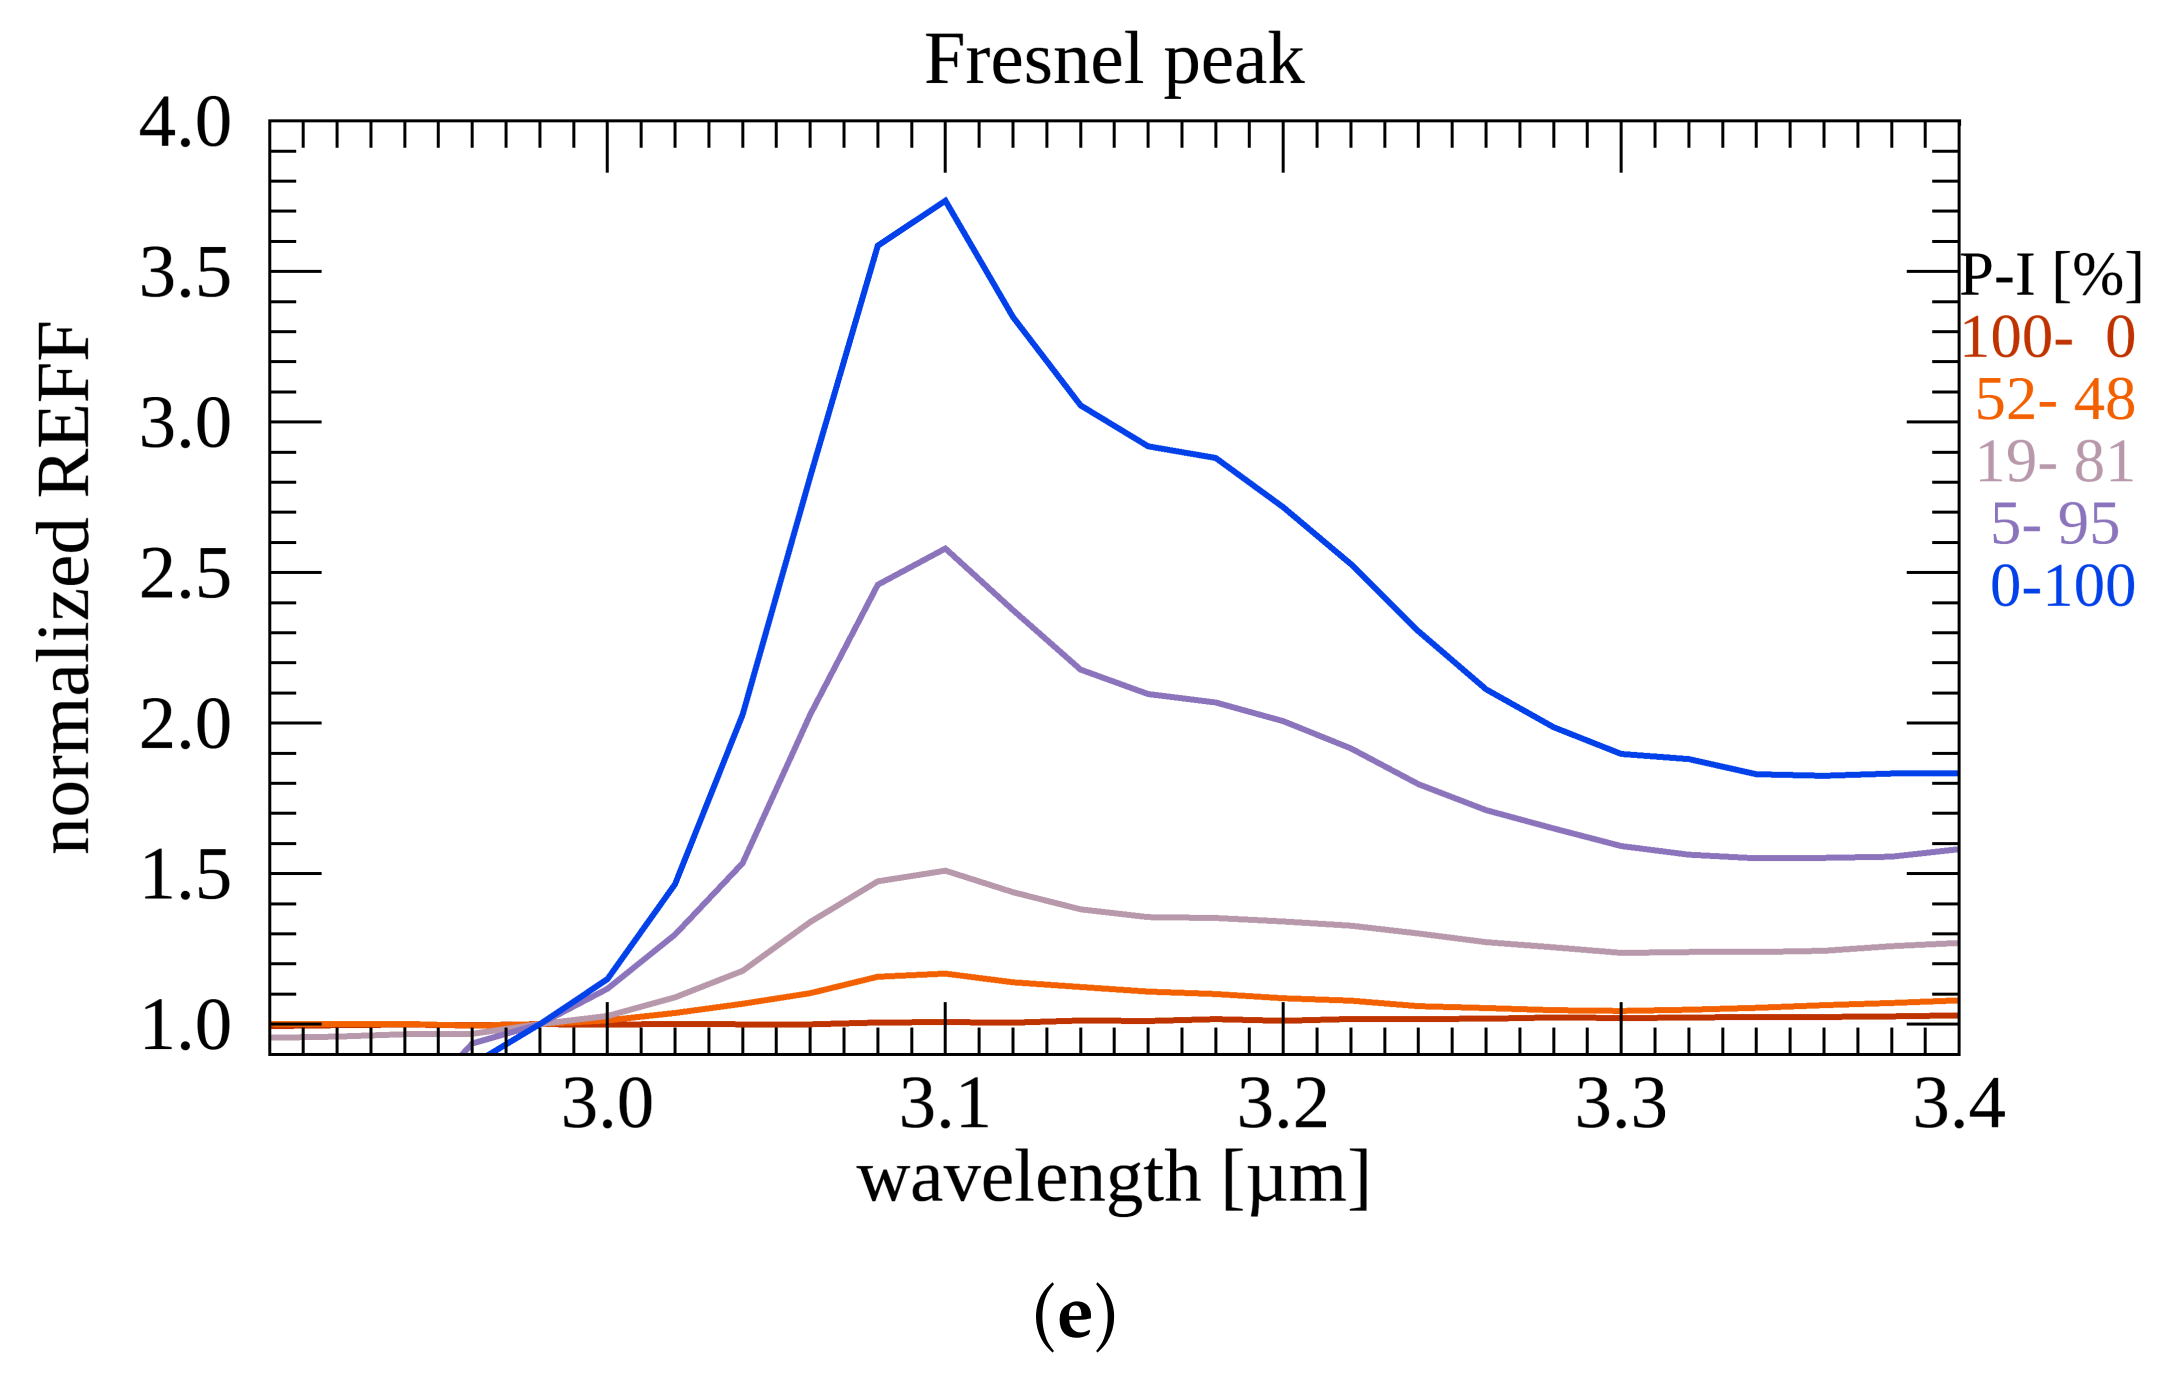
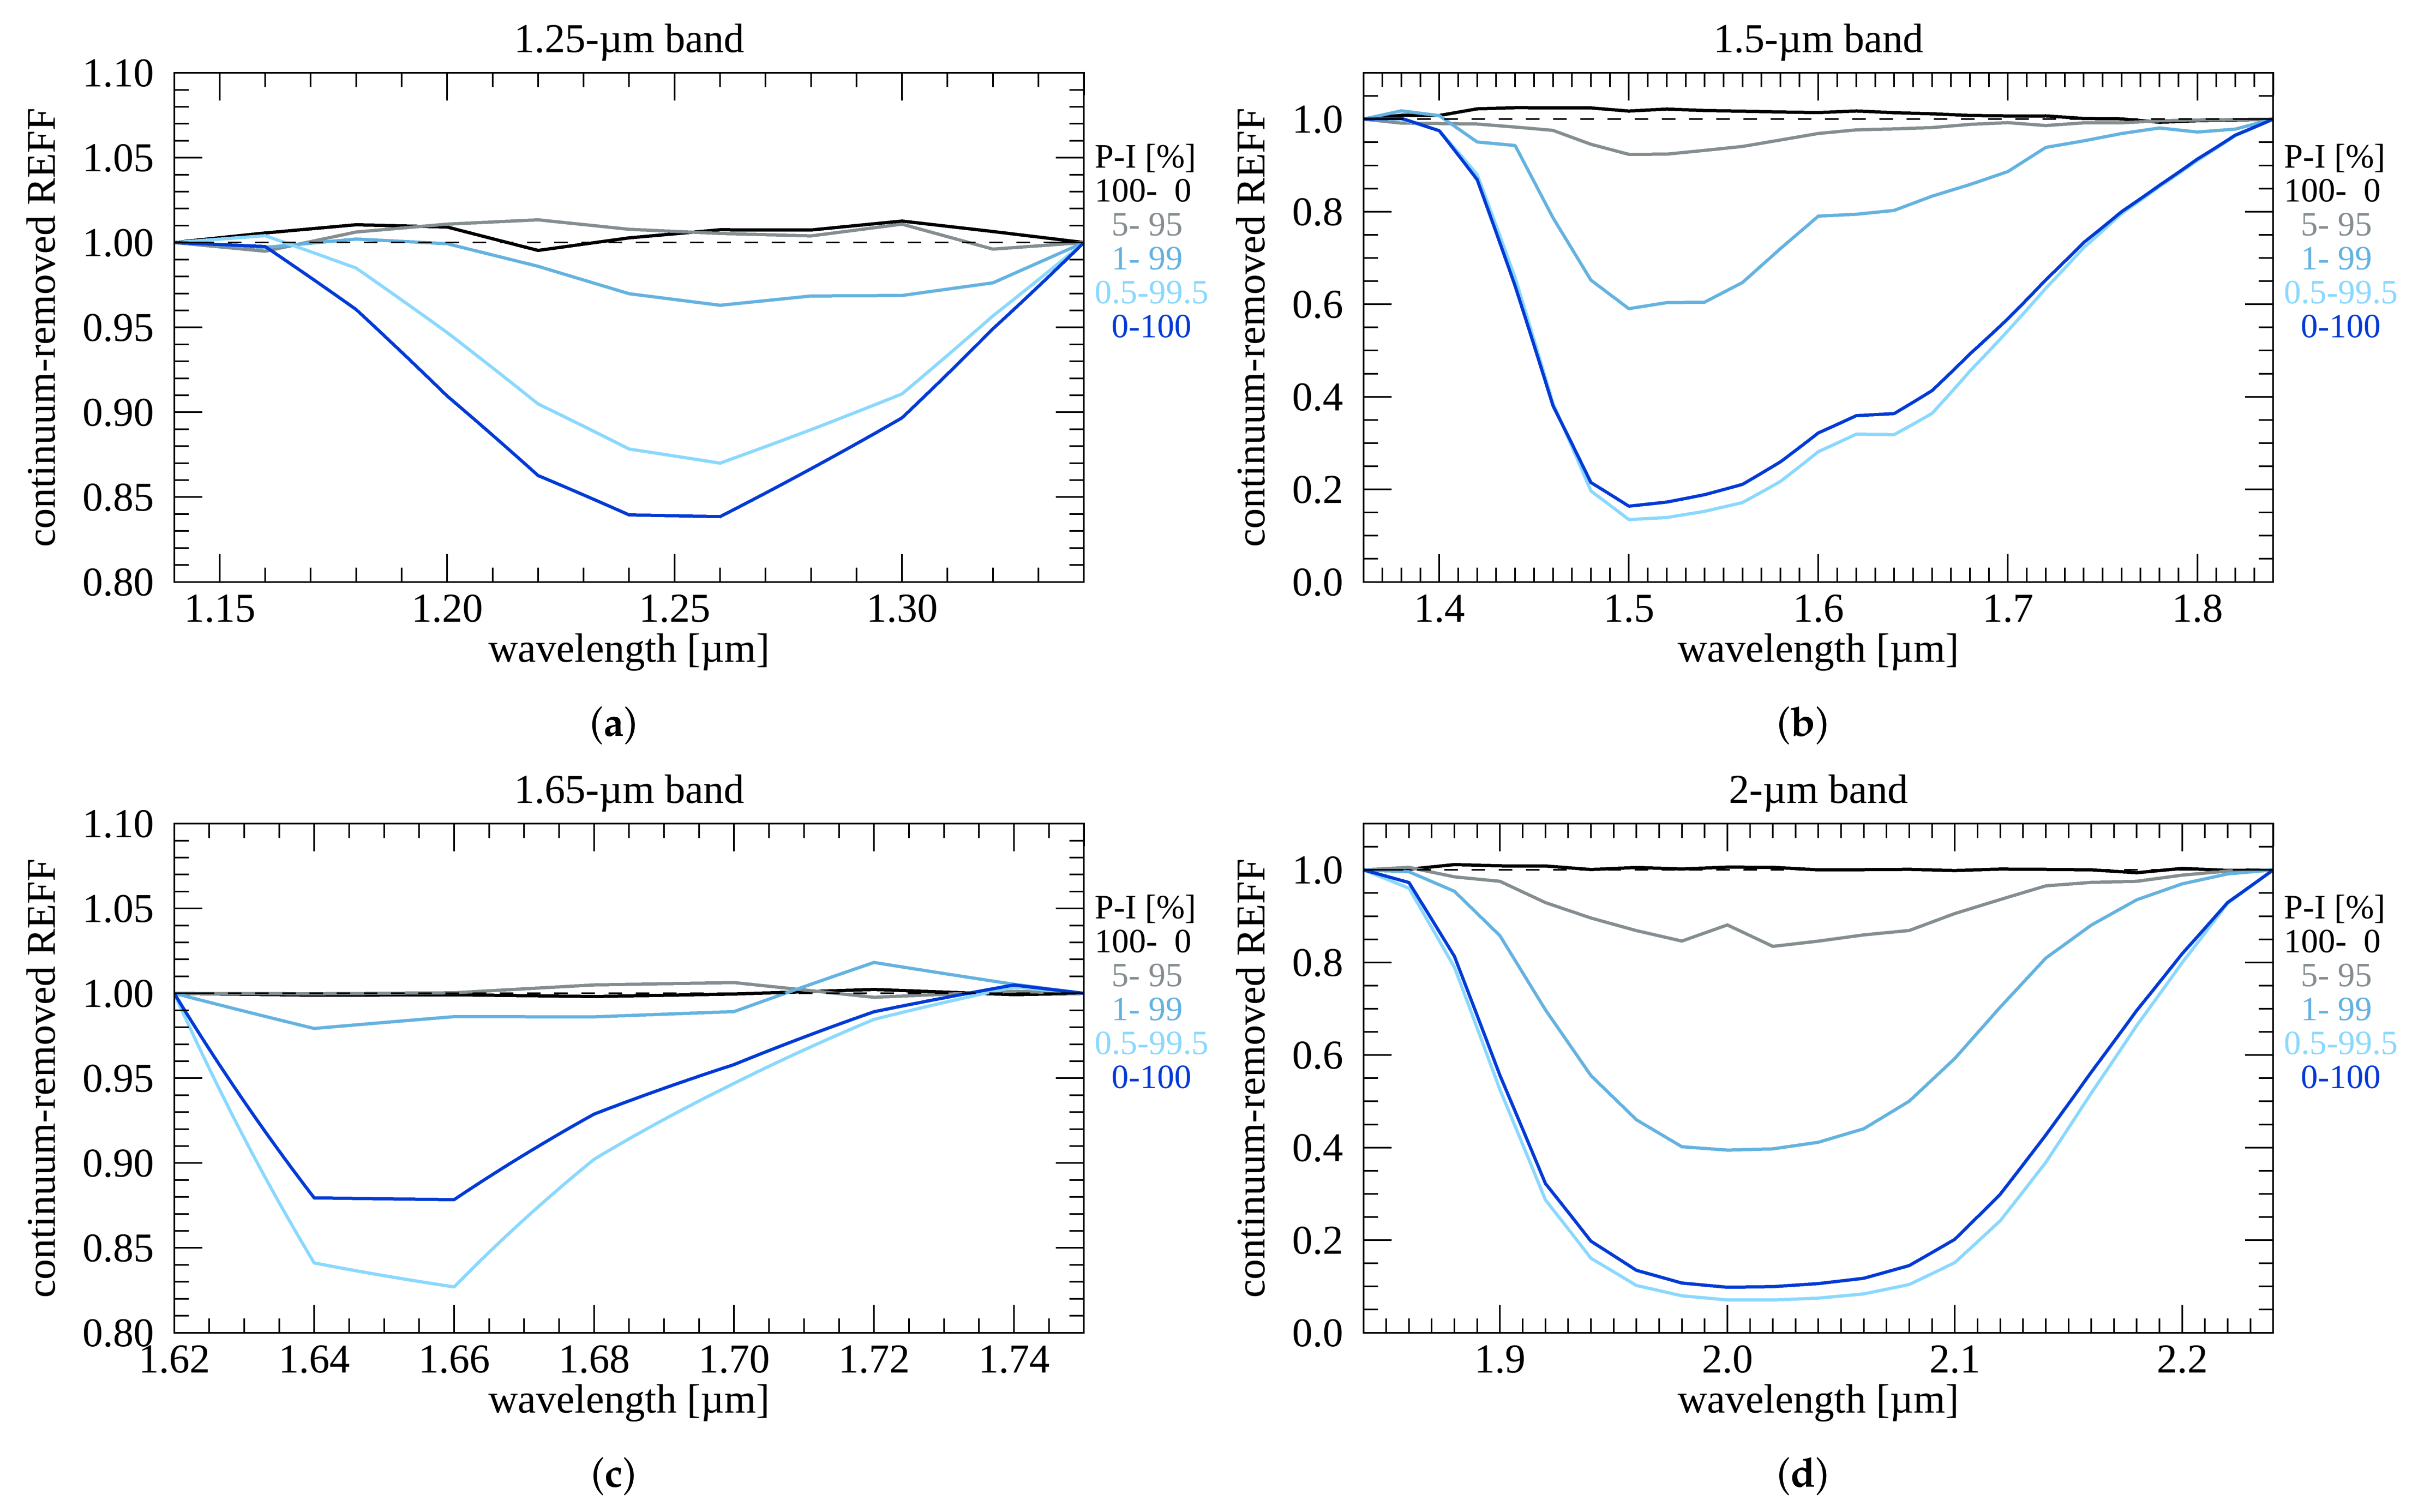
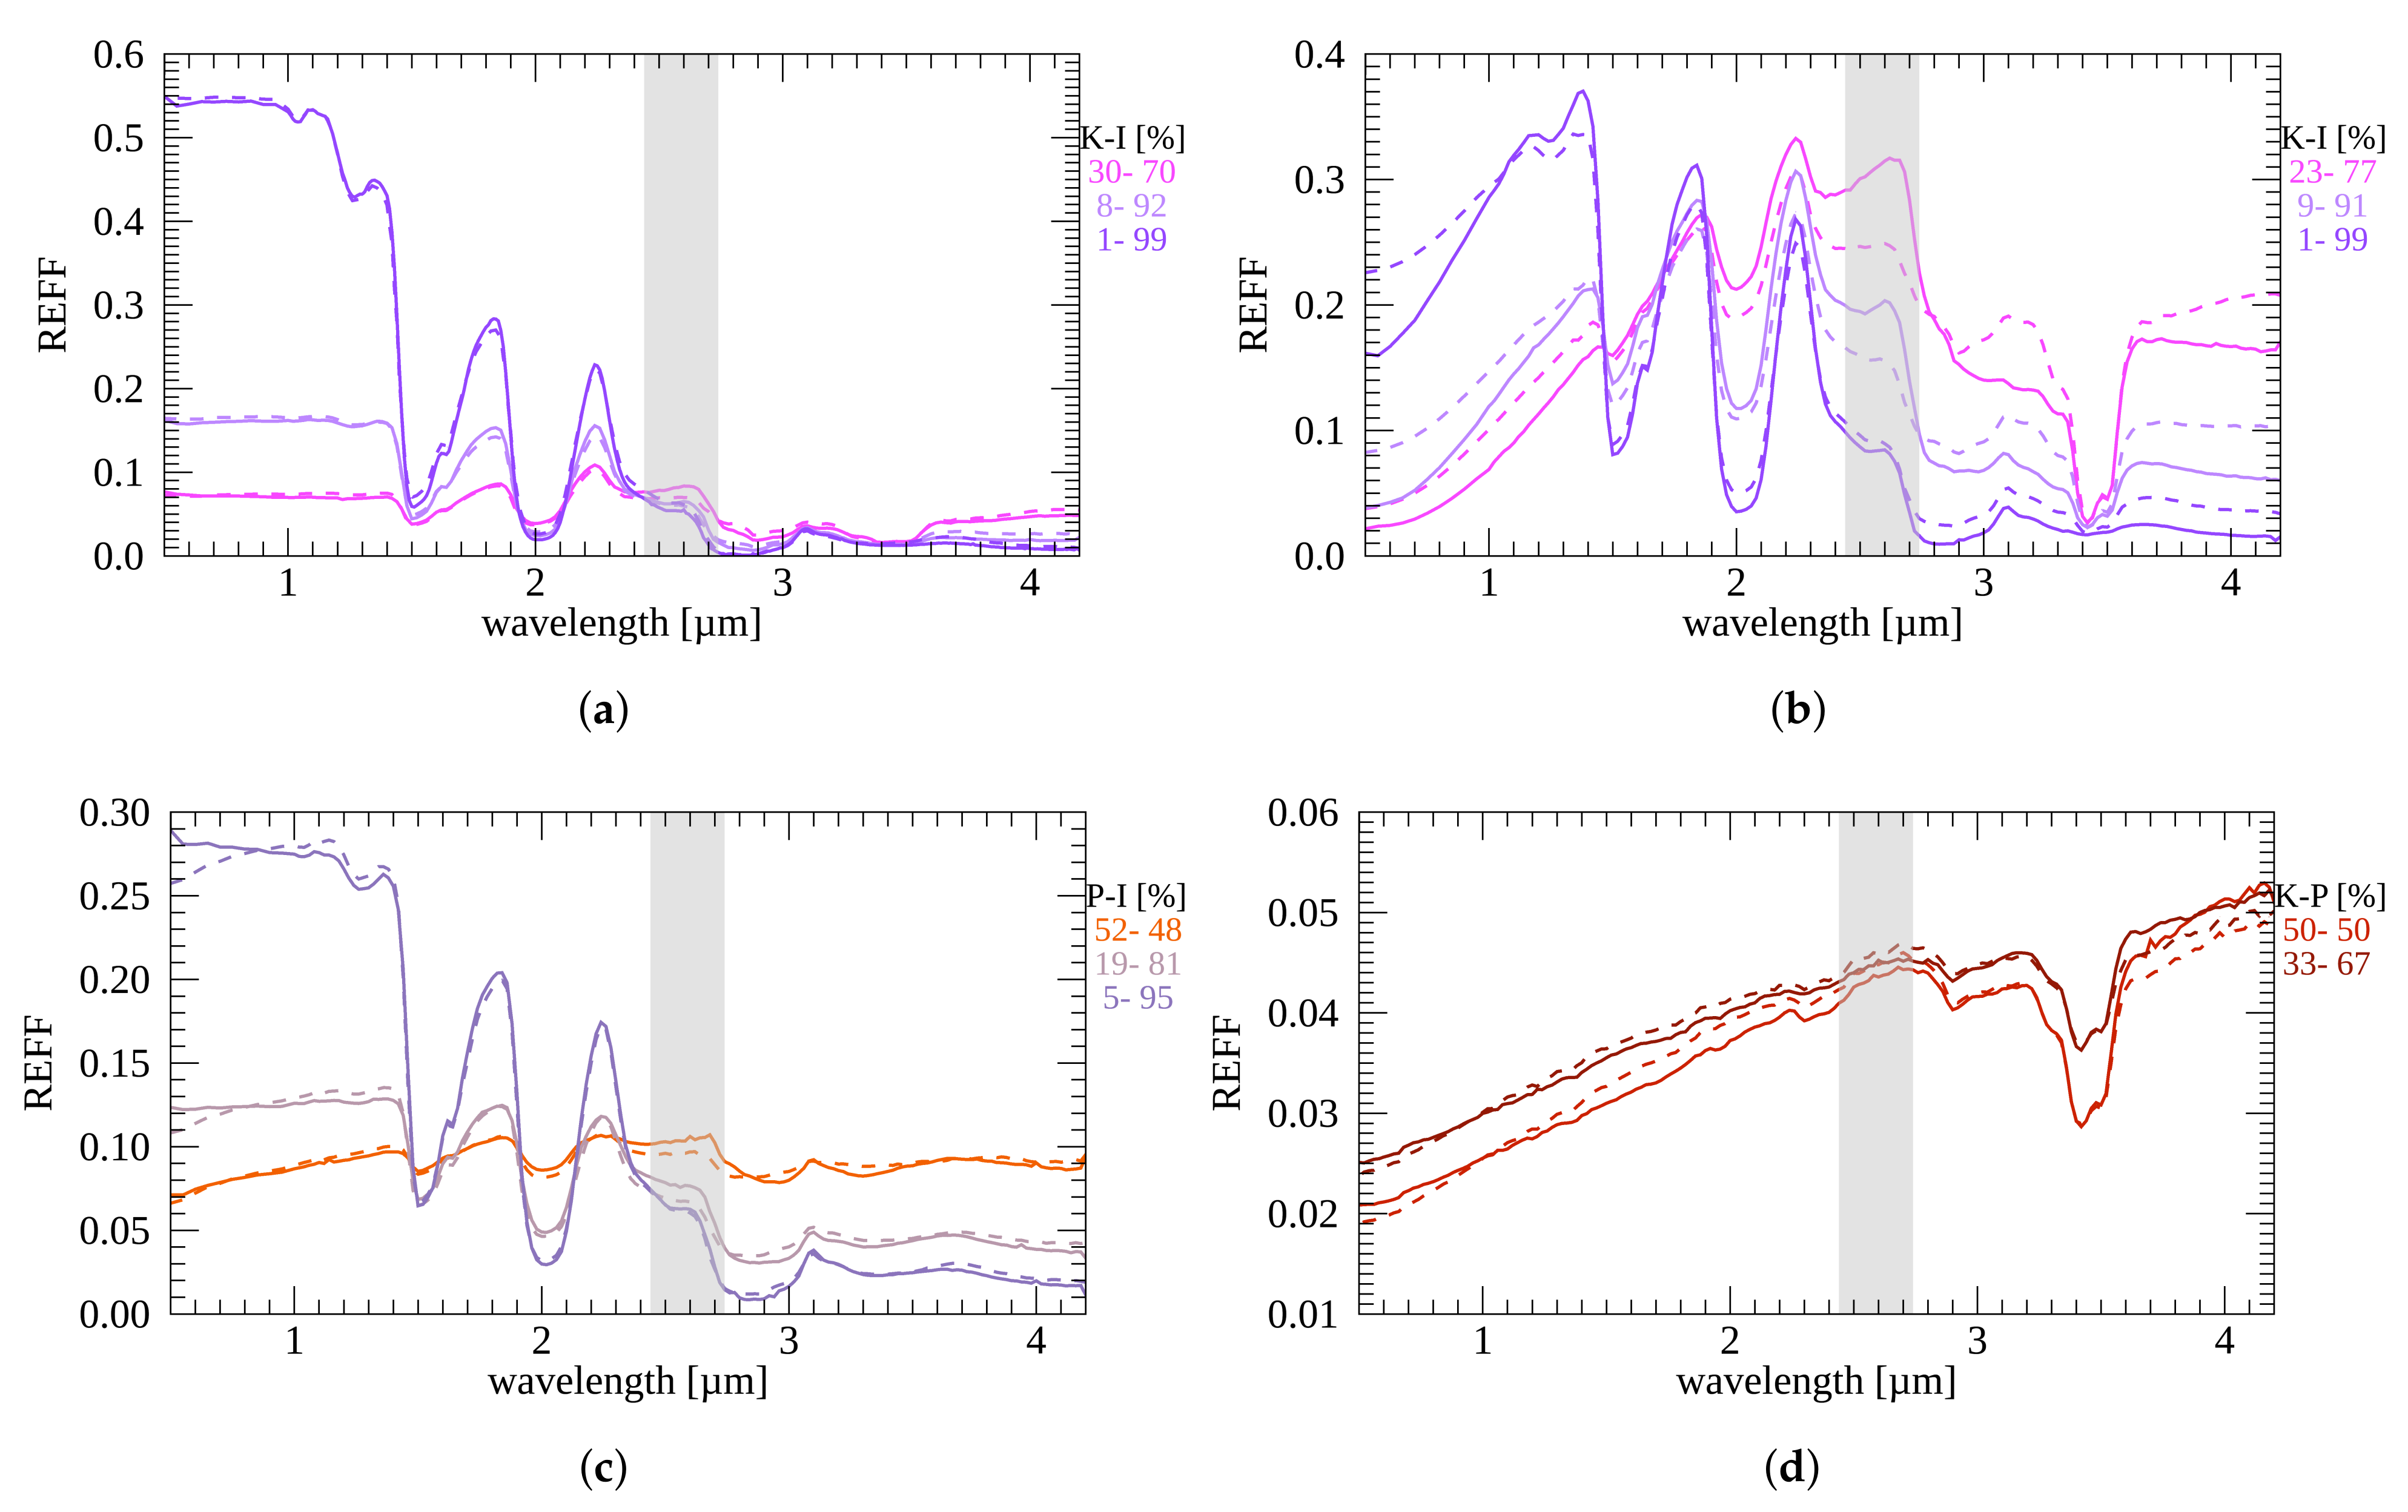
  • Water-ice particles: these have been prepared by means of the Setup for the Production of Icy Planetary Analogs-B (SPIPA-B, [36,39]), which makes use of an ultrasonic nebulizer and a peristaltic pump to spray and freeze water droplets into liquid nitrogen. This protocol allows us to produce spherical water-ice particles with a reproducible size distribution, characterized by a diameter of 67 ± 31 μ m, as inferred from cryo-scanning electron microscopy. The reflectance factor (REFF) (which, hereafter, we refer to as reflectance, for brevity) spectrum (Figure 1a) is characterized by high albedo at visual wavelengths and displays the diagnostic near-infrared water ice absorption features located at 1.05, 1.25, 1.5, 2.0, and 2.7–3.0 μ m. The broad 1.5- μ m band hosts a secondary absorption at 1.65 μ m, characteristic of crystalline water ice [50,51]. Longward of the strong 2.7–3.0 μ m absorption, the Fresnel reflectance peak is clearly displayed at 3.1 μ m with two side-features at 3.0 μ m and 3.2 μ m, still indicative of crystalline water ice [52].
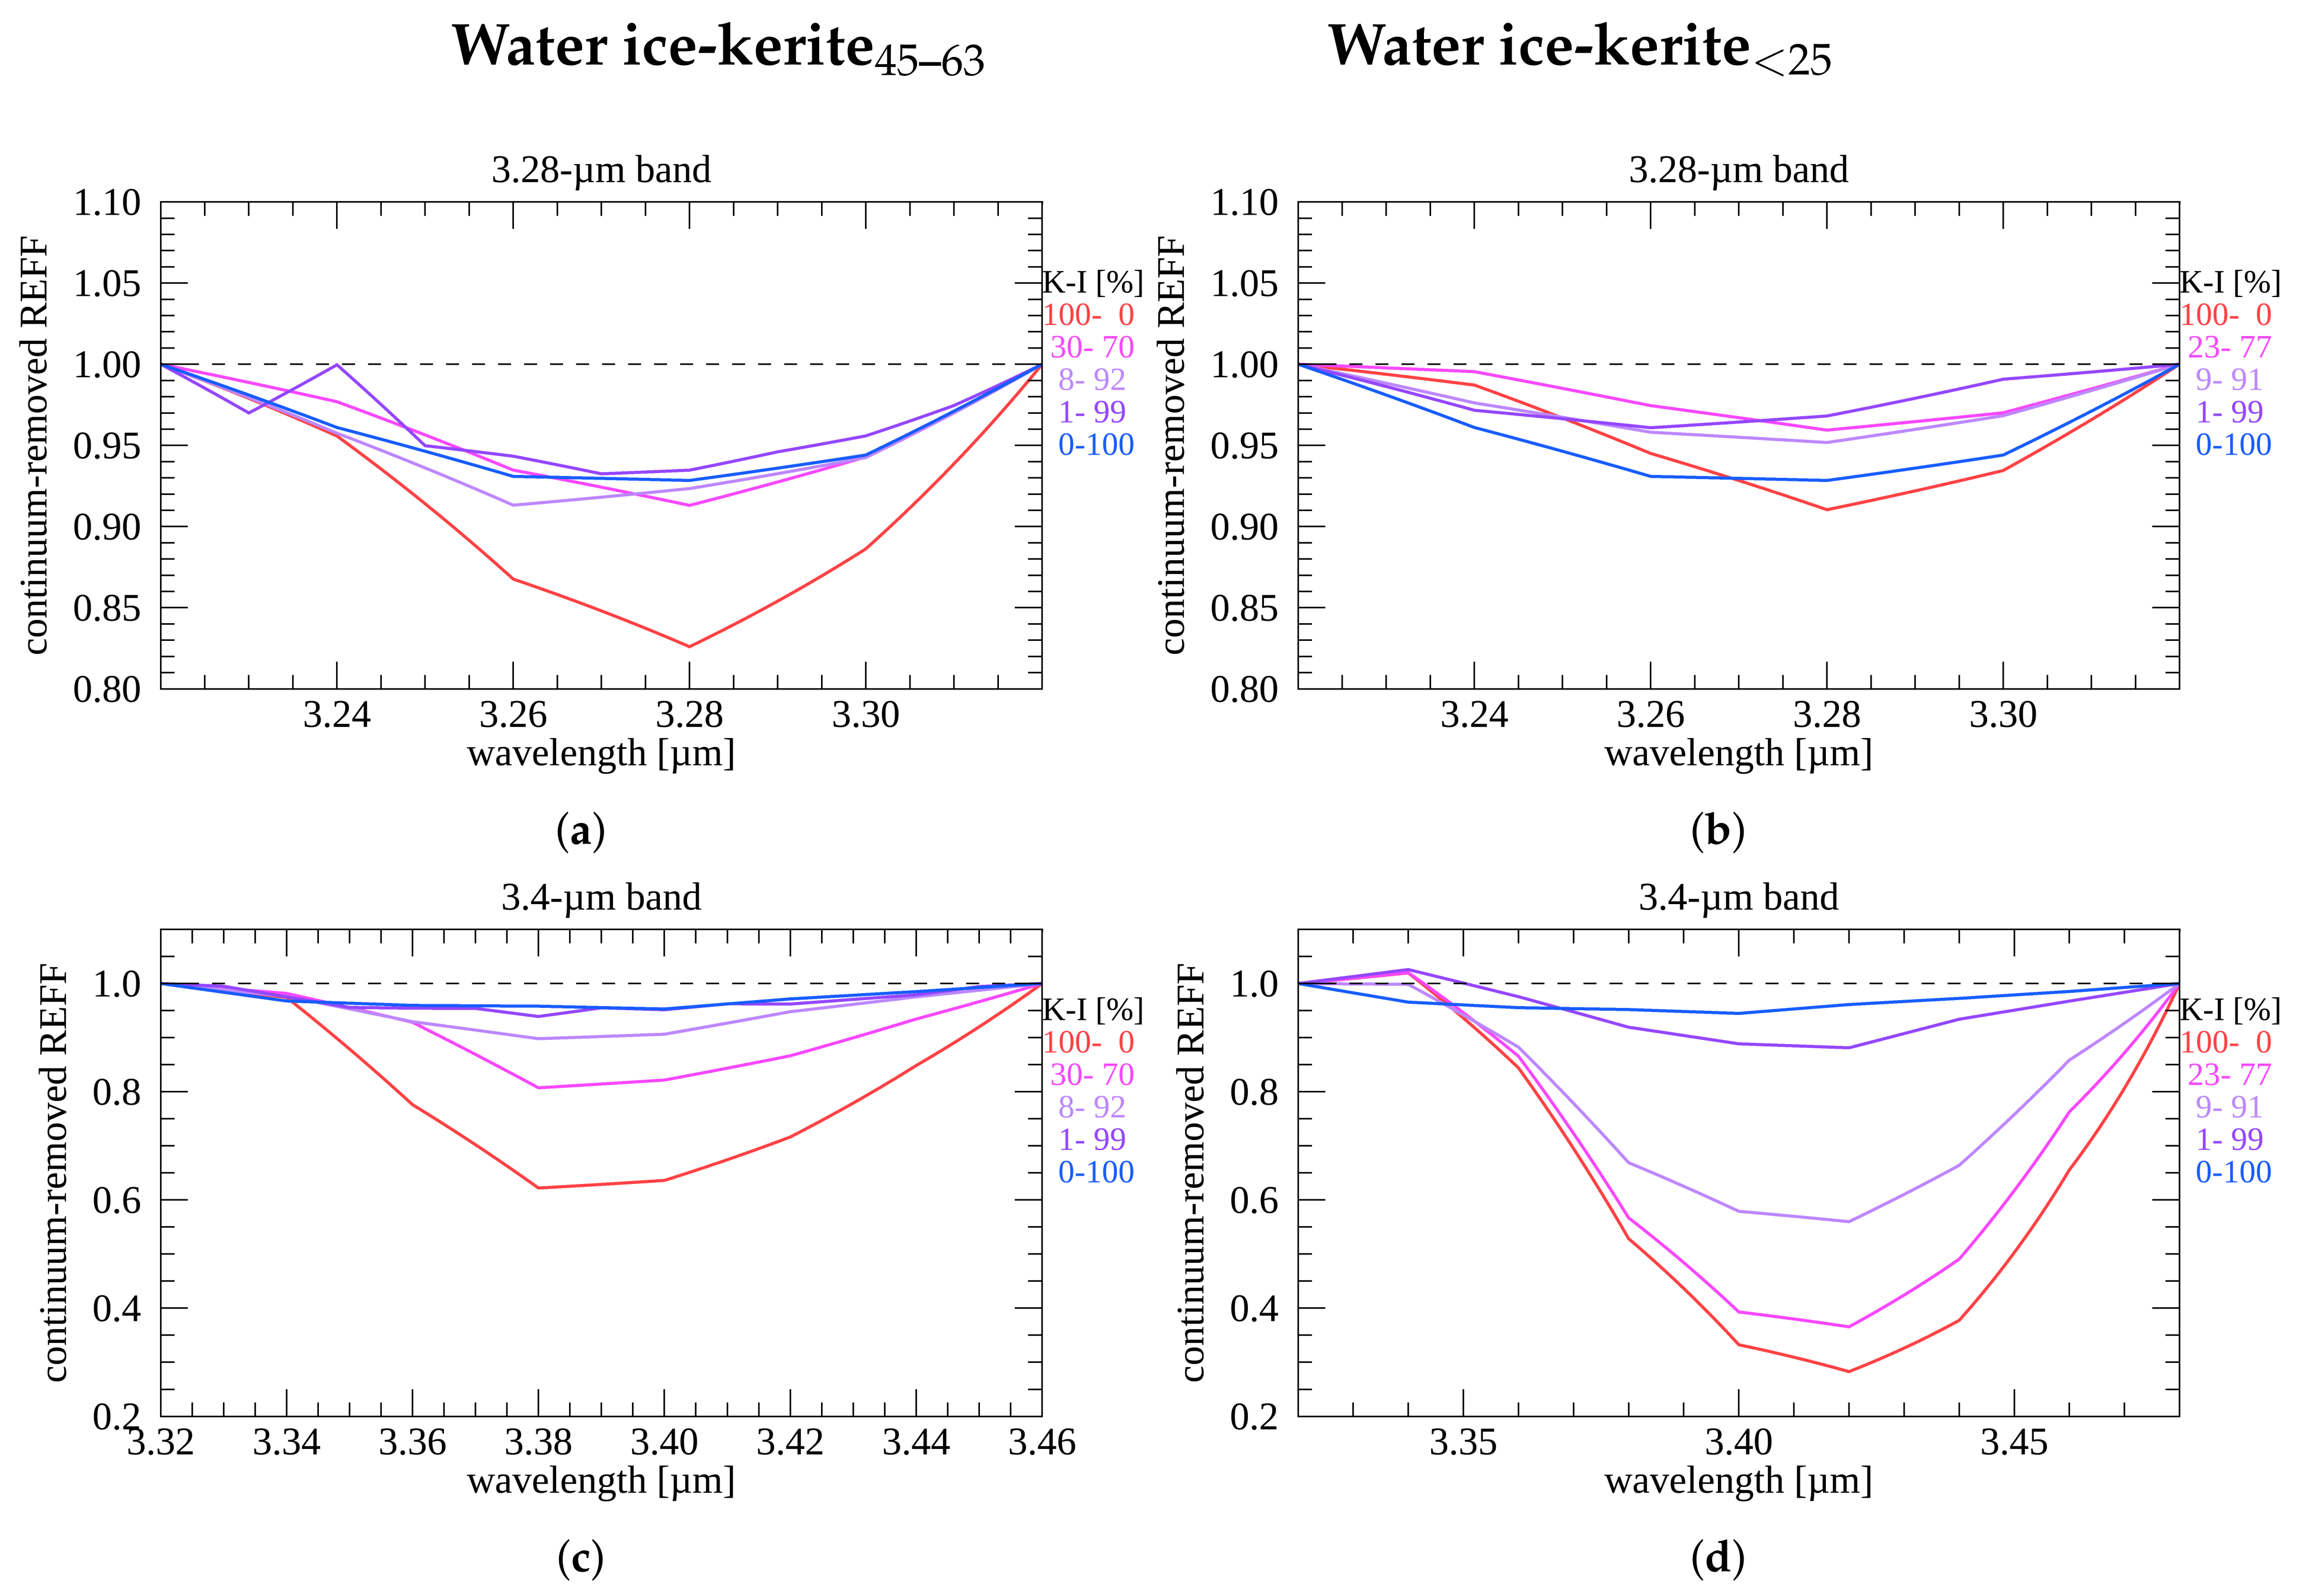
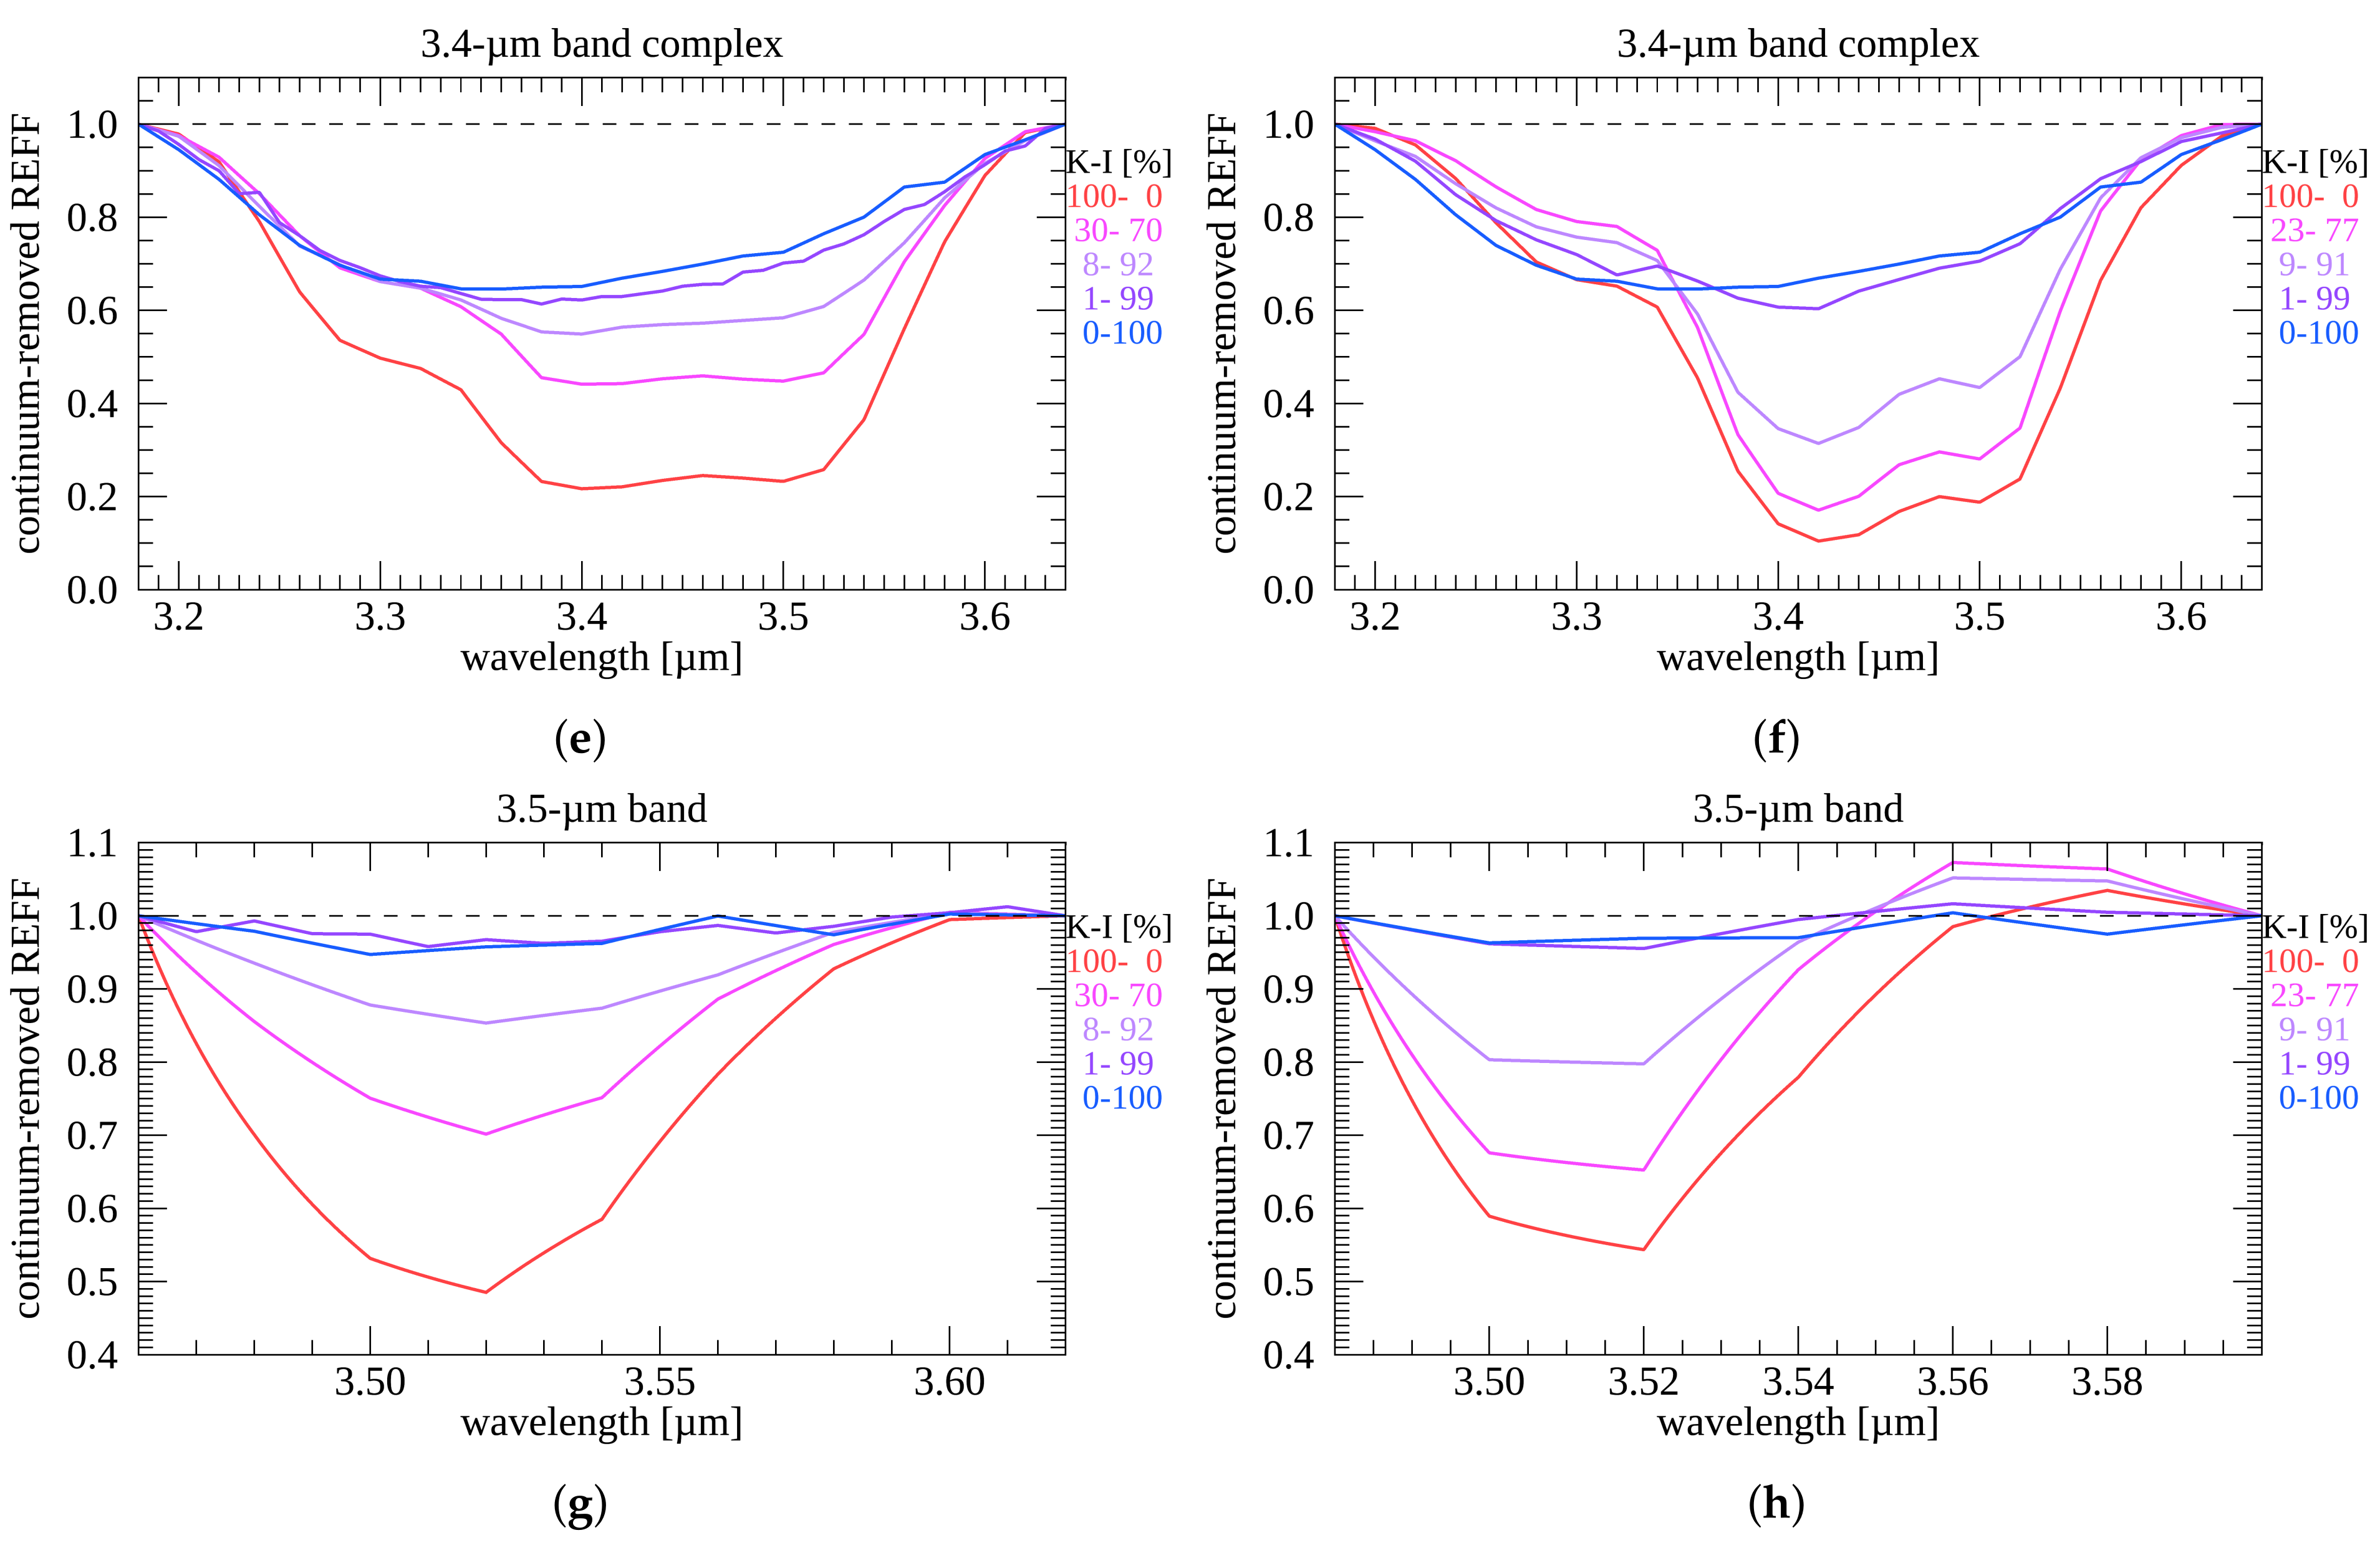
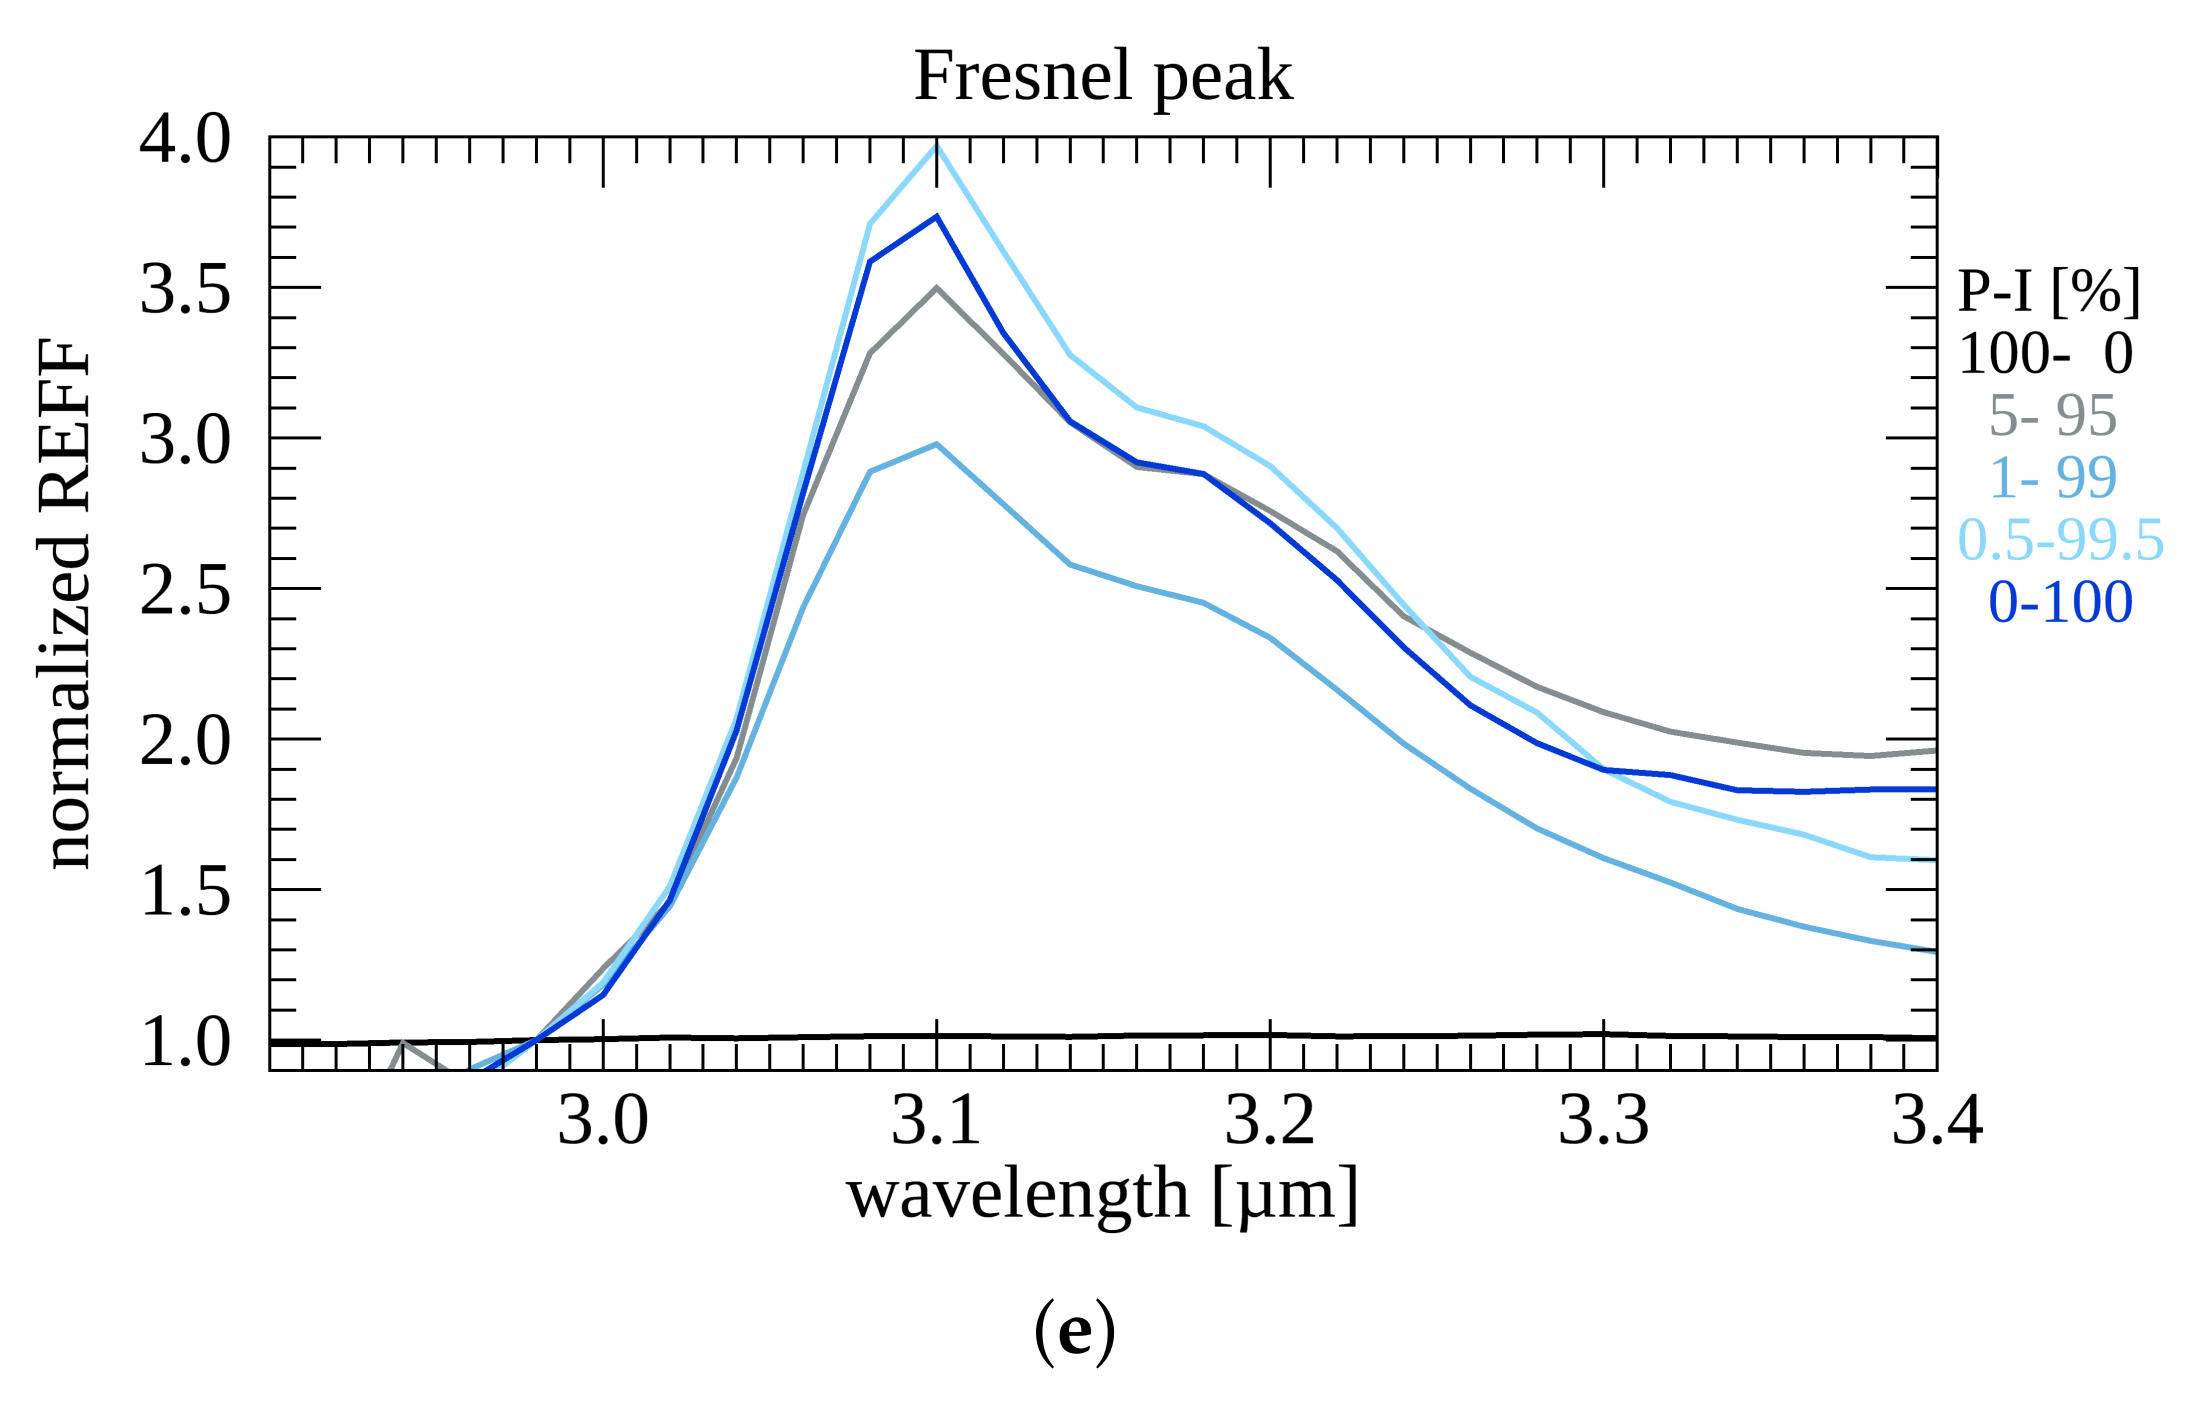
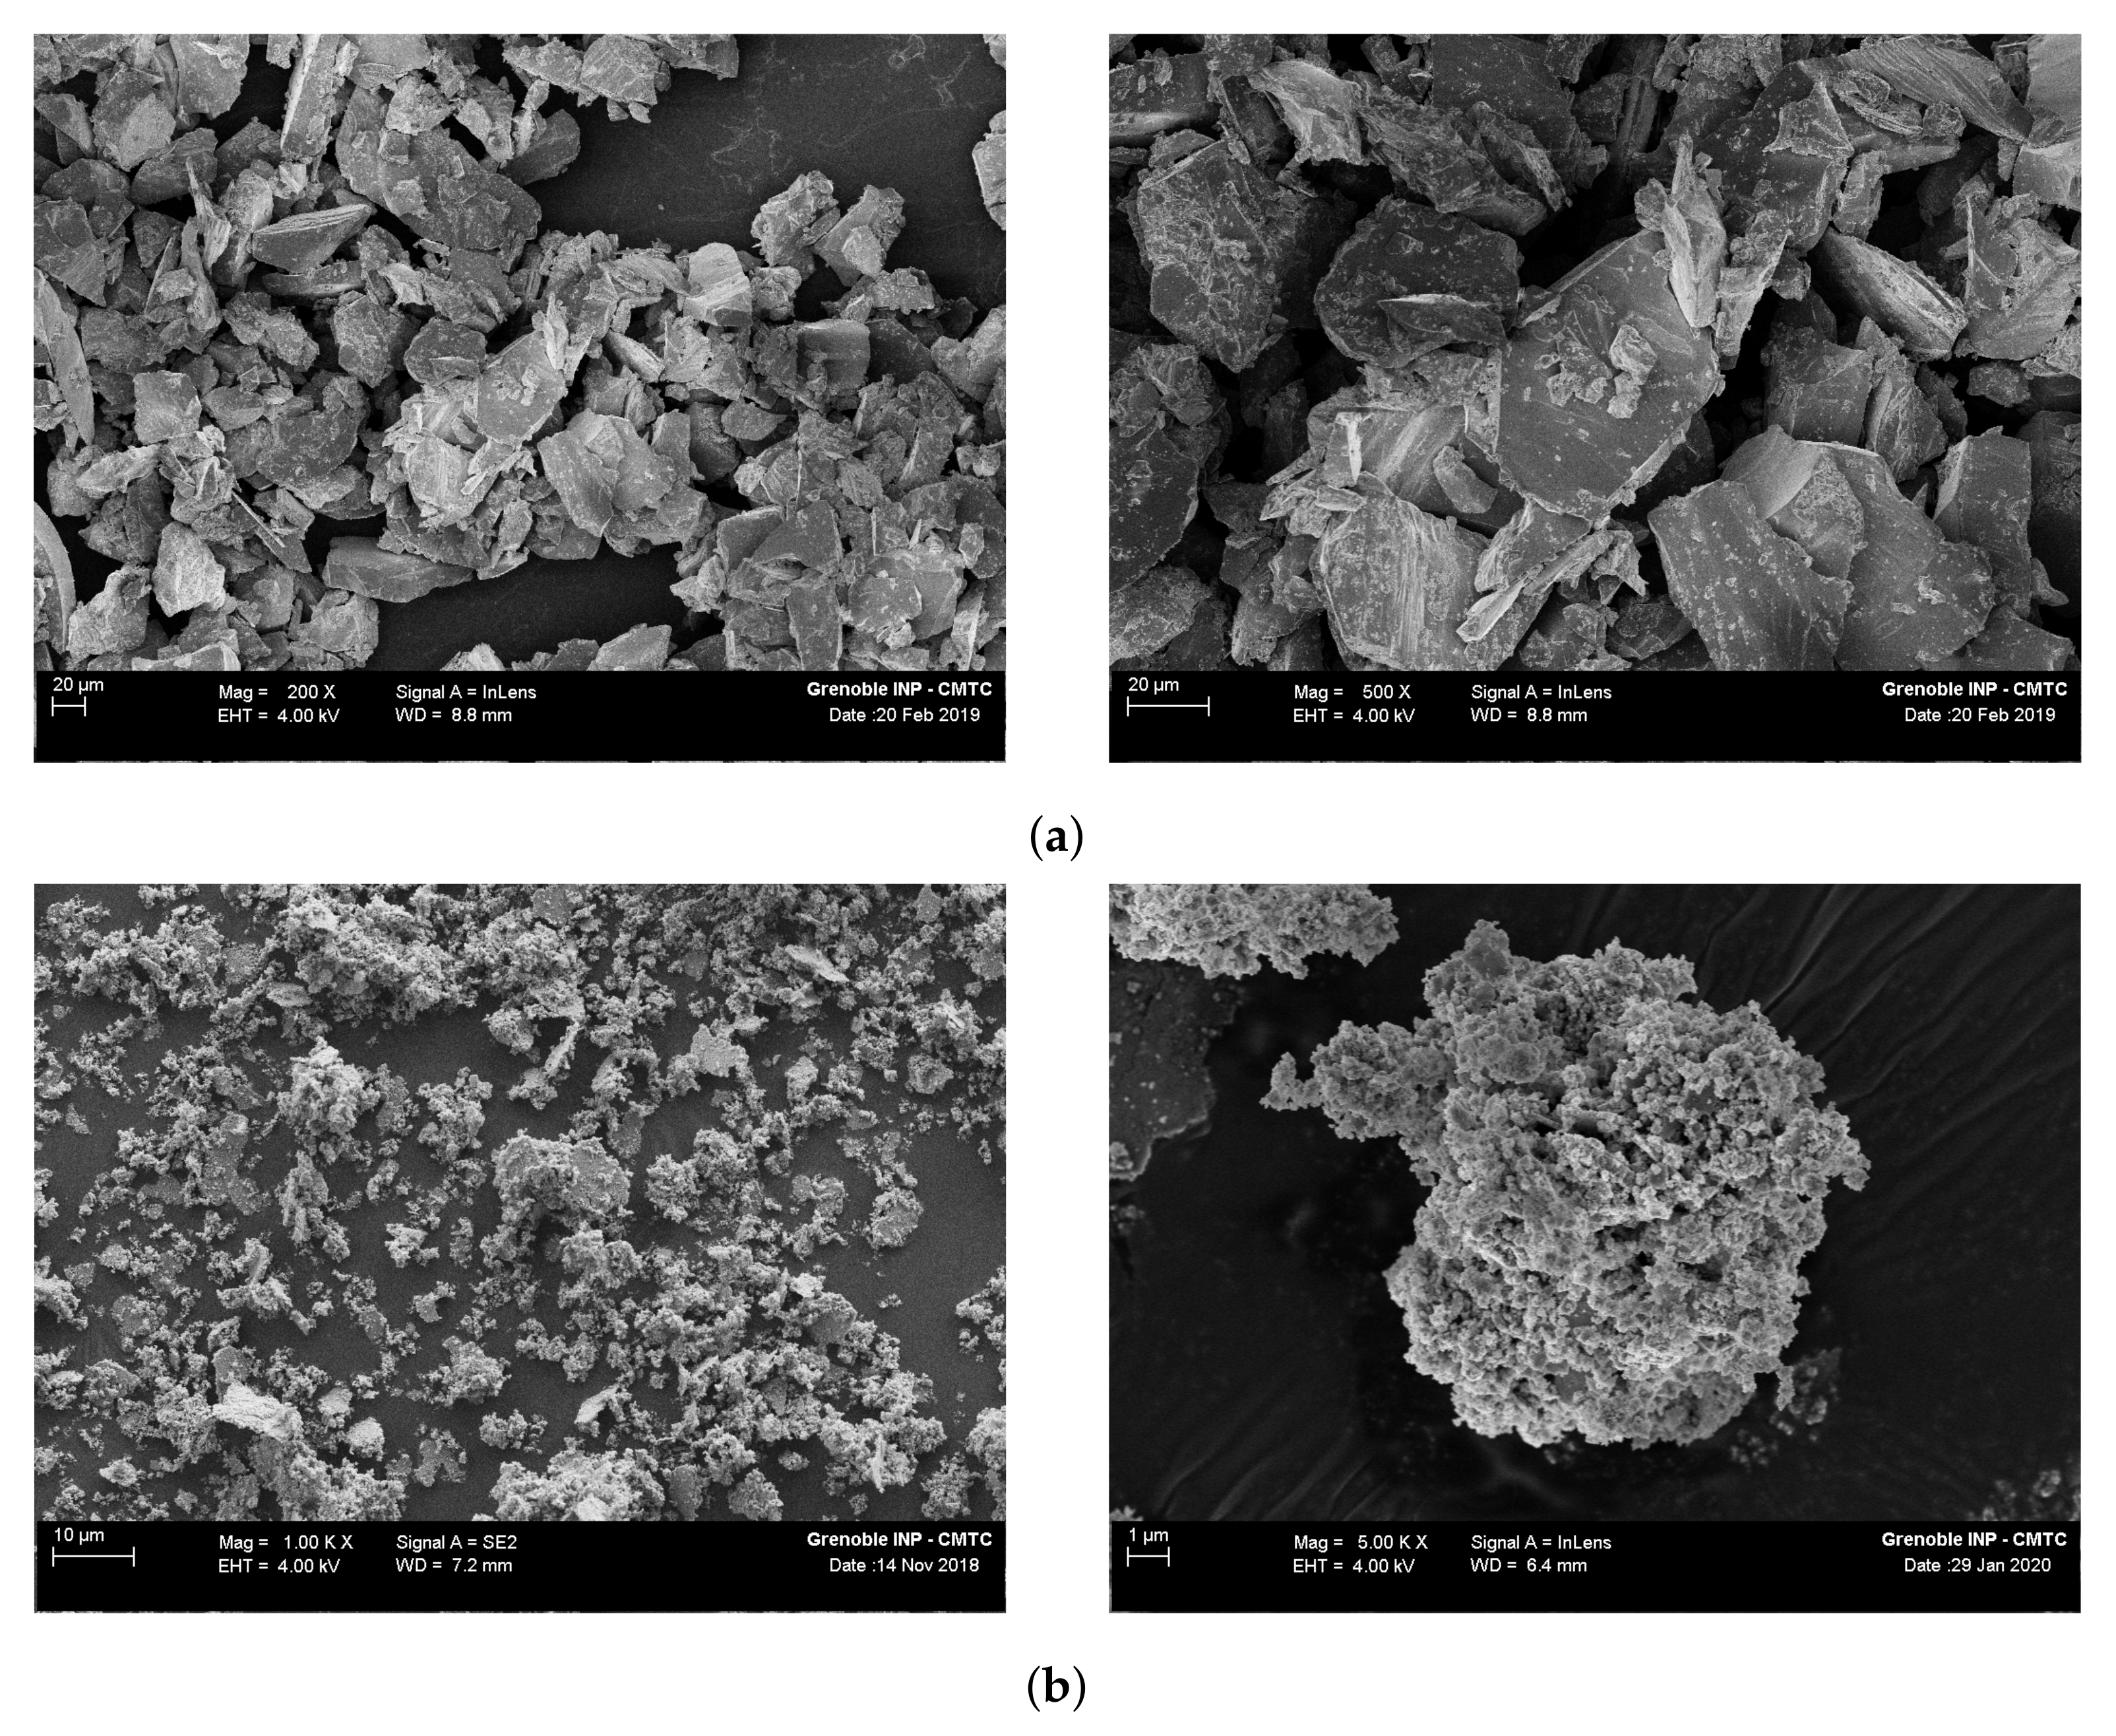
  • Kerite: this is a natural solid oil bitumen of medium aromaticity (PAM#42) from the DLR (Deutsches Zentrum für Luft- und Raumfahrt) laboratory repository. The sample was previously part of the H. Jacob collection [53] and originates from Pushmataha County, United States. We refer the reader to [54] for elemental and X-ray diffraction (XRD) analyses (sample #8540) and 0.5–16 μ m reflectance spectrum of the <25 μ m-powder (“kerite” in Figure 1 of [54]), while the 13 C neutron magnetic resonance analysis has been published in [55]. In addition, 0.3–25 μ m reflectance spectra of five dry-sieved kerite PAM#42 separates have been measured in [56], and the detailed results will be published elsewhere. In this work, kerite separates were prepared/available in three different grain sizes (25–50 μ m, 45–63 μ m, and <25 μ m, referred to as kerite 25 50 , kerite 45 63 , and kerite < 25 , respectively), obtained by manual grinding of the bulk sample and wet-sieving (with water) of the coarse (>25 μ m) fraction. The kerite sample reflectance spectra are shown in Figure 1b. The three separates are characterized by a marked visual/near-infrared positive spectral slope, which progressively decreases with increasing grain size, along with the overall reflectance, as the effect of increasing light absorption in the grains. A similar trend is seen in the spectra of PAM#42 kerite separates previously measured at DLR [56]. The kerite spectrum displays several absorption features characteristic of solid bitumens, as described in [54]. In particular, in the investigated spectral range, we can recognize a complex feature at 2.3–2.6 μ m due to the overlapping combinations of mid-infrared fundamental modes of CH 2 and CH 3 groups. Moving to longer wavelengths, several absorptions related to organic OH groups occur at 2.77, 2.90–2.92, 3.02, and 3.14 μ m. Finally, C-H stretch-related features, which are used as principal indicators of aromatic/aliphatic carbon in VIS-IR spectroscopy, are located at 3.28 μ m (aromatic CH), ∼3.4 μ m (likely from superposition of the absorptions at 3.38–3.39 μ m of antisymmetric modes of aliphatic CH 3 groups and at 3.41–3.42 μ m of antisymmetric modes of aliphatic CH 2 groups and aromatic CH 3 groups), ∼3.5 μ m (likely from superposition of the absorptions at 3.48–3.50 μ m of symmetric modes of aliphatic CH 3 and at 3.50 μ m of symmetric modes of aliphatic CH 2 ), and 3.66–3.67 μ m (Ar 3 CH or RCHO groups).
  • Pyrrhotite: we used an iron sulphide (Fe1−xS) sample (PAM#169) from the DLR laboratory repository [56]. Reflectance spectra in the 0.3–25 μ m spectral range of five PAM#169 size separates ranging from <25 to 250 μ m have been measured in [56]. It has been shown that reflectance and spectral slopes of the powders decrease with decreasing grain size, making fine-grained pyrrhotite an effective darkening agent. The detailed results will be published elsewhere. We prepared two particulate separates: 25–50 μ m (pyrrhotite 25 50 ) and <25 μ m (pyrrhotite < 25 ). The former separate was produced by manual grinding and wet-sieving (with ethanol instead of water, to avoid sample oxidation), while the fine-grained pyrrhotite < 25 has been prepared by hand-crushing followed by colloidal grinding in a planetary grinder [9]. The two pyrrhotite separates display featureless red-sloped VIS-IR spectra (Figure 1c). As observed for other opaque phases where surface scattering dominates [9,57,58], and in [56] for the same sample, reflectance of the pyrrhotite powders decreases with decreasing grain size, with the pyrrhotite < 25 separate being ∼5 times darker than the pyrrhotite 25 50 powder. In this respect, we note that fine-grained iron sulphides have been proposed as darkening materials in cometary surfaces [4,5,9,56].

2.2. Mixtures Preparation

We prepared binary mixtures with the available endmembers with varying abundances, grain sizes, and mixing modalities (Figure 2 and Figure S1 of the Supplementary Materials), as described below:
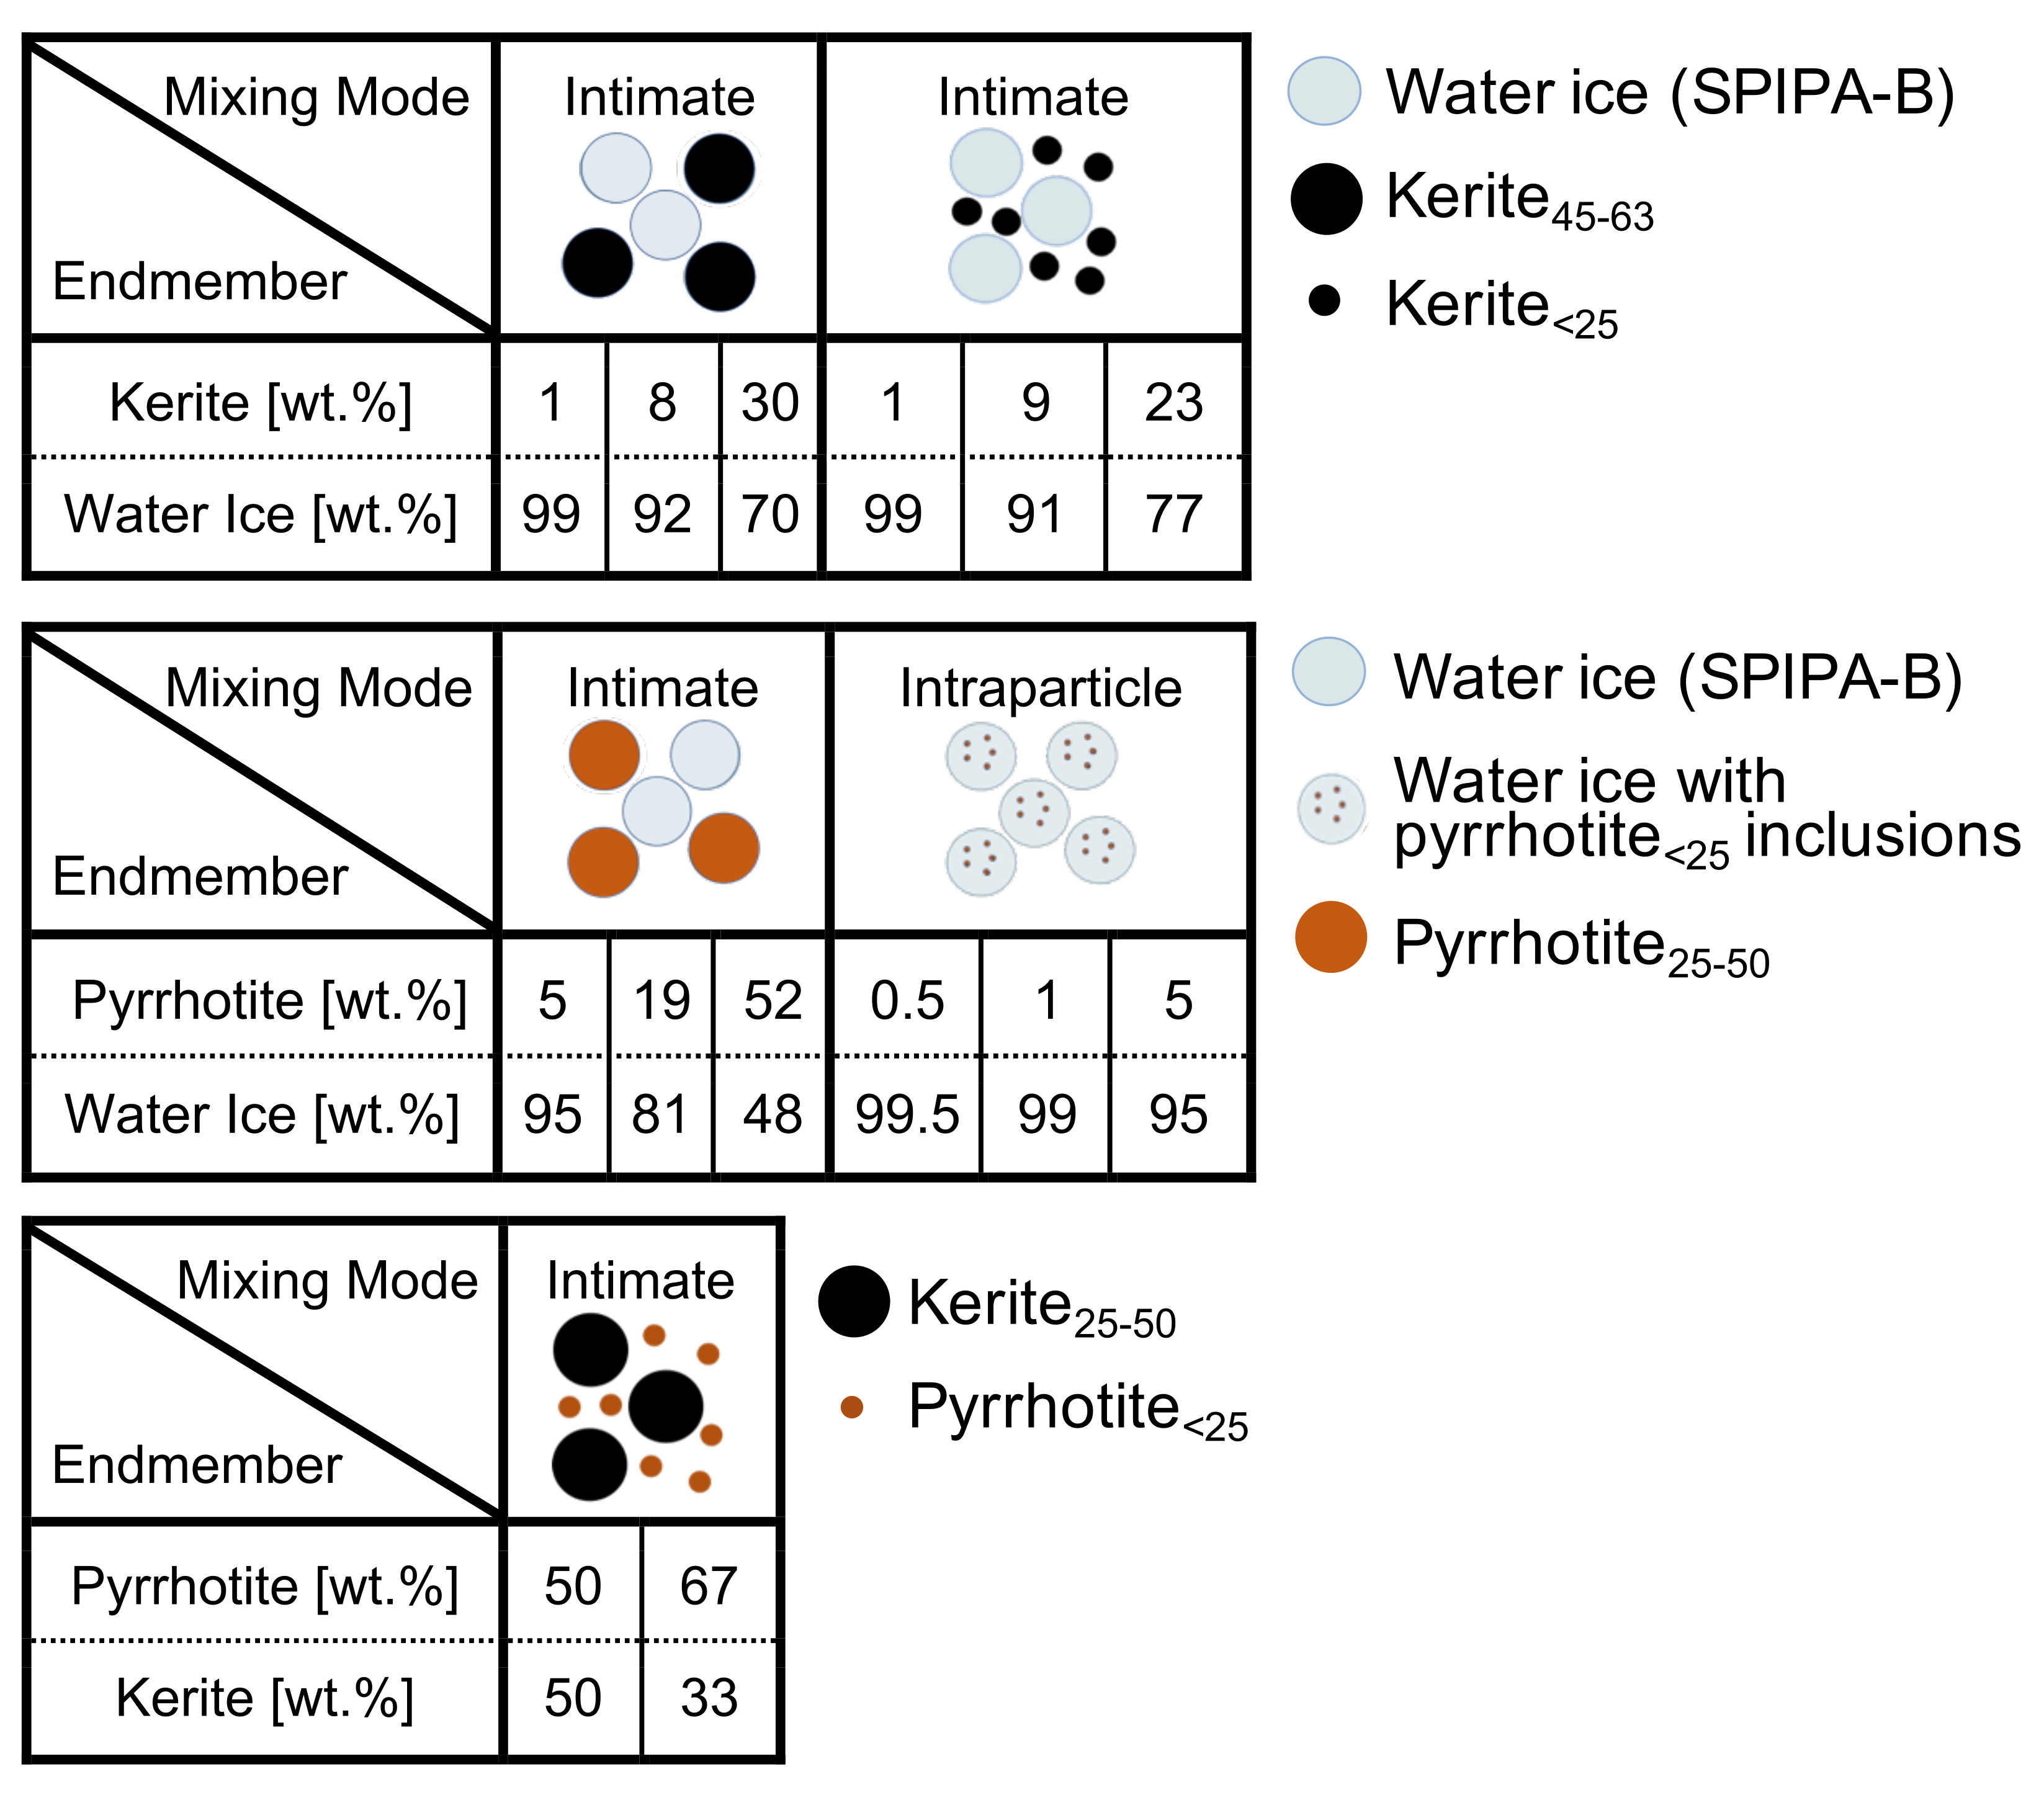
  • Water ice–kerite mixtures: these samples were prepared as an intimate mixture (“salt and pepper”). The mixing was performed adopting a protocol aimed at minimizing any modifications of the water ice grains (SPIPA-B) during the sample preparation and described in Section S2 of the Supplementary Material. Two sets of three binary mixtures were produced, by using the kerite 45 63 and the kerite < 25 grains separately and varying the kerite abundance (Figure 2, top panel).
  • Water ice–pyrrhotite mixtures: these samples were prepared as intimate and intraparticle mixtures (pyrrhotite fine grains embedded in water ice grains) by using the pyrrhotite 25 50 and pyrrhotite < 25 samples, respectively. Intimate mixtures were prepared following the protocol described in Section S2 of the Supplementary Material. Intraparticle mixtures were produced by preparing a suspension of water and pyrrhotite < 25 grains homogenized via ultrasonic mixing (30 s, two times), according to the required mixing ratio, and then by following the protocol for the production of SPIPA-B grains (freezing in liquid N 2 of water droplets with pyrrhotite inclusions). Two sets of three mixtures were prepared, one for each mixing modality (Figure 2, central panel).
  • Kerite–pyrrhotite mixtures: two refractory intimate mixtures were prepared by combining the kerite 25 50 grains and the fine grained pyrrhotite < 25 sample (Figure 2, bottom panel).

3. Mixtures Spectral Behavior

In order to investigate the spectral variations within and among the different sets of mixtures, we compute the continuum-removed spectrum in correspondence with relevant water ice and kerite absorption features and the normalized REFF at selected VIS and IR wavelengths. For mixtures containing water ice, we monitor the 1.25, 1.5, 1.65, and 2 μ m absorptions along with the Fresnel peak at 3.1 μ m. For mixtures containing kerite, we monitor the CH-related absorptions occurring at 3.28, 3.4, and 3.5 μ m, along with the broad absorption occurring at 3.18–3.64 μ m (3.4- μ m complex). The continuum-removed spectrum for each investigated band is derived by dividing the REFF spectrum by the local continuum, defined as a straight line connecting the band shoulders, at positions defined in Table A1 and Table A2. The Fresnel peak region is investigated after normalizing the REFF spectrum at 2.98 μ m, in order to characterize relative variations of the peak amplitude. Finally, to compare the variations of spectral slope at VIS and IR wavelengths for the different mixtures, we computed the REFF spectrum normalized at 0.55 μ m and 1 μ m, respectively.

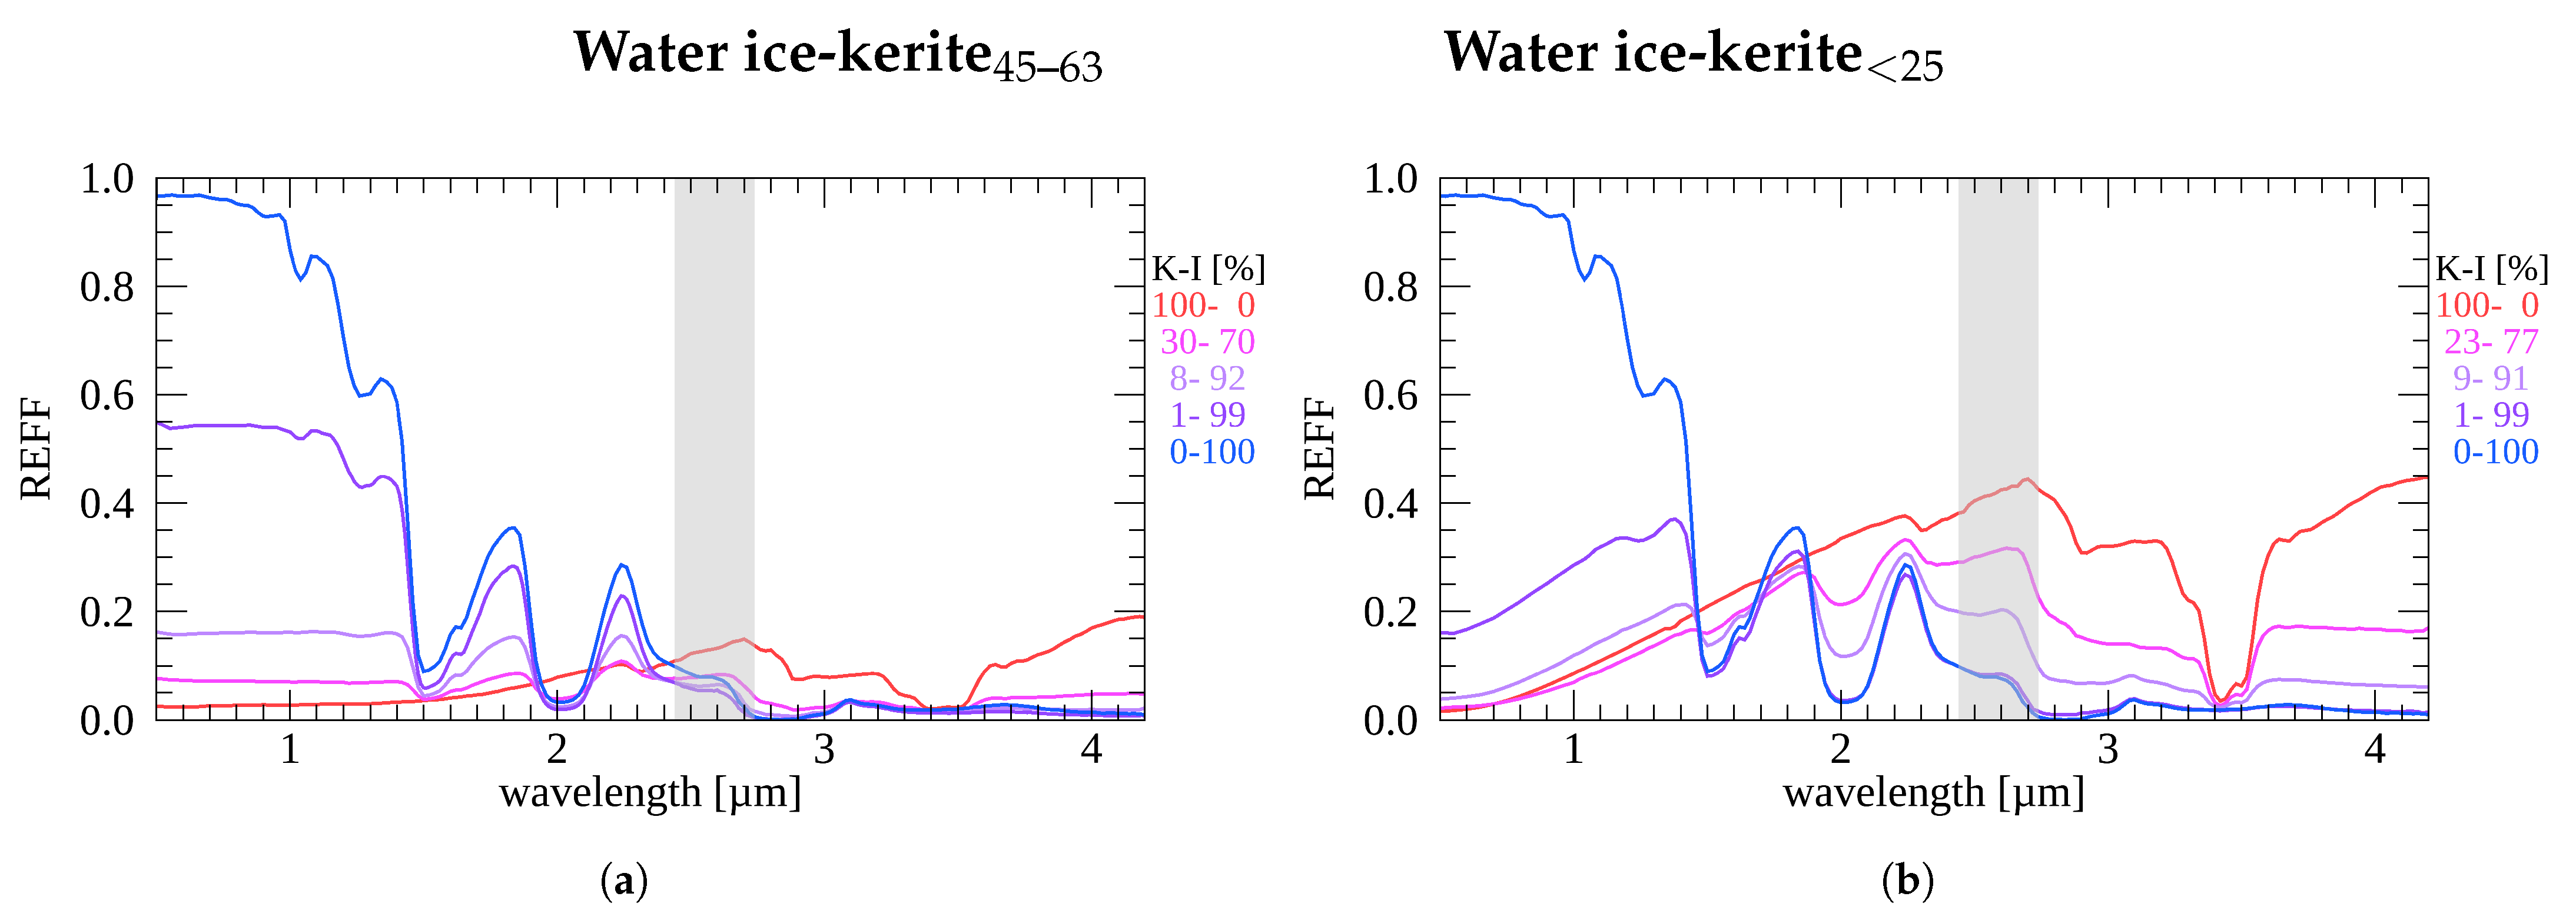
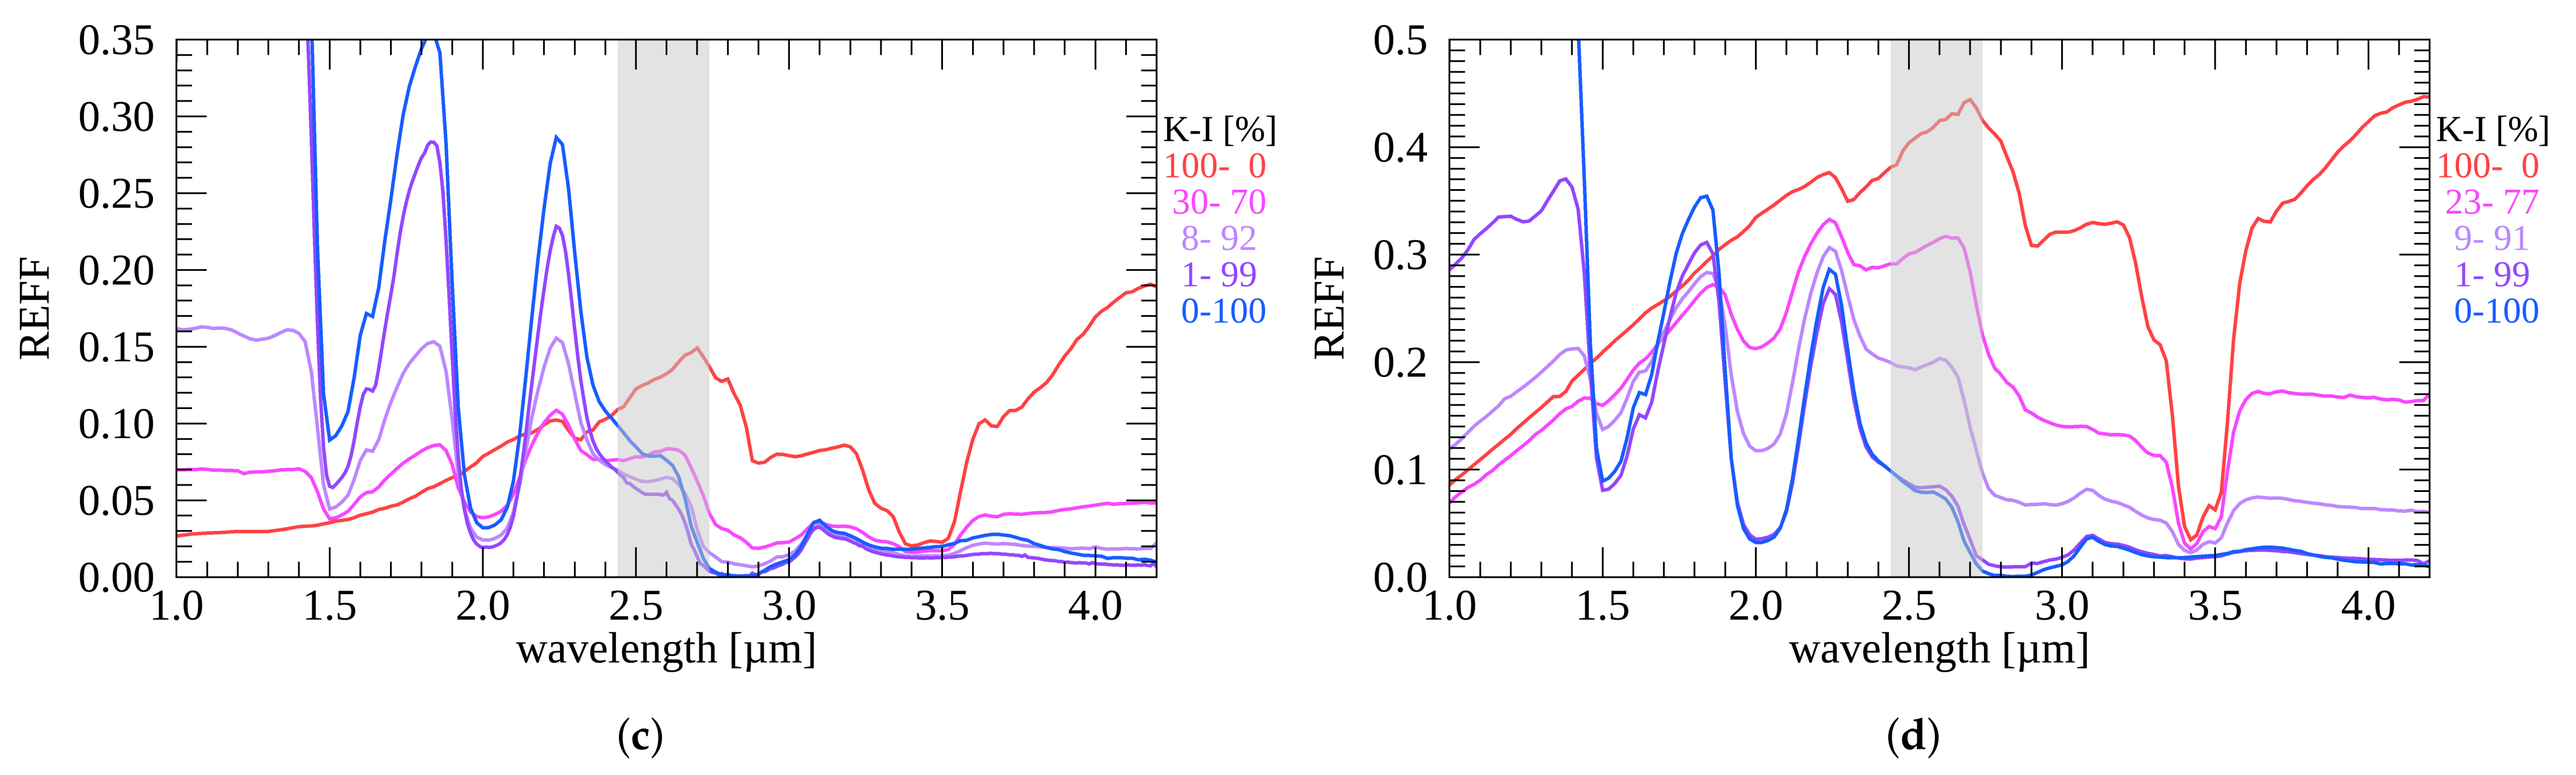
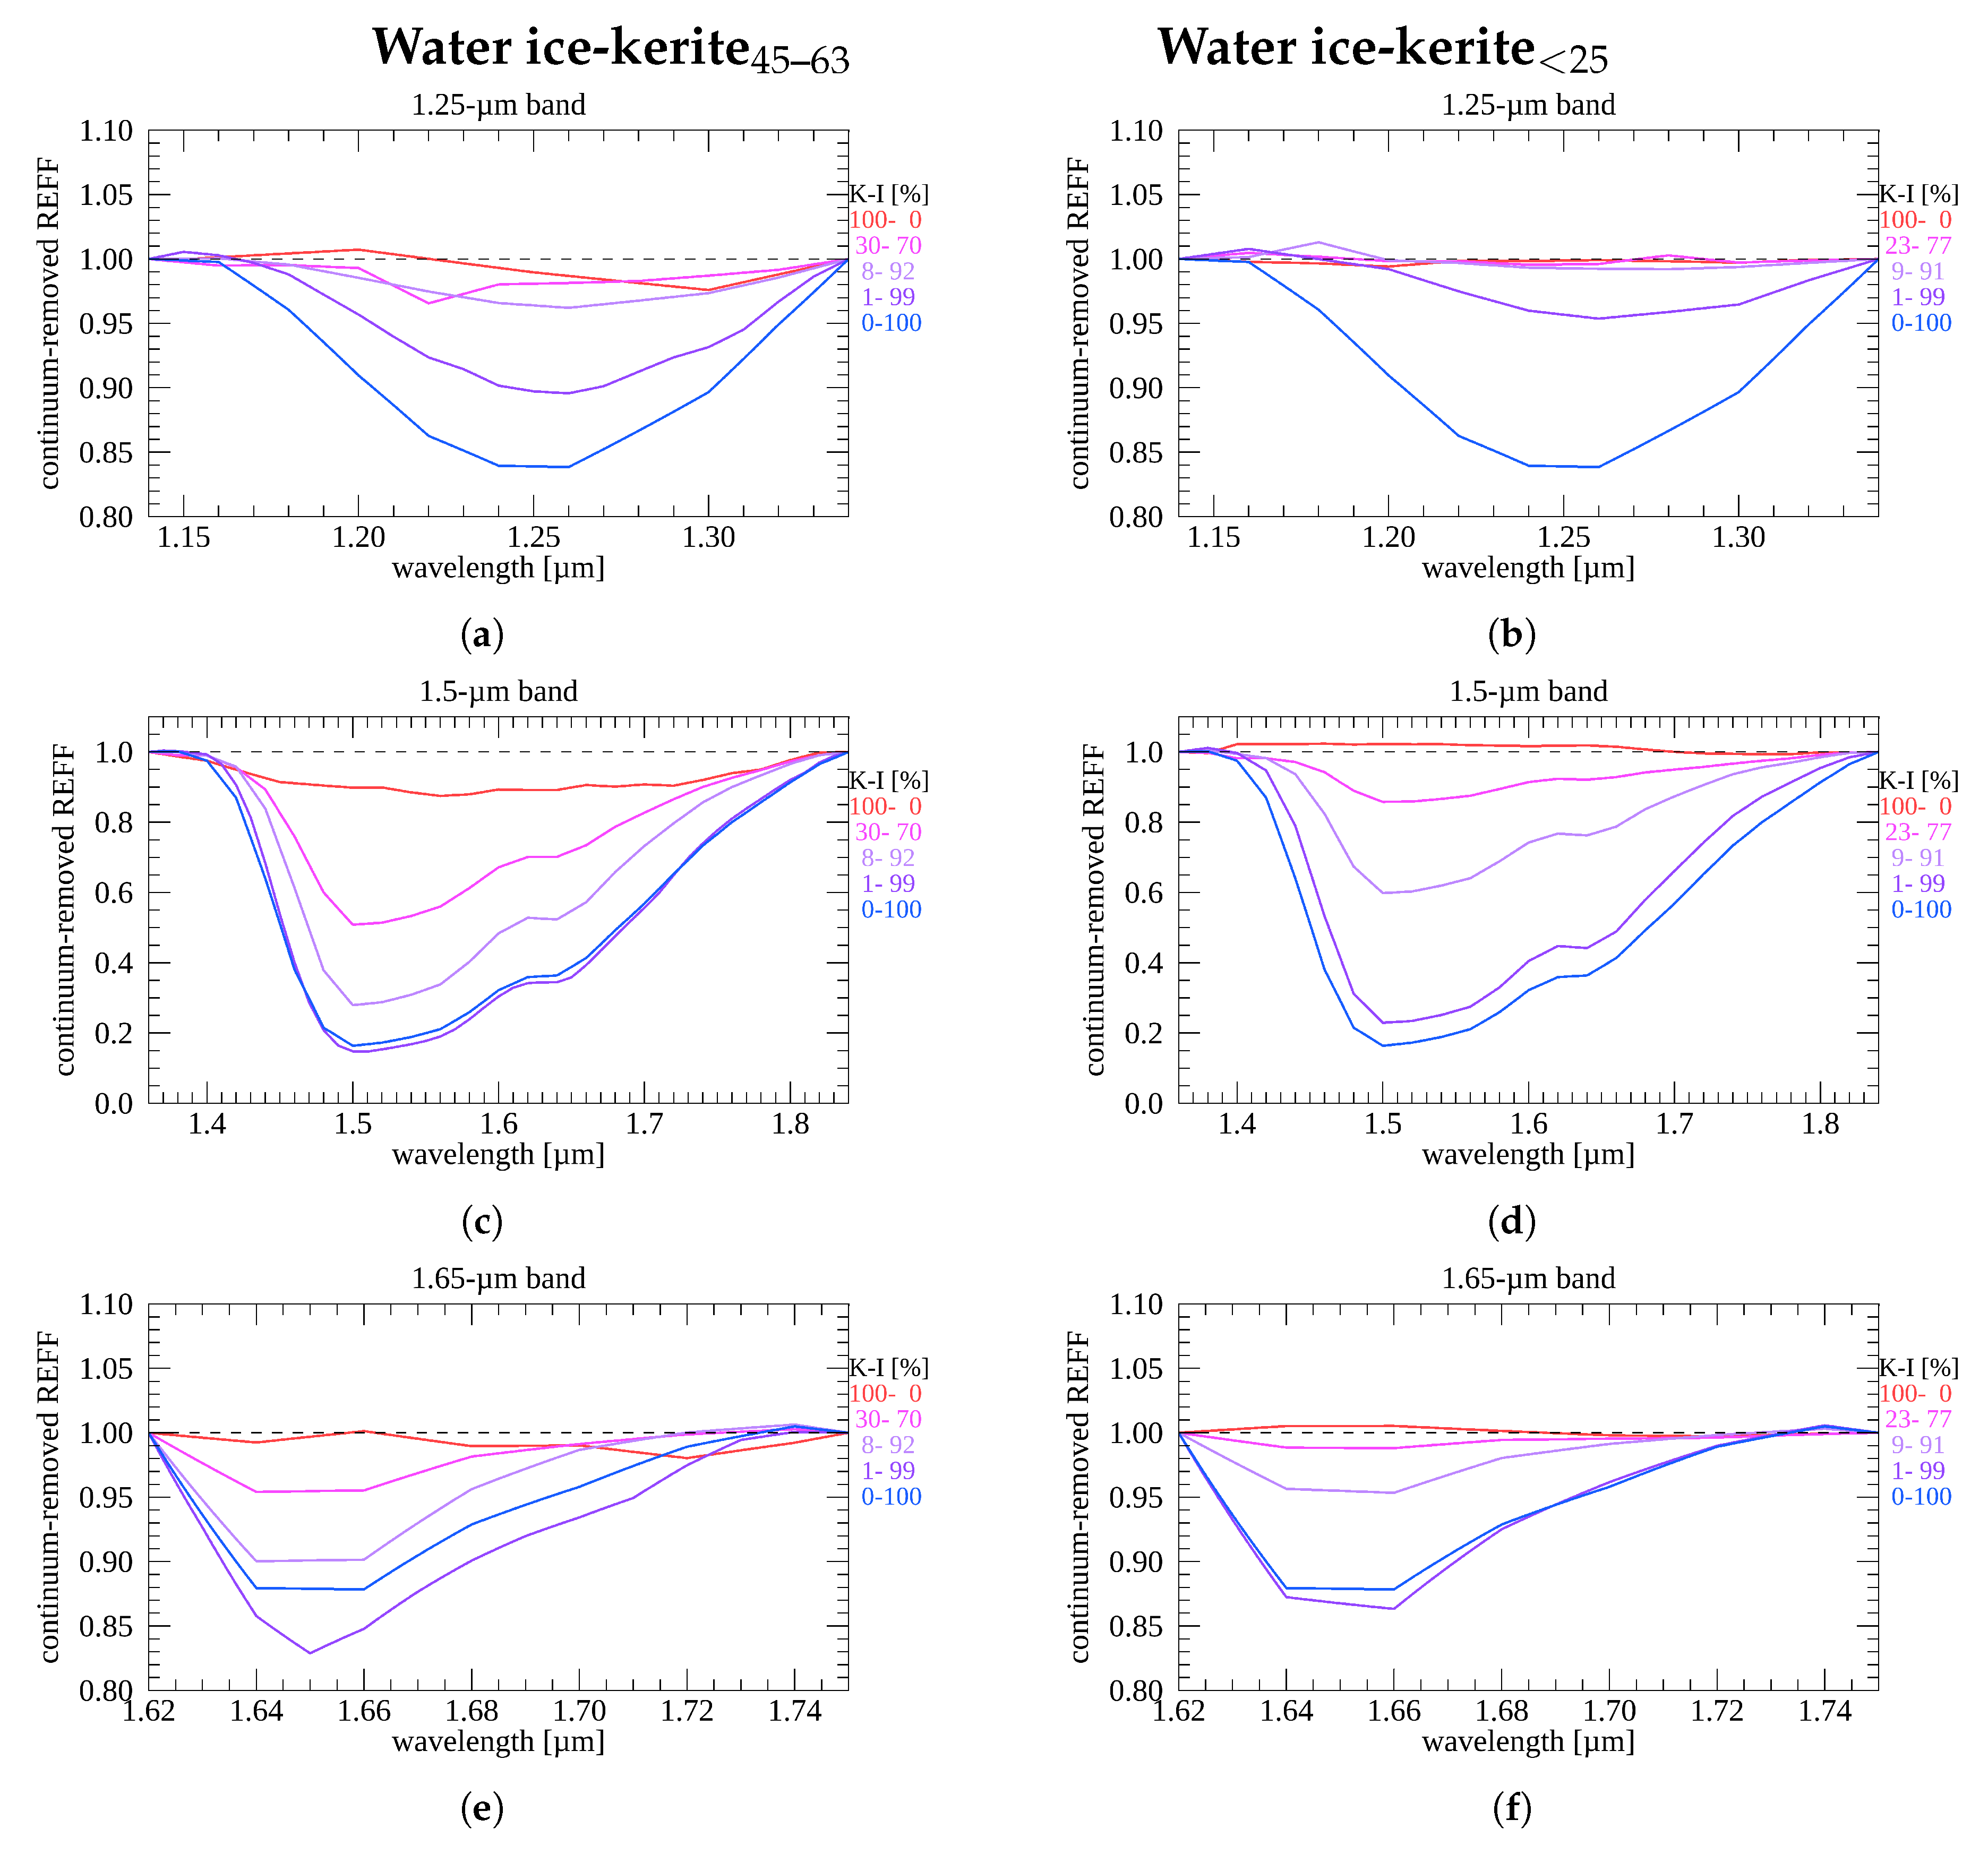
3.1. Water Ice–Kerite Mixtures

The increase of kerite content in water ice–kerite mixtures leads to a general reduction in reflectance at VIS wavelengths and to an increase in the IR, as expected according to the relative reflectance properties of the two endmembers (Figure 3). Nonetheless, we notice some deviations from this general behaviour: an example of this is shown in the 23 wt% kerite < 25 –77 wt% water ice mixture, displaying a lower REFF than the pure kerite sample at VIS wavelengths, where water ice is by far brighter than kerite, indicating that the final photometric properties are not necessarily characterized by a monotonic dependence on the endmember abundances and/or can be affected by additional (secondary) drivers. Along with absolute reflectance variations, with increasing kerite content, the resulting spectra display a globally redder spectral slope, both at VIS and IR wavelengths for the kerite < 25 case and only at IR wavelengths for mixtures containing the kerite 45 63 sample (Figure S2 of the Supplementary Material). The increase of kerite content in the mixtures globally decreases the spectral contrast of ice-related features (Figure 4). In this respect, this effect is more pronounced for kerite < 25 mixtures than kerite 45 63 ones at similar weight mixing ratios. This can be explained by the fact that, given the smaller grain size of the kerite < 25 sample, similar abundances correspond to relatively larger kerite total cross sections and a more effective spectral contribution. Notable examples are represented by the Fresnel peak (Figure 4i,j) that can be still recognized in kerite 45 63 mixtures with kerite abundances up to 30 wt%, while it is not detectable in the 23 wt% kerite < 25 mixture, and by the 1.25 μ m feature (Figure 4a,b), which is present in all the kerite 45 63 mixtures, while being indistinguishable at 9 wt% kerite < 25 . As expected, the increased content of kerite in the mixtures determines a deepening of the kerite-related absorption features (Figure 5). For kerite 45 63 mixtures, the ∼3.4 μ m (minimum at 3.38 μ m), the 3.4 μ m-complex, and the 3.5 μ m bands (Figure 5c,e,g, respectively) are no longer detectable in 1 wt% kerite mixtures, while the 3.28 μ m feature is already hardly recognizable at 8 wt% kerite abundance (Figure 5a,e). For kerite < 25 mixtures (Figure 5), the ∼3.4 μ m band has its minimum shifted to 3.42 μ m, and, along with the 3.4 μ m complex, it is barely detectable at 1 wt% kerite abundances (Figure 5d,f), while the 3.28 μ m and 3.5 μ m features, for the same abundance, are mostly indistinguishable from the local water ice continuum (Figure 5b,f,h).

3.2. Water Ice-Pyrrhotite Intimate Mixtures

The increase in pyrrhotite content in water ice–pyrrhotite intimate mixtures leads to a general reduction of reflectance at VIS wavelengths and an increase in the IR (see Figure 6). Nonetheless, whereas a monotonic increase in the VIS and IR spectral slope is observed for increasing pyrrhotite amounts (Figure S3 of the Supplementary Material), mixtures with the largest abundances of pyrrhotite, namely 19% and 52%, unexpectedly display REFF levels lower than the pure pyrrhotite sample at wavelengths where water ice is brighter than pyrrhotite, similar to what was noted above for the water ice–kerite < 25 case. This again indicates, even more markedly, that the final photometric properties of the mixtures are not necessarily monotonically linked to the endmember abundances and/or may not be driven by the endmember abundances alone. As expected, the increase in pyrrhotite content in the mixtures globally decreases the spectral contrast of water-ice-related features (Figure 7) that, however, are always recognizable, with the only exception of the 1.25 μ m band, being indistinguishable for the 52% pyrrhotite mixture.

3.3. Water Ice–Pyrrhotite < 25 Intraparticle Mixtures

The increasing amount of fine-grained pyrrhotite inclusions in water ice–pyrrhotite intraparticle mixtures leads to a dramatic reduction in REFF over a large part of the investigated spectral range. In particular, at VIS wavelengths, the REFF is approximately 40 times lower for the pyrrhotite-richest mixture (5 wt%) (Figure 8). Conversely, longward of ∼3 μ m, where water ice is extremely absorbing and the Fresnel peak occurs, the final reflectance of the mixture is hardly affected by the pyrrhotite content. This behaviour is compatible with the fact that at wavelengths where water ice is weakly absorbing, light can penetrate the icy grains and is mostly absorbed by pyrrhotite inclusions, whereas at wavelengths where water ice is opaque, light is scattered from the grain surface, without interacting with the embedded pyrrhotite. For increasing amounts of pyrrhotite, the spectral slope of the mixtures progressively increases in the IR, while in the VIS, it is hardly affected for the 0.5 wt% and 1 wt% pyrrhotite cases, and for the 5 wt% pyrrhotite mixture, a negative (blue) spectral slope is observed (Figure S4 of the Supplementary Material). We mention that despite our precautions, after the preparation of the 5 wt% pyrrhotite mixture, a layer of frost formed on top of the sample, which then sublimated during the spectral REFF measurement. This caused a spurious bluing in the resulting spectrum, which we corrected by comparison with a second spectrum of the same sample acquired when (most of) the frost was sublimated (see details in Appendix B). Nonetheless, as mentioned above, a residual bluing in the reference spectrum presented in Figure 8 and Figure S4 can be observed. As such, this could be likely imparted by the fine pyrrhotite inclusions in water ice grains, although a residual frost-related contribution cannot be fully ruled out (see Appendix B), along with residual Rayleigh scattering of isolated smaller-than-wavelength pyrrhotite particles ([59], Robin et al., in preparation). The increase in pyrrhotite content generally reduces the spectral contrast of the water-ice-related features, with the 1.25 μ m and 1.65 μ m features being undetectable at 5 wt% pyrrhotite content. We notice that for the 0.5 wt%-pyrrhotite case, the 1.5 μ m, 1.65 μ m, and 2 μ m features are slightly deeper than for pure water ice, which might be explained by minor differences in the size of the icy grains among the samples. Finally, as anticipated above, the Fresnel peak’s relative intensity is hardly affected by the pyrrhotite abundance (Figure 9).

3.4. Kerite 25 50 –Pyrrhotite < 25 Intimate Mixtures

Reflectance spectra of a larger set of pyrrhotite (PAM#169)–kerite(PAM#42) intimate mixtures with various grain-sizes and modal abundances together with endmember spectra have previously been measured at DLR [56]. It has been found that increasing abundances of the fine-grained (<25 μ m) pyrrhotite in the mixtures progressively decreases overall reflectance, VIS and IR slopes, and the contrasts of absorption bands characteristic for kerite. This provides support to the idea that fine-grained iron sulphides can effectively decrease the IR albedo, suppress IR spectral slopes, and mask absorption features on cometary and other planetary surfaces. The detailed analysis of the measured spectra will be published elsewhere. In this work, we measured only two kerite–pyrrhotite intimate mixtures using a different grain size of kerite (kerite 25 50 ) mixed with 50 and 67 wt% pyrrhotite < 25 . The spectra obtained here confirm all spectral trends observed in [56], except for the slightly lower overall reflectance of the 50% pyrrhotite mixture compared to the 67% pyrrhotite separate in our study (see Figure 10d in Section 4.3.3). Regarding the kerite–pyrrhotite intimate mixtures, our purpose here is only to test the ability of the Hapke reflectance model to reproduce the spectral behaviour of the mixtures of these two refractory materials and to correctly derive modal abundances of the endmembers. The results are discussed in Section 4.3.3.

4. Spectral Modelling

The set of mixtures presented in Section 2.2 gives us the possibility to test the accuracy of the widely used Hapke theory [42] in reproducing the observed spectral output as a function of the endmembers’ physical properties and abundances. For this purpose, we adopt a simplified version of the Hapke equation of the REFF of a particulate surface, as reported below:
R E F F ( i , e , α ) = w 4 1 μ 0 + μ p ( α ) + H ( μ 0 , w ) H ( μ , w ) 1 , μ 0 = cos i , μ = cos e ,
where the observation geometry is determined by the incidence (i), emission (e), and phase ( α ) angles; w is the single scattering albedo (SSA); p ( α ) is the single particle phase function (SPPF); and H ( w , x ) is the Chandrasekhar function [60]. Equation (1) assumes negligible effects of large-scale surface roughness and does not include an explicit modellization of the opposition effect and of the dependence on medium porosity. This simplification allows us to work with a minimum number of free parameters and stems from the considerations below:
  • We expect a minor contribution to the measured reflectance from the opposition effect, as our measurements are performed at a relatively large phase angle ( 30 ).
  • In Hapke theory, the correction for “large-scale” roughness accounts for the fact that real surfaces, due to local topography, are not necessarily smooth at scales larger than the grain size and smaller than the detector footprint. This would affect the target reflectance, due to varying illumination angles on facets (here it is assumed that a macroscopically rough surface is composed by small surface elements, locally smooth, and large compared to the grain size, referred to as “facets”) with randomly distributed slopes and facet shadowing effects. Although, in principle, this effect should be small in laboratory samples, Ref. [61] showed that roughness at scales from the grain size up to few millimetres may still produce a non-negligible photometric contribution. Nonetheless, our measurements are performed at a relatively small phase angle, suggesting these effects should be minor.
  • The effect of porosity in closely packed media on the surface reflectance has been introduced and modelled in [62]. However, unless the porosity is measured independently, in the inversion process, the effects of porosity can possibly be compensated by varying the single scattering albedo [42], thus not allowing us to fully decouple the two quantities. Given this, in many applications of the Hapke model to remote sensing observations, porosity effects are usually not explicitly modelled. We align with this approach in order to test the model in similar conditions of applicability.

4.1. Modelling Intimate Mixtures

According to [42], the single scattering albedo of intimate mixtures of touching particles much larger than the wavelength can be computed as a linear combination of the single scattering albedo of the mixture endmembers, weighted by their abundance and geometric cross section. The expression of the single scattering albedo for a mixture is then given by
w m i x = i p i σ i w i i p i σ i ,
where the subscript i indicates the different endmembers, w i is the i’th endmember single scattering albedo, σ i is the corresponding grain geometric cross-section, and p i is the numerical abundance. Equation (2) can be expressed as a function of the relative mass fraction of a given endmember ( M i ) as
w m i x = i M i w i d i ρ i i M i d i ρ i ,
where we assumed spherical grains, and d i and ρ i represent the size (diameter) and bulk density of each endmember, respectively. If a given endmember is characterized by a polydisperse grain size distribution, it can be shown that the corresponding diameter in Equation (3) can be expressed as
d i = d 3 i d 2 i ,
where the brackets indicate averages over the grain size distribution. This represents the characteristic diameter of the equivalent monodisperse distribution having the same ratio between the total volume and total cross-section (volume per unitary cross-section) of the polydisperse case. In the case of binary mixtures ( i = 1 , 2 ), Equation (3) can be rearranged in the form
w m i x = w 1 + w 2 ρ 1 ρ 2 M 2 M 1 d 1 d 2 1 + ρ 1 ρ 2 M 2 M 1 d 1 d 2 ,
where the SSA of the mixture is expressed as a function of the endmember masses and size ratios. Equations (3) and (5) can be generalized to non-spherical particles by interpreting the grain size d of a given endmember as an effective grain size [63], given by
d e f f = 3 v 2 σ ,
where v and σ are the average volume and cross section of the grains. Note that the proposed definition of effective size is slightly different from the one given by [63] that does not include the factor 3 2 . For a monodisperse distribution of spherical particles with size d, Equation (6) provides d e f f = d .
In this study, with the exception of the intraparticle mixture cases (see Section 4.2), the SSA of an intimate mixture is computed as a function of the endmember SSAs, respectively derived by inverting Equation (1) over the corresponding endmember REFF spectrum, applying a common approach in spectral un-mixing attempts of remote sensing observations [64,65]. For simplicity, and since we do not have a characterization of the SPPF of all the endmembers, this is done by assuming isotropic scattering ( p ( α ) = 1 ) [65,66,67]. The same assumption is adopted when the modelled mixture REFF is computed. Then, for intimate mixtures, our approach depends only on the mixture SSA that is in turn a function of the endmember SSAs, mixing ratios and size ratios. We can anticipate that this method is not able to fully reproduce the observed photometric variability of the measured mixtures, where, in a few cases, the resulting mixture REFF at certain wavelengths is not in between the REFFs of the endmembers. This cannot be accounted for by the simple linear mixing of the endmember SSAs. The possible causes for this effect can be represented by uncontrolled porosity differences among different samples and non-linear multiple scattering effects coupled to anisotropic SPPFs. In particular, we investigated this latter possibility with Monte Carlo ray-tracing simulations [68] in Appendix C for the case of water ice–pyrrhotite intimate mixtures, assuming that the transparent water ice grains are characterized by a forward-scattering SPPF and that opaque pyrrhotite grains are mostly back-scattering. Our simulations suggest that the resulting mixture can effectively be characterized by a VIS reflectance lower than the pure pyrrhotite case. In this case, forward-scattering water ice grains scatter light deep into the medium, providing a net reduction of the mixture REFF, which prevails over the REFF increase induced by the bright water ice grains if water ice abundance is not high enough.
Given that with the present set of measurements we do not have the possibility to separately characterize the different contributions affecting the final REFF of the mixture, as a characterization of the sample porosity and of the endmember SPPF is missing, and that the above-mentioned effects are not modelled in the simplified formulation of the Hapke model adopted here, we account for them by introducing an empirical scaling factor (C), multiplying Equation (1). As such, we are then testing a semi-empirical application of the Hapke model, and the resulting REFF equation (including the condition p ( α ) = 1) is
R E F F ( i , e , α ) = C w 4 1 μ 0 + μ H ( μ 0 , w ) H ( μ , w ) . μ 0 = cos i , μ = cos e ,
where the SSA is the only wavelength-dependent quantity. In particular, we fit the model to the measured REFF of the mixtures by letting the scaling factor C and endmember mixing ratios be free to vary, while assuming as a reference grain size of each endmember the central value of the sieving size interval (as described in Section 4.3.1, for SPIPA-B grains, a more accurate description of the size distribution is available, which we adopted). This approach is similar to common remote sensing applications, where the endmember mixing ratios of the target are unknown, limited information about the porosity and single particle phase function of the target and of the endmembers used for un-mixing is often available, and empirical corrective factors are introduced in the modelling effort [11,20,64,69]. The estimated mixing ratios from the fitting process are finally compared to the nominal values of the different mixtures to asses the ability of the model at constraining endmember abundances in a spectral un-mixing attempt.

4.2. Modelling Intraparticle Mixtures

The optical effects of fine grained inclusions of a given material in a host particle of a different composition are typically modelled by applying methods based on the effective medium theory (EMT, [45]) as in [27,29,30,35,70,71], in which effective optical constants n eff = n e f f + i k e f f of the whole grain are computed as a combination of the host material and inclusion of optical constants ( n h = n h + i k h and n in = n i n + i k i n , respectively), through the Maxwell–Garnett rule [72]:
ϵ e f f = ϵ h + 3 ϵ h f ϵ i n ϵ h ϵ i n + 2 ϵ h f ( ϵ i n ϵ h ) ,
where ϵ is the dielectric constant, and ϵ = n + i k (subscripts omitted for brevity). This modellization, being based on the assumption that the inclusions are much smaller than the wavelength, does not depend on the inclusion size, while depending on the corresponding volumetric density f in the host grain. The effective optical constants are then used within the Hapke theory framework to compute the grain single scattering albedo. The SSA expression for a particulate material of closely spaced particles, assuming no internal scattering within grains [73], is given by
w = S e + ( 1 S e ) 1 S i 1 S i e α 2 3 D e α 2 3 D ,
where S e and S i are the exterior and internal surface reflection coefficients, respectively, depending on the material optical constants (see [42] for full expressions); D is the particle diameter; and α = 4 π k / λ is the absorption coefficient of the material. By applying a similar EMT-based method to silica gel powders infused with nanophase-iron, [71] showed that the model is able to reproduce the measurements in the case of small inclusions while failing in the case of relatively large ones (of the order of 10 times the wavelength). An alternative approach was then developed by Lucey and Riner, 2011 (hereafter LR11, [46]), which assumes inclusions of finite size, whose absorption efficiency is computed by means of Mie theory [74] and is included as an additional contribution to the total absorption in the host grain as derived from Hapke theory, providing a modified expression for the single scattering albedo:
w L R 11 = S e + ( 1 S e ) 1 S i 1 S i e ( α + α M i e ) 2 3 D e ( α + α M i e ) 2 3 D ,
where α M i e = q a σ i n N , with q a representing the Mie absorption efficiency of the included particles, σ i n their geometric cross section, and N the number density of inclusions in the host grain. We note that in this approach, S e and S i are computed as a function of the optical constants of the host grain, while the optical constants of the inclusions enter in the computation of q a , where the host-adjusted complex refractive index of the inclusions n ˜ = n in / n h is considered.

4.3. Hapke Modelling Results

4.3.1. Water Ice–Kerite Intimate Mixtures

In Figure 10a,b, we show the fits obtained by Hapke modelling of water ice–kerite mixtures, applying the semi-empirical approach (Equation (7)) described in Section 4.1, and the corresponding estimated parameters are reported in Table 1. In Equation (2), we assume ρ i c e = 0.9288 [75] and ρ k e r i t e = 1.1 g/cm 3 ([54], and references therein). Since for the SPIPA-B particles, the grain size distribution has been accurately characterized ([37,39], the size distribution can be found at the following link: https://www.sshade.eu/data/MATSOLSPIPA-BOP20171009, accessed on 18 October 2021). We can estimate the corresponding second ( d 2 ) and third moments ( d 3 ) and apply Equation (4) to compute the water ice particle effective size ( d e f f = 104 μ m, thus larger than the nominal grain size distribution central value d = 67 μ m). Conversely, for the kerite endmembers, we assume a monodisperse grain size distribution with a central value given by the average of extremes of the sieved size interval. As such, we assume d = 54 μ m and d = 12.5 μ m for the kerite 45 63 and kerite < 25 samples, respectively. In the fit procedure, we let the mixing ratio be free to vary along with the scaling factor C, while using as input the SSA spectrum of the endmembers. It can be noted that for the kerite 45 63 intimate mixtures, the modelled spectra reproduce the measured ones fairly well, with normalized root mean square deviation (NRMSD) ≤10% (the NRMSD is computed as the model RMSD divided by the average of REFF over the investigated wavelength range), and a reasonable accuracy is achieved for the kerite < 25 case (NRMSD ≤ 22%), where larger differences are noted in the short wavelength region of the spectrum, in the range of the Fresnel peak, and longward of 3.6 μ m. In both the kerite 45 63 and kerite < 25 cases, the amount of kerite is overestimated for all the mixtures. We consider the possibility that this is due to the overestimation of the kerite size with the adopted value of grain diameter. Conversely, we consider unlikely the alternative possibility of an underestimation of the water ice grain size, as SPIPA-B particles are almost perfectly spherical, and their grain size distribution has been thoroughly characterized. To test this hypothesis we compute the adjusted grain size d * of the kerite sample which would provide the correct abundance in the mixtures, according to Equation (3). The obtained values are reported in Table 1. We find that accurate mixing ratios can be obtained with values of d * ∼ 21–30 μ m and d * = 3.3–6.7 μ m for the kerite 45 63 and kerite < 25 samples. The resulting d * values, separately similar for each set of mixtures, suggest that the characteristic grain size of the sample is significantly smaller than the one adopted from the sieving size limits. In this respect, the derived d * values would provide an estimate of the kerite effective size. This appears qualitatively in agreement with scanning electron microscope (SEM) images of the samples reported in Figure 11a,c. Both the kerite 45 63 and kerite < 25 particles are in fact characterized by irregular shapes, with the size along at least one dimensional axis often significantly smaller than the sample reference size (and, for kerite 45 63 , smaller than the nominal sieved lower limit), possibly leading to an overestimation of the grain volume/cross-section ratio under the simplifying assumption of nearly spherical (equant) grains. In this respect, it is important to mention that whereas for spherical grains, the effective size as defined above is equal to the grain diameter, for flattened (ideally disk-shaped) particles, the effective size is proportional only to their smallest dimension (grain thickness) [63]. In addition, for the kerite 45 63 sample, despite the washing procedure in the preparation of the sample, SEM images indicate a fraction of fine-grained particles (much smaller than the nominal sieved lower limit, Figure 11a right panel), likely further reducing the effective grain size of the sample.

4.3.2. Water Ice–Pyrrhotite Intimate Mixtures

We apply the same approach as the one described in Section 4.3.1 to model the spectra of water ice–pyrrhotite 25 50 mixtures. The resulting fits are shown in Figure 10c, and the corresponding estimated parameters are reported in Table 1. For the pyrrhotite endmember, we assumed a monodisperse grain size distribution with d = 37.5 μ m and bulk density ρ p y r r h o t i t e = 4.6 g/cm 3 [75]. The modelled spectra reproduce the measurements fairly well, with larger differences only at VIS wavelengths, where the spectral slope predicted by the model is slightly overestimated for the 5 wt% and 19 wt% pyrrhotite cases. However, the predicted pyrrhotite abundances considerably overestimate the nominal values of the mixtures. As for the water ice–kerite case, this can be explained by an overestimated reference grain size for the pyrrhotite endmember. We then computed the pyrrhotite-adjusted grain size for all the mixtures, obtaining d * = 3.5–4.9 μ m. As for the water ice–kerite case, the similarity among the estimated d * for the different mixtures in fact suggests that the reference grain size systematically overestimates, by a comparable amount, the effective one. This is further supported by the SEM images of the pyrrhotite 25 50 separate, characterized by irregular, flattened grains, and by residual fine-grained particles surviving the washing procedure (Figure 12a). Assuming that in the pyrrhotite 25 50 case, d * also provides an estimate of the effective grain size, we find that this is ∼10 times smaller than the reference size, while for kerite 45 63 mixtures it is smaller by a factor of ∼2. This is in qualitative agreement with the SEM images of the two endmembers, with the pyrrhotite 25 50 grains having much more irregular and flattened shapes with respect to kerite 45 63 (Figure 11a and Figure 12a).

4.3.3. Kerite–Pyrrhotite Intimate Mixtures

Results of the spectral modelling of kerite 25 50 –pyrrhotite < 25 mixtures are reported in Figure 10d and Table 1. The spectral match is relatively good for the two cases, with NRMSD ≤ 5%. The estimated abundances are computed at first assuming a reference grain size of 37.5 μ m and 12.5 μ m for kerite and pyrrhotite, respectively. This leads to a large overestimation of the pyrrhotite amount in the mixtures, suggesting that the assumed reference sizes for the two endmembers are not good proxies of their effective sizes. As shown in Equation (5), the resulting SSA of the mixture depends only on the endmember size ratio. We then adjust this quantity in order to match the nominal weight abundances in each mixture. Notice that this approach slightly differs from the one described above for water-ice-bearing mixtures, for which the effective grain size of water ice was independently characterized, allowing us to adjust the grain size of the second endmember separately. For both the kerite 25 50 –pyrrhotite < 25 mixtures (50%–50%, 33%–67%) we obtain a similar adjusted size ratio (27 vs. 29), considerably larger than the size ratio obtained from the endmembers’ reference size values ( 37.5 / 12.5 = 3 ), suggesting that the kerite 25 50 effective size is much larger than the one of pyrrhotite < 25 . This appears to be confirmed when kerite 25 50 and pyrrhotite < 25 SEM images are compared (Figure 11b and Figure 12b), with the kerite 25 50 sample dominated by relatively large (mostly from a few to tens of microns) single grains, while the pyrrhotite < 25 sample is characterized by irregular aggregates of variable sizes formed by sub- μ m units. Given this, we also note that these modelling results should be considered with caution, as applied to mixtures including grains typically smaller than the wavelength, while the Hapke model is based on the assumption of geometric optics.

4.3.4. Water Ice–Pyrrhotite Intraparticle Mixtures

For the case of water ice–pyrrhotite intraparticle mixtures, we attempt to model the measured spectra by applying the two different approaches described in Section 4.2, using the EMT-based method and the Lucey and Riner (2011) model (LR11), respectively. To this aim, we use pyrrhotite optical constants from ellipsometry measurements [76] by [77] below 1.1 μ m and U. Schade (private communication) at longer wavelengths, while for water ice, we use optical constants from [35], and references therein. In this comparison, we do not include a scaling factor in the Hapke model REFF equation and let the single particle phase function ( p ( 30 ) ) be a free wavelength-independent parameter in the fitting routine (Equation (1)). Additionally, we let the size of the icy grains be free to vary (and the size of the pyrrhotite inclusion as well, for the LR11 model), allowing for larger flexibility of the model, while keeping, at first, the amount of pyrrhotite inclusions fixed to the nominal value.
We find that the EMT-based approach is not able to reproduce the observed spectral behaviour of the water ice–pyrrhotite intraparticle mixtures. In particular, the match remains unsatisfactory (NRMSD = 24–69%) even when letting the inclusion abundance be a free parameter (Figure 13a,b and Table 2 top panel). Conversely, a much better match is obtained with the LR11 model (NRMSD = 10–11%, Figure 13c,d and Table 2 bottom panel), assuming the nominal pyrrhotite abundances, with the only exception of the 0.5 wt%-pyrrhotite case, for which this has been adjusted. The model, in particular, is able to reproduce the prominent Fresnel peak and part of the VIS bluing of the pyrrhotite-richest mixture. We note that according to the model, the latter effect is a result of the scattering properties of the pyrrhotite inclusions; however, we recall that a residual frost-related contribution to the VIS bluing cannot be excluded, along with Rayleigh scattering from smaller-than-wavelength isolated pyrrhotite grains. Larger differences with respect to the measured spectrum are noticeable at ∼2.8 μ m and around ∼3.6 μ m, and a general slight overestimation of the water ice major absorption spectral contrasts can be noted. The model infers micron-sized pyrrhotite inclusions, similar among the different mixtures, while the estimated icy grain size progressively decreases with increasing pyrrhotite content. This latter effect may not necessarily reflect an actual decrease of the sample grain size, whereas it could point to the model being only partly able to account for the spectral contrast reduction of the water ice features due to increasing pyrrhotite amounts, thus requiring a grain size adjustment in the fit.

5. Discussion and Conclusions

The results of our measurements on binary mixtures including kerite and/or water ice powders provide certain insights into the possibility to characterize the abundance and physical properties of water ice and organics from remote sensing observations of planetary surfaces and spectral modelling, which we enumerate and discuss below:
1.
We find that minor amounts (≲1 wt%) of aliphatic organics can remain undetected in mixtures with coarse-grained (characteristic size of several tens of microns) water ice if searched by means of the diagnostic absorption features around 3.4 μ m. A significant reduction of the reflectance level and overall increase of the VIS-IR spectral slope are already noticeable with the lowest organic abundances explored by our experiments, which, however, would not be easy to disentangle from the contribution of other spectrally bland, yet VIS-IR reddish, absorbing materials. Our measurements also suggest that fine-grained fractions of organic materials with intense aliphatic features would be more easily detected than coarse-grained ones with similar abundance when mixed with relatively large water ice grains. This is due to the more favourable grain cross-section/volume ratio and, for the specific kerite sample adopted in this study, to the more intense 3.4- μ m feature in the spectrum of the kerite < 25 separate compared to that of the kerite 45 63 powder. For the latter separate, the spectral contrast of the feature is reduced by partial saturation of the absorption bands around 3.4 μ m. Fine-grained insoluble organic matter (IOM) isolated from carbonaceous chondrites is characterized by a much less intense absorption around 3.4 μ m (band depths <0.12, [64]) compared to the one observed in our kerite < 25 separate (∼0.9). Given this, we can anticipate that IOM-like material mixed with coarse-grained water ice would likely be characterized by detectability thresholds significantly larger than the ones obtained in this study.
2.
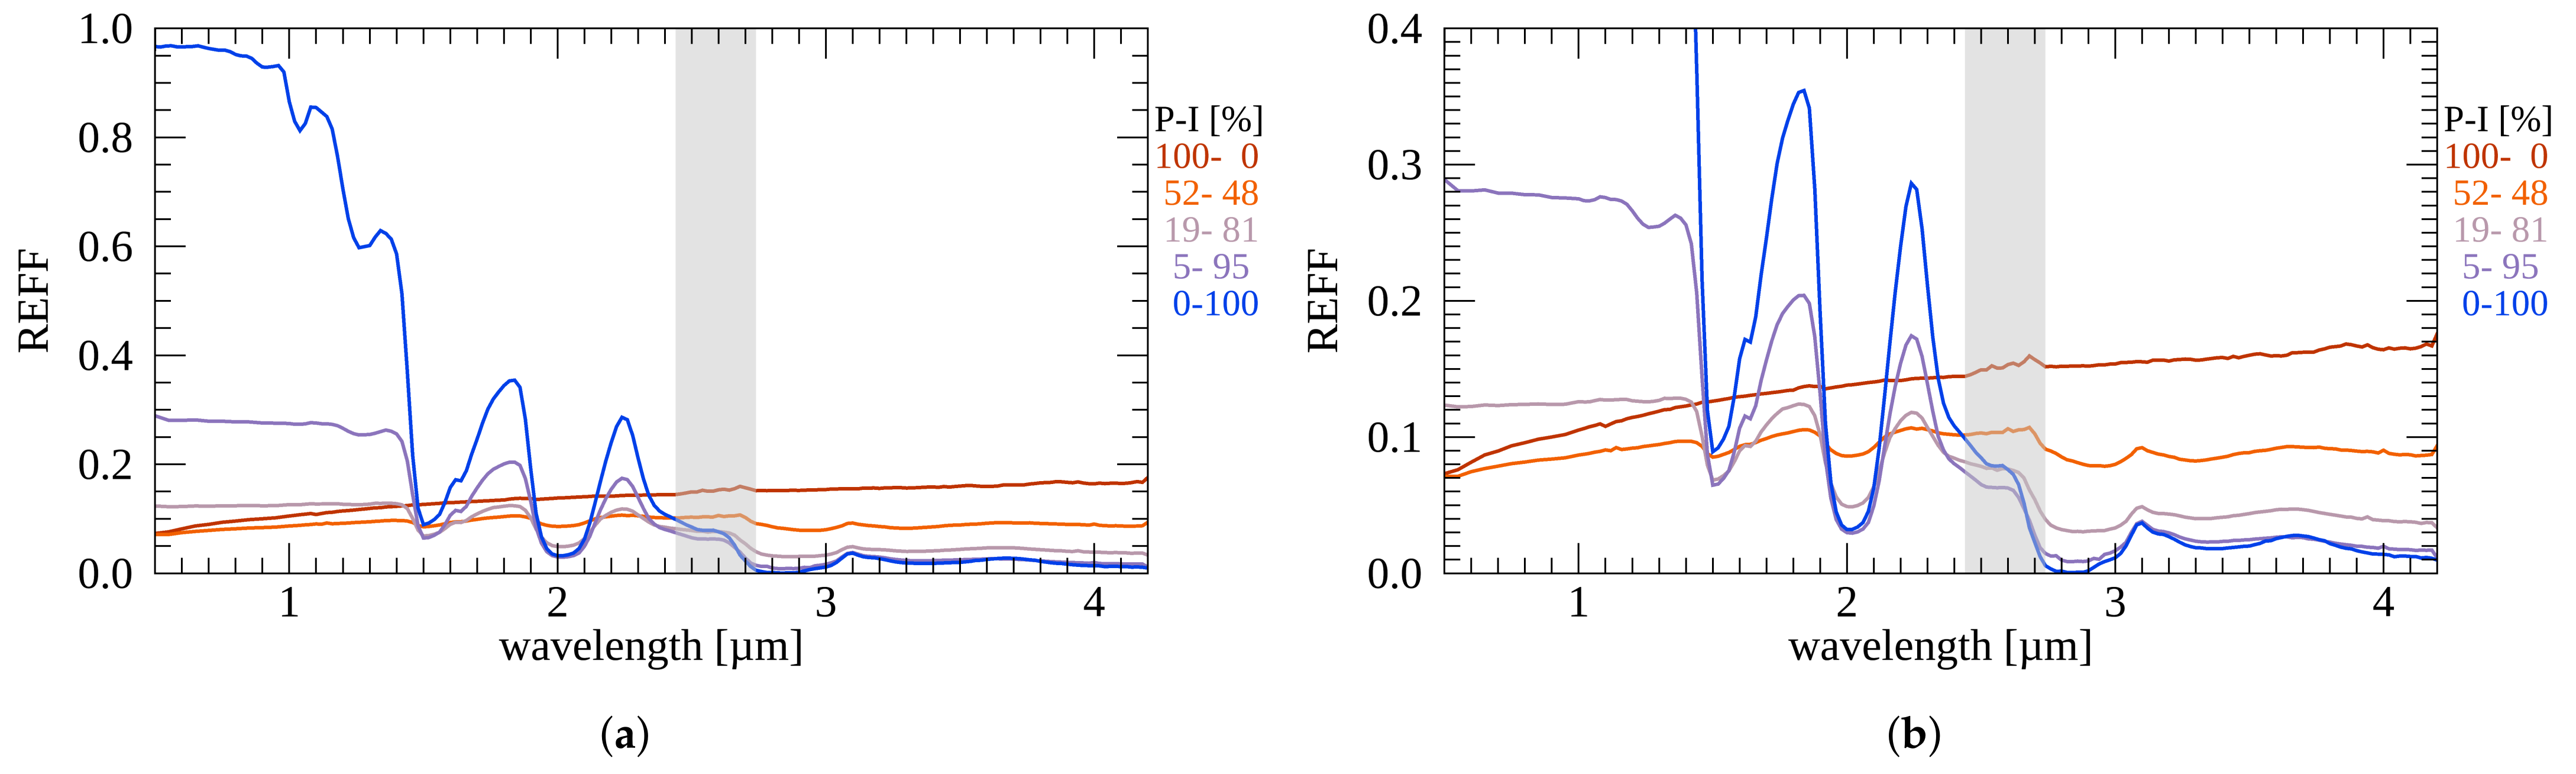
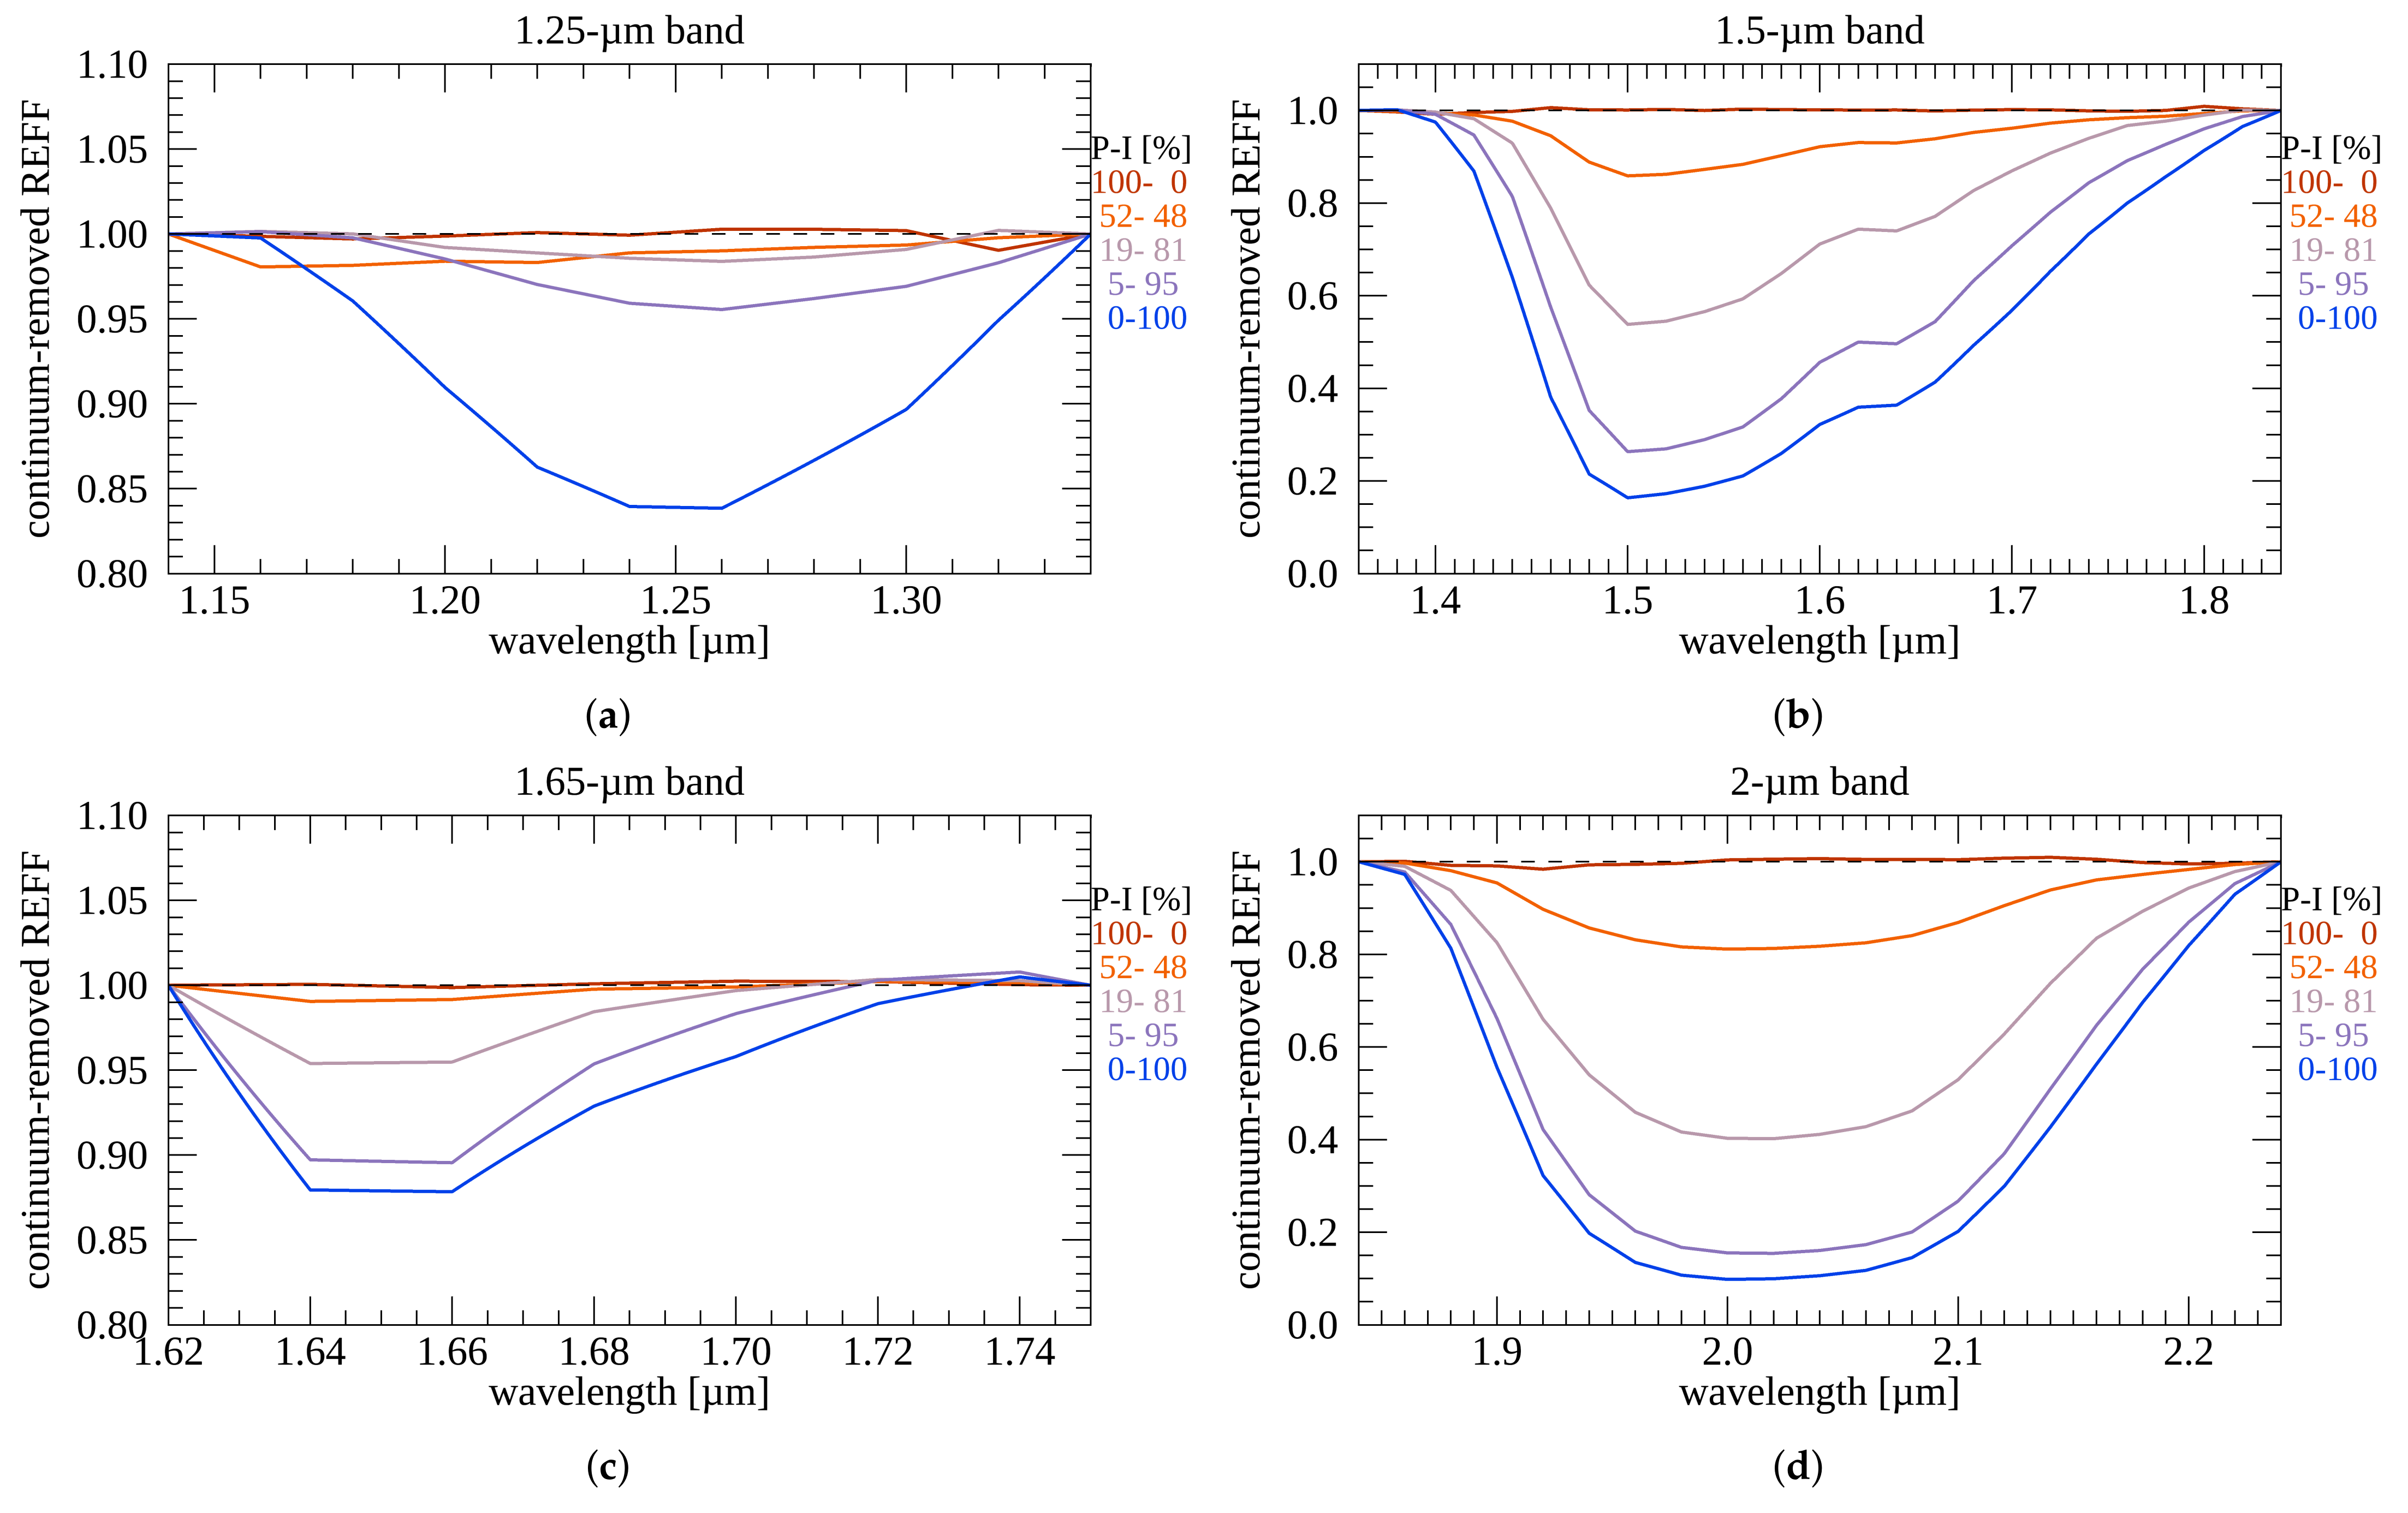
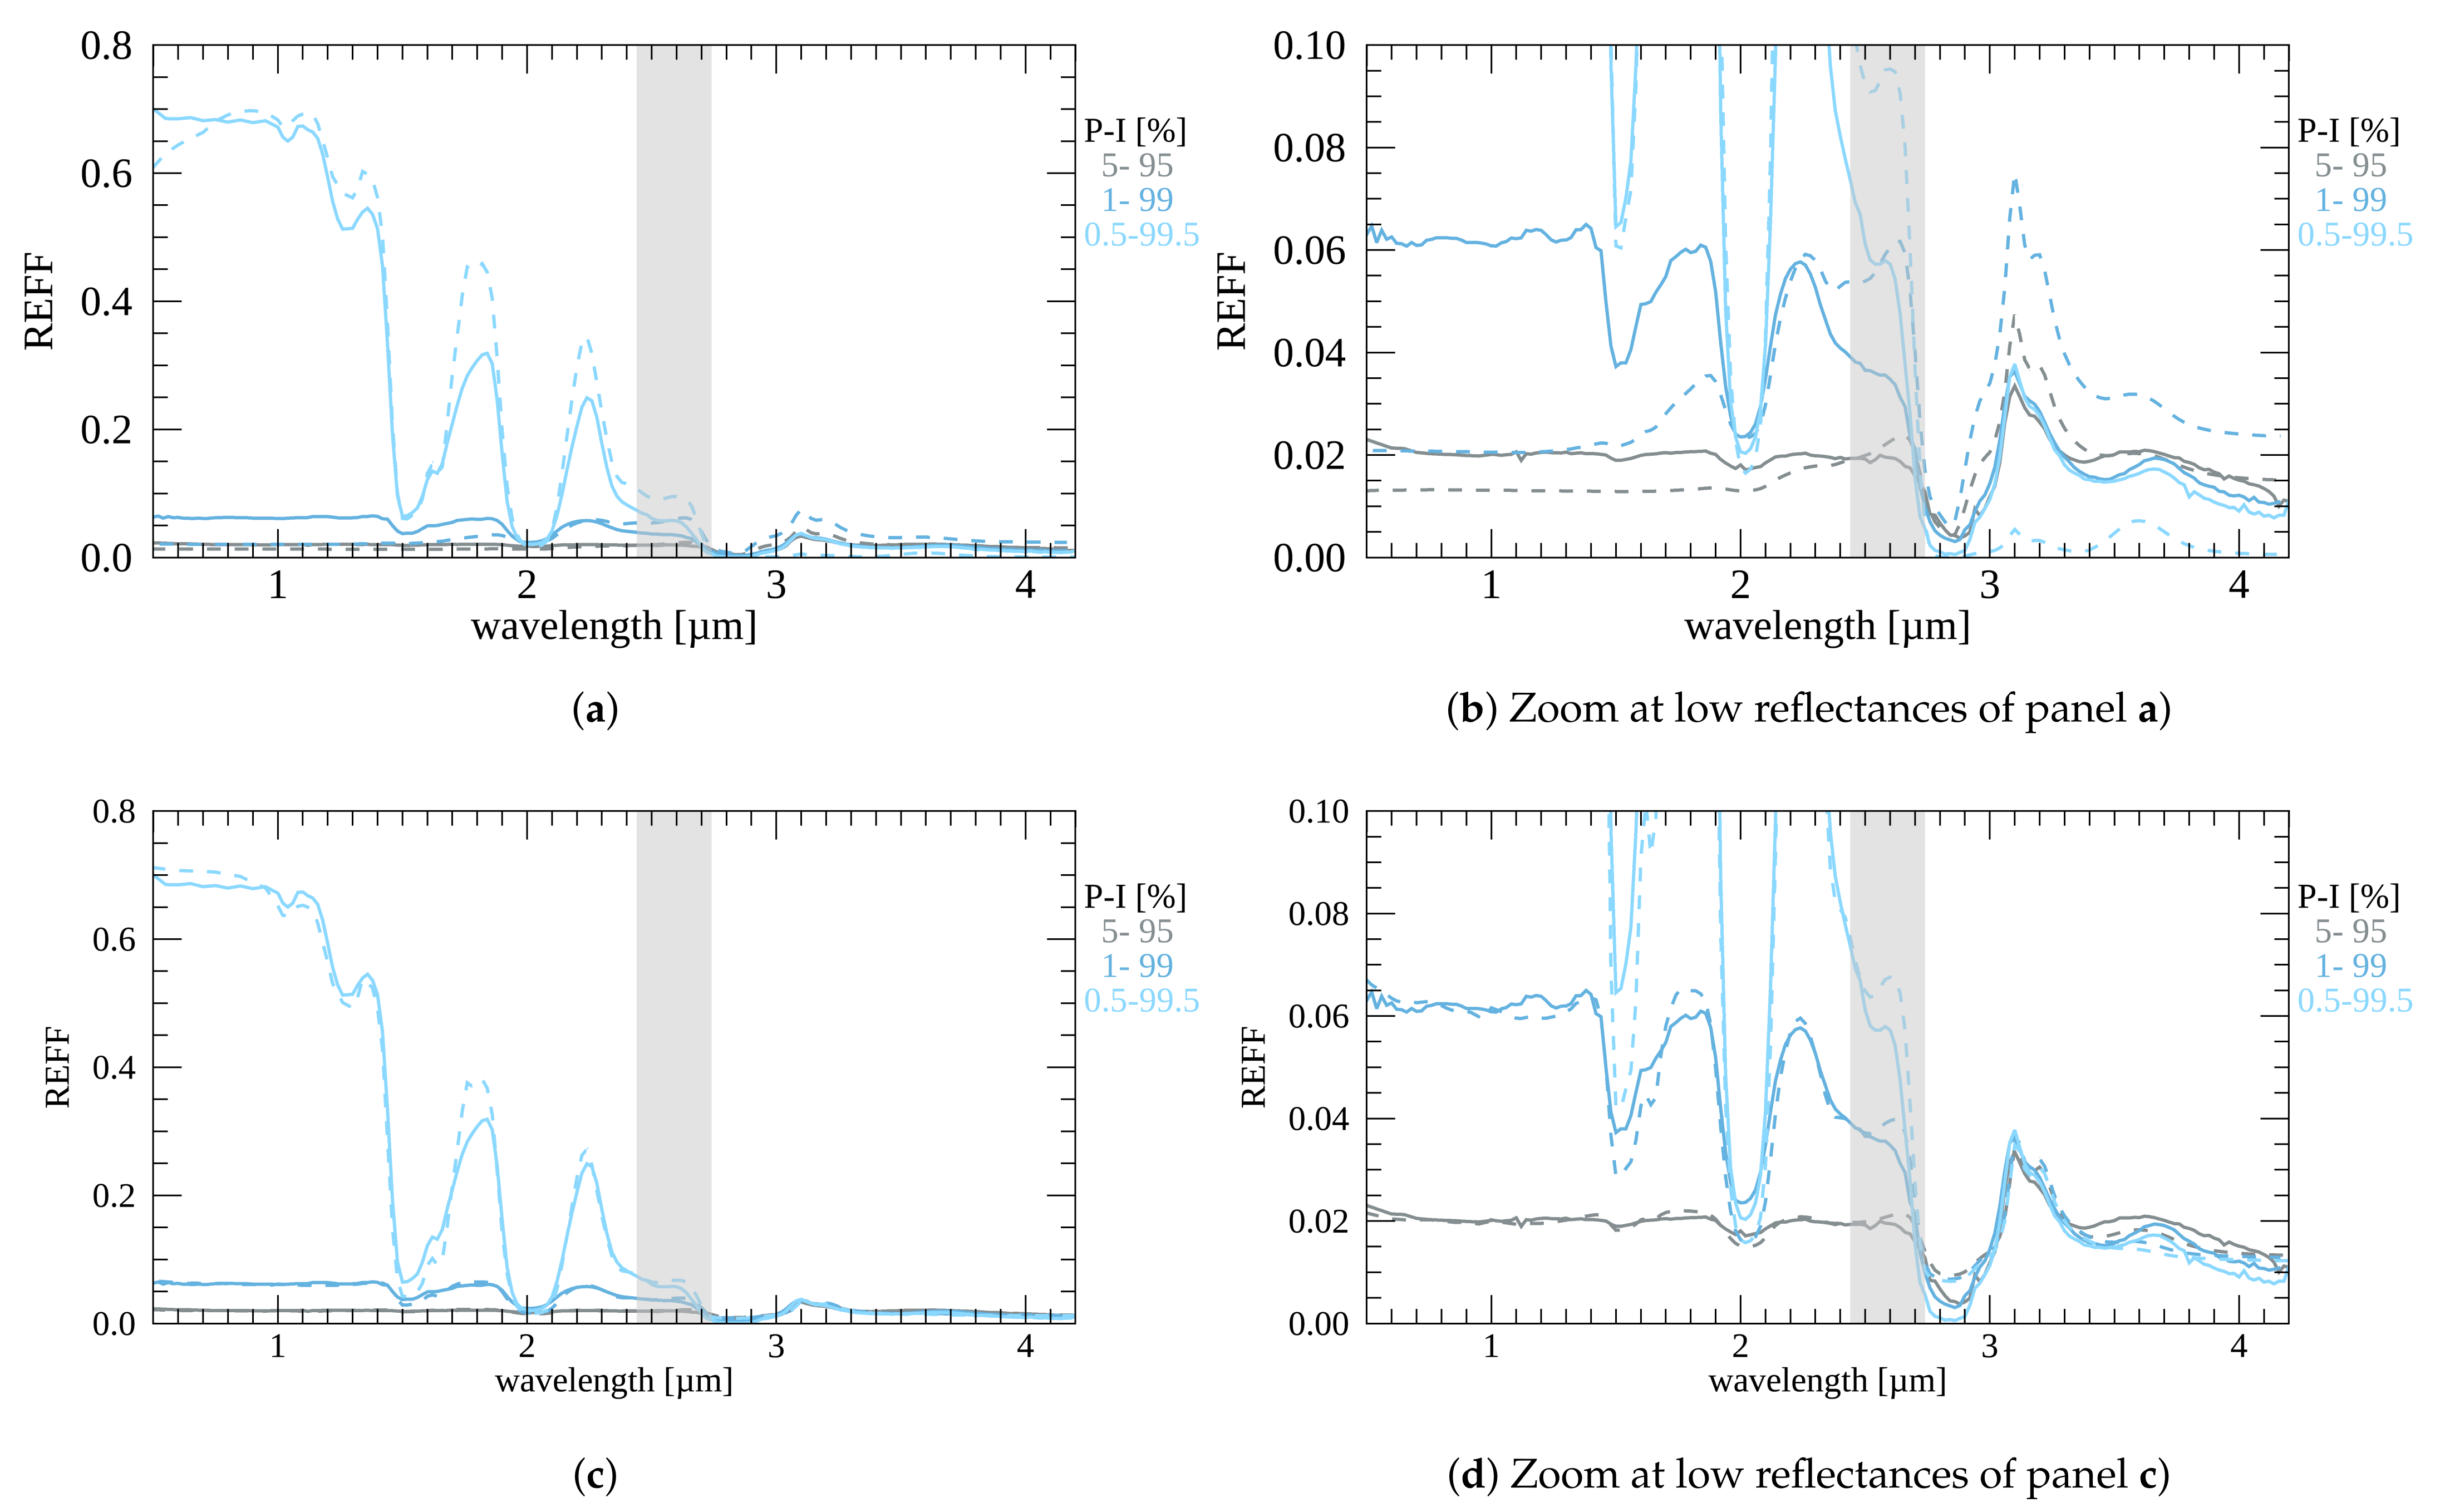
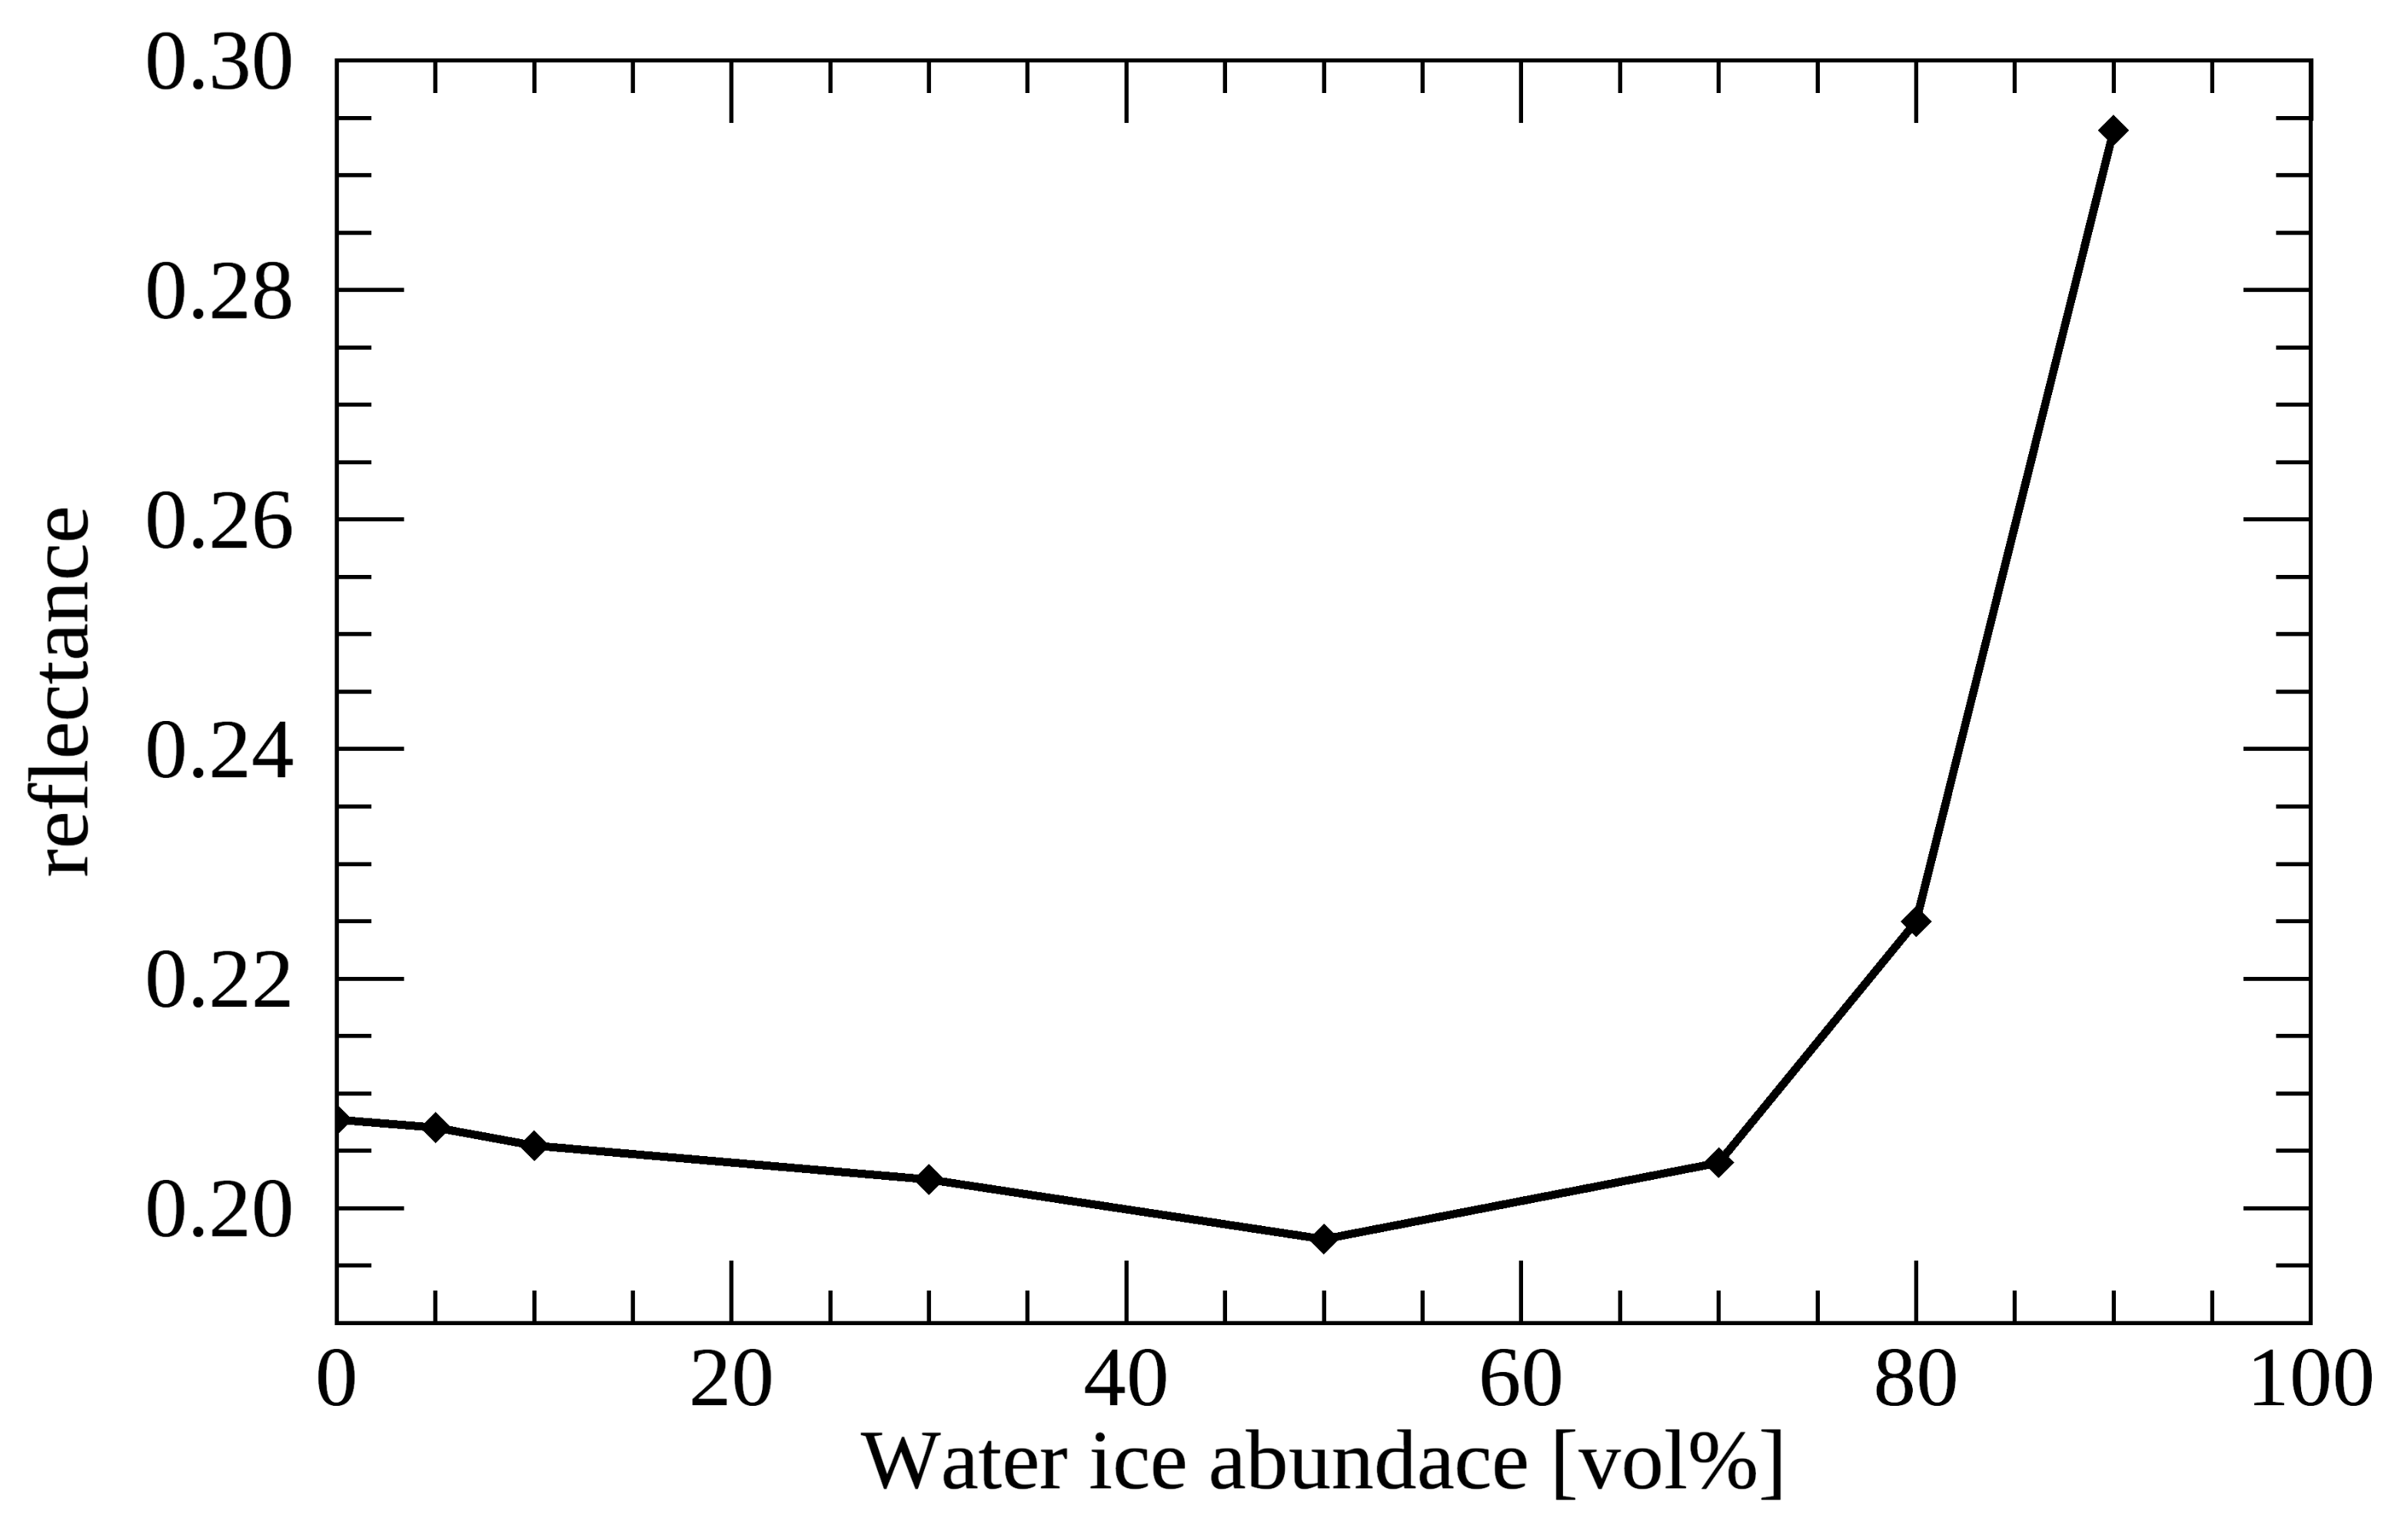
All the investigated water-ice-bearing mixtures of our experiments are characterized by high water ice content. As a consequence, although a general reduction of the band contrast is observed with increasing abundance of refractories, most of the major water ice spectral features monitored in this study, and in particular the 1.5- μ m and 2- μ m bands, always remain clearly detectable. At the same time, with increasing amounts of refractories, the REFF of the mixtures at wavelengths where water ice is brighter than the other (dark) endmember progressively decreases, and for certain cases, it becomes surprisingly lower than the dark endmember REFF. A similar behaviour can be noted for mixtures containing SPIPA-B water ice grains and lunar regolith simulant [36,37]. This indicates that in such mixtures, the final overall reflectance is not necessarily a monotonic function of the endmember mixing ratios and implies that additional properties/effects potentially concur in defining the reflectance level, among which we list porosity and multiple scattering effects in the case of anisotropic SPPFs. This has implications for VIS remote sensing observations of water-ice-bearing surfaces, where the albedo is commonly considered as an indicator of water ice content. Our measurements, in addition to [36,37], indicate that VIS albedo is not necessarily a good proxy for characterizing water ice abundance, and considerable amounts of water ice may be overlooked based only on this indicator. Conversely, spectral indicators such as water ice band depths and spectral slopes, in general, appear mostly monotonically linked to the water ice abundance, providing more robust constraints. We also note that a similar reflectance behaviour was observed for the two kerite 25 50 -pyrrhotite < 25 mixtures, suggesting that analogue effects may be relevant for refractory mixtures as well.
3.
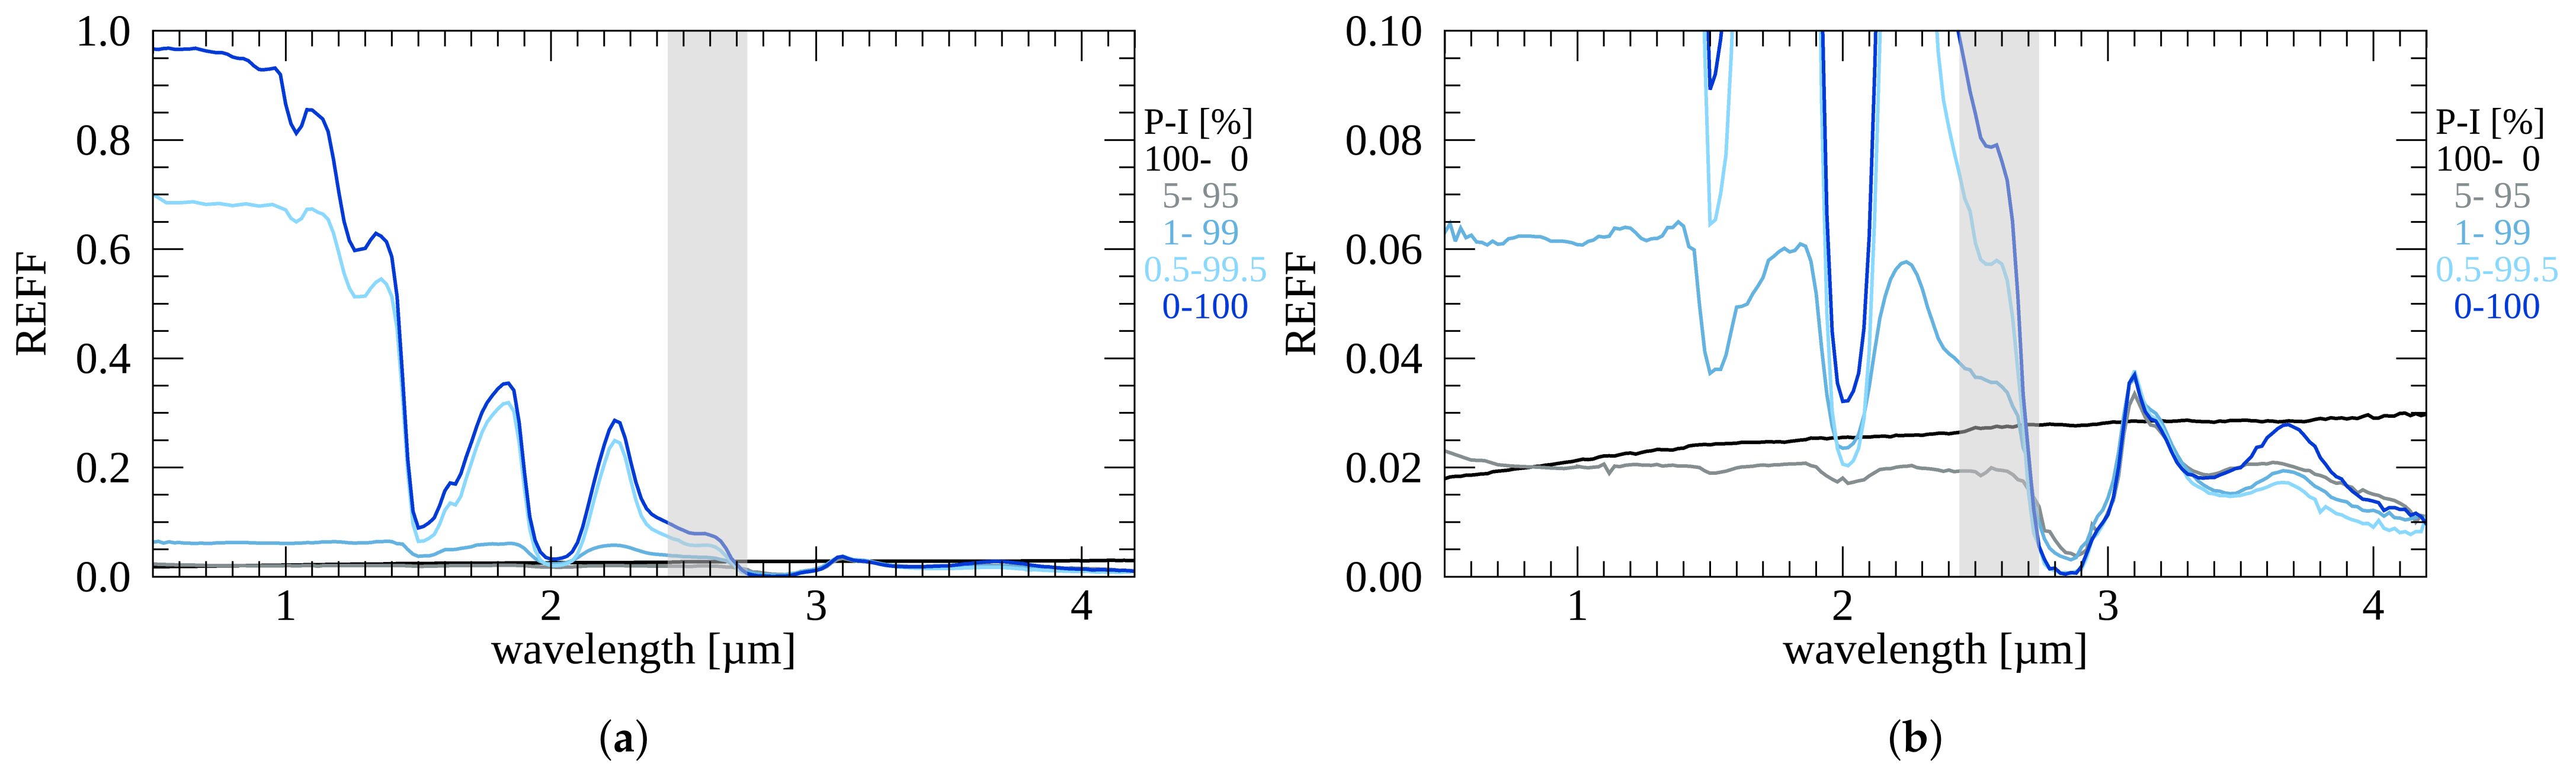
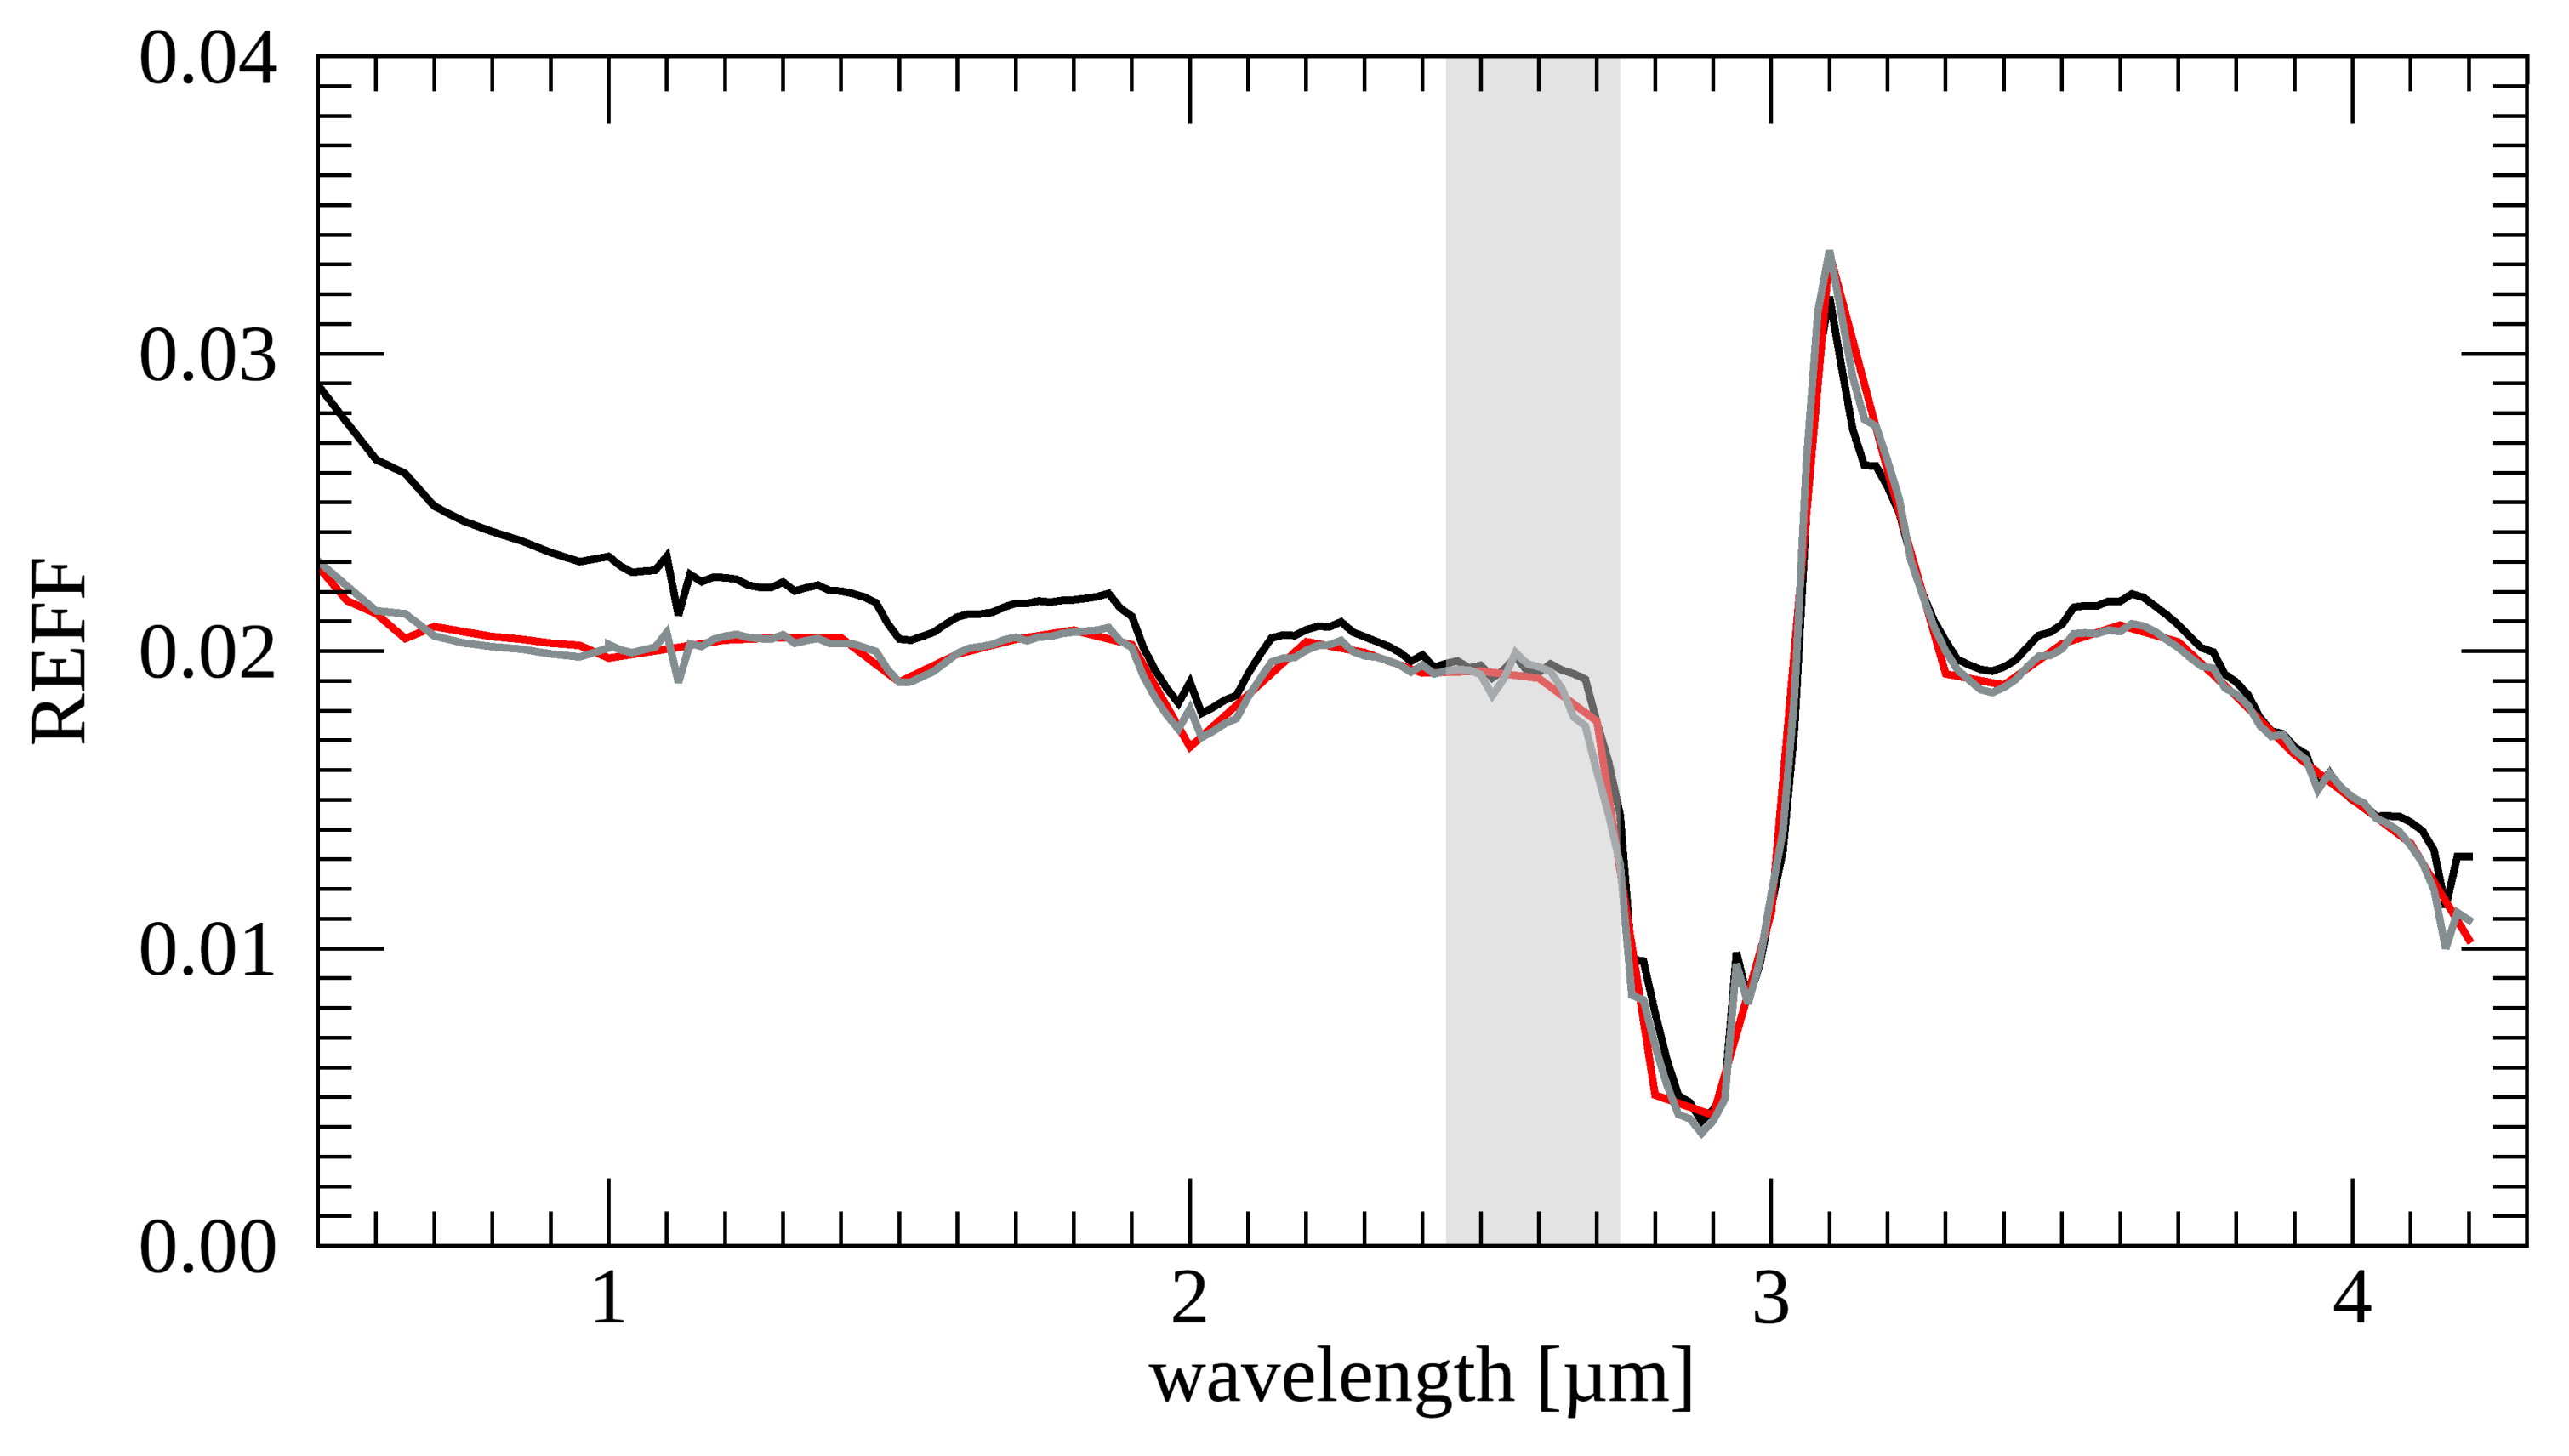
Our measurements show that intraparticle mixing of fine opaque inclusions in coarse-grained water ice is extremely efficient at VIS-IR darkening. In fact, we find that 5 wt% fine-grained pyrrhotite inclusions are capable of reducing the VIS REFF of pure water ice by a factor of ∼40. Similar strong darkening effects were reported by [38] by using nanophase carbon inclusions in coarse water ice grains. Such levels of REFF (∼0.02 at VIS wavelengths for the 5 wt%-pyrrhotite case) would be comparable with the characteristic low albedo of cometary nuclei [2,3,78,79,80,81] at VIS wavelengths. However, reflectance spectra of our mixtures display clearly detectable water ice absorption features, a prominent Fresnel peak, and neutral to negative spectral slope, not observed in cometary VIS-IR spectra [3,6,81], thus ruling out a similar mixing modality as a reference paradigm for the average surface properties of these objects.
4.
The comparison of the spectral output of our binary intimate mixtures with a simplified semi-empirical version of the Hapke model provides overall positive results with most of the mixtures fitted with an NRMSD ≤ 10% and a minimum number of free parameters. Nonetheless, retrieved abundances, although positively correlated with the corresponding endmember mixing ratios, are offset from nominal values. The analysis of SEM images suggests that a simplistic assumption on the typical grain size of the investigated endmembers (central value from the size limits imposed by the sieving procedures) can considerably overestimate the effective grain size of irregular (not equant) grains (Equation (6)) and of fine-grained fractions, and possibly explain the observed mismatch on the retrieved abundances. In particular, within each set of water-ice-bearing mixtures, we find that similar adjusted grain sizes ( d * ) of the refractory endmember provide the correct mixing ratios, indicating a systematic and reproducible effect, and suggesting that the estimated d * values approximate the sample effective grain size. Similarly, in the case of the pyrrhotite-kerite mixtures, we find that the correct mixture abundances are obtained by similar adjusted grain size ratios of the two endmembers. Our results are qualitatively similar to the ones from [37], who modelled monochromatic reflectance measurements of water ice–lunar simulant mixtures, and provide additional support to the argument of accounting for grain shape effects in spectral un-mixing attempts [37,63].
5.
The modelling of water ice–pyrrhotite intraparticle mixtures with the LR11 model [46] provided overall encouraging results and a much better agreement than the EMT-based approach [45,72]. This is compatible with the fact that the pyrrhotite inclusion size is not negligible with respect to wavelength, as instead assumed by the EMT-based approach. The LR11 approach was originally developed to model the effects of submicrometre iron inclusions in mineral grains to characterize space weathering effects on planetary surfaces ([46], and references therein). Our results indicate that it can also be adopted to model intraparticle mixtures hosted in water ice grains and suggest it can be applied to different classes of endmembers.
The recently concluded space missions Rosetta, Cassini, and Dawn provided large sets of remote VIS-IR observations of water-ice- and/or organics-bearing targets, such as the comet 67P/Churyumov-Gerasimenko, Saturn’s icy moons and rings, and Ceres, respectively. In addition, at the time of the preparation of this manuscript, the remote sensing instruments on-board the Juno mission are currently investigating Jupiter’s icy moons, and future observations of these targets will be provided from Europa Clipper and JUICE (JUpiter ICy moons Explorer) missions. The presented measurements will support the ongoing and future interpretation of these data sets, providing some insights for the characterization of the mixing modality and abundances of water ice and/or organics occurring on the surfaces of the investigated targets.

Supplementary Materials

The following are available online at https://0-www-mdpi-com.brum.beds.ac.uk/article/10.3390/min11111222/s1, Figure S1: Pictures of selected samples stored in the Carbon-IR environmental chamber for the spectral REFF measurement, Figure S2: REFF spectra for water ice-kerite 45 63 (left panels) and water ice-kerite < 25 (right panels) intimate mixtures normalized at 0.55 μm, (a and b, VIS wavelengths) and 1 μm (c and d, IR wavelengths), Figure S3: REFF spectra for water ice-pyrrhotite 25 50 intimate mixtures normalized at 0.55 μm, (a, VIS wavelengths) and 1 μm (b, IR wavelengths), Figure S4: REFF spectra for water ice (SPIPA-B)-pyrrhotite < 25 intraparticle mixtures normalized at 0.55 μm (a, VIS wavelengths) and 1 μm (b, IR wavelengths).

Author Contributions

Conceptualization and methodology, M.C., L.V.M., O.P., V.V., P.B., B.R., I.I., A.R., G.F., D.K., A.P., S.E.S., C.P., E.Q. and V.M.; software, M.C.; formal analysis, M.C.; investigation, M.C., L.V.M., O.P., V.V., P.B., B.R., I.I. and R.S.; resources, B.S., P.B. and L.V.M.; data curation, M.C., O.P., R.S. and B.S.; writing—original draft preparation, M.C.; writing—review and editing, M.C., L.V.M., O.P., V.V., P.B., B.R., I.I., R.S., A.R., G.F., D.K., A.P., S.E.S., C.P., E.Q., V.M. and B.S.; visualization, M.C.; supervision, M.C.; project administration, M.C.; funding acquisition, M.C. All authors have read and agreed to the published version of the manuscript.

Funding

The measurements described in this work were performed as part of the research project “Spectral analysis of mixtures with pyrrhotite-ice-kerite (SAMPIK) as analogues for cometary surface composition” (Project number: 18-EPN4-033; PI: Mauro Ciarniello), that has received funding from the European Union’s Horizon 2020 research and innovation programme under grant ’Europlanet-2020 RI’, No 871149. This work was supported by the Mainstream INAF project: “Caratterizzazione delle superfici dei satelliti di Giove mediante osservazioni di Juno-JIRAM e misure di laboratorio nell’infrarosso” (INAF Grant 1.05.01.86.11). L.V.M. was partly supported by the DFG grant MO 3007/1-1. D.K. acknowledges DFG-grant KA 3757/2-1.

Data Availability Statement

The measurements discussed in this paper and their associated sample information are available through the SSHADE database infrastructure for solid spectroscopy at https://0-doi-org.brum.beds.ac.uk/10.26302/SSHADE/EXPERIMENT_MC_20181026_1.

Acknowledgments

We thank the two anonymous reviewers for their constructive comments and suggestions which helped us to improve the paper. This work took advantage of the collaboration of the ISSI international team “Comet 67P/Churyumov-Gerasimenko Surface Composition as a Playground for Radiative Transfer Modeling and Laboratory Measurements”, number 397. We thank U. Schade for providing pyrrhotite optical constants measured at ISAS Berlin. We acknowledge the help of Enrico Bruschini for importing the measured spectra in the SSHADE database.

Conflicts of Interest

The authors declare no conflict of interest.

Appendix A

Table A1. Endpoints (left and right shoulder) for the computation of continuum-removed spectra of water ice absorption bands.
Band Reference WavelengthLeft ShoulderRight Shoulder
1.25  μ m1.14  μ m1.34  μ m
1.5  μ m1.36  μ m1.84  μ m
1.65  μ m1.62  μ m1.75  μ m
μ m1.84  μ m2.24  μ m
Table A2. Endpoints (left and right shoulder) for the computation of continuum-removed spectra of kerite absorption bands. Values in parentheses, when indicated, refer to the kerite 45 63 sample only.
Band Reference WavelengthLeft ShoulderRight Shoulder
3.28  μ m3.20  μ m3.34  μ m
3.4  μ m3.32  μ m3.48(3.46)  μ m
3.5  μ m3.48(3.46)  μ m3.60(3.62)  μ m
3.4  μ m (complex)3.22  μ m3.64  μ m

Appendix B. Water Ice (95 wt%)–Pyrrhotite <25 (5 wt%) Intraparticle Mixture: Correction of the Spectral Contribution from Sublimating Frost

After the preparation of the of the water ice (95 wt%)–pyrrhotite < 25 (5 wt%) mixture, despite the adopted precautions, a layer of frost due to condensation of ambient humidity formed on top of the sample before the spectral REFF measurement. The frost layer, once the sample was stored in the Carbon-IR chamber filled with N 2 at a pressure of 1.5 mbar, started sublimating. The presence of the frost top layer determines an increase in REFF with respect to the original sample. As the spectrum was acquired wavelength by wavelength, from 0.5 μ m to 4.2 μ m, in about one hour, the increase in reflectance due to the presence of frost is maximum for wavelengths at the beginning of the acquisition, progressively reducing with time (and increasing wavelengths) as the frost layer sublimates away. This produces a spurious bluing in the measured spectrum. In the particular case of the water ice (95 wt%)–pyrrhotite < 25 (5 wt%) sample, a first spectrum (Spectrum A, Figure A1) was acquired with the nominal spectral sampling (50 nm in the interval 0.5–1.0 μ m and 20 nm at 1.0–4.2 μ m ), and a second one (Spectrum B, Figure A1), just after the former, with a lower IR sampling (100 nm in the 1–4.2 μ m range). By comparing the two spectra, it can be noted that Spectrum A appears bluer than Spectrum B up to ∼2.7 μ m, being characterized by an excess of REFF progressively reducing at longer wavelengths. Beyond ∼2.7 μ m, spectrum A and Spectrum B mostly overlap, suggesting that most of the frost was already sublimated by the time the REFF at ∼2.7 μ m was being acquired for Spectrum A, and that after that point, the sample was mostly stable. In spectrum B, a residual bluing shortward of 1 μ m can be noted, which could be imparted by the pyrrhotite inclusions in the icy grains (and possibly by isolated smaller-than-wavelength pyrrhotite particles), although a contribution from minor ongoing sublimation or residual (stable) submicron frost cannot be excluded.
In order to produce a reference spectrum (Spectrum C) of the water ice (95 wt%)–pyrrhotite < 25 (5 wt%) sample, with the highest available spectral sampling and minimal spurious bluing from frost sublimation, we corrected the overall spectral shape of Spectrum A in order to match the one from Spectrum B. In particular, this has been done by interpolating Spectrum B at the same sampling wavelengths ( λ ) of Spectrum A and computing the spectral ratio R( λ ) = (Spectrum A)/(Spectrum B). R ( λ ) was then smoothed by applying a least squares smoothing polynomial filter to obtain the corrective factor R s m ( λ ). This is done to remove high-frequency spectral variations and retain only the broad-band spectral behaviour of R ( λ ) . The reference spectrum of the water ice (95 wt%)–pyrrhotite < 25 (5 wt%) intraparticle mixture corrected for frost sublimation (Spectrum C, Figure A1) was then obtained as Spectrum C = (Spectrum A)/(R s m ( λ )), which preserves the original spectral resolution of Spectrum A.
Figure A1. The original spectrum of the 95 wt% water ice–5 wt%pyrrhotite < 25 intraparticle mixture (Spectrum A, black) is compared to Spectrum B (red) and to the mixture reference spectrum after correction for frost sublimation (Spectrum C, grey). The light grey bands indicate a spectral region where possible residual water vapour contamination in the optical path may affect the resulting spectra.
Minerals 11 01222 g0a1

Appendix C. Multiple Scattering Effects Coupled to Anisotropic SPPFs Explored by Monte Carlo Ray-Tracing

In Section 3.2, we show that water ice–pyrrhotite 25 50 intimate mixtures with large content of pyrrhotite (19 wt%, 52 wt%) are unexpectedly characterized by REFF lower than pure pyrrhotite, at wavelengths where water ice is brighter than pyrrhotite. A similar effect is also noted for the water ice (77 wt%)–kerite < 25 (23 wt%) mixture. We now explore the possibility that a contribution to this effect comes from multiple scattering in mixtures characterized by endmembers with anisotropic SPPFs. In particular, we investigate the water ice–pyrrhotite case, assuming that the transparent water ice grains are characterized by a forward-SPPF, and the opaque pyrrhotite grains are back-scattering, by simulating the reflectance of their intimate mixtures by means of Monte Carlo ray-tracing [68] at 0.7 μ m. In the Monte Carlo routine, we assume spherical grains with a single grain size, and each grain population (water ice and pyrrhotite) is characterized by a different SSA and SPPF. We assume, for simplicity, the water ice and pyrrhotite SSAs obtained by inverting Equation (1) under the assumption of isotropic scattering. The SPPF is modelled by means of the Henyey–Greenstein function [82]:
p ( α ) = 1 b 2 ( 1 + 2 b cos ( α ) + b 2 ) 3 / 2 ,
with b = 0.8 (forward-scattering SPPF) and b = 0.4 (back-scattering SPPF) for water ice and pyrrhotite grains, respectively. We note that the adopted SSAs, as obtained by REFF inversion, are not consistent with the assumed anisotropic SPPFs for the two endmembers. Nonetheless, we are not attempting to fit the mixture measured REFF, while the aim of the Monte Carlo simulation is only to illustrate the effects of anisotropic SPPF in binary intimate mixtures with “water ice-like” and “pyrrhotite-like” endmembers, which allows us to relax the constraint between SSA and SPPF. In the simulations, we assume a medium porosity of 90 % and “standard” observation geometry ( i = 30 , e = 0 , α = 30 ). We run simulations with increasing amounts of water ice, starting from a pure pyrrhotite case up to 90 vol% of water ice in the mixture (Figure A2). It can be noted that the reflectance of the mixture decreases with increasing abundances of water ice, reaching the minimum at 50 vol% water ice. Then, for higher contents, the reflectance starts increasing with increasing water ice abundances, and for 80 vol% water ice, the reflectance is already larger than that of pure pyrrhotite.
Figure A2. Reflectance at 0.7 μ m of water ice–pyrrhotite intimate mixtures from Monte Carlo ray-tracing simulations as a function of water ice volumetric abundance in the mixture.
Minerals 11 01222 g0a2
This result is similar to the REFF variation observed in the laboratory water ice–pyrrhotite intimate mixtures, where the final reflectance is not monotonically linked to the endmember mixing ratio. We explain this behaviour as the result of “light-trapping” at greater depth from forward-scattering (transparent) water ice grains. Light interacting with water ice grains on the top of the sample is scattered deeper into the medium with respect to light interacting with back-scattering pyrrhotite. As such, the forward-scattered photons undergo more interactions than the back-scattered ones before emerging from the sample, thus providing a reduction of reflectance (Figure A3). We note that the presence of transparent water ice grains in a mixture with opaque pyrrhotite mimics an increase of porosity in the top layers (in the geometric optics limit, photons forward-scattered by non-absorbing particles are similar to undisturbed photons propagating in vacuum), thus decreasing the reflectance [42,68,83]. The Monte Carlo simulations suggest that this effect dominates over the expected water-ice-induced brightening as long as the water ice abundance is not too large. Although the simulation is run for water ice–pyrrhotite mixtures, the mechanism described here is general and might be relevant for any binary mixture composed of transparent forward-scattering and opaque back-scattering grains.
Figure A3. Schematization of the “light-trapping” induced by transparent forward-scattering water ice grains (clear circles) mixed with opaque back-scattering pyrrhotite grains (black irregular shapes). Arrows indicate the propagation of photon packets, and colour shades from yellow to red indicate increasing levels of the fraction of absorbed light.
Minerals 11 01222 g0a3

References

  1. Taylor, M.G.G.T.; Altobelli, N.; Buratti, B.J.; Choukroun, M. The Rosetta mission orbiter science overview: The comet phase. Philos. Trans. R. Soc. Lond. Ser. A 2017, 375, 20160262. [Google Scholar] [CrossRef] [Green Version]
  2. Ciarniello, M.; Capaccioni, F.; Filacchione, G.; Raponi, A.; Tosi, F.; De Sanctis, M.C.; Capria, M.T.; Erard, S.; Bockelee-Morvan, D.; Leyrat, C.; et al. Photometric properties of comet 67P/Churyumov-Gerasimenko from VIRTIS-M onboard Rosetta. Astron. Astrophys. 2015, 583, A31. [Google Scholar]
  3. Fornasier, S.; Hasselmann, P.H.; Barucci, M.A.; Feller, C.; Besse, S.; Leyrat, C.; Lara, L.; Gutierrez, P.J.; Oklay, N.; Tubiana, C.; et al. Spectrophotometric properties of the nucleus of comet 67P/Churyumov-Gerasimenko from the OSIRIS instrument onboard the ROSETTA spacecraft. Astron. Astrophys. 2015, 583, A30. [Google Scholar] [CrossRef] [Green Version]
  4. Capaccioni, F.; Coradini, A.; Filacchione, G.; Erard, S.; Arnold, G.; Drossart, P.; De Sanctis, M.C.; Bockelee-Morvan, D.; Capria, M.T.; Tosi, F.; et al. The organic-rich surface of comet 67P/Churyumov-Gerasimenko as seen by VIRTIS/Rosetta. Science 2015, 347, 628. [Google Scholar] [CrossRef] [Green Version]
  5. Quirico, E.; Moroz, L.V.; Schmitt, B.; Arnold, G.; Faure, M.; Beck, P.; Bonal, L.; Ciarniello, M.; Capaccioni, F.; Filacchione, G.; et al. Refractory and semi-volatile organics at the surface of comet 67P/Churyumov-Gerasimenko: Insights from the VIRTIS/Rosetta imaging spectrometer. Icarus 2016, 272, 32–47. [Google Scholar] [CrossRef] [Green Version]
  6. Raponi, A.; Ciarniello, M.; Capaccioni, F.; Mennella, V.; Filacchione, G.; Vinogradoff, V.; Poch, O.; Beck, P.; Quirico, E.; De Sanctis, M.C.; et al. Infrared detection of aliphatic organics on a cometary nucleus. Nat. Astron. 2020, 4, 500–505. [Google Scholar] [CrossRef]
  7. Poch, O.; Istiqomah, I.; Quirico, E.; Beck, P.; Schmitt, B.; Theulé, P.; Faure, A.; Hily-Blant, P.; Bonal, L.; Raponi, A.; et al. Ammonium salts are a reservoir of nitrogen on a cometary nucleus and possibly on some asteroids. Science 2020, 367, aaw7462. [Google Scholar] [CrossRef]
  8. Mennella, V.; Ciarniello, M.; Raponi, A.; Capaccioni, F.; Filacchione, G.; Suhasaria, T.; Popa, C.; Kappel, D.; Moroz, L.; Vinogradoff, V.; et al. Hydroxylated Mg-rich Amorphous Silicates: A New Component of the 3.2 μm Absorption Band of Comet 67P/Churyumov-Gerasimenko. Astrophys. J. Lett. 2020, 897, L37. [Google Scholar] [CrossRef]
  9. Rousseau, B.; Érard, S.; Beck, P.; Quirico, É.; Schmitt, B.; Brissaud, O.; Montes-Hernandez, G.; Capaccioni, F.; Filacchione, G.; Bockelée-Morvan, D.; et al. Laboratory simulations of the Vis-NIR spectra of comet 67P using sub-μm sized cosmochemical analogues. Icarus 2018, 306, 306–318. [Google Scholar] [CrossRef] [Green Version]
  10. Filacchione, G.; Raponi, A.; Capaccioni, F.; Ciarniello, M.; Tosi, F.; Capria, M.T.; De Sanctis, M.C.; Migliorini, A.; Piccioni, G.; Cerroni, P.; et al. Seasonal exposure of carbon dioxide ice on the nucleus of comet 67P/Churyumov-Gerasimenko. Science 2016, 354, 1563–1566. [Google Scholar] [CrossRef] [Green Version]
  11. Barucci, M.A.; Filacchione, G.; Fornasier, S.; Raponi, A.; Deshapriya, J.D.P.; Tosi, F.; Feller, C.; Ciarniello, M.; Sierks, H.; Capaccioni, F.; et al. Detection of exposed H2O ice on the nucleus of comet 67P/Churyumov-Gerasimenko. as observed by Rosetta OSIRIS and VIRTIS instruments. Astron. Astrophys. 2016, 595, A102. [Google Scholar] [CrossRef] [Green Version]
  12. Raponi, A.; Ciarniello, M.; Capaccioni, F.; Filacchione, G.; Tosi, F.; De Sanctis, M.C.; Capria, M.T.; Barucci, M.A.; Longobardo, A.; Palomba, E.; et al. The temporal evolution of exposed water ice-rich areas on the surface of 67P/Churyumov-Gerasimenko: Spectral analysis. Mon. Not. R. Astron. Soc. 2016, 462, S476–S490. [Google Scholar] [CrossRef] [Green Version]
  13. O’Rourke, L.; Heinisch, P.; Blum, J.; Fornasier, S.; Filacchione, G.; Van Hoang, H.; Ciarniello, M.; Raponi, A.; Gundlach, B.; Blasco, R.A.; et al. The Philae lander reveals low-strength primitive ice inside cometary boulders. Nature 2020, 586, 697–701. [Google Scholar] [CrossRef]
  14. De Sanctis, M.C.; Capaccioni, F.; Ciarniello, M.; Filacchione, G.; Formisano, M.; Mottola, S.; Raponi, A.; Tosi, F.; Bockelée-Morvan, D.; Erard, S.; et al. The diurnal cycle of water ice on comet 67P/Churyumov-Gerasimenko. Nature 2015, 525, 500–503. [Google Scholar] [CrossRef]
  15. Ciarniello, M.; Raponi, A.; Capaccioni, F.; Filacchione, G.; Tosi, F.; De Sanctis, M.C.; Kappel, D.; Rousseau, B.; Arnold, G.; Capria, M.T.; et al. The global surface composition of 67P/Churyumov-Gerasimenko nucleus by Rosetta/VIRTIS. II) Diurnal and seasonal variability. Mon. Not. R. Astron. Soc. 2016, 462, S443–S458. [Google Scholar] [CrossRef]
  16. Fornasier, S.; Mottola, S.; Keller, H.U.; Barucci, M.A.; Davidsson, B.; Feller, C.; Deshapriya, J.D.P.; Sierks, H.; Barbieri, C.; Lamy, P.L.; et al. Rosetta’s comet 67P/Churyumov-Gerasimenko sheds its dusty mantle to reveal its icy nature. Science 2016, 354, 1566–1570. [Google Scholar] [CrossRef] [Green Version]
  17. Campins, H.; Hargrove, K.; Pinilla-Alonso, N.; Howell, E.S.; Kelley, M.S.; Licandro, J.; Mothé-Diniz, T.; Fernández, Y.; Ziffer, J. Water ice and organics on the surface of the asteroid 24 Themis. Nature 2010, 464, 1320–1321. [Google Scholar] [CrossRef]
  18. Rivkin, A.S.; Emery, J.P. Detection of ice and organics on an asteroidal surface. Nature 2010, 464, 1322–1323. [Google Scholar] [CrossRef]
  19. Licandro, J.; Campins, H.; Kelley, M.; Hargrove, K.; Pinilla-Alonso, N.; Cruikshank, D.; Rivkin, A.S.; Emery, J. (65) Cybele: Detection of small silicate grains, water-ice, and organics. Astron. Astrophys. 2011, 525, A34. [Google Scholar] [CrossRef] [Green Version]
  20. Combe, J.P.; McCord, T.B.; Tosi, F.; Ammannito, E.; Carrozzo, F.G.; De Sanctis, M.C.; Raponi, A.; Byrne, S.; Landis, M.E.; Hughson, K.H.G.; et al. Detection of local H2O exposed at the surface of Ceres. Science 2016, 353, aaf3010. [Google Scholar] [CrossRef]
  21. Raponi, A.; De Sanctis, M.C.; Frigeri, A.; Ammannito, E.; Ciarniello, M.; Formisano, M.; Combe, J.P.; Magni, G.; Tosi, F.; Carrozzo, F.G.; et al. Variations in the amount of water ice on Ceres’ surface suggest a seasonal water cycle. Sci. Adv. 2018, 4, eaao3757. [Google Scholar] [CrossRef] [Green Version]
  22. De Sanctis, M.C.; Ammannito, E.; Raponi, A.; Marchi, S.; McCord, T.B.; McSween, H.Y.; Capaccioni, F.; Capria, M.T.; Carrozzo, F.G.; Ciarniello, M.; et al. Ammoniated phyllosilicates with a likely outer Solar System origin on (1) Ceres. Nature 2015, 528, 241–244. [Google Scholar]
  23. Filacchione, G.; Capaccioni, F.; Ciarniello, M.; Clark, R.N.; Cuzzi, J.N.; Nicholson, P.D.; Cruikshank, D.P.; Hedman, M.M.; Buratti, B.J.; Lunine, J.I.; et al. Saturn’s icy satellites and rings investigated by Cassini–VIMS: III—Radial compositional variability. Icarus 2012, 220, 1064–1096. [Google Scholar] [CrossRef] [Green Version]
  24. Cruikshank, D.P.; Dalle Ore, C.M.; Clark, R.N.; Pendleton, Y.J. Aromatic and aliphatic organic materials on Iapetus: Analysis of Cassini VIMS data. Icarus 2014, 233, 306–315. [Google Scholar] [CrossRef]
  25. Poulet, F.; Cuzzi, J.N.; Cruikshank, D.P.; Roush, T.L.; Dalle Ore, C.M. Comparison between the Shkuratov and Hapke scattering theories for solid planetary surfaces: Application to the surface composition of two Centaurus. Icarus 2002, 160, 313–324. [Google Scholar]
  26. Filacchione, G.; Ciarniello, M.; Capaccioni, F.; Clark, R.N.; Nicholson, P.D.; Hedman, M.M.; Cuzzi, J.N.; Cruikshank, D.P.; Dalle Ore, C.M.; Brown, R.H.; et al. Cassini-VIMS observations of Saturn’s main rings: I. Spectral properties and temperature radial profiles variability with phase angle and elevation. Icarus 2014, 241, 45–65. [Google Scholar] [CrossRef]
  27. Ciarniello, M.; Capaccioni, F.; Filacchione, G.; Clark, R.; Cruikshank, D.; Cerroni, P.; Coradini, A.; Brown, R.; Buratti, B.; Tosi, F.; et al. Hapke modeling of Rhea surface properties through Cassini-VIMS spectra. Icarus 2011, 214, 541–555. [Google Scholar] [CrossRef] [Green Version]
  28. Poulet, F.; Cruikshank, D.P.; Cuzzi, J.N.; Roush, T.L.; G, F.R. Compositions of Saturn’s rings A, B, and C from high resolution near-infrared spectroscopic observations. Astron. Astrophys. 2003, 412, 305–316. [Google Scholar]
  29. Cuzzi, J.N.; French, R.G.; Hendrix, A.R.; Olson, D.M.; Roush, T.; Vahidinia, S. HST-STIS spectra and the redness of Saturn’s rings. Icarus 2018, 309, 363–388. [Google Scholar] [CrossRef]
  30. Ciarniello, M.; Filacchione, G.; D’Aversa, E.; Capaccioni, F.; Nicholson, P.D.; Cuzzi, J.N.; Clark, R.N.; Hedman, M.M.; Dalle Ore, C.M.; Cerroni, P.; et al. Cassini-VIMS observations of Saturn’s main rings: II. A spectrophotometric study by means of Monte Carlo ray-tracing and Hapke’s theory. Icarus 2019, 317, 242–265. [Google Scholar] [CrossRef]
  31. McCord, T.B.; Carlson, R.; Smythe, W.; Hansen, G.; Clark, R.; Hibbitts, C.; Fanale, F.; Granahan, J.; Segura, M.; Matson, D.; et al. Organics and other molecules in the surfaces of Callisto and Ganymede. Science 1997, 278, 271–275. [Google Scholar] [CrossRef]
  32. McCord, T.B.; Hansen, G.B.; Clark, R.N.; Martin, P.D.; Hibbitts, C.A.; Fanale, F.P.; Granahan, J.C.; Segura, M.; Matson, D.L.; Johnson, T.V.; et al. Non-water-ice constituents in the surface material of the icy Galilean satellites from the Galileo near-infrared mapping spectrometer investigation. J. Geophys. Res. Planets 1998, 103, 8603–8626. [Google Scholar] [CrossRef]
  33. Grundy, W. Is the missing ultra-red material colorless ice? Icarus 2009, 199, 560–563. [Google Scholar] [CrossRef] [Green Version]
  34. Clark, R.N.; Lucey, P.G. Spectral properties of ice-particulate mixtures and implications for remote sensing. 1. Intimate mixtures. J. Geophys. Res. Planets 1984, 89, 6341–6348. [Google Scholar] [CrossRef]
  35. Clark, R.N.; Cruikshank, D.P.; Jaumann, R.; Brown, R.H.; Stephan, K.; Dalle Ore, C.M.; Eric Livo, K.; Pearson, N.; Curchin, J.M.; Hoefen, T.M.; et al. The surface composition of Iapetus: Mapping results from Cassini VIMS. Icarus 2012, 218, 831–860. [Google Scholar] [CrossRef]
  36. Pommerol, A.; Jost, B.; Poch, O.; Yoldi, Z.; Brouet, Y.; Gracia-Berná, A.; Cerubini, R.; Galli, A.; Wurz, P.; Gundlach, B.; et al. Experimenting with Mixtures of Water Ice and Dust as Analogues for Icy Planetary Material. Recipes from the Ice Laboratory at the University of Bern. Space Sci. Rev. 2019, 215, 37. [Google Scholar] [CrossRef]
  37. Yoldi, Z.; Pommerol, A.; Jost, B.; Poch, O.; Gouman, J.; Thomas, N. VIS-NIR reflectance of water ice/regolith analogue mixtures and implications for the detectability of ice mixed within planetary regoliths. Geophys. Res. Lett. 2015, 42, 6205–6212. [Google Scholar] [CrossRef] [Green Version]
  38. Jost, B.; Pommerol, A.; Poch, O.; Brouet, Y.; Fornasier, S.; Carrasco, N.; Szopa, C.; Thomas, N. Bidirectional reflectance of laboratory cometary analogues to interpret the spectrophotometric properties of the nucleus of comet 67P/Churyumov-Gerasimenko. Planet. Space Sci. 2017, 148, 1–11. [Google Scholar] [CrossRef]
  39. Poch, O.; Pommerol, A.; Jost, B.; Carrasco, N.; Szopa, C.; Thomas, N. Sublimation of water ice mixed with silicates and tholins: Evolution of surface texture and reflectance spectra, with implications for comets. Icarus 2016, 267, 154–173. [Google Scholar] [CrossRef]
  40. Jost, B.; Pommerol, A.; Poch, O.; Yoldi, Z.; Fornasier, S.; Hasselmann, P.H.; Feller, C.; Carrasco, N.; Szopa, C.; Thomas, N. Bidirectional reflectance and VIS-NIR spectroscopy of cometary analogues under simulated space conditions. Planet. Space Sci. 2017, 145, 14–27. [Google Scholar] [CrossRef] [Green Version]
  41. Yoldi, Z.; Pommerol, A.; Poch, O.; Thomas, N. Reflectance study of ice and Mars soil simulant associations—I. H2O ice. Icarus 2021, 358, 114169. [Google Scholar] [CrossRef]
  42. Hapke, B. Theory of Reflectance and Emittance Spectroscopy; Cambridge University Press: Cambridge, UK, 2012. [Google Scholar]
  43. Shkuratov, Y.; Starukhina, L.; Hoffmann, H.; Arnold, G. A model of spectral albedo of particulate surfaces: Implications for optical properties of the Moon. Icarus 1999, 137, 235–246. [Google Scholar]
  44. Markkanen, J.; Agarwal, J. Scattering, absorption, and thermal emission by large cometary dust particles: Synoptic numerical solution. Astron. Astrophys. 2019, 631, A164. [Google Scholar] [CrossRef] [Green Version]
  45. Bohren, C.F.; Huffman, D.R. Absorption and Scattering of Light by Small Particles; John Wiley & Sons, Inc.: New York, NY, USA, 1983. [Google Scholar]
  46. Lucey, P.G.; Riner, M.A. The optical effects of small iron particles that darken but do not redden: Evidence of intense space weathering on Mercury. Icarus 2011, 212, 451–462. [Google Scholar] [CrossRef]
  47. Brissaud, O.; Schmitt, B.; Bonnefoy, N.; Douté, S.; Rabou, P.; Grundy, W.; Fily, M. Spectrogonio Radiometer for the Study of the Bidirectional Reflectance and Polarization Functions of Planetary Surfaces. 1. Design and Tests. Appl. Opt. 2004, 43, 1926–1937. [Google Scholar] [CrossRef]
  48. Grisolle, F. Les Condensats Saisonniers de Mars: Etudeexpérimentale de la Formation et du Métamorphisme Deglaces de CO2. Ph.D. Thesis, Université de Grenoble, Grenoble, France, December 2013. [Google Scholar]
  49. Potin, S.; Brissaud, O.; Beck, P.; Schmitt, B.; Magnard, Y.; Correia, J.J.; Rabou, P.; Jocou, L. SHADOWS: A spectro-gonio radiometer for bidirectional reflectance studies of dark meteorites and terrestrial analogs: Design, calibrations, and performances on challenging surfaces. Appl. Opt. 2018, 57, 8279. [Google Scholar] [CrossRef] [Green Version]
  50. Grundy, W.M.; Schmitt, B. The temperature-dependent near-infrared absorption spectrum of hexagonal H2O ice. J. Geophys. Res. 1998, 103, 25809–25822. [Google Scholar] [CrossRef]
  51. Mastrapa, R.; Bernstein, M.; Sandford, S.; Roush, T.; Cruikshank, D.; Ore, C.D. Optical constants of amorphous and crystalline H2O-ice in the near infrared from 1.1 to 2.6 μm. Icarus 2008, 197, 307–320. [Google Scholar] [CrossRef]
  52. Mastrapa, R.; Sandford, S.A.; Roush, T.L.; Cruikshank, D.P.; Ore, C.M.D. Optical constants of amorphous, crystalline H2O-ice: 2.5–22 μm (4000-455 cm−1) optical constants of H2O-ice. Astrophys. J. 2009, 701, 1347–1356. [Google Scholar]
  53. Jacob, H. Neuere Untersuchungen zur Genesis natürlicher, fester Erdölbitumina. Geol. Jahr 1983, D 59, 3–61. [Google Scholar]
  54. Moroz, L.V.; Arnold, G.; Korochantsev, A.V.; Wäsch, R. Natural Solid Bitumens as Possible Analogs for Cometary and Asteroid Organics:. 1. Reflectance Spectroscopy of Pure Bitumens. Icarus 1998, 134, 253–268. [Google Scholar] [CrossRef]
  55. Moroz, L.; Baratta, G.; Strazzulla, G.; Starukhina, L.; Dotto, E.; Barucci, M.A.; Arnold, G.; Distefano, E. Optical alteration of complex organics induced by ion irradiation:. 1. Laboratory experiments suggest unusual space weathering trend. Icarus 2004, 170, 214–228. [Google Scholar] [CrossRef]
  56. Moroz, L.V.; Markus, K.; Arnold, G.; Henkel, D.; Kappel, D.; Schade, U.; Ciarniello, M.; Rousseau, B.; Quirico, E.; Schmitt, B.; et al. Laboratory spectral reflectance studies aimed at providing clues to composition of refractory phases of comet 67P/CG’s nucleus. In Proceedings of the European Planetary Science Congress (EPSC2017), Riga, Latvia, 17–22 September 2017; p. 266. [Google Scholar]
  57. Britt, D.T.; Bell, J.F.; Haack, H.; Scott, E.R.D. The Reflectance Spectrum of Troilite. In Lunar and Planetary Science Conference; Technical Report; Lunar and Planetary Inst.: Houston, TX, USA, 1992; Volume 23. [Google Scholar]
  58. Cloutis, E.A.; Sanchez, J.A.; Reddy, V.; Gaffey, M.J.; Binzel, R.P.; Burbine, T.H.; Hardersen, P.S.; Hiroi, T.; Lucey, P.G.; Sunshine, J.M.; et al. Olivine-metal mixtures: Spectral reflectance properties and application to asteroid reflectance spectra. Icarus 2015, 252, 39–82. [Google Scholar] [CrossRef]
  59. Clark, R.N.; Curchin, J.M.; Jaumann, R.; Cruikshank, D.P.; Brown, R.H.; Hoefen, T.M.; Stephan, K.; Moore, J.M.; Buratti, B.J.; Baines, K.H.; et al. Compositional mapping of Saturn’s satellite Dione with Cassini VIMS and implications of dark material in the Saturn system. Icarus 2008, 193, 372–386. [Google Scholar] [CrossRef]
  60. Chandrasekhar, S. Radiative Transfer; Dover: New York, NY, USA, 1960. [Google Scholar]
  61. Shepard, M.K.; Helfenstein, P. A test of the Hapke photometric model. J. Geophys. Res. 2007, 112. [Google Scholar] [CrossRef] [Green Version]
  62. Hapke, B. Bidirectional reflectance spectroscopy: 6. Effects of porosity. Icarus 2008, 195, 918–926. [Google Scholar] [CrossRef] [Green Version]
  63. Hiroi, T.; Pieters, C.M. Effects of grain size and shape in modeling reflectance spectra of mineral mixtures. Lunar Planet. Sci. Conf. Proc. 1992, 22, 313–325. [Google Scholar]
  64. Kaplan, H.H.; Milliken, R.E.; Alexander, C.M.O. New Constraints on the Abundance and Composition of Organic Matter on Ceres. Geophys. Res. Lett. 2018, 45, 5274–5282. [Google Scholar] [CrossRef] [Green Version]
  65. Raponi, A.; Carrozzo, F.G.; Zambon, F.; De Sanctis, M.C.; Ciarniello, M.; Frigeri, A.; Ammannito, E.; Tosi, F.; Combe, J.P.; Longobardo, A.; et al. Mineralogical mapping of Coniraya quadrangle of the dwarf planet Ceres. Icarus 2019, 318, 99–110. [Google Scholar] [CrossRef]
  66. Mustard, J.F.; Pieters, C.M. Photometric phase functions of common geologic minerals and applications to quantitative analysis of mineral mixture reflectance spectra. J. Geophys. Res. 1989, 94, 13619–13634. [Google Scholar] [CrossRef]
  67. Carli, C.; Ciarniello, M.; Capaccioni, F.; Serventi, G.; Sgavetti, M. Spectral variability of plagioclase-mafic mixtures (2): Investigation of the optical constant and retrieved mineral abundance dependence on particle size distribution. Icarus 2014, 235, 207–219. [Google Scholar] [CrossRef]
  68. Ciarniello, M.; Capaccioni, F.; Filacchione, G. A test of Hapke’s model by means of Monte Carlo ray-tracing. Icarus 2014, 237, 293–305. [Google Scholar] [CrossRef]
  69. Raponi, A.; De Sanctis, M.C.; Carrozzo, F.G.; Ciarniello, M.; Castillo-Rogez, J.C.; Ammannito, E.; Frigeri, A.; Longobardo, A.; Palomba, E.; Tosi, F.; et al. Mineralogy of Occator crater on Ceres and insight into its evolution from the properties of carbonates, phyllosilicates, and chlorides. Icarus 2019, 320, 83–96. [Google Scholar] [CrossRef]
  70. Hapke, B. Space weathering from Mercury to the asteroid belt. J. Geophys. Res. 2001, 106, 10039–10074. [Google Scholar] [CrossRef]
  71. Lucey, P.G.; Noble, S.K. Experimental test of a radiative transfer model of the optical effects of space weathering. Icarus 2008, 197, 348–353. [Google Scholar] [CrossRef]
  72. Maxwell-Garnett, J. Colours in metal glasses and in metallic films. Philos. Trans. R. Soc. Lond. Ser. A 1904, 203, 385–420. [Google Scholar]
  73. Hapke, B. Bidirectional reflectance spectroscopy. 1. Theory. J. Geophys. Res. Planets 1981, 86, 4571–4586. [Google Scholar]
  74. Mie, G. Beiträge zur Optik trüber Medien, speziell kolloidaler Metallösungen. Ann. Phys. 1908, 377–445, 377–445. [Google Scholar]
  75. Haynes, W.M.; Lide, D.R.; Bruno, T.J. CRC Handbook of Chemistry and Physics: A Ready-Reference Book of Chemical and Physical Data, 97th ed.; CRC Press: Boca Raton, FL, USA, 2016. [Google Scholar]
  76. Röseler, A.; Schade, U. Polarizing interferometer for the unambiguous determination of the ellipsometric parameters. Appl. Opt. 2020, 59, 6619–6624. [Google Scholar] [CrossRef]
  77. Egan, W.G.; Hilgeman, T. The rings of Saturn—A frost-coated semiconductor. Icarus 1977, 30, 413–421. [Google Scholar] [CrossRef]
  78. Li, J.Y.; A’Hearn, M.F.; Belton, M.J.S.; Crockett, C.J.; Farnham, T.L.; Lisse, C.M.; McFadden, L.A.; Meech, K.J.; Sunshine, J.M.; Thomas, P.C.; et al. Deep Impact photometry of Comet 9P/Tempel 1. Icarus 2007, 187, 41–55. [Google Scholar] [CrossRef]
  79. Li, J.Y.; A’Hearn, M.F.; McFadden, L.A.; Belton, M.J.S. Photometric analysis and disk-resolved thermal modeling of Comet 19P/Borrelly from Deep Space 1 data. Icarus 2007, 188, 195–211. [Google Scholar] [CrossRef]
  80. Li, J.Y.; A’Hearn, M.F.; Farnham, T.L.; McFadden, L.A. Photometric analysis of the nucleus of Comet 81P/Wild 2 from Stardust images. Icarus 2009, 204, 209–226. [Google Scholar] [CrossRef]
  81. Li, J.Y.; Besse, S.; A’Hearn, M.F.; Belton, M.J.S.; Bodewits, D.; Farnham, T.L.; Klaasen, K.P.; Lisse, C.M.; Meech, K.J.; Sunshine, J.M.; et al. Photometric properties of the nucleus of Comet 103P/Hartley 2. Icarus 2013, 222, 559–570. [Google Scholar] [CrossRef]
  82. Henyey, L.G.; Greenstein, J.L. Diffuse radiation in the Galaxy. Astrophys. J. 1941, 93, 70–83. [Google Scholar]
  83. Capaccioni, F.; Cerroni, P.; Barucci, A.; Fulchignoni, M. Phase curves of meteorites and terrestrial rocks—Laboratory measurements and applications to asteroids. Icarus 1990, 83, 325–348. [Google Scholar]
Figure 1. Reflectance spectra of water ice (a; SPIPA-B), kerite (b), and pyrrhotite (c) samples. Spectral features described in the text are indicated by dashed lines. The major spectral features of water ice and the kerite aromatic CH and CH 2 /CH 3 aliphatic/aromatic absorptions (contributing to the broad 3.18–3.64 μ m band) are indicated by bold dashed lines. These features, for the different sets of mixtures, are characterized by means of apposite spectral indicators in Section 3. The light gray bands indicate a spectral region where possible residual water vapour contamination in the optical path may affect the resulting spectra.
Minerals 11 01222 g001
Figure 2. Set of binary mixtures investigated in this work. Top panel: water ice–kerite mixtures; central panel: water ice–pyrrhotite mixtures; bottom panel: kerite–pyrrhotite mixtures. See text for further details.
Minerals 11 01222 g002
Figure 3. REFF spectra for water ice–kerite 45 63 (left panels) and water ice–kerite < 25 (right panels) intimate mixtures. Mass fractions are indicated (K: kerite, I: water ice). Panels (c,d) show zooms of (a,b), respectively, at IR wavelengths and low reflectances. The light gray bands indicate a spectral region where possible residual water vapour contamination in the optical path may affect the resulting spectra.
Minerals 11 01222 g003aMinerals 11 01222 g003b
Figure 4. Water-ice-related absorption features and Fresnel peak for water ice–kerite 45 63 (left panels: a,c,e,g,i) and water ice–kerite < 25 (right panels: b,d,f,h,j) intimate mixtures. The name of the monitored feature is indicated in the corresponding panel title. Absorption bands are plotted after continuum-removal (the black dashed line in each plot indicates the continuum-removed baseline), while the Fresnel peak region is shown after normalization at 2.98 μ m. Kerite (K) and water ice (I) mass fractions are indicated.
Minerals 11 01222 g004aMinerals 11 01222 g004b
Figure 5. Kerite-related absorption features for water ice–kerite 45 63 (left panels: a,c,e,g) and water ice–kerite < 25 (right panels: b,d,f,h) intimate mixtures. The name of the monitored feature is indicated in the corresponding panel title. Absorption bands are plotted after continuum-removal and the black dashed line in each plot indicates the continuum-removed baseline. Kerite (K) and water ice (I) mass fractions are indicated.
Minerals 11 01222 g005aMinerals 11 01222 g005b
Figure 6. (a) Water ice–pyrrhotite 25 50 intimate mixture spectra. Mass fractions are indicated (P: pyrrhotite, I: water ice). (b) Zoom at low reflectances. The light gray bands indicate a spectral region where possible residual water vapour contamination in the optical path may affect the resulting spectra.
Minerals 11 01222 g006
Figure 7. Water-ice-related absorption features (ad) and Fresnel peak (e) for water ice–pyrrhotite 25 50 intimate mixtures. Absorption bands are plotted after continuum-removal (the black dashed line in each plot indicates the continuum-removed baseline), while the Fresnel peak region is shown after normalization at 2.98 μ m. Pyrrhotite (P) and water ice (I) mass fractions are indicated.
Minerals 11 01222 g007aMinerals 11 01222 g007b
Figure 8. (a) Water ice–pyrrhotite < 25 intraparticle mixture spectra. Mass fractions are indicated (P: Pyrrhotite, I: Water ice). (b) Zoom at low reflectances. The light gray bands indicate a spectral region where possible residual water vapour contamination in the optical path may affect the resulting spectra.
Minerals 11 01222 g008
Figure 9. Water-ice-related absorption features (ad) and Fresnel peak (e) for water ice–pyrrhotite < 25 intraparticle mixtures. Absorption bands are plotted after continuum-removal (the black dashed line in each plot indicates the continuum-removed baseline) while the Fresnel peak region is shown after normalization at 2.98 μ m. Pyrrhotite (K) and water ice (I) mass fractions are indicated.
Minerals 11 01222 g009aMinerals 11 01222 g009b
Figure 10. Modelled (dashed lines) and measured (solid lines) spectra for (a) water ice–kerite 45 63 (b), water ice–kerite < 25 (c), water ice–pyrrhotite 25 50 , and (d) kerite 25 50 –pyrrhotite < 25 mixtures. The nominal mass fractions of the different endmembers (water ice: I; kerite: K; pyrrhotite: P) are indicated in each panel. The light grey bands indicate a spectral region where possible residual water vapour contamination in the optical path may affect the resulting spectra.
Minerals 11 01222 g010
Figure 11. SEM secondary electron mode images of the (a) kerite 45 63 , (b) kerite 25 50 , and (c) kerite < 25 samples at two levels of magnification.
Minerals 11 01222 g011
Figure 12. SEM secondary electron mode images of the (a) pyrrhotite 25 50 and (b) pyrrhotite < 25 samples at two levels of magnification.
Minerals 11 01222 g012
Figure 13. Measured (solid lines) water ice–pyrrhotite intraparticle mixture spectra compared to fits (dashed lines) with the EMT-based model (a,b) and the LR11 model (c,d). Water ice (I) and pyrrhotite (P) nominal mass fractions are indicated. The light grey bands indicate a spectral region where possible residual water vapour contamination in the optical path may affect the resulting spectra.
Minerals 11 01222 g013
Table 1. Intimate mixture modelling parameters: the nominal mass fractions are compared with the fit-estimated values (in parentheses). The resulting values of the scaling factor C are reported, along with the NRMSD and the adjusted grain sizes d * of the indicated endmembers (see text). For the kerite 25 50 –pyrrhotite < 25 mixtures, the kerite/pyrrhotite adjusted size ratio d k * / d p * is reported.
Water Ice–kerite 45 63 [wt%])Ckerite 45 63   d * [ μ m]NRMSD [%]
99(98.9)–1(1.1)0.7947 a 5
92(82)–8(18)0.67218
70(54)–30(46)0.662810
Water Ice–kerite < 25 [wt%]Ckerite < 25   d * [ μ m]NRMSD [%]
99(96)–1(4)0.823.316
91(84)–9(16)0.826.722
77(61)–23(39)0.865.818
Water Ice–pyrrhotite 25 50 [wt%]Cpyrrhotite 25 50   d * [ μ m]NRMSD [%]
95(71)–5(29)0.694.95
81(34)–19(64)0.604.46
48(8)–52(92)0.693.54
kerite 25 50 –pyrrhotite < 25 [wt%]C d k * / d p * NRMSD [%]
50(10)–50(90)1.04275
33(5)–67(95)1.32293
a  In this case, given the small amount of kerite, the  d * value is poorly constrained. Assuming a reference value of d * = 30 μ m, similar to the one obtained for the other mixtures, would in fact correspond to a 0.6 wt% kerite abundance, still close to the nominal amount of 1 wt%.
Table 2. Water ice–pyrrhotite < 25 intraparticle mixture modelling parameters for the EMT-based model (top panel) and the LR11 model (bottom panel). For the EMT-based model, the nominal mass fractions are compared with the fit-estimated values (in parenthesis). For the LR11 model, the nominal mass fractions are assumed in the fitting routine, if not specified (in parentheses). The resulting value of the single particle phase function p ( 30 ) is indicated, along with the estimated size of the icy grains d and the NRMSD. For the LR11 model, the estimated size of the pyrrhotite inclusions d p is also reported.
EMT-Based Model
Water Ice-Pyrrhotite < 25 [wt%]p( 30 ) d [ μ m]NRMSD [%]
99.5(99.999)–0.5(0.001)011424
99(97)–1(3)2.3126069
95(92)–5(8)1.3716232
LR11 Model
Water Ice-Pyrrhotite < 25 [wt%]p( 30 ) d [ μ m] d p [ μ m]NRMSD [%]
99.5(99.975  a )–0.5(0.025  a )1.172221.711
99–11.231620.710
95–51.10770.711
a  Adjusted value.
Publisher’s Note: MDPI stays neutral with regard to jurisdictional claims in published maps and institutional affiliations.

