Article

Origin of the Pd-Rich Pentlandite in the Massive Sulfide Ores of the Talnakh Deposit, Norilsk Region, Russia

1
Sobolev Institute of Geology and Mineralogy, Siberian Branch of the Russian Academy of Sciences, Koptyuga Ave., 3, 630090 Novosibirsk, Russia
2
Department of Geology and Geophysics, Novosibirsk State University, Pirogova St., 1, 630090 Novosibirsk, Russia
*
Authors to whom correspondence should be addressed.
Submission received: 22 October 2021 / Revised: 8 November 2021 / Accepted: 9 November 2021 / Published: 12 November 2021
(This article belongs to the Special Issue The Formation of Sulfide Ores in PGE-Cu-Ni Deposits)

Abstract

:
Pd-rich pentlandite (PdPn) along with ore-forming pentlandite (Pn) occurs in the cubanite and chalcopyrite massive sulfide ores in the EM-7 well of the Southern-2 ore body of the Talnakh deposit. PdPn forms groups of small grains and comprises marginal areas in large crystals of Pn. The palladium content in PdPn reaches up to 11.26 wt.%. EDS elemental mapping and a contour map of palladium concentrations indicate distinct variations in the palladium content within and between individual grains. Palladium distribution in the large grains is uneven and non-zoned. PdPn was formed as the result of a superimposed process, which is not associated with either the sulfide liquid crystallization or the subsolidus transformations of sulfides. Deming regression calculations demonstrated the isomorphic substitution character of Ni by 0.71 Pd and 0.30 Fe (apfu), leading to PdPn occurrence. The replacement of Ni by Fe may also indicate a change in sulfur fugacity, compared to that taking place during the crystallization of the primary Pn. The transformation of Pn into PdPn could have occurred under the influence of a Pd-bearing fluid, which separated from the crystallizing body of the massive sulfide ores.

1. Introduction

Palladium along with platinum are the main platinum group elements (PGE) mined in PGE-Ni-Cu deposits. Their main mode of occurrence is within palladium minerals, although palladium can also be concentrated in sulfides and arsenides, entering the mineral structure. The development of ICP-MS LA methods has made it possible to determine very low concentrations of palladium and other PGE in common sulfide minerals of PGE-Ni-Cu deposits such as chalcopyrite, pyrrhotite and pentlandite. Several studies have demonstrated to a great extent that pentlandite is the only one of the three common sulfide minerals that concentrates Pd [1,2,3,4,5,6,7,8,9,10,11,12]. Nonetheless, pentlandite typically contains low to moderate value ranges (ppb to ppm) of the PGE, mostly Pd and Rh [13]. Keays et al. obtained values of 0.001–0.5 ppm for Pd in pentlandite from the Nickel deposits of the Kambalda camp [14]. On the other hand, 0.2–6700 ppm of Pd in pentlandite have been published for the J-M Reef, Stillwater Complex [9], and 0.28–2.7 ppm for the Creighton Mine, Sudbury [15]. The Talnakh pentlandite contains Pd in the range of 54–248 ppm, whereas Rh, Pt, Ir and Os are present at low levels (0.002–1.17 ppm) [13]. Additionally, up to thousands of ppm of Pd in pentlandite have also been reported in sulfide ores from the Platreef and Merensky Reef in the Bushveld Complex [8,10,16,17,18]. A relatively low palladium content (0.1–6 ppm) was recorded in the pentlandite from the Jinchuan [3], and even reached up to 1.5 wt.% in Stillwater ores [1,19]. Values ranging from 0.04–4.62 wt.% of Pd in the ores of the Norilsk−1 deposit were published by [4,12]. However, the highest Pd content in natural pentlandite (up to 9.8 wt.%) is reported in the J-M reef in the Stillwater Complex [20]. Thus, in the scientific literature, there are only a few references to even higher Pd concentrations in natural pentlandites [4,12,20]; however, these cases are extremely rare, and hence, special conditions must have been required.
Monosulfide and intermediate solid solutions (MSS and ISS), as well as quaternary and bornite solid solutions [21] crystallize during the evolution of a sulfide melt, depending on its primary composition. Sulfide minerals are the result of subsolidus transformations of these solid solutions and their exsolutions. Since Pd is incompatible with both MSS and ISS [22], it should be accumulated in the residual melt and reach its maximum concentration in the last portion of ISS from which chalcopyrite is formed. However, Pd accumulates in pentlandite and not in chalcopyrite. Thus, it is clear that the distribution of palladium is not strongly influenced by the enrichment process in the residual melt but by some other processes.
It is also noticeable that the significant enrichment of pentlandite in palladium is not only due to fractionation processes during the evolution of the sulfide melt. In order to identify the intervening factors and understand the reasons for these, it is advisable to study in detail the distribution pattern of palladium in individual grains and mineral aggregates.
Studies in the copper-rich massive sulfide ores of the Talnakh deposit (Norilsk region) have found natural pentlandite with an extremely high palladium content (up to 11.26 wt.%). It is usually associated with large multiphase platinum group minerals (PGM) grains and, in terms of morphology and optical properties, is not different from ore-forming pentlandite, in which the Pd concentration is below the detection limit (<0.06 wt.%) of the X-ray spectral method. The aims of this work are to study Pd-rich pentlandite grains; to reveal the Pd distribution in individual grains and grain populations; and to determine the possible causes for its occurrence.

2. Geology of the Talnakh Ore Cluster

The Talnakh ore cluster is located in the Norilsk region in the northwestern corner of the Siberian platform near the border with the Yenisey−Khatanga trough (Figure 1). The structural style of the Norilsk region is dominated by positive and negative structures and faults, mostly oriented northeastern. Negative structures such as basins are filled with Permian-Triassic volcanic series that belong to the Siberian flood basalt province, whereas positive structures consist of Paleozoic sediments sequences, including carbonates, evaporites and terrigenous rocks [23,24,25,26]. The Norilsk–Kharaelakh fault of north-northeast-striking is the most important structure from the standpoint of PGE-Ni-Cu mineralization owing to the fact that the Norilsk and Talnakh ore clusters are confined to it (Figure 1).
The Talnakh ore cluster includes the Talnakh and Oktyabr’sky PGE-Ni-Cu deposits, which are associated with the Talnakh and Kharaelakh mafic-ultramafic ore-bearing intrusions (Figure 1b). The intrusions are hosted in a Devonian to Permian sedimentary sequence that incudes coal-bearing terrigenous sediments, carbonates and evaporites [23,24,25,26]. The intrusions are not exposed on the surface. The southern (frontal) part of the Talnakh intrusion approaches the surface, where it is overlain by Cenozoic sediments. Both intrusions are plunging toward the northeast along the Norilsk–Kharaelakh fault to a depth of about 1.5 km.
Ore-bearing intrusions of the Norilsk region have a similar structure and rock composition. In general, the rocks of the Norilsk ore-bearing intrusions are termed as gabbro-dolerites due to the fine-grained texture, which makes them similar to the subvolcanic varieties. The intrusions have a well-defined layered structure. A typical stratigraphic section from bottom to top is represented by layers of lower taxitic, picritic, olivine, olivine-bearing, olivine-free gabbro-dolerites, leucogabbro and upper taxitic gabbro-dolerites. The sequence order and thickness of the layers may somewhat vary from place to place. Disseminated sulfide ores in the intrusions are mainly associated with lower taxitic and picritic gabbro-dolerites, and besides, massive sulfide ore bodies occur near the lower contact of the intrusion (Figure 1b). Some of them may even penetrate the lower contact of the intrusion, the result of which is that one margin of the ore body is located inside the intrusion whereas the other is in the underlying sedimentary rocks. The massive sulfide ore bodies of the Talnakh and Kharaelakh intrusions consist mainly of pyrrhotite varieties. Ore bodies including copper-rich ores are rather rare. These are normally found in the frontal parts of the intrusions, including the western and northwestern part of the Kharaelakh and the southern part of the Talnakh intrusions. The Southern-2 ore body of the Talnakh intrusion is one such ore body (Figure 1b) and the subject of this research.

3. Materials and Methods

3.1. Sampling and Analytical Procedure

The study of the ore body and the collection of samples were carried out using the core sample of the EM-7 well. The sampling interval did not exceed 0.5 m. Additional samples were collected from the contact margins of the ore body and from various layers in order to have a better characterization of the internal structure of the ore body and each of the layers in terms of change in mineral associations and mineral compositions.
A total of 35 samples were collected. Two types of polished sections were prepared for this research. Thirty-five polished sections fixed with epoxy resin and a diameter of 25 mm were prepared to study the structure of the ores and the relationship of ore-forming minerals. Eleven small fragments of ores with large visible PGM grains were also fixed with epoxy resin into small polished sections with a diameter of 8 mm. After polishing, all preparations were examined using an optical microscope. Twenty polished sections were used for microanalysis in an electron microscope and an electron probe microanalyzer to determine the composition of minerals.
Analytical studies were carried out at the laboratory of X-ray spectral analysis of the Analytical Center for Multi-Elemental and Isotope Research of SB RAS at the Sobolev Institute of Geology and Mineralogy, SB RAS, Novosibirsk (Russia). The study of the relationship of mineral phases in intergrowth zones, the detection of small grain of minerals and the preliminary estimation of mineral composition were made using the MIRA 3 LMU electron microscope (TESCAN ORSAY Holding a.s., Brno, Czech Republic) with INCA Energy 450+/Aztec Energy XMax 50 + and INCA Wave 500 microanalysis systems (Oxford Instruments Nanoanalysis). For the analysis, carbon-coated epoxy mounts with a thickness of 0.5 cm and a diameter of 25 mm and 8 mm were employed. The chemical composition of minerals was determined using the electron probe microanalyzer JXA-8230 (JEOL Ltd., Tokyo, Japan) under accelerating voltage of 20 kV, beam current of 50 nA and beam size of 2–3 µm. Acquisition time on a spectral line (peak/background) was 10/5 s. Natural minerals and synthetic alloys were used as standards. Concentrations were calculated by the ZAF correction method. The uncertainty was 1–3 rel.% for major elements and 5–10 rel.% for minor and trace elements. The detection limit Cmin was calculated using the 2σ-criterion at the confidence level of 95% (Table 1).

3.2. EDS Elemental Distribution Maps

EDS Elemental distribution maps were obtained using an electron probe microanalyzer JXA-8230 (JEOL Ltd., Tokyo, Japan). The color scale is generated automatically by the microanalyzer software and reflects the relative concentrations of a chemical element using 256 colors. The scale may contain any number of relative units from minimum to maximum concentrations of the element, which are distinguished by the microanalyzer (see Figure 8b,c). The color scale in some of the EDS maps was modified using the microanalyzer original software in order to highlight elemental chemical variations at the most significant concentration levels for this study. For example, to demonstrate variations in the low concentrations of palladium in pentlandite, we use all 256 colors only in the range of 0–80 from the total range 0–652 (see Figure 8f). The gap in the color scale indicated by the number 80 shows the limit for this interval. The variations in Pd content corresponding to the range of 80–652 is then displayed in one color number 256. Changes in palladium concentrations within this range became indistinguishable. The same method was used to modify the color scale in the EDS elemental distribution maps for Cu, Ni and Co (see Figure 8a,d,e, respectively).

3.3. Mapping of Pd Distribution in Pentlandite

Preliminary SEM studies have shown that the distribution of palladium in pentlandite is extremely uneven. Concentration of Pd may approach the detection limit in the center of large grain and can sharply increase (up to 5 wt.%) towards one of the edges. However, it can remain low to the opposite side edge. The maximum enrichment in palladium (up to 11.26 wt.%) was detected in fine pentlandite grains located inside cubanite or chalcopyrite. That is, only small pentlandite grains surrounded by cubanite and chalcopyrite, as well as thin rims in large grains, are essentially enriched in palladium. Therefore, in order to outline the areas where palladium-pentlandite enrichment took place, fine grains (<10 microns) of pentlandite, as well as narrow edges in large grains, were analyzed. Three analyses by electron probe microanalyzer JXA-8230 were performed for each fine grain or site on the edge of large grains. Analyses with low sums and copper capture from surrounding cubanite or chalcopyrite were discarded. Then, the average value was calculated to obtain a consistent pentlandite composition for each site. A total of 636 analyses were performed. After rejection, 462 analyses remained (Supplementary Materials, Table S1). This corresponds to 189 sites for which reliable average compositions of pentlandite were obtained. These 189 sites almost evenly cover the area of preparation 32−11, which was selected for mapping of palladium-pentlandite enrichment. The absence of sites in some areas of the map just indicates pentlandite grains were absent. Palladium concentrations at the 189 sites were used to draw a map with contours of equal palladium concentrations in the population of pentlandite grains.

4. Results

4.1. Structure and Mineral Assemblages of the Southern-2 Ore Body

The Southern-2 ore body is located in the frontal part of the Talnakh ore-bearing intrusion at the southwestern tip (Figure 1). It occurs near the lower contact of the intrusion with underlying olivine gabbro-dolerites and overlying taxitic gabbro-dolerites. The ore body extends 350 m from north to south and 150 m from west to east. The maximum thickness reaches 9.6 m in the central part, where the EM-7 well drilled the ore body at a depth of 69.4 to 79 m. This is the most representative cross-section of the ore body selected for study (Figure 2).
The ore body consists of massive sulfide ores with a predominance of chalcopyrite-rich varieties. The main ore-forming minerals are chalcopyrite, cubanite, pentlandite and pyrrhotite. They form a coarse-grained aggregate, which composes 65–95 vol.% of the ore. All ores contain magnetite (up to 10 vol.%) and a variable amount of silicate minerals (up to 30 vol.%). The latter is represented mainly by iron-rich chlorite, which fills fractures and intergranular space between ore-forming sulfides. Minor sulfide minerals are sphalerite and smythite. The first occurs everywhere as inclusions in chalcopyrite. The second is rather rare. Fine grains of smythite were found at a depth of 77.9–76.9 m where it replaces pentlandite. Accessory minerals are PGM, Au-Ag alloys, galena, auricupride and tetra-auricupride. There are two types of accessory PGM grains. The first is represented by fine, partially faceted single-mineral grains of zvyagintsevite (Pd3Pb), polarite (PdBi), menshikovite (Pd3Ni2As3), stillwaterite (Pd8As3), palladoarsenide (Pd2As) or their two-phased intergrowths. This PGM is 1–30 microns in size and is found in ores at different depths in the whole section. The second one is a large (up to 2 mm), complicated multiphase aggregate of either round or irregular shape, consisting of 3–6 phases of PGM along with Au-Ag alloy, galena, auricupride and tetra-auricupride. The aggregates contain atokite (Pd3Sn), rustenburgite (Pt3Sn), taimyrite ((Pd,Cu)3Sn), zvyagintsevite (Pd3Pb), norilskite ((Pd,Ag)7Pb4), tetraferroplatinum (PtFe), polarite (PdBi), mertieite-II (Pd8(Sb,As)3), majakite (PdNiAs) and stibiopalladinite (Pd5+xSb2−x) in variable proportions.
Multiphase PGM grains are found in the upper half of the section at depths from 69.6 to 76.7 m. The mineral association of the PGM and their compositions is consistent with previously published data [27,28] and is not considered here.
The Southern-2 ore body has a layered structure due to the regular change in mineral associations and the ratios of base metal sulfides. The ore body consists of the following four layers (Figure 2):
The upper chalcopyrite layer is the uppermost and the main layer of the ore body. The depth is 76.4–69.4 m, with a thickness of 7 m. It consists of chalcopyrite-pentlandite ores (Figure 3a). The key feature of the layer is the large amount of chalcopyrite that remains almost constant and is about 85 vol.%. The amount of pentlandite reaches 15 vol.%. The lower boundary of the layer corresponds to the appearance of cubanite in the underlying cubanite layer.
The cubanite layer is the thin transitional zone between the overlying upper chalcopyrite layer and the underlying pyrrhotite layer. The corresponding depth is 77.0–76.4 m, with a thickness of 0.6 m. It consists of cubanite-chalcopyrite-pentlandite ores (Figure 3b). The main mineral of the layer is cubanite in amounts that reach 60 vol.% at the bottom and gradually decreases upward until 50 vol.%. The amount of chalcopyrite increases upward from 20 to 30 vol.% as the amount of cubanite decreases. The amount of pentlandite remains constant at about 15 vol.%. The content of magnetite in the ores is about 5 vol.%. The lower boundary of the layer is drawn along the first appearance of pyrrhotite in the underlying pyrrhotite layer. The upper boundary corresponds to the absence of cubanite.
The pyrrhotite layer is the second most significant layer of the ore body. It is located at a depth of 78.8–77.0 m and has a thickness of 1.8 m. It consists of pyrrhotite-cubanite-chalcopyrite-pentlandite ores (Figure 3c). The most remarkable feature of the layer is the presence of pyrrhotite. Its amount reaches 50 vol.% at the bottom and gradually decreases upward until it completely disappears at the top. The amount of cubanite increases upward from 20 to 60 vol.% as the amount of pyrrhotite decreases. The amount of pentlandite and chalcopyrite remains constant (15 and 5 vol.%, respectively). The upper and lower boundaries of the pyrrhotite layer are characterized by the disappearance of pyrrhotite.
The lower chalcopyrite layer is a very thin but distinct layer at the lower contact of the ore body. The depth is 79–78.8 m. The thickness is 0.2 m. It consists of chalcopyrite-cubanite-pentlandite ores (Figure 3d). The layer is characterized by sharp zoning. The amount of chalcopyrite reaches 95 vol.% at the bottom and gradually decreases upward to 40 vol.% at the top. The amount of cubanite increases upward from 0 to 30 vol.% as the amount of chalcopyrite decreases. The amount of pentlandite increases upward from 5 to 20 vol.%. The amount of magnetite increases upward from 0 to 10 vol.%. The lower boundary of the layer is the contact of the ore body.
The upper boundary corresponds to the appearance of pyrrhotite in the overlying pyrrhotite layer. The layered structure of the ore body as a whole, as well as the internal changes in the ratio of minerals within each of the layers, reflects a gradual increase in copper-bearing minerals from the bottom to the top. The only exception to this trend is the lower chalcopyrite layer, which may have formed as a result of some boundary effects of sulfide liquid crystallization in the contact zone of the ore body.

4.2. Morphology of the Pentlandite

Pentlandite occurs in two morphological varieties in the ores of the Southern-2 ore body that is either lamellae or large crystals, which may appear as well as granular aggregates of coarse xenomorphic pentlandite grains. Both varieties are found in all types of ores but have their own typomorphic features (Figure 4). Pentlandite in the form of flame-like lamellas and coarse-grained aggregates occur in ores of the pyrrhotite layer (Figure 4a,b, respectively). Flames and granular pentlandites appear intergrown with chalcopyrite and cubanite. These morphological types are typical for pyrrhotite ores from Norilsk and many other deposits.
Pentlandite from the cubanite and chalcopyrite layers is found as well in these two forms. Normally, lamellae form a network of plates intersecting at right angles. Well-developed network-arrangements are more common in chalcopyrite ores (Figure 4c), whereas cubanite ores often contain individual lamellae only or groups of parallel lamellae, although some of them can also intersect each other at right angles (Figure 4d).
In addition, there are remnants of a network of pentlandite lamellae, largely replaced by cubanite (Figure 4h), which are similar to those in the ores of the chalcopyrite layer (Figure 4c).
Large individual crystals of pentlandite or their intergrowths represent granular pentlandite from chalcopyrite and cubanite ores (Figure 4e,f). A network of chalcopyrite lamellae occurs inside the crystals, intersecting at right angles (Figure 4e) or at angles of approximately 60 degrees (Figure 4f). This indicates that the chalcopyrite lamellae are parallel to the edges of the cube. This means that a primary solid solution (presumably high PnSS) with cubic symmetry exsolved into pentlandite and chalcopyrite upon cooling. ISS lamellae, now represented by chalcopyrite, exsolved parallel to the faces of the cube due to cleavage on {001} in the matrix or to the similarity of structural elements between the high PnSS matrix and ISS lamellae. The presence of several differently oriented networks of chalcopyrite lamellae in granular pentlandite indicates the occurrence of various crystals of pentlandite intergrown all together (Figure 4f). It is important to emphasize that networks of chalcopyrite lamellae found inside pentlandite lamellae (Figure 4g) and large pentlandite crystals (Figure 4e,f) are exactly the same. This allows to suggest that both lamellae and granular pentlandite in the cubanite and chalcopyrite ores had the same history of subsolidus changes.
Both forms of pentlandite-crystals and lamellae occurring in cubanite and chalcopyrite ores have experienced partial dissolution and/or replacement by cubanite or chalcopyrite, respectively. This is clearly seen in the marginal zone of the crystals, where there are many small pentlandite relicts that were previously parts of a bigger crystal (Figure 4e,f). Dissolution and/or replacement of pentlandite lamellae by cubanite or chalcopyrite leads to the occurrence of individual tiny relicts of pentlandite grains forming tails or chains in cubanite and chalcopyrite ores (Figure 4f).

4.3. Compositional Variations of the Ore-Forming Pentlandite

Microprobe analyses were performed in fifteen samples from the massive sulfide ores along the section of the Southern-2 ore body in order to investigate the compositional variations of ore-forming pentlandite. Four to eighteen analyses were carried out for each morphological variety in each of the samples. The results obtained showed that pentlandites of different morphological varieties have the same composition within the same sample. Average compositions of pentlandite at different depths of the section are shown in Table 2.
A systematic change in the composition of pentlandite throughout the section of the ore body was established (Figure 5). The concentration of Ni gradually increases to the top from 33.20 to 40.58 wt.%, whereas the concentration of Fe decreases from 31.85 to 25.46 wt.% in the same direction. Ores at the very top and bottom plot slightly off the general trend. Pentlandite in the top has a higher iron content compared to the previous samples. Furthermore, pentlandite in the base is enriched in Co and depleted in Fe (Figure 5 and Table 2).
Pd-bearing pentlandites were excluded from the previous interpretations of compositional trends, since the presence of palladium leads to a decrease in the nickel content. The division into ore-forming («Pd-free») and Pd-bearing («Pd-rich») pentlandites is arbitrary. We defined a concentration of 0.06 wt.% of Pd as the boundary between the two groups since it corresponds to the lowest detection limit of Pd in the electron probe microanalyzer, here used.

4.4. Location and Composition of Pd-Rich Pentlandite

Pd-rich pentlandite was found in six samples in the ores of the cubanite and upper chalcopyrite layers at depths from 76.7 to 69.6 m (Figure 5). In four out of the six samples, Pd-rich pentlandite occurs near large multiphase PGM grains, whereas in the other two samples located at depths of 69.6 and 72.3 m, PGM grains are absent. The highest Pd contents are typically found in very small pentlandite grains in chalcopyrite and cubanite of a few microns in size. They may yield up to 9.66 wt.% Pd in sample 32–11 (76.5 m); and up to 11.26 wt.% Pd in sample 31–11 (76.7 m) (Table 3). These grains correspond to relicts of pentlandite lamellae in cubanite or chalcopyrite (Figure 4h) as well as relicts of the marginal zone in large crystals that were partially substituted by cubanite or chalcopyrite (Figure 4e,f), as discussed above. It is important to note that the concentration of palladium in the central part of these large crystals is very low or even below the detection limit. There are no features in the morphology or optical properties that make it possible to distinguish pentlandite grains with a high palladium content from ore-forming pentlandite, which does not contain significant palladium.
Areas comprising Pd-rich pentlandite grains are very small with sizes that do not exceed a few millimeters across. One of them is shown in Figure 6. The concentration of Pd in pentlandite within these areas can vary greatly from 9–11.26 wt.% at local maximums in the central part of the area up to tenths of a percent in the margins. Regardless of this, the compositional changes are consistent. The boundary line (the white line in Figure 6b) of the areas was drawn according to the Pd concentration of 0.06 wt.% corresponding to the lower detection limit in the microprobe analysis carried out for this study.
Figure 6 shows the areas comprising Pd-rich pentlandite in cubanite ore (Figure 6a) and the contour map of Pd concentration in the population of Pd-rich pentlandite grains (Figure 6b). For further information on how the area was mapped, see Materials and Methods section. The area is confined to a multiphase PGM grain and to some extent it seems to replicate its shape. However, the local maximum, with the highest Pd content (9.8 wt.%), is located relatively far from the PGM grain. A great number of analyses confirm a consistent decrease in the concentration of palladium in fine pentlandite grains from the local maximum to the periphery of the studied area (Figure 6b).

4.5. Distribution of Pd in Individual Grains of Pentlandite

In order to study the Pd distribution in individual pentlandite grains, the area drawn in Figure 6a was selected. This area contains two large partially dissolved pentlandite crystals and several pentlandite lamellae in cubanite (Figure 7). One of the large crystals is in direct contact with the multiphase PGM grain containing taimyrite and other Pd-bearing minerals (Figure 7).
The EDS map of elemental distribution for Cu, Fe, S, Ni, Co and Pd in the selected area is shown in Figure 8. An uneven distribution of Ni and Co in the large crystals of pentlandite was established by means of the EDS elemental maps, which overall resembles a weakly expressed zoning (Figure 8d,e, respectively). In addition, a network of chalcopyrite lamellae within the pentlandite crystals is evident, as well as areas replaced by cubanite (Figure 8a).
The EDS maps show an extremely uneven distribution of palladium both among neighboring grains and in each individual grain. The lower margin of the large pentlandite crystal located in the lower part of the map shows the highest enrichment in palladium (Figure 8f). Palladium content reaches its maximums in the marginal zone of the crystal where it is in contact with cubanite and sharply decreases towards the center. The central part of the pentlandite crystal, next to the multiphase PGM grain, contains very low palladium and corresponds to the concentration for ore-forming pentlandite.
The concentration of palladium on the opposite margin of the crystal is insignificant and absent on the left border (Figure 8f). Thus, the distribution of palladium in the crystal is not to be considered zonal. Only some relatively narrow areas on the margin of the crystal are enriched with palladium.
The distribution of palladium in the pentlandite lamella in cubanite located in the lower left corner of the EDS map and the large crystal described above is essentially the same. The palladium content is maximum in the lower left part of the lamella and decreases upward to the right. It seems that the enrichment of neighboring pentlandite grains with palladium occurs in the same direction, shown with arrows in Figure 8f.
The same inhomogeneous distribution of palladium in pentlandite occurs in the upper part of the EDS map. A small isometric pentlandite crystal is enriched with palladium on the right side only (Figure 8f). An evident enrichment in palladium is observed next to fine pentlandite grains and lamellae in cubanite right above and below the crystal. However, the left margin of this crystal contains significantly less palladium. Smaller grains and a single large crystal positioned to the left of this crystal contain no palladium at all. The arrow shows the probable direction along which pentlandite was enriched in palladium in the upper part of the EDS map (Figure 8f).
Variations in the chemical composition of Pd-rich pentlandite were investigated by analyzing a large crystal along the LL’ and KK’ profiles (Figure 7). The KK’ line intersects the crystal from one Pd-enriched margin to another through the Pd-depleted core (Table 4 and Figure 9a). The LL’ line crosses from the marginal zone, the richest in Pd, through the Pd-depleted core to the contact with the multiphase PGM grain (Table 5 and Figure 9b). Both profiles show the opposite behavior for nickel and palladium (Figure 9). An increase in the palladium content leads to a decrease in nickel and vice versa.
The LL’ profile reveals the highest variations in the concentrations of Ni and Pd in pentlandite. The Pd content decreases from 5.37 wt.% at the rim to 0.13 wt.% at the core of the crystal. Simultaneously, the Ni content increases from 28.9 to 34.6 wt.% in the same direction (Table 5). The previously established variations are in good agreement with the observation that palladium-rich pentlandites have low nickel concentrations compared to ore-forming pentlandite within the same sample (Figure 5). The behavior of cobalt is ambiguous. Its content remains almost constant along the KK’ profile (Figure 9a). Along the LL’ profile, the line of cobalt content in general repeats the slope of the palladium line; nonetheless, variations of Co and Pd in some parts of the profile demonstrate the opposite behavior of them (Figure 9b).

5. Discussion

5.1. Position of Pd in the Pentlandite Structure

The highest concentration of palladium in Pd-rich pentlandites of the Southern-2 ore body corresponds to 11.26 wt.%, which is relatively close to the palladium content (12.96 wt.%) in synthetic pentlandite-like π (pi) phase [29]. This phase has a cubic structure with a formula of Fe4Ni4MS8, where M = Ru, Rh, Pd, although Fe:Ni:M ratio in π (pi) phase can vary within a wide range [30]. The proximity of some Pd-rich pentlandite and the π (pi) phase in terms of Pd content suggests that they may have in principle an identical crystallographic structure.
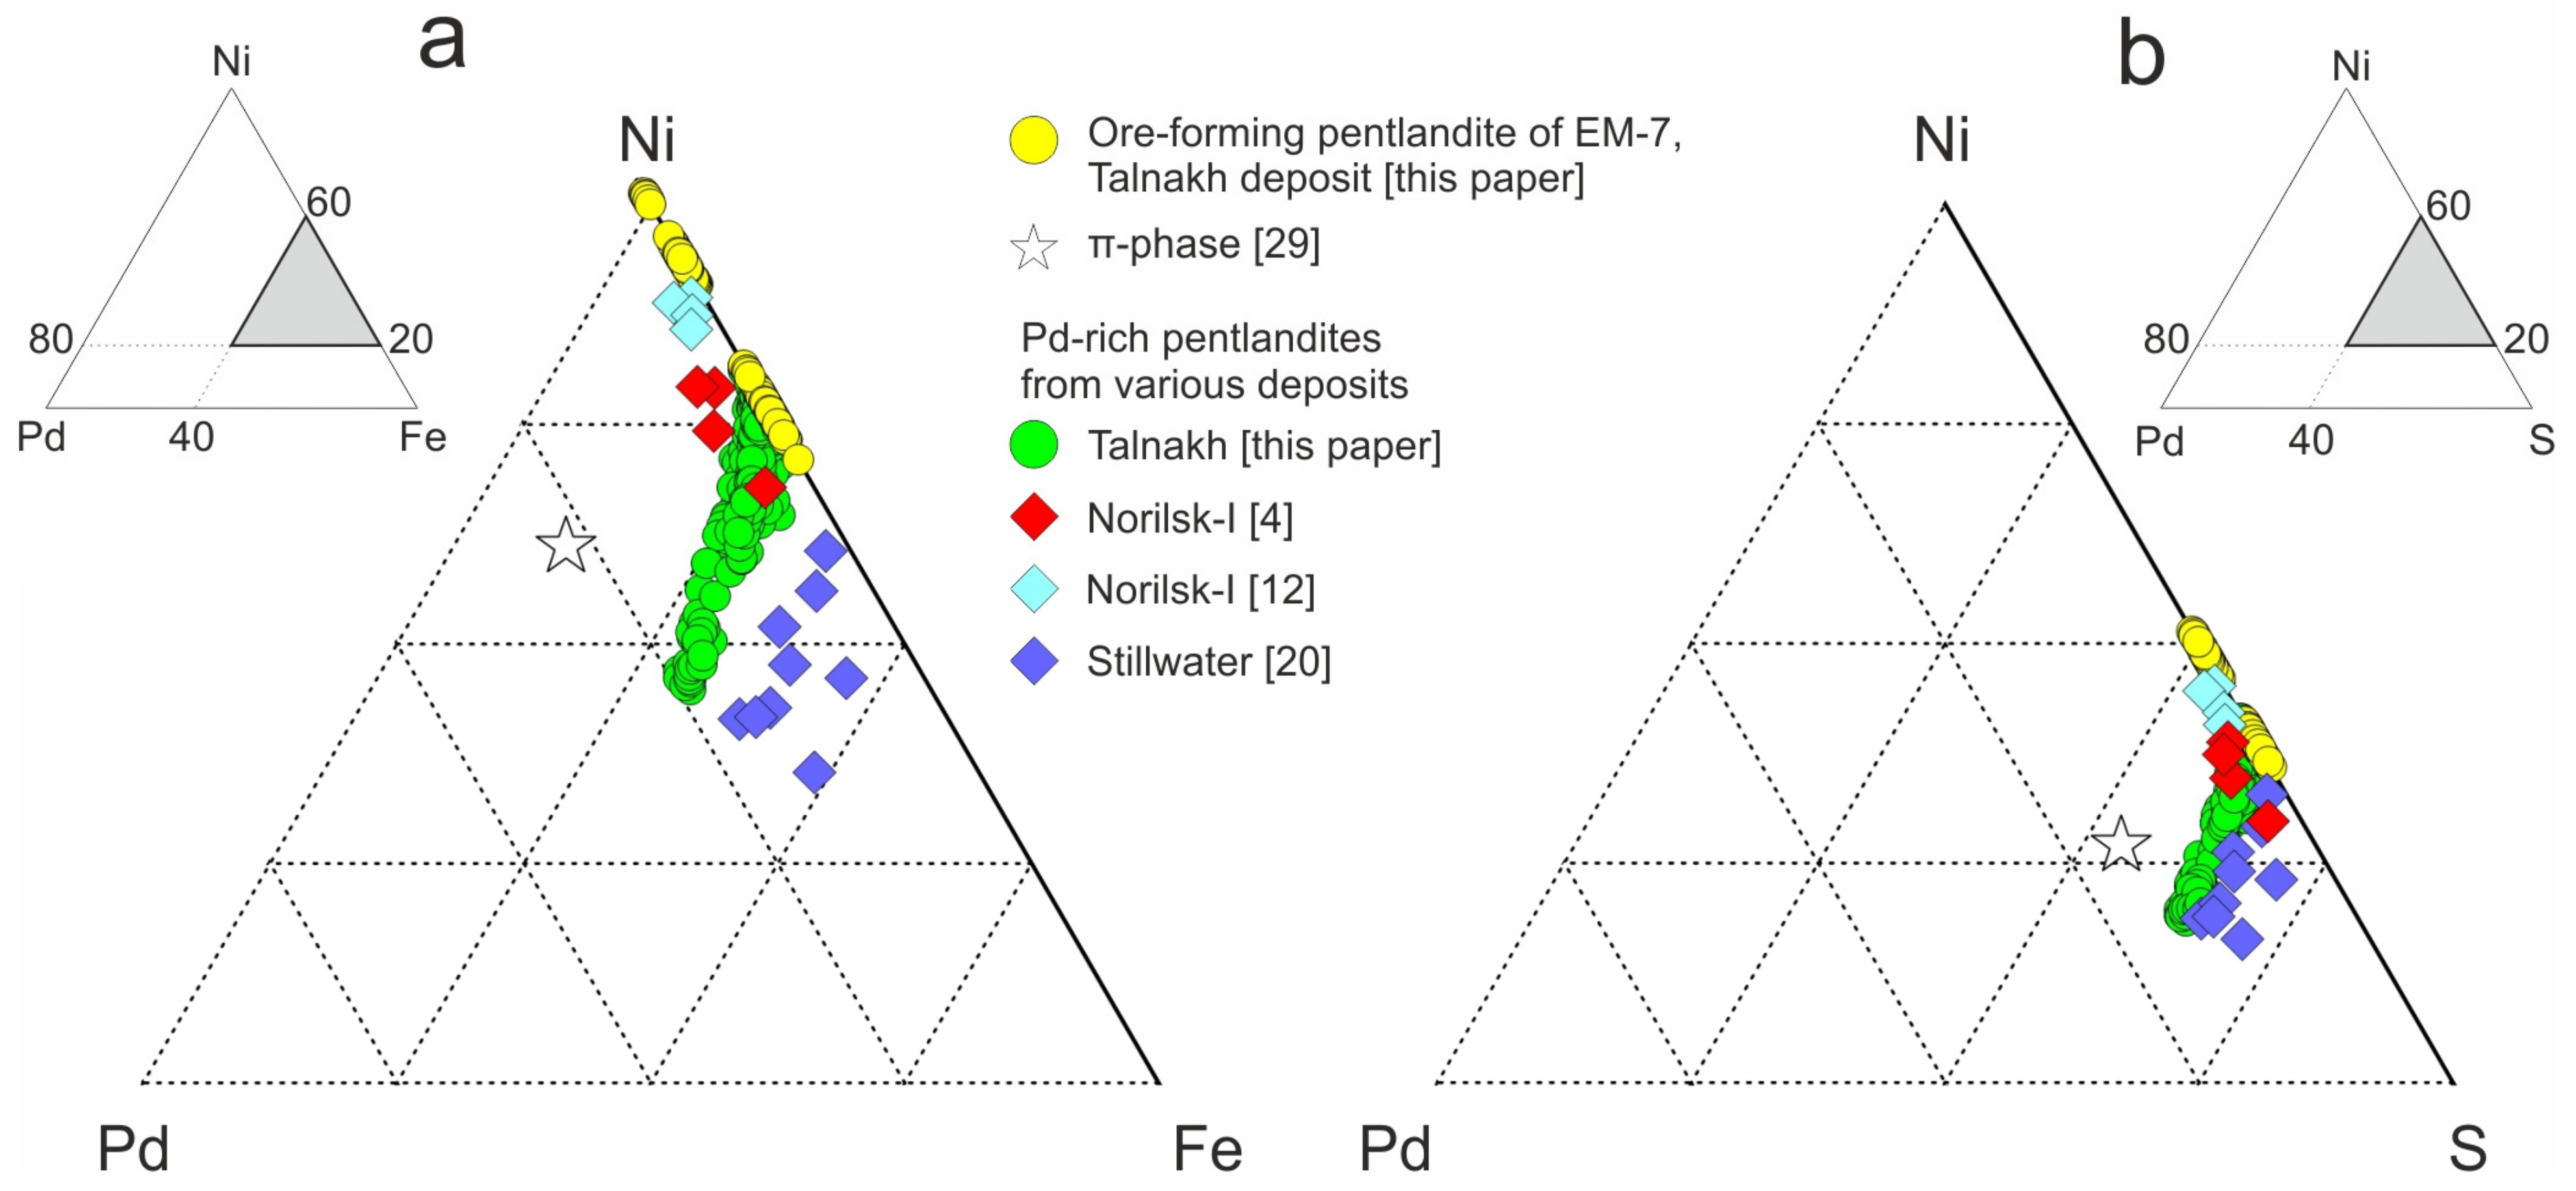
Compositions of π-phase, ore-forming and Pd-rich pentlandites from various deposits are plotted on ternary diagrams of Pd-Ni-Fe (Figure 10a) and Pd-Ni-S (Figure 10b). The Fe content in Pd-rich pentlandites of the Southern-2 ore body varies within a narrow range. Thus, their compositional points form a trend, subparallel to the Pd-Ni side of the Pd-Ni-S ternary plots (Figure 10a). Stillwater Pd-rich pentlandites contain more iron [20] and form a parallel trend located closer to the Fe angle. Compositions of Pd-rich pentlandites from Norilsk-1 form a different trend, subparallel to Ni-Fe side (Figure 10a), regardless of the fact that some compositions are similar to the Pd-rich pentlandites here presented. This may be due to the differences in the initial sulfide melt composition, possible difference in MSS and ISS composition and the conditions of crystallization. Thus, the studied Pd-rich pentlandites, as well as the ones reported in other works, do not correspond to the π-phase obtained in [29], tending to have much less Pd and more iron than nickel.
It should be noted that when estimating the palladium concentration in pentlandite, a few intrinsic problems may arise. LA-ICP MS studies have shown that Pt and Pd can be present in sulfide minerals not only in a dissolved form (structural), but also in the form of microinclusions [17,31,
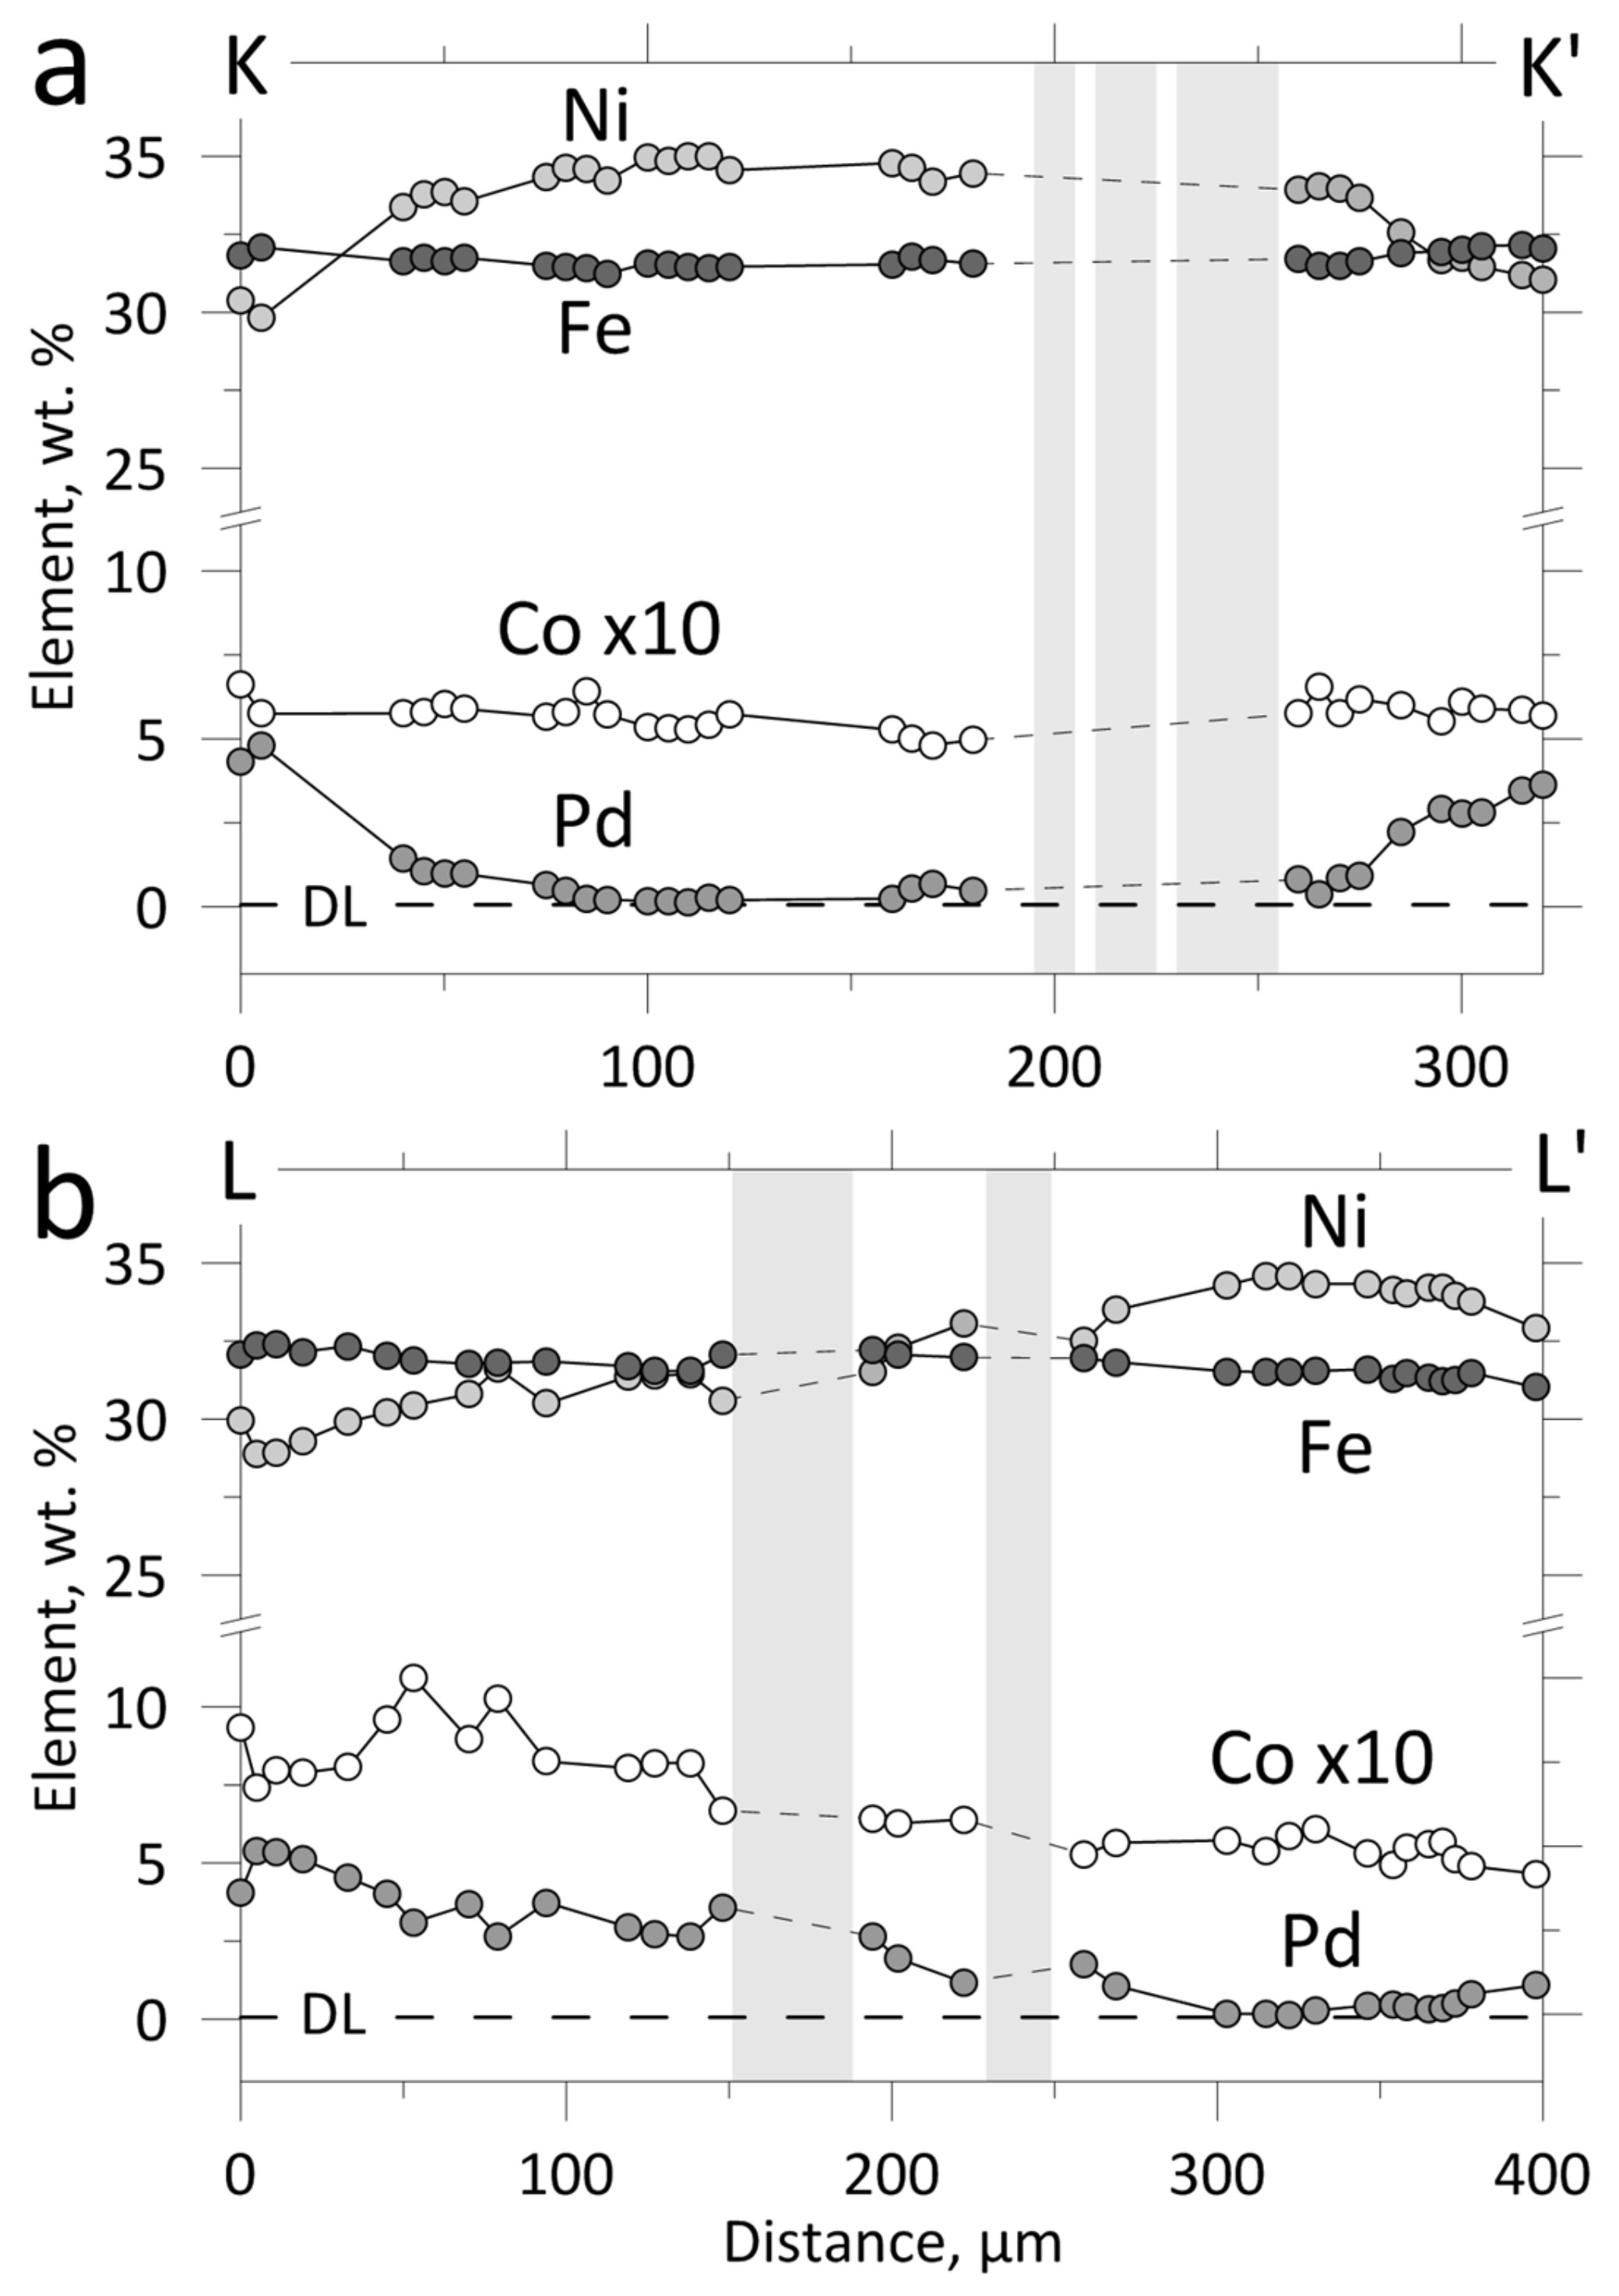
32]. This is especially important when assessing low PGE concentrations at the ppm level. The argument for the absence of the effect of microinclusions on the studied pentlandites from this study is that their composition is rather smooth with a regular change in Pd content along the microprobe profile (Figure 9a).
The significant amount of palladium in pentlandite raises the question as to what position occupies in its structure. The structure of pentlandite is pseudocubic close packing with cations (Fe,Ni), occupying octahedral and tetrahedral positions [33,34]. The ionic radiuses of Pd, Fe and Ni differ by less than 15% [35], and at the same time, palladium in pentlandite has a nominal oxidation state of +2, which theoretically makes it possible to replace Ni and/or Fe, in the structure of pentlandite, with Pd. Additionally, it has been established that palladium in pentlandite represents a homogeneous solid solution replacing Ni or Fe in the crystal lattice [17,19].
The composition of Pd-rich pentlandite from the Southern-2 ore body shows a strong correlation between Ni-Pd and Ni-Fe pairs, as well as between Fe-Pd (Table 6). The correlation of cobalt with all other components is insignificant (Table 6).
The correlation analysis involved 277 analyses of Pd-rich pentlandites containing less than 0.7 wt.% copper. Such a limitation on the copper content allows to partially or completely exclude the compositions of very small grains, the analysis of which may cause the detection of surrounding cubanite or chalcopyrite to occur. The data set included only compositions of pentlandite from the samples 32–11 and 31–11 (depths of 76.5 and 76.7 m, respectively).
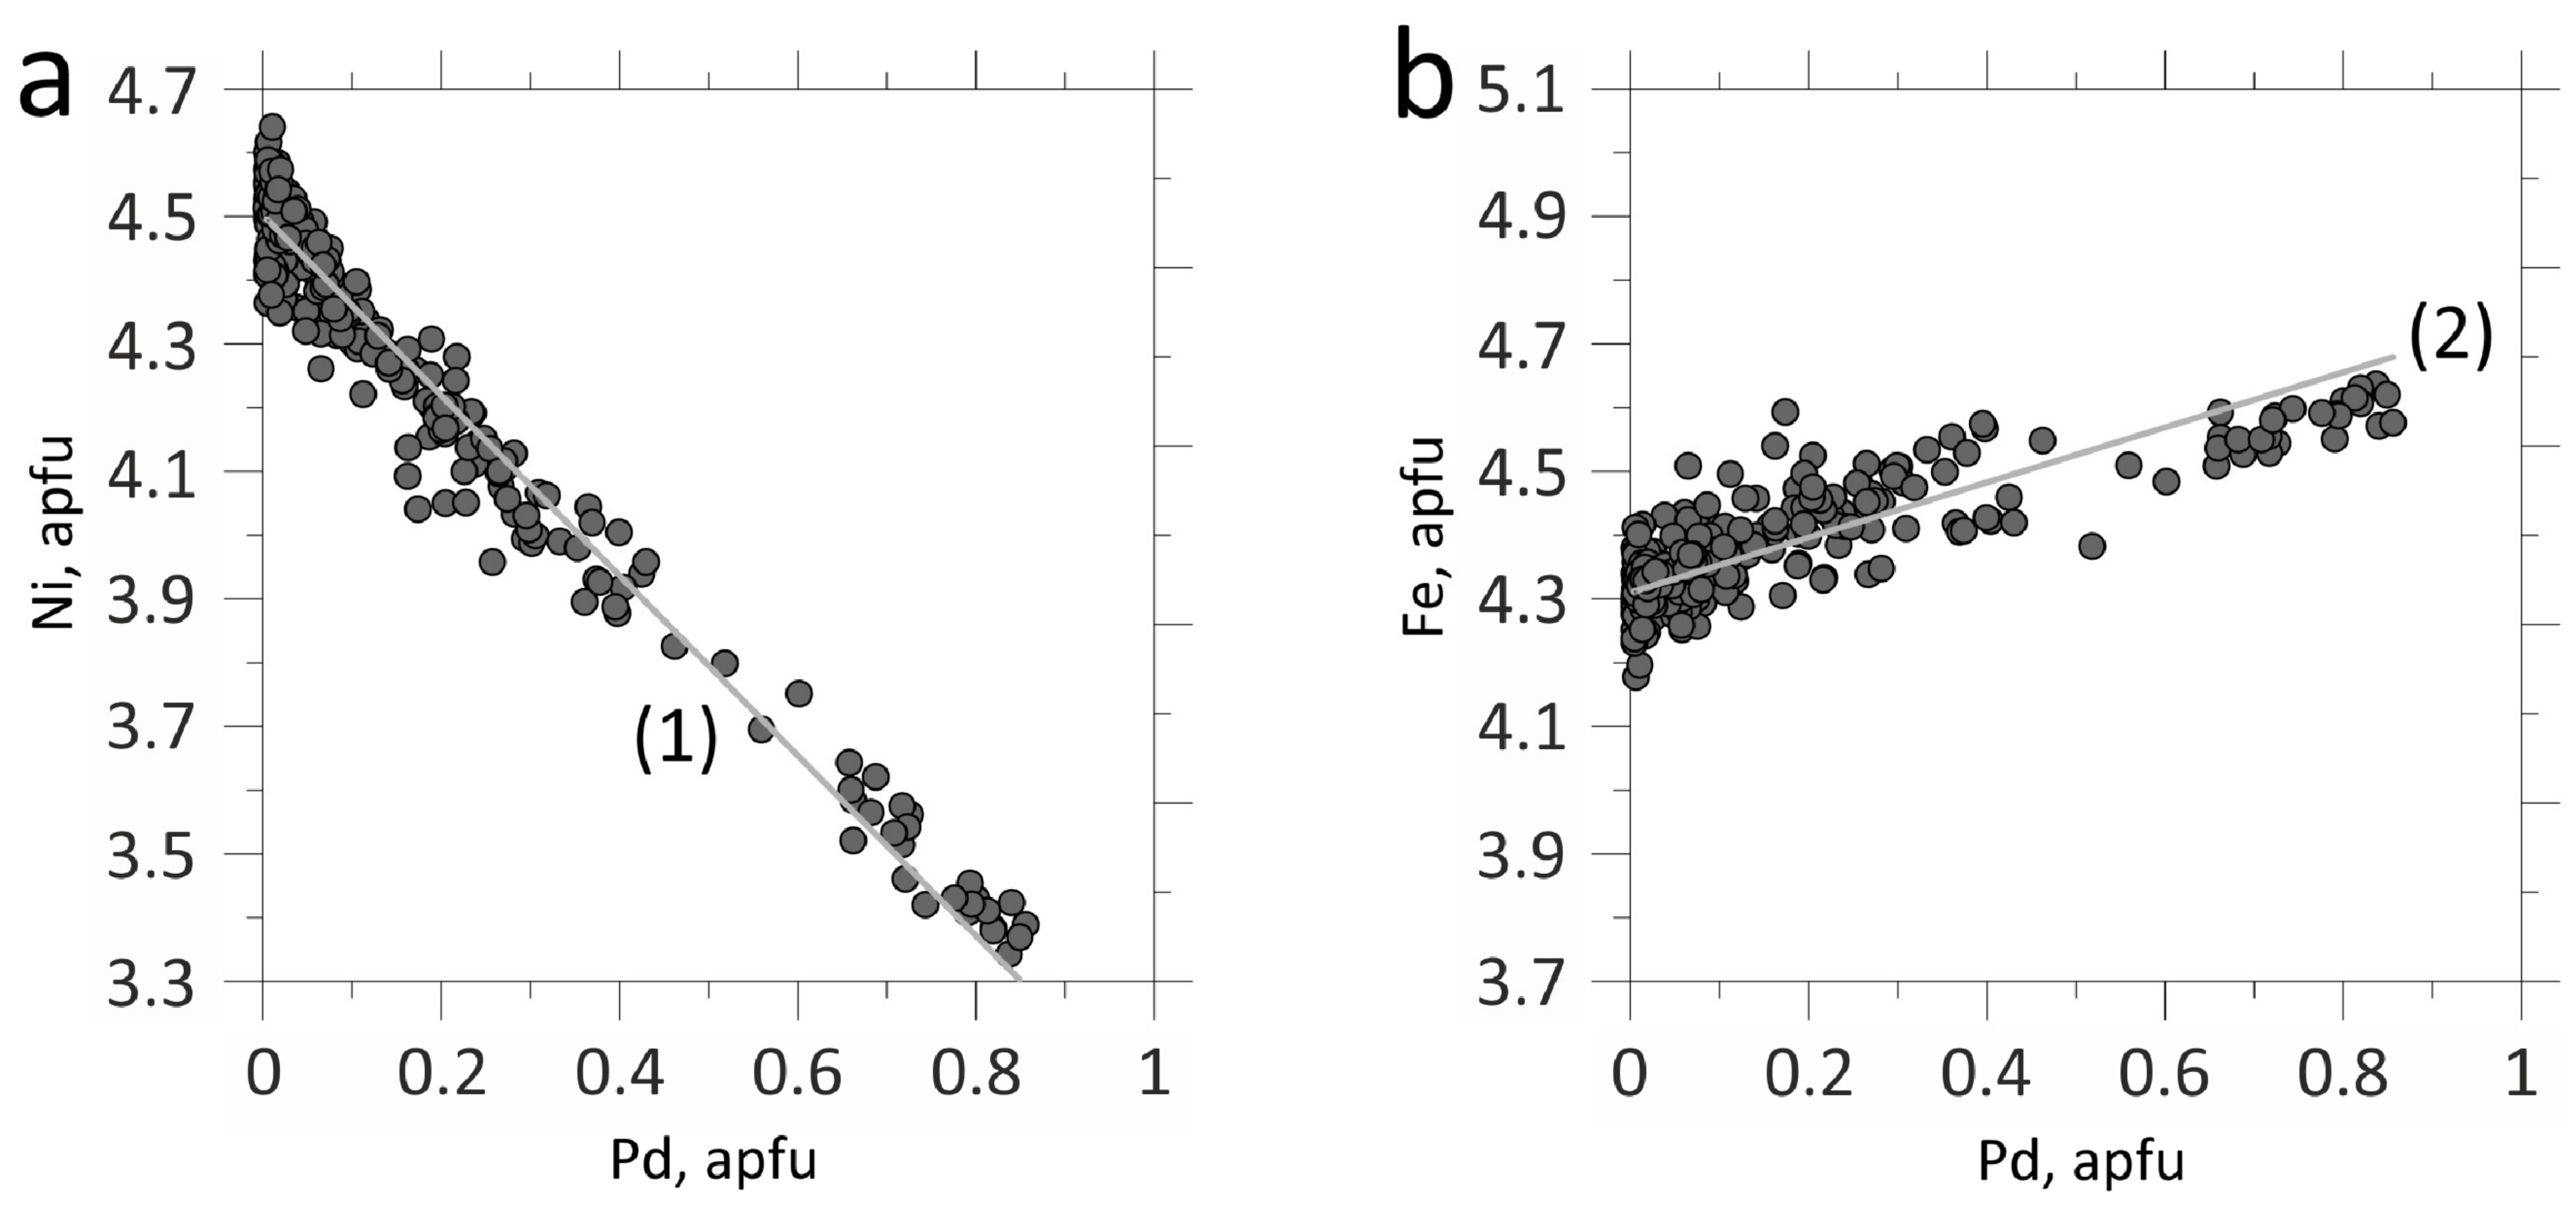
The strong negative correlation between Ni and Pd indicates that Pd replaces Ni in the crystal structure of pentlandite (Figure 11a). Positive correlation of Fe with Pd suggests that Pd does not substitute Fe. Moreover, a simultaneous increase in the content of Pd and Fe (Figure 11b) indicates either a more complex isomorphism than the simple substitution of palladium for nickel, or two different processes that affect the pentlandite composition.
The first led to the enrichment of pentlandite in Pd by isomorphic replacement of Ni with Pd, whereas the second led to a change in the Ni/Fe ratio in pentlandite by replacing part of the Ni with Fe.
In addition to the correlation analysis, a principal component analysis was performed for the data set of 277 Pd-rich pentlandites. This statistical method allows us to determine how many factors (principal components) affected the quantitative ratios of chemical elements in the pentlandite formula, as well as to assess the contribution of each factor. Each of these factors may be associated to some physicochemical process that affects the compositions of pentlandites in the data set. The main factor to be considered is the substitution of palladium for nickel, which provides the strong negative correlation of these components (Table 6). Another possible factor to be taken into account could be the detection of cubanite matrix during the analyses, which would lead to a positive correlation between Cu and Fe. Changes in sulfur fugacity can lead to modification of the Ni/Fe ratio in pentlandite [36]. These and other factors can act simultaneously but independently of each other and affect the final ratio of components (elements) in the pentlandite to variable degrees.
A covariance matrix was obtained as a result of the calculation. The respective eigen values of the covariance matrix are 0.1502, 0.002484, 0.001388, 0.000408, 0.00027, 0. The contribution of the first principal component is 97%. The impact of the other five factors is too small to have had noticeable effects on the composition of pentlandite. Therefore, they can be disregarded. The existence of a single significant principal component suggests that all isomorphic substitutions in pentlandites from the data set occurred within that particular process and are dependent on each other.
Ni, Fe and Pd are the main elements for isomorphic substitutions leading to the formation of Pd-rich pentlandite; hence, it was necessary to find a dependence in relation to these components.
By applying Deming regression, the possible error in the determination of both components was taken into account, which is necessary for assessing the relationship between the components in Ni-Pd and Fe-Pd pairs. The following equations were obtained:
XNi = −1.41 (±0.03) × XPd + 4.502 (±0.009)
XFe = 0.43 (±0.03) × XPd + 4.310 (±0.008)
where XNi, XPd and XFe are contents of the elements in apfu.
Equation (1) shows that the appearance of one atom of Pd in pentlandite formula leads to a decrease for nickel by 1.41 atoms. In other words, 0.71 of a palladium atom appears when one atom of nickel disappears. Equation (2) assumes that the addition of one atom of Pd is accompanied by the appearance of 0.43 atoms of Fe. That is, the addition of 0.71 of Pd atom leads to an increase in the number of iron atoms by 0.30. Thus, one atom of nickel is replaced by 0.71 atoms of Pd and 0.30 atoms of Fe, for a total of 1.01 (±0.05).
The increase in the Fe content upon enrichment of pentlandite with palladium raises some other questions. The Ni/ Fe ratio in pentlandite depends on the bulk composition of the sulfide liquid and the primary solid solution from which the pentlandite exsolved. This is in good agreement with the regular change in the content of nickel and iron in ore-forming pentlandite along the section of the ore body (Table 2 and Figure 5). The gradual changes in pentlandite composition can be explained by a gradual change in the composition of the sulfide liquid and solid phase during fractional crystallization.
Additionally, experimental data have shown that an increase in sulfur fugacity leads to an increase in the Ni/Fe ratio in pentlandite [36,37,38,39]. Thus, sulfur fugacity is also an important factor controlling the Ni/Fe ratio.
The selected data include 277 analyses of Pd-rich pentlandites from two samples of cubanite ores that are very close in terms of position in the section of the ore body (76.5 and 76.7 m) as well as in composition. Ore-forming pentlandites in these samples are very similar in iron and nickel content as well (Table 2 and Figure 5). Assuming that the role of palladium is completely equivalent to the role of nickel in the pentlandite structure (Ni* = Ni + Pd), the Ni*/Fe ratio in the Pd-rich pentlandites should be the same with Ni/Fe ratio in the ore-forming pentlandites. However, Ni*/Fe ratios turned out to be lower due to the replacement of nickel in Pd-rich pentlandite not only with palladium, but also with additional iron. Since the bulk composition of the ore, as well as the composition of chalcopyrite and cubanite hosts for the pentlandite grains, is the same, the change in the Ni*/Fe ratio in pentlandite may indicate that the physicochemical conditions have changed. This suggests that the crystallization of ore-forming pentlandite occurred under higher sulfur fugacity, giving as a result a higher Ni/Fe ratio. However, its transformation into Pd-rich pentlandite seems to have occurred at a lower sulfur fugacity, which caused a decrease in the Ni/Fe ratio due to the replacement of part of the nickel with iron. A different sulfur fugacity was assumed for the formation of several generations of pentlandite grains in the clinopyroxenite of the Platreef in the Bushveld Complex [32]. However, in the ores here studied, there is only one generation of pentlandite, which underwent partial isomorphic replacement in the rim of the grains.
Another possible explanation for these variations denotes that if the Pd atom is not equivalent to the nickel in the pentlandite structure, then Pd-rich pentlandite and ore-forming pentlandite can be considered as different mineral phases. In this case, different (Ni + Pd)/Fe and Ni/Fe ratios in these phases can exist under the same conditions.
Accordingly, Pd isomorphically replaces only nickel in Pd-rich pentlandites of the Southern-2 ore body. The isomorphic substitution occurs as follows: XNi = 0.71 × XPd + 0.30 × XFe, where XNi, XPd and XFe are the contents of the elements in apfu. The isomorphic replacement of nickel with iron occurring simultaneously with the enrichment of pentlandite with palladium thus may indicate that the formation of ore-forming pentlandite and its replacement by Pd-rich pentlandite occurred under various physicochemical conditions and, perhaps, at different times.

5.2. Genetic Constraints and Mechanisms for the Enrichment of Pd in Pentlandite

Pentlandite is the only palladium concentrator among the base metal sulfide minerals of the nickel-copper ores, since palladium is a compatible element with pentlandite while incompatible to coexisting pyrrhotite, chalcopyrite and cubanite [1,2,3,4,5,6,7,8,9,10,11,12]. Pentlandite is considered a late-forming mineral, within the base metal sulfides assemblage, that may be formed as a result of exsolution of MSS and ISS. Exsolution of MSS leads to the crystallization of more stable phases, at lower temperatures, like pyrrhotite, chalcopyrite and pentlandite, causing a redistribution of the majority of the palladium into pentlandite. However, this mechanism may not be enough to result in high concentrations of palladium in pentlandite since the overall concentration of Pd in MSS is relatively low. It has been established sufficiently that MSS is the first solid phase to crystallize from a sulfide liquid and that Pd is incompatible with it. For instance, the partition coefficient of Pd between MSS and liquid is 0.08–0.27 [40,41]. Therefore, Pd tends to accumulate in the residual sulfide liquid, and only one sixth of Pd actually dissolves into MSS. Consequently, pentlandite formed during exsolution of MSS may not yield more than 10 ppm of palladium. Crystallization of ISS begins right after the solidification of MSS and continues until consuming all the sulfide liquid. Exsolution of ISS not only leads to the formation of chalcopyrite and cubanite but also pentlandite, redistributing most of the palladium into pentlandite as with MSS. Considering that palladium is incompatible with ISS as in MSS, it then continues to accumulate in the remaining sulfide liquid. Hence, the amount of palladium dissolved in early ISS is also very low as in MSS. An important increment in the content of Pd could be expected only in the late ISS, which crystallizes from the very last portions of the sulfide liquid and may concentrate significant amounts of palladium.
In this study, we present 23 cases of reported Pd concentrations in pentlandite from different deposits and one experiment (Table 7). Most authors, however, did not indicate the primary sulfide phase, MSS or ISS, from which Pd-pentlandite formed. Thus, we assumed a primary solid solution in each case based on the mineral association presented in the papers. Only three cases out of twenty-three, including our study, concern pentlandite formed during exsolution of ISS, whereas sixteen out of twenty-three studies introduce occurrences of crystallization of pentlandite from MSS (Table 7). Four papers report concentrations of palladium in pentlandite lower than 10 ppm. (Table 7). These are pentlandites from the Jinchuan deposits [3], Kambalda [14], Aguablanca [42] and Creighton Mine in Sudbury [15]. Such low concentrations are most likely the result of Pd partitioning under exsolution of MSS. Regarding the mechanism of Pd enrichment, some authors have suggested additional diffusion of Pd from contiguous ISS [42]. However, these limited concentrations are considered normal within magmatic sulfide deposits as a result of processes that are well known. Higher concentrations of Pd, especially those reaching weight percentage levels, are rather atypical and are required to be further studied. In principle, such accumulations of Pd in pentlandite could not be regarded as the result of exsolution and redistribution of palladium among base metal sulfides from MSS nor early ISS. Therefore, authors encountering such enrichments were compelled to look for other sources of palladium and other mechanisms for enriching pentlandite with it.
Holwell and McDonald reported 70–200 ppm Pd in pentlandite from the Platreef in Bushveld, which they explained by means of a high Pd/semimetal ratio in the ores [16]. They suggested that Pd binds preferentially to Bi and Te, which can lead to separation of an immiscible bismuth-telluride liquid at the latest stages of crystallization. Excess of Pd binds to sulfur and enters first into MSS and then into pentlandite [16]. Godel and Barnes reported 0.2–6700 ppm of Pd in pentlandite from the J-M Reef in Stillwater. The authors assumed the transfer of Pd from outside by a fluid [9]. On the other hand, Li and Ripley discovered pentlandite containing up to 9.8 wt.% Pd intergrown with altered Pt-Pd sulfide in the J-M Reef of Stillwater [20]. A source of palladium from Pt-Pd sulfide, which was destroyed and replaced by Pt-Fe alloy, was suggested this time [20].
Mansur and coauthors published pentlandite with 0.005–0.1 wt.% of Pd from the Norilsk-1 deposit and 0.08–242 ppm at the Merensky reef in Bushveld [43]. Pentlandite layers between pyrrhotite (former MSS) and chalcopyrite (former ISS) were studied. The authors proposed that Pd-rich pentlandite formed by a peritectic reaction of MSS + Liquid = PnSS, where PnSS is a high-temperature solid solution from which pentlandite is obtained upon cooling [43,45]. In addition, Brovchenko and coauthors found 0.04–4.62 wt.% Pd in pentlandite from Norilsk-1 deposit and similarly came up with a peritectic reaction as plausible explanation for this atypical pentlandites [12]. Accordingly, there are four main hypotheses, which have been proposed to explain the high concentrations of palladium in pentlandite. These include (1) high Pd/semimetals ratio in sulfide liquid, (2) transfer of Pd into pentlandite by a fluid from outside, (3) destruction and element redistribution of Pd-bearing PGM and (4) a peritectic reaction of MSS + Liquid = PnSS. Nonetheless, most of them are not appropriate in explaining the high concentrations of Pd in pentlandites of the Southern-2 ore body.
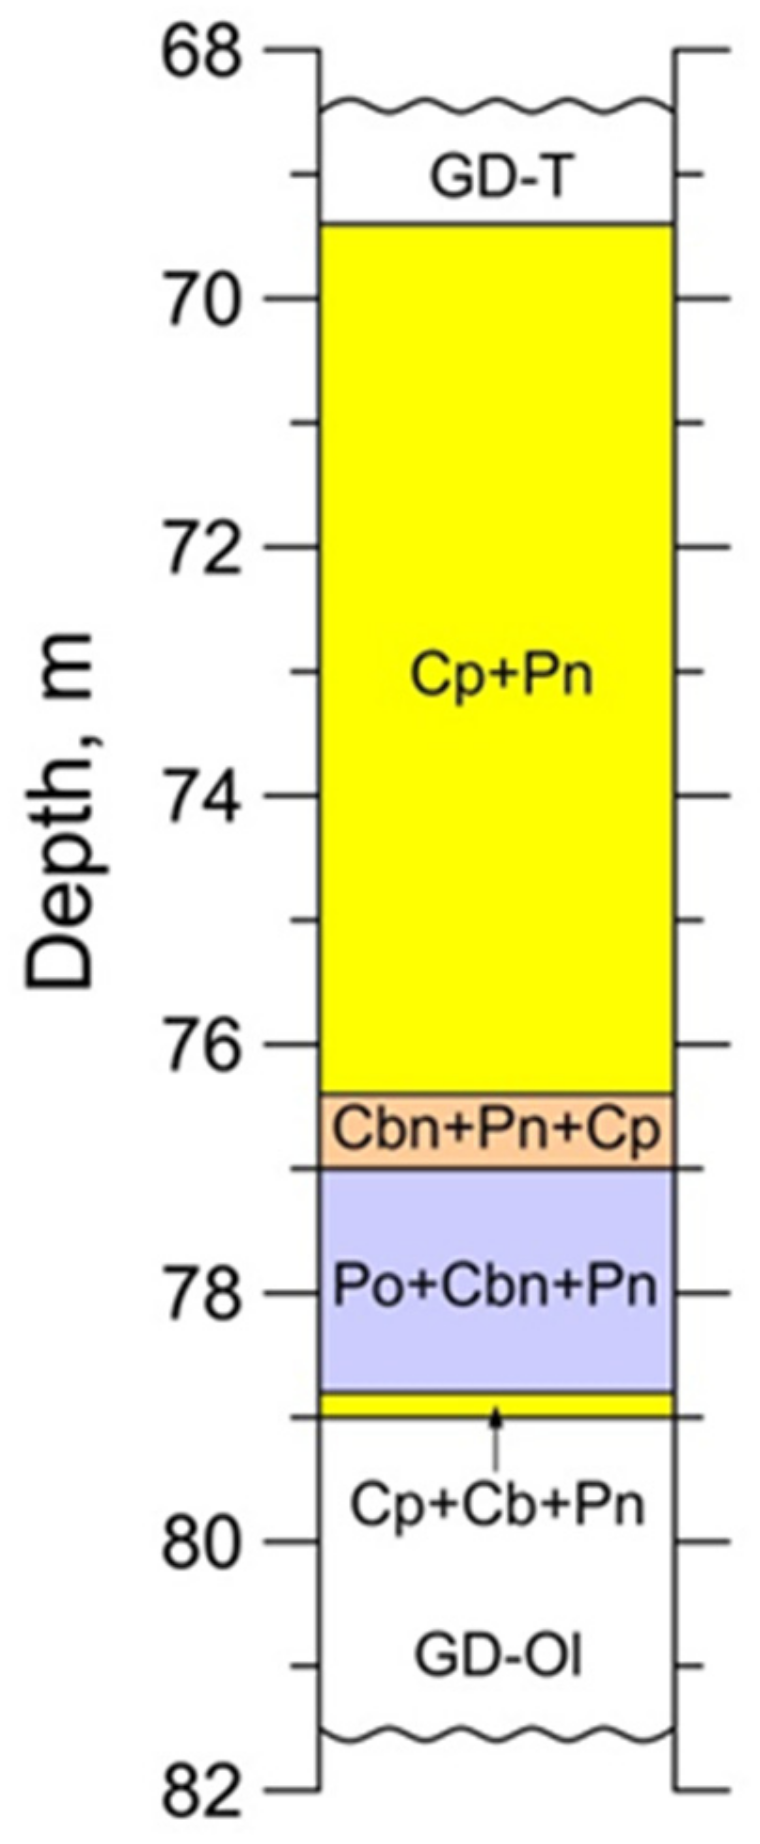
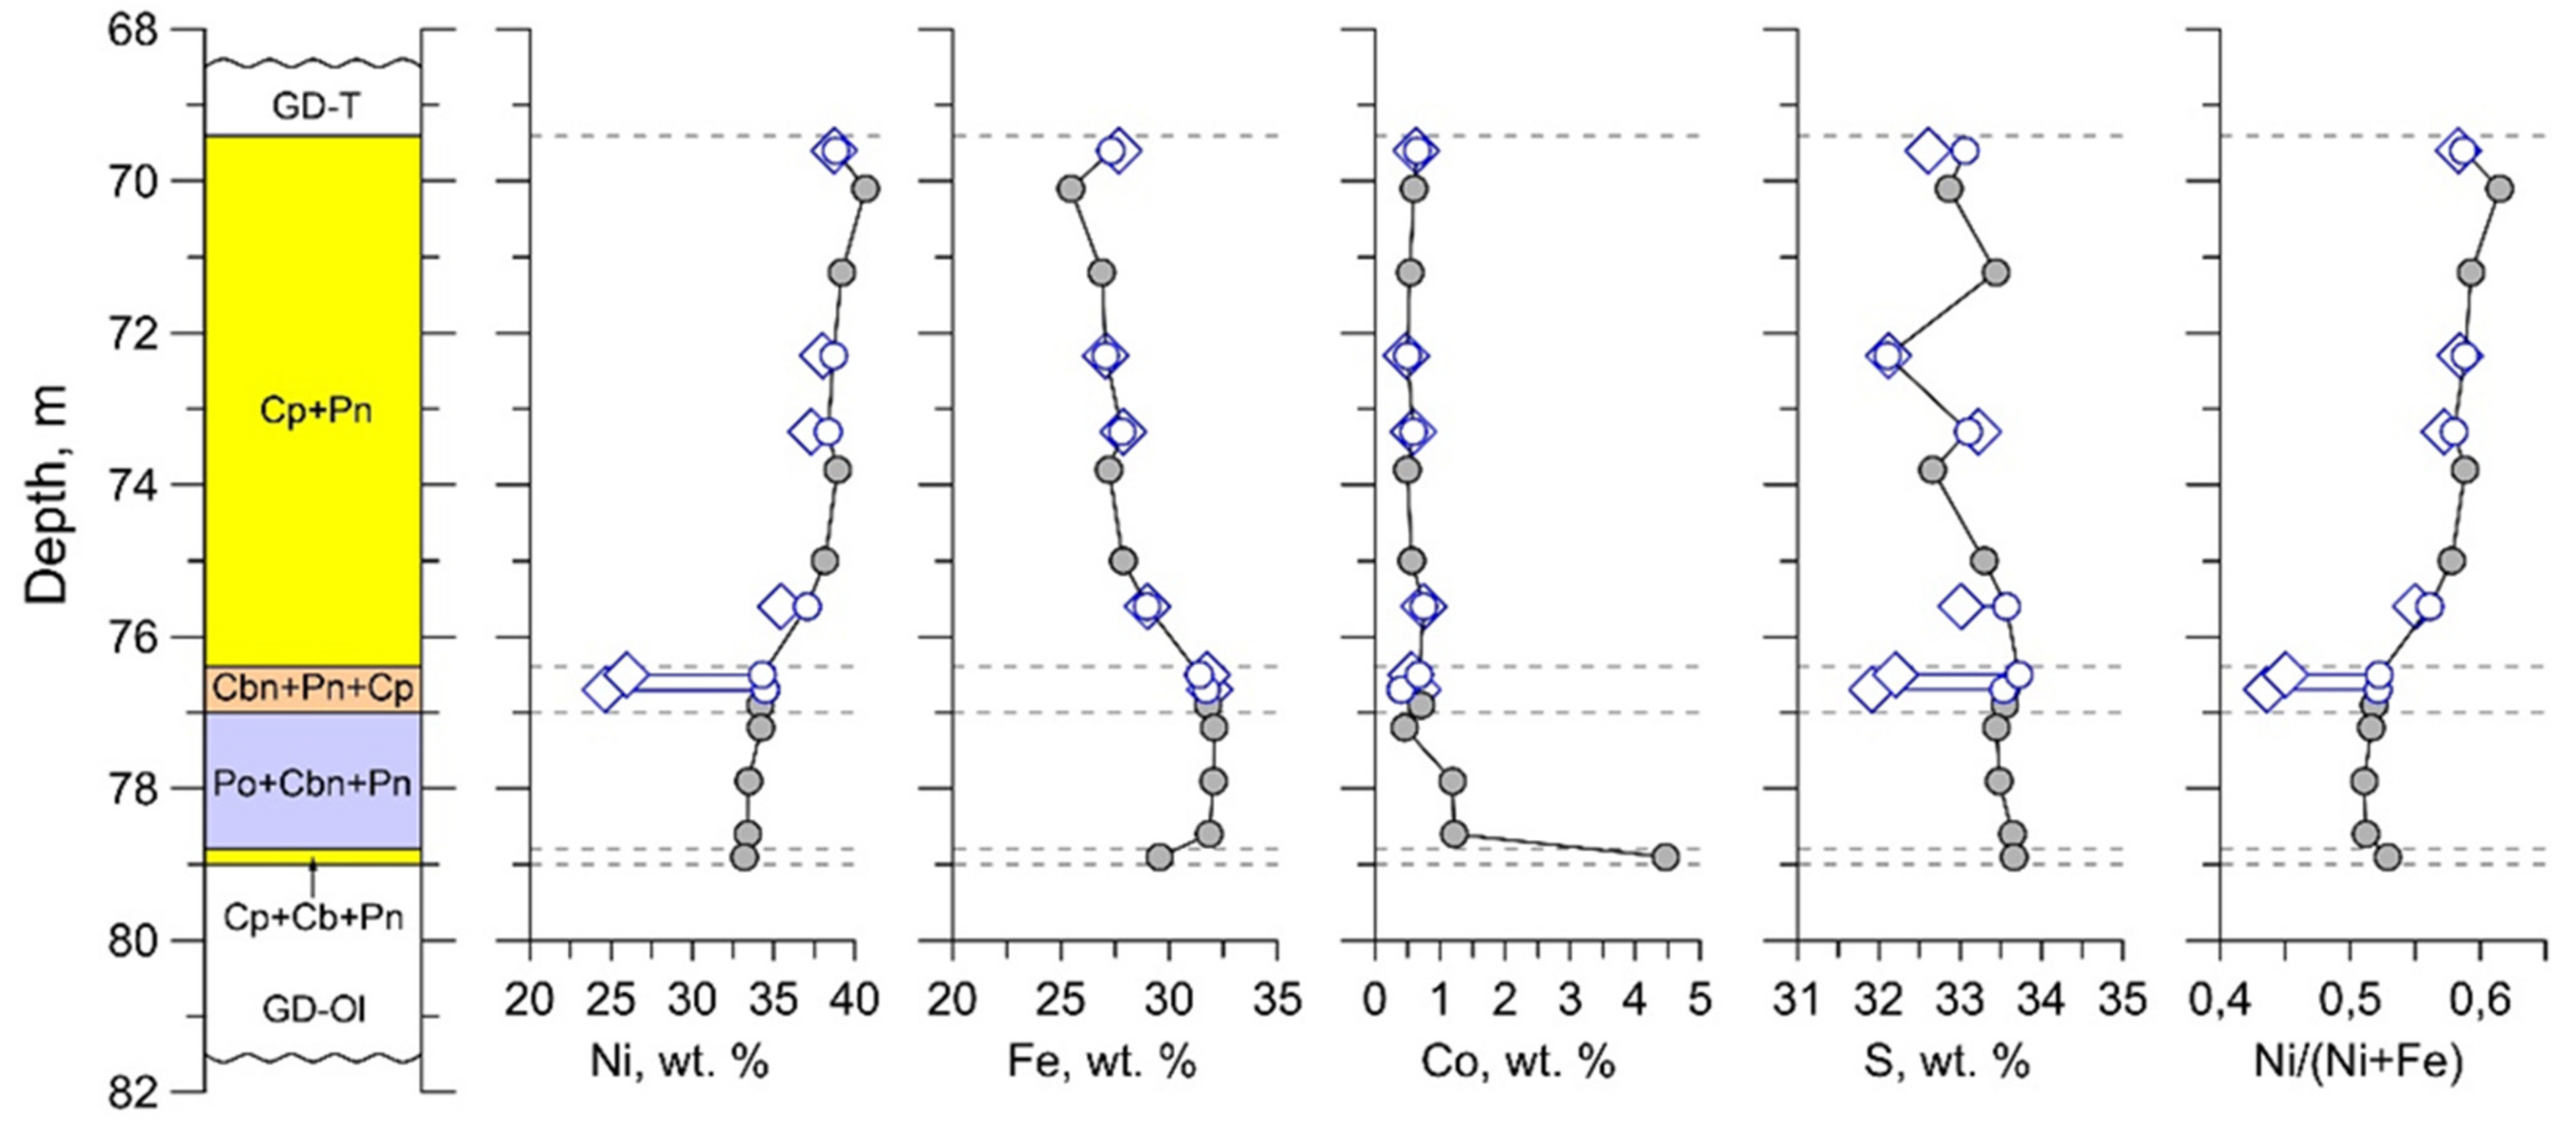
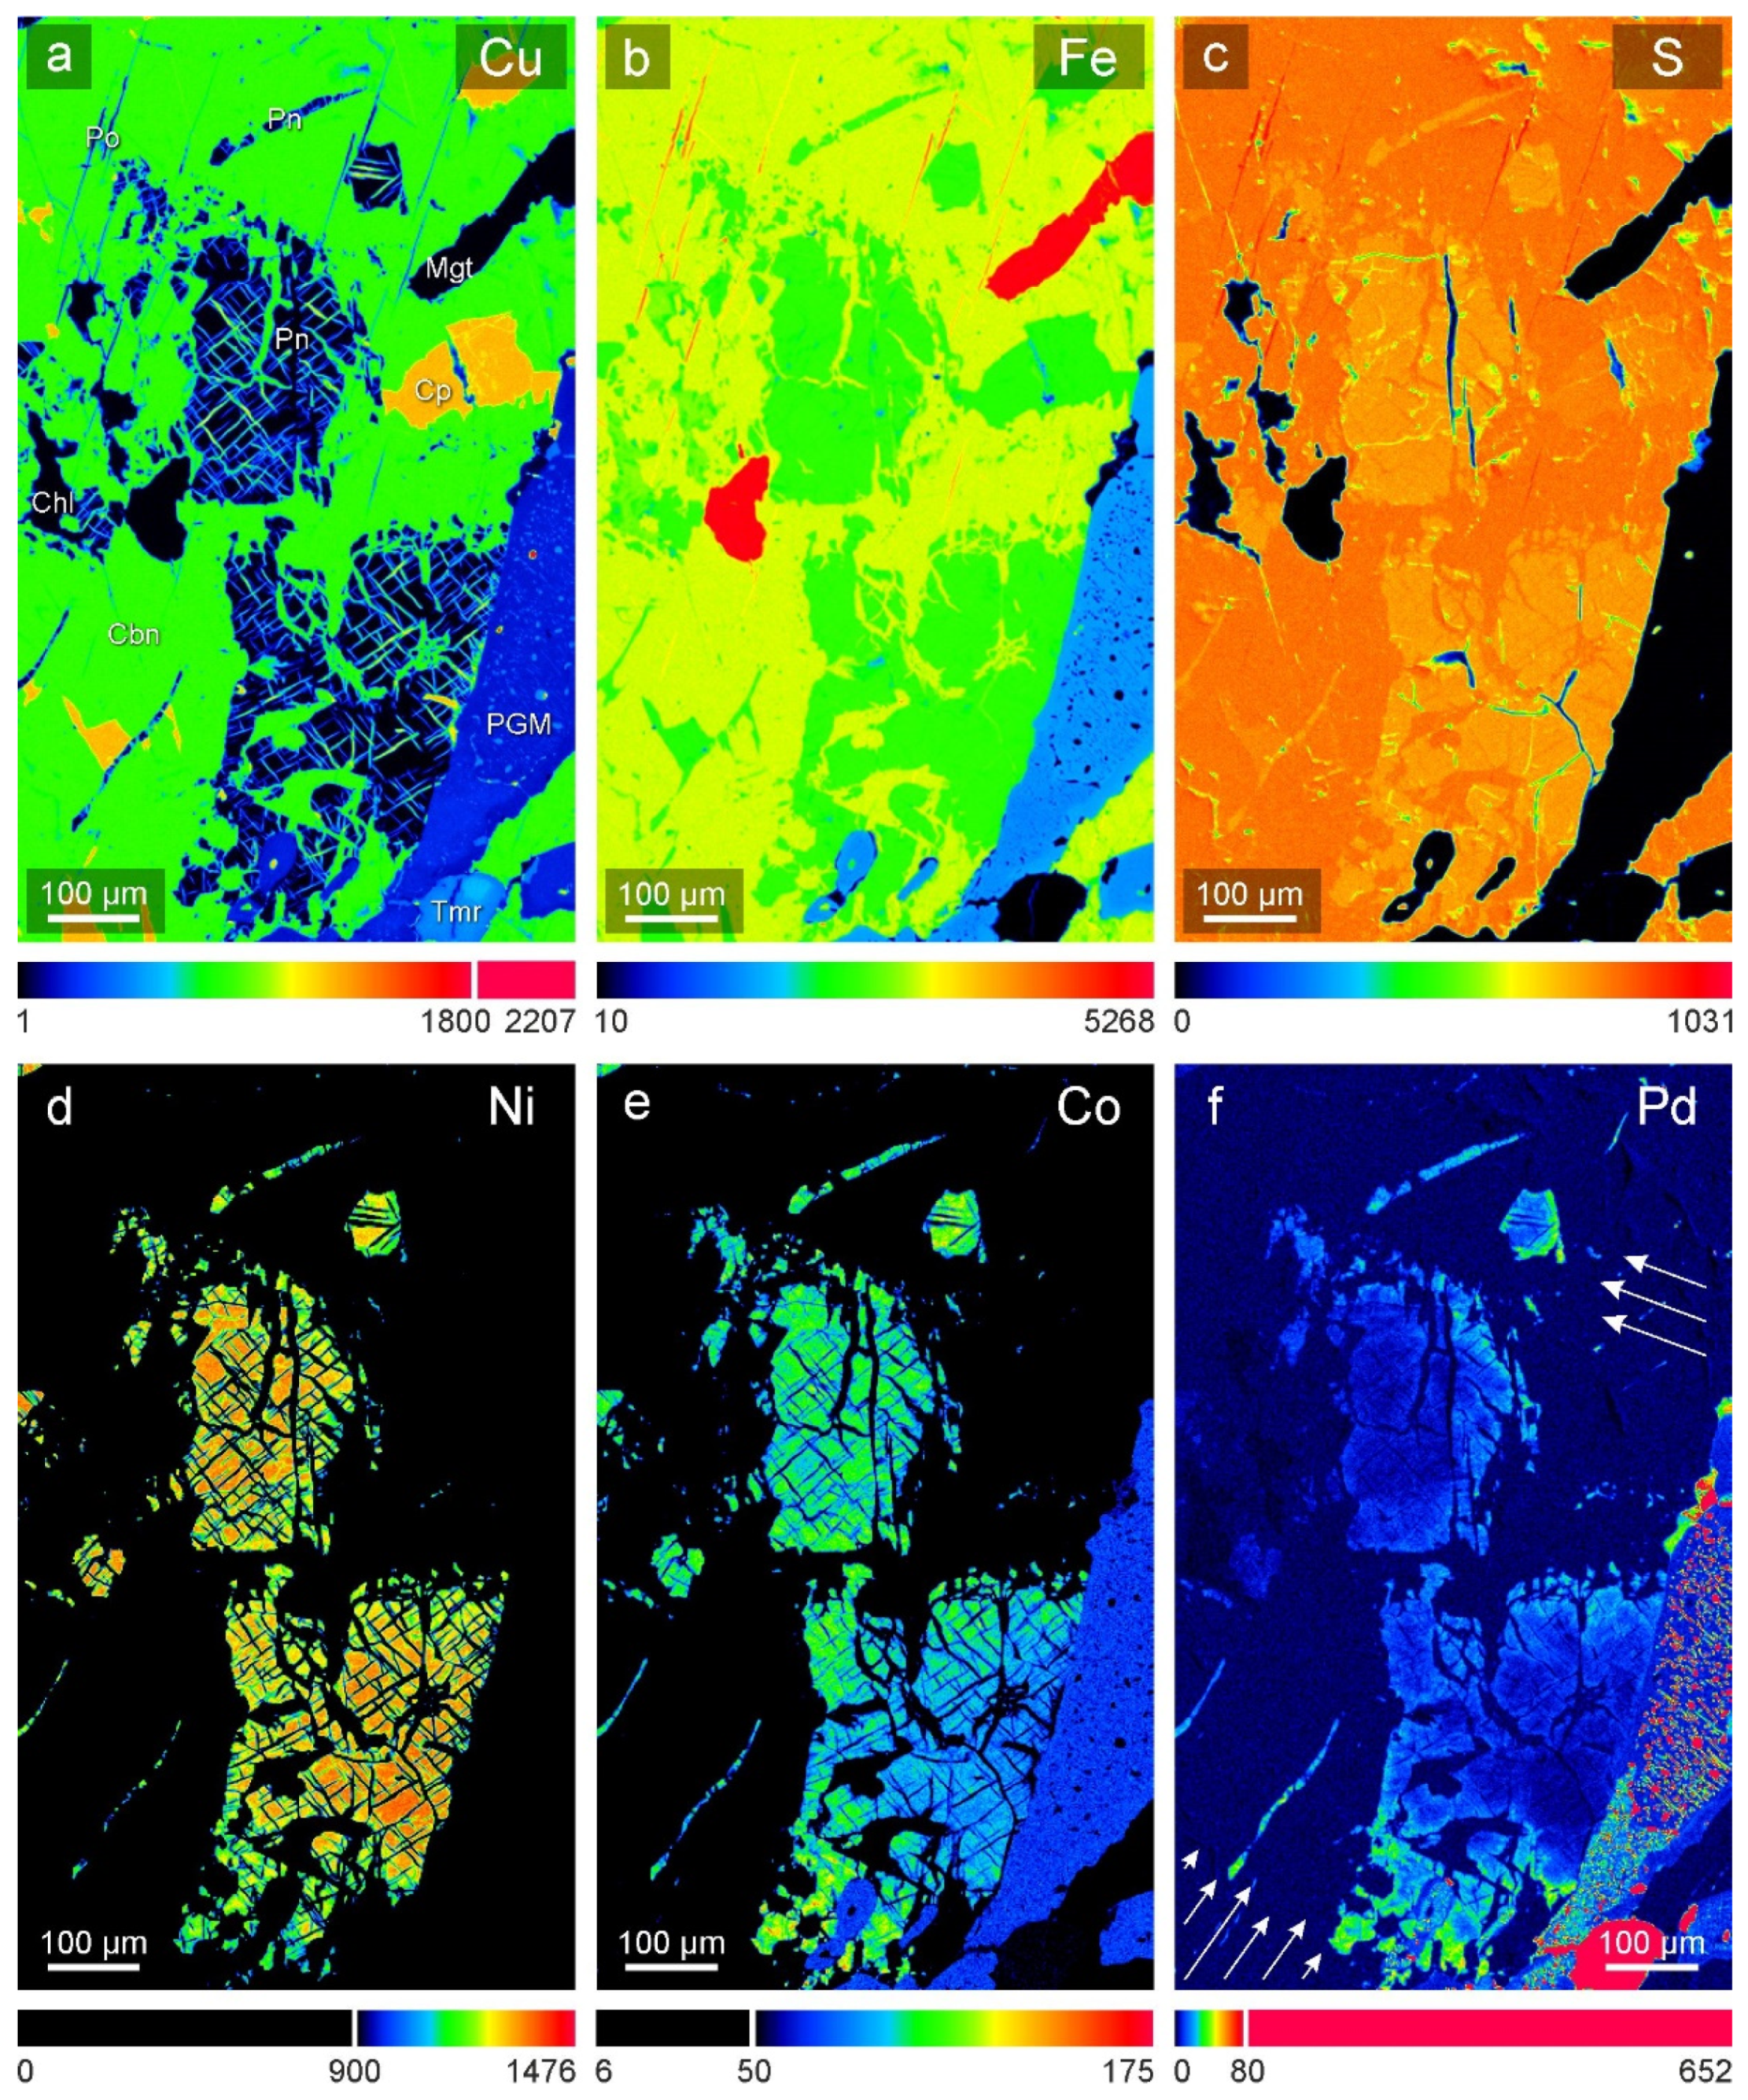
The examined section of the ore body, in this study, exhibits a layered structure (Figure 2), where the pyrrhotite layer is the result of crystallization and subsolidus transformation of MSS, and the cubanite and chalcopyrite layers are the product of crystallization and subsolidus transformation of ISS. The boundary between the pyrrhotite and cubanite layers is a potential place for the peritectic reaction MSS + Liquid = ISS to occur. A reaction of this type has been repeatedly reproduced in experiments with different initial compositions of the sulfide liquid [46,47,48,49]. If Pd-rich pentlandite forms as a result of another peritectic reaction MSS + Liquid = PnSS like the one proposed by Mansur et al. [43], then we should expect to see such a layer of PnSS immediately above the pyrrhotite layer. However, there is no accumulation of pentlandite grains at or near the contact between pyrrhotite and cubanite ores. Furthermore, Pd-rich pentlandite in this study was found at different levels of the cubanite and chalcopyrite layers and, in particular, very far from the top of the pyrrhotite layer (Figure 5). In addition, high concentrations of palladium occur in the pentlandite lamellae within cubanite (
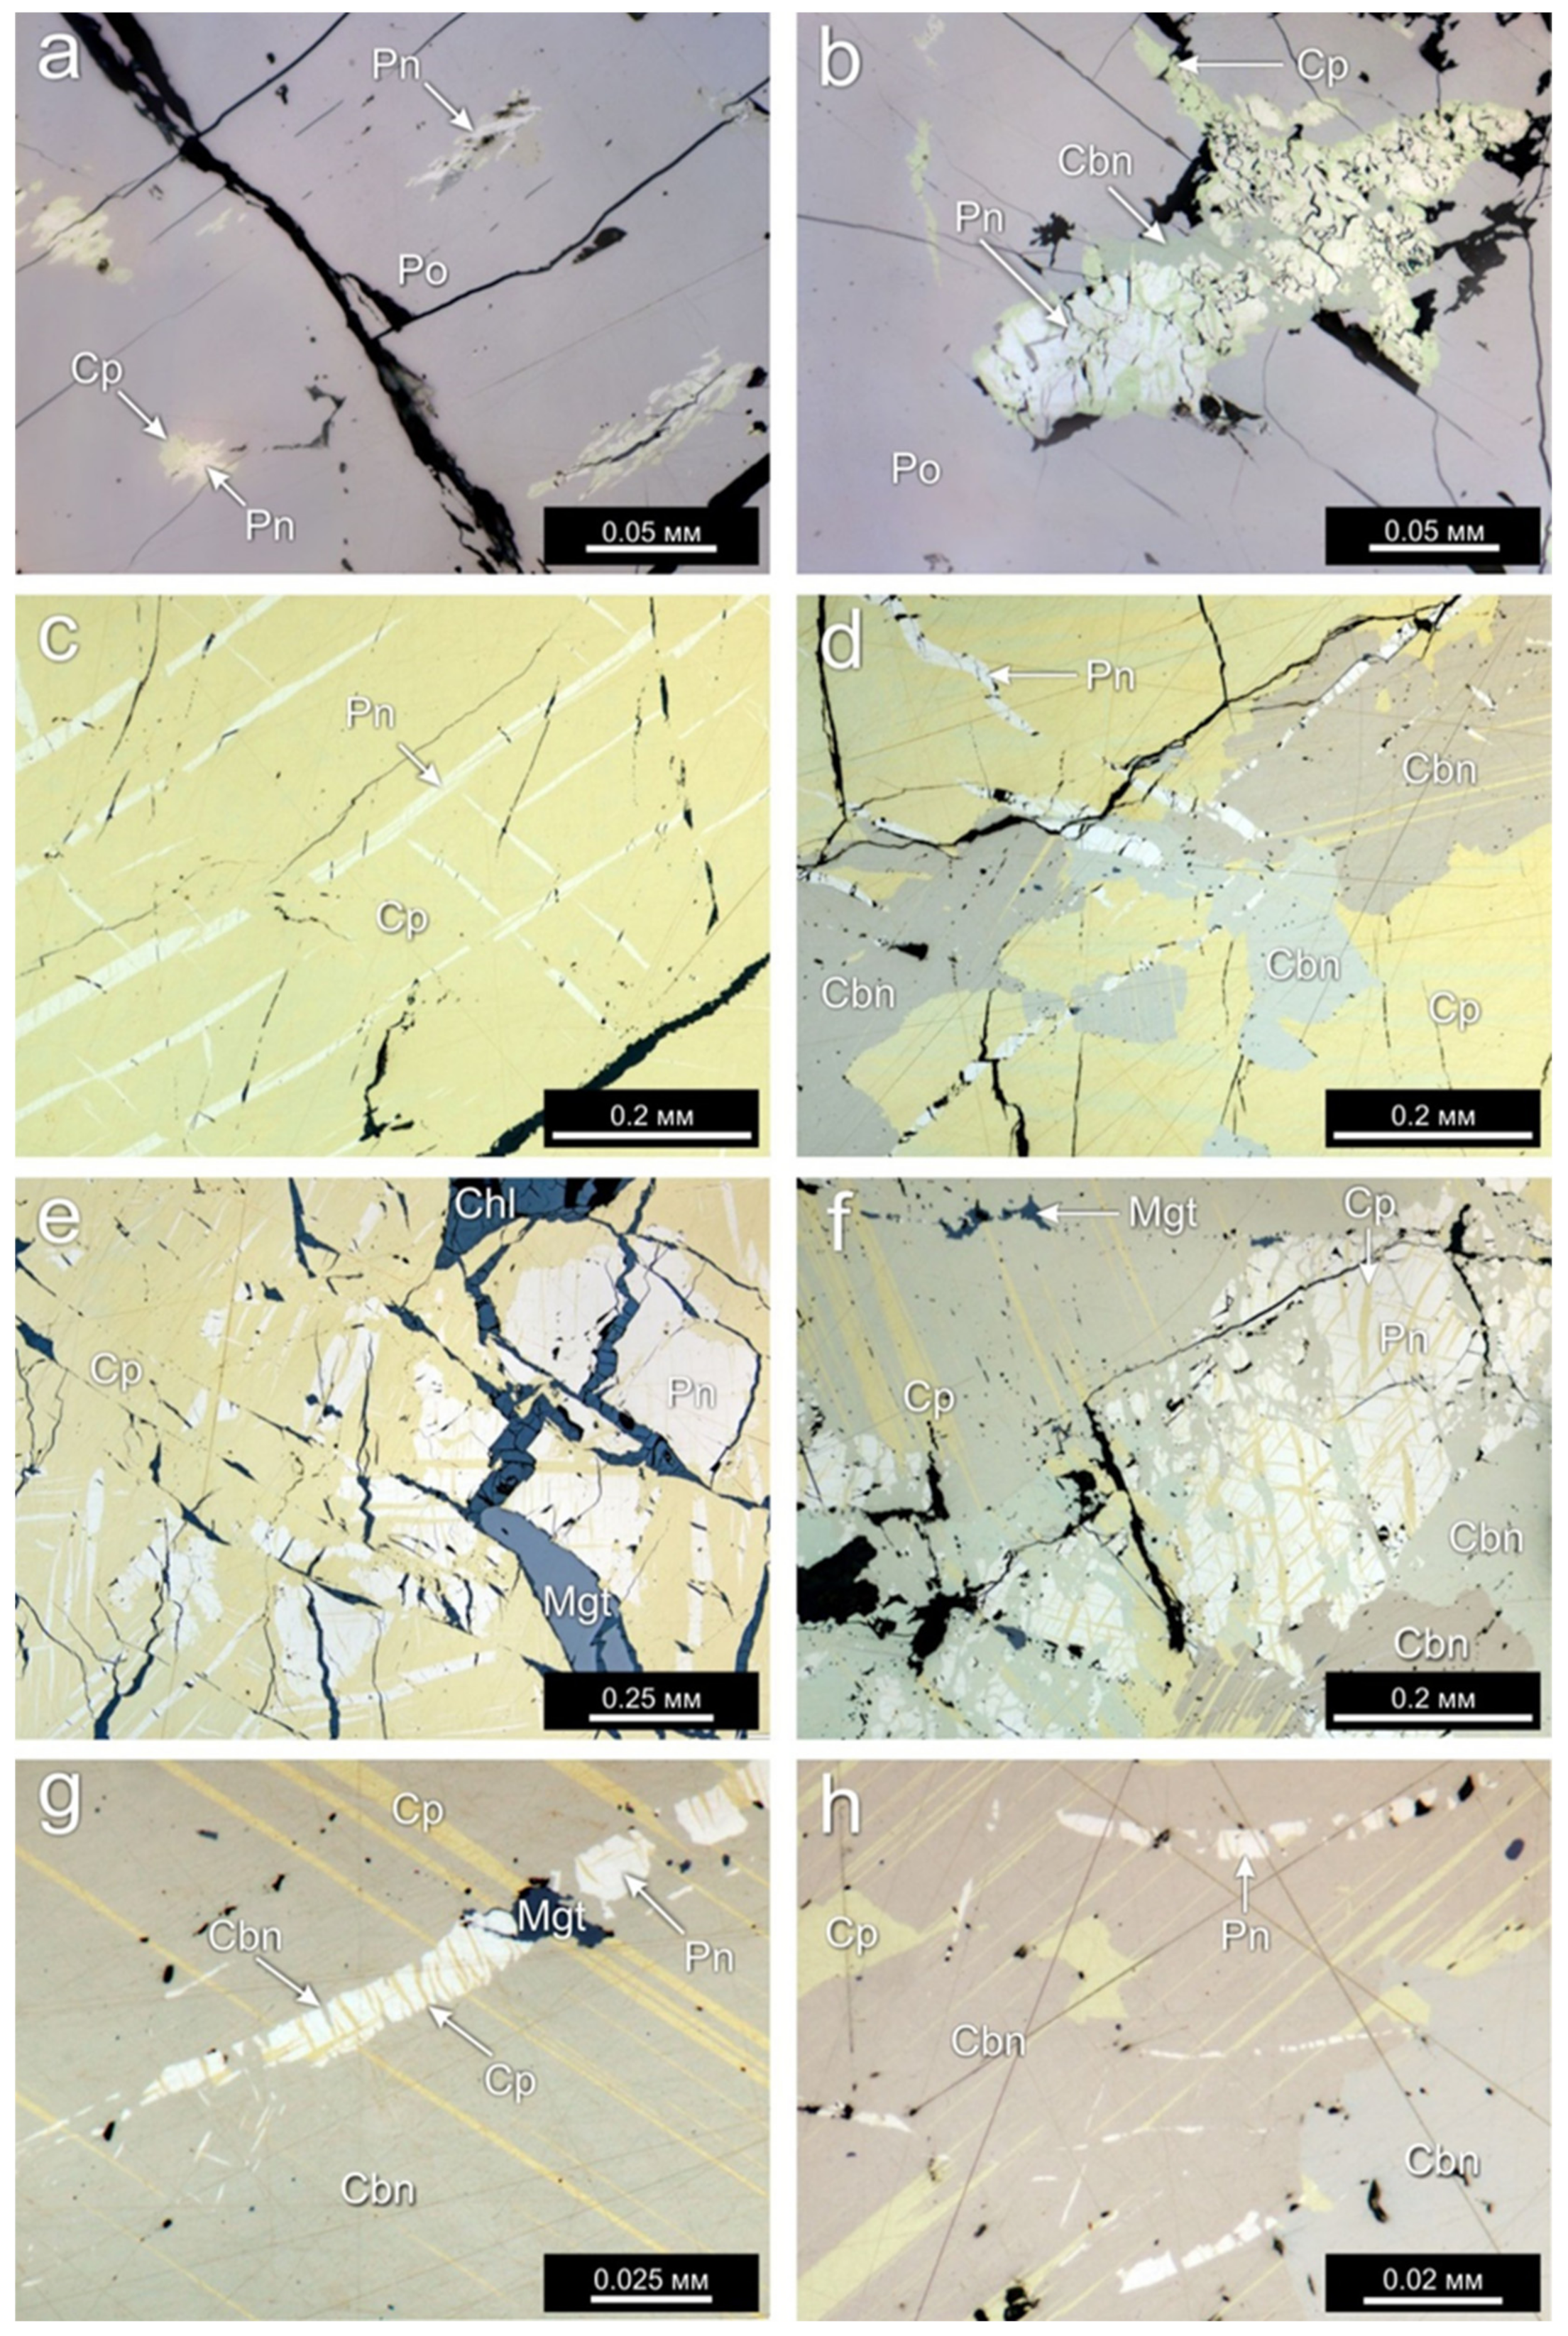
Figure 8f), which completely excludes the formation of such pentlandite as a result of the peritectic reaction as described before.
The hypothesis of imbalance between Pd and semimetals [16] assumes that Pt and Pd are more likely to form complex compounds with semimetals such as Te, Bi, Sb and As, than with S [50,51,52,53]. This would lead to the appearance of PGE-bismuthotellurides at the latest stages of the sulfide liquid crystallization [54,55,56] or separation of an immiscible liquid consisting of PGE and semimetals [51,52]. Therefore, the excess of palladium will bond with sulfur and thus can enter MSS and ISS, and finally into pentlandite, as a result of the exsolution of those primary solid solutions. If there was to be an excess of palladium atoms associated with sulfur during the crystallization of the Southern-2 ore body, then it should have been dissolved in MSS and ISS and then it would enter into the ore-forming pentlandite. The occurrence of Pd-rich pentlandites together with ore-forming pentlandites in this case is inexplicable.
The source of palladium is one of the main problems in elucidating the origin of Pd-rich pentlandite. Li and Ripley found Pd-rich pentlandites in the J-M Reef at the Stillwater complex and suggested that they are the result of decomposition of Pt-Pd sulfides as a result of interaction with an S-undersaturated hydrothermal fluid, forming Pt-Fe alloys and releasing of Pd [20]. The spatial relationship between Pd-rich pentlandites and PGE-bismuthotellurides has also been noted for other deposits [16,17]. Four out of the six studied areas containing Pd-rich pentlandite in the Southern-2 ore body are situated in the vicinity of large multiphase PGM grains, as shown in Figure 6. The other two areas have no evident spatial relationship with any PGM. This means that, even though PGMs are absent nearby some occurrences of Pd-rich pentlandites, on the investigated polished surface, we cannot assure there is no PGM above or below these Pn grains. Therefore, it can be assumed that some PGMs could be a source of palladium for the studied Pd-rich pentlandites. The large multiphase PGM grains, as in our case, are thought to be formed because of crystallization of an immiscible PGE-semimetal liquid. The separation of a PGE-telluride liquid at the latest stages of sulfide liquid crystallization has been confirmed experimentally [52]. In natural ores, this immiscible liquid can be of a more complex composition [16,
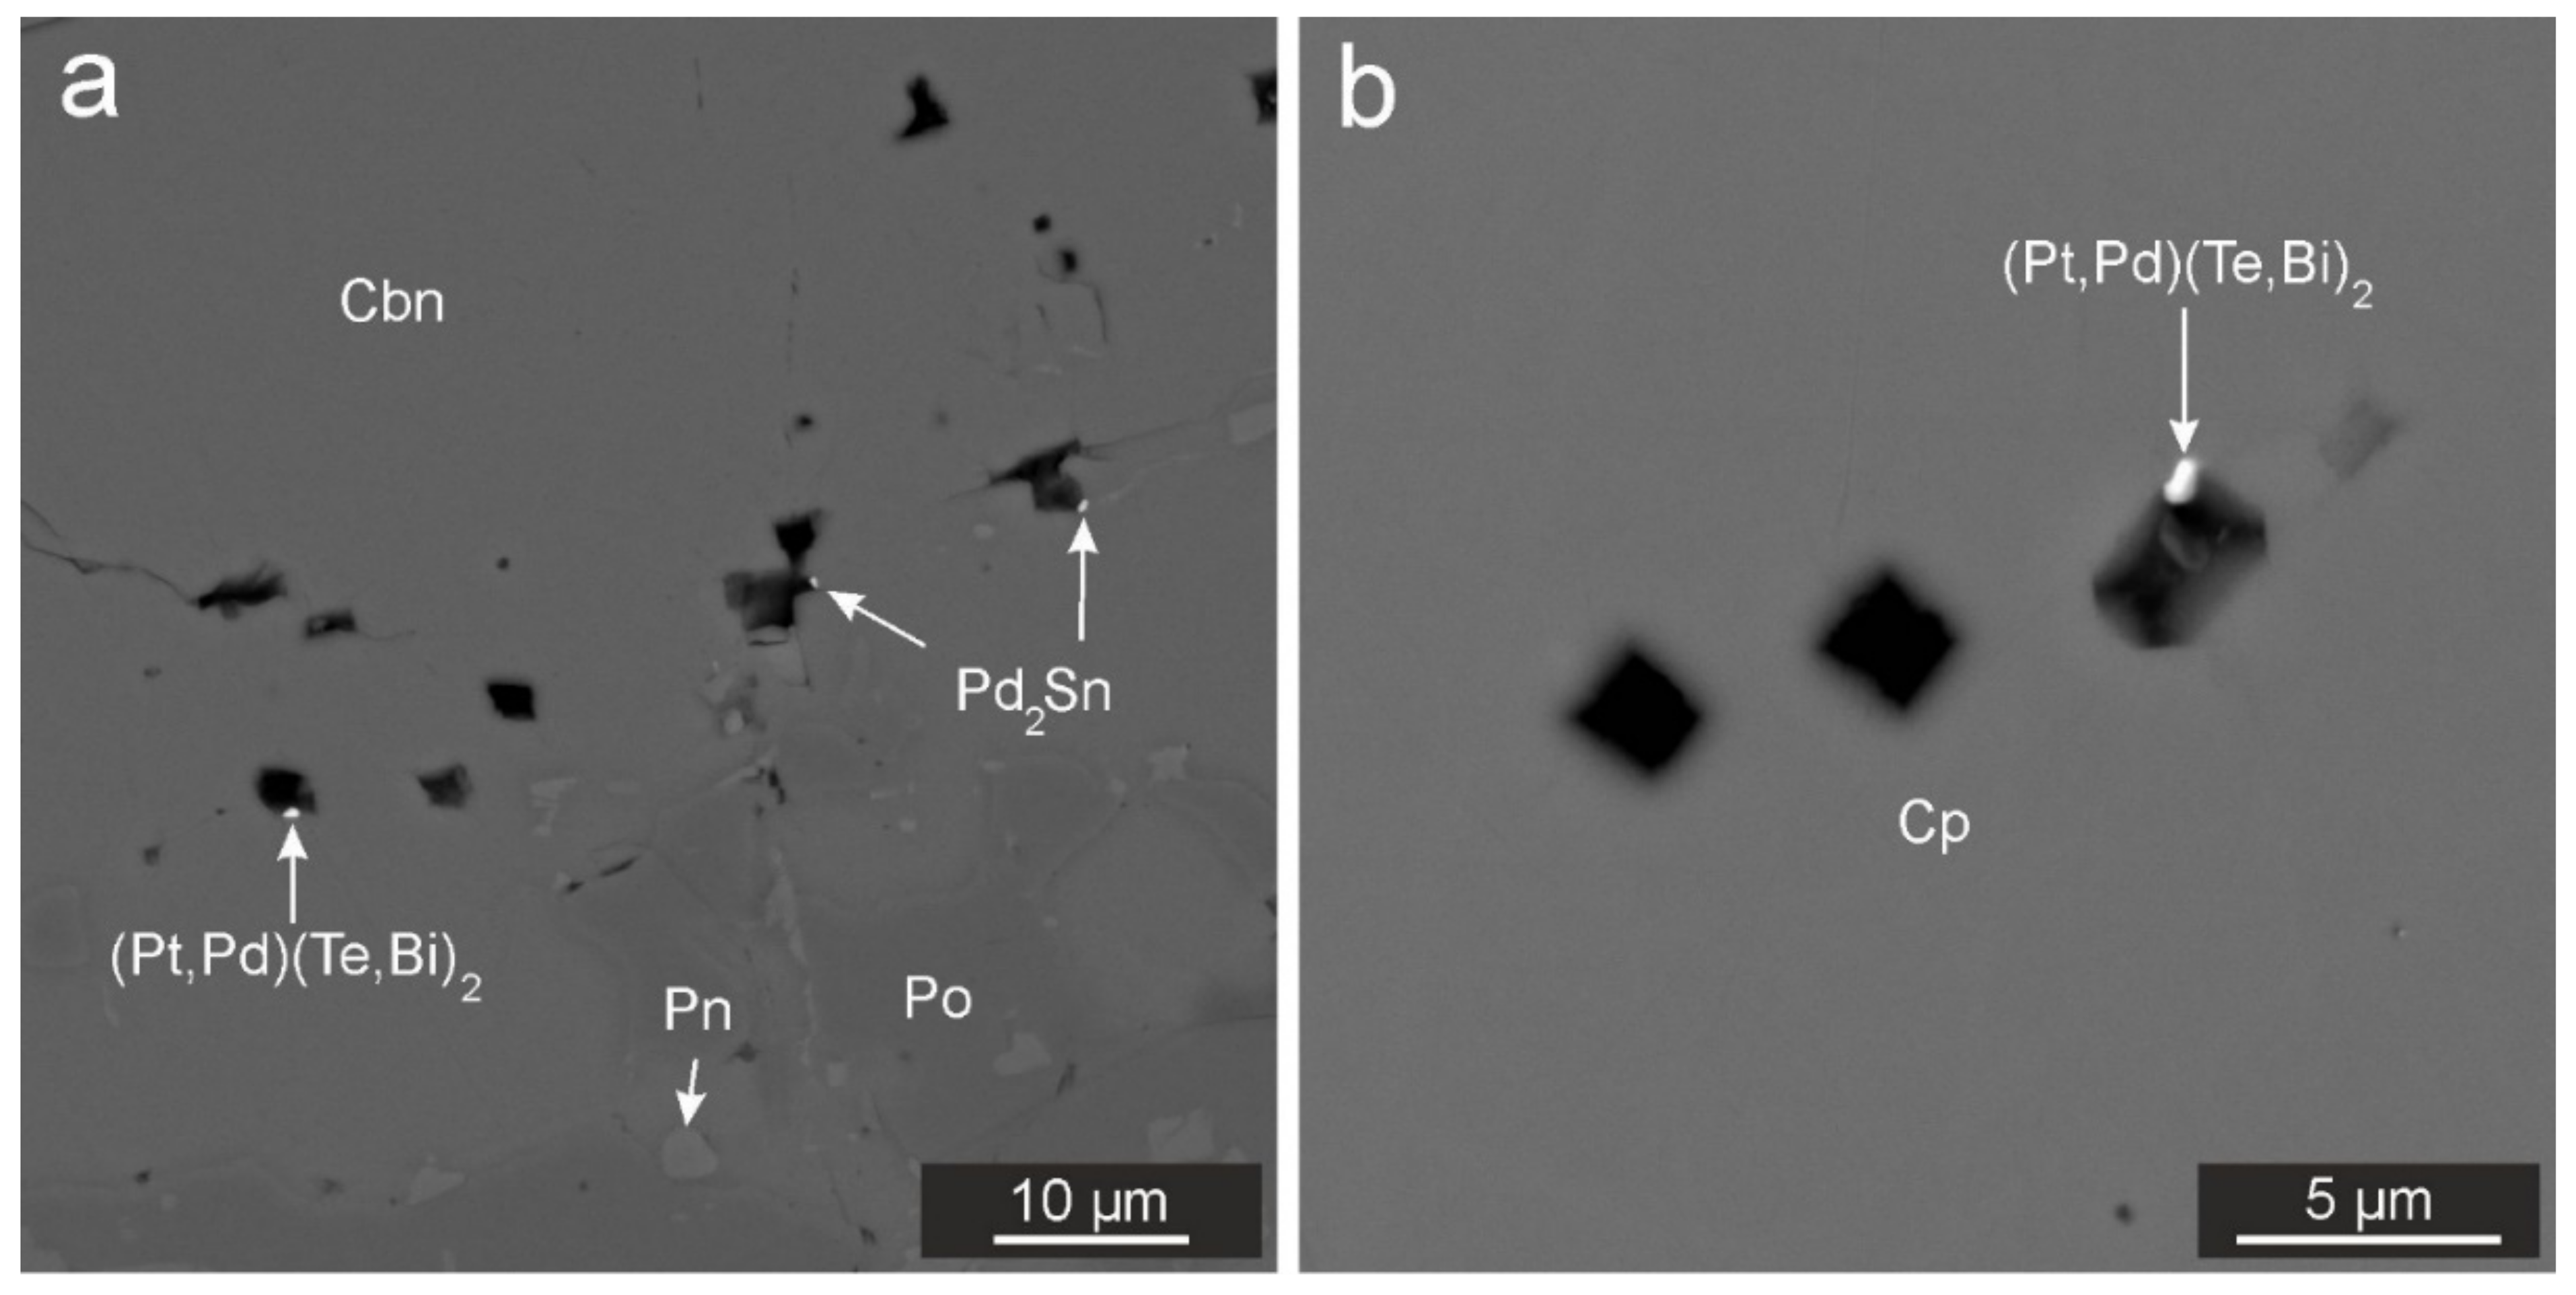
17]. Sn, Bi and Pb are the main semimetal anions in the PGE-immiscible liquid in the ores of Southern-2 ore body, whereas Te is present only in small amounts. Pd and subordinate Pt are the main cations in these multiphase PGM grains. Other PGEs do not form their own minerals and are usually not detected as impurities in the minerals of Pt and Pd. The rounded or irregular-complex shape of the multiphase PGM grains (
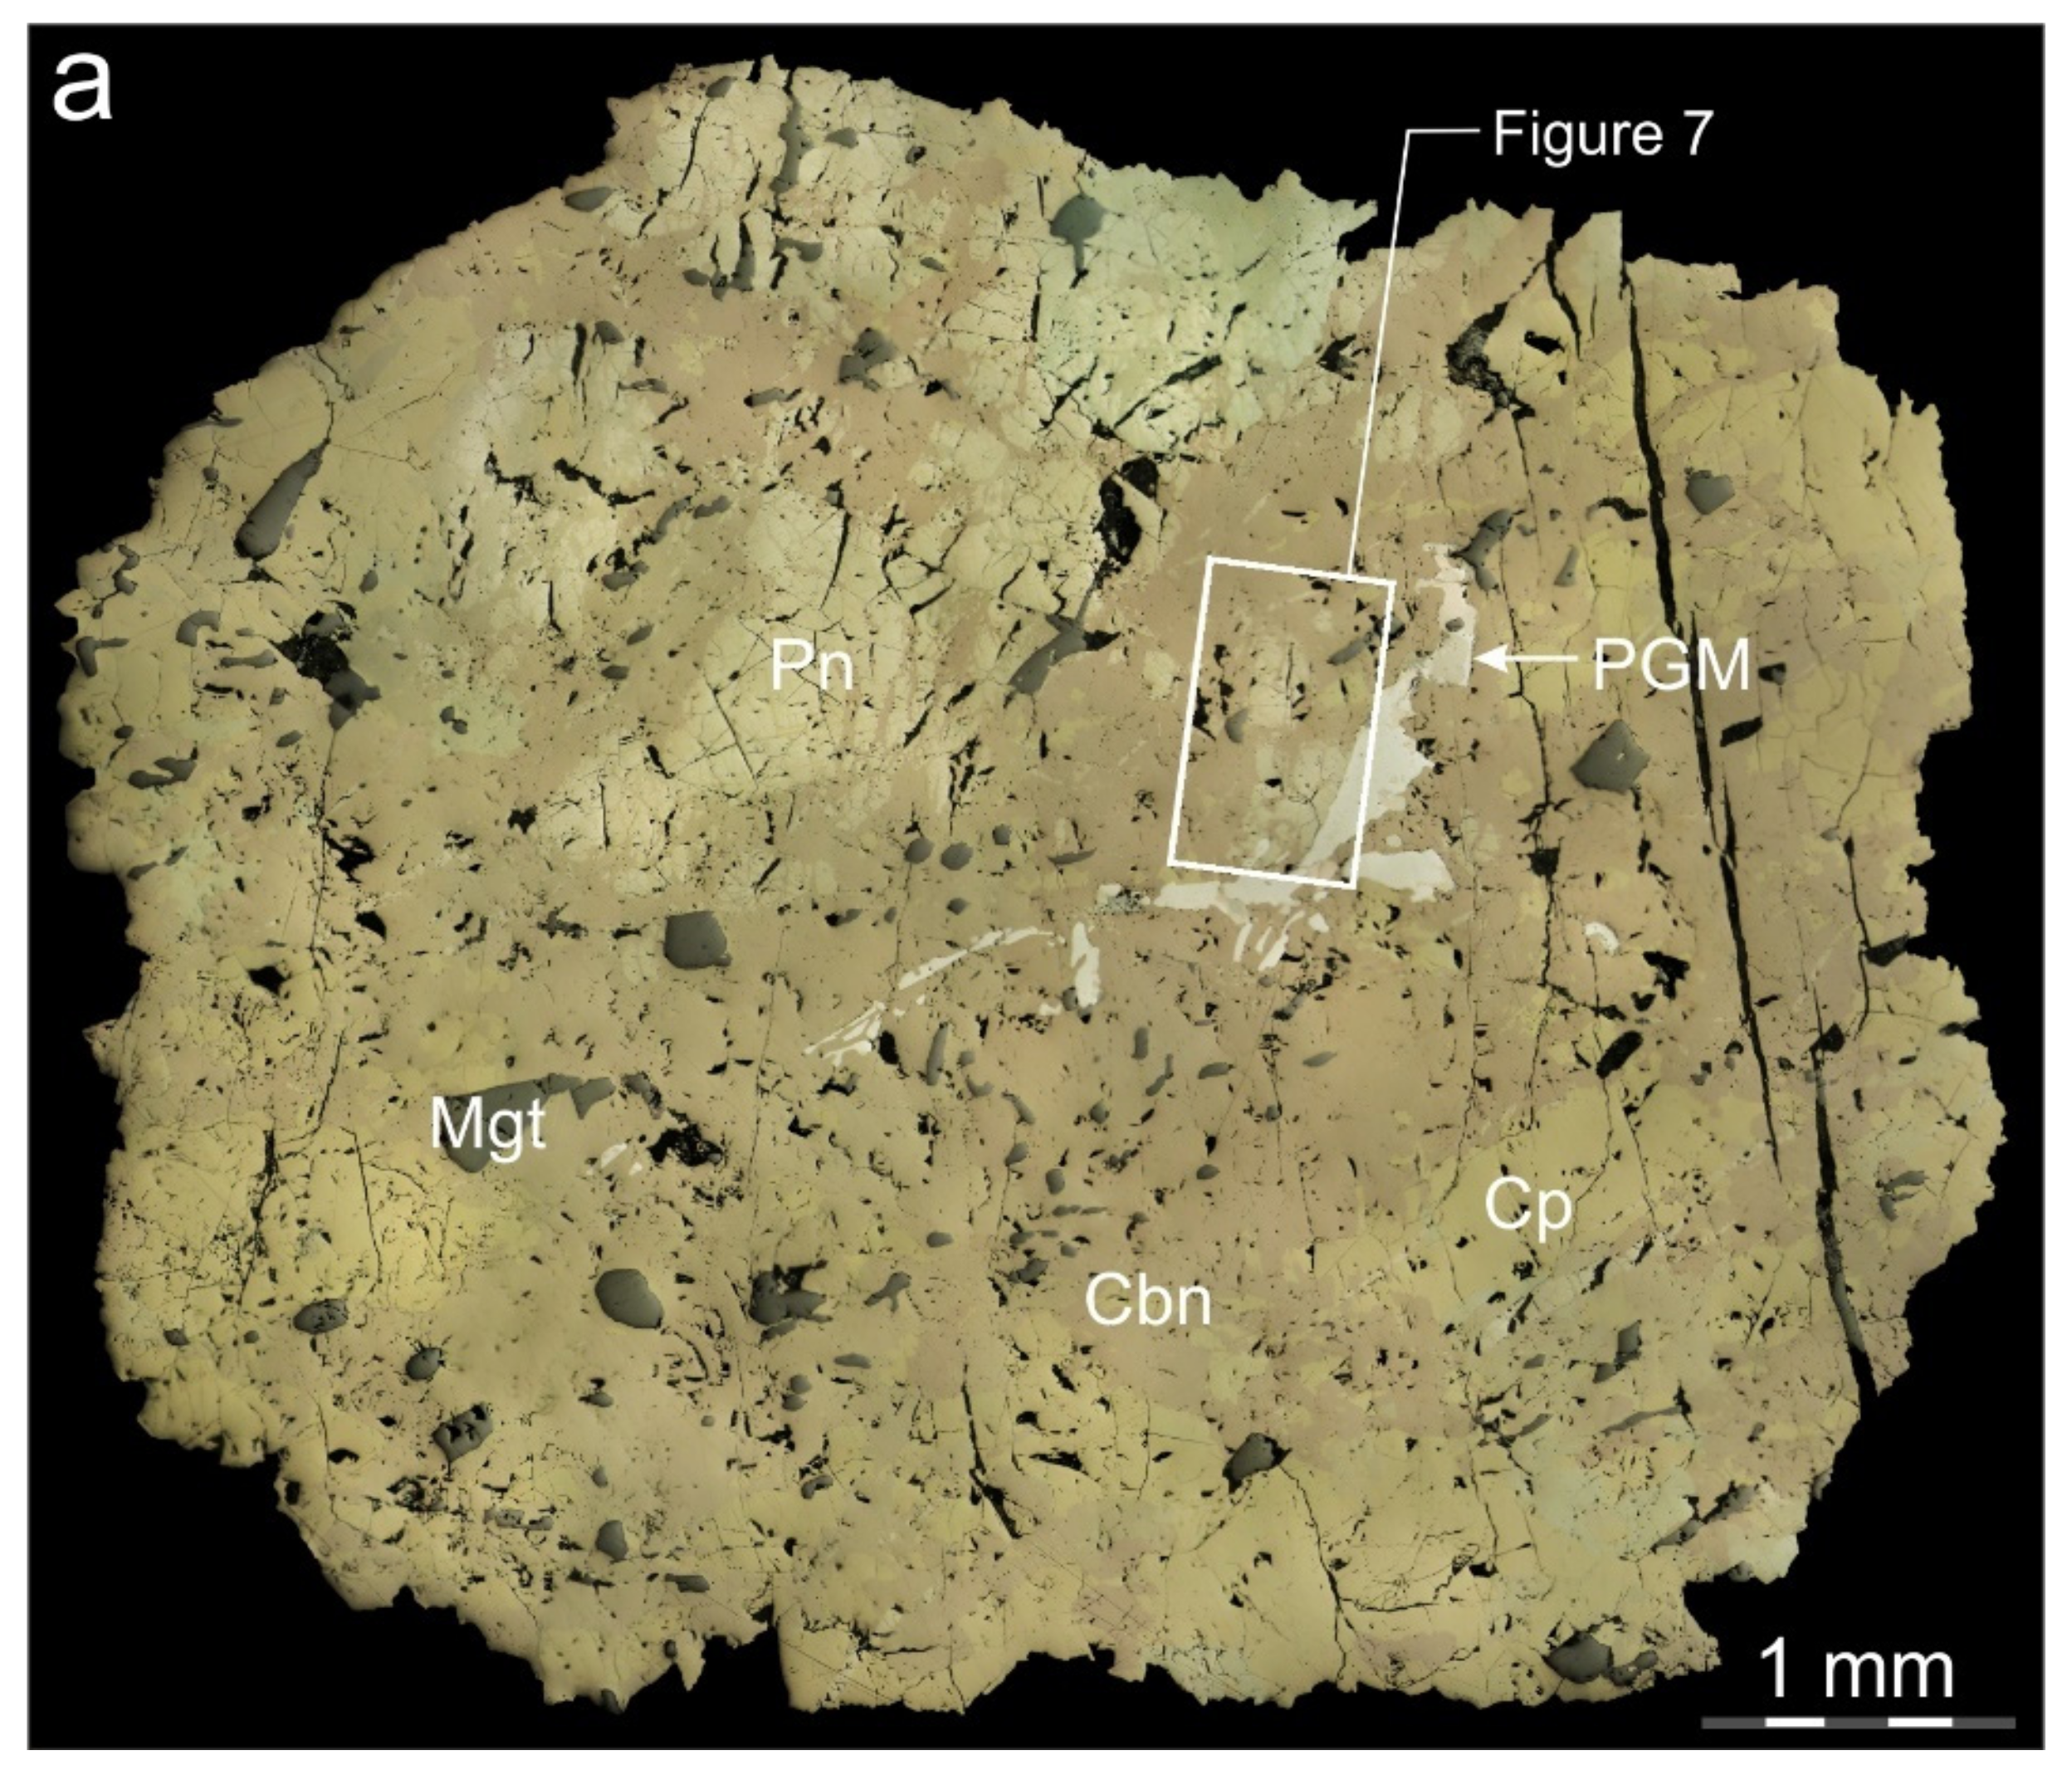
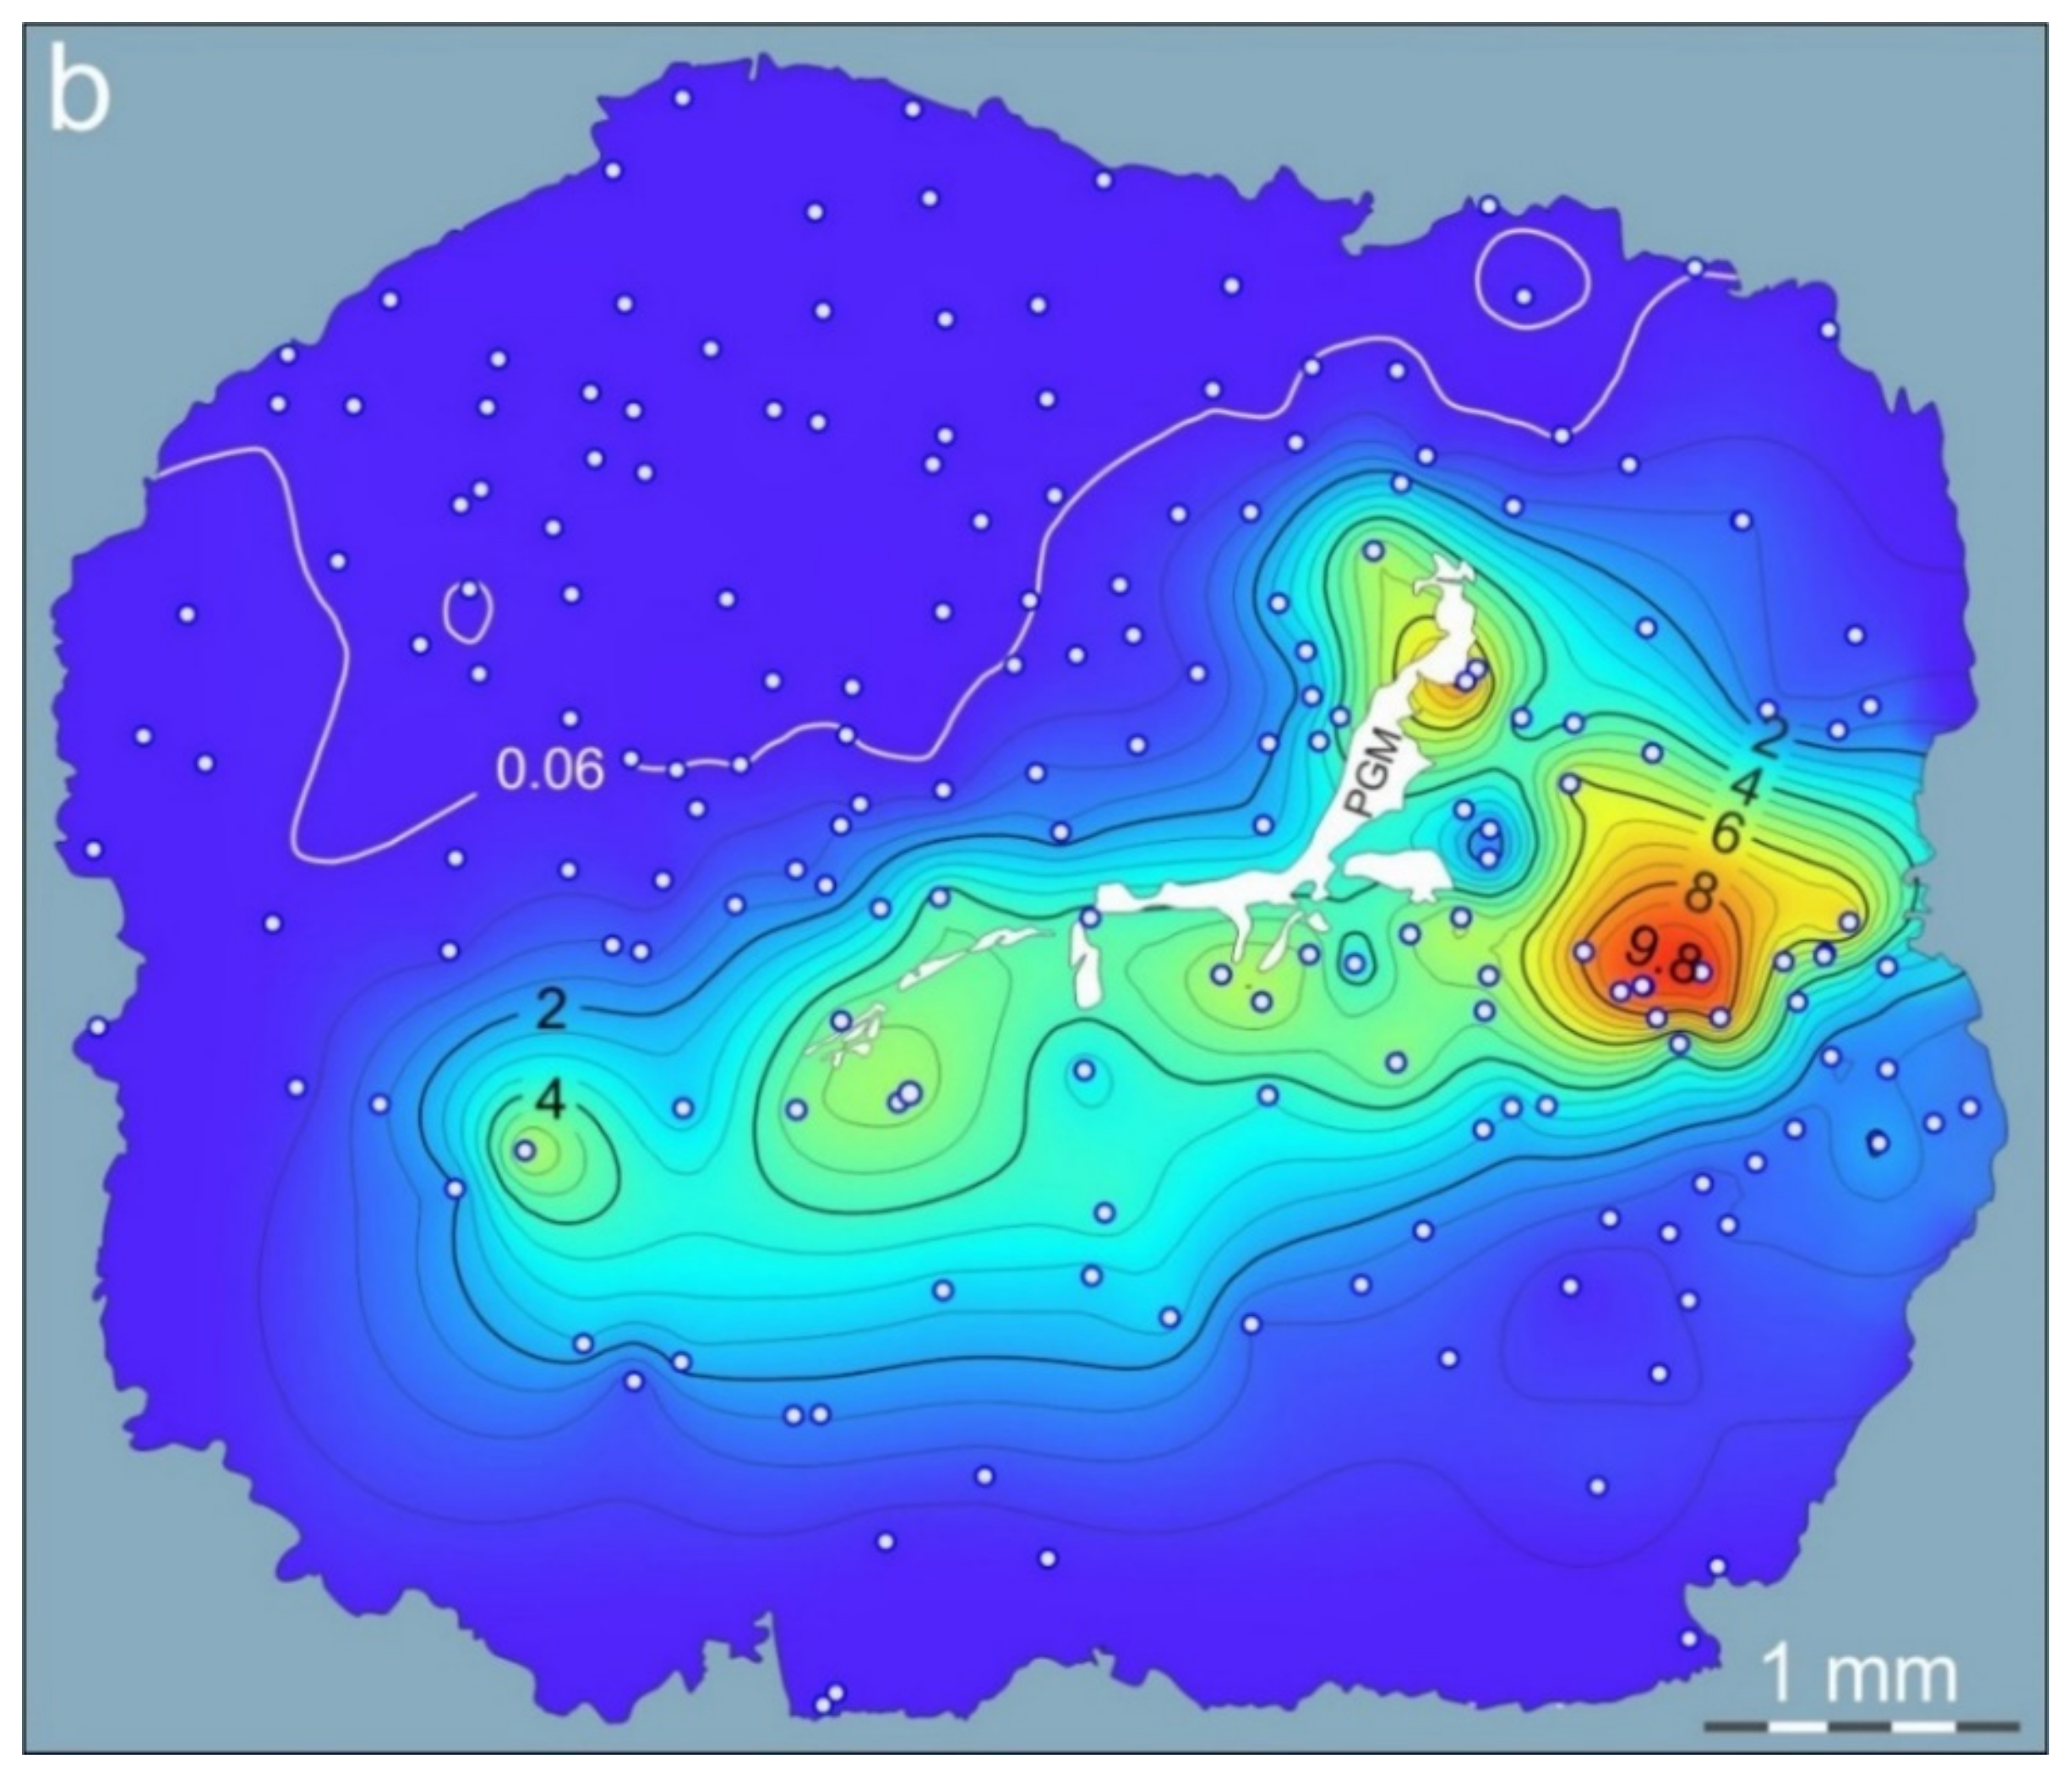
Figure 6), the intricated internal structure, and the large number of different PGM phases may indicate that this type of PGM composites are the result of crystallization of droplets of an immiscible liquid with complex composition. Although the large multiphase PGM grains are important reservoirs of palladium, they cannot be regarded as the source of palladium for Pd-rich pentlandites for the following reasons.
  • Pt and Pd are more strongly bonded to semimetals such as Te, Bi, Sb and As than to S [50,51,52,53]. Thus, if a bond of palladium with a semimetal atom is formed, the breaking of such a bond and the new formation of a bond between palladium and sulfur is very unlikely.
  • Liquid immiscibility implies equilibrium between coexisting liquids and crystallizing phases. If separation of a PGE-semimetals liquid from a sulfide liquid ever occurs, PGE and semimetals would be concentrated in the former. Upon cooling, the separation of components between the liquids will also increase, and consequently, the partitioning of palladium from the PGE semimetal liquid back into the sulfide liquid or solid sulfide matrix is very unlikely.
  • As opposed to the metamorphic reaction suggested for the J-M Reef, Stillwater, including Pd release [20], in our case, there is no single evidence of breakdown or dissolution of any PGM phases or multiphase PGM grains. Thus, a source of palladium from PGM grains is not manifested.
  • If PGM grains were to be a source of palladium, then the highest Pd contents in pentlandite would be those occurring in very close proximity or direct contact with them. However, Pd content in pentlandite does not depend on the proximity or contact with PGM grain (Figure 8f and Figure 9b).
The above stated arguments do not allow the multiphase PGM grains to be considered a source of palladium for studied Pd-rich pentlandites. Thus, the considered hypotheses cannot fully explain the occurrence of Pd-rich pentlandite in the ores of the Southern-2 ore body, and a new mechanism must be proposed.

5.3. Origin of Pd-Rich Pentlandite in the Southern-2 Ore Body

According to the petrographic and geochemical features revealed in this study, four aspects are considered crucial in the interpretation of the genesis of Pd-rich pentlandite in the Southern-2 ore body: (1) the rather small size of the areas containing Pd-rich pentlandite (Figure 6b); (2) the extremely high concentrations of Pd, reaching up to 11.26 wt.% (Table 3); (3) the pretty sharp variations in the content of palladium in pentlandite in short distances (Figure 6b); (4) the irregular (non-zonal) distribution of palladium in individual grains of pentlandite (Figure 8f and Figure 9b). Nevertheless, the main problems concern the source of palladium as well as the mechanism of enrichment.
The hypothesis claiming that residual sulfide liquid could be a source of palladium seems very compelling. Most of the areas containing Pd-rich pentlandite are spatially associated with multiphase PGM grains, which are the result of the separation of an immiscible PGE-semimetal liquid from a residual sulfide melt at the latest stages of crystallization of sulfide liquids [51,52]. Since large droplets of such immiscible liquid occur evenly along the section of cubanite and chalcopyrite ores, the residual liquid could have been remained among the ISS cumulate in the form of enclaves during crystallization of the ISS. Therefore, most of the palladium should have been contained in the immiscible PGE-semimetal liquid. However, at a high Pd/semimetal ratio, part of the palladium would form a bond with sulfur and thus would be in the coexisting sulfide liquid [16]. Crystallization of such a liquid could lead to the occurrence of Pd-rich ISS and consequently palladium-rich pentlandite. In this case, the map in Figure 6b shows the enclave of the crystallized residual sulfide liquid together with the immiscible PGE-semimetal liquid. However, this completely contradicts the morphological features of pentlandite and the distribution of palladium in it.
It may be assumed that large crystals of pentlandite (
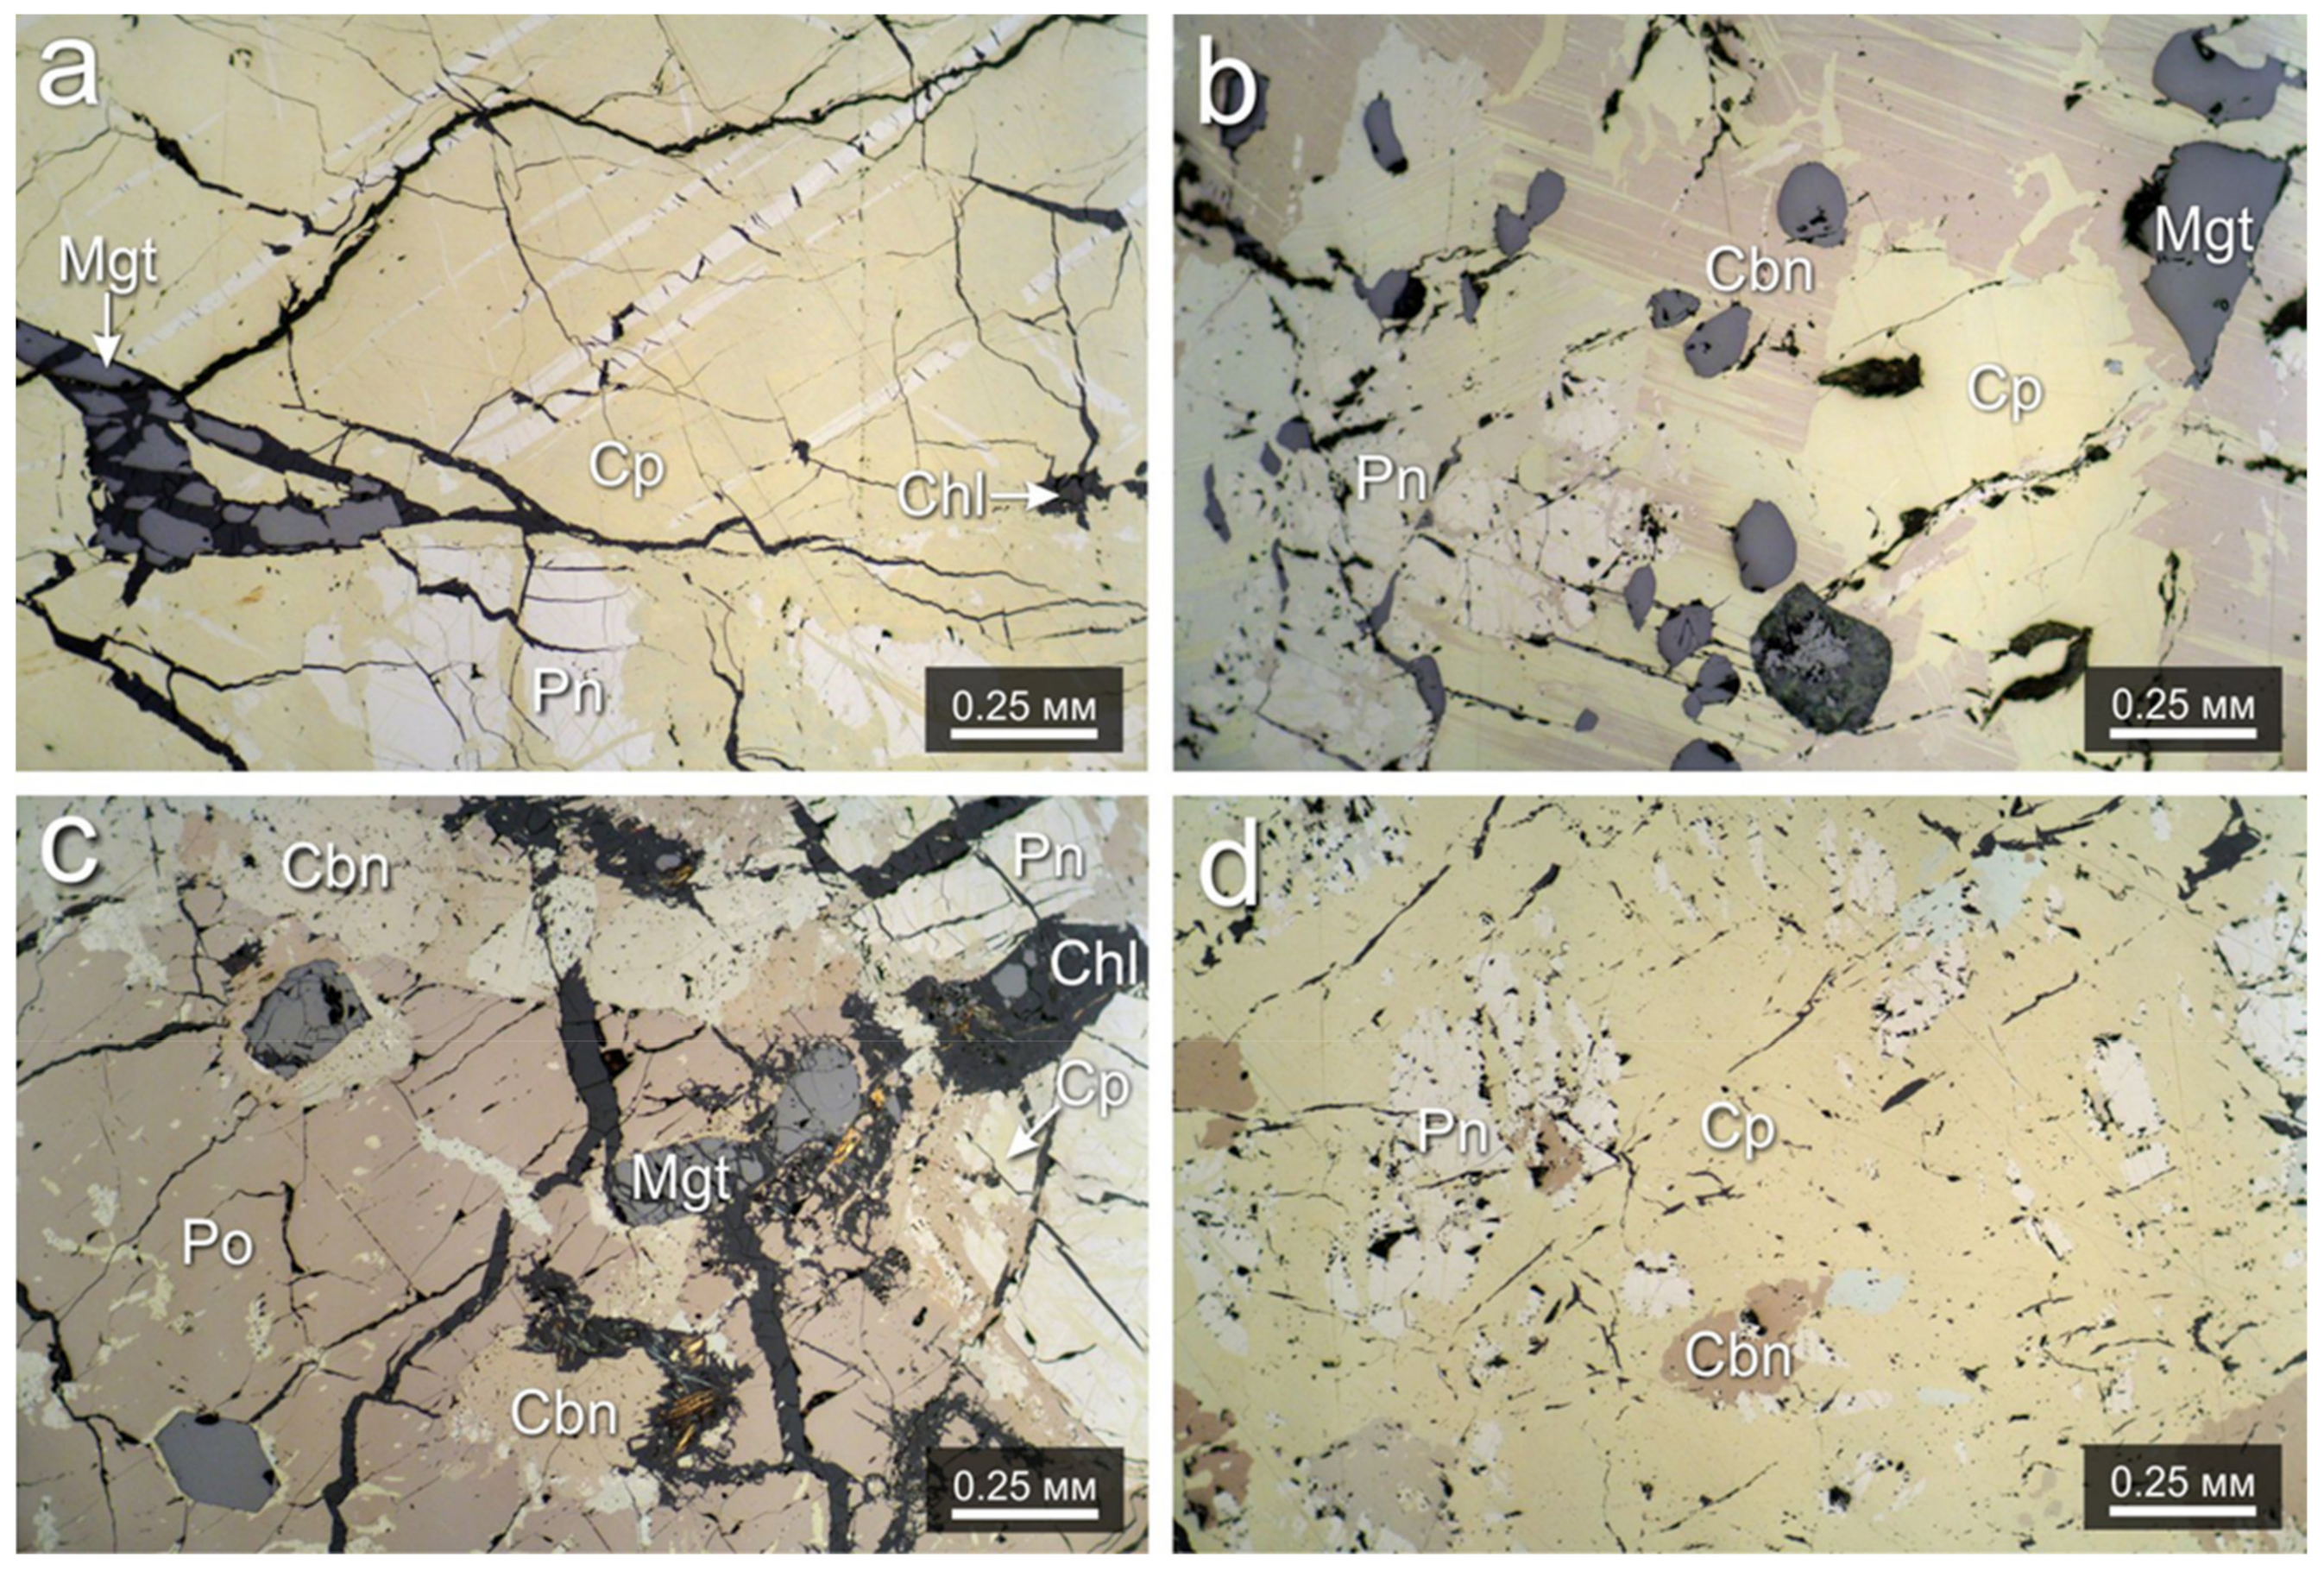
Figure 4e,f) were formed as a result of cotectic or eutectic crystallization of ISS and PnSS. Most of palladium thus should enter into the PnSS during the crystallization of PnSS from the liquid. Additionally, the distribution of palladium should be uniform in general, due to the high diffusion rate of the elements at magmatic temperatures. If this homogenization did not happen during crystallization from the melt, then it should have been completed during subsolidus re-equilibrations by diffusion. Pentlandite crystals have a network of chalcopyrite lamellas, and large areas of pentlandite are replaced by either cubanite or chalcopyrite (Figure 4f and Figure 8a,d). This may indicate an intense cation exchange of Cu, Fe and Ni within the PnSS crystal below the solidus. Furthermore, microprobe studies have shown that the composition of ore-forming pentlandite is the same within one sample. Consequently, the homogenization of the concentrations of the main components was rather effective. If Pd entered the PnSS at the magmatic stage of crystallization, then its concentration should have been equally distributed within the studied grain as well as the concentration of Fe, Ni and Cu. In other words, those PnSS crystals that crystallized from the residual sulfide liquid should have a slightly higher concentration of palladium than others and an even distribution of palladium in the grain. However, the distribution of palladium in large crystals of pentlandite is markedly uneven (Figure 9). Moreover, the presence of lamellae of Pd-rich pentlandite in cubanite (
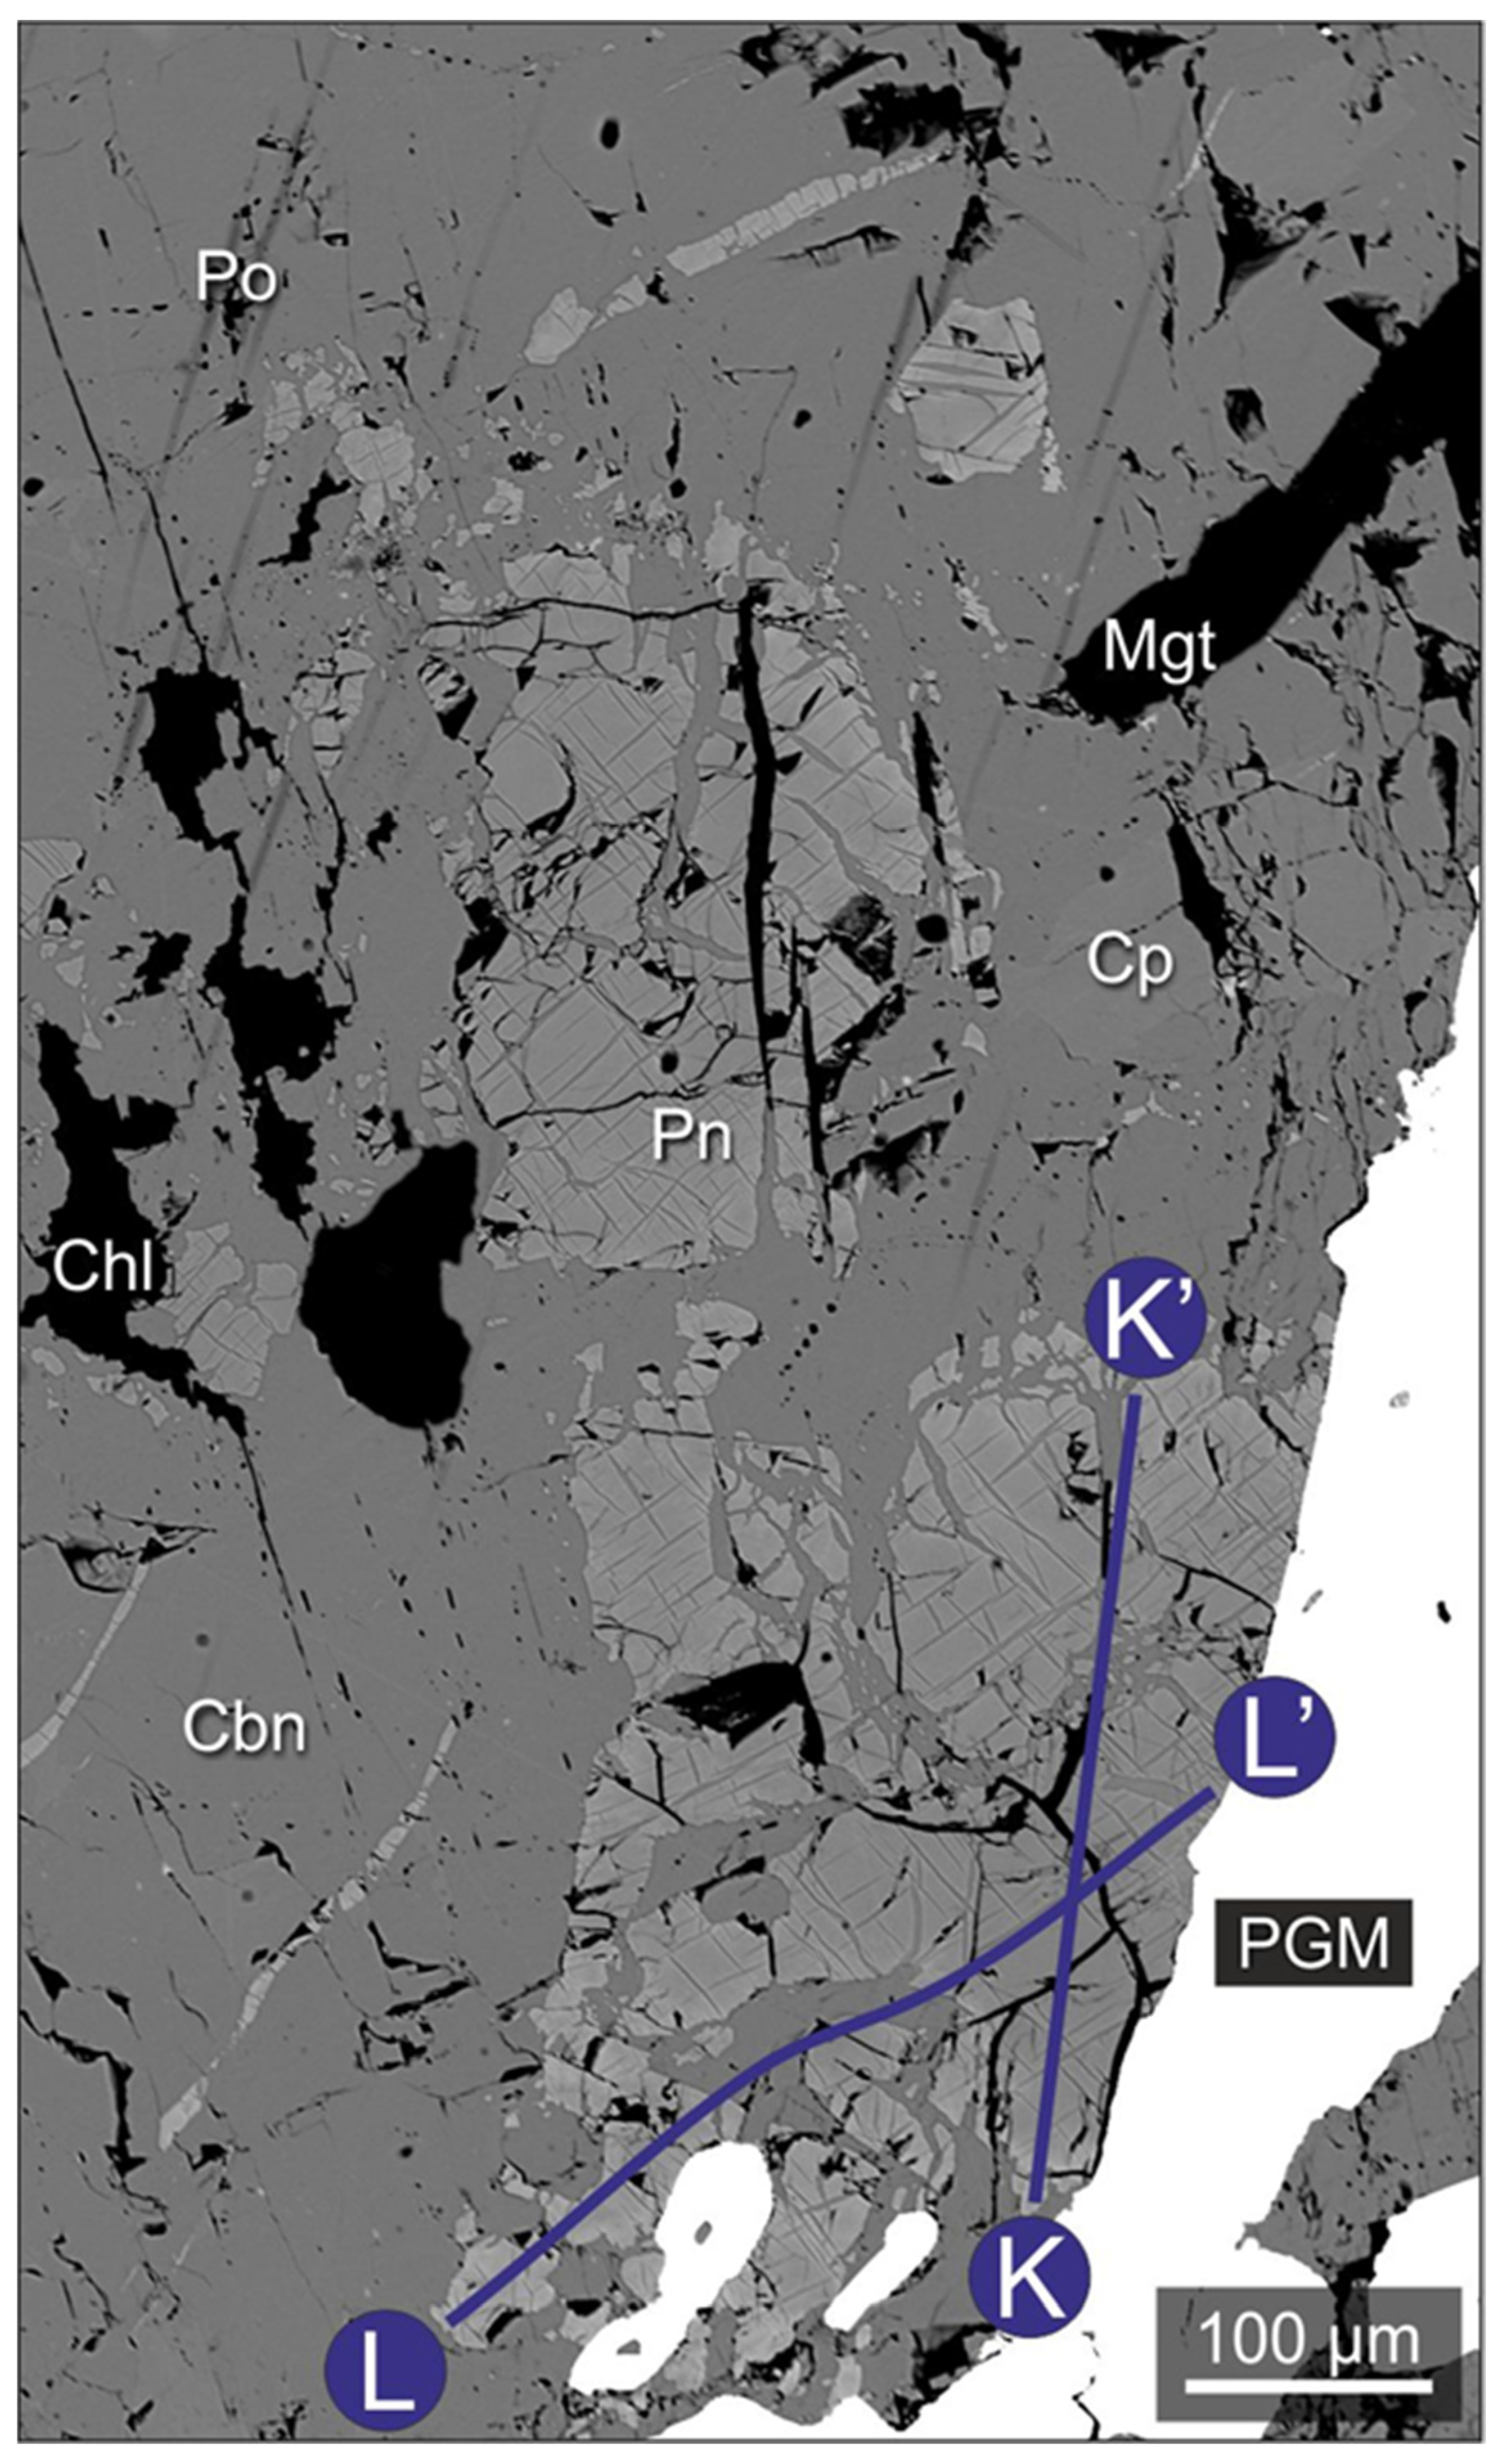
Figure 8f) contradicts this assumption. If PnSS were to be crystallized from the melt, then palladium would be consumed during its crystallization. After that, there should be no source of palladium for the Pd-rich pentlandite lamellae.
In our opinion, both lamellae and granular pentlandite in cubanite and chalcopyrite ores occurred as a result of ISS exsolution. If a portion of the ISS crystallized from the residual Pd-rich sulfide liquid, then the exsolution of such ISS should lead to the occurrence of Pd-rich PnSS. Nonetheless, a long sequence of subsolidus transformations of PnSS into pentlandite, chalcopyrite and cubanite should have led to a homogenization of the composition with respect to palladium as well as Cu, Fe and Ni.
Because of the extremely irregular distribution of palladium in pentlandite grains (Figure 8f), palladium enrichment occurred once PnSS subsolidus transformations were completed. Therefore, the enrichment of pentlandite in palladium is a superimposed process, which is not associated with either crystallization of the sulfide liquid or subsolidus transformations of sulfides. The map of palladium distribution (Figure 8f) confirms the superimposed nature of the process. This map shows that dramatic enrichment in palladium occurs in local areas associated with neighboring pentlandite grains or closely spaced parts of these grains, regardless of whether the lamellae or large crystals were enriched. One could easily assume the direction of the diffusion along which the palladium was supplied. Arrows in Figure 8f show these directions. However, there is a problem with the source of palladium for a late superimposed process which needs to be addressed.
Godel and Barnes proposed the possibility of Pd transfer, from a source outside, by a fluid into pentlandite for the J-M Reef in Stillwater [9]. However, in our study, it seems challenging to invoke for an outsider Pd-rich source in the Southern-2 ore body. Many ore bodies comprising massive sulfide ores of the Talnakh and Oktyabr’sky deposits have aureoles of metasomatically altered rocks containing sulfide and PGE mineralization. These metasomatic changes, including the formation of sulfide impregnations, are caused by fluid released during the crystallization of the same ore body. The concentration of copper, Pt, Pd and other incompatible elements in the 100% sulfide calculation [23] of altered rocks is higher than in the massive sulfide ores. Sulfide impregnation is clearly visible in igneous and sedimentary rocks near the contact with the ore body. However, the influence of such metasomatic fluid on the sulfide ores of the ore body itself is unrevealed because sulfide minerals deposited from this fluid are difficult to detect among the primary massive sulfides. Fluid inclusions in sulfide minerals are evidence of the effect of such a fluid (Figure 12). There are large groups of inclusions (Figure 12a), single inclusions or chains of inclusions (Figure 12b). Some of them are euhedral in shape (Figure 12b) and contain Pd-bearing daughter mineral phases (Figure 12a,b). The presence of these indicates the impact of the fluid, which could have been the source of palladium for the enrichment of some pentlandite grains in palladium. Currently, there is no way to determine the source of this fluid with supporting evidence. This could well be either a neighboring ore body or some part of the Southern-2 ore body that solidified later than the studied section of the EM-7 borehole. An important fact, however, is the time gap between the occurrence and subsolidus transformations of ore-forming pentlandite and the process itself of enrichment with palladium.

6. Conclusions

Pd-rich pentlandite in the massive ores of the Southern-2 ore body has unusually high palladium concentrations, reaching up to 11.26 wt.%, sharp changes in palladium content and uneven distribution of palladium within individual grains. Unlike most of the already known examples, it is found in ores that formed by crystallization and subsolidus changes of ISS. Analysis of the proposed hypotheses on the origin of such pentlandites showed that most of them are unsuitable for the studied case. Our research indicates that the enrichment of palladium in pentlandite is not related either to the crystallization of the sulfide liquid nor to subsolidus transformations of the base metal sulfides. Instead, this is the result of a superimposed process that allowed for the replacement of nickel by palladium and the decrease in the Ni/Fe ratio in the implicated pentlandite grains. Most likely, this process occurred at a lower sulfur fugacity compared to that which happened during the crystallization of ore-forming pentlandite. At the same time, this may also indicate a time gap between the crystallization of ore-forming pentlandite and the process of enrichment with palladium. The transformation of pentlandite into a Pd-rich one occurred due to isomorphic substitution of one nickel atom by 0.71 Pd and 0.30 Fe (apfu). The assumed source of Pd and the cause of the modification in ore-forming pentlandite may correspond to a fluid that separates during the crystallization of massive sulfide ores. However, there is currently no way to determine the exact source of such fluid. The results obtained in this study suggest that after complete crystallization of the massive sulfide ore body, transfer and redistribution of such important elements like PGEs continued, which draws attention to the important role of such late-stage fluids in this and possibly other ore-forming processes.

Supplementary Materials

The following are available online at https://0-www-mdpi-com.brum.beds.ac.uk/article/10.3390/min11111258/s1, Table S1: Composition of the ore-forming and Pd-rich pentlandites form the EM-7 borehole of the Southern-2 ore body of the Talnakh deposit.

Author Contributions

Conceptualization, V.K.; methodology, V.K. and E.N.; software, V.G. and A.L.; validation, V.K. and N.T.; formal analysis, V.G., A.L. and E.N.; investigation, V.K. and V.G.; resources, V.K. and V.G.; data curation, V.K. and V.G.; writing—original draft preparation V.K., N.T. and V.G.; writing—review and editing, V.K. and N.T.; visualization, V.G.; supervision, N.T.; project administration, V.K. and N.T.; funding acquisition, N.T. and V.G. All authors have read and agreed to the published version of the manuscript.

Funding

The studies were carried out within the framework of the state assignment of the Sobolev Institute of Geology and Mineralogy, Siberian Branch of the Russian Academy of Sciences and financed by the Ministry of Science and Higher Education of the Russian Federation. Financial assistance was also obtained from the Russian Foundation of Basic Research projects No. 20-35-90088.

Conflicts of Interest

The authors declare no conflict of interest.

References

  1. Cabri, L.J.; Laflamme, J.G. Analyses of minerals containing platinum-group elements. In Platinum-Group Elements: Mineralogy, Geology, Recovery; Cabri, L.J., Ed.; Canadian Insitute of Mining, Metallurgy and Petroleum: Montreal, QC, Canada, 1981; Volume 23, pp. 151–173. [Google Scholar]
  2. Czamanske, G.K.; Kunilov, V.E.; Zientek, M.L.; Cabri, L.J.; Likhachev, A.P.; Calk, L.C.; Oscarson, R.L. A proton microprobe study of magmatic sulfide ores from the Noril’sk-Talnakh district, Siberia. Can. Mineral. 1992, 30, 249–287. [Google Scholar]
  3. Chai, G.; Naldrett, A.J.; Rucklidge, J.C.; Kilius, L.R. In situ quantitative analyses for PGE and Au in sulfide minerals of the Jinchuan Ni-Cu deposit by accelerator mass spectrometry. Can. Mineral. 1993, 3l, 19–30. [Google Scholar]
  4. Distler, V.V.; Kulagov, E.A.; Sluzhenikin, S.F.; Laputina, I.P. The quench sulfide solid solutions in the ores of the Noril’sk deposit. Geol. Ore Depos. 1996, 38, 41–53. (In Russian) [Google Scholar]
  5. Cabri, L.J. The Geology, Geochemistry, Mineralogy and Mineral Beneficiation of Platinum-Group Elements; Canadian Institute of Mining, Metallurgy and Petroleum: Montreal, QC, Canada, 2002; Volume 54, p. 852. [Google Scholar]
  6. Gervilla, F.; Cabri, L.J.; Kojonen, K.; Oberthür, T.; Weiser, T.W.; Johanson, B.; Sie, S.H.; Campbell, J.L.; Teesdale, W.J.; Laflamme, J.G. Platinum-group element distribution in some ore deposits: Results of EPMA and micro-PIXE analyses. Microchim. Acta 2004, 147, 167–173. [Google Scholar] [CrossRef]
  7. Holwell, B.D.A.; McDonald, I. A review of the behavior of platinum group elements within natural magmatic sulfide ore systems. Platin. Met. Rev. 2010, 54, 26–36. [Google Scholar] [CrossRef]
  8. Godel, B.; Barnes, S.-J.; Maier, W.D. Platinum-group elements in sulphide minerals, platinum-group minerals, and whole-rocks of the Merensky Reef (Bushveld Complex, South Africa): Implications for the formation of the Reef. J. Petrol. 2007, 48, 1569–1604. [Google Scholar] [CrossRef] [Green Version]
  9. Godel, B.; Barnes, S.-J. Platinum-group elements in sulfide minerals and the whole rocks of the J-M Reef (Stillwater Complex): Implication for the formation of the reef. Chem. Geol. 2008, 248, 272–294. [Google Scholar] [CrossRef]
  10. Osbahr, I.; Klemd, R.; Oberthür, T.; Brätz, H.; Schouwstra, R. Platinum-group element distribution in base-metal sulfides of the Merensky Reef from the eastern and western Bushveld Complex, South Africa. Miner. Depos. 2013, 48, 211–232. [Google Scholar] [CrossRef]
  11. Osbahr, I.; Oberthür, T.; Klemd, R.; Josties, A. Platinum-group element distribution in base-metal sulfides of the UG2 chromitite, Bushveld Complex, South Africa—A reconnaissance study. Miner. Depos. 2014, 49, 655–665. [Google Scholar] [CrossRef]
  12. Brovchenko, V.D.; Sluzhenikin, S.F.; Kovalchuk, E.V.; Kovrigina, S.V.; Abramova, V.D.; Yudovskaya, M.A. Platinum Group Element Enrichment of Natural Quenched Sulfide Solid Solutions, the Norilsk 1 Deposit, Russia. Econ. Geol. 2020, 6, 1343–1361. [Google Scholar] [CrossRef]
  13. Cabri, L.J.; Sylvester, P.J.; Tubrett, M.N.; Peregoedova, A.; Laflamme, J.H.G. Comparison of LAM–ICP–MS and micro-PIXE results for palladium and rhodium in selected samples of Noril’sk and Talnakh sulfides. Can. Mineral. 2003, 41, 321–329. [Google Scholar] [CrossRef] [Green Version]
  14. Keays, R.R.; Ross, J.R.; Woolrich, P. Precious metals in volcanic peridotite-associated nickel sulfide deposits in western Australia. II. Distribution within the ores and host rocks at Kambalda. Econ. Geol. 1981, 76, 1645–1674. [Google Scholar] [CrossRef]
  15. Dare, S.A.S.; Barnes, S.-J.; Prichard, H.M. The distribution of platinum group elements (PGE) and other chalcophile elements among sulfides from the Creighton Ni–Cu–PGE sulfide deposit, Sudbury, Canada, and the origin of palladium in pentlandite. Miner. Depos. 2010, 45, 765–793. [Google Scholar] [CrossRef]
  16. Holwell, D.A.; McDonald, I. Distribution of platinum-group elements in the Platreef at OVerysel. Northern Bushveld Complex: A combined PGM and LA-ICP-MS study. Contrib. Mineral. Petrol. 2007, 154, 171–190. [Google Scholar] [CrossRef]
  17. Junge, M.; Wirth, R.; Oberthur, T.; Melcher, F.; Schreibr, A. Mineralogical siting of platinum-group minerals in pentlandite from the Bushveld Complex, South Africa. Miner. Depos. 2015, 50, 41–54. [Google Scholar] [CrossRef] [Green Version]
  18. Klemd, R.; Herderich, T.; Junge, M.; Oberthür, T.; Schouwstra, R.; Roberts, J. Platinum-group element concentrations in base-metal sulphides from the Platreef, Mogalakwena Platinum Mine, Bushveld Complex, South Africa. S. Afr. J. Geol. 2016, 119, 623–638. [Google Scholar] [CrossRef]
  19. Cabri, L.J.; Blank, H.; El Goresy, A.; Laflamme, J.H.G.; Nobiling, R.; Sizgoric, M.B.; Traxel, K. Quantitative trace-element analyses of sulphides from Sudbury and Stillwater by proton microprobe. Can. Mineral. 1984, 22, 521–542. [Google Scholar]
  20. Li, C.; Ripley, E.M. Formation of Pt-Fe alloy by desulfurization of Pt-Pd sulfide in the J-M reef of the Stillwater Complex, Montana. Can. Mineral. 2006, 44, 895–903. [Google Scholar] [CrossRef]
  21. Sinyakova, E.F.; Kosyakov, V.; Borisenko, A.S.; Karmanov, N.S. Behavior of noble metals during fractional crystallization of Cu–Fe–Ni–(Pt, Pd, Rh, Ir, Ru, Ag, Au, Te) sulfide melts. Russ. Geol. Geophys. 2019, 60, 642–661. [Google Scholar] [CrossRef]
  22. Liu, Y.; Brenan, J. Partitioning of platinum-group elements (PGE) and chalcogens (Se, Te, As, Sb, Bi) between monosulfide-solid solution (MSS), intermediate solid solution (ISS) and sulfide liquid at controlled fO2–fS2 conditions. Geochim. Cosmochim. Acta 2015, 159, 139–161. [Google Scholar] [CrossRef]
  23. Naldrett, A.J. Magmatic Sulphide Deposits: Geology, Geochemistry and Exploration; Springer: Berlin/Heidelberg, Germany; New York, NY, USA, 2004; p. 727. [Google Scholar] [CrossRef]
  24. Sluzhenikin, S.F.; Krivolutskaya, N.A.; Rad’ko, V.A.; Malitch, K.N.; Distler, V.V.; Fedorenko, V.A. Ultramafic-Mafic Intrusions, Volcanic Rocks and PGE-Cu-Ni Sulfide Deposits of the Norilsk Province, Polar Siberia Field Trip Guidebook; Zavaritsky Institute of Geology and Geochemistry of the Ural Branch (UB) of the Russian Academy of Sciences (RAS): Yekaterinburg, Russia, 2014; p. 87. [Google Scholar]
  25. Krivolutskaya, N.A. 2014 The Evolution of Trap Magmatism and Pt-Cu-Ni Ore Formation in the Norilsk Region; Tovarishhestvo nauchnyh izdanii KMK: Moscow, Russia, 2014; p. 305. [Google Scholar]
  26. Genkin, A.D.; Distler, V.V.; Gladyshev, G.D.; Filimonova, A.A.; Evstigneeva, T.L.; Kovalenker, V.A.; Laputina, I.P.; Smirnov, A.V.; Grokhovskaya, T.L. Sulfide Copper–Nickel Ores of the Norilsk Deposits; Nauka: Moscow, Russia, 1981; p. 374. [Google Scholar]
  27. Tolstykh, N.; Krivolutskaya, N.; Safonova, I.; Shapovalova, M.; Zhitova, L.; Abersteiner, A. Unique Cu-rich sulphide ores of the Southern-2 ore body in the Talnakh Intrusion, Noril’sk area (Russia): Geochemistry, mineralogy and conditions of crystallization. Ore Geol. Rev. 2020, 122, 103525. [Google Scholar] [CrossRef]
  28. Vymazalová, A.; Laufek, F.; Sluzhenikin, S.F.; Stanley, C.J. Norilskite, (Pd,Ag)7Pb4, a new mineral from Noril’sk-Talnakh deposit, Russia. Mineral. Mag. 2017, 81, 531–541. [Google Scholar] [CrossRef]
  29. Knop, O.; Huang, C.-H.; Reid, K.I.G.; Carlow, J.S.; Woodhams, F.W.D. Chalkogenides of the Transition elements. X. X-Ray, Neutron, Mossbauer, and magnetic studies of pentlandite and the π phases π(Fe,Co,Ni,S), Co8MS8, and Fe4Ni4MS8 (M = Ru,Rh,Pd). J. Solid State Chem. 1976, 16, 97–116. [Google Scholar] [CrossRef]
  30. Knop, O.; Ibrahim, M.A. Satarno chalcogenides of the transition elements; [Part] 4, Pentlandite, a natural pi phase. Can. Mineral. 1965, 8, 291–316. [Google Scholar]
  31. Hutchinson, D.; McDonald, I. Breaking the rules. Divergent behaviour of platinum and palladium in the northern limb of Bushveld Complex, R.S.A. In Proceedings of the 10th International Platinum Symposium, Oulu, Finland, 8–11 August 2005. [Google Scholar]
  32. Klemd, R.; Beinlich, A.; Kern, M.; Junge, M.; Martin, L.; Regelous, M.; Schouwstra, R. Magmatic PGE Sulphide Mineralization in Clinopyroxenite from the Platreef, Bushveld Complex, South Africa. Minerals 2020, 10, 570. [Google Scholar] [CrossRef]
  33. Rajamani, V.; Prewitt, C.T. Crystal chemistry of natural pentlandites. Can. Mineral. 1973, 12, 178–187. [Google Scholar]
  34. Rajamani, V.; Prewitt, C.T. Thermal expansion of the pentlandite structure. Am. Mineral. 1975, 60, 39–48. [Google Scholar]
  35. Goldschmidt, V.M. Die Gesetze der Krystallochemie. Die Nat. 1926, 14, 477–485. [Google Scholar] [CrossRef]
  36. Peregoedova, A.V.; Fedorova, Z.N.; Sinyakova, E.F. Physicochemical conditions of the pentlandite formation in Cu-bearing sulfide paragenesis (according to experimental data). Russ. J. Geol. Geophysics. 1995, 36, 91–98. [Google Scholar]
  37. Fedorova, Z.N.; Sinyakova, E.F. Experimental investigation of physicochemical conditions of pentlandite formation. Russ. J. Geol. Geophys. 1993, 34, 79–87. [Google Scholar]
  38. Sinyakova, E.F. Forms of palladium release under crystallization of sulfide melts of the Fe-Ni-S System at sulfur content 40–51 at.%. Russ. J. Geol. Geophys. 1998, 39, 634–647. [Google Scholar]
  39. Kolonin, G.R.; Orsoev, D.A.; Sinyakova, E.F.; Kislov, E.V. The Ni/Fe ratio in pentlandite as an indicator of sulfur fugacity during the formation of PGE-bearing sulfide mineralization of the Ioko–Dovyren Massif. Dokl. Earth Sci. 2000, 370, 75–79. [Google Scholar]
  40. Ballhaus, C.; Tredoux, M.; Spath, A. Phase relations in the Fe-Ni-Cu-PGE-S system at magmatic temperature and application to massive sulphide ores of the Sudbury igneous complex. J. Petrol. 2001, 42, 1911–1926. [Google Scholar] [CrossRef] [Green Version]
  41. Li, C.; Barnes, S.J.; Makovicky, E.; Rose-Hansen, J.; Makovicky, M. Partitioning of nickel, copper, iridium, rhenium, platinum, and palladium between monosulfide solid solution and sulfide liquid: Effects of composition and temperature. Geochim. Cosmochim. Acta 1996, 60, 1231–1238. [Google Scholar] [CrossRef]
  42. Pina, R.; Gervilla, F.; Barnes, S.-J.; Ortega, L. Distribution of platinum-group and chalcophile elements in the Aguablanca Ni-Cu sulfide deposit (SW Spain): Evidence from a LA-ICP-MS study. Chem. Geol. 2012, 302–303, 61–75. [Google Scholar] [CrossRef] [Green Version]
  43. Mansur, E.T.; Barnes, S.J.; Duran, C.J. Textural and compositional evidence for the formation of pentlandite via peritectic reaction: Implications for the distribution of highly siderophile elements. Geology 2019, 47, 1–7. [Google Scholar] [CrossRef]
  44. Makovicky, M.; Makovicky, E.; Rose-Hansen, J. Experimental studies on the solubility and distribution of platinum group elements in base metal sulphides in platinum deposits. In Metallurgy of Basic and Ultrabasic Rocks; Gallagher, M.J., Ixer, R.A., Neary, C.R., Prichard, H.M., Eds.; Institute of Mining and Metallurgy: London, UK, 1986; pp. 415–425. [Google Scholar]
  45. Mansur, E.T.; Barnes, S.J.; Duran, C.J.; Sluzhenikin, S.F. Distribution of chalcophile and platinum-group elements among pyrrhotite, pentlandite, chalcopyrite and cubanite from the Noril’sk-Talnakh ores: Implications for the formation of platinum-group minerals. Miner. Depos. 2020, 55, 1215–1232. [Google Scholar] [CrossRef]
  46. Dutrizac, J.E. Reactions in cubanite and chalcopyrite. Can. Mineral. 1976, 14, 172–181. [Google Scholar]
  47. Sinyakova, E.F.; Kosyakov, V.I. Experimental modeling of zoning in copper-nickel sulfide ores. Dokl. Earth Sc. 2007, 417, 1380–1385. [Google Scholar] [CrossRef]
  48. Sinyakova, E.F.; Kosyakov, V.I. The polythermal section of the Cu–Fe–Ni–S phase diagram constructed using directional crystallization and thermal analysis. J. Therm. Anal. Calorim. 2014, 117, 1085–1089. [Google Scholar] [CrossRef]
  49. Kosyakov, F.I.; Sinyakova, E.F.; Distler, V.V. Experimental simulation of phase relationships and zoning of magmatic nickel-copper sulfide Ores, Russia. Geol. Ore Depos. 2012, 54, 179–208. [Google Scholar] [CrossRef]
  50. Fleet, M.E.; Chryssoulis, S.L.; Stone, W.E.; Weisener, C.G. Partitioning of platinum-group elements and Au in the Fe−Ni−Cu−S system: Experiments on the fractional crystallization of sulfide melt. Contrib. Mineral. Petrol. 1993, 115, 36–44. [Google Scholar] [CrossRef]
  51. Gervilla, F.; Leblanc, M.; Torres-Ruiz, J.; Fenoll Hach-Ali, P. Immiscibility between arsenide and sulfide melts: A mechanism for concentration of noble metals. Can. Mineral. 1996, 34, 485–502. [Google Scholar]
  52. Helmy, H.; Ballhaus, C.; Berndt, J.; Bockrath, C.; Wohlgemuth-Ueberwasser, C. Formation of Pt, Pd and Ni tellurides: Experiments in sulfide–telluride systems. Contrib. Mineral. Petrol. 2007, 153, 577–591. [Google Scholar] [CrossRef]
  53. Holwell, D.; McDonald, I. Petrology, geochemistry and the mechanisms determining the distribution of platinum-group element and base metal sulphide mineralisation in the Platreef at Overysel, northern Bushveld Complex, South Africa. Miner. Depos. 2006, 41, 575–598. [Google Scholar] [CrossRef]
  54. Cabri, L.J.; Laflamme, J.H.G. The mineralogy of the platinum-group elements from some copper-nickel deposits of the Sudbury area, Ontario. Econ. Geol. 1976, 71, 1159–1195. [Google Scholar] [CrossRef]
  55. Prichard, H.M.; Hutchinson, D.; Fisher, P.C. Petrology and Crystallization History of Multiphase Sulfide Droplets in a Mafic Dike from Uruguay: Implications for the Origin of Cu-Ni-PGE Sulfide Deposits. Econ. Geol. 2004, 99, 365–376. [Google Scholar] [CrossRef]
  56. Barnes, S.-J.; Cox, R.A.; Zientek, M.L. Platinum-group element, gold, silver and base metal distribution in compositionally zoned sulfide droplets from the Medvezky Creek Mine, Noril’sk, Russia. Contrib. Mineral. Petrol. 2006, 152, 187–200. [Google Scholar] [CrossRef]
Figure 1. Location of the Talnakh ore cluster and details of its geological structure: (a) Geological scheme of the northern part of the Norilsk region; (b) Geological scheme of the Talnakh ore cluster. 1—Lower and middle Paleozoic sediments; 2—Mesozoic and Cenozoic sediments; 3—Permo−Triassic volcanics; 4—Faults: I—North Kharaelakh fault; II—Norilsk–Kharaelakh fault; III—Mikchangda fault; 5—Outline projection of the main body of the Kharaelakh ore-bearing intrusion; 6—Outline projection of the main body of the Talnakh ore-bearing intrusion; 7—Outline projection of the massive sulfide ore bodies.
Minerals 11 01258 g001
Figure 2. Cross-section of the Southern-2 ore body along the EM-7 borehole. Abbreviations: Cbn—cubanite; Cp—chalcopyrite; Pn—pentlandite; Po—pyrrhotite; GD-OL—olivine gabbro-dolerite; GD-T—taxitic gabbro-dolerite.
Minerals 11 01258 g002
Figure 3. Main ore types in the cross-section of the Southearn-2 ore body along the EM-7 well. (a) Chalcopyrite-pentlandite ore from the upper chalcopyrite layer, depth 71.2 m; (b) Cubanite-pentlandite-chalcopyrite ore from the cubanite layer, depth 76.5 m; (c) Pyrrhotite-cubanite-pentlandite ore from the pyrrhotite layer, depth 78.6 m; (d) Chalcopyrite-cubanite-pentlandite ore from the lower chalcopyrite layer, depth 78.9 m. Reflected light, nicols are not completely crossed. Abbreviations: Cbn—cubanite; Chl—chlorite; Cp—chalcopyrite; Mgt—magnetite; Pn—pentlandite; Po—pyrrhotite.
Minerals 11 01258 g003
Figure 4. Morphological varieties of pentlandite from the ores of EM-7 borehole: (a) Flames in pyrrhotite ores; (b) Granular pentlandite in pyrrhotite ores; (c) Network of pentlandite lamellae in chalcopyrite ores; (d) Network of partially dissolved pentlandite lamellae in cubanite ores; (e) Granular pentlandite in chalcopyrite ores; (f) Granular pentlandite in cubanite ores; (g) Pentlandite lamellae in cubanite ores with the network of chalcopyrite lamellae inside; (h) Relict of the network of pentlandite lamellae in cubanite ores. Reflected light, nicols are not completely crossed. Abbreviations: Cbn—cubanite, Chl—chlorite, Cp—chalcopyrite, Mgt—magnetite, Pn—pentlandite, Po—pyrrhotite.
Minerals 11 01258 g004
Figure 5. Variations in the average composition of pentlandite in the ore body cross-section, EM-7 core sample (Table 1). Circles show average compositions of ore-forming pentlandite. Squares show the compositions of pentlandite with the highest palladium content. Empty figures connected by lines show the compositions of Pd-rich and ore-forming pentlandite in the same sample. Abbreviations: Cbn—cubanite; Cp—chalcopyrite; Pn—pentlandite; Po—pyrrhotite; GD-OL—olivine gabbro-dolerite; GD-T—taxitic gabbro-dolerite.
Minerals 11 01258 g005
Figure 6. Distribution of Pd content (wt.%) in fine grains of pentlandite in cubanite ore (sample 32−11, depth 76.5 m). (a) The polished section in reflected light. Nicols are not completely crossed; (b) Contour map showing Pd concentrations (wt.%) in small grains of pentlandite. The white isoline (white) labeled as 0.06 corresponds to the lower detection limit for Pd in Pn imposed by the microprobe. White dots represent the points of analyses. Abbreviations: Cbn—cubanite; Pn—pentlandite; Cp—chalcopyrite; Mgt—magnetite; PGM—multiphase grain of platinum group minerals.
Minerals 11 01258 g006aMinerals 11 01258 g006b
Figure 7. BSE image of cubanite ore in the sample 32−11, depth 76.5 m, used for EDS mapping (Figure 8). Lines KK’ and LL’ show microprobe profiles through the large crystal of Pd-rich pentlandite (Figure 9). Abbreviations: Cbn—cubanite; Chl—chlorite; Cp—chalcopyrite; Mgt—magnetite; PGM—multiphase grain of platinum group minerals; Pn—pentlandite; Po—pyrrhotite.
Minerals 11 01258 g007
Figure 8. EDS elemental distribution maps in cubanite ore (sample 32−11, depth 76.5 m). (a) Cu; (b) Fe; (c) S; (d) Ni; (e) Co; (f) Pd. Arrows show the probable direction of palladium enrichment in pentlandite (see explanations in the Chapter 5.3). For an explanation on the color scales, see Section 3.2. Abbreviations: Cbn—cubanite; Chl—chlorite, Cp—chalcopyrite; Mgt—magnetite; Pn—pentlandite; Po—pyrrhotite; PGM—multiphase PGM grain; Tmr—taimyrite.
Minerals 11 01258 g008
Figure 9. Microprobe profiles through the large crystal of Pd-rich pentlandite from the cubanite ore (sample 32−11, depth 76.5 m): (a) Microprobe profile KK’; (b) Microprobe profile LL’. The gray areas show discontinuities in the pentlandite crystal due to the replacement of pentlandite by cubanite. The dashed line marked DL shows the detection limit of Pd in pentlandite, corresponding to 0.06 wt.%. The position of the profiles is shown in Figure 7.
Minerals 11 01258 g009
Figure 10. Ternary plots, showing the differences in chemical composition in wt.% between π-phase, ore-forming and Pd-rich pentlandites from various deposits: (a) Diagram Pd-Ni-Fe; (b) Diagram Pd-Ni-S.
Minerals 11 01258 g010
Figure 11. Binary diagrams, showing correlation between main elements in Pd-rich pentlandite: (a) Diagram Pd-Ni; (b) Diagram Pd-Fe. The lines marked with numbers (1) and (2) are plotted according to Deming regression Equations (1) and (2) in the text. Apfu—atoms per formula unit.
Minerals 11 01258 g011
Figure 12. Fluid inclusions in the sulfide ores of the Talnakh deposit. (a) Large group of fluid inclusions in cubanite; (b) Chain of euhedral fluid inclusions in chalcopyrite. BSE images. Abbreviations: Cbn—cubanite; Pn—pentlandite; Po—pyrrhotite; (Pt,Pd) (Te,Bi)2—moncheite; Pd2Sn—paolovite.
Minerals 11 01258 g012
Table 1. The standards and detection limits for microprobe analysis.
Spectral LineSpectrometer CrystalStandardCmin, wt.%, Detection Limit
PdPETJPd-metal0.06
NiLIFAlloy FeNiCo0.04
CuLIFCuFeS20.04
CoLIFHAlloy FeNiCo0.03
PtLIFHPt-metal0.08
SPETJCuFeS20.04
FeLIFLCuFeS20.02
Note. Spectrometer crystals abbreviations: LIF—LiF, LIFH—LiF of high intensity, LIFL—LiF (large), PETJ—Pentaerythritol of Jeol Ltd.
Table 2. Average compositions of the ore-forming pentlandite from Southern-2 ore body of the Talnakh intrusion (borehole EM-7).
No. Depth, mNumber of AnalysesNiCuCoSFeTotalMineral Formulas
169.61838.750.230.6533.0427.3299.97(Fe3.79Ni5.12Co0.08Cu0.02)9.01S7.99
270.11340.580.400.6032.8625.4699.90(Fe3.54Ni5.38Co0.08Cu0.04)9.04S7.96
371.2739.060.460.5333.4726.91100.44(Fe3.71Ni5.14Co0.07Cu0.04)8.96S8.04
472.3538.480.400.4932.1027.0998.56(Fe3.82Ni5.19Co0.07Cu0.04)9.12S7.88
573.3938.360.230.5933.1027.82100.10(Fe3.83Ni5.03Co0.08Cu0.07)9.01S7.99
673.81838.710.370.4832.7327.2699.54(Fe3.80Ni5.17Co0.07Cu0.02)9.06S7.94
775.0837.980.370.5633.3227.90100.13(Fe3.86Ni5.02Co0.07Cu0.02)8.98S8.02
875.6437.070.320.7533.5728.98100.69(Fe3.99Ni4.82Co0.10Cu0.08)8.99S8.01
976.51834.300.440.6833.7231.41100.55(Fe4.31Ni4.48Co0.09Cu0.05)8.93S8.07
1076.71134.510.150.4033.5331.71100.30(Fe4.36Ni4.52Co0.05Cu0.02)8.95S8.05
1176.9634.150.420.6833.5831.76100.60(Fe4.37Ni4.47Co0.09Cu0.05)8.98S8.02
1277.2834.210.080.4533.4532.07100.27(Fe4.42Ni4.48Co0.06Cu0.01)8.97S8.03
1377.91333.240.411.2433.4732.10100.46(Fe4.41Ni4.38Co0.16Cu0.03)8.98S8.02
1478.61133.230.511.1933.6931.85100.46(Fe4.38Ni4.37Co0.16Cu0.04)8.95S8.05
1578.91333.200.124.4633.6629.57101.01(Fe4.05Ni4.33Co0.58Cu0.01)8.97S8.03
Note. Pd below detection limit (0.06 wt.%) in all analyses.
Table 3. Representative compositions of pentlandite with the highest palladium content (wt.%).
No.PdNiCuCoSFeTotalMineral Formulas
111.2624.620.420.6131.9131.62100.44(Fe4.58Ni3.39Pd0.86Co0.08Cu0.05)8.96S8.04
211.2124.560.500.6031.9132.03100.81(Fe4.62Ni3.37Pd0.85Co0.08Cu0.06)8.98S8.02
311.0724.390.430.7332.0132.19100.82(Fe4.64Ni3.34Pd0.84Co0.10Cu0.05)8.97S8.03
411.0724.900.390.7131.8531.63100.56(Fe4.60Ni3.32Pd0.85Co0.10Cu0.05)8.92S8.08
59.6626.140.480.5932.1831.73100.77(Fe4.54Ni3.56Pd0.73Co0.08Cu0.06)8.97S8.03
69.5425.820.630.5232.3731.84100.72(Fe4.55Ni3.51Pd0.72Co0.07Cu0.08)8.93S8.07
79.5126.160.680.5332.0631.53100.46(Fe4.53Ni3.57Pd0.72Co0.07Cu0.09)8.98S8.02
89.1526.590.430.6132.1931.62100.59(Fe4.53Ni3.62Pd0.69Co0.08Cu0.05)8.97S8.03
99.1126.270.660.6332.3331.89100.89(Fe4.55Ni3.57Pd0.68Co0.09Cu0.08)8.97S8.03
Note. 1–4—sample no. 31−11, depth 76.7 m; 5–9—sample no. 32−11, depth 76.5 m.
Table 4. Compositional variations in the crystal of Pd-rich pentlandite (wt.%) along the profile KK’.
No.PdNiCuCoSFeTotalMineral Formulas
14.3230.380.340.6632.7431.84100.28(Fe4.47Ni4.06Pd0.32Co0.09Cu0.04)8.98S8.02
24.8029.830.270.5732.9832.08100.53(Fe4.50Ni3.98Pd0.35Co0.08Cu0.03)8.94S8.06
31.4433.390.100.5833.2931.64100.44(Fe4.38Ni4.40Pd0.10Co0.08Cu0.01)8.97S8.03
41.0633.790.090.5833.7431.74101.00(Fe4.36Ni4.41Pd0.08Co0.08Cu0.01)8.09S8.07
50.9933.840.140.6033.5331.64100.74(Fe4.36Ni4.43Pd0.07Co0.08Cu0.02)8.96S8.04
60.9833.550.430.5933.5231.74100.81(Fe4.37Ni4.39Pd0.07Co0.08Cu0.05)8.96S8.04
70.6534.340.130.5733.7531.50100.95(Fe4.32Ni4.48Pd0.05Co0.07Cu0.02)8.94S8.06
80.4734.630.090.5833.5331.44100.74(Fe4.32Ni4.53Pd0.03Co0.08Cu0.01)8.97S8.03
90.2534.610.080.6434.0831.43101.10(Fe4.29Ni4.50Pd0.02Co0.08Cu0.01)8.90S8.10
100.2234.230.140.5733.0031.2399.40(Fe4.35Ni4.54Pd0.02Co0.08Cu0.02)9.01S8.01
110.1734.960.050.5433.6731.58100.95(Fe4.32Ni4.55Pd0.01Co0.07Cu0.01)8.96S8.03
120.1634.86<0.040.5333.5731.51100.66(Fe4.33Ni4.56Pd0.01Co0.07Cu0.00)8.97S8.03
130.1434.990.060.5333.5431.46100.72(Fe4.32Ni4.57Pd0.01Co0.07Cu0.01)8.98S8.02
140.2735.020.090.5433.4931.43100.84(Fe4.32Ni4.57Pd0.02Co0.07Cu0.01)8.99S8.01
150.2034.550.140.5733.5431.46100.46(Fe4.33Ni4.52Pd0.01Co0.07Cu0.02)8.95S8.04
160.2434.780.120.5333.5731.54100.78(Fe4.33Ni4.54Pd0.02Co0.07Cu0.01)8.97S8.03
170.5534.630.120.5033.6131.78101.19(Fe4.35Ni4.51Pd0.04Co0.06Cu0.01)8.97S8.02
180.6734.190.310.4833.7331.69101.06(Fe4.34Ni4.46Pd0.05Co0.06Cu0.04)8.95S8.05
190.4934.460.120.5033.5431.55100.66(Fe4.34Ni4.51Pd0.04Co0.07Cu0.01)8.97S8.04
200.8033.930.130.5833.4331.71100.58(Fe4.37Ni4.45Pd0.06Co0.08Cu0.02)8.98S8.03
210.3934.060.100.6533.5831.50100.28(Fe4.34Ni4.47Pd0.03Co0.08Cu0.01)8.93S8.06
220.8633.970.070.5833.4931.50100.46(Fe4.35Ni4.46Pd0.06Co0.08Cu0.01)8.96S8.05
230.9333.670.100.6233.4631.63100.41(Fe4.37Ni4.42Pd0.07Co0.08Cu0.01)8.95S8.05
242.2432.540.170.6033.2331.90100.69(Fe4.42Ni4.29Pd0.16Co0.08Cu0.02)8.97S8.02
252.9131.680.470.5532.9431.95100.50(Fe4.45Ni4.20Pd0.21Co0.07Cu0.06)8.99S8.00
262.7931.740.360.6133.0332.02100.55(Fe4.46Ni4.20Pd0.20Co0.08Cu0.04)8.98S8.01
272.8031.450.480.5933.0432.12100.47(Fe4.47Ni4.17Pd0.20Co0.08Cu0.06)8.98S8.02
283.4731.190.300.5933.0132.16100.73(Fe4.48Ni4.14Pd0.25Co0.08Cu0.04)8.99S8.01
293.6431.040.270.5733.3932.06100.97(Fe4.45Ni4.10Pd0.27Co0.07Cu0.03)8.92S8.08
Note. The composition no. 1 corresponds to the point K; the composition no. 29 corresponds to the point K’ (Figure 7).
Table 5. Compositional variations in the crystal of Pd-rich pentlandite (wt.%) along the profile LL’.
No.PdNiCuCoSFeTotalMineral Formulas
14.0529.980.400.9432.7132.07100.14(Fe4.51Ni4.01Pd0.30Co0.13Cu0.05)9.00S8.01
25.3728.900.520.7432.5432.38100.44(Fe4.57Ni3.88Pd0.40Co0.10Cu0.06)9.01S7.99
35.3328.940.370.8032.4832.39100.31(Fe4.57Ni3.89Pd0.40Co0.11Cu0.05)9.02S7.99
45.1129.310.310.7932.7032.16100.37(Fe4.53Ni3.93Pd0.38Co0.11Cu0.04)8.99S8.02
54.5329.920.250.8132.7832.34100.62(Fe4.53Ni3.99Pd0.33Co0.11Cu0.03)8.99S8.00
64.0230.210.440.9632.7432.03100.40(Fe4.49Ni4.03Pd0.30Co0.13Cu0.05)9.00S8.99
73.1030.440.571.0933.0231.87100.09(Fe4.46Ni4.05Pd0.23Co0.14Cu0.07)8.95S8.05
83.6730.800.290.9032.6631.77100.08(Fe4.46Ni4.12Pd0.27Co0.12Cu0.04)9.01S7.99
92.6631.620.181.0232.8731.80100.16(Fe4.44Ni4.20Pd0.20Co0.14Cu0.02)9.00S8.00
103.7330.500.650.8332.9531.85100.50(Fe4.45Ni4.06Pd0.27Co0.11Cu0.08)8.97S8.03
112.9531.370.150.8032.9631.6999.92(Fe4.44Ni4.18Pd0.22Co0.11Cu0.02)8.97S8.04
122.7331.390.490.8233.2131.53100.18(Fe4.40Ni4.17Pd0.20Co0.11Cu0.06)8.94S8.07
132.6531.440.140.8233.1031.5499.69(Fe4.42Ni4.19Pd0.19Co0.11Cu0.02)8.93S8.07
143.5930.600.240.6732.6632.0599.81(Fe4.51Ni4.10Pd0.27Co0.09Cu0.03)9.00S8.01
152.6631.510.460.6432.8432.22100.32(Fe4.50Ni4.18Pd0.19Co0.08Cu0.06)9.01S7.98
161.9432.290.230.6333.1132.06100.25(Fe4.46Ni4.27Pd0.14Co0.08Cu0.03)8.98S8.02
171.1833.060.200.6432.9631.97100.01(Fe4.45Ni4.37Pd0.09Co0.08Cu0.02)9.01S7.98
181.7732.490.200.5332.9431.9599.88(Fe4.46Ni4.31Pd0.13Co0.07Cu0.02)8.99S8.01
191.0733.500.120.5733.3631.82100.44(Fe4.40Ni4.40Pd0.08Co0.07Cu0.01)8.96S8.03
200.1834.300.110.5733.3931.53100.07(Fe4.36Ni4.51Pd0.01Co0.07Cu0.01)8.96S8.04
210.1734.600.100.5433.2531.51100.17(Fe4.35Ni4.55Pd0.01Co0.07Cu0.01)8.99S8.00
220.1334.560.130.5933.4531.50100.34(Fe4.34Ni4.53Pd0.01Co0.08Cu0.02)8.98S8.03
230.2834.320.180.6133.2831.54100.20(Fe4.36Ni4.51Pd0.02Co0.08Cu0.02)9.00S8.01
240.4434.340.170.5333.7531.60100.82(Fe4.33Ni4.48Pd0.03Co0.07Cu0.02)8.93S8.06
250.4834.150.200.5033.6631.31100.28(Fe4.32Ni4.48Pd0.03Co0.07Cu0.02)8.92S8.08
260.3934.040.260.5533.4431.46100.14(Fe4.35Ni4.47Pd0.03Co0.07Cu0.03)8.95S8.05
270.3134.210.320.5633.8131.31100.53(Fe4.30Ni4.47Pd0.02Co0.07Cu0.04)8.90S8.09
280.3434.210.190.5733.7531.20100.27(Fe4.30Ni4.48Pd0.02Co0.07Cu0.02)8.89S8.10
290.5133.960.240.5133.4231.2499.89(Fe4.33Ni4.48Pd0.04Co0.07Cu0.03)8.95S8.06
300.8133.770.290.4933.5931.49100.44(Fe4.34Ni4.43Pd0.06Co0.06Cu0.04)8.93S8.07
311.0932.910.580.4733.5031.0299.57(Fe4.31Ni4.36Pd0.08Co0.06Cu0.07)8.88S8.12
Note. The composition no. 1 corresponds to point L; the composition no. 31 corresponds to point L’ (Figure 7).
Table 6. Spearman’s rank correlation coefficients of Pd-rich pentlandite components in wt.% calculated from the data set containing 277 analyses.
NiFePdCuCoS
Ni-−0.61−0.93−0.48−0.100.72
Fe−0.61-0.530.09−0.09−0.42
Pd−0.930.53-0.320.03−0.74
Cu−0.480.090.32-0.13−0.21
Co−0.10−0.090.030.13-−0.03
S0.72−0.42−0.74−0.21−0.03-
Note: Symbols “-” indicate the unit diagonal. Bold type shows correlation coefficients that are considered significantly nonzero at the 1% level, critical value ρcrit = 0.15.
Table 7. Summary of Pd-bearing pentlandites from various deposits.
Deposit, LocationShapeHost Mineral (s)Parent PhasePd Content, wt.%Distribution Pattern of Pd in the GrainProposed Mechanism of Pd EnrichmentReference
Bushveld, UG-2 (Karee Mine)Granular PnCp ± Po ± PGE-bismuthotellurideISS0.02–1.26EvenNot discussedJunge et al., 2015 [17]
Bushveld, UG-2Granular PnCp ± Po ± Pt-dominant PGMISS0.92–1003 (×10−4)There is no information on the distribution of Pd in individual grains. Variation in Pd content in pentlandite along the section was notedPd partition into Pn during the exsolution of MSS. A high Pd content in the earlier MSS is suggestedOsbahr et al., 2014 [11]
Bushveld, Merensky ReefGranular Pn and flamesPo + Cp ± Cbn ± Py ± Pt-dominant PGMMSS3.61–1750 (×10−4)There is no information on the distribution of Pd in individual grains. Variation in Pd content in pentlandite along the section was notedPd partition into Pn during the exsolution of MSS. A high Pd content in the earlier MSS is suggestedOsbahr et al., 2013 [10]
Bushveld, Merensky ReefGranular PnPoMSS7–600 (×10−4)No informationPd diffused into the Pn from ISS during exsolution of sulfidesGodel et al., 2007 [8]
Bushveld, Merensky Reef (Impala Mine)Granular Pn and flamesPnHigh PnSS0.08–242 (×10−4)Zonal. The core is enriched in Pd, the rim is depletedPeritectic reaction MSS + L = PnSSMansur et al., 2019 [43]
Bushveld, Platreef (Mogalakwena Mine)Granular Pn and flamesPo ± Cp ± PGE-bismuthotellurideMSS0.04–0.07EvenNot discussedJunge et al., 2015 [17]
Bushveld, Platreef (Mogalakwena Mine)Granular Pn and flamesPo ± Cp ± Cbn ± PGE-bismuthotellurideMSS3.1–636 (×10−4)Even in the grain, uneven in the group of grains in the samplePentlandite is destroyed and re-deposited by alteration processes. Pentlandite from the different generations contain various concentrations of PdKlemd et al., 2016 [18]
Klemd et al., 2020 [32]
Bushveld, PlatreefGranular Pn and flamesPo ± Cp ± PGE-bismuthotellurideMSS70–200 (×10−4)EvenHigh Pd/semimetal ratio. Part of Pd binds to Bi and Te. Excess Pd enters in MSSHolwell and McDonald, 2007 [16]
Stillwater, J-M ReefGranular PnPo ± Cp ± Pt-Fe alloyMSS0.7–9.8No informationPd is released from destructing Pd-Pt sulfide by a fluid and enters the newly formed PnLi and Ripley, 2006 [20]
Stillwater, J-M ReefGranular PnPo ± CpMSS0.2–6700 (×10−4)No informationFluid transfer of Pd into Pn from outsideGodel and Barnes, 2008 [9]
Stillwater, West ForkPn grains from crushed samplesPo or CpMSS?0.19–1.36EvenNot discussedCabri et al., 1984 [19]
Norilsk-1, Mt. RudnayaGranular Pn and flamesPo ± CpHigh PnSS0.04–4.62Zonal. The core is enriched in Pd, the rim is depletedPeritectic reaction MSS + L = PnSSBrovchenko et al., 2020 [12]
Norilsk-1Granular PnCbSS + ISS ± MSSISS1.90–3.05UnevenNot discussedDistler et al., 1996 [4]
Norilsk-1Granular PnPnHigh PnSS0.04–0.10EvenPeritectic reaction MSS + L = PnSSMansur et al., 2019 [43]
Norilsk-1, Medvezhiy Creek MinePn grains from crushed samplesPo or CpMSS?0.005–0.03No informationNot discussedCabri et al., 2003 [13]
Talnakh, Mayak MineGranular Pn and lamellae in Cbn and CpCbn ± CpISS0.06–11.26Uneven. One side of the grain is enriched in PdFluid transfer of Pd into Pn from outsideThis paper
TalnakhPn grains from crushed samplesPo or CpMSS?54.5–248 (×10−4)No informationNot discussedCabri et al., 2003 [13]
KharaelakhGranular Pn and flamesPnHigh PnSS55–180 (×10−4)(1) The core is enriched in Pd, the rim is depleted; (2) different Pd content on the contact with Po and CpPeritectic reaction MSS + L = PnSSMansur et al., 2019 [43]
AguablancaGranular Pn and flamesPo ± CpMSS0.5–7 (×10−4)No informationDiffusion Pd from ISSPiña et al., 2012 [42]
JinchuanGranular Pn and flamesPo ± CpMSS0.1–6 (×10−4)EvenPd diffused into the Pn during exsolution of MSSChai et al., 1993 [3]
Sudbury, Creighton MineGranular Pn and flamesPo ± CpMSS0.28–2.7 (×10−4)Zonal. The core is enriched in Pd, the rim is depletedPd diffused into the Pn during exsolution of MSSDare et al., 2010 [15]
KambaldaPn grains from crushed samplesPoMSS0.001–0.5 (×10−4)No informationStress-induced diffusion of Pd through MSS during cooling or metamorphismKeays et al., 1981 [14]
Experiment at 500° CNo informationPoMSS0–12.5UnevenPd diffused into the Pn during exsolution of MSSMakovicky et al., 1986 [44]
Abbreviations: Cbn—cubanite; Cp—chalcopyrite; Pn—pentlandite; Po—pyrrhotite; PGE—platinum group elements; CbSS—cubanite solid solution; High PnSS—high-T pentlandite-like solid solution; ISS—intermediate solid solution; MSS—monosulfide solid solution; L—liquid.
Publisher’s Note: MDPI stays neutral with regard to jurisdictional claims in published maps and institutional affiliations.

