
An Intelligent Rockburst Prediction Model Based on Scorecard Methodology
by
 , and
, and
Honglei Wang
1,2, 
Zhenlei Li
1,2,*,
Dazhao Song
1,2,
Xueqiu He
1,2,3,
Aleksei Sobolev
4 and
Majid Khan
1,2
1
Key Laboratory of Ministry of Education for Efficient Mining and Safety of Metal Mine, University of Science and Technology Beijing, Beijing 100083, China
2
School of Civil and Resources Engineering, University of Science and Technology Beijing, Beijing 100083, China
3
Zhong-an Academy of Safety Engineering, Beijing 100083, China
4
Khabarovsk Federal Research Center of the Far Eastern Branch of Russian Academy of Science, 51 Turgenev Street, 680000 Khabarovsk, Russia
*
Author to whom correspondence should be addressed.
Minerals 2021, 11(11), 1294; https://0-doi-org.brum.beds.ac.uk/10.3390/min11111294
Submission received: 17 October 2021
/
Revised: 17 November 2021
/
Accepted: 18 November 2021
/
Published: 22 November 2021
(This article belongs to the Special Issue Rockburst Mechanism and Its Prevention and Control in Underground Mines)
Abstract
:Rockburst is a serious hazard in underground engineering, and accurate prediction of rockburst risk is challenging. To construct an intelligent prediction model of rockburst risk with interpretability and high accuracy, three binary scorecards predicting different risk levels of rockburst were constructed using ChiMerge, evidence weight theory, and the logistic regression algorithm. An intelligent rockburst prediction model based on scorecard methodology (IRPSC) was obtained by integrating the three scorecards. The effects of hazard sample category weights on the missed alarm rate, false alarm rate, and accuracy of the IRPSC were analyzed. Results show that the accuracy, false alarm rate, and missed alarm rate of the IRPSC for rockburst prediction in riverside hydropower stations are 75%, 12.5%, and 12.5%, respectively. Setting higher hazard sample category weights can reduce the missed alarm rate of IRPSC, but it will lead to a higher false alarm rate. The IRPSC can adaptively adjust the threshold and weight value of the indicator and convert the abstract machine learning model into a tabular form, which overcomes the commonly black box problems of machine learning model, as well as is of great significance to the application of machine learning in rockburst risk prediction.
1. Introduction
Rockburst is a phenomenon caused by mining unloading, in which the internal elasticity of the rock is suddenly released, resulting in bursting, spalling, spraying, and throwing of material [1,2,3]. Rockburst is a very serious hazard that can cause damage to mining equipment, roadway failure, injuries, and seismic activity [4,5]. The study of methods for predicting rockburst is of great importance to underground and mining engineering, and the establishment of effective rockburst prediction models will be of great help to engineering construction [6,7]. However, rockburst is a complex phenomenon, influenced by numerous factors such as rock properties, geological formations, ground stresses, and extraction activities, making rockburst prediction difficult, and effectively predicting rockburst remains a serious challenge [8,9].
In general, rockburst prediction methods can be divided into two categories: the empirical approach and mathematical models, with mathematical models divided into uncertainty theory algorithmic models and machine learning models [8,9]. The empirical approach assesses rockburst risk by analyzing the phenomenon in terms of stress/strength, brittleness, energy, and depth [10,11,12,13,14]. The most outstanding advantages of the empirical approach are simplicity and operability, which have been widely used in the identification of rockburst risk in underground engineering [15,16]. Indicator thresholds are generally determined by experts using the results of data analysis and engineering experience; however, due to the suddenness and complexity of rockburst, the thresholds for rockburst occurrence under different geological conditions are generally different and accurately determining thresholds is difficult. In response to the random and fuzzy nature of the factors affecting rockburst, a series of uncertainty theory algorithms such as rough set theory [1], grey systems [17], attribute identification models [18], the split-source weighting method [19], and the fuzzy comprehensive evaluation method [20] have been used in rockburst rating prediction. However, uncertainty theory algorithms suffer from subjectivity and inconsistency for rockburst prediction [21]. Different models are proposed based on different geological conditions and are highly specific and difficult to apply to multiple projects. The factors affecting rockburst are non-linear, and artificial intelligence algorithms excel at non-linear analysis with high-dimensional data. Artificial neural networks (ANN), support vector machines (SVM), K-nearest neighbors (KNN), classification and regression trees (CART), random forests (RF), and ensemble learning can effectively predict rockburst [22]. Li and Jimenez [23] proposed a method for predicting rockburst by using logistic regression. ANN and improved ANN are the most widely used in rockburst risk prediction. Feng and Wang [24] described a new method for predicting rockburst in underground tunnels based on ANN and adaptive identification. A new improved ANN model was successfully introduced to predict rockburst risk in deep gold mines in South Africa [25]. Machine learning used in rockburst risk prediction generally has a high accuracy. Nevertheless, taking practical engineering problems into consideration, we believe that the proposed model can provide a strong basis for accurate rockburst prediction, as well as assist in understanding and improving the rockburst risk indicator. Furthermore, the proposed model has both high prediction ability and interpretability. In general, machine learning-based models are sensitive to the induced irrelevant features and decrepit to the outliers. Additionally, due to the presence of black box properties in some of the machine learning models, the prediction process is quite complex and has poor interpretability [26].
The scorecard is not only easy to operate but also highly interpretable [27,28,29]. Scorecard modeling theory is a general modeling framework. Logistic regression (LR), SVM, and ANN can be used in the scorecard modeling process, among which logistic regression is the most used scorecard construction algorithm. The scorecard model only requires the scorecard to score the predicted samples and then judge the attributes of the samples according to the total score of the samples. It can not only determine the prediction results, but also directly observe the impact of each feature on the results. The scorecard is a strong interpretability model with a simple and controllable prediction process, as well as the ability to adjust adaptively to the dataset. The scorecard model in a bank lending scenario can measure a customer’s credit risk in the form of a score. The higher the score scored by the scorecard, the higher the chances that the customer is a quality customer and the lower the risk of borrowing [27]. The scorecard model is ideal for use in the financial sector. However, a study on the literature regarding the application of the scorecard model in rockburst risk prediction has not been reported, and further research is needed on the application of the scorecard model in rockburst risk prediction.
In order to build a rockburst prediction model with high accuracy and identify the primary factors affecting the rockburst risk level, an intelligent rockburst prediction model based on scorecard methodology (IRPSC) was constructed using 311 real rockburst cases, and the model was used to predict rockburst cases in riverside hydropower stations to verify the application effect of the IRPSC. Next, the prediction effects of the IRPSC and machine learning models such as LR, CART, RF, and AdaBoost are compared and analyzed [30]. Finally, the influence of sample category weight on the missing alarm rate, false alarm rate, and accuracy of rockburst risk scorecard was studied. The results have important implications for the application of machine learning in rockburst risk prediction, as well as improving the accuracy of rockburst predictions.
2. Methods
2.1. Establishment of the Intelligent Rockburst Risk Prediction Model
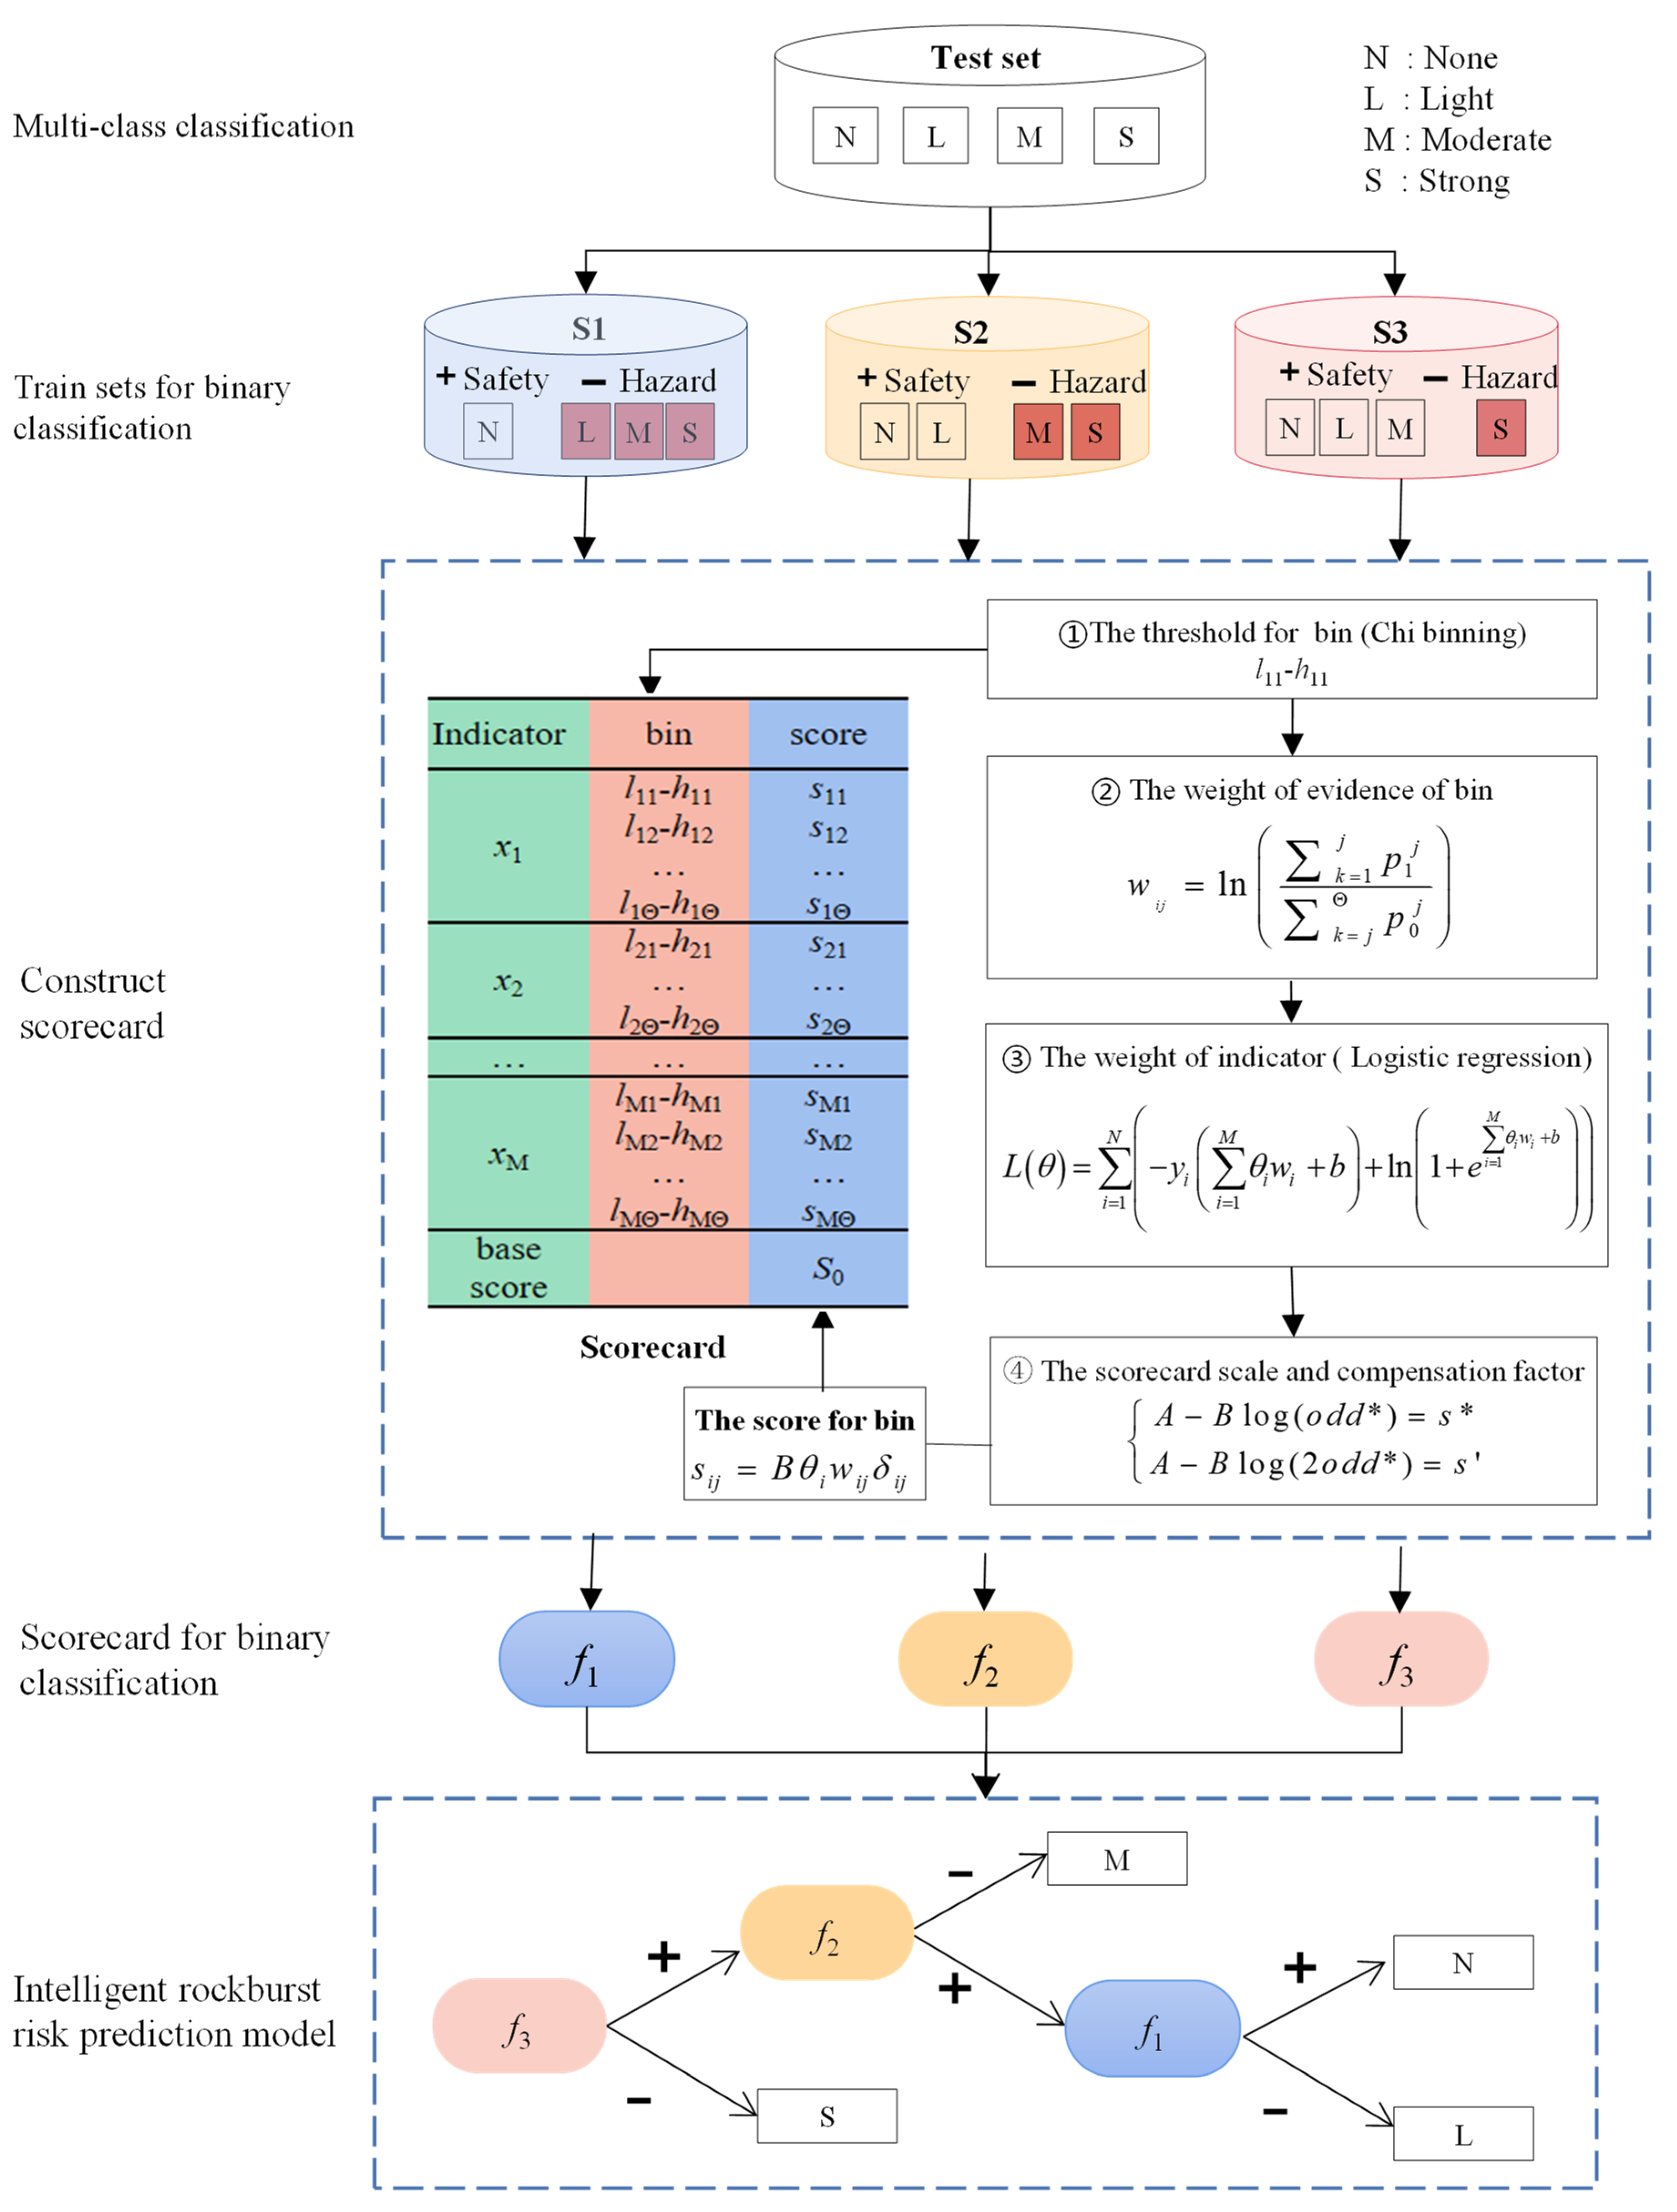
The establishment of the IRPSC consists of three main steps. First, through combining rockburst cases based on risk level, the data sets of different classification tasks are obtained. Then, the scorecards for evaluating different rockburst risk levels were constructed based on the data sets using ChiMerge, weights of evidence (WOE), and LR. Finally, the IRPSC was constructed by integrating the scorecards.
Rockburst risk is generally classified as none, light, moderate, or strong, based on the probability and severity of the rockburst (Figure 1) [30]. Rockburst risk prediction is a multi-classification problem, and one versus one (OVO) and one versus all (OVA) are two commonly used approaches for multi classification problems [31]. Fernández compared OVO and OVA by methods of ad-hoc learning algorithms and concluded that OVO outperformed OVA [32,33]. All sample categories are independent of each other when using the OVO and OVA approaches, but the rockburst risk levels are sequential, i.e., the four levels of none, light, moderate, and strong have increasing levels of danger in that order.
In this paper, the sequence of the rockburst risk is taken into account in the task decomposition. (I) Dataset S1 is based on samples with light, moderate, or strong rockburst risk as the hazard samples, and samples with no rockburst risk are the safety samples. (II) Dataset S2 is based on samples with moderate or strong rockburst risk as the hazard sample, and samples with no or light rockburst risk as the safety sample. (III) Dataset S3 is based on samples with strong rockburst risk as the hazard sample, and samples with no, light or moderate rockburst risk as the safety sample. Rockburst risk scorecard f1, f2, and f3 were constructed using datasets S1, S2, and S3, respectively. This step is the core of the model construction, and the scorecard construction process for rockburst risk prediction is described in detail in Section 2.2.
The IRPSC consists of three scorecards, which are used in turn to predict rockburst cases. (I) If the scorecard f3 predicts the case to be a hazardous sample, the IRPSC predicts the rockburst risk level of strong. (II) If scorecard f3 predicts the case to be a safe sample, and scorecard f2 predicts the case to be a hazardous sample, the IRPSC predicts that the rockburst risk level of medium; (III) If scorecard f3 and f2 predict the case to be a safe sample, and scorecard f1 predicts the case to be a hazardous sample, the IRPSC predicts that the rockburst risk level of light; (IV) If all three scorecards predict the case to be a safe sample, the IRPSC predicts a rockburst risk level of none.
2.2. Construction of the Rockburst Risk Prediction Scorecard
Like the comprehensive index method commonly used for rockburst risk assessment, the rockburst risk scorecard first discretizes each indicator and assigns a score to each bin, and then analyzes the sample qualitatively and quantitatively by calculating the score (Figure 1). The rockburst risk scorecard scores cases as the sum of the sample indicator scores and the base score of the scorecard. Using the scorecard to score the sample, the category of the sample based on the total score of the sample can be determined. Using the scorecard model to predict the rockburst risk of a case not only gives the prediction results, but also directly gives the impact of each indicator on the results [28,34].
The score given by the scorecard to rockburst cases has a linear relationship with the odds of a rockburst case [28,35].
where score denotes the score of the case scored by the scorecard, sij denotes the score of the jth bin of ith indicator, δij is a binary variable, δij = 1 when the value xi of the i-th indicator of the rockburst case satisfies lij < xi < hij, and δij = 0 if the value of the indicator is not within the j-th box. Θ denotes the number of the i-th risk indicator interval, M is the total number of indicators of sample cases. A and B are constants and the constant A is referred to as the compensation factor and the constant B as the scorecard scale. Odds is the ratio of the probability that a case is a safety sample to the probability that it is a hazard sample. The expression for Odds is:
where p denotes the probability that a case is safety samples, and the probability that it is hazard sample is 1 − p.
The construction of a rockburst risk scorecard based on ChiMerge, WOE and a LR requires the conversion of rockburst risk indicators into dimensionless WOE values and the assumption that the WOE values satisfy a logit relationship with the probability p (Figure 1).
where, θi is the weight of the ith indicator, wij is the WOE of the jth bin of ith indicator, b is the model coefficient, determined by the LR model training process.
By combining Equations (1)–(3), the score given by the scorecard to the rockburst case is:
From the above analysis, constructing a dichotomous rockburst risk scorecard consists of four main steps. At first, the threshold value for each indicator bin is obtained by employing ChiMerge that bins each risk indicator. Then, using WOE theory, the weights of evidence are calculated for each bin as represented by wij. The weight of indicators θ is estimated using the maximum likelihood method of the LR model. Finally, the values for the compensation factor A and the scorecard scale B are computed.
2.2.1. Binning of Indicators
The discretization of the indicators using the binning method is the first step in the construction of a rockburst risk scorecard. The binning for indicators has three advantages. (I) The indicators after binning are more robust compared to abnormal data. (II) LR is a generalized linear model with limited expressiveness. After the indicators are discretized into Θ bins, each bin has a separate WOE value, which is equivalent to introducing non-linearity to the model and can improve the expressiveness of the model. (III) Indicator discretization plays a role in simplifying the model and reducing the risk of over-fitting.
ChiMerge is a commonly used supervised binning method proposed by Kerber in 1992 [36], which is used to good effect in the scorecard production process. ChiMerge is a bottom-up data discretization method that combines adjacent bins with minimum χ2 statistic values until a defined stopping criterion is satisfied. In this paper, ChiMerge is used as the discretization method for the risk assessment indicators to obtain the critical values lij, hij for each bin of the risk assessment indicators.
2.2.2. Determination of the Weight of Evidence for Each Bin
The indicators used to predict rockburst risk generally have different physical units, and the values of the different indicators vary significantly and cannot be summed directly; therefore, a characteristic transformation of the indicators into dimensionless indicators is required to produce the rockburst risk scorecard. A conversion of the indicators into WOE values was used to produce the scorecard. The WOE reflects the variability in the proportion of hazard and safety samples in each bin of the indicator [37]. The WOE value wij for the j-th bin of the i-th rockburst risk indicator is [38,39].
where is the hazard sample rate for the j-th bin of the i-th indicator, which represents the ratio of the number of dangerous samples in the j-th bin of the i-th indicator to the total number of dangerous samples in the sample set, and is the safety sample rate for the j-th bin of the i-th indicator.
2.2.3. Determination of Each Weight’s Indicator
Using the maximum likelihood method to estimate the weight values θ for each indicator, the likelihood function of the LR is [40,41]:
where N denotes the total number of the training set {Wi, yi}, yi is the case label, yi∈{0,1}, I = 1,2,...,N.
The log-likelihood function is [40,41]:
where, L(θ) is the logarithmic loss of the model on the sample set, and is also the objective function of the model optimization.
An estimate of the parameter θ is obtained by maximizing L(θ), and solving for the value of the parameter θ is accomplished by transforming it into an optimization problem with the log-likelihood as the objective function. Equation (7) is a continuous convex function of higher order derivability with respect to θ. According to convex optimization theory, numerical optimization algorithms such as gradient descent and Newton’s method can be used to determine the optimal solution. The limited memory Broyden-Fletcher-Goldfarb-Shanno (L-BFGS) is the optimization algorithm used in this article, which is a quasi-Newton method. L-BFGS approximates the Broyden-Fletcher-Goldfarb-Shanno (BFGS) algorithm using a limited amount of computer memory and can commonly get a better solution than the two methods mentioned above with fewer iterations.
2.2.4. Determination of Scorecard Scales and Compensation Factors
To calculate the scorecard scale B and the compensation factor A, we set the expected score for a rockburst case with an odds*, and the expected score for a doubling of the odds*. Then the values of the A and B are calculated as:
where odds* denotes the ratio of the probability that a case is a safety sample, s* is the expected score for a rockburst case with an odds*, and s′ is the expected score doubling of the odds*.
The score for each bin of the scorecard is obtained by substituting the scorecard scale B and the compensation factor A into Equation (4).
2.3. Evaluation of Prediction Effectiveness
A situation where a low risk level case is predicted to be a high risk level in the rockburst risk prediction is called a false alarm, and a situation where a high risk level case is predicted to be a low risk level is called a miss alarm. The accuracy (ACC) is the ratio of the number of samples whose predicted results agree with the actual results to the total number of samples. The false alarm rate (FAR) is defined as the ratio of false alarm cases to the total number of all cases, and the miss alarm rate (MAR) is the ratio of miss alarm cases to the total number of all cases. The ACC, FAR, and MAR of the rockburst risk prediction model can be calculated using the confusion matrix. The confusion matrix for rockburst risk prediction is shown in Table 1.
The multi-classification ACC, FAR, and MAR are calculated as:
2.4. Parameter Setting
We used Python to compile functions for ChiMerge, calculate WOE values, construct rockburst risk scorecards, and IRPSC. The LR was implemented using the Logistic Regression class in scikit-learn-0.23.2.
The rockburst risk indicators were divided into four bins using ChiMerge. In this paper, the expected score is set to S* = 0 when the safety odd* = 1 of the rockburst risk scorecard. That is, when the safety probability of the case is greater than 0.5, the score of the case scored using the rockburst risk scorecard is greater than 0; otherwise, it is less than 0. Therefore, when the score is greater than or equal to 0, the scorecard determines that the sample is a safety sample, otherwise it is a dangerous sample. Set the expected score S′ = 10 when the safety odd* = 2, then the scorecard compensation factor A and scorecard scale B values (calculated using Equation (8)) are 0 and 14.42, respectively.
3. Results
3.1. Rockburst Case Collection and Analysis
A total of 311 real-life rockburst cases were used as the training set, and all cases had one of the rockburst hazard levels of none, light, moderate, or strong, with numbers of 48, 94, 114, and 55, respectively. The rockburst case set was reorganized into case sets S1, S2, and S3 according to the task decomposition method in Section 2.1, and the sample numbers for the three rockburst case sets are shown in Table 2. The ratios of the number of safety and hazard samples in the three rockburst case sets are 0.18, 0.84, and 4.65, respectively, and there is an imbalanced dataset in all the rockburst case sets (Table 2).
Though existing research considers the influence of rock burst factors, this study selects the shear stress σθ, uniaxial compressive strength σc, uniaxial tensile strength σt, stress coefficient σθ/σc, rock brittleness coefficient σc/σt, and elastic energy index Wet as rockburst risk prediction indicators. σθ refers to the σθ around underground opening; σc and σt refer to uniaxial compressive stress and uniaxial tensile stress; σθ/σc is stress concentration factor; σc/σt represent two forms of rock brittleness index; Wet reflects a ratio between the stored elastic strain energy (ϕsp) and the dissipated elastic strain energy (ϕst) in a hysteresis looping test. Table 3 shows the range, mean value, standard deviation and skew of the rockburst risk prediction indicator.
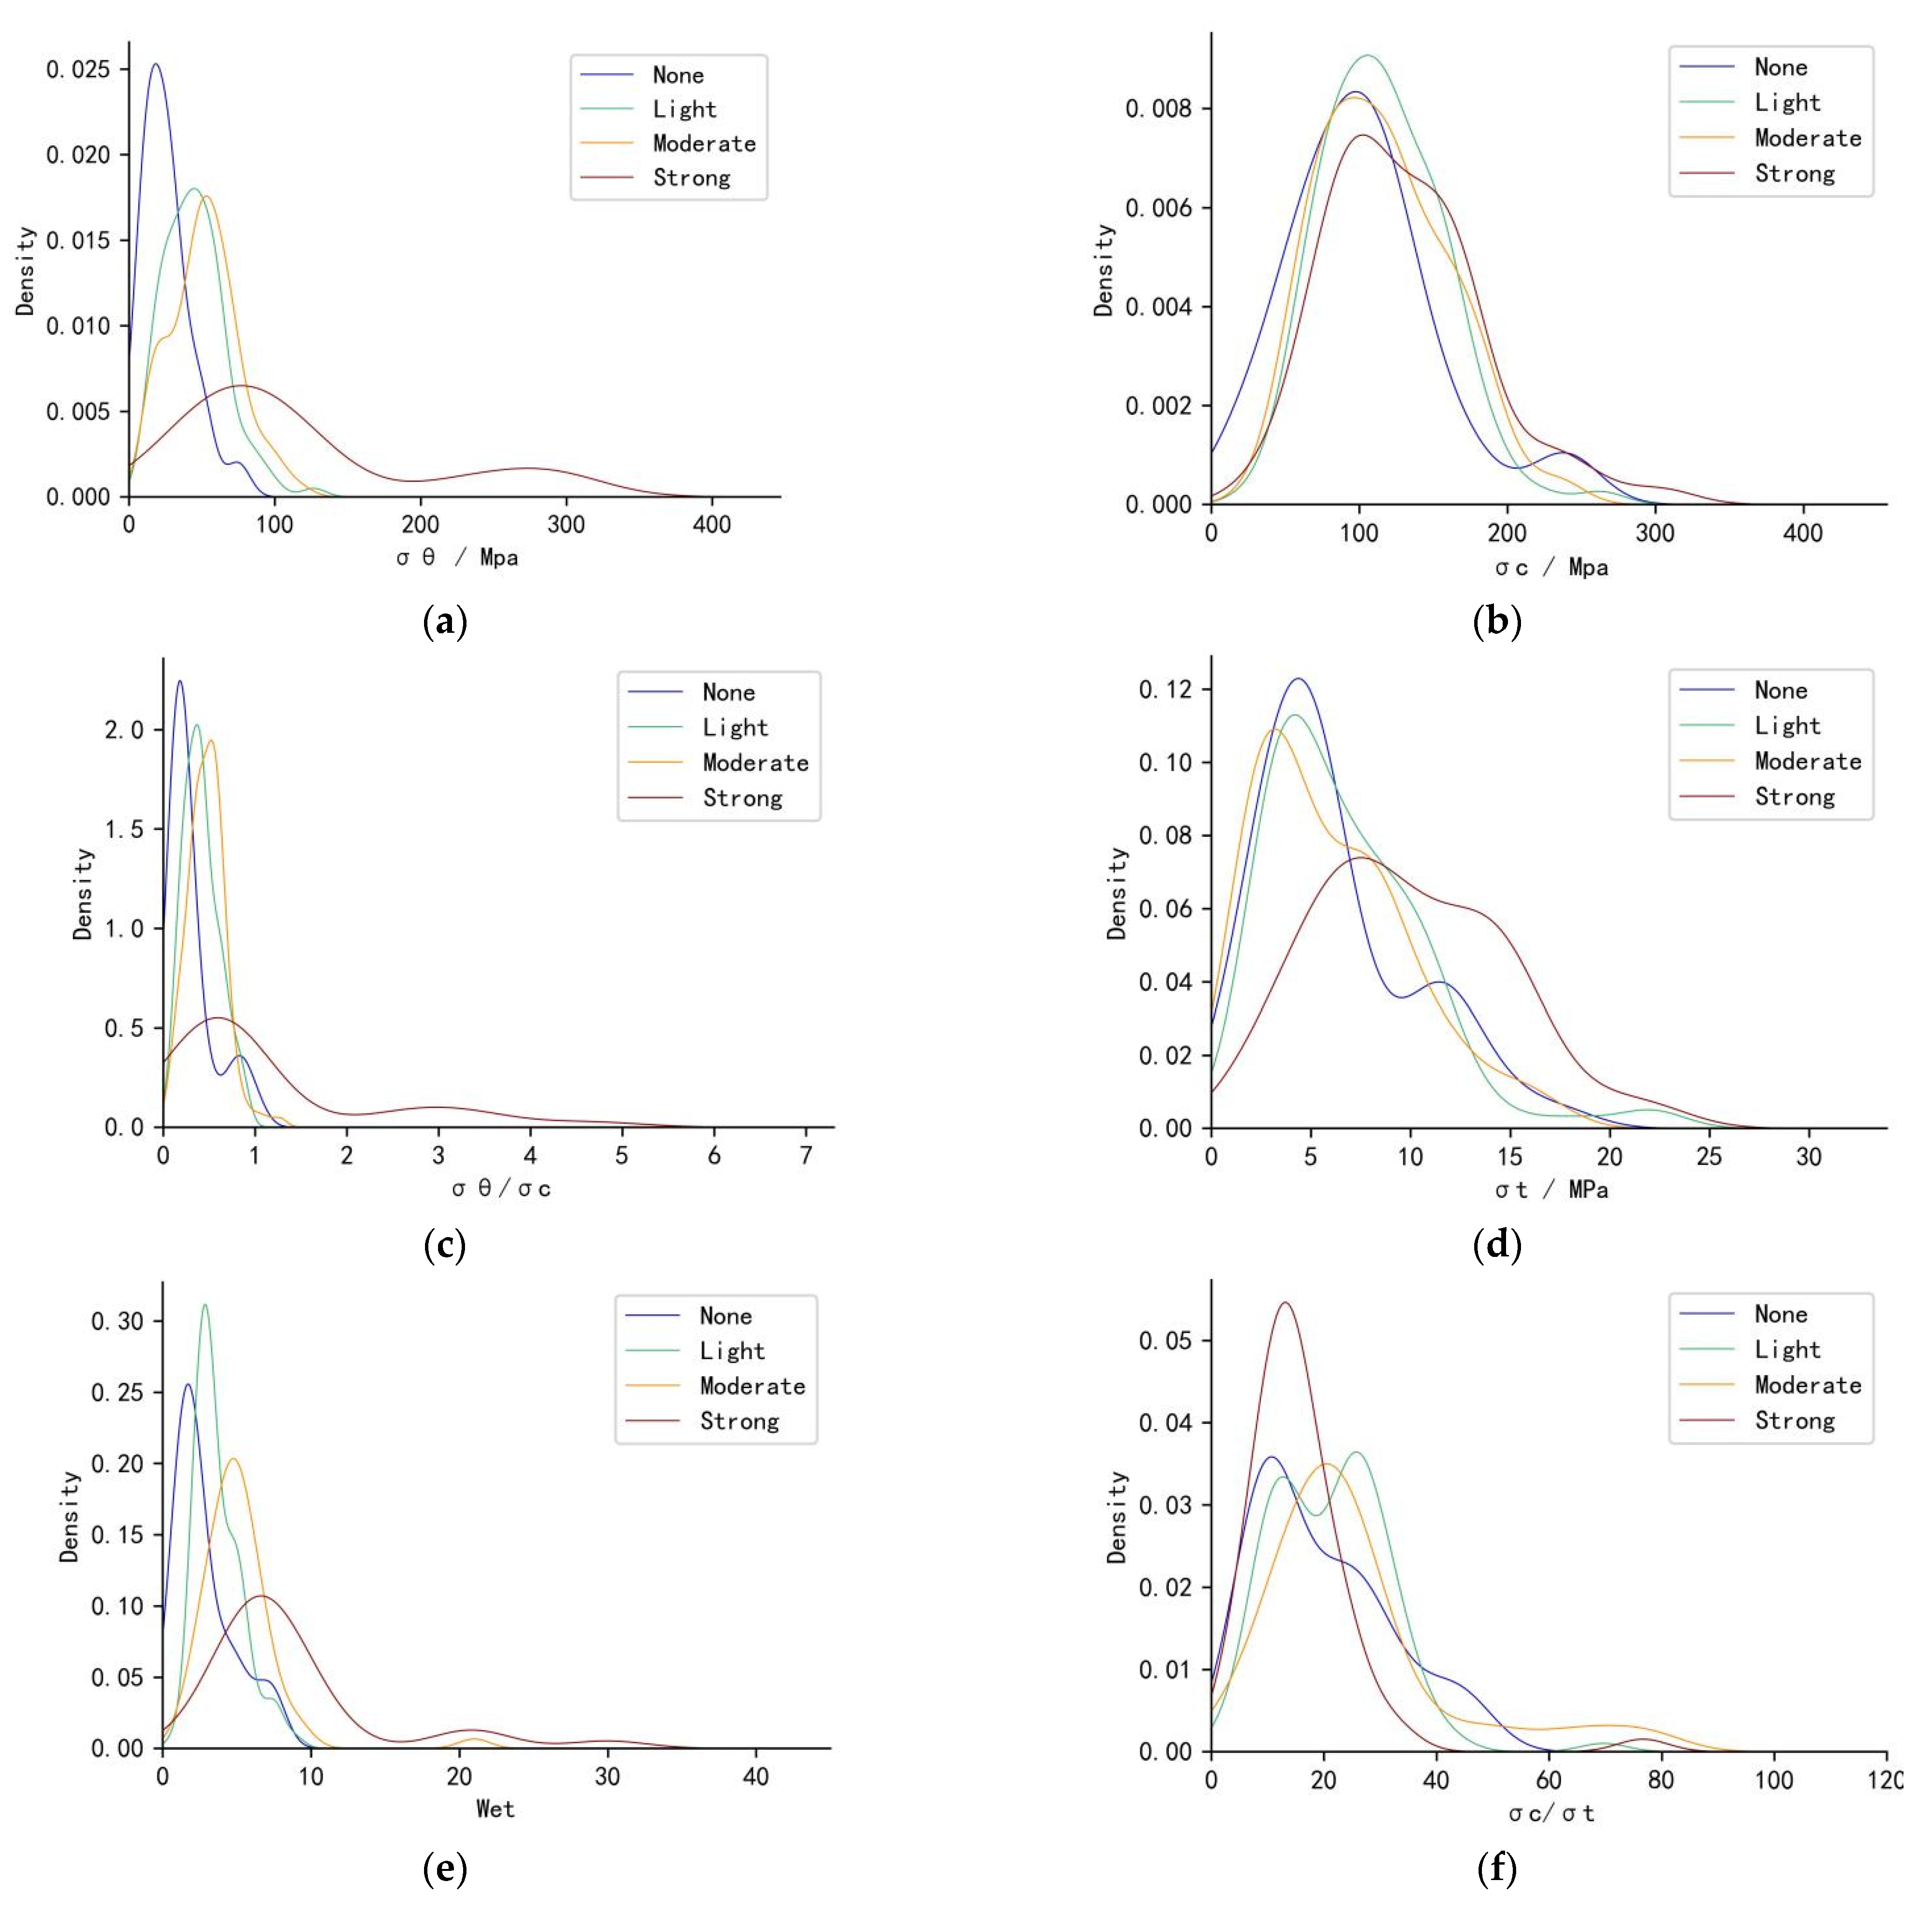
The values of different rockburst risk indicators show significant differences (Table 3). In order to explore the distribution of indicators for cases with different risk levels, the hist function in the matplotlib library of Python was used to plot the probability distribution curves of indicators for rockburst cases with different risk levels (Figure 2).
The probability distribution curves of indicators for different rockburst risk levels have a superimposed component, and the use of only a single rockburst risk indicator will not accurately predict the rockburst risk level (Figure 2). As risk level increases, the probability distribution curve peaks of the σθ, σθ/σc and Wet have a significant tendency to increase, indicating that the rockburst risk increases as these three indicators increase. The probability distribution curves of the σc, σt, and σc/σt vary in an insignificant pattern with increasing rockburst risk. According to the probability distribution curves of the indicators for different risk levels, it can be initially determined that the prediction ability of σθ, σθ/σc and Wet are strong, and the prediction ability of σc, σt and σc/σt are light.
3.2. The Intelligent Rockburst Risk Prediction Model by Using Scorecards
The rockburst risk scorecards f1, f2, and f3 trained on sample sets S1, S2, and S3 respectively were used to construct the IRPSC (Table 4).
In the rockburst risk scorecard, the higher the absolute value of the score of a bin, the more important in the rockburst risk prediction. The top three rockburst risk assessment indicators in absolute scores in the rockburst risk scorecard are the σθ, σθ/σc, and Wet, which are important indicators for predicting rockburst risk levels (Table 3). The highest and lowest absolute values of the scores for Wet are large, and Wet is the most important rockburst risk assessment indicator used in this paper. Reducing the Wet of the rock is the key to reducing rock burst risk level. σc, σt and σc/σt scored low on the scorecard, which is consistent with the results obtained from the probability distribution curves of indicators in Figure 2.
The scorecard f3 is used to identify whether the sample rockburst risk level is a strong hazard, and the scorecard f1 is used to distinguish whether the sample has a rockburst risk. The critical values of Wet in scorecard f1 are 1.5, 2.03, and 2.5, and the critical values of Wet in scorecard f3 are 4.9, 5.2, and 9.3 (Table 5). In addition, the scorecard enables a quantitative analysis of the rockburst risk based on score, because the rockburst risk scorecard was set with an expected score of S* = 0 for Odds* = 1 and a score of S′ = 10 for odd* doubling, the probability of the scorecard judging a rockburst case to be a safety sample is 0.5 when the case is scored as 0, and 0.66 when the score is 10.
The threshold and scores of the bins correspond to the critical values and weights of the indicators. They are obtained based on rockburst cases using ChiMerge, weights of evidence, and LR. Different rockburst cases set will give different thresholds and scores, achieving an adaptive adjustment of the critical values and indicator weights. The rockburst risk scorecard uses the most familiar form of tabular scoring, as does the comprehensive index method currently used in rockburst assessment to determine the rockburst risk by the score. The rockburst risk scorecard allows for easy analysis of predictions based on scores, allowing the user to understand the basis for the predictions. The IRPSC constructed based on rockburst risk scorecards can adaptively adjust the critical values and indicator weights, while the model has strong interpretability, overcoming the problems plaguing machine learning models.
3.3. Application to Riverside Hydropower Station Tunnel Rockburst Case
The IRPSC was applied to eight rockburst cases during the construction of a riverside hydropower station tunnel [4], including two cases with no rockburst risk, three cases with light rockburst risk, two cases with moderate rockburst risk, and two cases with strong rockburst risk. The results of the model predictions are shown in Table 5.
The IRPSC accurately predicted six rockburst cases out of eight during the construction of a riverside hydropower station tunnel (Table 5). Of the two cases that were incorrectly predicted, one strong risk case was predicted as a moderate risk, while one light risk case was predicted as a moderate risk. The real risk level of case 1 is strong, and the model incorrectly predicts a moderate level, because the scorecard f3 identified the case as safety. The σθ/σc of case 1 is 0.58, which is in the 2nd bin and is the primary reason for the incorrect prediction on scorecard f3. Scorecard f2 incorrectly predicts case 2 as a hazard case, resulting in the actual light dangerous case 2 being predicted as a moderate. This is primarily because case 2 has high σθ and Wet values. Case 2 has a σθ value of 91.3 MPa and a score of −10 on scorecard f2, which is the lowest score for this indicator on scorecard f2. The ACC, FAR, and MAR of the IRPSC applied to the riverside hydropower station tunnel is 75%, 12.5%, and 12.5% respectively. The model predicts with a high degree of accuracy; however, the model’s predictions are more skewed towards moderate hazards, meaning that the model is too conservative when analyzing cases with extreme hazards and safety, which is an area for further improvement.
4. Discussion
4.1. Comparison with Machine Learning Models
To analyze the rockburst risk scorecard prediction accuracy, five machine learning models, such as LR, SVM, CART, RF, and AdaBoost [40,41], were trained based on sample sets S1, S2, and S3, respectively. The sample set is divided into five groups, one of which is selected as the test set, and the remaining four groups are used as the training set. The training set samples are used to train each machine learning model separately, and the confusion matrix of the model for the test set is obtained. The above process was repeated five times to sum the corresponding elements of the confusion matrix and obtain the confusion matrix for each machine learning model on the test set. Then, the ACC, FAR, and MAR results were calculated (Table 6).
The ACC of the rockburst risk scorecard f1, f2, and f3 are 89.3%, 75.9%, and 87.5%, respectively (Table 6). Of all the models, RF prediction accuracy was highest on sample sets S1, S2, and S3, with 2.2%, 7.8%, and 0.3% higher prediction accuracy than the rockburst risk scorecard, respectively. The prediction accuracy of the rockburst risk scorecard is higher than that of the SVM and is about the same as that of LR, CART, and AdaBoost. The rockburst risk scorecard can provide accurate predictions. In addition, the IRPSC transforms the abstract machine learning models into a tabular form, making the evaluation process simple and transparent, which overcomes the commonly black box problems of machine learning models. Our results are not only accurate in predicting rockburst risk, but also in identifying the dominant factors contributing to rockburst risk in a way that previous rockburst prediction methods have not been able to accomplish.
The rockburst risk scorecard f1 had a FAR of 50.0% on the test set, and the rockburst risk scorecard f3 had a MAR of 46.6% on the test set. When training LR, the aim is to maximize accuracy, which implicitly assumes that the number of samples in each category in the training set is approximately equal, and that if there is an imbalanced data set, the prediction will be more favorable to the category with the higher number of samples. The ratio of the number of safety samples to the number of danger samples in sample sets S1 and S3 is 0.19 and 4.50, respectively, and there is a serious imbalance in the sample categories, leading to a high FAR for rockburst risk scorecard f1 and a high MAR for f3 (Table 1).
4.2. Effect of Hazard Sample Category Weights on Scorecard Prediction Results
In rockburst risk prediction, the losses from miss alarms are much greater than those from false alarms. False alarms will tend to eliminate rockburst measures and incur additional costs, but miss alarms will cause rockburst accidents, which will not only cause damage to equipment, but also cause injury or death. For example, in 2018, a major rockburst accident occurred in the 1303 working face of Shandong Long Yun Coal Industry Co., Ltd. (Heze, China). The direct economic loss of the accident was 56.398 million. Reducing the MAR of the score of IRPSC is helpful for improving the application of rockburst risk prediction methods. Using a LR model that considers category weights, constructing a rockburst risk scorecard can improve the accuracy of the model’s prediction of a hazard sample by increasing the weight value of the hazard sample. The log-likelihood function of the LR model considering the category weights is:
where C1 and C0 are the category weight values for the hazard and safety samples, respectively. N is the total number of samples, xi, yi is the indicator and label of the ith case in the sample set, and for hazard sample yi = 1 and safety sample yi = 0, p (y = 1|xi) represents the probability that the model predicts that sample is a hazard.
The logistic regression class in sklearn uses the class_weight parameter to set the sample category weights. When setting the safety sample category weight to 1 and the hazard sample category weight to 0.5, 1, 2.5, 5, 7.5, and 10, respectively, the confusion matrix, ACC, FAR, and MAR of the rockburst risk scorecard f3 on the test set are shown in Table 7.
When the safety sample weight is set to 1 and the hazard sample weight is gradually increased from 0.5 to 10, the rockburst risk scorecard’s MAR gradually decreases from 56.9% to 17.2%, the FAR increases from 1.5% to 31.4%, and the ACC decreases from 88.4% to 71.2% (Table 7). It is possible to set larger category weights of hazard sample to reduce the MAR of rockburst risk scorecard, but this will increase the FAR of the scorecard and should be considered when determining the sample category weights.
5. Conclusions
A total of 311 real rockburst cases were used to construct the intelligent rockburst prediction model based on scorecard methodology (IRPSC), and the model was applied to eight rockburst cases that occurred during the construction of a riverside hydropower station tunnel. The effects of category weights on the false alarm rate (FAR), miss alarm rate (MAR), and accuracy (ACC) of the rockburst scorecard were investigated. The following conclusions were obtained.
- (1)
- Using 311 rockburst cases, an IRPSC was constructed based on ChiMerge, WOE, and LR algorithms. The model was applied to predict rockburst cases in the riverside hydropower station tunnel. The IRPSC can identify the main controlling factors affecting the occurrence of rockburst. As for the field application in this work, the Wet was the main indicator affecting the rockburst risk level. The model predicted an ACC, FAR, and MAR of 75%, 12.5% and 12.5%, respectively, demonstrating that the evaluation process of the IRPSC is simple and transparent with high prediction accuracy.
- (2)
- The influence of sample category weight on the predicted FAR and MAR of rock burst was further investigated. Results show that when the safety sample category weight is set to 1 and the hazard sample category weight is gradually increased from 0.5 to 10, the rockburst risk scorecard’s MAR gradually decreases from 56.9% to 17.2%, the FAR increases from 1.5% to 31.4%, and the ACC decreases from 88.4% to 71.2%. Setting higher category hazard sample weights reduces the MAR of the rockburst risk scorecard; however, this will increase the FAR and should be considered when determining sample category weights.
Author Contributions
Conceptualization, H.W. and Z.L.; methodology, Z.L.; software, H.W.; validation, Z.L. and D.S.; investigation, H.W.; resources, Z.L. and D.S.; writing—original draft preparation, H.W.; writing—review and editing, A.S. and M.K.; visualization, A.S.; supervision, X.H.; project administration, D.S.; funding acquisition, Z.L. and X.H. All authors have read and agreed to the published version of the manuscript.
Funding
This research was funded by the Fundamental Research Funds for the Central Universities and the Youth Teacher International Exchange and Growth Program (Ground No. QNXM20210004), and the National Natural Science Foundation of China (Grant Nos. 52011530037, 51904019, 51634001).
Conflicts of Interest
The authors declare no conflict of interest.
References
- Cai, W.; Dou, L.; Si, G.; Cao, A.; He, J.; Liu, S. A principal component analysis/fuzzy comprehensive evaluation model for coal burst liability assessment. Int. J. Rock Mech. Min. Sci. 2016, 81, 62–69. [Google Scholar] [CrossRef]
- He, J.; Dou, L.; Gong, S.; Li, J.; Ma, Z. Rock burst assessment and prediction by dynamic and static stress analysis based on micro-seismic monitoring. Int. J. Rock Mech. Min. 2018, 93, 46–53. [Google Scholar] [CrossRef]
- He, M.; Ren, F.; Liu, D. Rockburst mechanism research and its control. Int. J. Min. Sci. Technol. 2018, 28, 829–837. [Google Scholar] [CrossRef]
- Zhou, J.; Li, X.; Mitri, H.S. Evaluation method of rockburst: State-of-the-art literature review. Tunn. Undergr. Space Technol. 2018, 81, 632–659. [Google Scholar] [CrossRef]
- Tian, R. Research and Application of Rockburst Intensity Classification Prediction Model Based on Machine Learning Algorithms; Inner Mongolia University of Science & Technology: Baotou, China, 2020. [Google Scholar]
- Liang, W.; Zhao, G.; Wu, H.; Dai, B. Risk assessment of rockburst via an extended MABAC method under fuzzy environment. Tunn. Undergr. Space Technol. 2019, 83, 533–544. [Google Scholar] [CrossRef]
- Liang, W.; Sari, A.; Zhao, G.; McKinnon, S.D.; Wu, H. Short-term rockburst risk prediction using ensemble learning methods. Nat. Hazards 2020, 104, 1923–1946. [Google Scholar] [CrossRef]
- Naji, A.M.; Emad, M.Z.; Rehman, H.; Yoo, H. Geological and geomechanical heterogeneity in deep hydropower tunnels: A rock burst failure case study. Tunn. Undergr. Space Technol. 2019, 84, 507–521. [Google Scholar] [CrossRef]
- Wang, C.; Cao, A.; Zhang, C.; Canbulat, I. A New Method to Assess Coal Burst Risks Using Dynamic and Static Loading Analysis. Rock Mech. Rock Eng. 2020, 53, 1113–1128. [Google Scholar] [CrossRef]
- Barton, N.; Lien, R.; Lunde, J. Engineering classification of rock masses for the design of tunnel support. Rock Mech. Rock Eng. 1974, 6, 189–236. [Google Scholar] [CrossRef]
- Hoek, E.; Brown, E.T. Practical estimates of rock mass strength. Int. J. Rock Mech. Min. 1997, 34, 1165–1186. [Google Scholar] [CrossRef]
- Kidybiński, A. Bursting liability indices of coal. Int. J. Rock Mech. Min. Sci. Géoméch. Abstr. 1981, 18, 295–304. [Google Scholar] [CrossRef]
- Mitri, H.S. Assessment of horizontal pillar burst in deep hard rock mines. Int. J. Risk Assess. Manag. 2007, 7, 695. [Google Scholar] [CrossRef]
- Qiu, S.; Feng, X.; Zhang, C.; Wu, W. Development and validation of rockburst vulnerability index (RVI) in deep hard rock tunnels. Chin. J. Rock Mech. Eng. 2011, 30, 1126–1141. [Google Scholar]
- Xia, Y.; Kang, L.; Qi, Q.; Mao, D.; Ren, Y.; Lan, H.; Pan, J. Five indexes of microseismic and their application in rockburst forecastion. J. Chin. Coal Soc. 2010, 35, 2011–2016. [Google Scholar]
- Dou, L.; Chen, T.; Gong, S.; He, H.; Zhang, S. Rockburst hazard determination by using computed tomography technology in deep workface. Saf. Sci. 2012, 50, 736–740. [Google Scholar] [CrossRef]
- Tong, J.; Jiang, Z.; Huang, Y.; Chen, S. Application of Grey System Optimal Theory Model in Forecasting Rockburs. J. North Chin. Inst. Water Conserv. Hydro. Power. 2003, 24, 37–40. [Google Scholar]
- Liu, Z.; Shao, J.; Xu, W.; Meng, Y. Prediction of rockburst classification using the technique of cloud models with attribution weight. Nat. Hazard 2013, 68, 549–568. [Google Scholar] [CrossRef]
- Pan, J.; Qin, Z.; Wang, S.; Xia, Y.; Feng, M. Comprehensive evaluation method of impact risk by weight of different sources. J. Chin. Coal Soc. 2015, 40, 2327–2335. [Google Scholar]
- Cai, W.; Dou, L.; Zhang, M.; Cao, W.; Shi, J.; Feng, L. A fuzzy comprehensive evaluation methodology for rockburst forecasting using microseismic monitoring. Tunn. Undergr. Space Technol. 2018, 80, 232–245. [Google Scholar] [CrossRef]
- Chen, J.; Pu, Y.; Jiang, Y.; Qi, Q.; Wen, Z. Machine learning method for predicting and warning of rockbursts. J. Min. Strata Control Eng. 2020, 3, 13026. [Google Scholar]
- Zhou, J.; Li, X.; Shi, X. Long-term prediction model of rockburst in underground openings using heuristic algorithms and support vector machines. Saf. Sci. 2012, 50, 629–644. [Google Scholar] [CrossRef]
- Li, N.; Jimenez, R. A logistic regression classifier for long-term probabilistic prediction of rockburst hazard. Nat. Hazard 2018, 90, 197–215. [Google Scholar] [CrossRef]
- Feng, X.; Wang, L. Rockburst prediction based on neural networks. T. Nonfer. Soc. 1994, 4, 7–14. [Google Scholar]
- Pu, Y.; Apel, D.B.; Xu, H. Rockburst prediction in kimberlite with unsupervised learning method and support vector classifier. Tunn. Undergr. Space Technol. 2019, 90, 12–18. [Google Scholar] [CrossRef]
- Dong, L.; Wesseloo, J.; Potvin, Y.; Li, X. Discrimination of Mine Seismic Events and Blasts Using the Fisher Classifier, Naive Bayesian Classifier and Logistic Regression. Rock Mech. Rock Eng. 2016, 49, 183–211. [Google Scholar] [CrossRef]
- Xu, W.; Zhang, J. A measure on the credit risk of china’s Municipal Bonds: A scorecard model based on multivariate logistic regression. J. App. Stat. Manag. 2020, 39, 705–720. [Google Scholar]
- Bequé, A.; Coussement, K.; Gayler, R.; Lessmann, S. Approaches for credit scorecard calibration: An empirical analysis. Knowl. Based Syst. 2017, 134, 213–227. [Google Scholar] [CrossRef]
- Liu, T. Credit Score Theory and Application Research; Hunan University: Changsha, China, 2010. [Google Scholar]
- Afraeia, S.; Shahriara, K.; Madania, S.H.; Abbas, A.K. Developing intelligent classification models for rockburst prediction after recognizing significant predictor variables, Section 2: Designing classifiers. Tunn. Undergr. Space Technol. 2019, 84, 522–537. [Google Scholar] [CrossRef]
- Pu, Y.; Apel, D.B.; Wei, C. Applying Machine Learning Approaches to Evaluating Rockburst Liability: A Comparation of Generative and Discriminative Models. Pure Appl. Geophys. 2019, 176, 4503–4517. [Google Scholar] [CrossRef]
- López, V.; Fernández, A.; García, S.; Palade, V.; Herrera, F. An insight into classification with imbalanced data: Empirical results and current trends on using data intrinsic characteristics. Inf. Sci. 2013, 250, 113–141. [Google Scholar] [CrossRef]
- Fernández, A.; García, S.; Galar, M.; Prati, R.C.; Krawczyk, B.; Herrera, F. Learning from Imbalanced Data Sets; Springer: Singapore, 2018. [Google Scholar]
- Linkov, I.; Loney, D.; Cormier, S.; Satterstrom, F.K.; Bridges, T. Weight-of-evidence evaluation in environmental assessment: Review of qualitative and quantitative approaches. Sci. Total Environ. 2009, 407, 5199–5205. [Google Scholar] [CrossRef]
- Teichgräber, U.; Sibbel, R.; Heinrich, A.; Güttler, F. Development of a balanced scorecard as a strategic performance measurement system for clinical radiology as a cost center. Insights Imaging 2021, 12, 69. [Google Scholar] [CrossRef]
- Kerber, R. ChiMerge: Discretization of Numeric Attributes; AAAI’92: Palo Alto, CA, USA, 1992; pp. 123–128. [Google Scholar]
- Hardy, A.; Benford, D.; Halldorsson, T.; Jeger, M.J.; Knutsen, H.K.; More, S.; Naegeli, H.; Noteborn, H.; Ockleford, C.; Ricci, A.; et al. Guidance on the use of the weight of evidence approach in scientific assessments. Efsa. J. 2017, 15, e04971. [Google Scholar]
- Weed, D.L. Weight of Evidence: A Review of Concept and Methods. Risk Anal. 2005, 25, 1545–1557. [Google Scholar] [CrossRef]
- Chen, J.; Chen, S.; Fu, R.; Wang, C.; Li, D.; Jiang, H.; Zhao, J.; Wang, L.; Peng, Y.; Mei, Y. Simulation of water hyacinth growth area based on multi-source geographic information data: An integrated method of WOE and AHP. Ecol. Indic. 2021, 125, 107574. [Google Scholar] [CrossRef]
- Li, H. Statistical Learning Methods; Tsinghua University Press: Beijing, China, 2012. [Google Scholar]
- Zhou, Z. Machine Learning; Tsinghua University Press: Beijing, China, 2016. [Google Scholar]
Figure 1.
The approach for building the intelligent rockburst prediction model based on scorecard methodology (IRPSC). *: the except odds and score.
Figure 1.
The approach for building the intelligent rockburst prediction model based on scorecard methodology (IRPSC). *: the except odds and score.

Figure 2.
The probability distribution curves of indicators for rockburst cases with varying risk levels. (a) Probability density curves of indicators σθ of rockburst cases for different hazard classes. (b) Probability density curves of indicators σc of rockburst cases for different hazard classes. (c) Probability density curves of indicators σθ/σc of rockburst cases for different hazard classes. (d) Probability density curves of indicators σt of rockburst cases for different hazard classes. (e) Probability density curves of indicators Wet of rockburst cases for different hazard classes. (f) Probability density curves of indicators σc/σt of rockburst cases for different hazard classes.


Table 1.
The confusion matrix for rockburst risk prediction model. n: the number of case.
| Actual Risk Level | Prediction Risk Level | |||
|---|---|---|---|---|
| None | Light | Moderate | Strong | |
| None | n11 | n12 | n13 | n14 |
| Light | n21 | n22 | n23 | n24 |
| Moderate | n31 | n32 | n33 | n34 |
| Strong | n41 | n42 | n43 | n44 |
Table 2.
The sample numbers of the data sets for rockburst risk scorecard.
| Data Set | Safety Samples | Risk Samples | Ratios of Safety and Hazard Samples |
|---|---|---|---|
| S1 | 48 | 263 | 0.18 |
| S2 | 142 | 169 | 0.84 |
| S3 | 256 | 55 | 4.65 |
Table 3.
The range, mean value, standard deviation and skew of the rockburst risk prediction indicator.
Table 3.
The range, mean value, standard deviation and skew of the rockburst risk prediction indicator.
| Parameter | Range | Mean | Standard Deviation | Skew |
|---|---|---|---|---|
| σθ/MPa | 2.6–297 | 57.53 | 49.40 | 2.99 |
| σc/MPa | 20–304 | 116.46 | 46.08 | 0.71 |
| σt/MPa | 0.4–22.6 | 7.02 | 4.30 | 1.00 |
| σθ/σc | 0.05–4.87 | 0.55 | 0.60 | 4.31 |
| σc/σt | 0.15–80 | 21.53 | 13.51 | 1.91 |
| Wet | 0.81–30 | 5.02 | 3.76 | 3.48 |
Table 4.
The rockburst risk scorecards f1, f2 and f3, which trained on sample sets S1, S2, and S3, respectively.
Table 4.
The rockburst risk scorecards f1, f2 and f3, which trained on sample sets S1, S2, and S3, respectively.
| Indicator | Bin | f1 | f2 | f3 | |||||||||
|---|---|---|---|---|---|---|---|---|---|---|---|---|---|
| θ | Range | WOE | Score | θ | Range | WOE | Score | θ | Range | WOE | Score | ||
| σθ/MPa | 1 | 0.32 | <13.7 | −4.88 | 23 | 0.30 | <13.7 | −5.14 | 22 | 0.32 | <48.0 | −2.23 | 10 |
| 2 | 13.7–24.0 | −1.59 | 7 | 13.7–46.06 | −1.15 | 5 | 48.0–73.2 | −0.09 | 0 | ||||
| 3 | 24.0–38.25 | −0.59 | 3 | 46.06–62.1 | 0.44 | −2 | 73.2–123.61 | 1.93 | −9 | ||||
| 4 | >38.25 | 1.67 | −8 | >62.1 | 2.24 | −10 | >123.61 | 5.54 | −26 | ||||
| σc/MPa | 1 | 0.17 | <61.1 | 2.44 | 6 | −0.08 | <112.0 | −0.74 | −1 | −0.07 | <83.78 | −1.95 | −2 |
| 2 | 61.1–135.07 | −0.07 | 0 | 112.0–115.0 | 0.16 | 0 | 83.78–112.0 | −0.45 | 0 | ||||
| 3 | 135.0–190.8 | 1.62 | −4 | 115.0–122.4 | 0.27 | 0 | 112.0–135.0 | 0.19 | 0 | ||||
| 4 | >190.85 | 2.77 | −7 | >122.47 | 1.04 | 1 | >135.07 | 1.29 | 1 | ||||
| σt/MPa | 1 | −0.26 | <4.7 | −1.04 | −4 | −0.30 | <2.88 | −1.67 | −7 | 0.39 | <5.0 | −1.95 | 11 |
| 2 | 4.7–6.0 | −0.32 | −1 | 2.88–6.7 | −0.60 | −3 | 5.0–10.51 | 0.12 | −1 | ||||
| 3 | 6.0–10.51 | 0.88 | 3 | 6.7–7.31 | 0.43 | 2 | 10.51–13.0 | 1.47 | −8 | ||||
| 4 | >10.51 | 1.47 | 6 | >7.31 | 1.04 | 5 | >13.0 | 2.98 | −17 | ||||
| σθ/σc | 1 | 0.70 | <0.23 | −1.99 | 20 | 0.26 | < 0.31 | −1.74 | 6 | 0.30 | <0.23 | −2.93 | 13 |
| 2 | 0.23–0.31 | −0.54 | 5 | 0.31–0.465 | −0.29 | 1 | 0.23–0.63 | −0.75 | 3 | ||||
| 3 | 0.31–0.74 | 1.14 | −12 | 0.465-0.55 | 0.74 | −3 | 0.63–1.03 | 1.54 | −7 | ||||
| 4 | >0.74 | 2.08 | −21 | > 0.55 | 1.42 | −5 | >1.025 | 4.44 | −19 | ||||
| σc/σt | 1 | 0.35 | <6.3 | −2.80 | 14 | 0.02 | <6.3 | −2.50 | 1 | 0.60 | <6.3 | −1.95 | 7 |
| 2 | 6.3–11.28 | −1.74 | 9 | 6.3–10.11 | −2.17 | 1 | 6.3–10.11 | −1.69 | 5 | ||||
| 3 | 11.28–22.9 | 0.03 | 0 | 10.11–22.9 | −0.20 | 0 | 10.11–17.52 | −0.15 | 1 | ||||
| 4 | >22.9 | 0.93 | −5 | >22.9 | 0.77 | 0 | >17.52 | 0.49 | −4 | ||||
| Wet | 1 | 0.72 | <1.5 | −4.47 | 46 | 0.57 | <2.87 | −2.50 | 21 | 0.53 | <4.9 | −2.42 | 18 |
| 2 | 1.5–2.03 | −2.86 | 30 | 2.87–4.9 | −0.45 | 4 | 4.9–5.2 | −0.56 | 4 | ||||
| 3 | 2.03–2.5 | −1.40 | 15 | 4.9–7.8 | 1.43 | −12 | 5.2–9.3 | 1.17 | −9 | ||||
| 4 | >2.5 | 1.04 | −11 | >7.8 | 4.26 | −35 | >9.3 | 4.85 | −37 | ||||
| Base score | −31 | −3 | 22 | ||||||||||
Table 5.
The IRPSC predicts the process and prediction results of rockburst cases during the construction of a riverside hydropower station tunnel.
Table 5.
The IRPSC predicts the process and prediction results of rockburst cases during the construction of a riverside hydropower station tunnel.
| Case | Indicator | σθ/MPa | σc/MPa | σt/MPa | σθ/σc | σc/σt | Wet | Total Score | Scorecard Predicted Results | IRPSC Prediction Results | Actual Rockburst Risk Level |
|---|---|---|---|---|---|---|---|---|---|---|---|
| 1 | value | 91.23 | 157.63 | 11.96 | 0.58 | 13.18 | 6.27 | Moderate | Strong | ||
| f1 score | −8 | −4 | 6 | −12 | 0 | −11 | −60 | hazard | |||
| f2 score | −10 | 1 | 5 | −5 | 0 | −12 | −24 | hazard | |||
| f3 score | −9 | 1 | −8 | 3 | 1 | −9 | 1 | safety | |||
| 2 | value | 66.77 | 148.48 | 8.47 | 0.45 | 17.53 | 5.08 | - | Moderate | Light | |
| f1 score | −8 | −4 | 3 | −12 | 0 | −11 | −63 | hazard | |||
| f2 score | −10 | 1 | 5 | 1 | 0 | −12 | −18 | hazard | |||
| f3 score | 0 | 1 | -1 | 3 | -4 | 4 | 25 | safety | |||
| 3 | value | 51.5 | 132.05 | 6.33 | 0.39 | 20.86 | 4.63 | Moderate | Moderate | ||
| f1 score | −8 | 0 | 3 | −12 | 0 | −11 | −59 | hazard | |||
| f2 score | −2 | 1 | −3 | 1 | 0 | 4 | −2 | hazard | |||
| f3 score | 0 | 0 | −1 | 3 | −4 | 18 | 38 | safety | |||
| 4 | value | 35.82 | 127.93 | 4.43 | 0.28 | 28.9 | 3.67 | Light | Light | ||
| f1 score | 3 | 0 | −4 | 5 | −5 | −11 | −43 | hazard | |||
| f2 score | 5 | 1 | −3 | 6 | 0 | 4 | 10 | safety | |||
| f3 score | 10 | 0 | 11 | 3 | -4 | 18 | 60 | safety | |||
| 5 | value | 21.5 | 107.52 | 2.98 | 0.2 | 36.04 | 2.29 | None | None | ||
| f1 score | 7 | 0 | −4 | 20 | −5 | 15 | 2 | safety | |||
| f2 score | 5 | −1 | −3 | 6 | 0 | 21 | 25 | safety | |||
| f3 score | 10 | 0 | 11 | 13 | −4 | 18 | 70 | safety | |||
| 6 | value | 18.32 | 96.41 | 2.01 | 0.19 | 47.93 | 1.87 | None | None | ||
| f1 score | 7 | 0 | −4 | 20 | −5 | 30 | 17 | safety | |||
| f2 score | 5 | −1 | −7 | 6 | 0 | 21 | 21 | safety | |||
| f3 score | 10 | 0 | 11 | 13 | −4 | 18 | 70 | safety | |||
| 7 | value | 110.3 | 167.19 | 12.67 | 0.66 | 13.2 | 6.83 | Strong | Strong | ||
| f1 score | −8 | −4 | 6 | −12 | 0 | −11 | −60 | hazard | |||
| f2 score | −10 | 1 | 5 | −5 | 0 | −12 | −24 | hazard | |||
| f3 score | −9 | 1 | −8 | −7 | 1 | −9 | −9 | hazard | |||
| 8 | value | 26.06 | 118.46 | 3.51 | 0.22 | 33.75 | 2.89 | Light | Light | ||
| f1 score | 3 | 0 | −4 | 20 | −5 | −11 | −28 | hazard | |||
| f2 score | 5 | 0 | −3 | 6 | 0 | 4 | 9 | safety | |||
| f3 score | 10 | 0 | 11 | 13 | −4 | 18 | 70 | safety |
Table 6.
Confusion matrix, accuracy (ACC), false alarm rate (FAR) and miss alarm rate (MAR) of five-fold cross-validation.
Table 6.
Confusion matrix, accuracy (ACC), false alarm rate (FAR) and miss alarm rate (MAR) of five-fold cross-validation.
| Data Set | Model | TP | FN | FP | TN | ACC | FAR | MAR |
|---|---|---|---|---|---|---|---|---|
| S1 | SCM | 25 | 25 | 9 | 260 | 89.3% | 50.0% | 3.3% |
| LR | 15 | 35 | 14 | 255 | 84.6% | 70.0% | 5.2% | |
| SVM | 7 | 43 | 6 | 263 | 84.6% | 86.0% | 2.2% | |
| CART | 29 | 21 | 12 | 257 | 89.7% | 42.0% | 4.5% | |
| RF | 32 | 18 | 9 | 260 | 91.5% | 36.0% | 3.3% | |
| AdaBoost | 29 | 21 | 11 | 258 | 90.0% | 42.0% | 4.1% | |
| S2 | SCM | 109 | 37 | 40 | 133 | 75.9% | 25.3% | 23.1% |
| LR | 113 | 33 | 41 | 132 | 76.8% | 22.6% | 23.7% | |
| SVM | 113 | 33 | 46 | 127 | 75.2% | 22.6% | 26.6% | |
| CART | 109 | 37 | 45 | 128 | 74.3% | 25.3% | 26.0% | |
| RF | 115 | 31 | 21 | 152 | 83.7% | 21.2% | 12.1% | |
| AdaBoost | 109 | 37 | 30 | 143 | 79.0% | 25.3% | 17.3% | |
| S3 | SCM | 248 | 13 | 27 | 31 | 87.5% | 5.0% | 46.6% |
| LR | 253 | 8 | 31 | 27 | 87.8% | 3.1% | 53.4% | |
| SVM | 258 | 3 | 39 | 19 | 86.8% | 1.1% | 67.2% | |
| CART | 233 | 28 | 25 | 33 | 83.4% | 10.7% | 43.1% | |
| RF | 248 | 13 | 26 | 32 | 87.8% | 5.0% | 44.8% | |
| AdaBoost | 238 | 23 | 29 | 29 | 83.7% | 8.8% | 50.0% |
Note: TP is true positive and means the number of positive cases predicted as positive; FN is false negative and indicates the number of positive cases predicted as negative classes; FP is false positive and represents the number of negative cases predicted as positive; and TN is true negative and means the number of negative cases predicted as negative classes.
Table 7.
ACC, FAR and MAR of the scorecard f3 with different category weighted on the test set.
| Category Weight | TP | FN | FP | TN | ACC | MAR | FAR |
|---|---|---|---|---|---|---|---|
| 0.5 | 257 | 4 | 33 | 25 | 88.4% | 56.9% | 1.5% |
| 1 | 248 | 13 | 27 | 31 | 87.5% | 46.6% | 5.0% |
| 2.5 | 232 | 29 | 18 | 40 | 85.3% | 31.0% | 11.1% |
| 5 | 206 | 55 | 14 | 44 | 78.4% | 24.1% | 21.1% |
| 7.5 | 192 | 69 | 13 | 45 | 74.3% | 22.4% | 26.4% |
| 10 | 179 | 82 | 10 | 48 | 71.2% | 17.2% | 31.4% |
Publisher’s Note: MDPI stays neutral with regard to jurisdictional claims in published maps and institutional affiliations. |
© 2021 by the authors. Licensee MDPI, Basel, Switzerland. This article is an open access article distributed under the terms and conditions of the Creative Commons Attribution (CC BY) license (https://creativecommons.org/licenses/by/4.0/).
Share and Cite
MDPI and ACS Style
Wang, H.; Li, Z.; Song, D.; He, X.; Sobolev, A.; Khan, M. An Intelligent Rockburst Prediction Model Based on Scorecard Methodology. Minerals 2021, 11, 1294. https://0-doi-org.brum.beds.ac.uk/10.3390/min11111294
AMA Style
Wang H, Li Z, Song D, He X, Sobolev A, Khan M. An Intelligent Rockburst Prediction Model Based on Scorecard Methodology. Minerals. 2021; 11(11):1294. https://0-doi-org.brum.beds.ac.uk/10.3390/min11111294
Chicago/Turabian StyleWang, Honglei, Zhenlei Li, Dazhao Song, Xueqiu He, Aleksei Sobolev, and Majid Khan. 2021. "An Intelligent Rockburst Prediction Model Based on Scorecard Methodology" Minerals 11, no. 11: 1294. https://0-doi-org.brum.beds.ac.uk/10.3390/min11111294
Note that from the first issue of 2016, this journal uses article numbers instead of page numbers. See further details here.