Article

VIS-NIR/SWIR Spectral Properties of H2O Ice Depending on Particle Size and Surface Temperature

1
German Aerospace Center (DLR), Institute of Planetary Research, 12489 Berlin, Germany
2
Institute for Space Astrophysics and Planetology (IAPS), National Institute for Astrophysics (INAF), 00133 Rome, Italy
3
Univ. Grenoble Alpes, CNRS, IPAG, 38000 Grenoble, France
*
Author to whom correspondence should be addressed.
Submission received: 17 September 2021 / Revised: 14 November 2021 / Accepted: 23 November 2021 / Published: 27 November 2021
(This article belongs to the Special Issue Ocean Worlds Mineralogy)

Abstract

:
Laboratory measurements were performed to study the spectral signature of H2O ice between 0.4 and 4.2 µm depending on varying temperatures between 70 and 220 K. Spectral parameters of samples with particle sizes up to ~1360 µm, particle size mixtures, and different particle shapes were analyzed. The band depth (BD) of the major H2O-ice absorptions at 1.04, 1.25, 1.5, and 2 µm offers an excellent indicator for varying particle sizes in pure H2O ice. The spectral changes due to temperature rather, but not exclusively, affect the H2O-ice absorptions located at 1.31, 1.57, and 1.65 µm and the Fresnel reflection peaks at 3.1 and 3.2 µm, which strongly weaken with increasing temperature. As the BDs of the H2O-ice absorptions at 1.31, 1.57, and 1.65 µm increase, the band centers (BCs) of the H2O-ice absorptions at 1.25 and 1.5 µm slightly shift to shorter wavelengths. However, the BCs of the strong H2O-ice absorptions can also be affected by saturation in the case of large particles. The collected spectra provide a useful spectral library for future investigations of icy satellites such as Ganymede and Callisto, the major targets of ESA’s JUICE mission.

1. Introduction and Motivation

H2O ice is among the dominant chemical compounds on the surfaces of satellites in the outer solar system. Its varying abundance as well as its physical properties such as particle size and crystallinity are important indicators for understanding the geological and microphysical evolution of the icy satellites’ surfaces, including how their environment influences the surface properties. Particularly, the surfaces of the Jovian satellites Ganymede and Callisto, the major targets of the upcoming JUICE mission [1], were found to be covered by a large range of H2O-ice particle sizes and different phases of crystallinity (amorphous and crystalline). The properties vary on both satellites depending on geographic latitude and point to a potential relationship with the local surface temperature [2,3,4] and/or sputtering-induced H2O-ice enrichment [5]. However, major changes in the spectral signature of H2O ice only due to temperature have also been previously reported [6,7,8] and may add up to spectral effects related to variations in particle size and crystallinity. Therefore, an accurate characterization of how surface temperature affects the H2O-ice spectral signatures in association with varying particle sizes is essential to disentangle both effects and to avoid any misinterpretation of icy surface properties. This would in particular enable one to directly compare the particle sizes of geological structures characterized by different surface temperatures, on the same satellite and between different icy satellites.
So far, modelled H2O-ice spectra have mostly been used to estimate or quantify the physical H2O-ice parameters. However, these models are based on optical constants derived from transmission spectra [6,7,8], and they need to assume the scattering properties of particles (single-scattering albedo and particle phase function) and their dependencies on particle size, shape, and wavelength. The single-scattering albedo is estimated from optical constants using various simplified models of the scattering of a single particle, but it is recognized that these different models lead to wide divergences in particle size and that one of the most-used versions of the Hapke ‘equivalent slab’ model [9] is known to be inapplicable, where the imaginary index is large. Even its improved version [10], although providing improvement in strong absorptions, still has difficulties to fit the shape of the Fresnel reflection peak of H2O ice at 3.1 µm in some particle size ranges and, on the other hand, leads to a factor of 2.5 overestimation of the particle size (e.g., see Figure 1 in the study of [11]). In addition, no simple model is able to correctly predict the wavelength-dependent particle phase function as function of particle size and shape, despite attempts to model it empirically using sets of exact Monte Carlo calculations [12]. Therefore, it is generally assumed to be constant and fully independent of all these parameters. All these assumptions can be critical to correctly simulate spectra, particularly in the case of large H2O-ice particles (>500 µm in diameter), as expected in the equatorial regions of Ganymede and Callisto, for which indeed the modelled spectra often have difficulties to match the H2O-ice signature, particularly, where absorptions start to saturate [4].
In order to evaluate in detail how variations in particle size and surface temperature together influence the spectral H2O-ice signature, we measured H2O-ice samples with particle sizes ranging between ~70 and ~1600 µm in the 0.4–4.2 µm wavelength range at temperatures between 70 and 150 K (and 220 K, for selected cases)—the expected temperature range occurring on the icy Galilean satellites [13]. Since these spectra were measured in reflectance, they provide the opportunity to directly compare the results to spectral remote sensing data sets of icy satellites. In particular, we investigated: (1) how the spectral signature of H2O-ice changes with particle size in the above mentioned size range; (2) how the spectrum of a specific particle size changes with temperature between 70 and 150–220 K, (3) including if there are recognizable differences when the sample is cooled or heated; further, (4) how the spectral signature changes with different particle shapes; and (5) how the relative abundances of small and large particles influence the spectral signature in particle size mixtures.

2. Experiment Procedure

2.1. Sample Preparation

Samples of five different particle sizes (70 ± 30, 300 ± 100, 680 ± 120, 1060 ± 60 and 1360 ± 240 µm) were prepared by spraying spherical water droplets into liquid N2 or crushing and/or sieving the ice in a freezer (Figure 1a–f). H2O-ice particles of ~300 µm were produced with the two methods in order to compare spectra of spherical and irregular shaped particles. Spherical ice particles 70 ± 30 µm were prepared with the setup for the production of icy planetary analogs—B (SPIPA-B), made of a peristatic pump and an ultrasonic nebulizer [14]. This setup allows for producing in a controlled and reproducible way spherical particles of water ice of mean diameter of 67 ± 31 µm, as measured by cryo-scanning electron microscopy. Larger spherical particles were produced with a garden sprayer, and the particles crystallized in liquid nitrogen were sieved using 200 and 400 µm sieves. Except for the SPIPA-B particles, the size of all other particles was selected and controlled by sieving in the freezer using sieves for particles of 200, 400, 560, 800, 1000, 1120, and 1600 µm in size, followed by a washing of the samples with liquid nitrogen to remove the remaining smaller ice particles (which otherwise stick to the larger ice grains). In addition, three mixtures of ~70 µm and ~1060 µm particles were prepared, with mass mixing ratios of 27%/73%, 52%/48%, and 77%/23% measured during the preparation (Figure 1g,h). These mixtures were made by weighting each type of H2O-ice particles in separate aluminum bottles cooled with liquid nitrogen and mixing them in a single bottle put on a vortex mixer (two times during 10 s) to homogenize the mixture. To avoid the metamorphization (change of size/shape) of the ice particles after their crystallization and before their measurements, all bottles, sieves, and other tools used to prepare the samples were filled and thus regularly cooled with liquid nitrogen and manipulated at the bottom of the freezer (dimensions: H/W/D 90.5/137.9/78.7 cm). The freezer temperature was set at a temperature of −30 °C, which was continuously monitored. As the liquid nitrogen evaporates with time, the bottles are manually refilled with liquid nitrogen, approximately every 5 min.
After production, the H2O-ice particles were poured in a cylindrical aluminum sample holder of 48 mm in diameter and 10 mm deep (for samples containing 70 ± 30, 300 ± 100, or 680 ± 120 µm particles) or 20 mm deep (for samples containing 1060 ± 60 or 1360 ± 240 µm particles) in order to provide sufficient optical thickness for reflectance measurements. Moreover, the bottom of the sample holder was covered with a dark opaque layer (black aluminum tape) to limit potential secondary reflections. The samples were finally transferred (under dry and cold conditions, using a box containing liquid nitrogen) to the CarboN-IR environmental chamber. Liquid nitrogen keeps the ice at low temperature, while the outgassing of N2 keeps the atmosphere dry, avoiding the formation of frost on the ice particles during their transportation.

2.2. Experiment Setup and Measurement Procedure

Measurements were performed with the SpectropHotometer with variable INcidence and Emergence (SHINE) coupled to the CarboN-IR environmental chamber at the Cold Surfaces Spectroscopy (CSS) facility (https://cold-spectro.sshade.eu/ accessed on 22 November 2021) of the Institut de Planétologie et d’Astrophysique de Grenoble (IPAG) (Grenoble, France). CarboN-IR is a cylindrical stainless-steel chamber containing an inner cell made of copper where the sample holder is placed [15]. The main cylinder of the chamber is pumped down to high vacuum (HV). The temperature and pressure inside the cell are controlled with a helium cryostat, a heater and a proportional-integral-derivative (PID) temperature controller, and a turbopump system. There is no liquid N2 in this chamber. After the introduction of the sample and closing of the inner cell and main chamber, the inner cell is first pumped down to primary vacuum, then 5–10 mbar of pure N2 from a gas bottle (>99.99(9)% N2; the stated impurity of the N2 bottle is <5.5 ppm with <3 ppm of H2O) is introduced in this inner cell to allow a good thermalization of the sample and avoid the sublimation of the water ice (and consecutive change of particles size/shape). Therefore, there is no issue related to H2O as a contaminant in the inner-cell where the sample is kept. Residual water potentially present in the main cylinder of the chamber pumped to HV condenses on the cold point of the cryostat at the bottom of the chamber; therefore, it does not deposit on the windows and does not interfere with the reflectance measurements.
All samples were measured at least at 8 different temperatures from 70 to 150 K and under about 1 × 10⁻⁶ mbar of dinitrogen to ensure good thermalization. The irregularly shaped ~300 µm particles were measured twice in order to detect possible irreversible spectral changes due to cooling and heating of the sample. In contrast to the other measurement sequences, the sample was first cooled from 150 to 70 K and then again heated to 220 K. The top of the CarboN-IR chamber and the inner cell are closed with lids equipped with sapphire windows, enabling the illumination of the sample surface and the measurement of its reflectance over the whole visible and near-infrared ranges by the SHINE spectro-gonio radiometer.
SHINE consists of a goniometer arm illuminating the sample with a 200 mm wide collimated monochromatic beam, provided by a monochromator, and a second goniometer arm holds two detectors covering the spectral range from 0.35 to 5.0 µm [16]. Spectra were acquired from 0.4 to 4.2 µm using an incidence angle of 0° and an emission angle of 30°. The spectral sampling was of 0.050 µm from 0.4 to 1.0 µm, 0.010 µm from 1.0 to 3.6 µm, and 0.050 µm from 3.6 to 4.2 µm. The spectral resolution was 0.003 µm in the wavelength range of 0.4–0.7 μm, 0.006 µm in the wavelength range of 0.7–1.4 μm, 0.013 μm in the range of 1.4–3.0 μm, and 0.026 μm in the range of 3.0–4.2 μm. At each wavelength, the intensity was recorded at 1 s, repeated 10 times, and averaged. Spectralon and Infragold (Labsphere Inc., North Sutton, NH, USA) were used as references, and the nonperfect Lambertian behavior of the Spectralon was considered in the calibration [17]. Finally, the collected spectra were corrected for effects of transmission and multiple reflections due to the sapphire windows of the CarboN-IR chamber, as described in [18]. The final absolute radiometric accuracy of the laboratory measurement was better than 3%.

3. Spectral Parameter Analysis

The spectral signature of H2O ice and its variation highly depend on the refractive index and absorption coefficient of H2O as a function of wavelength. For detailed information, the reader is referred to excellent reviews by [19,20,21]. Particularly in the near- (0.78–1.4 µm) and shortwave-infrared (1.4–3 µm) wavelength region, H2O-ice exhibits diagnostic absorptions caused by overlapping overtones and combinations of the fundamental vibration modes of the H2O molecule [19]. However, from the UV through the IR, the H2O-ice spectral signature is very sensitive to various physical parameters such as particle size, temperature (including thermal history), and crystallinity [21], which can significantly affect the depth or intensity, wavelength position (or band center), width, and shape of the specific absorption [21]. Although these effects make the interpretation of the H2O-ice spectra more challenging, they also offer valuable indicators for the chemical and physical conditions of H2O ice on icy satellites’ surfaces. Therefore, the best possible knowledge how these spectral parameters vary between the collected spectra in relation with particle size and temperature is essential for future investigation, and thus is the focus of this study.
Figure 1 shows the spectra of all samples measured for this study at 70 K. All spectra show the typical spectral signature of H2O ice with a relatively high reflectance in the visible spectral region, which decreases with increasing wavelength. The major H2O-ice absorptions centered at ~1.04, ~1.25, ~1.5, and ~2 µm appear in every spectrum. The band depth of these absorptions has been often used before as an indicator for abundance and particle size [4], whereas the wavelength position of the band center could give indications of varying crystallinity [6]. In addition, absorptions of H2O ice at 1.31, 1.57, and 1.65 µm can be recognized in some spectra, which correspond to additional H2O-ice absorptions previously described by [6] and interpreted to be related to variations in the temperature and crystallinity of H2O ice. At wavelengths larger than 3 µm, the reflectance is usually very low as the broad and very strong fundamental band of H2O ice saturates in reflectance. Nevertheless, the characteristic Fresnel reflection peak at 3.1 µm sometimes accompanied by a second peak at 3.2 µm, which was previously used as an indicator for the characterization of H2O-ice crystallinity [2], is present in all spectra. In this wavelength region, the absorption of light is so large that the particles reflect the light like polished metal spheres [19]. The shallower reflection peak at 3.6 µm, which has been used as an indicator of the ice temperature [22,23], is hardly visible due to the very low reflectance in this wavelength region in the particle size range studied in this work.
Figure 2 presents the spectra measured for the five H2O-ice particle sizes (Figure 2a) and the second sample for the 300 µm-sized particles (Figure 2b) separately for the major spectral signatures of H2O ice. At this closer inspection, distinct variations in the band center, depth or intensity, and shape of the individual H2O-ice absorptions and of the Fresnel reflection peak, respectively, become apparent. In order to analyze the observed variations in detail, we derived the band center (BC), band depth (BD), or intensity (I), the full-width at half maximum (FWHM) and the asymmetry (A) of the major H2O-ice absorptions at 1.04, 1.25, 1.5, and 2 µm, the additional H2O-ice absorptions at 1.31, 1.57, and 1.65 µm, and the two peaks related to the Fresnel reflection centered at 3.1 and 3.2 µm. The band center (BC) of the H2O-ice absorptions is defined as the position of the band minimum after spectral continuum removal, whereas the band depth (BD) is defined as 1-Rb/Rc [24,25], with Rb and Rc representing, respectively, the reflectance of the absorption band and the interpolated spectral continuum at the BC wavelength. As a descriptor of the shape of the individual H2O-ice absorptions, we computed the full-width at half maximum (FWHM), defined as the distance between the two positions on the band wings at halfway reflectance between the band minimum and the continuum [26]. Further, the ratio between the HWHM (half-width at half maximum) derived separately for the two wings works as a potential indicator for any arising asymmetry (A) in the shape of the absorption band. In order to also characterize variations related to the Fresnel reflection peaks at 3.1 and 3.2 µm, the intensity (I) of its maximum reflectance and the corresponding band center (BC) were measured. Despite possible small variations in the BCs of the investigated absorptions, in the following section, we refer to the individual absorptions using their generalized wavelength position, such as 1.04, 1.25, 1.31, 1.5, 1.57, 1.65, and 2.0 µm. The same applies to the Fresnel reflection peaks at 3.1 and 3.2 µm.

3.1. Spectral Changes with Particle Size

Figure 3 presents the derived BD and I variations depending on the PS of the H2O-ice samples measured at the lowest (70 K) and highest temperature (150 K). Please note that the radiometric accuracy of <3% usually does not exceed the used symbol size and therefore is not indicated in the plots. Variations in the BDs of the H2O-ice absorptions at 1.04, 1.25, 1.5, and 2 µm show a strong relationship to the different particle sizes of the samples and follow the general trends highlighted in previous works [27,28] with larger particles more absorptive than smaller ones due to the longer distance a photon travels through the ice between the scattering opportunities than in smaller particles [19]. At 70 K, BD1.04 increases from ~9% to ~17% monotonically with particle size (Figure 3a). Similarly, at 70 K, BD1.25 increases from ~21% to ~40% between the particle sizes of ~70 and ~1060 µm and reaches a plateau for the two largest particle sizes. A similar trend can be observed in the case of the spectra derived at higher temperatures (Figure 3b). At 150 K, BD1.04 and BD1.25 reach their maxima at a particle size of ~1060 µm and then slightly decrease by about 3%. It has to be noted, however, that these variations lie within the expected range of accuracy of the radiometric calibration (see above).
In the case of the stronger H2O-ice absorptions at 1.5 and 2 µm, the BDs reach their maxima at even smaller particle sizes (Figure 3a). At 70 K, BD1.5 increases from ~85% to 89% for particle size from ~70 up to ~680 µm but then decreases to ~81% for larger particles. The BD2.0 increases between 70 and 300 µm-sized particles (~89%) and then decreases with increasing particle size even more strongly down to 68%. At 150 K, similar trends can be observed. BD1.5 increases slightly from ~85% to ~88%, until a plateau is reached for particles with the size of ~680 and ~1060 µm. At the largest particles, the BD1.5 is slightly lower (~84%). BD2.0 exhibits the highest values of ~88% for 70 µm and 300 µm particles, which decrease to ~1060 µm-particles and remain at ~78% also for ~1360 µm-sized particles (Figure 3b). The decrease in the BDs of H2O-ice absorptions at larger particles is a well-known characteristic of the H2O-ice spectral properties and is believed to be caused by band saturation. The reflectance in the band center at 1.5 and 2 µm reaches a minimum beginning at particle sizes of ~500 and ~200 µm, respectively. A similar trend has been already described by [4], based on model H2O-ice spectra. In the case of saturation, a further increase in particle size cannot further decrease the reflectance in the band center below these residuals. Due to the progressive reduction of the reflectance of the continuum with increasing particle size, the band depth decreases again.
At least partly, a similar relationship to the H2O-ice particle size can be also observed for the BDs of the weaker H2O-ice absorptions at 1.31, 1.57, and 1.65 µm at a given temperature (Figure 3c,d). At 70 K, BD1.31 increases from ~7% to ~19% for particle sizes between ~70 and ~1060 µm and drops to 16% for 1360 µm-sized particles. On the contrary, BD1.57 and BD1.65 increase from ~29% to ~38% and ~50% to 61.3%, respectively, between ~70 and ~300 µm-sized particles and then continuously decrease again toward larger particles to ~14% and ~41%, respectively. Although the overall trend of the BD variations is with particle sizes more or less similar at 150 K, the BD values differ between 70 and 150 K up to ~25%, i.e., more strongly than between the particle sizes. Thus, the BD variations of these weaker absorptions cannot be attributed exclusively to particle size, which is discussed in more detail in Section 3.2.
The same applies for the Fresnel reflection peaks at 3.1 and 3.2 µm (Figure 3e,f). Both peaks show a comparable trend, which is also similar for 70 and 150 K. At least for particle sizes from ~300 to ~1060 µm, an increasing in the intensity (I) of both peaks with increasing particle size can be observed. In addition, a distinct drop in I between the samples of ~70 and ~300 µm-particles can be seen. If particles are larger than a few microns, only a single surface particle reflection is expected at the wavelengths of the Fresnel peak, which is then poorly dependent of particle size [2]. According to Figure 1, all particle sizes exhibit a similar very low (nearly 0) reflectance around 2.9–3.5 µm, where the 3.1 µm-peak occurs. In this wavelength range, absorption dominates over scattering (except first-reflection scattering causing the peak). Because, there is no increase in spectral continuum for the small particles (~300 and ~70 µm), and because the Fresnel reflection is a surface effect, the decrease in the peak for 300 and 70 µm particles could probably be due to the increased roughness at small scale for these samples compared to the samples made of larger particles. A higher roughness would produce some shadowing effects, mimic a larger porosity of the first layer, and/or induce multiple different directions of first reflections that could decrease the intensity of the Fresnel peak in the averaged-area of the beam light compared to flatter surfaces at the same scale. The BD3.1 and BD3.2 values slightly decrease again between particles with a size of 1060 and 1360 µm. However, as stated above, the overall variations in the intensity I of both peaks over the range of the measured particle sizes do not exceed the I variations between 70 and 150 K, which are discussed in more detail below.
Generally, the BCs of the individual H2O-ice absorptions measured at a given temperature remain more or less stable for the studied range of particle sizes (Figure 4). Only the strong H2O-ice absorptions at 1.5 and 2 µm show a slight dispersion of BC values over the entire particle size range, which could possibly imply a relation to the saturation of these absorptions. Slight dispersions in the BC also occur with respect to the Fresnel reflection peaks at 3.1 and 3.2 µm (Figure 4e,f). Although, at 70 K, a slight shift of the BC3.2 to shorter wavelengths (from 3.22 to 3.20) with increasing particle size could be possible, such a trend is difficult to see for the BC3.1 and does not exist for the spectra measured at 150 K.
Variations with H2O-ice particle size could be only partly recognized for the FWHM derived for the H2O-ice absorptions (Figure 5). At least, the FWHM of the absorptions at 1.5 and 2 µm seem to increase with particle size followed by a slight drop toward ~1360 µm-sized particles for FWHM2.0. Since this trend occurs without any significant shift in the BC (Figure 4) and no apparent relationship between A and particle size of the samples and/or FWHM, the trend between FWHM and particle size could be explained by a broadening of these absorptions due to their progressive saturation. The weaker absorptions do not show significant FWHM variations with particle size. This trend is even more pronounced at 150 K, which is discussed in the next section.

3.2. Spectral Changes with Temperature

Figure 6 and Figure 7 show, how the spectral parameters vary depending on the temperature exemplarily for the smallest (~70 µm) and largest (~1360 µm) H2O-ice particles of this study. Generally, the BDs of the H2O-ice absorptions at 1.04, 1.25, 1.5, and 2 µm only vary within ±2% (which is even lower than the derived measurement accuracy) over the studied range of temperatures and thus remain fairly constant for a specific particle size (Figure 6a,b) and therefore support that the BDs of these absorptions are useful indicators of particle size variations [3,4]. As stated above, the deviation (±10%) of BD2.0 values in the case of large particles (1360 µm) are expected to be caused by band saturation and cannot be related to the temperature.
Variations in the spectral parameters depending on temperature are mainly related to the appearance of the additional H2O-ice absorptions such as a distinct kink at ~1.31 µm, close to the center of the absorption at 1.25 µm, and two additional absorption features at ~1.57 and ~1.65 µm, within the high wavelength wing of the absorption at 1.5 µm (Figure 2), which corresponds to the absorptions described for crystalline H2O ice by [6]. The H2O-ice absorption at 1.04 µm may also host an additional absorption, but it is too weak to be analyzed in detail. The variations in the BDs of these absorptions with temperature show a trend (Figure 6c,d), which mostly appear to dominate over the variations due to particle size (Figure 3c,d). BDs of these additional absorptions are strongest at a temperature of 85 K and then weaken progressively with increasing temperature (Figure 6c,d). It has to be noted, however, that the trend weakens at large particles and thus implies no exclusive trend with temperature independent of the particle size of the H2O-ice sample. By contrast, in the case of the Fresnel reflection peaks (Figure 6e,f), the peaks remain constant within the expected measurement accuracy of 3% between 70 and 150 K, but show a trend of weakening intensity I of the peaks with increasing temperature for large ~1360 µm-sized particles. The difference in the strength and shape of the peak between large and small particle sizes diminishes with increasing temperature.
Despite that the spectra shown in Figure 2 imply a possible slight shift of the major H2O-ice absorptions to shorter wavelengths with increasing temperature, their BCs versus temperature do not (Figure 7a,b). However, in the case of the BCs of the additional absorptions at 1.31, 1.57, and 1.65 µm (Figure 7c,d) as well as the Fresnel reflection peaks (Figure 7e,f), no significant variations appear clearly be related to changes in the temperature of the H2O-ice samples. Although, however, the BD variations of the additional absorptions do not affect their own BC, they apparently affect the BC of the ‘parent’ absorption (Figure 8). Minor BC shifts may already affect the H2O-ice absorption at 1.04 µm as shown in Figure 2, but variations in BC1.04 are difficult to assess, given the spectral resolution and SNR of the measured spectra. By contrast, Figure 8a illustrates that BC1.25 generally lies at shorter wavelengths at 150 K than measured at 70 K. As BD1.31 µm decreases with increasing temperature, the BC of the H2O-ice absorption at 1.25 µm seems to slightly shift to shorter wavelength, i.e., from ~1.27 to ~1.25 µm (BC1.25). A similar trend can be observed with respect to the H2O-ice absorption at ~1.5 µm affected by the absorptions at 1.57 and 1.65 µm (Figure 8b,c). As mentioned above, BC1.5 (and BC2.0) are sometimes difficult to measure in the case of larger particle sizes, i.e., ~1060 and ~1360 µm due to the starting influence of saturation of the absorption. If, in addition, the absorption at 1.57 µm is relatively strong, BC1.5 cannot be measured independently of BC1.57, which could explain the BC1.5 sometimes reaching ~1.57 µm as seen for ~1060 µm-sized particles (Figure 8b,c). Although the relationship between BD1.57 and BC1.5 is more difficult to detect, in the case of BD1.65 (Figure 8c), BC1.5 is located at shorter wavelength in the spectra measured at 70 K than at 150 K and at least varies between ~1.52 and ~1.49 µm, respectively, while BD1.65 decreases from ~0.60 to ~0.15 across the entire particle size range investigated.
Despite a minor increase in the FWHM1.5 for the 70 µm-sized particles and a more pronounced increasing for the larger particles (~1360 µm) with temperature (Figure 9), none of the other studied H2O-ice absorptions show a clear FWHM temperature dependent trend. This broadening of the 1.5 µm-absorption could possibly be caused by a change of the slope due to an additional absorption at 1.8 µm (Figure 2) growing in the continuum, which is too weak to be analyzed in this study but previously described in [6].

3.3. Spectral Changes between Samples with Different Particle Shape

Figure 10 presents the comparison of the spectral parameters derived for the two samples with ~300 µm-sized particles, one with spherical and one with irregular particles. Whereas the sample with the spherical particles were measured during warming from 70 to 150 K, the sample with irregular particles were measured twice, first during cooling from 150 to 70 K followed by heating again, which ended at 220 K. No major changes in the trends of the spectral parameters of the H2O-ice absorptions (BD, FWHM, BC) other than described above could be observed between the two H2O-ice samples as well as at the same temperature during ascending (sample heating) and descending (sample cooling) temperature ramps of the irregular particles. The only difference in the spectral variations of the spherical or irregular shape of the ~300 µm-sized H2O-ice particles occurs with respect to the BDs of the major H2O-ice absorptions. The BDs of the H2O-ice absorptions at 1.04, 1.25, 1.5, and 2 µm measured for the spherical 300 µm-particles are slightly larger for some temperatures (up to ~10% for BD1.04 and BD1.25 and up to ~5% for BD1.5 and BD2.0) at temperatures between 70 and 150 K. The same trend is often visible for the BDs of the absorptions at 1.57 and 1.65 µm but difficult to recognize for BD1.31. Particularly, in the case of BD1.65, the difference reaches a maximum of ~21%. This difference, however, is believed to be rather caused by the different way of the sample preparation than the shape of the particles. We may expect that irregular H2O-ice particles have a slightly smaller effective size than the spherical particle sample as a direct result of the sieving process. During the sieving process, elongated particles have the tendency to stay flat on the sieves and have difficulties to go through it. On the other hand, particles with their largest size below the sieve size go, but in average, they have their smallest size smaller than a spherical particle. Previous works already describe that optically irregular particles behave more like particles with a size close to the smallest dimension of their particles than to their largest. Reference [12] showed that the effective optical particle size (Deff) decreases for oblate and prolate particles compared to the average particle size D (defined from the average of particle cross section σ: = 2 σ / π ) by a factor of 3 relative to equant particles for aspect ratio around 0.2. In addition, few small particles could have sintered on the largest one with them not well washed during the sample preparation and/or the rougher particle surface of the grinded grains may play a role, with surface asperities acting as small independent scatterers. Finally, the possibly rougher surface of the grinded particles also might cause slight differences in the spectral parameters. By comparison, fewer surface irregularities in the spherical (sprayed) particles could enable the light to penetrate more efficiently in the particle, favoring forward scattering in the medium and requiring a larger number of interactions before emerging, which would result in stronger absorption. Thus, the spectral parameters of the H2O-ice absorptions are apparently mainly independent of the particle shape and whether the corresponding temperature of the H2O-ice sample is reached either by heating or cooling.
No significant difference in strength, shape, and position of the Fresnel reflection peaks can be recognized for spherical and irregular 300-µm sized particles, when both samples were heated from 70 to 150 K (Figure 10c,f). The diminishing intensity I of the Fresnel reflection peaks at 3.1 and 3.2 µm together with their slight shift to shorter wavelengths with increasing temperature described above being recognized more clearly due to the wider temperature range of the irregular particles. The Fresnel reflection peak at 3.1 µm and, to a lesser extent, the 3.2 µm peak weaken with increasing temperature (Figure 10c). In addition, a slight shift of the 3.1 µm peak to shorter wavelengths, i.e., from 3.12 to 3.08 µm is observed with increasing temperature from 70 to 220 K (Figure 10f). The same trend, although weak, can also be partly seen for the 3.2 µm-peak, which shifts from 3.24 to 3.19 µm, but with a BC at the shortest wavelength already reached near ~150 K. Only, in the case of the irregular 300 µm-particles the peak at 3.1 µm appears to be stronger at 150 K when measured at the starting point of the cooling sequence from 150 to 70 K than after heating from 70 to 150 K again (Figure 10c). This may be due to some cracking of the crystal due to thermal stress, which reduces the effective grain size and consequently reduces the peak.

3.4. Fresnel Reflection—Particle Size, Crystallinity, or Temperature Related?

In previous works, the Fresnel reflection peak at 3.1 µm together with other spectral signatures, i.e., the BCs of the H2O-ice absorptions at 1.5 and 2 µm and the existence and strength of the additional absorptions at 1.31, 1.57, and 1.65 µm, has often been used as indicator for the crystallinity of H2O ice, which can occur in amorphous and crystalline (cubic and hexagonal) phase depending on the condensation temperature, condensation rate, and temperature history [2,6,7,8,29]. We therefore shortly discuss the results of our measurements here in this context. Since, however, the spectral properties of cubic and hexagonal H2O ice do not differ at wavelengths < 70 µm [30], we only distinguish here between crystalline and amorphous H2O ice.
Any H2O ice formed from the liquid phase is expected to be crystalline [6] except in special conditions of ultrafast cooling of submicron particles, which is not our case. The spherical H2O-ice particles were produced by spraying liquid water droplets on liquid nitrogen. The freezing of the droplet is controlled by the Leidenfrost effect: the relatively warm droplet induces the evaporation of the N2, allowing the levitation of the droplet above the liquid nitrogen for a few seconds. The duration of the levitation allows the progressive crystallization of the liquid water from the surface to the interior of the spherical droplet and the resulting ice to be fully crystalline [31]. Irregular particles were retrieved from a perfectly crystalline ice slab derived from a relatively large mass of water put in the fridge to slowly freeze overnight and then crushed and sieved in the fridge. The temperature of the freezer lies at −30 °C (~243 K), which is much higher than the temperature required to build amorphous H2O ice and rather offer perfect conditions to form hexagonal H2O ice [8]. Therefore, according to the way and the conditions under which the samples were prepared for this study, we expect our samples to consist of crystalline probably hexagonal H2O ice.
The typical spectral characteristics of crystalline H2O ice as described by [13] can be seen in most of the spectra measured at 70 K, which show a pronounced Fresnel reflection peak at 3.1 µm with a complex shape including an additional shoulder at 3.2 µm, strong major H2O-ice absorptions centered at ~1.5 and ~2.02 µm, and distinct and relatively strong additional H2O-ice absorptions such as the one centered at 1.65 µm [6,7,8]. Nevertheless, spectral variations depending on particle size and/or temperature as described above, were also used as indicators for changing in the H2O-ice crystallinity on icy satellites before. This, a simple-shaped and relatively weak Fresnel reflection and non-existent or weak additional absorptions at 1.31, 1.57, and 1.65 µm observed in spectra of relatively small ~70 and 300 µm-sized H2O-ice particles or measured a relatively high temperature (>100 K), can be also observed in the case of amorphous H2O ice [2,6,8]. What is more, the observed BC variations of the major H2O-ice absorptions at 1.5 and 2 µm in the studied particle size and temperature range are also problematic. Amorphous and crystalline H2O ice differ with respect to BC1.5 and BC2.0, which shift from 1.492 to 1.507 µm and 1.996 to 2.024 µm [7,8,32], respectively. Probably, as mentioned above, due to a mixture of variations in temperature as well as saturation effects on the BCs of the H2O-ice absorptions at ~1.5 and ~2 µm in the case of large particles, the spectra derived in this study exhibit even significant larger BC variations, i.e., from ~1.49 to ~1.57 µm (BC1.5) and ~1.95 to ~2.06 µm (BC2.0) or saturation effects prevent an accurate determination of the band center (BC) at all. Only the BC of the 3.1-µm Fresnel reflection peak measured in this work can be clearly associated to crystalline H2O ice. Although the peak at 3.1 µm shifts to shorter wavelengths, i.e., from ~3.11 to ~3.09 µm between 120 and 80 K, in the case of amorphous H2O ice the peak should be located at even shorter wavelengths (between ~3.07 and ~3.08 µm) as presented by [8] for the same temperature range and thus supports that the H2O-ice samples investigated in this study represent crystalline H2O ice.

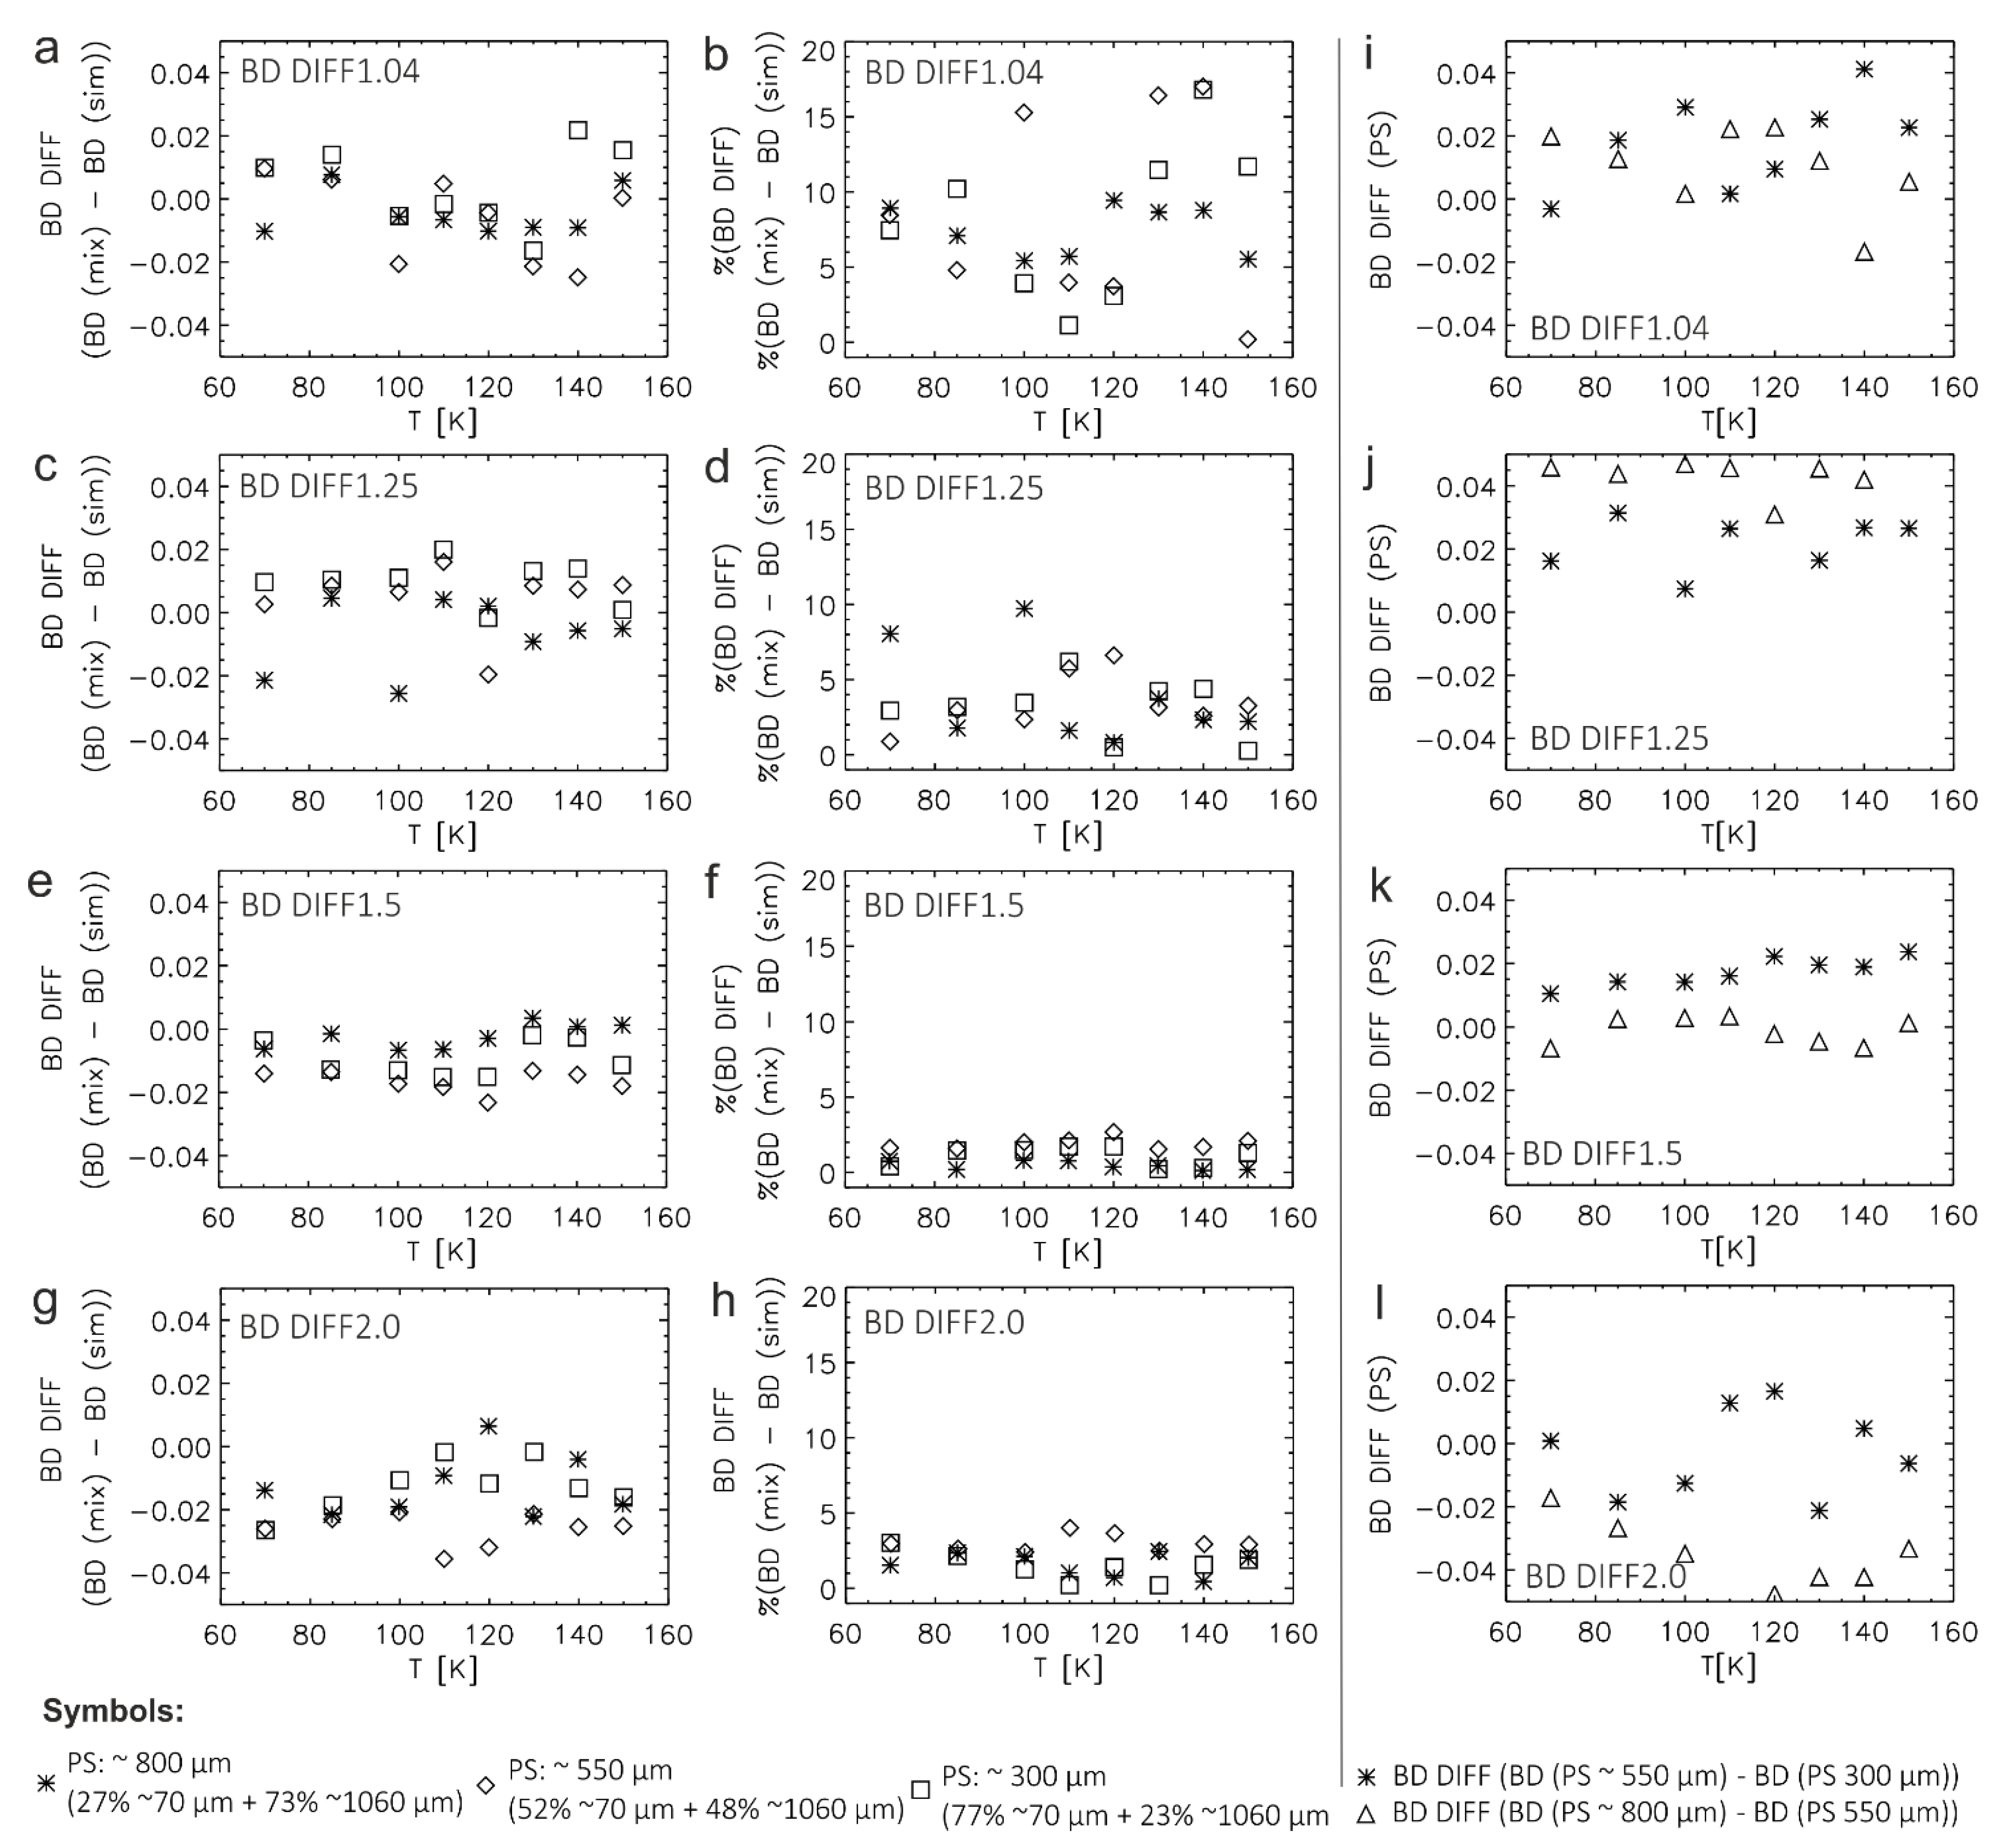
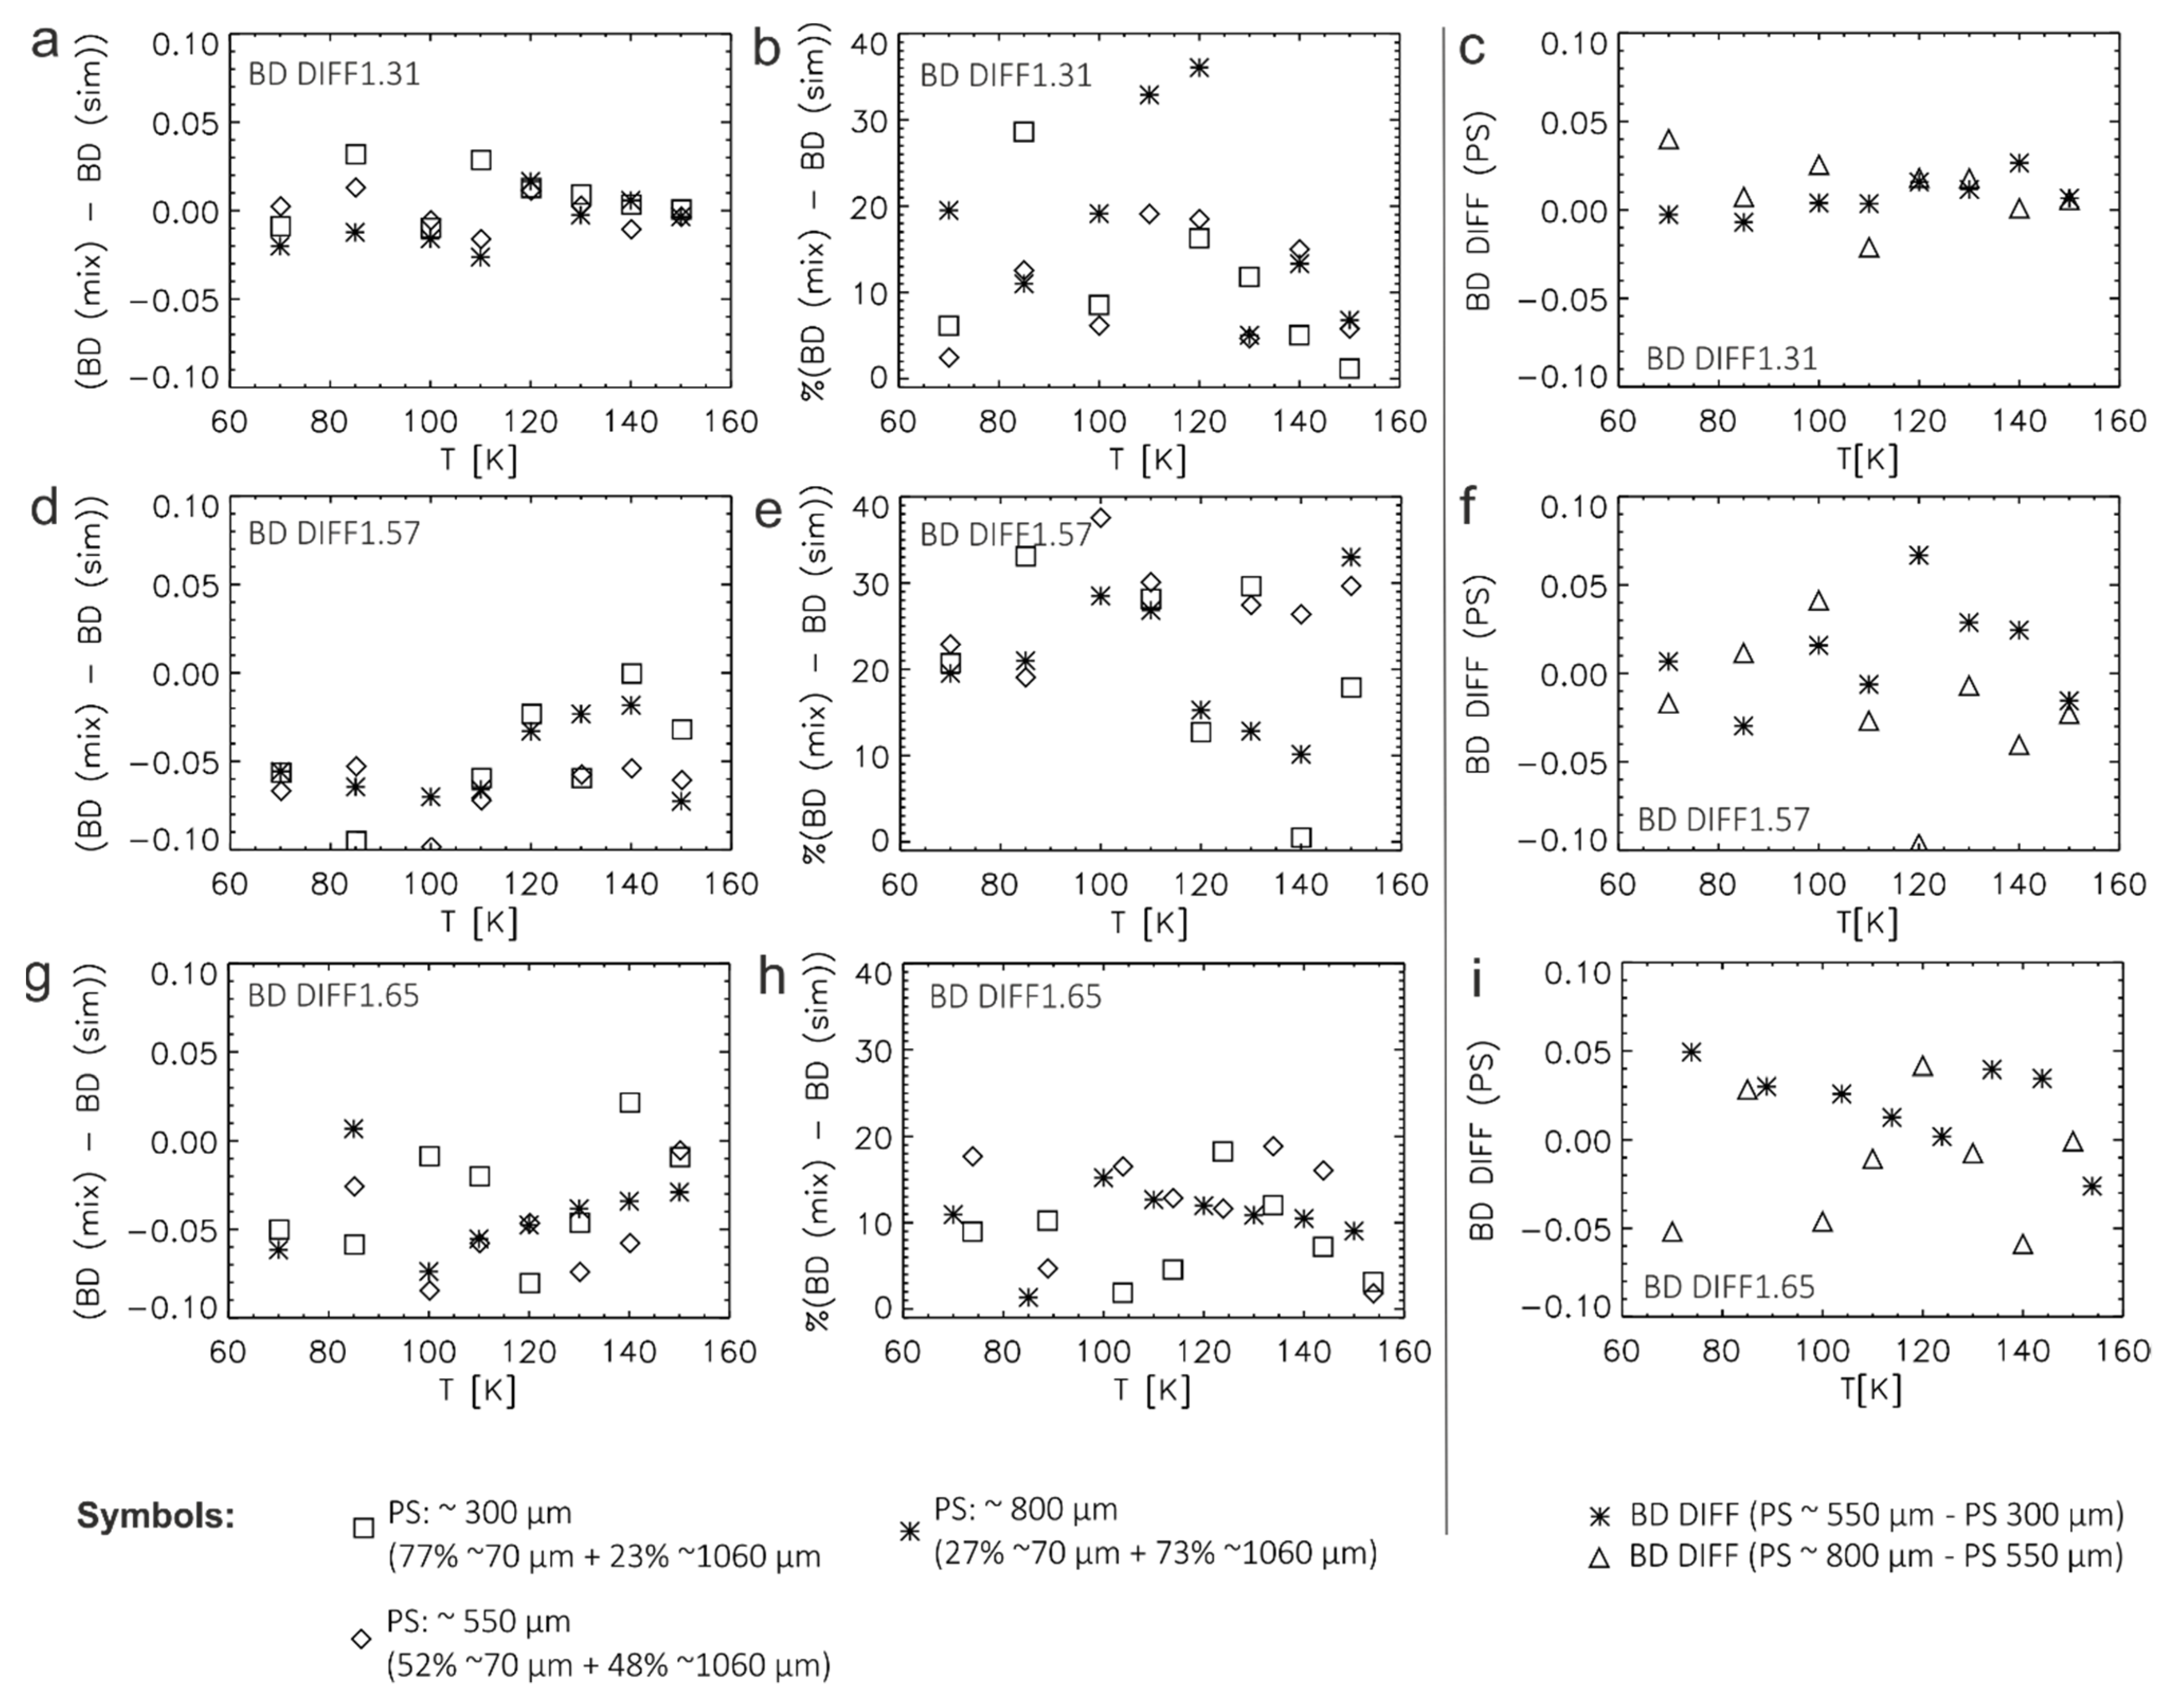
3.5. Spectral Changes in Particle Size Mixtures

For the investigation of icy surfaces by telescopes and spacecrafts, it is interesting to characterize how the spectral properties of intimate particle size mixtures would differ depending on the particle size endmembers. Figure 11a presents the spectra measured for the three intimate mixtures prepared with the ~70 and ~1060 µm-sized H2O-ice particles separately for the major spectral signatures of H2O ice in order to study the spectral effects of either small or large particles onto the spectra of the mixture. All measured spectra nicely exhibit the spectral properties intermediate between the two particle size endmembers. In addition, the variations in the spectral parameters with particle size and temperature exhibit similar trends as described above (Section 3.1 and Section 3.2). The H2O-ice absorptions at 1.04 and 1.25 µm deepen with increasing portion of the 1060 µm-sized particles. A similar trend is still visible in the case of the H2O-ice absorption at 1.5 µm, whereas the BD of the 2 µm-absorption decreases by a larger portion of the 1060 µm-sized particles due to saturation effects. Spectral changes with temperature again rather affect the absorptions at 1.31, 1.57, and 1.65 µm, which weaken with increasing temperature. Although the Fresnel reflection peaks at 3.1 and 3.2 µm also become stronger with growing portion of the larger particles, their intensity (I) also weakens with increasing temperature.
Since the investigation of icy surfaces by telescopes and spacecrafts still largely depends on comparisons with spectra derived from radiative transfer models, it is also interesting how the spectral properties of intimate particle size mixtures would differ from simulated predictions representing linear (areal or macroscopic) mixtures, i.e., a combined spectrum representing the sum of the fractional area times the spectrum of each component or particle size endmember [33]. Although such an approach is not theoretically rigorous, when applied to a mixture of small H2O-ice particles sticking onto the surface of larger ones, it would have the advantage of simplifying the estimation of important parameters of icy satellite surfaces with respect to the application of more complex and computer-intensive theoretical modelling of intimate mixtures [34,35], which also have other inherent assumptions and simplifications (see Section 1). Therefore, three areal particle size mixtures have been simulated according to the three measured particle size mixtures (Figure 11a) using the measured spectra of the ~70 and the ~1060 µm-sized particles and with varying mass mixing ratios of these two endmembers measured during the preparation of the intimate particle mixtures (27%/73%, 52%/48%, and 77%/23%). A comparison of the simulated and the measured spectra separately for the major H2O-ice features and exemplary for the temperatures 70 and 150 K are shown in Figure 11b,c, respectively. The changes in the BD of the H2O-ice absorptions and I of the Fresnel reflection peaks depending on particle size and/or temperature derived for the simulated mixtures follow the ones described for the measured particle size mixtures. Only small differences in the spectral signature of H2O ice can be recognized between the spectra of the measured intimate mixtures and the simulated mixtures. The only major difference apparently occurs with respect to the strength of the Fresnel reflection peak at 3.1 µm. Intriguingly, these differences appear to be less for the measured and simulated spectra with the largest amount of ~70 µm-sized particles at low temperatures (70 K) or the largest amount of ~1060 µm-sized particles at high temperature (150 K).
This can also be seen in Figure 12, Figure 13 and Figure 14, which directly compare the spectral parameters derived from the measured (orange) and simulated spectra (black) in comparison to the spectral parameters derived for the spectral endmembers (gray) depending on average particle size or temperature, respectively. The plots support that differences appear to be relatively small for the major H2O-ice absorptions at 1.04, 1.25, 1.5, and 2 µm but reveal that differences can be sometimes significant for all three mixtures in the case of the temperature-sensitive additional absorptions at 1.31, 1.57, and 1.65 as well as the Fresnel reflection peak at 3.1 µm. Figure 13 and Figure 14 illustrate the spectral differences between the mixtures dominated either by ~70 or ~1060 µm-sized particles. In the case of the smaller particles exhibiting ~77% of the mixture (Figure 13), the H2O-ice absorptions at 1.31, 1.57, and 1.65 appear to differ most at low temperatures and become more similar at higher temperatures. By contrast, the Fresnel reflection peaks are more similar at low temperatures. When the ~1060 µm-sized particles make up ~73% of the mixture (Figure 14), the additional H2O-ice absorptions at 1.31, 1.57, and 1.65 µm are relatively similar in strength across the entire temperature range, but the Fresnel reflection peaks still differ at low temperatures.
In order to see how these differences can affect the possibility to distinguish H2O-ice particle sizes based on their spectral properties, we compared the differences between measured and simulated spectra to the spectral differences between the average particle sizes of the three mixtures (BD DIFF (PS)). The difference in BD between measured and simulated spectra (BD(mix)—BD(sim)) as well as the percentage of this difference (%BD(mix)—BD(sim)) on the entire band depth of the corresponding spectral features were calculated. Figure 15 shows the results with respect to the major H2O-ice absorptions at 1.04, 1.25, 1.5, and 2 µm, and Figure 16 illustrates the effects onto the additional H2O-ice absorptions at 1.31, 1.57, and 1.65 µm. Generally, the differences in the BDs of a measured and simulated spectrum do not exceed ~20% for the weaker H2O-ice absorptions at 1.04 and 1.25 µm and are less than 5% for the stronger absorptions at 1.5 and 2 µm. Often, however, these differences are comparable with the BD differences between the different measured particle size mixtures (Figure 15i–l) and thus only allow at best to distinguish the varying particle size of the mixture by their BD variations between the mixtures with the smallest (~300 µm) and the largest average particle size (800 µm). The largest differences of up to 40% between the measured and the simulated mixtures occur with respect to the BDs of the absorptions at 1.31, 1.57, and 1.65 µm (Figure 16). However, it is not clear if these differences are related to variations in particle size and/or temperature.

4. Discussion

The major results from the presented reflectance measurements on H2O-ice particulate samples for different particle sizes and temperatures can be summarized as follows:
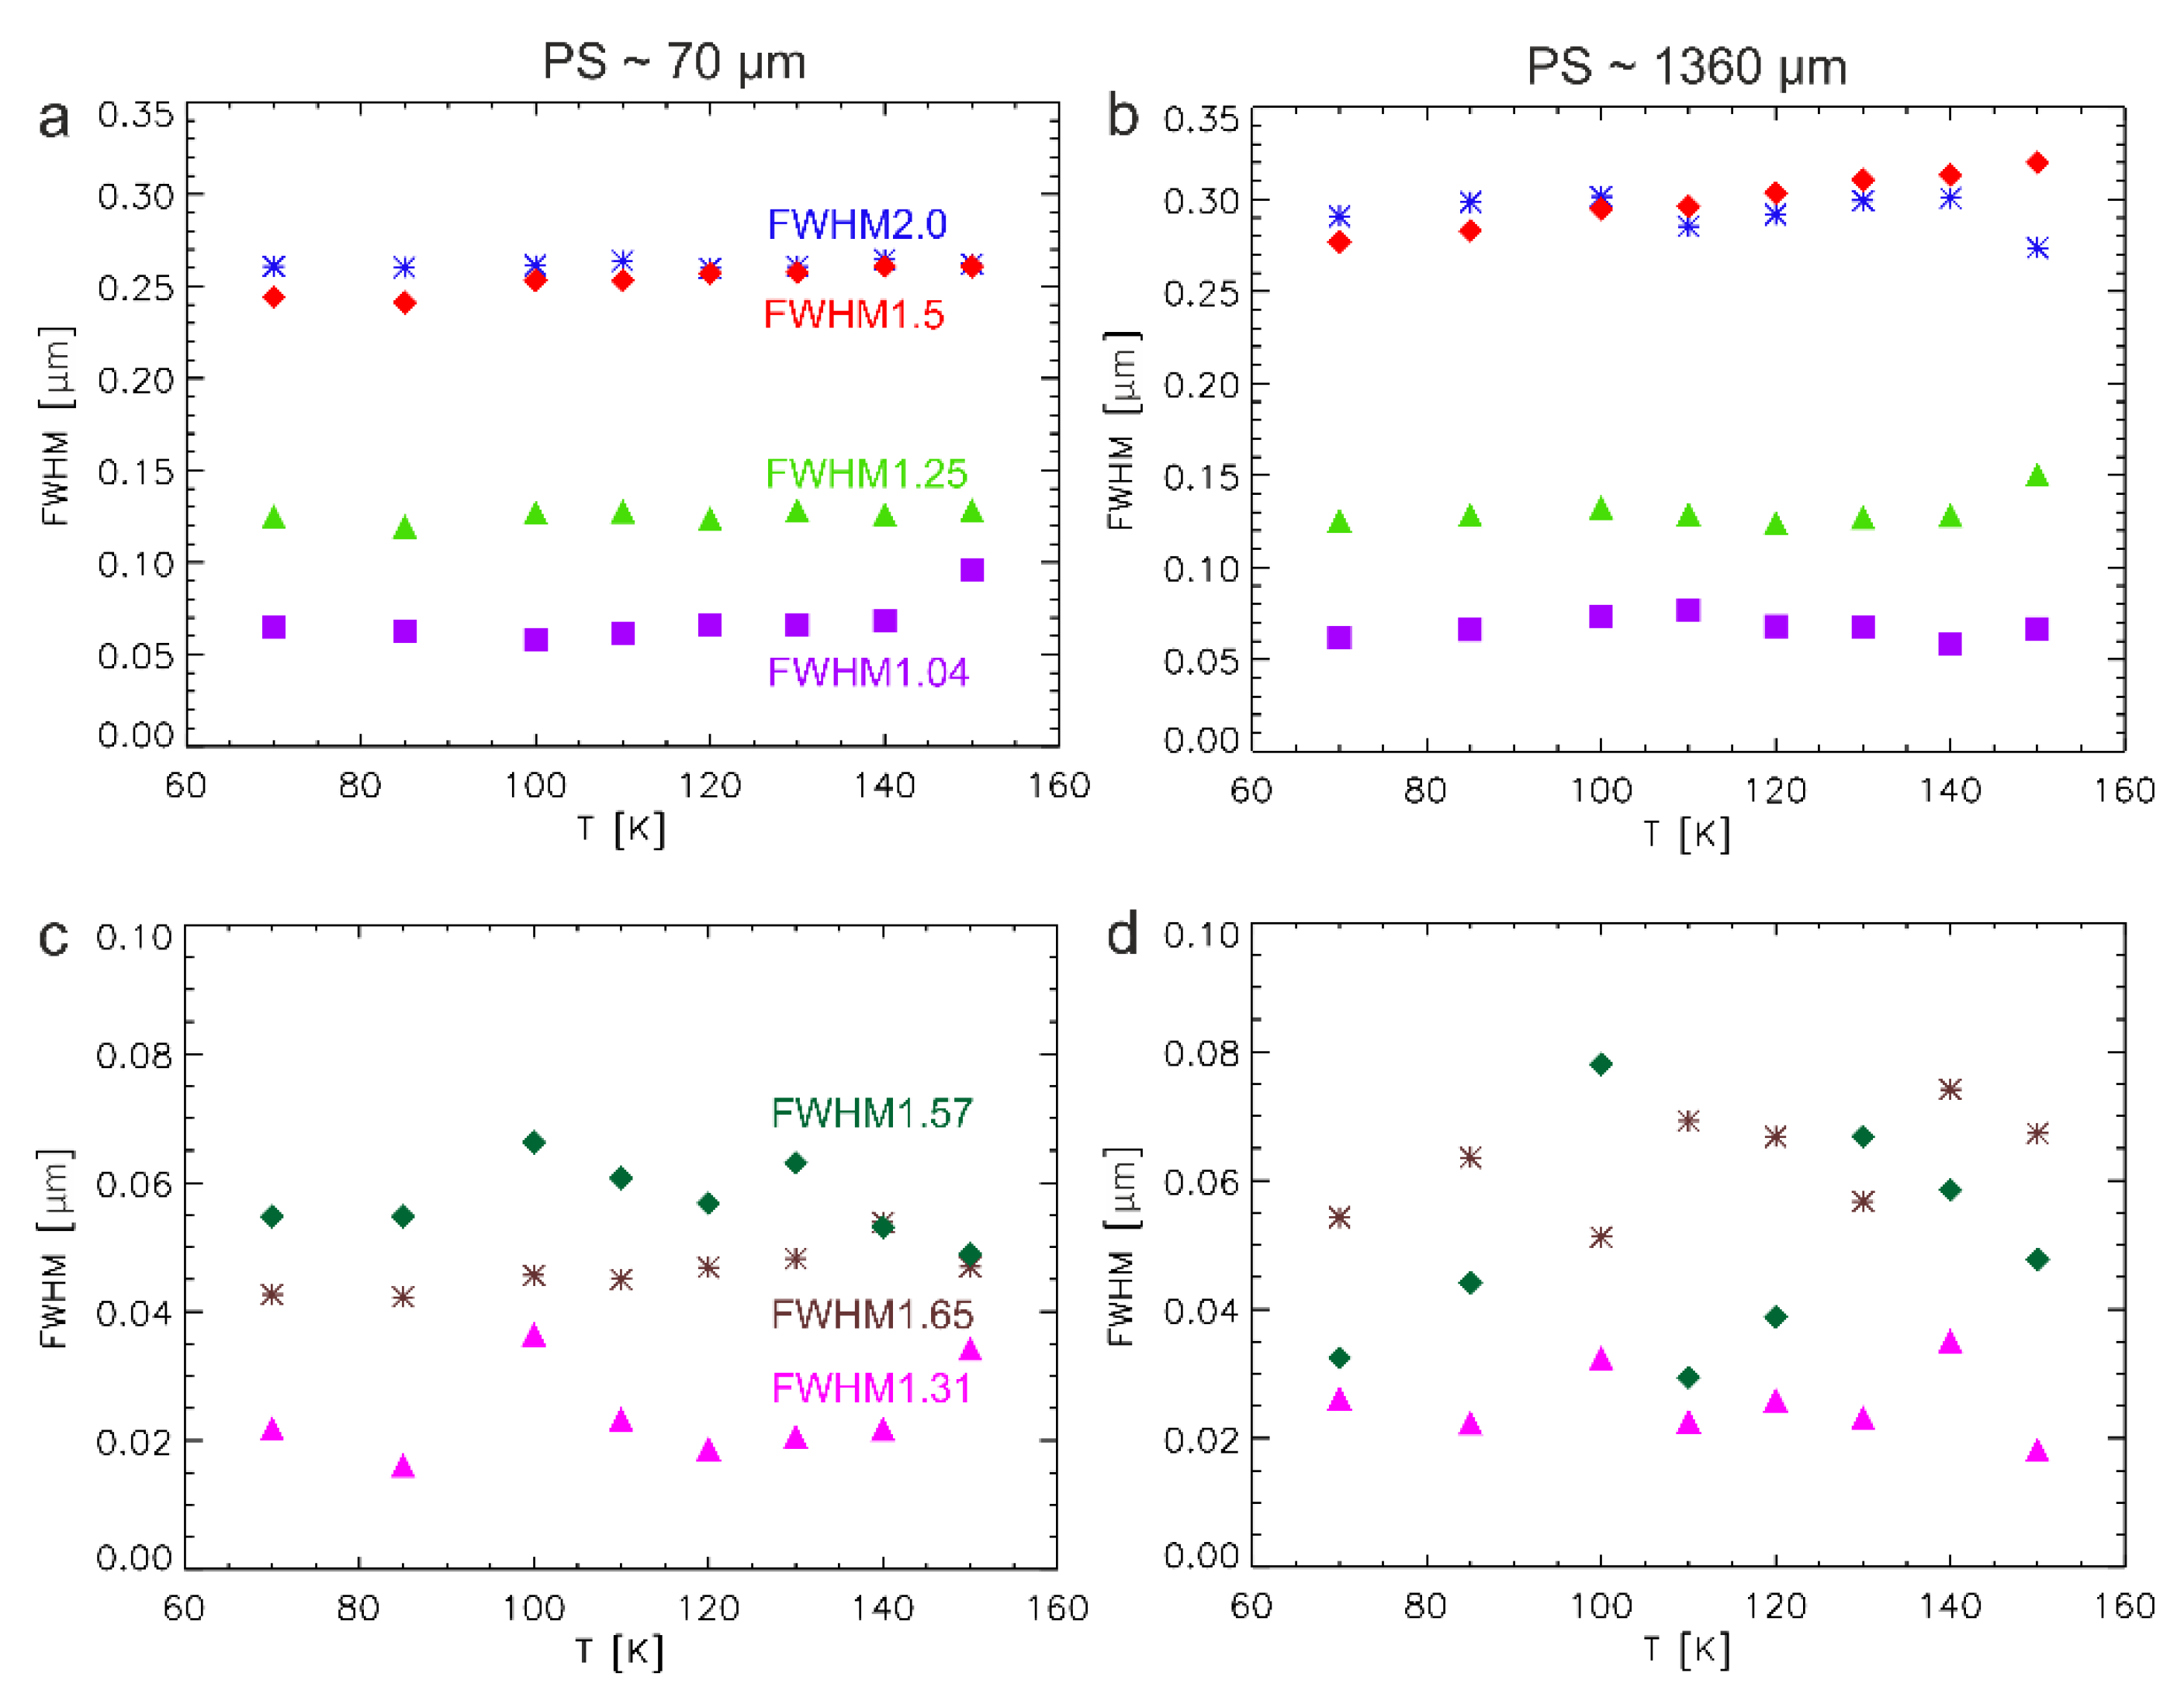
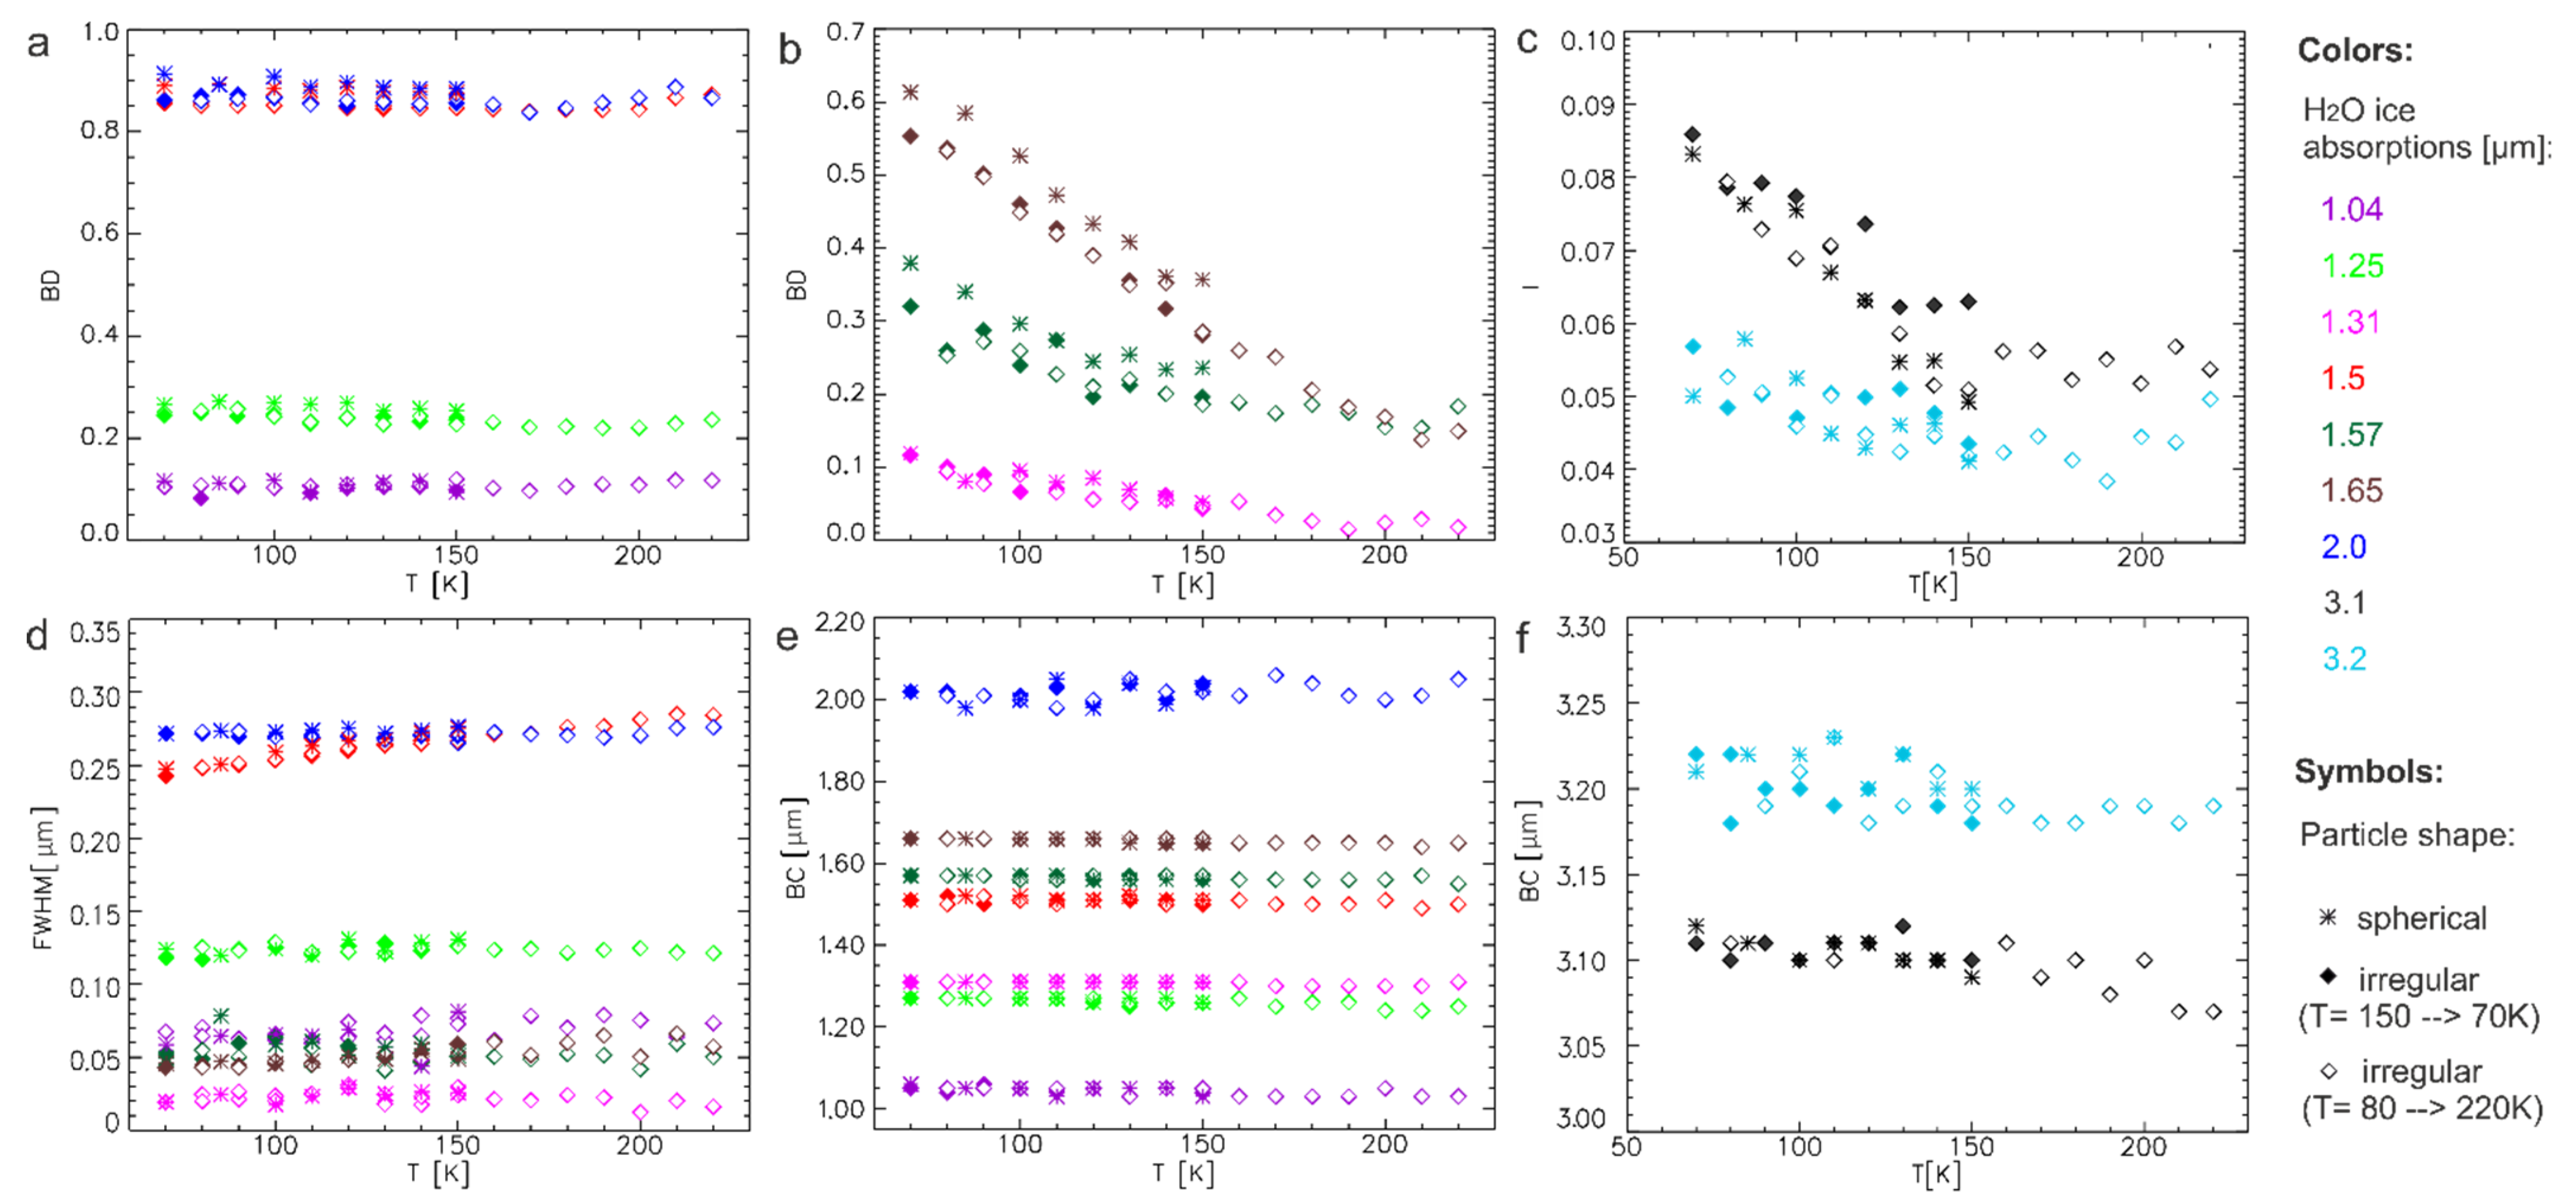
  • the band depths (BDs) of the H2O-ice absorptions at 1.04, 1.25, 1.5, and 2 µm vary depending on the size of the H2O-ice particles but are fairly stable within the studied range of temperatures, thus supporting that the BDs of these absorptions are a good indicator for particle size variations in the case of pure H2O ice;
  • the BDs of the H2O-ice absorptions at 1.31, 1.57, and 1.65 µm show a stronger relationship to the temperature but are still to some degree affected by the particle size of the H2O-ice samples;
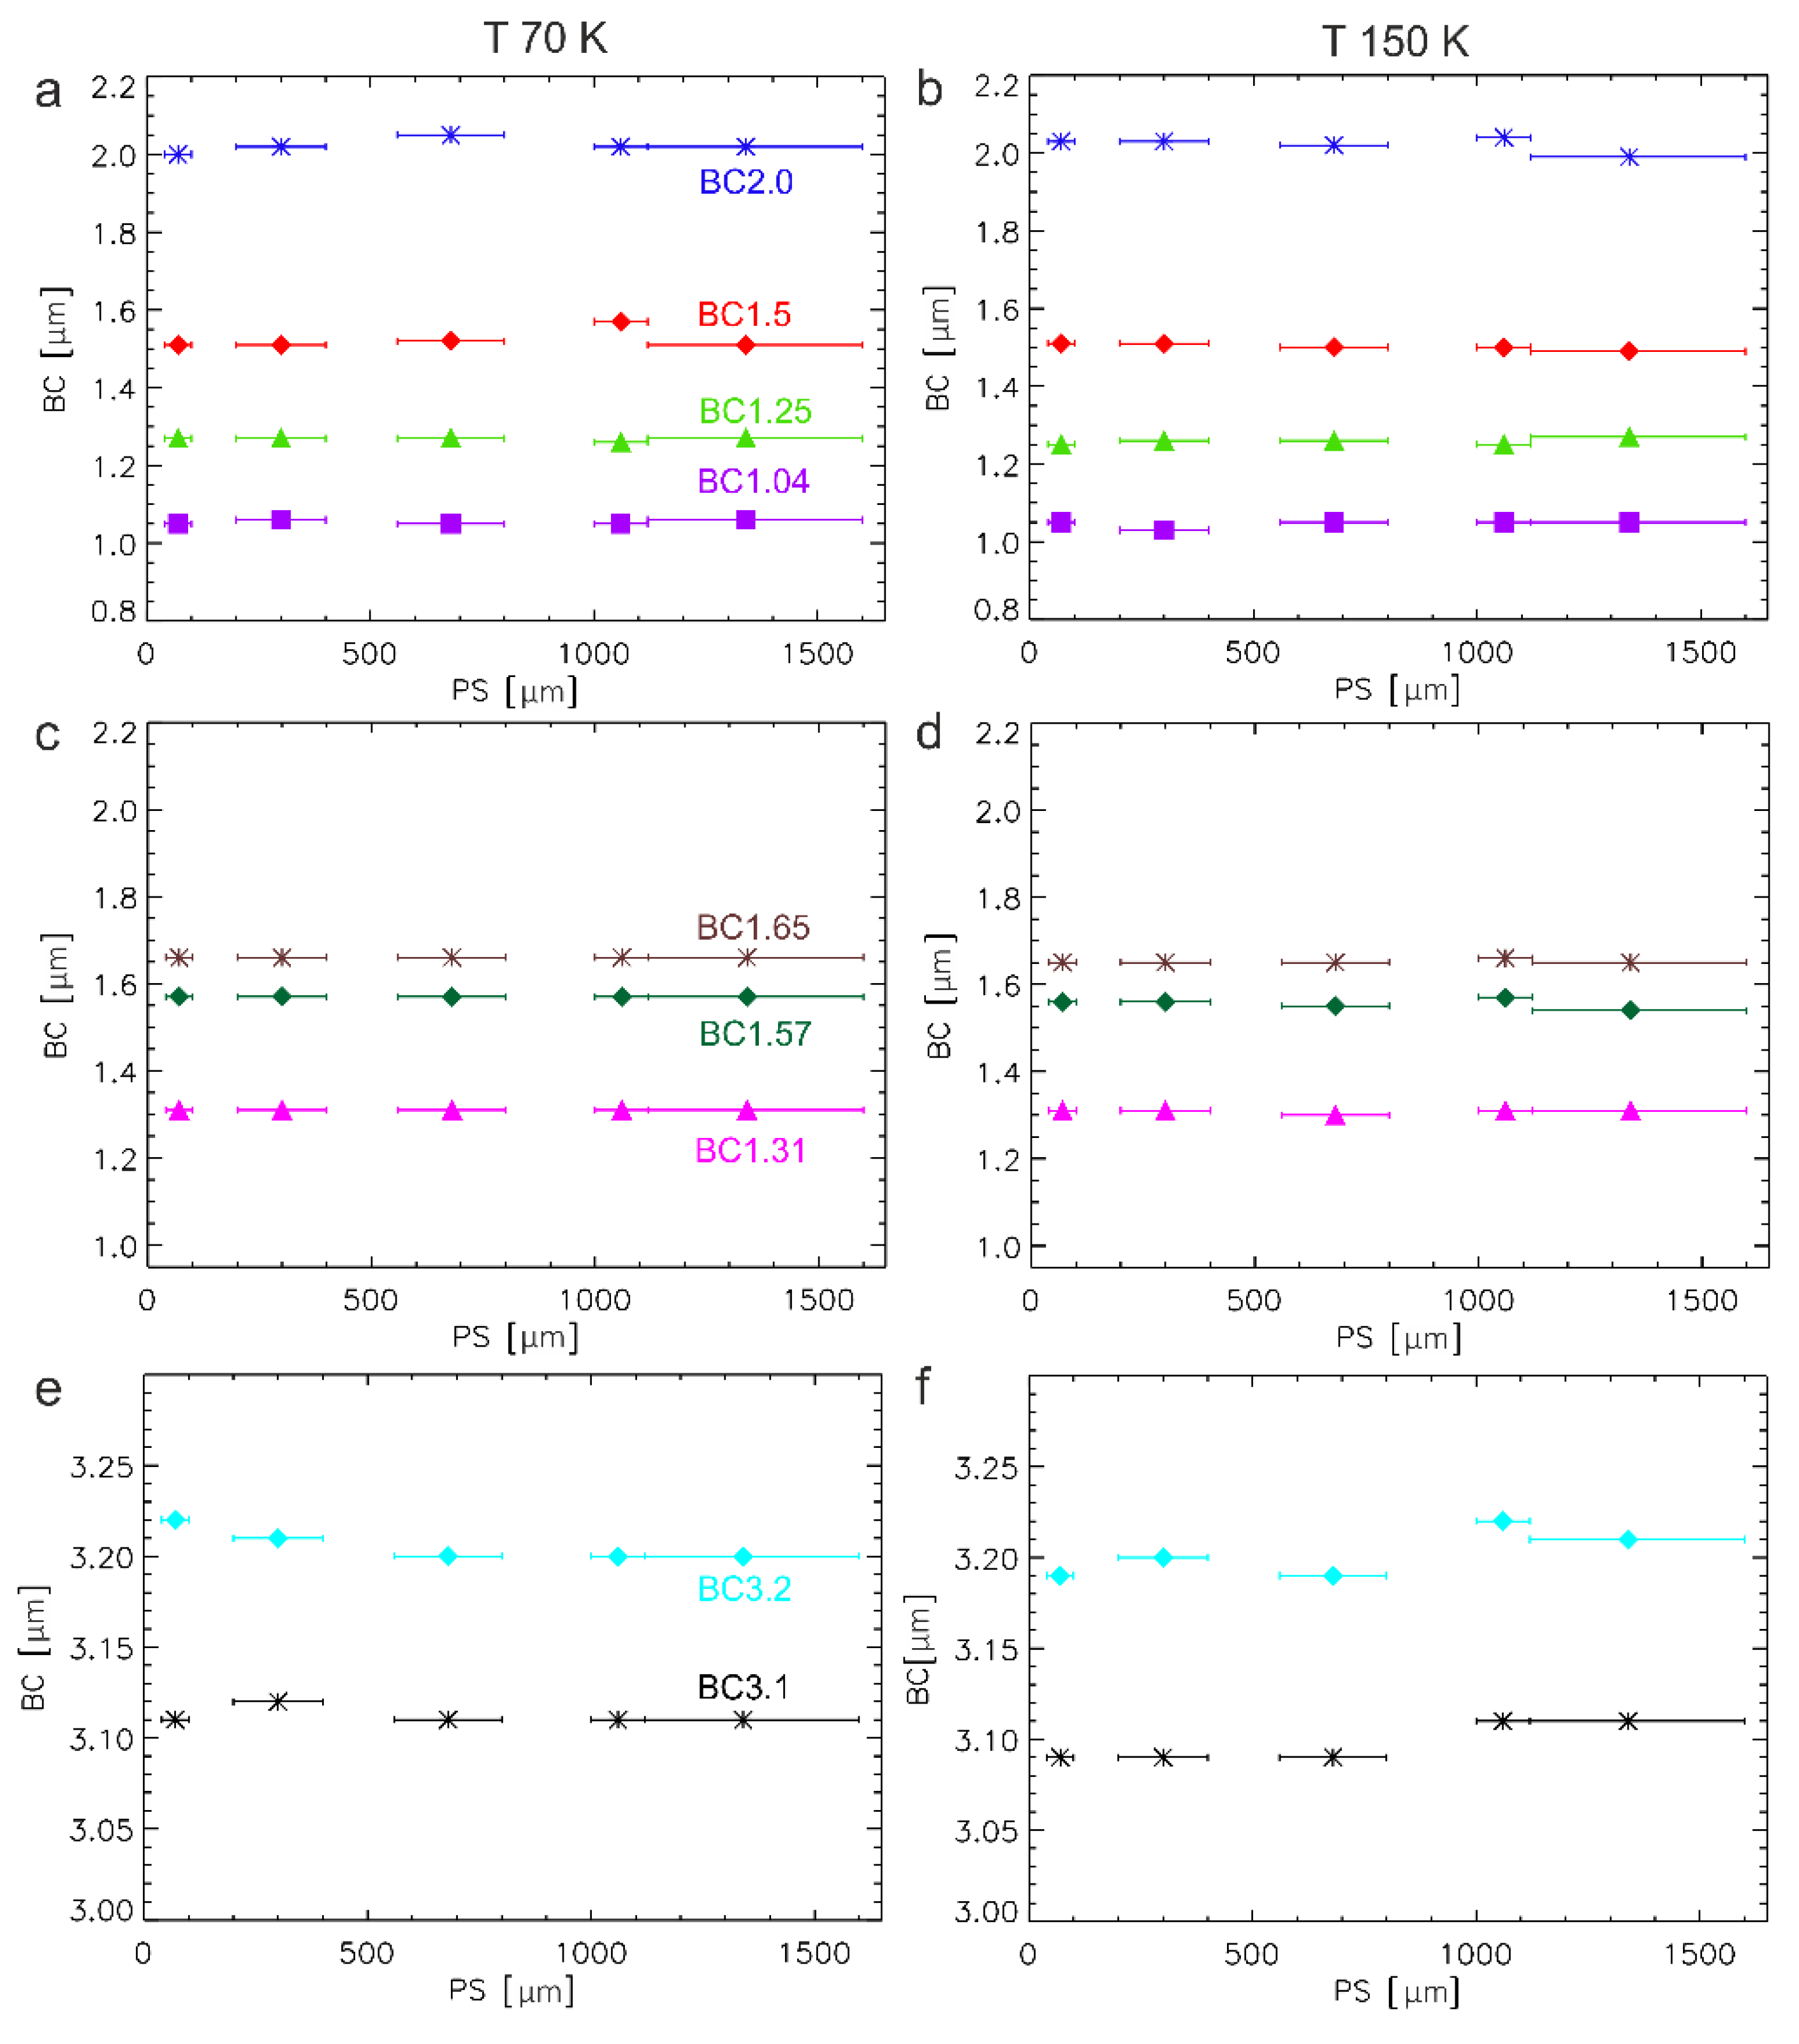
  • as the BDs of the H2O-ice absorptions at 1.31, 1.57, and 1.65 µm increase with decreasing temperature, they can affect the band centers (BCs) of the H2O-ice absorptions at 1.25 µm and possibly also at 1.5 and 2 µm;
  • similarly, also the Fresnel reflection peak at 3.1 µm with its associated peak at 3.2 µm also weakens with increasing temperature and the BC slightly shifts to shorter wavelengths;
  • the intensity of the Fresnel reflection peak also varies with H2O-ice particle size at low temperatures;
  • the trends in the spectral parameters (BD, BC, FWHM) with temperature are the same for cooling or heating the samples;
  • the trends in the spectral parameters (BD, BC, FWHM) with temperature are the same for particles with a spherical and an irregular shape;
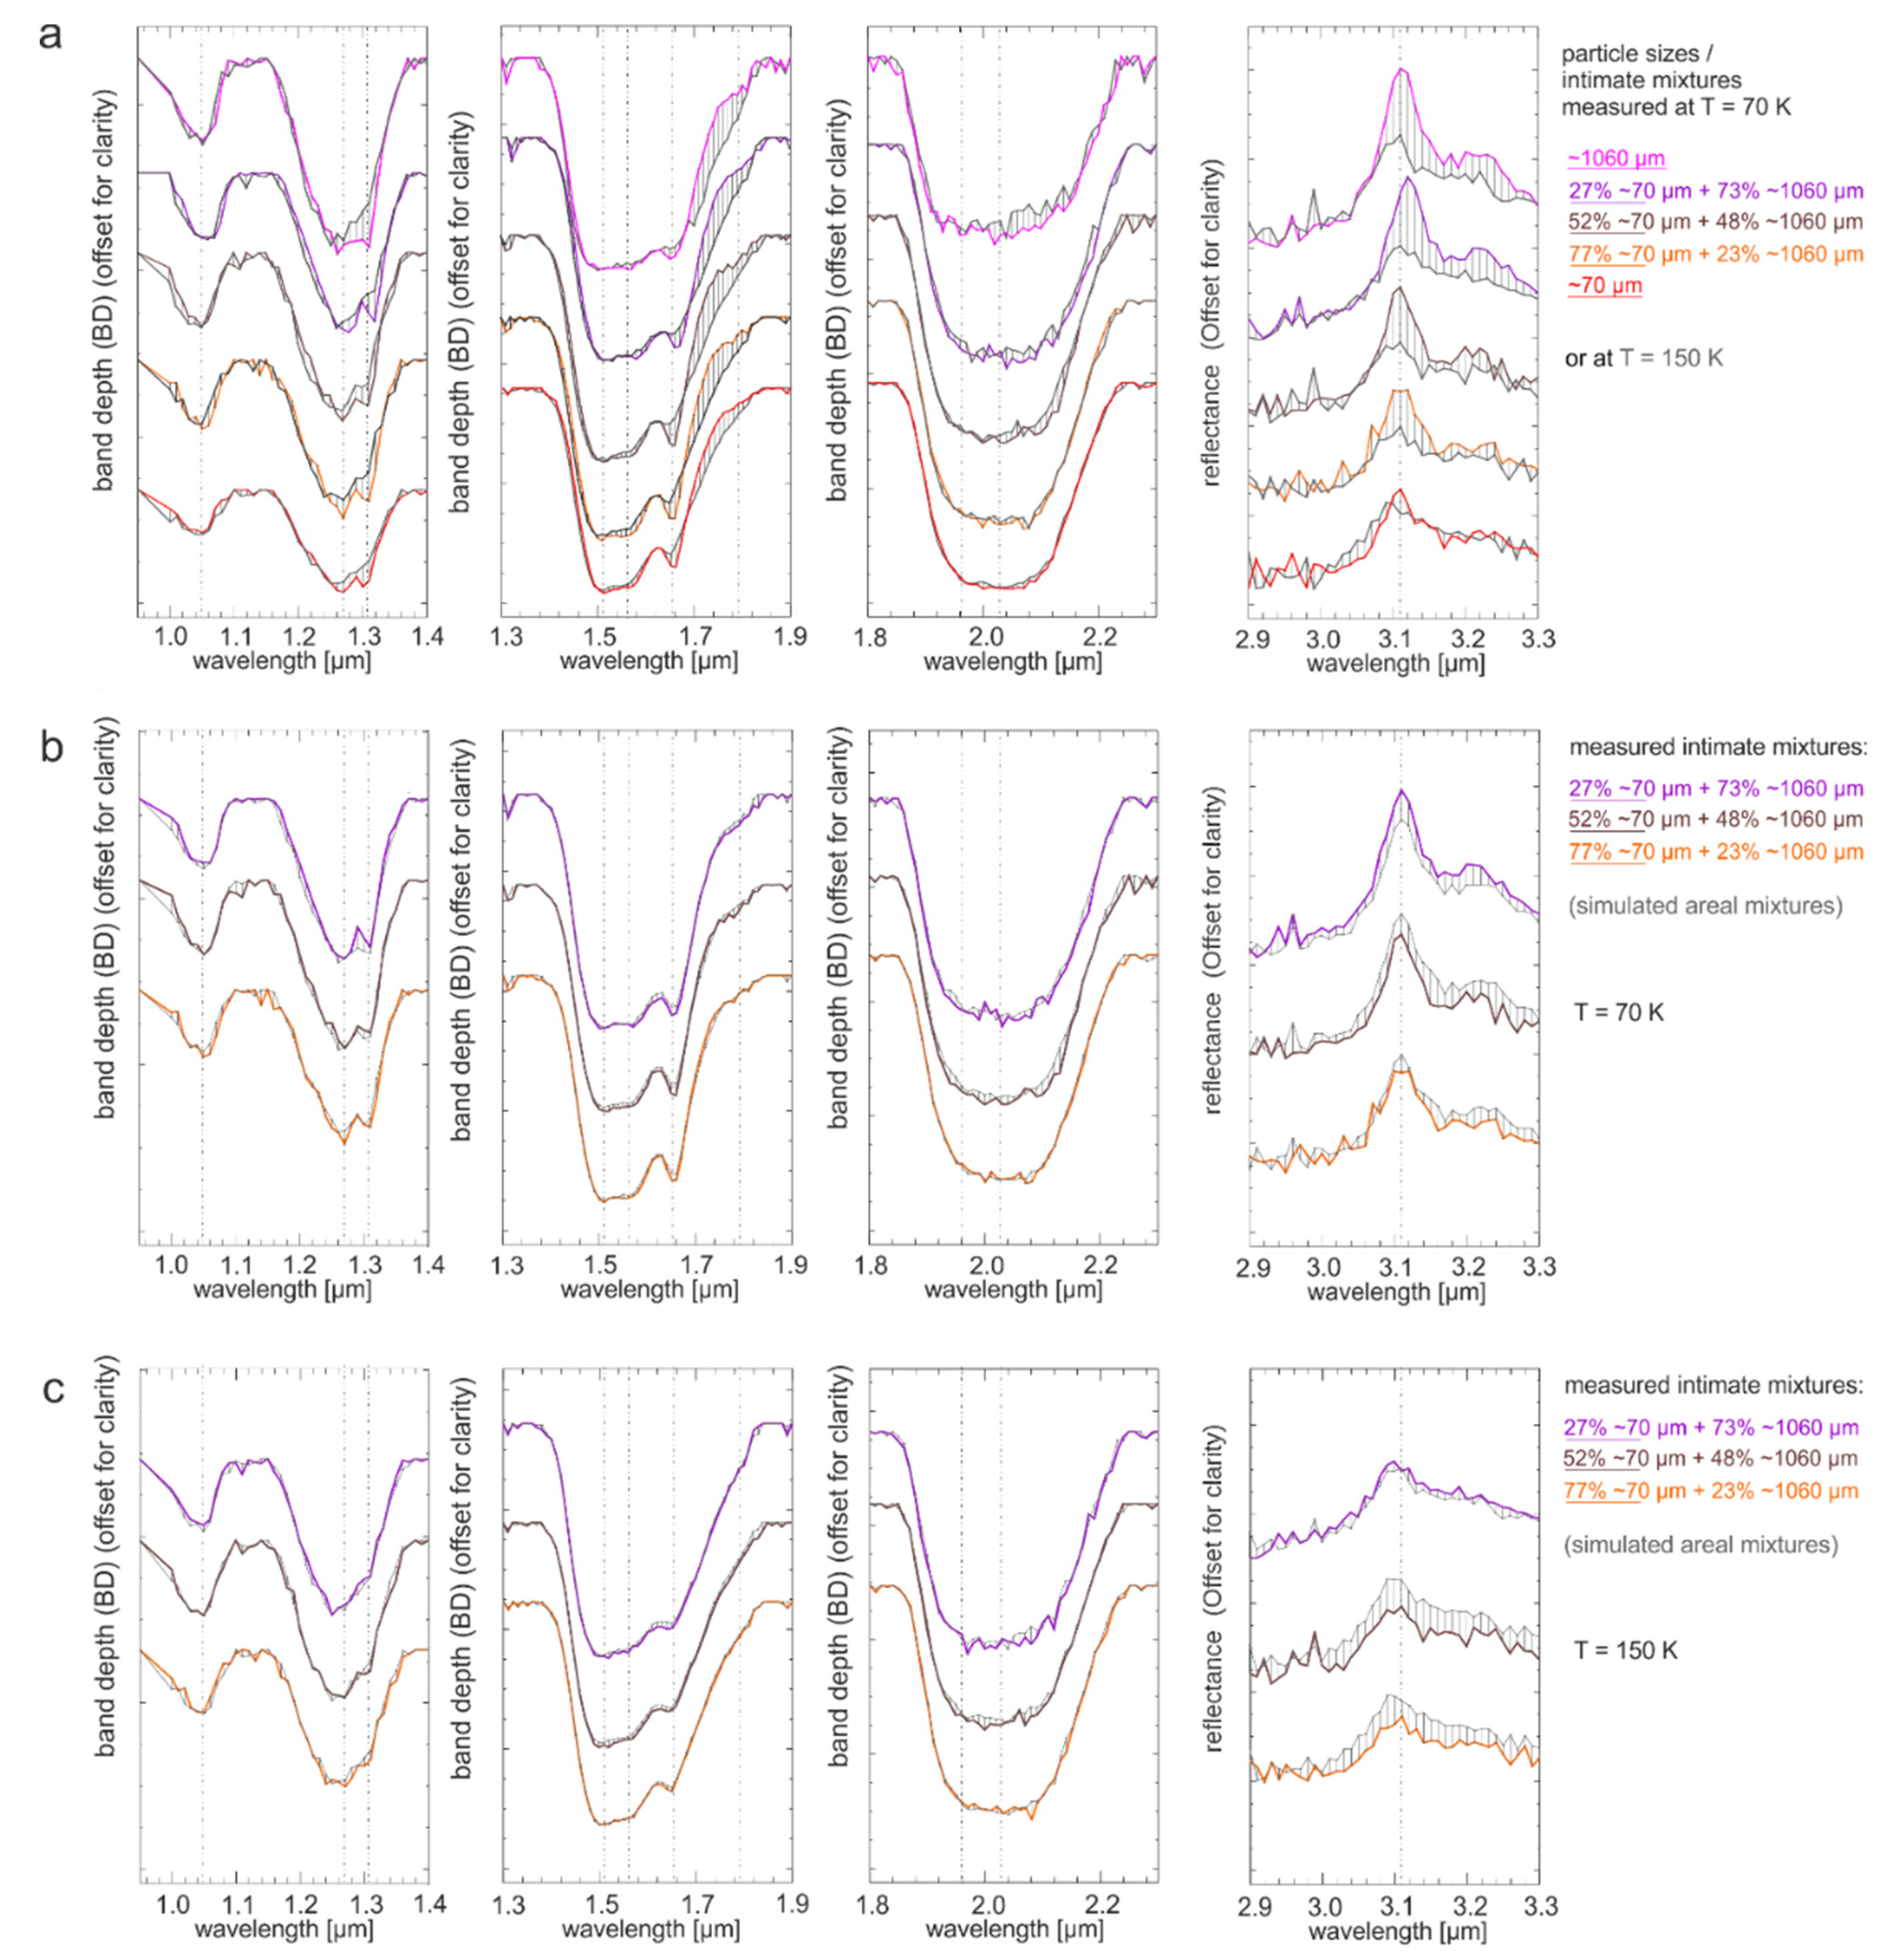
  • the shape and the BC of the H2O-ice absorption bands at 1.5 and 2 µm can be affected by the saturation of the bands in the case of large H2O-ice particles (>~680 µm).
The results of our measurements support that mapping particle size variations on icy satellites, and in particular on Ganymede’s and Callisto’s surface, can be performed independently from temperature effects by using the BDs of the major H2O-ice absorptions at least in the case of H2O ice expected to be more or less pure [4]. This is important when studying global variations and local surface features such as impact craters at different geographic locations and/or on different icy bodies. Special care, however, should be taken in the case of large H2O-ice particles and major H2O-ice absorptions affected by saturation. Moreover, the measured spectra provide an online spectral library [36] for future studies of icy satellites surface and the quantification of H2O-ice particle size on these bodies. Since the BDs of the absorptions at 1.04, 1.25, 1.5, and 2 µm inferred from linear mixtures of spectra of individual particles sizes provide a relatively close match to the BDs inferred from measured spectra of particle size binary mixtures, when relatively large variations in the size of the H2O-ice particles are expected, linear combinations of measured spectra can prove to be useful for providing a first characterization of the average particle size on these bodies. Although, it has to be noted that this assumption only covers the particle size range discussed here and might not be valid in the case of micrometer and submicrometer-sized H2O-ice particles, which are supposed to cover some of the Saturnian icy satellites [37]. Areal mixtures have been claimed to be sufficient to describe the mixtures of H2O-ice and dark non-ice material(s) on Ganymede and Callisto due to thermal segregation of both materials over time [38]. However, [3,4] advocated that the ratios of BDs of the H2O-ice absorptions are usable as indicators for particle size variations on icy bodies, even when H2O ice is mixed with most non-ice material(s) supposed to exist on the bodies. This has yet to be verified in the laboratory for the particle size ranges and temperatures on these bodies and will be the focus of future works.
Contrary to the H2O-ice particle size measurements, the mapping of temperature effects and/or crystallinity of H2O ice on icy satellites’ surfaces could be more challenging, particularly when the H2O ice is mixed with non-icy strongly absorbing compounds. Spectral indicators used in previous studies such as [23,37] to map differences in the surface temperature on icy Saturnian satellites and Europa could be difficult to apply on Ganymede and Callisto, because they make use of the 3.6 μm-peak of H2O ice, which is too weak in the particle size range expected on these bodies and studied in this work (Figure 1). Nevertheless, Ref. [39] exploited the relative intensities of the 1.65 and 1.5 µm bands to infer surface temperature but using numerical modeling. They noted that the temperature can be well constrained when the surface is dominated by crystalline H2O ice, independently of the presence of other absorbers, ice-free regions, and unusual scattering effects but “errors in derived temperatures can result if the ice is contaminated with other H2O ice phases, with bound water in hydrated minerals, by radiation damage, or with other unanticipated absorbers with spectral features coincident with the H2O absorptions”, such as for Europa and Enceladus.
Although, the samples studied in this work have be shown to be dominated by crystalline (hexagonal) H2O ice, spectral variations have been identified that were previously used as an indicator for variations in the crystallinity of H2O ice [32]. The appearance and strength of the absorptions at 1.31, 1.57, and 1.65 μm and the Fresnel reflection peak of H2O ice at 3.1 μm, which have been used in previous works to distinguish between amorphous and crystalline H2O ice [2,6], have been found to vary with temperature (and particle size) as well. Further, the H2O-ice absorptions 1.5 and 2 µm can exhibit BCs similar to amorphous H2O ice but are rather thought to be the result of saturation affecting these absorptions in the case of large particle sizes. Particularly on icy satellites such as Ganymede, although crystalline H2O ice is dominant on its surface, amorphous H2O ice is also assumed to be present [2,40] due to radiation- or impact-induced amorphization. In this case, a combined analysis of the spectral parameters of the spectral features of H2O-ice including the Fresnel reflection peaks in combination with their geographical and geological context might be necessary to disentangle the influences of the local surface temperature and the radiation environment and to evaluate separately the particles size, crystallinity, and surface temperature of H2O ice.

Author Contributions

Conceptualization, K.S. and M.C.; original draft preparation, K.S.; writing-review and editing, K.S., M.C., O.P., B.S., A.R. and D.H.; visualization and figures, K.S., M.C., O.P., and B.S.; formal analysis, K.S. and M.C.; supervision, K.S.; data acquisition, K.S., M.C., O.P., A.R. and D.H.; funding acquisition, K.S. and M.C. All authors have read and agreed to the published version of the manuscript.

Funding

This work has been supported by the Europlanet 2020-RI program through a Trans-National Access funding. Europlanet 2020 RI has received funding from the European Union’s Horizon 2020 research and innovation program under grant agreement No 654208.

Data Availability Statement

All measured spectra and their associated sample information are available through the CSS database of the SSHADE database infrastructure for solid spectroscopy (https://0-doi-org.brum.beds.ac.uk/10.26302/SSHADE/EXPERIMENT_OP_20201223_001, accessed on 20 November 2021), also supported by the Europlanet 2020-RI program.

Acknowledgments

We are grateful for the opportunity to perform the described measurements at the Cold Surfaces Spectroscopy (CSS) facility of the Institut de Planétologie et d’Astrophysique de Grenoble (IPAG) lead by Bernard Schmitt and would like to thank Olivier Brissaud, Pierre Beck, and Istiqomah Istiqomah for their help during the TNA visit and the experiments and Sandra Potin for the development of the code we used to correct the spectra for effects of transmission and multiple reflections.

Conflicts of Interest

The authors declare no conflict of interest.

References

  1. Grasset, O.; Dougherty, M.K.; Coustenis, A.; Bunce, E.J.; Erd, C.; Titov, D.; Blanc, M.; Coates, A.; Drossart, P.; Fletcher, L.N.; et al. JUpiter ICy moons Explorer (JUICE): An ESA mission to orbit Ganymede and to characterise the Jupiter system. Planet. Space Sci. 2013, 78, 1–21. [Google Scholar] [CrossRef]
  2. Hansen, G.B.; McCord, T.B. Amorphous and crystalline ice on the Galilean satellites: A balance between thermal and radiolytic processes. J. Geophys. Res. 2004, 109, E01012. [Google Scholar] [CrossRef]
  3. Stephan, K.; Ciarniello, M.; Jaumann, R.; Ore, C.D.; Filacchione, G.; Cruikshank, D.P.; Wagner, R. H2O-Ice Particle Sizes of Fresh Impact Craters in the Jovian and Saturnian System—Relationships to Subsurface Properties and Surface Temperature. In Proceedings of the Lunar and Planetary Science Conference, The Woodlands, TX, USA, 16–20 March 2020; Volume 2372. [Google Scholar]
  4. Stephan, K.; Hibbitts, C.A.; Jaumann, R. H2O-ice particle size variations across Ganymede’s and Callisto’s surface. Icarus 2020, 337, 113440. [Google Scholar] [CrossRef]
  5. Mura, A.; Adriani, A.; Sordini, R.; Sindoni, G.; Plainaki, C.; Tosi, F.; Filacchione, G.; Bolton, S.; Zambon, F.; Hansen, C.J.; et al. Infrared Observations of Ganymede From the Jovian InfraRed Auroral Mapper on Juno. J. Geophys. Res. 2020, 125, e2020JE006508. [Google Scholar] [CrossRef]
  6. Grundy, W.M.; Schmitt, B. The temperature-dependent near-infrared absorption spectrum of hexagonal H2O ice. J. Geophys. Res. 1998, 103, 25809–25822. [Google Scholar] [CrossRef]
  7. Mastrapa, R.M.E.; Bernstein, M.P.; Sandford, S.A.; Roush, T.L.; Cruikshank, D.P.; Ore, C.M.D. Optical constants of amorphous and crystalline H2O-ice in the near infrared from 1.1 to 2.6 μm. Icarus 2008, 197, 307–320. [Google Scholar] [CrossRef]
  8. Mastrapa, R.M.E.; Sandford, S.A.; Roush, T.L.; Cruikshank, D.P.; Ore, C.M.D. Optical Constants of Amorphous and Crystalline H2O-ice: 2.5–22 μm (4000–455 cm–1) Optical Constants of H2O-ice. Astrophys. J. 2009, 701, 1347. [Google Scholar] [CrossRef]
  9. Hapke, B. Theory of Reflectance and Emittance Spectroscopy; Cambridge University Press: Cambridge, UK, 1993; p. 513. [Google Scholar]
  10. Roush, T.L. Charon: More than Water Ice? Icarus 1994, 108, 243–254. [Google Scholar] [CrossRef]
  11. Hansen, G.B. Calculation of single-scattering albedos: Comparison of Mie results with Hapke approximations. Icarus 2009, 203, 672–676. [Google Scholar] [CrossRef]
  12. Grundy, W.M.; Douté, S.; Schmitt, B. A Monte Carlo ray-tracing model for scattering and polarization by large particles with complex shapes. J. Geophys. Res. 2000, 105, 29291. [Google Scholar] [CrossRef]
  13. Squyres, S.W. Surface temperatures and retention of H2O frost on Ganymede and Callisto. Icarus 1980, 44, 502–510. [Google Scholar] [CrossRef]
  14. Pommerol, A.; Poch, O.; Jost, B.; Feller, C.; Capelo, H.; Spadaccia, S.; Sunshine, J.; Thomas, N. Sublimation of ice/dust mixtures. In Proceedings of the Joined EPSC-DPS Meeting 2019, Geneva, Switzerland, 15–20 September 2019. [Google Scholar]
  15. Grisolle, F.; Schmitt, B.; Beck, P.; Philippe, S.; Brissaud, O. Experimental simulation of the condensation and metamorphism of seasonal CO2 condensates under martian conditions. In Proceedings of the European Planetary Science Conference (EPSC) 2014, Cascais, Portugal, 7–12 September 2014. [Google Scholar]
  16. Brissaud, O.; Schmitt, B.; Bonnefoy, N.; Douté, S.; Rabou, P.; Grundy, W.; Fily, M.J.A.O. Spectrogonio Radiometer for the Study of the Bidirectional Reflectance and Polarization Functions of Planetary Surfaces. 1. Design and Tests. Appl. Opt. 2004, 43, 1926. [Google Scholar] [CrossRef]
  17. Bonnefoy, N. Développement d’un Spectrophoto-Goniomètre pour l’étude de la Réflectance Bidirectionnelle des Surfaces Géophysiques. Application au Soufre et Perspectives pour le Satellite Io. Ph.D. Thesis, LPG Université Joseph Fourier, Grenoble, France, 2001. [Google Scholar]
  18. Pommerol, A.; Schmitt, B.; Beck, P.; Brissaud, O. Water sorption on martian regolith analogs: Thermodynamics and near-infrared reflectance spectroscopy. Icarus 2009, 204, 114–136. [Google Scholar] [CrossRef]
  19. Warren, S.G. Optical constants of ice from the ultraviolet to the microwave. Appl. Opt. 1984, 23, 1206–1225. [Google Scholar] [CrossRef] [PubMed]
  20. Warren, S.G.; Brandt, R.E. Optical constants of ice from the ultraviolet to the microwave: A revised compilation. J. Geophys. Res. 2008, 113, D14220. [Google Scholar] [CrossRef]
  21. Schmitt, B.; Quirico, E.; Trotta, F.; Grundy, W.M. Optical Properties of Ices From UV to Infrared. In Solar System Ices: Based on Reviews Presented at the International Symposium “Solar System Ices” Held in Toulouse; Schmitt, B., De Bergh, C., Festou, M., Eds.; Springer: Dordrecht, The Netherlands, 1995; pp. 199–240. [Google Scholar]
  22. Filacchione, G.; D’Aversa, E.; Capaccioni, F.; Clark, R.N.; Cruikshank, D.P.; Ciarniello, M.; Cerroni, P.; Bellucci, G.; Brown, R.H.; Buratti, B.J.; et al. Saturn’s icy satellites investigated by Cassini-VIMS. IV. Daytime temperature maps. Icarus 2016, 271, 292–313. [Google Scholar] [CrossRef] [Green Version]
  23. Filacchione, G.; Adriani, A.; Mura, A.; Tosi, F.; Lunine, J.I.; Raponi, A.; Ciarniello, M.; Grassi, D.; Piccioni, G.; Moriconi, M.L.; et al. Serendipitous infrared observations of Europa by Juno/JIRAM. Icarus 2019, 328, 1–13. [Google Scholar] [CrossRef]
  24. Clark, R.N.; Roush, T.L. Reflectance spectroscopy: Quantitative analysis techniques for remote sensing applications. J. Geophys. Res. Solid Earth 1984, 89, 6329–6340. [Google Scholar] [CrossRef]
  25. Stephan, K.; Jaumann, R.; Wagner, R.; Clark, R.N.; Cruikshank, D.P.; Hibbitts, C.A.; Roatsch, T.; Hoffmann, H.; Brown, R.H.; Filiacchione, G.; et al. Dione’s spectral and geological properties. Icarus 2010, 206, 631–652. [Google Scholar] [CrossRef] [Green Version]
  26. Cloutis, E.A.; Izawa, M.R.M.; Pompilio, L.; Reddy, V.; Hiesinger, H.; Nathues, A.; Mann, P.; le Corre, L.; Palomba, E.; Bell, J.F. Spectral reflectance properties of HED meteorites+CM2 carbonaceous chondrites: Comparison to HED grain size and compositional variations and implications for the nature of low-albedo features on Asteroid 4 Vesta. Icarus 2013, 223, 850–877. [Google Scholar] [CrossRef]
  27. Clark, R.N. Ganymede, Europa, Callisto, and Saturn’s rings: Compositional analysis from reflectance spectroscopy. Icarus 1980, 44, 388–409. [Google Scholar] [CrossRef]
  28. Clark, R.N.; Lucey, P.G. Spectral properties of ice-particulate mixtures and implications for remote sensing. 1. Intimate mixtures. J. Geophys. Res. 1984, 89, 6341–6348. [Google Scholar] [CrossRef]
  29. Mastrapa, R.M.E.; Grundy, W.M.; Gudipati, M.S. Amorphous and Crystalline H2O-Ice. In The Science of Solar System Ices; Gudipati, M.S., Castillo-Rogezedited, J., Eds.; Springer: Berlin/Heidelberg, Germany, 2013; pp. 371–408. [Google Scholar] [CrossRef]
  30. Jenniskens, P.; Blake, D.F.; Kouchi, A.J. Amorphous Water Ice—A solar system material. In Solar System Ices; Schmitt, B., De Bergh, C., Festou, M., Eds.; Astrophysics and Space Science Library; Springer: Dordrecht, The Netherlands, 1998; Volume 227, pp. 139–155. [Google Scholar] [CrossRef]
  31. Feng, H.; Xu, Y.; Yang, T. Study on Leidenfrost effect of cryoprotectant droplets on liquid nitrogen with IR imaging technology and non-isothermal crystallization kinetics model. Int. J. Heat Mass Transf. 2018, 127, 413–421. [Google Scholar] [CrossRef]
  32. Clark, R.N.; Cruikshank, D.P.; Jaumann, R.; Brown, R.H.; Stephan, K.; Dalle Ore, C.M.; Eric Livo, K.; Pearson, N.; Curchin, J.M.; Hoefen, T.M.; et al. The surface composition of Iapetus: Mapping results from Cassini VIMS. Icarus 2012, 218, 831–860. [Google Scholar] [CrossRef]
  33. Manolakis, D.G.; Lockwood, R.B.; Cooley, T.W. Spectral Mixture Analysis. In Hyperspectral Imaging Remote Sensing: Physics, Sensors, and Algorithms; Cambridge University Press: Cambridge, UK, 2016; pp. 443–493. [Google Scholar] [CrossRef]
  34. Ciarniello, M.; Capaccioni, F.; Filacchione, G.; Clark, R.N.; Cruikshank, D.P.; Cerroni, P.; Coradini, A.; Brown, R.H.; Buratti, B.J.; Tosi, F.; et al. Hapke modeling of Rhea surface properties through Cassini-VIMS spectra. Icarus 2011, 214, 541–555. [Google Scholar] [CrossRef] [Green Version]
  35. Clark, R.N.; Cruikshank, P.D.; Dalle Ore, C.M.; Jaumann, R.; Curchin, J.M.; Hoefen, T.M.; Stephan, K.; Buratti, B.J.; Filacchione, G.; Baines, K.H.; et al. Composition and Grain Sizes of Dark Material in Saturn’s Icy Satellites and Rings. EPSC-DPS Jt. Meet. 2011, 2011, 1563. [Google Scholar]
  36. Stephan, K.; Ciarniello, M.; Poch, O.; Haack, D.; Raponi, A. Vis-NIR Reflectance Spectra of H2O Ice with Varying Grain Sizes (70–1060 µm), Shapes (Spherical or Irregular) and Three Mixtures, from 70 to 220 K; SSHADE: “Solid Spectroscopy Hosting Architecture of Databases and Expertise” and Its Databases; OSUG Data Center: Grenoble, France, 26 November 2021; Available online: https://www.sshade.eu/data/EXPERIMENT_OP_20201223_001 (accessed on 20 November 2021).
  37. Filacchione, G.; Capaccione, F.; Ciarniello, M.; Clark, R.N.; Cuzzi, J.N.; Nicholson, P.D.; Cruikshank, P.D.; Hedman, M.M.; Buratti, B.J.; Lunine, J.; et al. Saturn’s icy satellites and rings investigated by Cassini-VIMS: III-Radial compositional variability. Icarus 2012, 220, 1064–1096. [Google Scholar] [CrossRef] [Green Version]
  38. McCord, T.B.; Hansen, G.B.; Clark, R.N.; Martin, P.D.; Hibbitts, C.A.; Fanale, F.P.; Grnahan, J.C.; Segura, M.; Matson, D.L.; Johnson, T.V.; et al. Non-water-ice constituents in the surface material of the icy Galilean satellites from the Galileo near-infrared mapping spectrometer investigation. J. Geophys. Res. 1998, 103, 8603–8626. [Google Scholar] [CrossRef]
  39. Grundy, W.M.; Buie, M.W.; Stansberry, J.A.; Spencer, J.R.; Schmitt, B. Near-Infrared Spectra of Icy Outer Solar System Surfaces: Remote Determination of H2O Ice Temperatures. Icarus 1999, 142, 536–549. [Google Scholar] [CrossRef]
  40. Ligier, N.; Paranicas, C.; Carter, J.; Poulet, F.; Calvin, W.M.; Nordheim, T.A.; Snodgrass, C.; Ferellec, L. Surface composition and properties of Ganymede: Updates from ground-based observations with the near-infrared imaging spectrometer SINFONI/VLT/ESO. Icarus 2019, 333, 496–515. [Google Scholar] [CrossRef] [Green Version]
Figure 1. Left column: optical images of the samples prepared for the study with particle sizes of (a) ~70 µm, (b): sprayed ~300 µm; (c): crushed ~300 µm, (d) ~680 µm, (e) ~1060 µm, (f) ~1360 µm and examples of particle size mixtures such as (g) 52%~70 µm + 48%~1060 µm, and (h) and 77%~70 µm + 23%~1060 µm. Right column: resulting spectra of the samples at different particle sizes (i) and of the particle size mixtures (j) over the entire wavelength interval (0.4–4.2 µm) measured at 70 K.
Minerals 11 01328 g001
Figure 2. Close view onto the individual spectral signatures of the H2O-ice spectra varying with temperature (a) spectra of the samples with the five different particle sizes measured between 70 and 150 K, (b) the irregular 300 µm particles measured during cooling from 150 to 70 K and heating from 70 to 150 K and then 220 K. From left to right: the band depth (BD) of the H2O-ice absorptions at 1.04 and 1.25 µm with the 1.31-µm absorption, at 1.5 µm with the absorption at 1.57 and 1.65 µm, and at 2 µm, as well as the Fresnel reflection peaks at 3.1 and 3.2 µm. All spectra are normalized to the spectral continuum (except for the 3.1 and 3.2 µm peak) and offset for clarity.
Minerals 11 01328 g002
Figure 3. The derived band depth (BD) of (a,b) the H2O-ice absorptions at 1.04, 1.25, 1.5, and 2 µm and (c,d) at 1.31, 1.57, and 1.65 µm, as well as (e,f) the intensity (I) of the Fresnel reflection peak separately measured at 3.1 and 3.2 µm versus the average particle size (PS) of the samples as derived from spectra measured at a temperature of 70 (left column) and 150 K (right column). The studied H2O-ice features are indicated by different colors. Error bars indicate the particle size range given by the sieves to prepare the samples.
Minerals 11 01328 g003
Figure 4. The derived band center (BC) of (a,b) the H2O-ice absorptions at 1.04, 1.25, 1.5, and 2 µm and (c,d) at 1.31, 1.57, and 1.65 µm, as well as (e,f) the Fresnel reflection peak separately measured at 3.1 and 3.2 µm versus the average particle size (PS) of the samples as derived from spectra measured at a temperature of 70 (left column) and 150 K (right column). The studied H2O-ice features are indicated by different colors. Error bars indicate the particle size range given by the sieves to prepare the samples.
Minerals 11 01328 g004
Figure 5. The derived full width at half maximum (FWHM) of (a,b) the H2O-ice absorptions at 1.04, 1.25, 1.5, and 2 µm and (c,d) at 1.31, 1.57, and 1.65 µm. The studied H2O-ice features are indicated by different colors. Error bars indicate the particle size range given by the sieves to prepare the samples.
Minerals 11 01328 g005
Figure 6. The derived band depth (BD) of (a,b) the H2O-ice absorptions at 1.04, 1.25, 1.5, and 2 µm and (c,d) at 1.31, 1.57, and 1.65 µm, as well as (e,f) the intensity (I) of the Fresnel reflection peak separately measured at 3.1 and 3.2 µm versus the temperature (T) of the samples as derived from spectra of the smallest and largest studied particle size (PS) of ~70 µm (left column) and ~1360 µm (right column). The studied H2O-ice features are indicated by different colors.
Minerals 11 01328 g006
Figure 7. The derived band center (BC) of (a,b) the H2O-ice absorptions at 1.04, 1.25, 1.5, and 2 µm and (c,d) at 1.31, 1.57, and 1.65 µm, as well as (e,f) the Fresnel reflection peak separately measured at 3.1 and 3.2 µm versus the temperature (T) of the samples as derived from spectra of the smallest and largest studied particle size (PS) of ~70 (left column) and ~1360 µm (right column). The studied H2O-ice features are indicated by different colors.
Minerals 11 01328 g007
Figure 8. Band depth (BD) variations of the H2O-ice absorptions at (a) 1.31, (b) 1.57, and (c) 1.65 µm derived for the different particles sizes (PS) at temperatures of 70 and 150 K versus the band center (BC) of the associated H2O-ice absorptions at 1.25 and 1.5 µm, respectively. The temperature is indicated by different colors. The different symbols indicate the particle sizes (PS) of the measured samples.
Minerals 11 01328 g008
Figure 9. The derived full width at half maximum (FWHM) of (a,b) the H2O-ice absorptions at 1.04, 1.25, 1.5, and 2 µm and (c,d) at 1.31, 1.57, and 1.65 µm versus the temperature (T) of the samples as derived from spectra of the smallest and largest studied particle size (PS) of ~70 (left column) and ~1360 µm (right column). The studied H2O-ice features are indicated by different colors.
Minerals 11 01328 g009
Figure 10. Spectral parameters of both spherical and irregular ~300 µm-sized H2O-ice particles during cooling from 150 to 70 K and heating (only for irregular particles) from 70 to 220 K: band depths (BDs) of the H2O-ice absorptions at (a) 1.04, 1.25, 1.5, and 2 µm, (b) at 1.31, 1.57, and 1.65 µm, (c) the intensity (I) of the Fresnel reflection peak at 3.1 and 3.2 µm, as well as (d) the FWHM and (e) the band center (BC) of all H2O-ice absorptions, and (f) the position (BC) of the Fresnel reflection peaks at 3.1 and 3.2 µm versus temperature of the measured samples. Please note that the irregular 300 µm-sized particles were the only ones that could be measured up to 220 K.
Minerals 11 01328 g010
Figure 11. Close view of the individual spectral signatures of the H2O-ice spectra of (a) the three intimate particle size mixtures measured at temperatures between 70 (colored) and 150 K (gray) compared to the spectra of the ~70 and ~1060 µm endmember samples, and (b,c) the three measured intimate mixtures (colored) compared to the corresponding simulated spectra of areal mixtures (gray) of the end-members at (b) 70 K and (c) 150 K. From left to right: the absorptions of the H2O ice at 1.04 and 1.25, 1.5, and 2 µm including the absorptions at 1.31, 1.57, and 1.65 µm, respectively, as well as the Fresnel reflection peak at 3.1 µm. All spectra are normalized (continuum removed, except for the 3.1-µm peak) and offset for clarity.
Minerals 11 01328 g011
Figure 12. Comparison of the (ag) BDs of the H2O-ice absorption bands and (h,i) the strength of the Fresnel reflection peak at 3.1 and 3.2 µm between the measured (orange) and simulated (black) H2O-ice spectra of three mixtures (27%/73%, 52%/48%, and 77%/23% depending on particle size (PS), i.e., the ~70 and ~1060 µm-sized particles and the average particle size of the mixtures being about ~800, ~550, and ~300 µm, respectively. The measured mixtures are intimate (wt%) while the simulated ones are areal (fractional area in %). The two measured endmember spectra with 70 and 1060 µm-sized particles are also shown as references (gray). Please note that the spectral parameters are exemplarily shown for the lowest (70 K) and highest (150 K) temperature.
Minerals 11 01328 g012
Figure 13. Comparison of (ag) the BDs of the H2O-ice absorption bands and (h,i) the strength of the Fresnel reflection peak at 3.1 and 3.2 µm between the measured (orange) and simulated (black) H2O-ice spectra of mixture with 77%/23% of the ~70 and ~1060 µm-sized particles and an average particle size being about ~300 µm depending on temperature. The measured mixtures are intimate (wt%), while the simulated ones are areal (fractional area in %).
Minerals 11 01328 g013
Figure 14. Comparison of (ag) the BDs of the H2O-ice absorption bands and (h,i) the strength of the Fresnel reflection peak at 3.1 and 3.2 µm between the measured (orange) and simulated (black) H2O-ice spectra of the mixture with (27%/73% of the ~70 and ~1060 µm-sized particles and an average particle size being about ~800 µm depending on temperature. The measured mixtures are intimate (wt%), while the simulated ones are areal (fractional area in %).
Minerals 11 01328 g014
Figure 15. Comparison of (a,c,e,g) the difference in the BDs (BD DIFF) of the H2O-ice absorption bands at 1.04, 1.25, 1.5, and 2 µm between the measured (BD (mix)) and simulated (BD (sim)) H2O-ice spectra, (b,d,f,h) the % of the BD diff of BD (mix) of three particles size mixtures (27%/73%, 52%/48%, and 77%/23% of the ~70 and ~1060 µm-sized particles) with the average particle size (PS) being about ~800, ~550, and ~300 µm, respectively, in comparison with (il) the difference in the BDs (BD DIFF) between the measured particle size mixtures. The measured mixtures are intimate (wt%), while the simulated ones are areal (fractional area in %).
Minerals 11 01328 g015
Figure 16. Comparison of (a,d,g) the difference in the BDs (BD DIFF) of the H2O-ice absorption bands at 1.31, 1.57, and 1.65 µm between the measured (BD (mix)) and simulated (BD (sim)) H2O-ice spectra, (b,e,h) the % of the BD diff of BD (mix) of three particles size mixtures (27%/73%, 52%/48%, and 77%/23% of the ~70 and ~1060 µm-sized particles) with the average particle size (PS) being about ~800, ~550, and ~300 µm, respectively, in comparison with (c,f,i) the difference in the BDs (BD DIFF) between the measured particle size mixtures. The measured mixtures are intimate (wt%), while the simulated ones are areal (fractional area in %).
Minerals 11 01328 g016
Publisher’s Note: MDPI stays neutral with regard to jurisdictional claims in published maps and institutional affiliations.

