
Spectral Analysis of Ceres’ Main Linear Features

 , , , ,
Abstract
:1. Introduction
2. Data
3. Selection of Linear Features
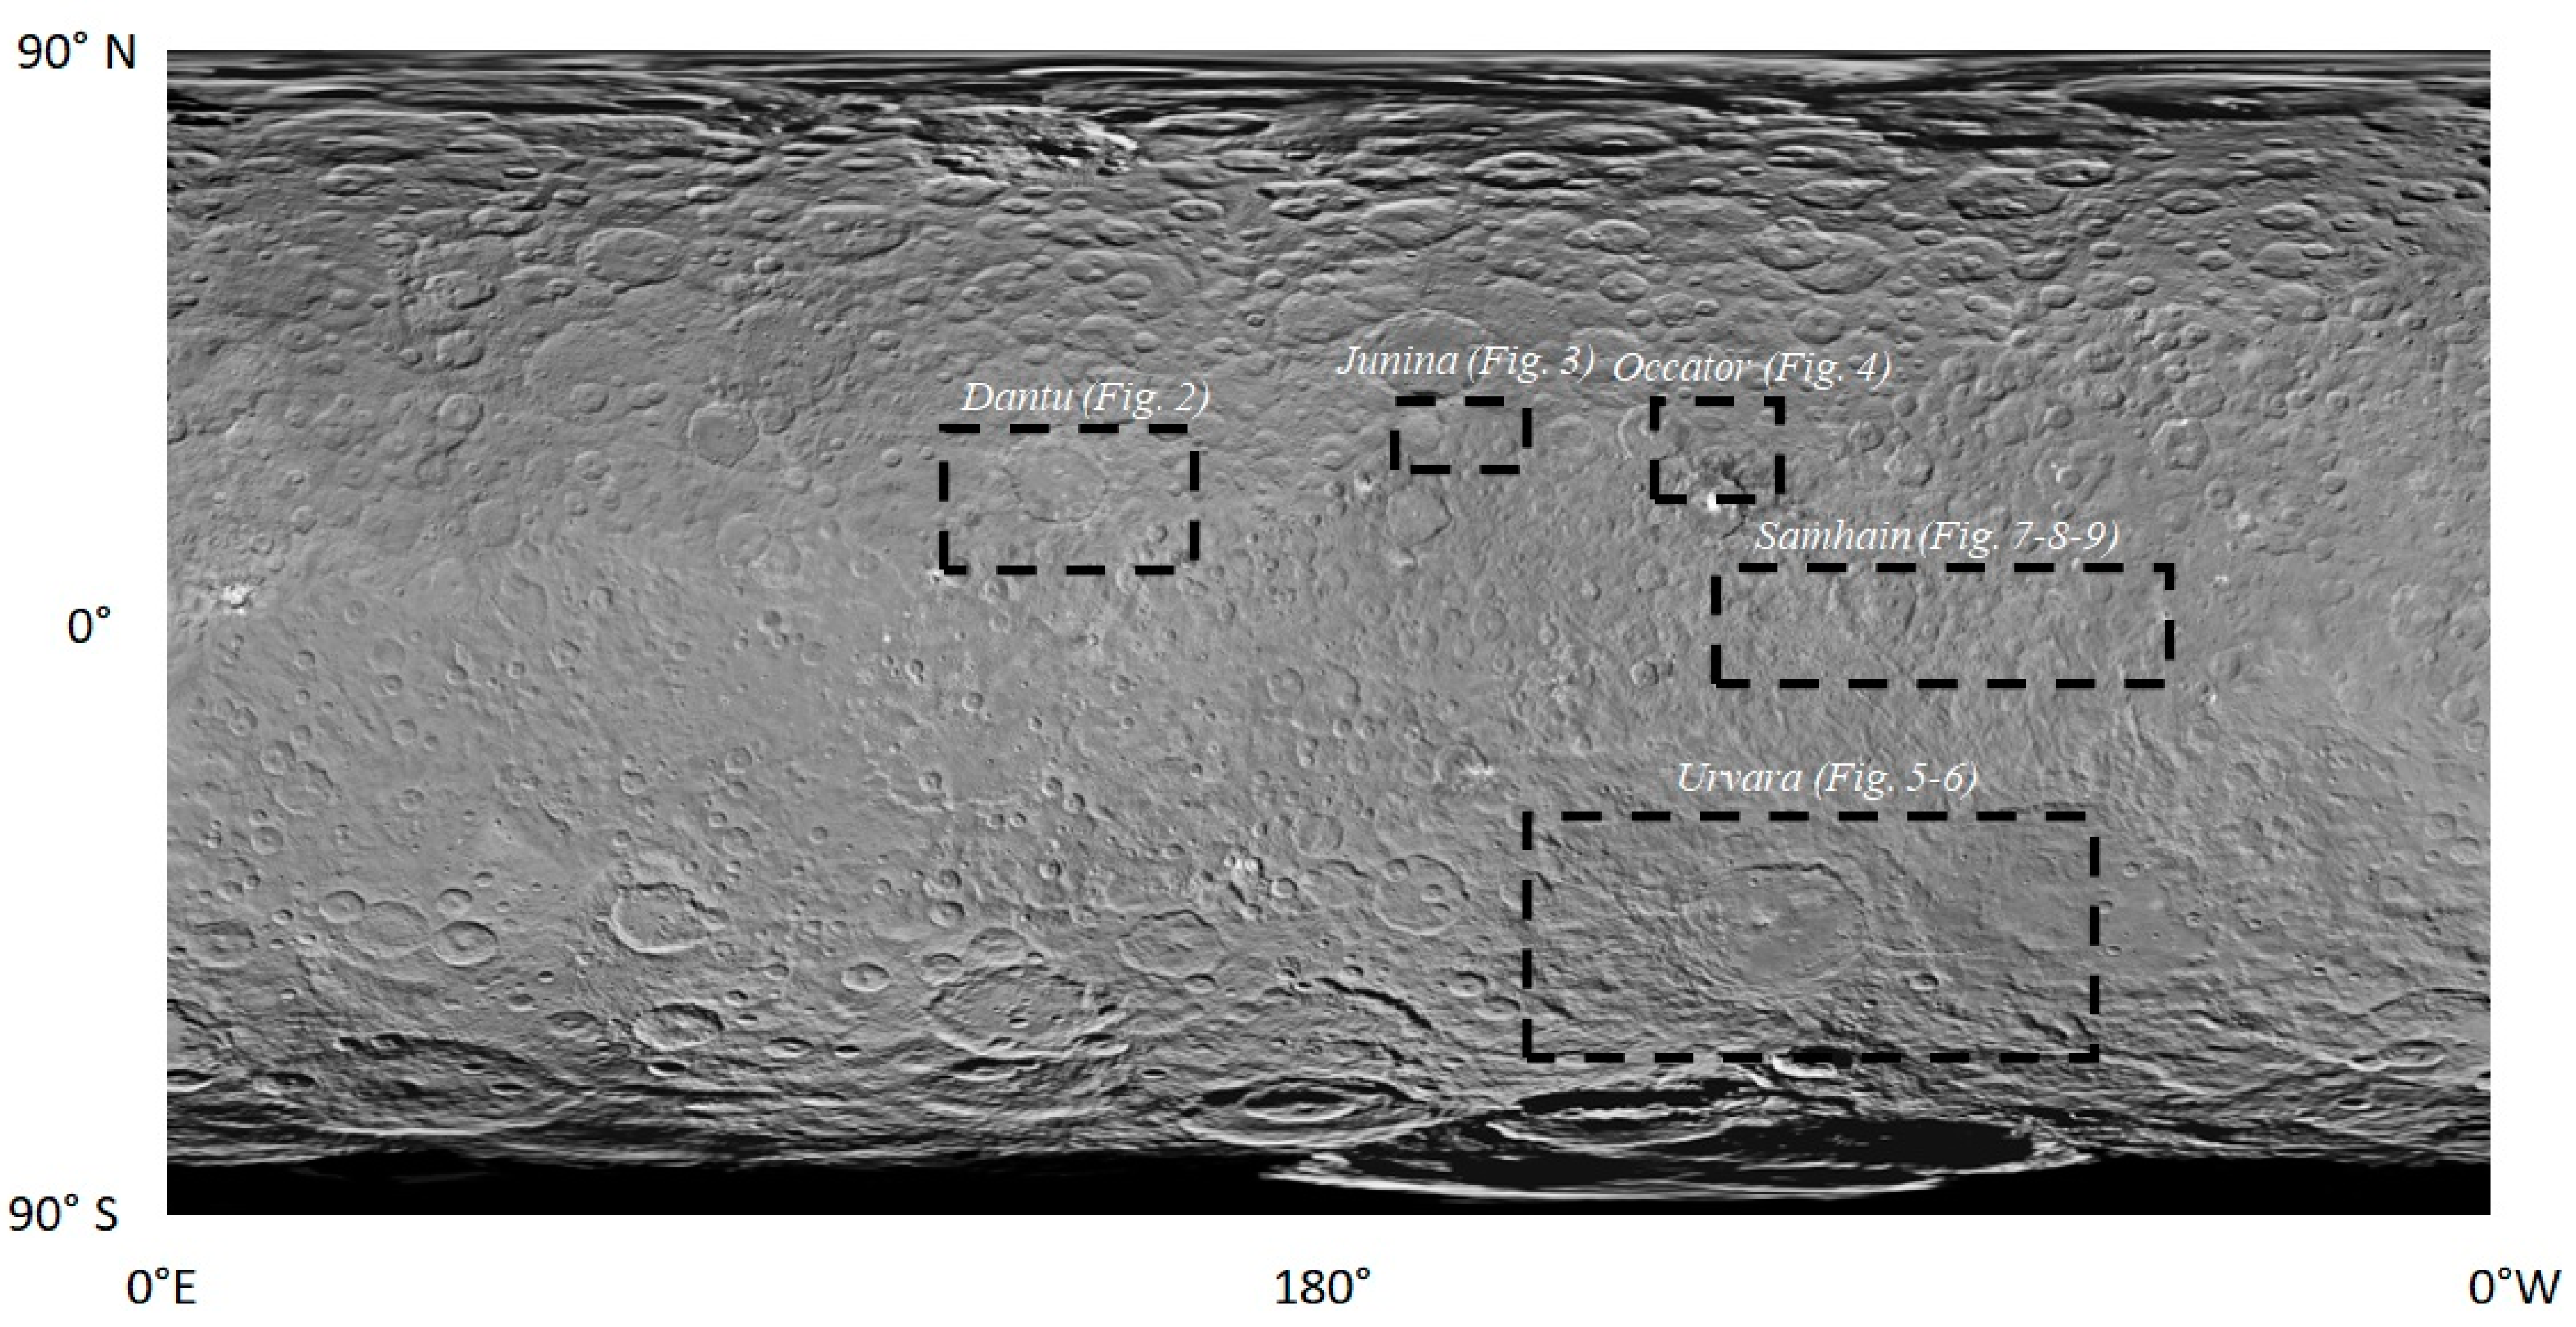
- Dantu crater chains. This group of secondary crater chains surrounds the Dantu crater, centered at 24° N 138° E. Chains extend radially from Dantu, especially west- and southwest-ward and, therefore, are thought to be generated from the impact producing the crater [24];
- Junina Catenae. The Junina Catenae is a group of 11 secondary radial chains extending from 12° to 46° N and from 95° E to 265° E, oriented in directions WNW–ESE and crosscut by several impact craters (formed after the crater chains), including Dantu and Occator [19]. According to ejecta distribution models [27], the Junina Catenae formed from the material ejected with high velocity from the impact that formed the Urvara crater, located in the Southern Hemisphere, and is distributed in a nonradial pattern due to Ceres’ rotation and low gravity;
- Urvara secondary crater chains. This is the set of crater chains formed by the material ejected from the Urvara crater, surrounding the crater itself, mainly in a north-ward direction. Differently than the Junina Catenae, these chains were formed from material ejected at low velocity, i.e., about 200 m/s [27];
- Samhain Catenae. Samhain Catenae are six pit chains extending between 10° S–10° N latitudes and 210–280° E longitudes and are NW–SE-oriented [19]. Like the Junina Catenae, the Samhain Catenae are not radial with respect to impact craters. Nevertheless, their origin is not ascribed to high-velocity material ejected from an impact far from the current chains’ location, but to surficial material draining into subsurface voids [19,25]. The surface stresses which generated these voids were likely due to a region of upwelling salt diapirs [25], but other hypotheses concern a basin-forming impact [28] and the freezing of a global subsurface ocean (thought to have occurred within hundreds of Myr after Ceres’ formation, [29]).
4. Spectral Maps
- NIR albedo is calculated at 1.2 μm as the average between the four VIR closest bands to this wavelength in order to maximize the signal-to-noise ratio;
- All the band depths are calculated as , where and , are the reflectance and the continuum at the band center wavelength (i.e., the local minimum after the continuum removal) [35]. The continuum is defined as the straight line connecting the two band shoulders. The band shoulders are calculated as follows:
- ○
- For the 2.7 μm band (ascribed to phyllosilicates), the left shoulder is the local maximum between 2.63 and 2.70 μm, and the right shoulder is the reflectance maximum of the second-order polynomials fitting the spectra between 2.8 and 3.0 μm;
- ○
- For the 3.1 μm band (ascribed to ammoniated materials), the shoulders are the local maxima of the second-order polynomials fitting the spectra between 2.8 and 3.0 μm and between 3.16 and 3.27 μm, respectively;
- ○
- For the 3.4 μm band (Mg-carbonates, with the contribution of ammoniated materials), we considered the local maxima between 3.05–3.36 μm and 3.55–3.68 μm, respectively;
- ○
- For the 3.9 μm band (Mg-carbonates), we considered the local maxima between 3.55–3.68 μm and 4.05–4.19 μm.
- The spectral slope is defined as , where is the reflectance at the wavelength λ.
5. Results and Discussion
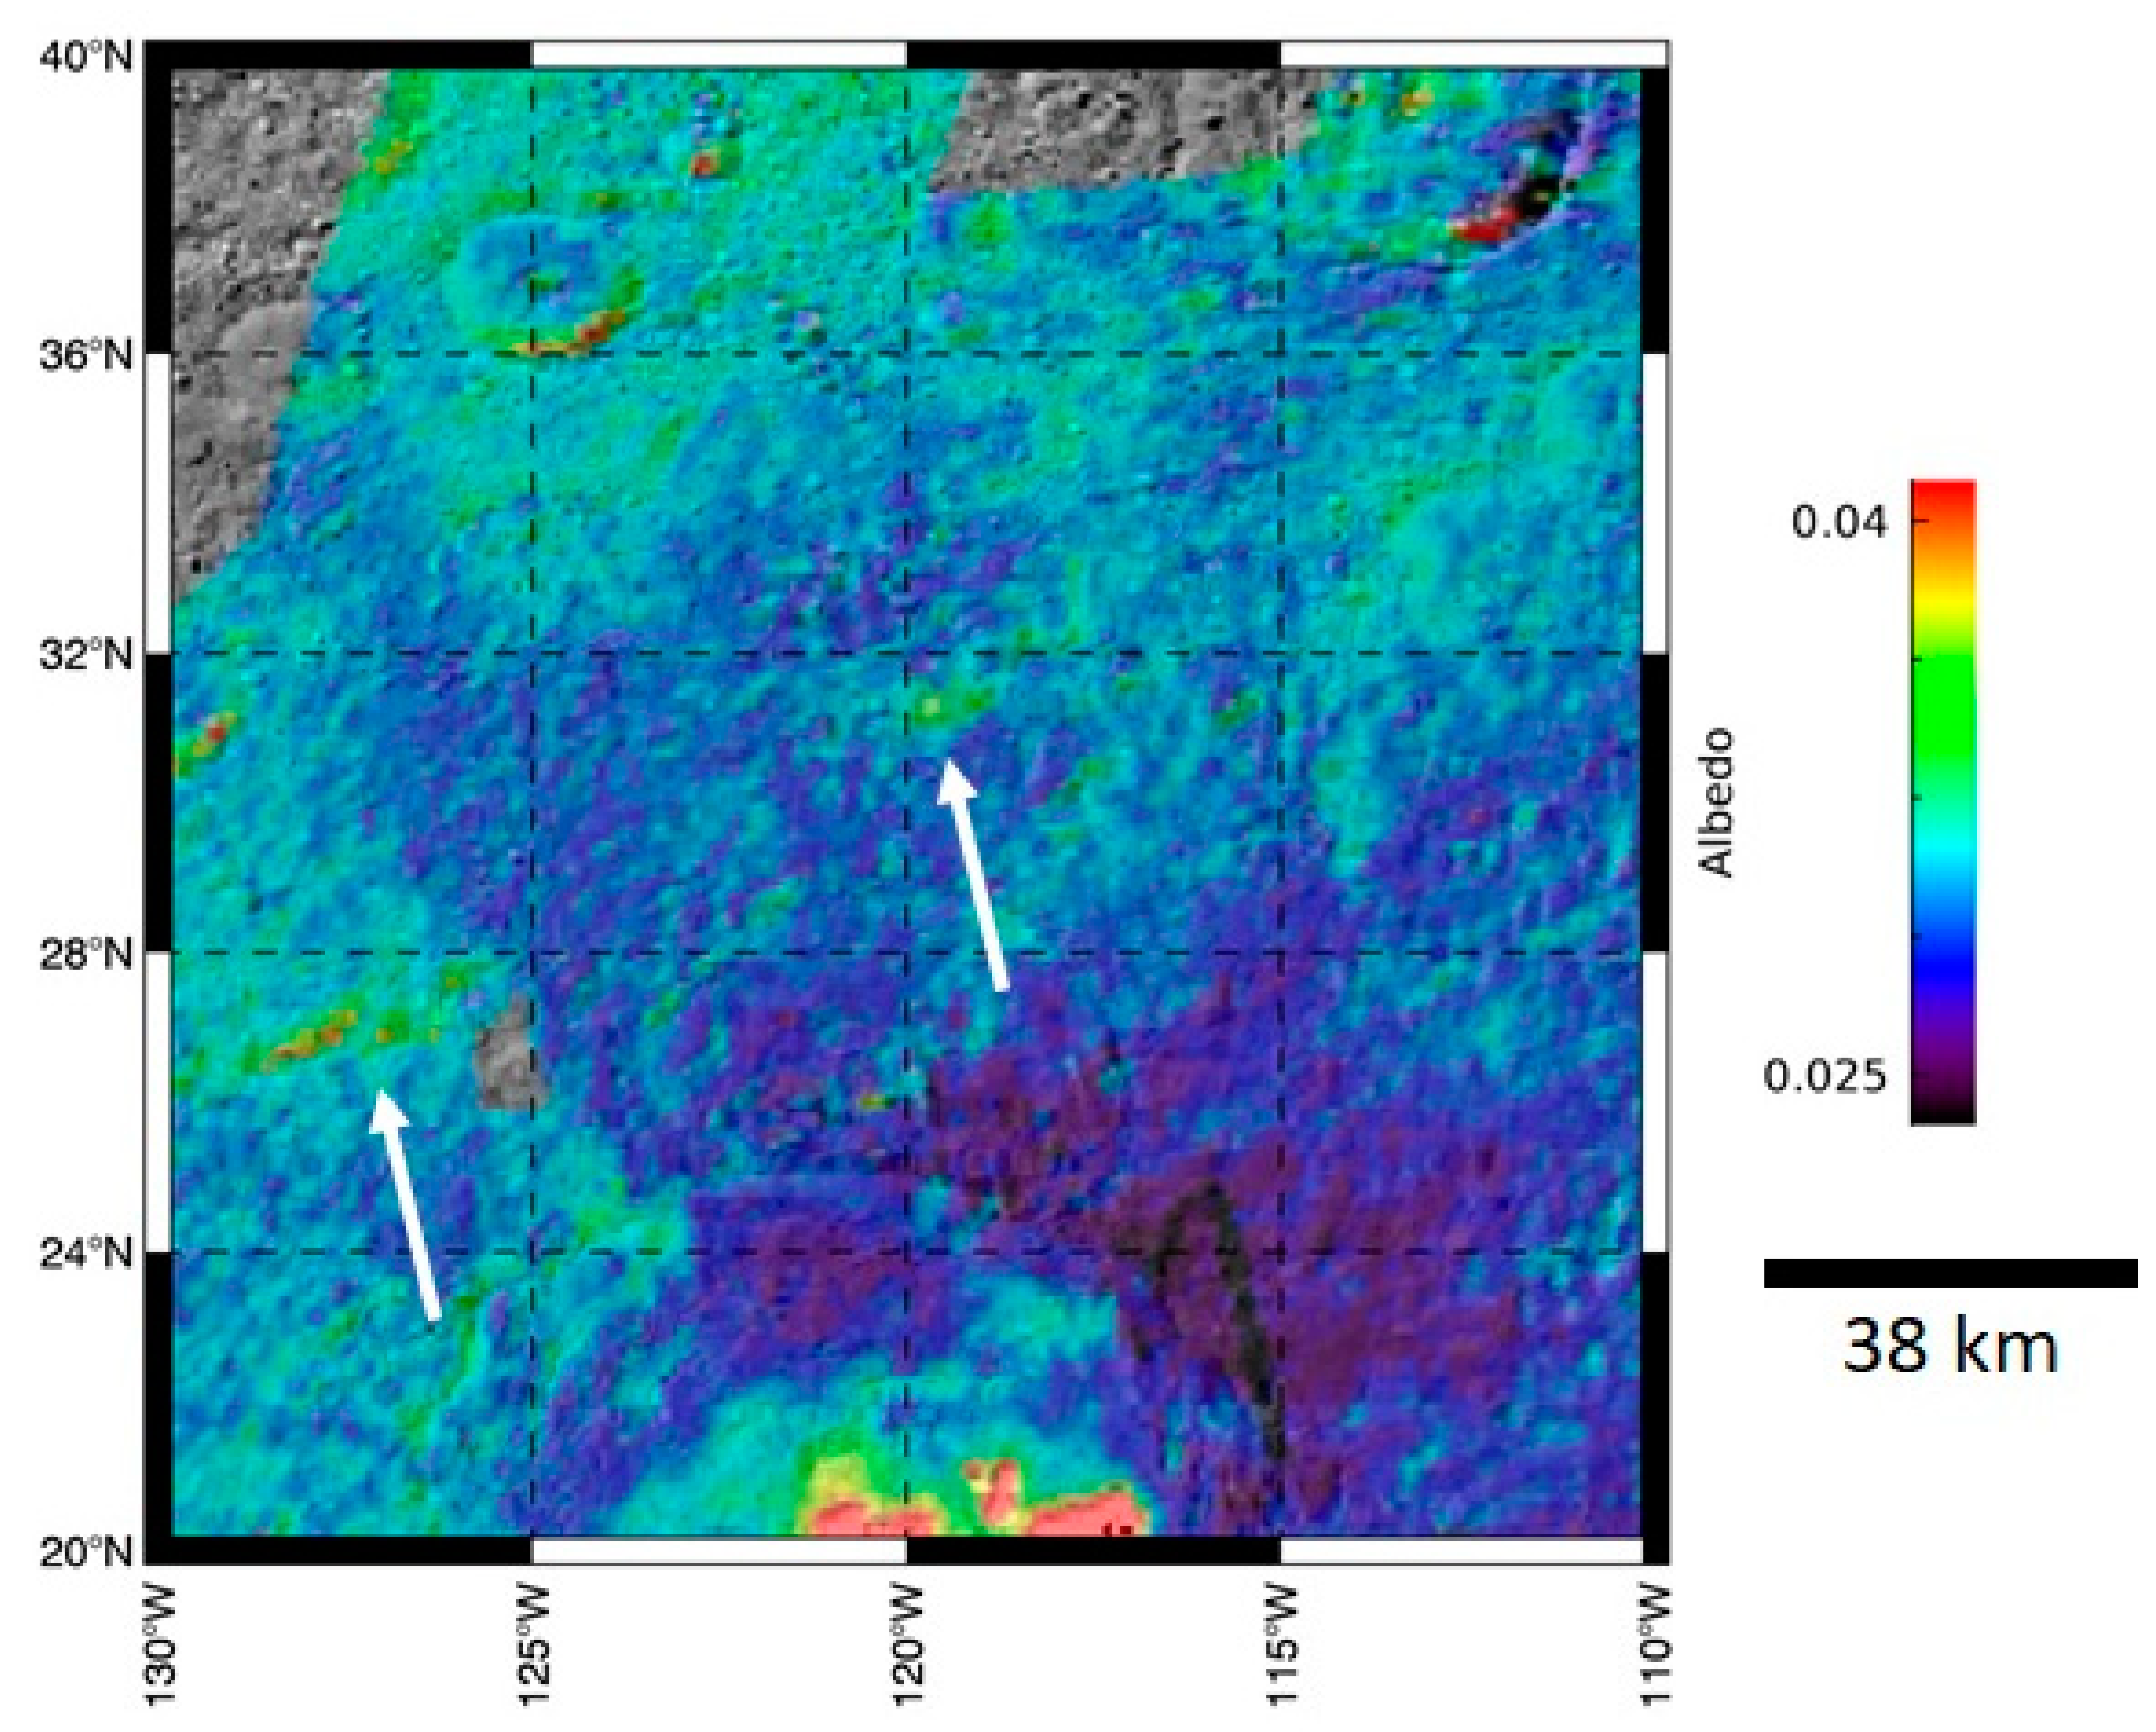
5.1. Dantu
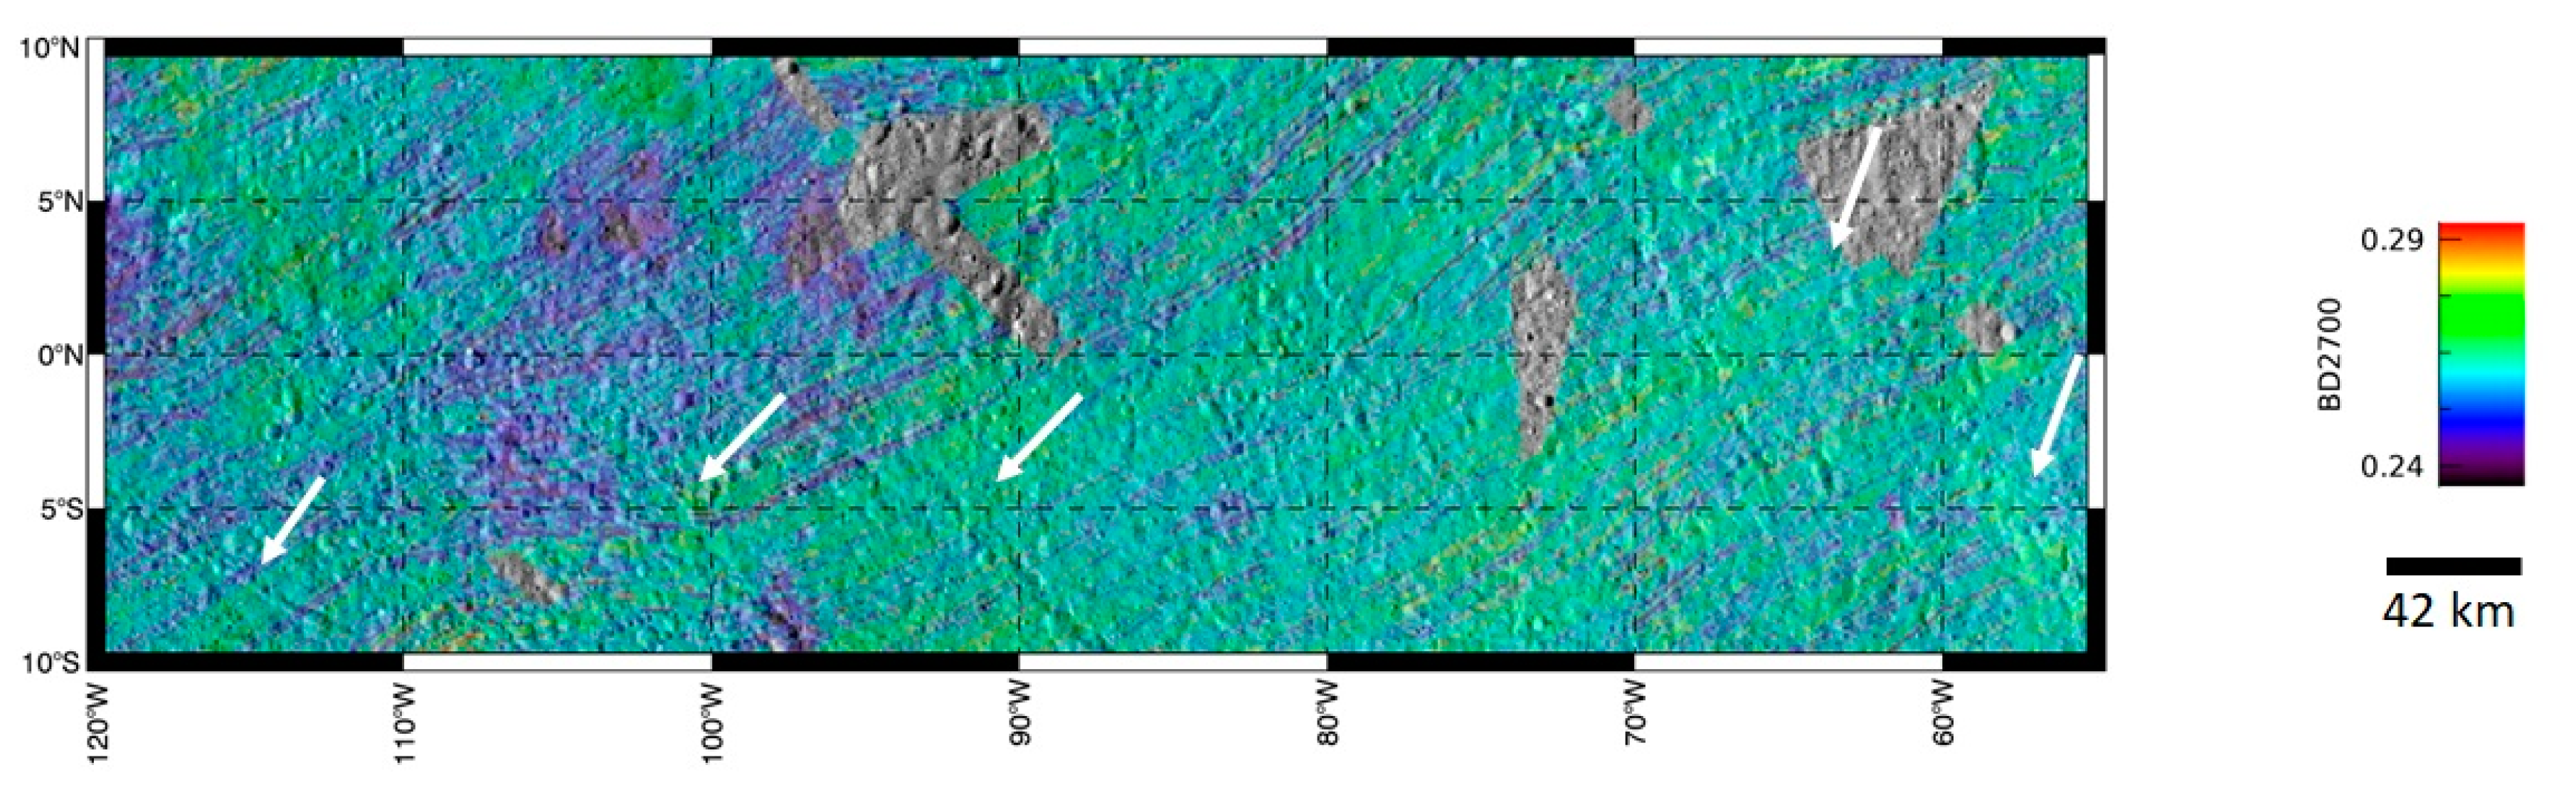
5.2. Junina Catenae
5.2.1. Far Ejecta
5.2.2. Occator Region Ejecta
5.3. Occator Ejecta
5.4. Urvara Ejecta
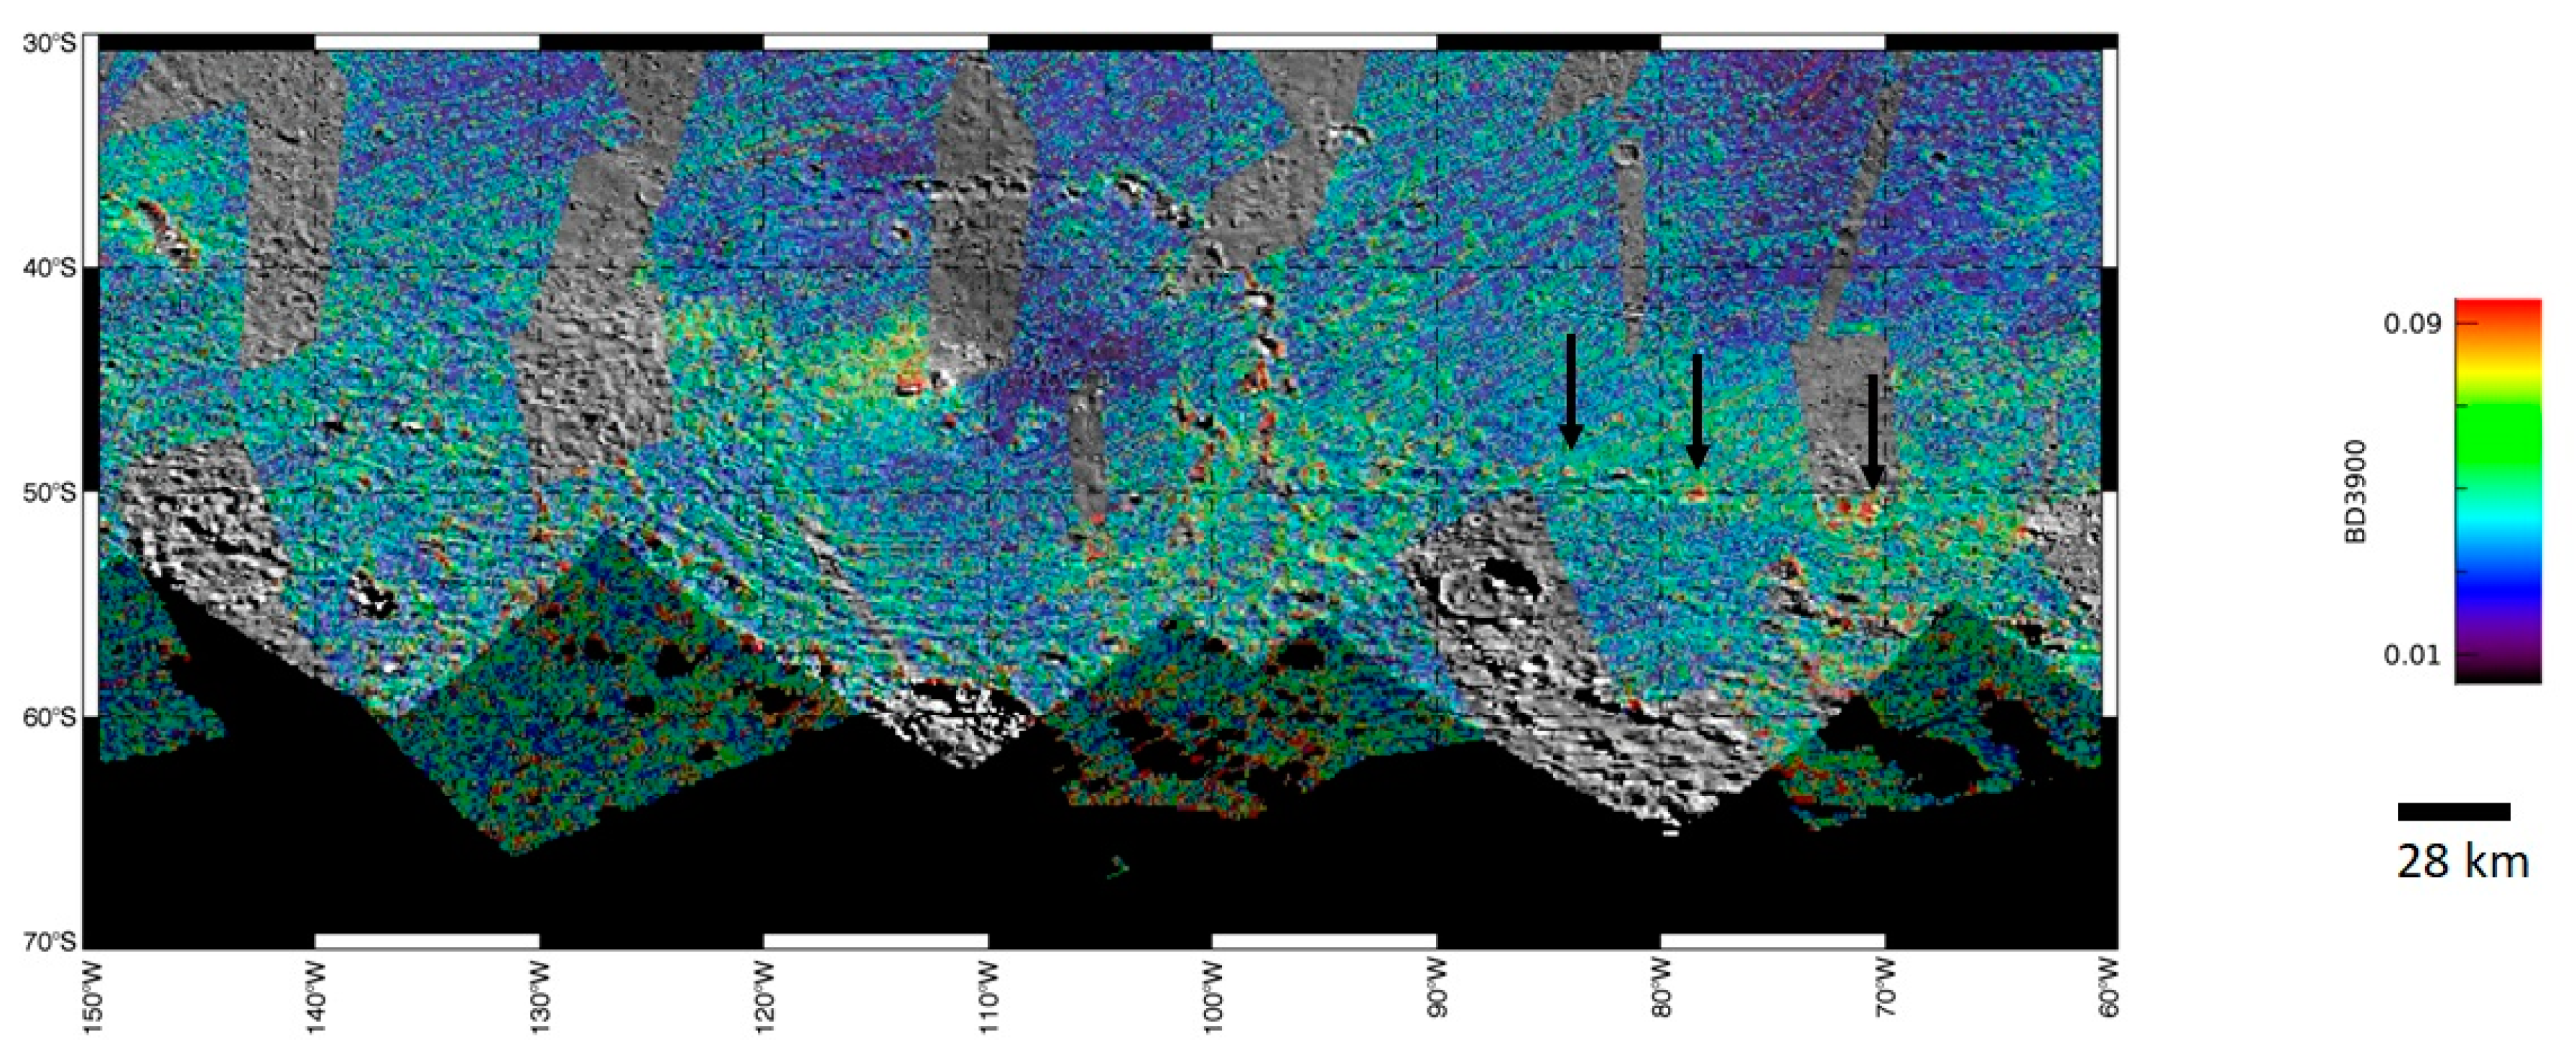
5.5. Samhain Catena
5.6. Searching for Organic Signatures
6. Conclusions
Author Contributions
Funding
Institutional Review Board Statement
Informed Consent Statement
Data Availability Statement
Acknowledgments
Conflicts of Interest
References
- Russell, C.T.; Raymond, C.A. The Dawn Mission to Vesta and Ceres. Space Sci. Rev. 2011, 163, 3–23. [Google Scholar] [CrossRef]
- Sierks, H.; Keller, H.U.; Jaumann, R.; Michalik, H.; Behnke, T.; Bubenhagen, F.; Büttner, I.; Carsenty, U.; Christensen, U.; Enge, R.; et al. The Dawn Framing Camera. Space Sci. Rev. 2011, 163, 263–327. [Google Scholar] [CrossRef]
- De Sanctis, M.C.; Coradini, A.; Ammannito, E.; Filacchione, G.; Capria, M.T.; Fonte, S.; Magni, G.; Barbis, A.; Bini, A.; Dami, M.; et al. The VIR Spectrometer. Space Sci. Rev. 2011, 163, 329–369. [Google Scholar] [CrossRef]
- Prettyman, T.H.; Feldman, W.C.; McSween, H.Y., Jr.; Dingler, R.D.; Enemark, D.C.; Patrick, D.E.; Storms, S.A.; Hendricks, J.S.; Morgenthaler, J.P.; Pitman, K.M.; et al. Dawn’s Gamma Ray and Neutron Detector. Space Sci. Rev. 2011, 163, 371–459. [Google Scholar] [CrossRef]
- Longobardo, A.; Palomba, E.; Galiano, A.; De Sanctis, M.C.; Ciarniello, M.; Raponi, A.; Tosi, F.; Schröder, S.E.; Carrozzo, F.G.; Ammannito, E.; et al. Photometry of Ceres and Occator faculae as inferred from VIR/Dawn data. Icarus 2019, 320, 97–109. [Google Scholar] [CrossRef]
- Stein, N.T.; Ehlman, B.L.; Palomba, E.; De Sanctis, M.C.; Nathues, A.; Hiesinger, H.; Ammannito, E.; Raymond, C.A.; Jaumann, R.; Longobardo, A.; et al. The formation and evolution of bright spots on Ceres. Icarus 2019, 320, 188–201. [Google Scholar] [CrossRef]
- De Sanctis, M.C.; Raponi, A.; Ammannito, E.; Ciarniello, M.; Toplis, M.J.; McSween, H.Y., Jr.; Castillo-Rogez, J.C.; Ehlmann, B.L.; Carrozzo, F.G.; Marchi, S.; et al. Bright carbonate deposits as evidence of aqueous alteration on (1) Ceres. Nature 2016, 536, 54–57. [Google Scholar] [CrossRef]
- Ammannito, E.; De Sanctis, M.C.; Ciarniello, M.; Frigeri, A.; Carrozzo, F.G.; Combe, J.-P.; Ehlmann, B.E.; Marchi, S.; McSween, H.Y.; Raponi, A.; et al. Distribution of phyllosilicates on the surface of Ceres. Science 2016, 353, aaf4279. [Google Scholar] [CrossRef]
- Carrozzo, F.G.; De Sanctis, M.C.; Raponi, A.; Ammannito, E.; Castillo-Rogez, J.; Ehlmann, B.E.; Marchi, S.; Stein, N.; Ciarniello, M.; Tosi, F.; et al. Nature, formation and distribution of Carbonates on Ceres. Sci. Adv. 2018, 4, 447. [Google Scholar] [CrossRef]
- Palomba, E.; Longobardo, A.; De Sanctis, M.C.; Stein, N.T.; Ehlmann, B.; Galiano, A.; Raponi, A.; Ciarniello, M.; Ammannito, E.; Cloutis, E.; et al. Compositional differences among Bright Spots on the Ceres surface. Icarus 2019, 320, 202–212. [Google Scholar] [CrossRef]
- Raponi, A.; De Sanctis, M.C.; Frigeri, A.; Ammannito, E.; Ciarniello, M.; Formisano, M.; Combe, J.P.; Magni, G.; Tosi, F.; Carrozzo, F.G.; et al. Variations in the amount of water ice on Ceres’ surface suggest a seasonal water cycle. Sci. Adv. 2018, 4, eaao3757. [Google Scholar] [CrossRef] [PubMed]
- De Sanctis, M.C.; Ammannito, E.; McSween, H.Y.; Raponi, A.; Marchi, S.; Capaccioni, F.; Capria, M.T.; Carrozzo, F.G.; Ciarniello, M.; Fonte, S.; et al. Localized aliphatic organic material on the surface of Ceres. Science 2017, 355, 719–722. [Google Scholar] [CrossRef] [PubMed]
- Pieters, C.M.; Nathues, A.; Thangjam, G.; Hoffman, M.; Platz, T.; De Sanctis, M.C.; Ammannito, E.; Tosi, F.; Zambon, F.; Pasckert, J.H.; et al. Geologic constraints on the origin of red organic-rich material on Ceres. Meteorit. Planet. Sci. 2018, 53, 1983–1998. [Google Scholar] [CrossRef]
- Hargitai, H.; Kereszturi, A. Encyclopedia of Planetary Landforms; Springer: Berlin/Heidelberg, Germany, 2015; ISBN 978-1-4614-3133-6. [Google Scholar]
- Thomas, P.C.; Prockter, L.M. Tectonics of small bodies. In Planetary Tectonics; Watters, T.R., Schultz, R.A., Eds.; Cambridge University Press: Cambridge, UK, 2010. [Google Scholar]
- Prockter, L.; Thomas, P.; Robinason, M.; Joseph, J.; Milne, A.; Bussey, B.; Veverka, J.; Cheng, A. Surface expressions of structural features on Eros. Icarus 2002, 155, 75–93. [Google Scholar] [CrossRef]
- Longobardo, A.; Palomba, E.; De Sanctis, M.C.; Zinzi, A.; Scully, J.E.C.; Capaccioni, F.; Tosi, F.; Zambin, F.; Ammannito, E.; Combe, J.P.; et al. Mineralogical and spectral analysis of Vesta’s Gegania and Lucaria quadrangles and comparative analysis of their key features. Icarus 2015, 259, 72–90. [Google Scholar] [CrossRef]
- Scully, J.E.C.; Yin, A.; Russell, C.T.; Buczkowski, D.L.; Williams, D.A.; Blewett, D.A.; Ruesch, O.; Hiesinger, H.; Le Corre, L.; Mercer, C.; et al. Geomorphology and structural geology of Saturnalia Fossae and adjacent structures in the northern hemisphere of Vesta. Icarus 2014, 244, 23–40. [Google Scholar] [CrossRef]
- Scully, J.E.C.; Buczkowski, D.L.; Schememann, N.; Raymond, C.A.; Castillo-Rogez, J.C.; King, S.D.; Bland, M.T.; Ermakov, A.I.; O’Brien, D.P.; Marchi, S.; et al. Evidence for the Interior Evolution of Ceres from Geologic Analysis of Fractures. Geophys. Res. Lett. 2017, 44, 9564–9572. [Google Scholar] [CrossRef]
- Filacchione, G.; Ammannito, E. Dawn VIR Calibration Document Version 2.4. 2014. Available online: https://sbn.psi.edu/archive/dawn/vir/DWNVVIR_I1B/DOCUMENT/VIR_CALIBRATION/VIR_CALIBRATION_V2_4.PDF (accessed on 12 July 2022).
- Carrozzo, F.G.; Raponi, A.; De Sanctis, M.C.; Ammannito, E.; Guardino, M.; D’Aversa, E.; Fonte, S.; Tosi, F. Artifacts reduction in VIR/Dawn data. Rev. Sci. Instrum. 2016, 87, 124501. [Google Scholar] [CrossRef]
- Raponi, A.; Carrozzo, F.G.; Zambon, F.; De Sanctis, M.C.; Ciarniello, M.; Frigeri, A.; Ammannito, E.; Tosi, F.; Combe, J.-P.; Longobardo, A.; et al. Mineralogical mapping of Coniraya quadrangle of the dwarf planet Ceres. Icarus 2019, 318, 99–110. [Google Scholar] [CrossRef]
- Ciarniello, M.; De Sanctis, M.C.; Ammannito, E.; Raponi, A.; Longobardo, A.; Palomba, E.; Carrozzo, F.G.; Tosi, F.; Li, J.-Y.; Schröder, S.E.; et al. Spectrophotometric properties of dwarf planet Ceres from VIR onboard Dawn mission. Astron. Astrophys. 2017, 598, A130. [Google Scholar] [CrossRef]
- Stephan, K.; Jaumann, R.; Wagner, R.; De Sanctis, M.C.; Palomba, E.; Longobardo, A.; Williams, D.A.; Krohn, K.; Tosi, F.; McFadden, L.A.; et al. Dantu’s mineralogical properties—A view into the composition of Ceres’ crust. Meteorit. Planet. Sci. 2018, 53, 1866–1883. [Google Scholar] [CrossRef]
- Buczkowski, D.L.; Schmidt, B.E.; Williams, D.A.; Mest, S.C.; Scully, J.E.C.; Ermakov, A.I.; Preusker, F.; Schenk, P.; Otto, K.A.; Hiesinger, H.; et al. The geomorphology of Ceres. Science 2016, 353, 1004. [Google Scholar] [CrossRef] [PubMed]
- Longobardo, A.; Palomba, E.; Carrozzo, F.G.; Galiano, A.; De Sanctis, M.C.; Stephan, K.; Tosi, F.; Raponi, A.; Ciarniello, M.; Zambon, F.; et al. Mineralogy of the Occator quadrangle. Icarus 2019, 318, 205–211. [Google Scholar] [CrossRef]
- Schmedemann, N.; Neesemann, A.; Schulzeck, F.; Krohn, K.; von der Gathen, I.; Otto, K.A.; Jaumann, R.; Michael, G.; Raymond, C.A.; Russell, C.T. The distribution of impact ejecta on Ceres. Lunar Planet. Sci. Conf. 2017, 48, 1233. [Google Scholar]
- Marchi, S.; Ermakov, A.I.; Raymond, C.A.; Fu, R.R.; O’Brien, D.P.; Bland, M.T.; Ammannito, E.; De Sanctis, M.C.; Bowling, T.; Schenk, P.; et al. The missing large impact craters on Ceres. Nat. Commun. 2016, 7, 1–9. [Google Scholar] [CrossRef]
- Castillo-Rogez, J.C.; Bowling, T.; Fu, R.R.; McSween, H.Y.; Raymond, C.A.; Rambaux, R.; Travis, B.; Marchi, S.; O’Brien, D.P.; Johnson, B.C.; et al. Loss of Ceres’ icy shell from impacts: Assessment and implications. Lunar Planet. Sci. Conf. 2016, 47, 3012. [Google Scholar]
- De Sanctis, M.C.; Frigeri, A.; Ammannito, E.; Carrozzo, F.G.; Ciarniello, F.; Zambon, F.; Tosi, F.; Raponi, A.; Longobardo, A.; Combe, J.P.; et al. Ac-H-11 Sintana and Ac-H-12 Toharu quadrangles: Assessing the large and small scale heterogeneities of Ceres’ surface. Icarus 2019, 318, 230–240. [Google Scholar] [CrossRef]
- Longobardo, A.; Galiano, A.; Ammannito, E.; Carrozzo, F.G.; De Sanctis, M.C.; Palomba, E.; Zambon, F.; Frigeri, A.; Ciarniello, M.; Raponi, A.; et al. Mineralogy of the Urvara-Yalode region on Ceres. Icarus 2019, 318, 241–250. [Google Scholar] [CrossRef]
- Palomba, E.; Longobardo, A.; De Sanctis, M.C.; Carrozzo, F.G.; Galiano, A.; Zambon, F.; Raponi, A.; Ciarniello, M.; Stephan, K.; Williams, D.A.; et al. Mineralogical mapping of the Kerwan quadrangle on Ceres. Icarus 2019, 318, 188–194. [Google Scholar] [CrossRef]
- Zambon, F.; Carrozzo, F.G.; Tosi, F.; Ciarniello, M.; Combe, J.-P.; Frigeri, A.; De Sanctis, M.C.; Thangjam, G.; Nathues, A.; Hoffmann, M.; et al. Mineralogical analysis of quadrangle Ac-H-10 Rongo on the dwarf planet Ceres. Icarus 2019, 318, 212–219. [Google Scholar] [CrossRef]
- Galiano, A.; Palomba, E.; Longobardo, A.; Zinzi, A.; De Sanctis, M.C.; Raponi, A.; Carrozzo, F.G.; Ciarniello, M.; Dirri, F. Continuum definition for ∼3.05, ∼3.4 and ∼4.0 µm absorption bands in Ceres spectra and evaluation of effects of smoothing procedure in the retrieved spectral parameters. Adv. Space Res. 2018, 62, 2342–2354. [Google Scholar] [CrossRef]
- Clark, R.N.; Roush, T.L. Reflectance spectroscopy–Quantitative analysis techniques for remote sensing applications. J. Geophys. Res. 1984, 89, 6329–6340. [Google Scholar] [CrossRef]
- Williams, D.A.; Kneissl, T.; Neesmann, A.; Mest, S.C.; Palomba, E.; Platz, T.; Nathues, A.; Longobardo, A.; Scully, J.E.C.; Ermakov, A.; et al. The geology of Kerwan quadrangle of dwarf planet Ceres: Investigating Ceres’ oldest, largest impact basin. Icarus 2018, 316, 99–113. [Google Scholar] [CrossRef]
- Thomas, N.; Barbieri, C.; Keller, H.U.; Lamy, P.; Rockman, H.; Rodrigo, R.; Sierks, H.; Wenzel, K.P.; Cremonese, G.; Jorda, L.; et al. The geomorphology of (21) Lutetia: Results from the OSIRIS imaging system onboard ESA’s Rosetta spacecraft. Planet. Space Sci. 2012, 66, 96–124. [Google Scholar] [CrossRef]
- Domagal-Goldman, S.D.; Wright, K.E.; Adamala, K.; de La Rubia, L.A.; Bond, J.; Datrnell, L.R.; Goldman, A.D.; Lynch, K.; Naud, M.-E.; Paulino-Lima, I.G.; et al. The Astrobiology Primer v2.0. Astrobiology 2016, 16, 561. [Google Scholar] [CrossRef] [PubMed]


Publisher’s Note: MDPI stays neutral with regard to jurisdictional claims in published maps and institutional affiliations. |
© 2022 by the authors. Licensee MDPI, Basel, Switzerland. This article is an open access article distributed under the terms and conditions of the Creative Commons Attribution (CC BY) license (https://creativecommons.org/licenses/by/4.0/).
Share and Cite
Longobardo, A.; Carrozzo, F.G.; Galiano, A.; Scully, J.E.C.; Parekh, R.; Palomba, E.; De Sanctis, M.C.; Ammannito, E.; Raponi, A.; Tosi, F.; et al. Spectral Analysis of Ceres’ Main Linear Features. Minerals 2022, 12, 1013. https://0-doi-org.brum.beds.ac.uk/10.3390/min12081013
Longobardo A, Carrozzo FG, Galiano A, Scully JEC, Parekh R, Palomba E, De Sanctis MC, Ammannito E, Raponi A, Tosi F, et al. Spectral Analysis of Ceres’ Main Linear Features. Minerals. 2022; 12(8):1013. https://0-doi-org.brum.beds.ac.uk/10.3390/min12081013
Chicago/Turabian StyleLongobardo, Andrea, Filippo Giacomo Carrozzo, Anna Galiano, Jennifer E. C. Scully, Rutu Parekh, Ernesto Palomba, Maria Cristina De Sanctis, Eleonora Ammannito, Andrea Raponi, Federico Tosi, and et al. 2022. "Spectral Analysis of Ceres’ Main Linear Features" Minerals 12, no. 8: 1013. https://0-doi-org.brum.beds.ac.uk/10.3390/min12081013