Article

Three-Dimensional Audio-Magnetotelluric Imaging including Surface Topography of the Cimabanshuo Porphyry Copper Deposit, Tibet

School of Geophysics and Information Technology, China University of Geosciences, Beijing 100083, China
*
Author to whom correspondence should be addressed.
Submission received: 10 November 2021 / Revised: 1 December 2021 / Accepted: 14 December 2021 / Published: 16 December 2021

Abstract

:
Cimabanshuo deposit is a newly discovered porphyry copper (Cu) deposit with giant metallogenic potential, found in the western segment of the Gangdese metallogenic belt, Tibet. The average elevation of the deposit is greater than 5500 m and the terrain on which it is found is steep and complex. Therefore, it is untraversed, and the existing exploration works on it are weak. We used 59 AMT sites belonging to an array covering the main, proven mineralization zone and ore bodies of this deposit for an analysis of its underground electrical structure. Dimensionality and strike analysis revealed the apparent three-dimensional (3D) features near the Cu ore bodies. 3D inversion with topography was conducted for the AMT array data. A large range of high-resistivity anomaly (~500–2000 Ωm) appears beneath the proven Cu mineralization zone and ore bodies, which is interpreted as intrusive rocks with potassic alteration. Although containing chalcopyrite, it is characterized by middle–high resistivity due to a low sulfide content and poor connectivity. Moreover, a series of scattered conductors (~10–300 Ωm) around the Cu ore bodies are distributed in the shallow layer from near the surface to ~200 m, possibly indicating phyllic alteration containing pyritization and connected metal sulfides. The proven ore bodies of Cimabanshuo are mainly located at the junction regions between high-resistivity intrusive rocks and high-conductivity sericitization alteration zones. According to this research, the 3D inversion with topography of AMT data can visually display the 3D distribution of intrusive rocks and alteration zones beneath porphyry Cu deposits in high-elevation regions, and provides a reference for further exploration works.

1. Introduction

The formation of porphyry copper deposits is generally considered to be related to the hydrothermal fluids released by magma generated within subduction zones [1,2]. The arc magma, being rich in Cu and other metals (Mo ± Au) and saturated with volatiles and salt water, intrude into the upper and middle crust [3]. Finally, the metallic elements precipitate in the form of metal sulfides. Upon cooling down, they react with the wall rock to cause the chalcopyrite and molybdenite precipitating within quartz veins and being disseminated in potassic-altered rocks. As the fluids rise and cool down further, they become more acidic, resulting in the alteration of foliaceous (quartz-sericite-pyrite), argillaceous and high-grade argillaceous (such as clay, alunite, residual quartz) [4]. Therefore, the alteration and mineral sulfides of the porphyry copper deposit system could show typical zoning characteristics both in vertical and lateral directions centered on the shallow volcanic intrusive complex (Figure 1) [5]. After the above mineralization processes, subsequent regional tectonic movements, such as uplift, result in the gradual denudation of shallow hydrothermal alteration zones and volcanic rocks, causing the outcrop of underlying secondary volcanic rocks, porphyry mineralization and batholith, which could also make the actual porphyry Cu system more diverse and complicated [4].
These porphyry Cu deposits exposed to the surface have mostly been discovered and mined in large porphyry Cu provinces around the world, such as the Canadian Cordillera, Andean orogenic belt in Chile, and Gangdese belt in Tibet [4,6,7], but mineralogists still believe that the concealed deposits have equally ideal ore-forming potentials [8]. This makes it very important to image and explore the underground structure of these deposits. In addition to the drilling works, which can directly obtain the underground lithological distribution, geophysical surveys are also proved to be effective for exploring such deposits due to the different physical properties between mineralization, alteration and surrounding rocks [9]. Based on the results of laboratory measurements and practical exploration works [10,11], a generalized, idealized profile model for the alteration, mineralization and resistivity distribution of typical porphyry Cu deposits was summarized [12]. It revealed that electrical resistivity and polarizability features vary significantly with different levels of mineralization and alteration, the essence of which is the difference in the content and connectivity of metal sulfides [13]. This caused electrical (DC) and electromagnetic (EM) soundings to become frequently used ways to image the underground structure of porphyry Cu deposits [14]. For instance, 3D joint inversion of magnetotelluric sounding (MT) and Z-axis tipper electromagnetic data were used to image intrusive rocks and alteration zones beneath the Morrison porphyry Cu-Au-Mo deposit in British Columbia, Canada [15].
Among these EM methods, audio-frequency magnetotelluric soundings (AMT) are commonly used to study the structure of metallic deposits [16]. AMT uses natural EM signals as the source and, therefore, has an exploration depth of greater than 1 km and a higher exploration accuracy than broad-band MT works. In addition, AMT is very suitable for exploration in high-elevation mining areas such as the study area in this research. The Cimabanshuo porphyry Cu deposit in southern Tibet has an average elevation of over 5800 m; therefore, there is no need to deploy long wires and transport a large number of cables, as is the case with DC soundings and the controlled-source audio-frequency magnetotelluric method (CSAMT) [17]. However, the application of the AMT method to such high-elevation areas as Cimabanshuo still has some limitations. Specifically, the AMT method can detect a maximum depth of ~1–3 km. However, the elevation difference between the highest and lowest points is more than 900 m within a horizontal distance of less than 1 km in Cimabanshuo area. The influence of topography cannot be ignored [18]. According to the forward modelling studies of Dong et al. [19], such clear topographic relief in Cimabanshuo cannot be ignored, otherwise, the reliable underground electrical structure cannot be obtained by inversion [20]. Furthermore, as mentioned above, the porphyry metallogenic system is a complex three-dimensional (3D) system; therefore, a reliable underground structure cannot be obtained by one-dimensional (1D) or two-dimensional (2D) inversion algorithms. In summary, for the Cimabanshuo deposit, only 3D inversion considering the effects of topography can reveal reliable underground structures. In this research, we carried out a 3D inversion with topography for an AMT array that was made up of 59 sites collected from the Cimabanshuo deposit, obtaining the underground electrical structure. Combined with other geological information, new constrains on the potential intrusive rocks and alteration zones were provided according to a detailed interpretation.

2. Geological Settings of the Cimabanshuo Porphyry Copper Deposit

There are many large-scale and super-large porphyry Cu ± Mo ± Au deposits in the Gangdese metallogenic belt, such as the Tinggong, Qulong and Jiama deposits [21,22]. The Cimabanshuo deposit is located in the western section of the Gangdese belt (Figure 2) [23]. Based on the study of Miocene adakites, these Gangdese deposits were suggested to be formed in an extensional tectonic setting after the subduction–collision between the Indian and Eurasian plates [24]. The ages of ore-bearing granodiorite porphyry were approximately 15.2 ± 0.8 Ma–15.2 ± 0.7 Ma (15.2 Ma) when the post-collision (25–13 Ma) extension occurred. The break-up of slab was supposed to lead to the upwelling of mantle-derived magma and its intrusion into the juvenile, thickened, mafic lower-crust, which provided heat for its melting and released abundant Cu- and sulfide-rich ore-forming fluids [25].
Due to its high elevation and remote location, very few exploration works have been executed in Cimabanshuo, including low-degree geological mapping and geochemical studies [23]. Miocene porphyry bodies, NE-trending and EW-trending faults, and well-nested geochemistry anomalies and remote sensing hydroxyl anomalies indicated good metallogenic potentials and geological conditions for Cu and Pb mineralization. A certain amount of massive and fine-grained pyritization along micro-fractures was found on the ground [25]. Two relatively large-scale and almost EW-trending mineralized alteration zones were delineated. They were ~2 km in E–W and ~350–1200 m in S–N direction (Figure 3). The NW- and NE-trending structures are suggested to be closely related to mineralization. Regional structures control the intrusion of magma, hydrothermal alteration and mineralization, which may play an important role in the activation of ore-forming materials, the passage of ore-forming fluids and the space of ore-forming occurrence [26]. Miocene monzogranite porphyry, porphyritic monzogranite and granite porphyry were suggested to closely correlate with porphyry mineralization. The main mineralization types include pyrite, chalcopyrite, molybdenite and malachite [23]. Chalcopyrite is mainly distributed within the rock fractures and K-feldspar phenocrysts of porphyritic granite. Malachite is distributed in the fractured surface of rocks and kaolinized altered rocks in the shape of filmy aggregate. Azurite is distributed in the fractured rock surface in the form of film and dissemination, and it is associated with malachite petrochemistry. The major alteration types contain vein-like, massive propylitic and white phyllic alterations. There are many EW- and SN-trending fine fractures within porphyritic monzonitic granite, especially in the rocks to the west of ore bodies. The Cu mineralization is closely related to the degree of rock fracturing. In other words, the mineralization would be stronger where more fractures occur [25].

3. AMT Data Acquisition and Processing

The MTU-5A system (developed by Phoenix Geophysics Ltd., Toronto, Canada) was used for AMT data collection and synchronous satellite observation was adopted. In July 2019, 59 sites were deployed to form an array covering the Cimabanshuo Cu deposit. The array consists of one relatively long NW–SE-trending and three short, almost E–W-trending profiles, which span the entire Cu mineralization area and pass through two nearly E–W strike Cu ore bodies. The average intra-site distance was ~50 m. The average acquiring time was 2–4 h for each site in order to obtain the frequency band covering ~10,000 Hz to 1 s (Figure 4). The survey area was located in a high-elevation and remote region within the hinterland of Tibet. Therefore, there is almost no sign of human activity and EM noise interference due to the absence of large-scale exploration and mining activities. The time series of AMT were processed by SSMT2000 software developed by the Phoenix Geophysics Ltd., and the reliable impedance tensors were obtained by using a standard Robust algorithm [27,28].

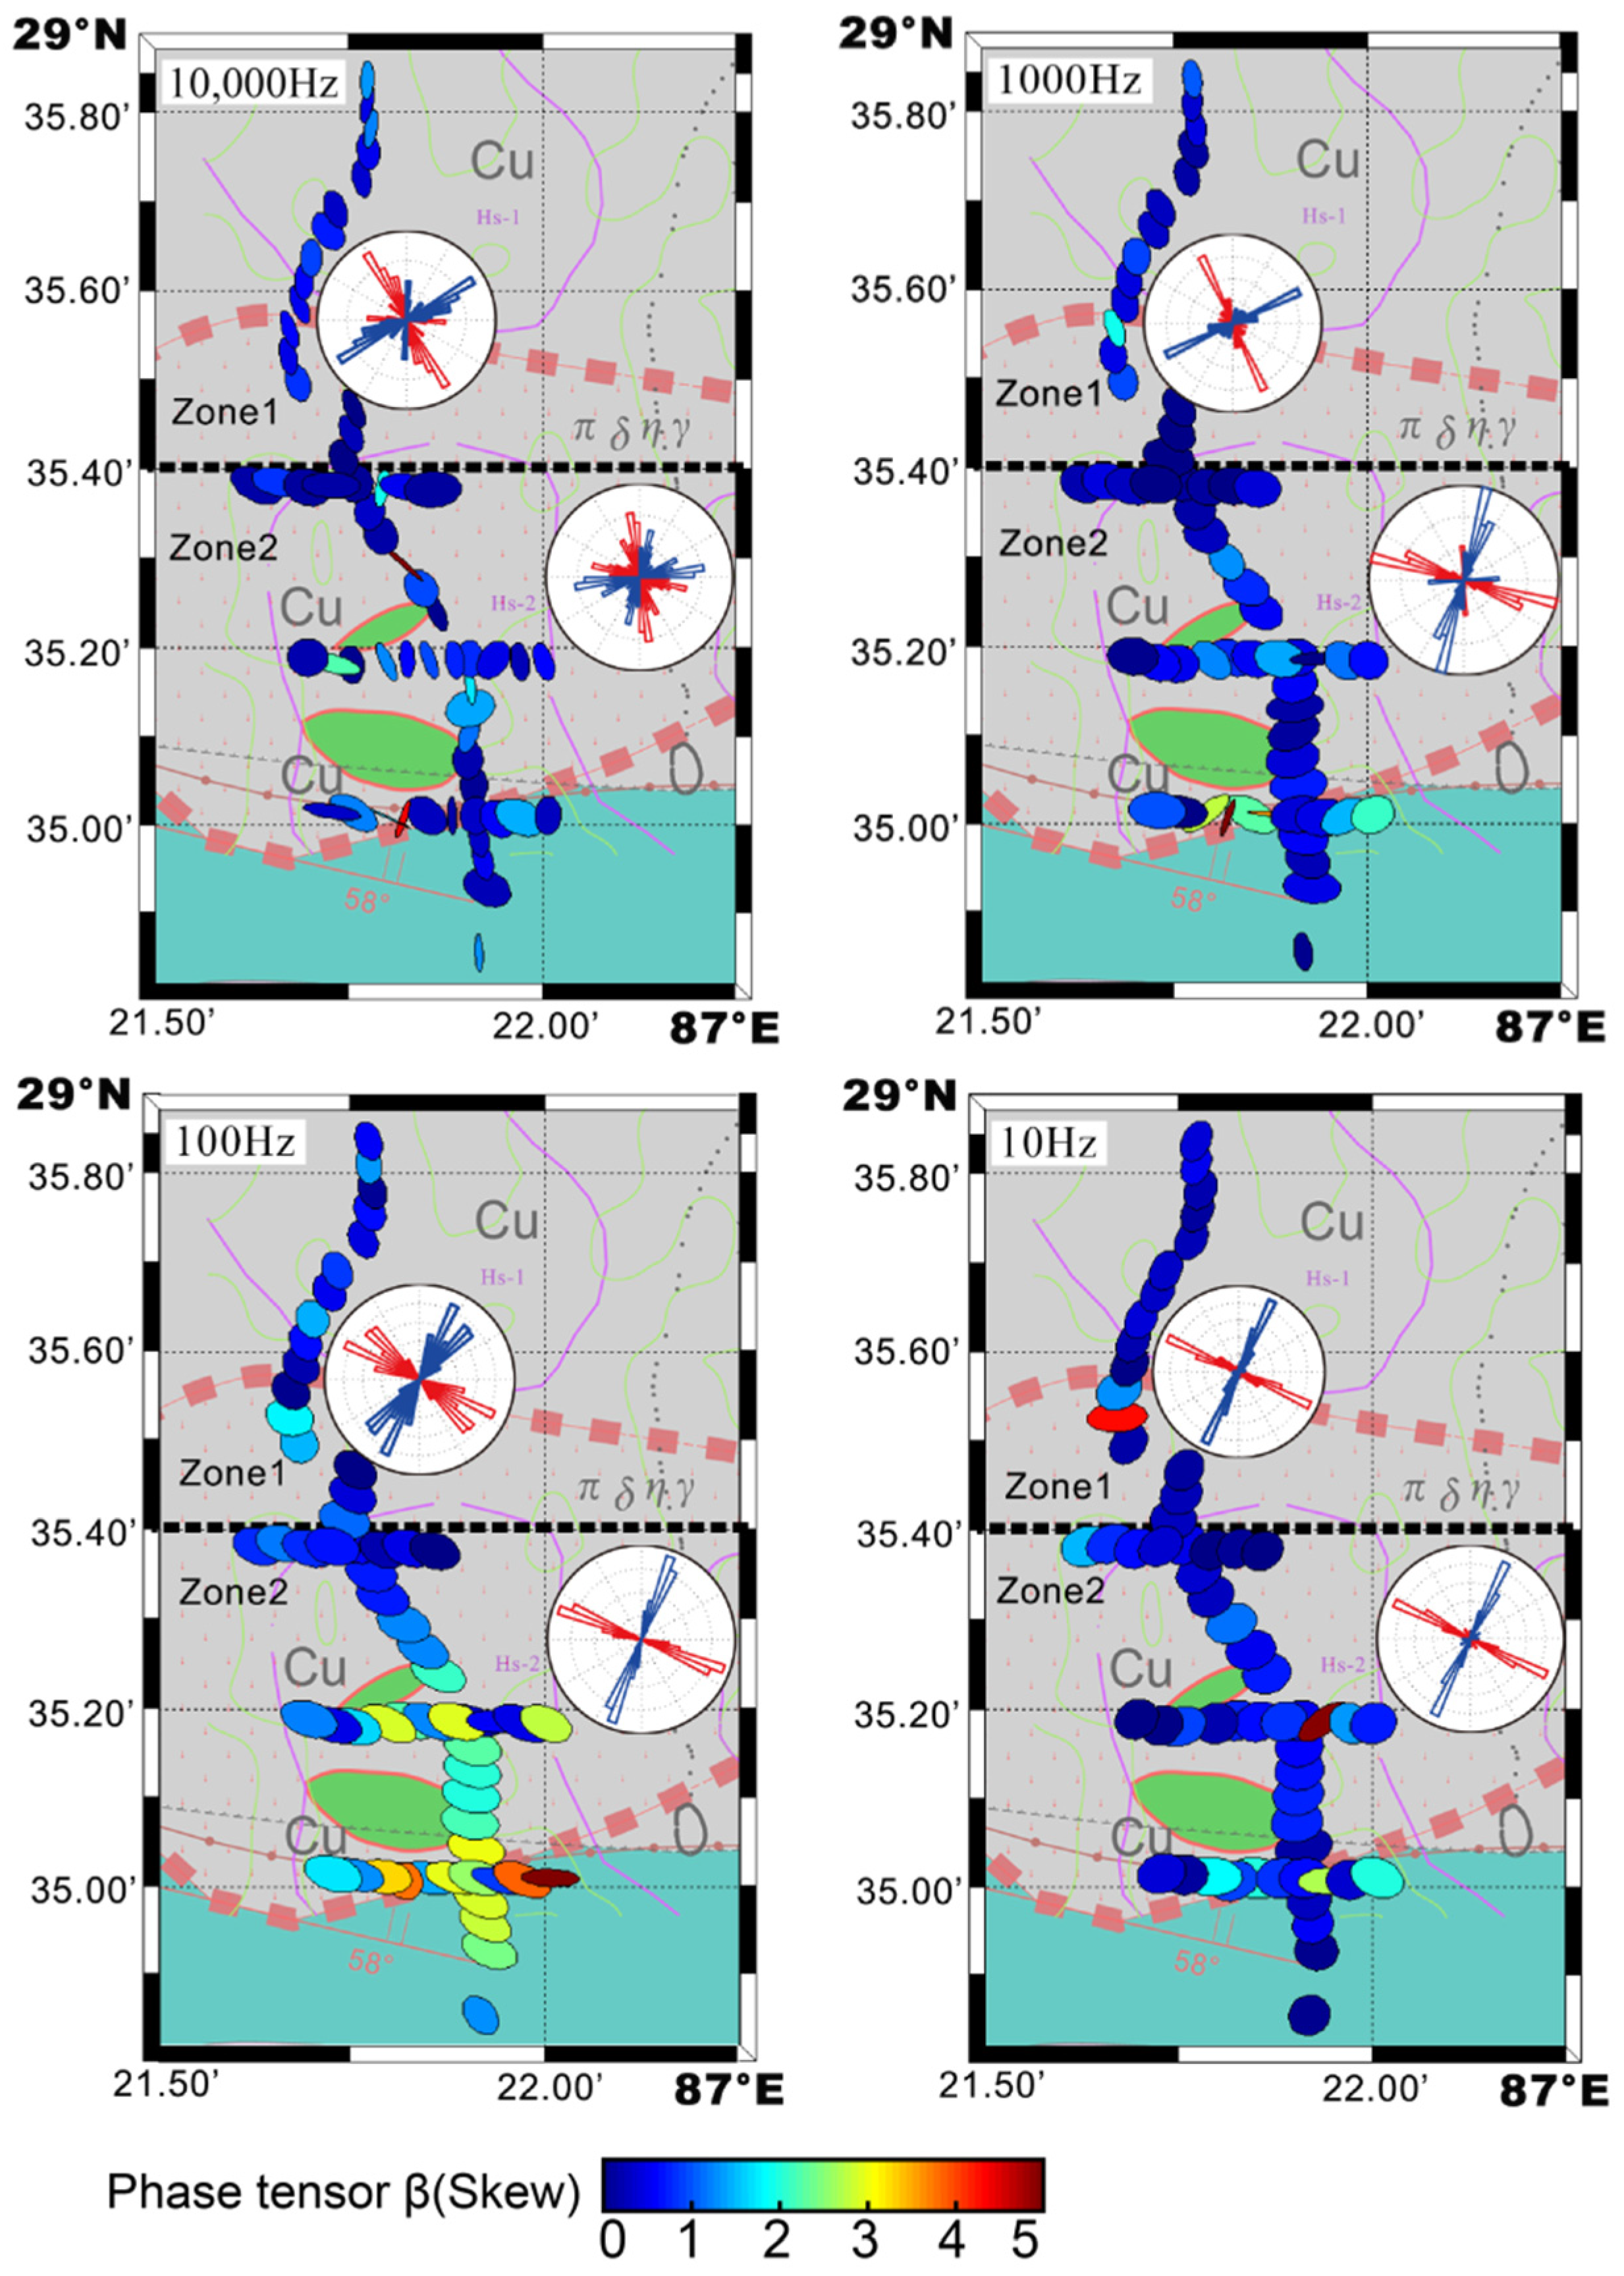
4. The Dimensionality and Strike Direction Analysis of AMT Data

Before inversion and interpretation, a detailed dimensionality analysis should be applied to evaluate the complexity of underground structures and the distortion of AMT data [29]. This research applies two commonly used methods, i.e., the Groom-Bailey (GB) impedance tensor decomposition [30] and phase tensor analysis [31]. According to the theory of skin depth, plotting these indicators by time period can reveal information for different depths (Figure 5) [29]. Generally speaking, the dimensionality and strike direction in the survey area are relatively simple. Specifically, the AMT data of Cimabanshuo array show consistency features only within some local areas, while these subregions differ from each other, for example, Zone1 to the north and Zone2 to the south.
The phase tensors of Zone1 show overall small skew (β) values from high to low frequencies (10,000–10 Hz), most of which are less than 2°, indicating simply 1D/2D structures. The electrical strike directions obtained from the GB decomposition are also relatively simple. Their 90° inherent ambiguity could be eliminated according to geological strikes. The direction of 10,000–1000 Hz is ~N60°E, which may reflect the trends of some shallow faults. By contrast, the direction of 100–10 Hz is mainly ~N120°E, which is similar to the boundary of the Cu mineralization belt and likely caused by underground lithologic interfaces.
The phase tensors of Zone2 show totally different features. Especially, those of 100 Hz show very large β angles (mostly greater than 3°) and complex long-axis directions, compared with their northern counterparts within Zone1. This can also be verified by the relatively complicated strike directions derived from GB decomposition. Considering that Zone2 covers the mineralization area and proven ore bodies. Additionally, as mentioned above, the porphyry metallogenic system is a complex 3D system. Therefore, it is reasonable to determine a relatively 3D electrical structure beneath Zone2.
It is notable that the strike directions of the highest frequencies (10,000 Hz and 1000 Hz) are also clearly aligned with the topographic ridge that the survey ran along. The interface between the topographic ridge and air is the most significant electrical resistivity contrast, which can make prominent 2D features. Additionally, the lithologic boundaries are mostly parallel or perpendicular to the extensional direction of the ridge. Therefore, whether the 2D features and clear strike directions are caused by underground structures or topography cannot be determined.
In conclusion, although the electrical dimensionality features in Cimabanshuo are relatively simple and most of the sub-regions are dominated by 1D/2D characteristics, the electrical strikes differ among different sub-regions and depths. In addition, relatively complicated 3D characteristics occur beneath the southern part of AMT array, due to the presence of ore-forming porphyry. In summary, it is necessary to carry out a 3D inversion of AMT data with topography to obtain reliable underground electrical structures beneath Cimabanshuo.

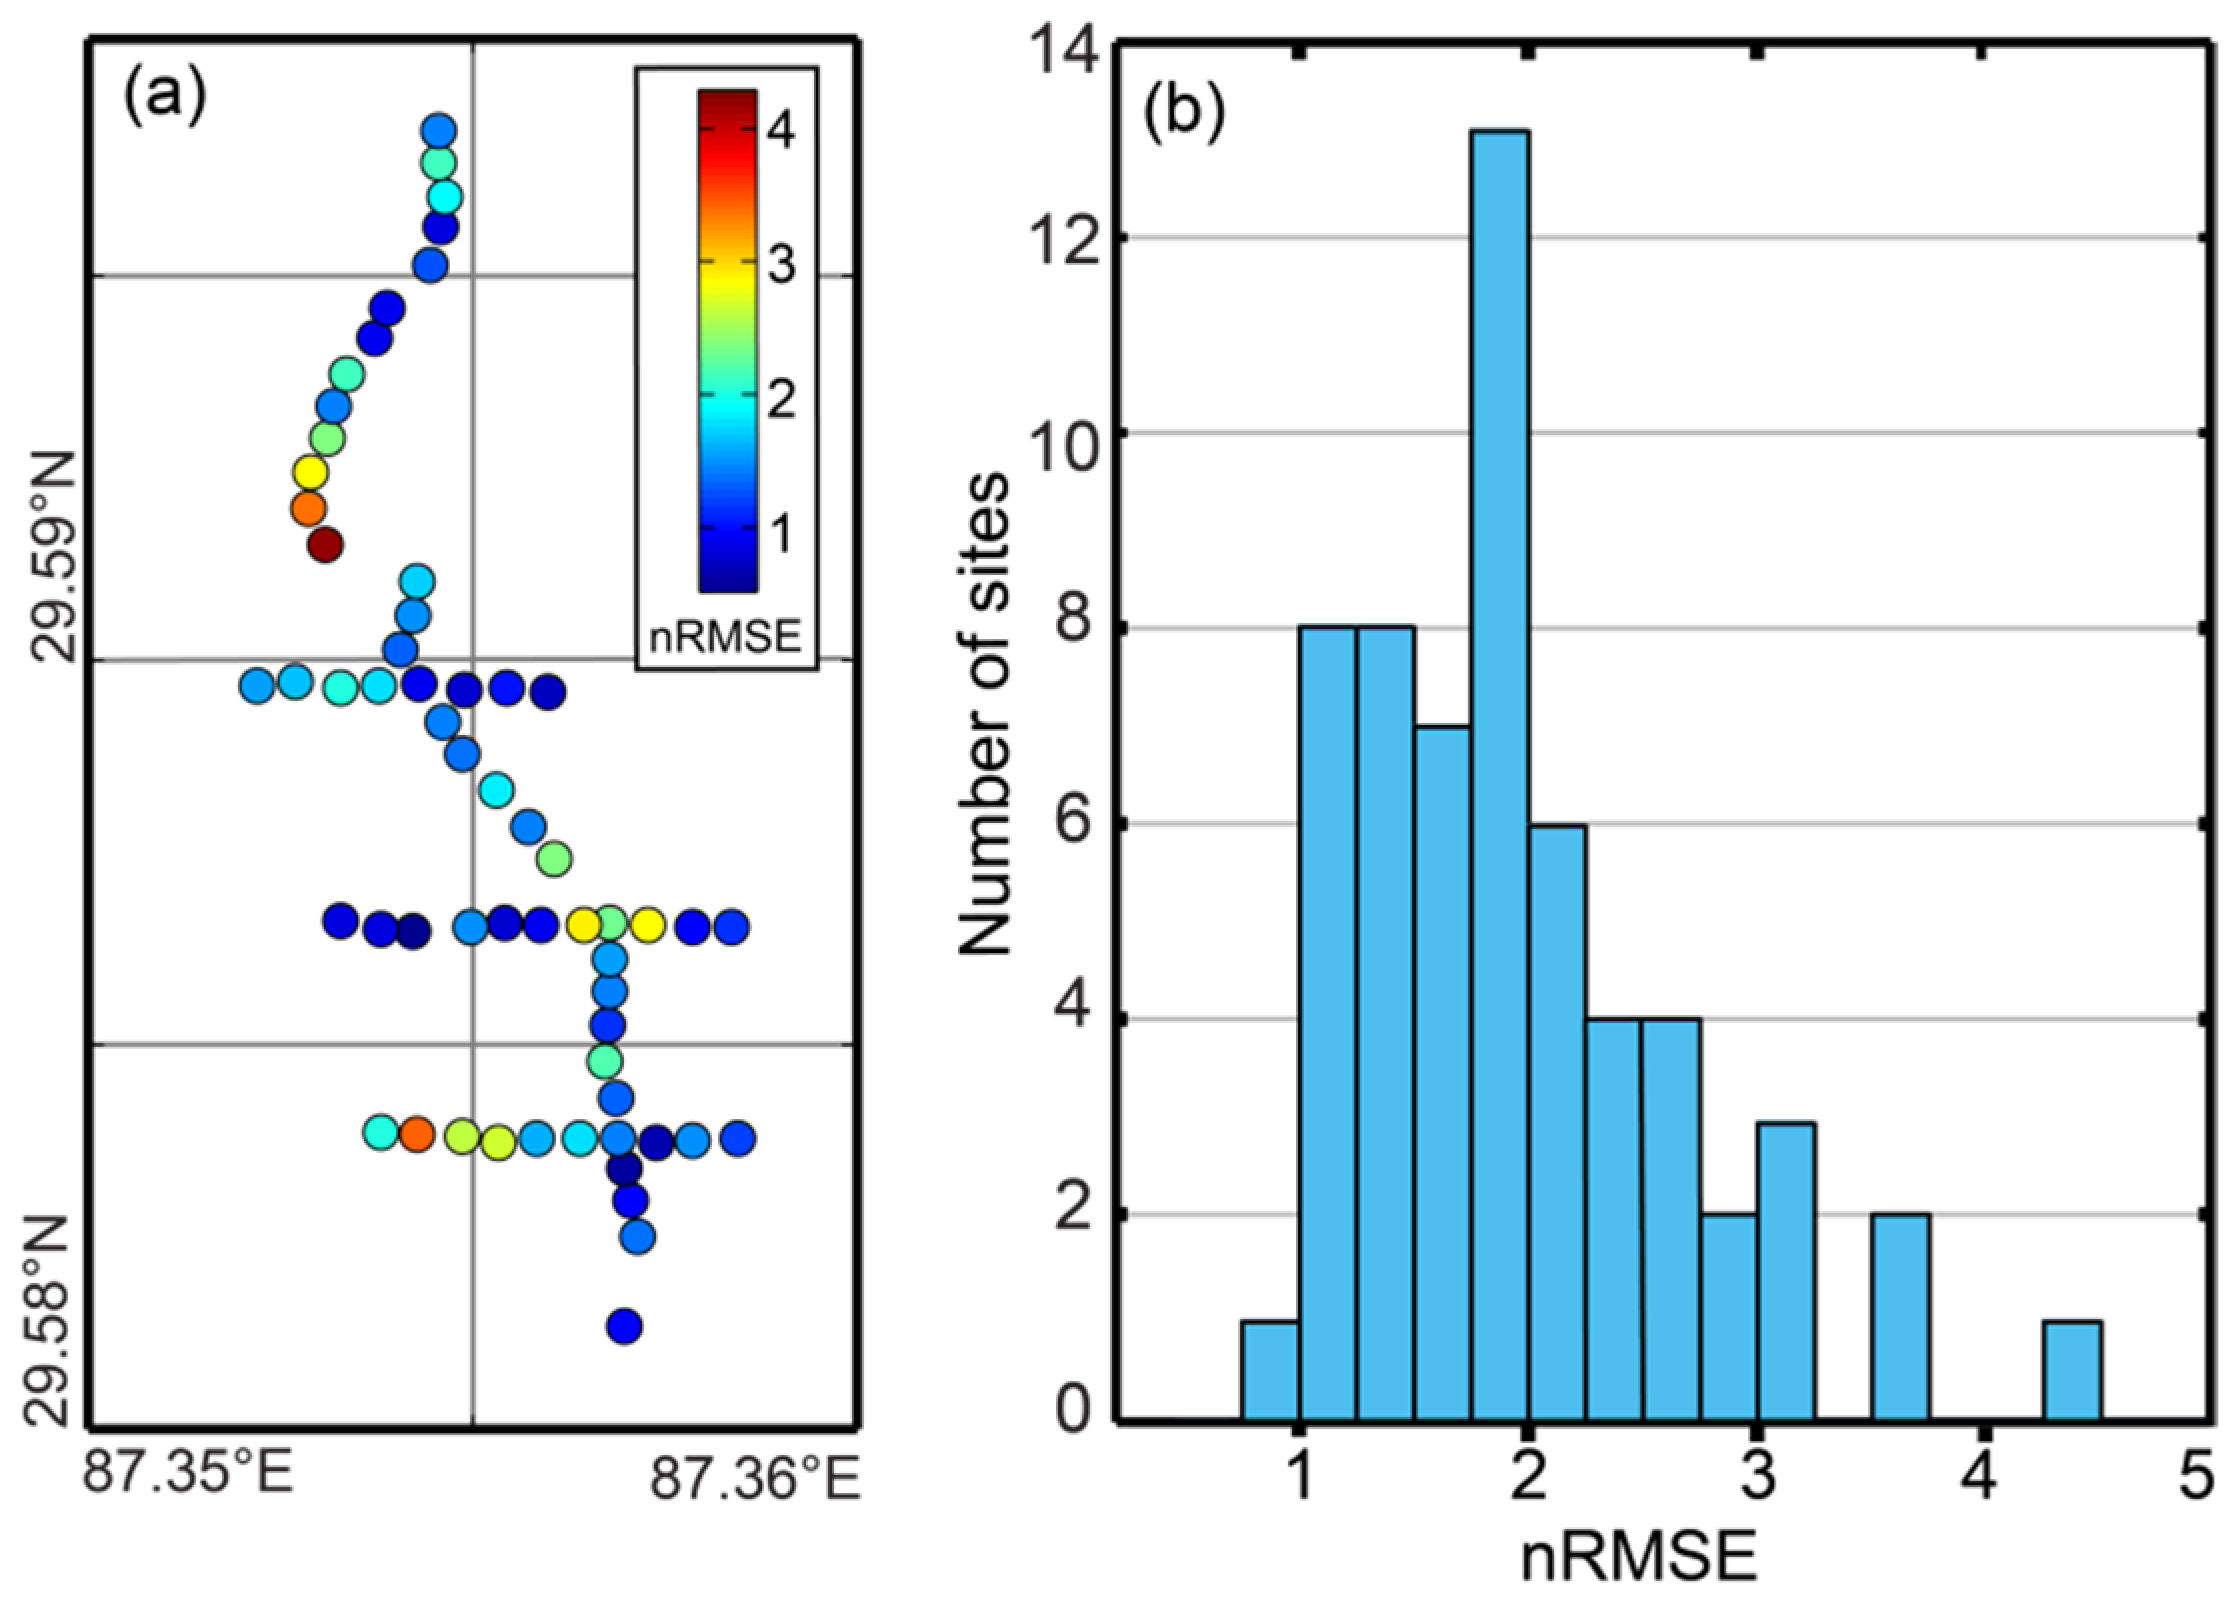
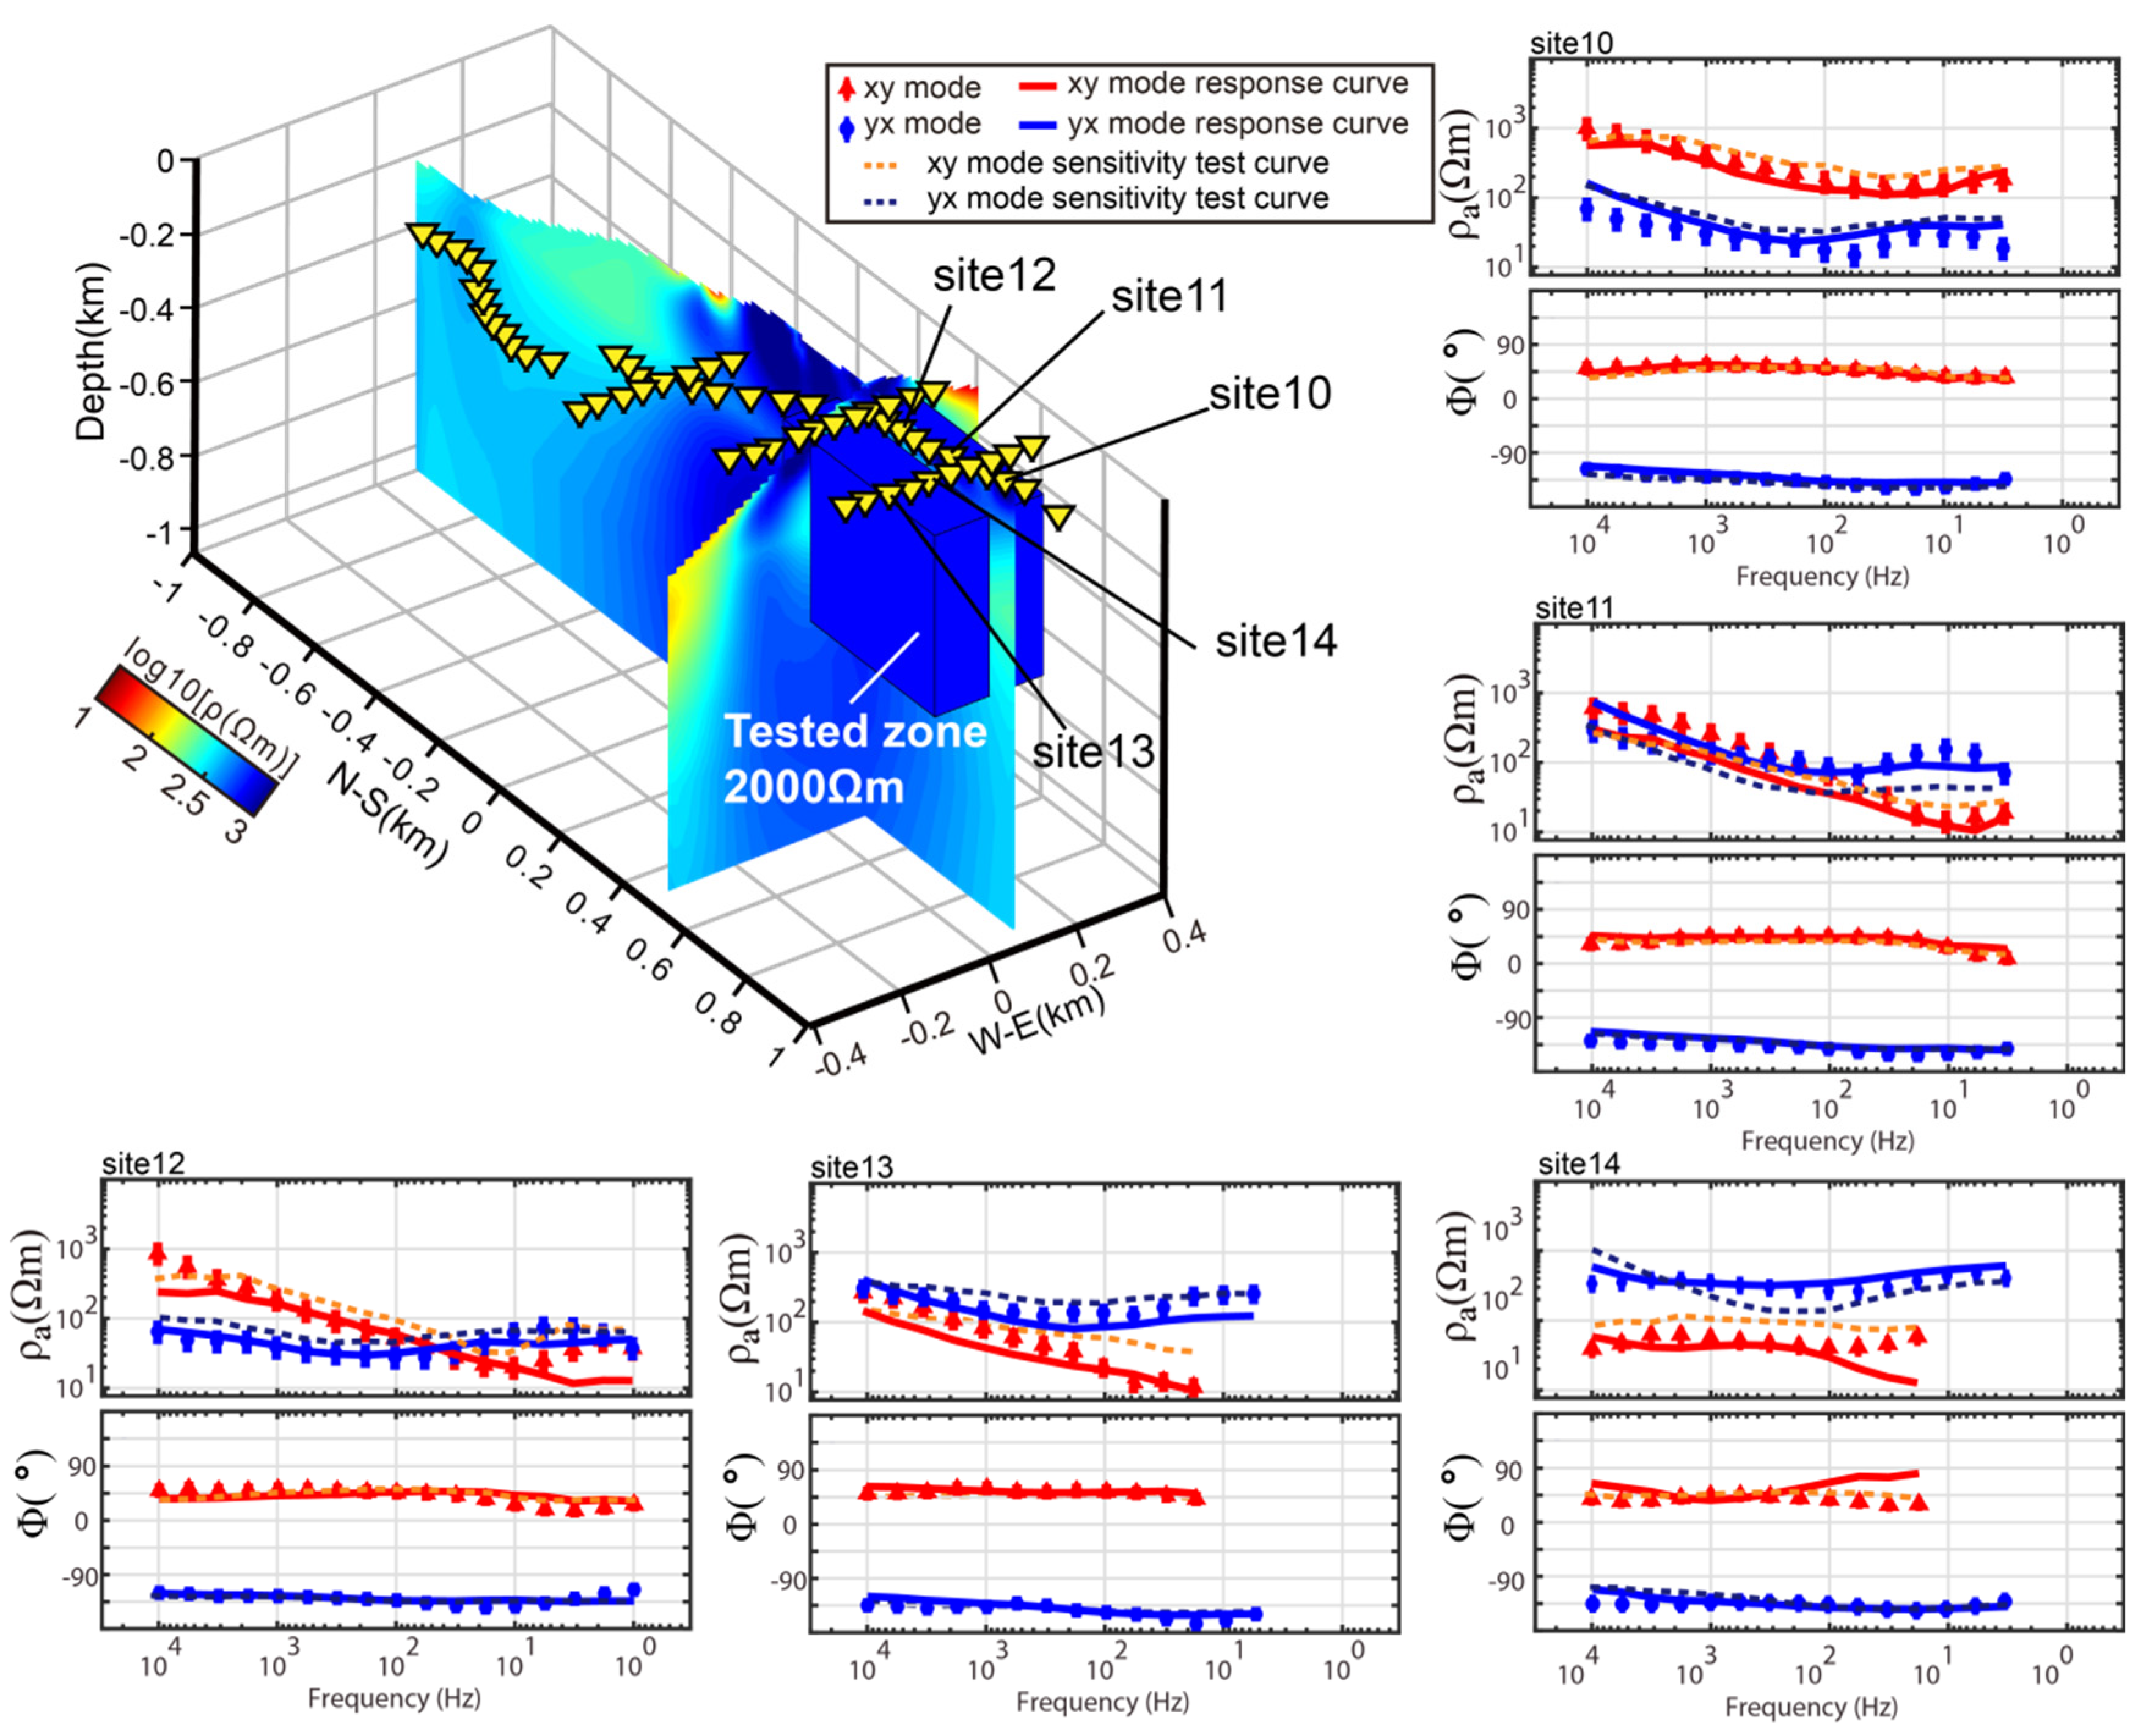
5. Three-Dimensional Inversion with Topography of AMT Data

The 3D inversion code of AMT data with topography we used is ModEM, which is based on the Non-Linear Conjugate Gradient (NLCG) algorithm [32,33]. We used Dong Hao’s code to generate the initial file and present the inversion results(The link of the code can be found in Supplementary Materials). Then, we import the diagonal (Zxx and Zyy) and non-diagonal (Zxy and Zyx) components of unrotated impedance tensor from 59 sites into the inversion code. After considering the mismatch of different values (5% and 10%, etc.) and the weight between model roughness, an error margin of 7.5% is finally selected. The initial model is a half space with a resistivity of 100 Ωm and a grid size of 105(Nx) × 49(Ny) × 60(Nz) m. The horizontal width of the grid is 20 m. Six units are filled in the periphery of the sites, and the width increases by 1.5 times. In the vertical direction, there are 60 layers, including 45 layers of terrain (each layer is 10 m thick) and the coefficient below the 45 layers increases exponentially by 1.45 times. Because the topography was taken into account, the initial model was constructed with real terrain data. The resistivity of 1010 Ωm was used to represent the air, while the resistivity of 100 Ωm was used below the surface to represent the earth. Additionally, “0” was set in the model covariance file (*.cov file) to lock the air value in the model so that it did not participate in the inversion calculation. In the data file (*.dat file), the z-coordinates of each site were also modified for the relative height of reference points based on the actual terrain data. We chose the data origin as the highest point in the model so that all data sites had non-negative z-coordinates. This ensured the avoidance of sites that were actually embedded inside the Earth, or in the air, which would cause an inaccuracy in the inversion.
We used a tower-type sever (Dell PowerEdge T440) with two processers containing 40 cores and 84 GB memories for the Parallel inversion calculation. The average time required for each iteration was about 1.75 h. After 66 iterations, the final overall Normalized-Root-Mean-Square error (nRMSe) for all sites was 1.77. The fitting of observed data was mostly acceptable, and those of several measured sites are shown in Figure 4.
The nRMSe values for every site are shown in Figure 6. Additionally, the frequency histogram of the nRMSe for all sites demonstrates that most sites (~49) had low nRMSe values between 0 and 2.5, indicating an acceptable fitting of the observed data.
However, it is notable that the data of several sites in Figure 4 do not seem to be well fitted, which could be due to the staircasing of the topography in the model, since the ModEM code uses finite-difference algorithm when conducting the forward modelling. The topography cannot be perfectly created by regular cube grids. Therefore, one option was to test multiple inversions using different parameter settings and select the best-fitted inversion for interpretation. In order to confirm the necessity of the inversion with topography, we also removed the topography of the inversion model by replacing the air (1010 Ωm) with 100 Ωm. The responses of the revised model are also shown in Figure 4 by dash lines. Clearly, the fittings became worse, compared with the original inversion model with topography, and the total R.M.S. misfit also increased to 3.0. Therefore, we suggested that an inversion that included topography was necessary.
The final 3D inversion model, which included the topography, was demonstrated by two different methods: horizontal slice (Figure 7), and vertical slice (Figure 8), on which we carried out a detailed geological interpretation.
In Figure 8, C1 is a clear and significant anomaly; therefore, sensitivity tests were performed on it. We replaced C1 by resistive material and carried out a forward modelling; the result is shown in Figure 9. It was evident that the degree of fitting decreased, which indicated the moderate presence of C1.

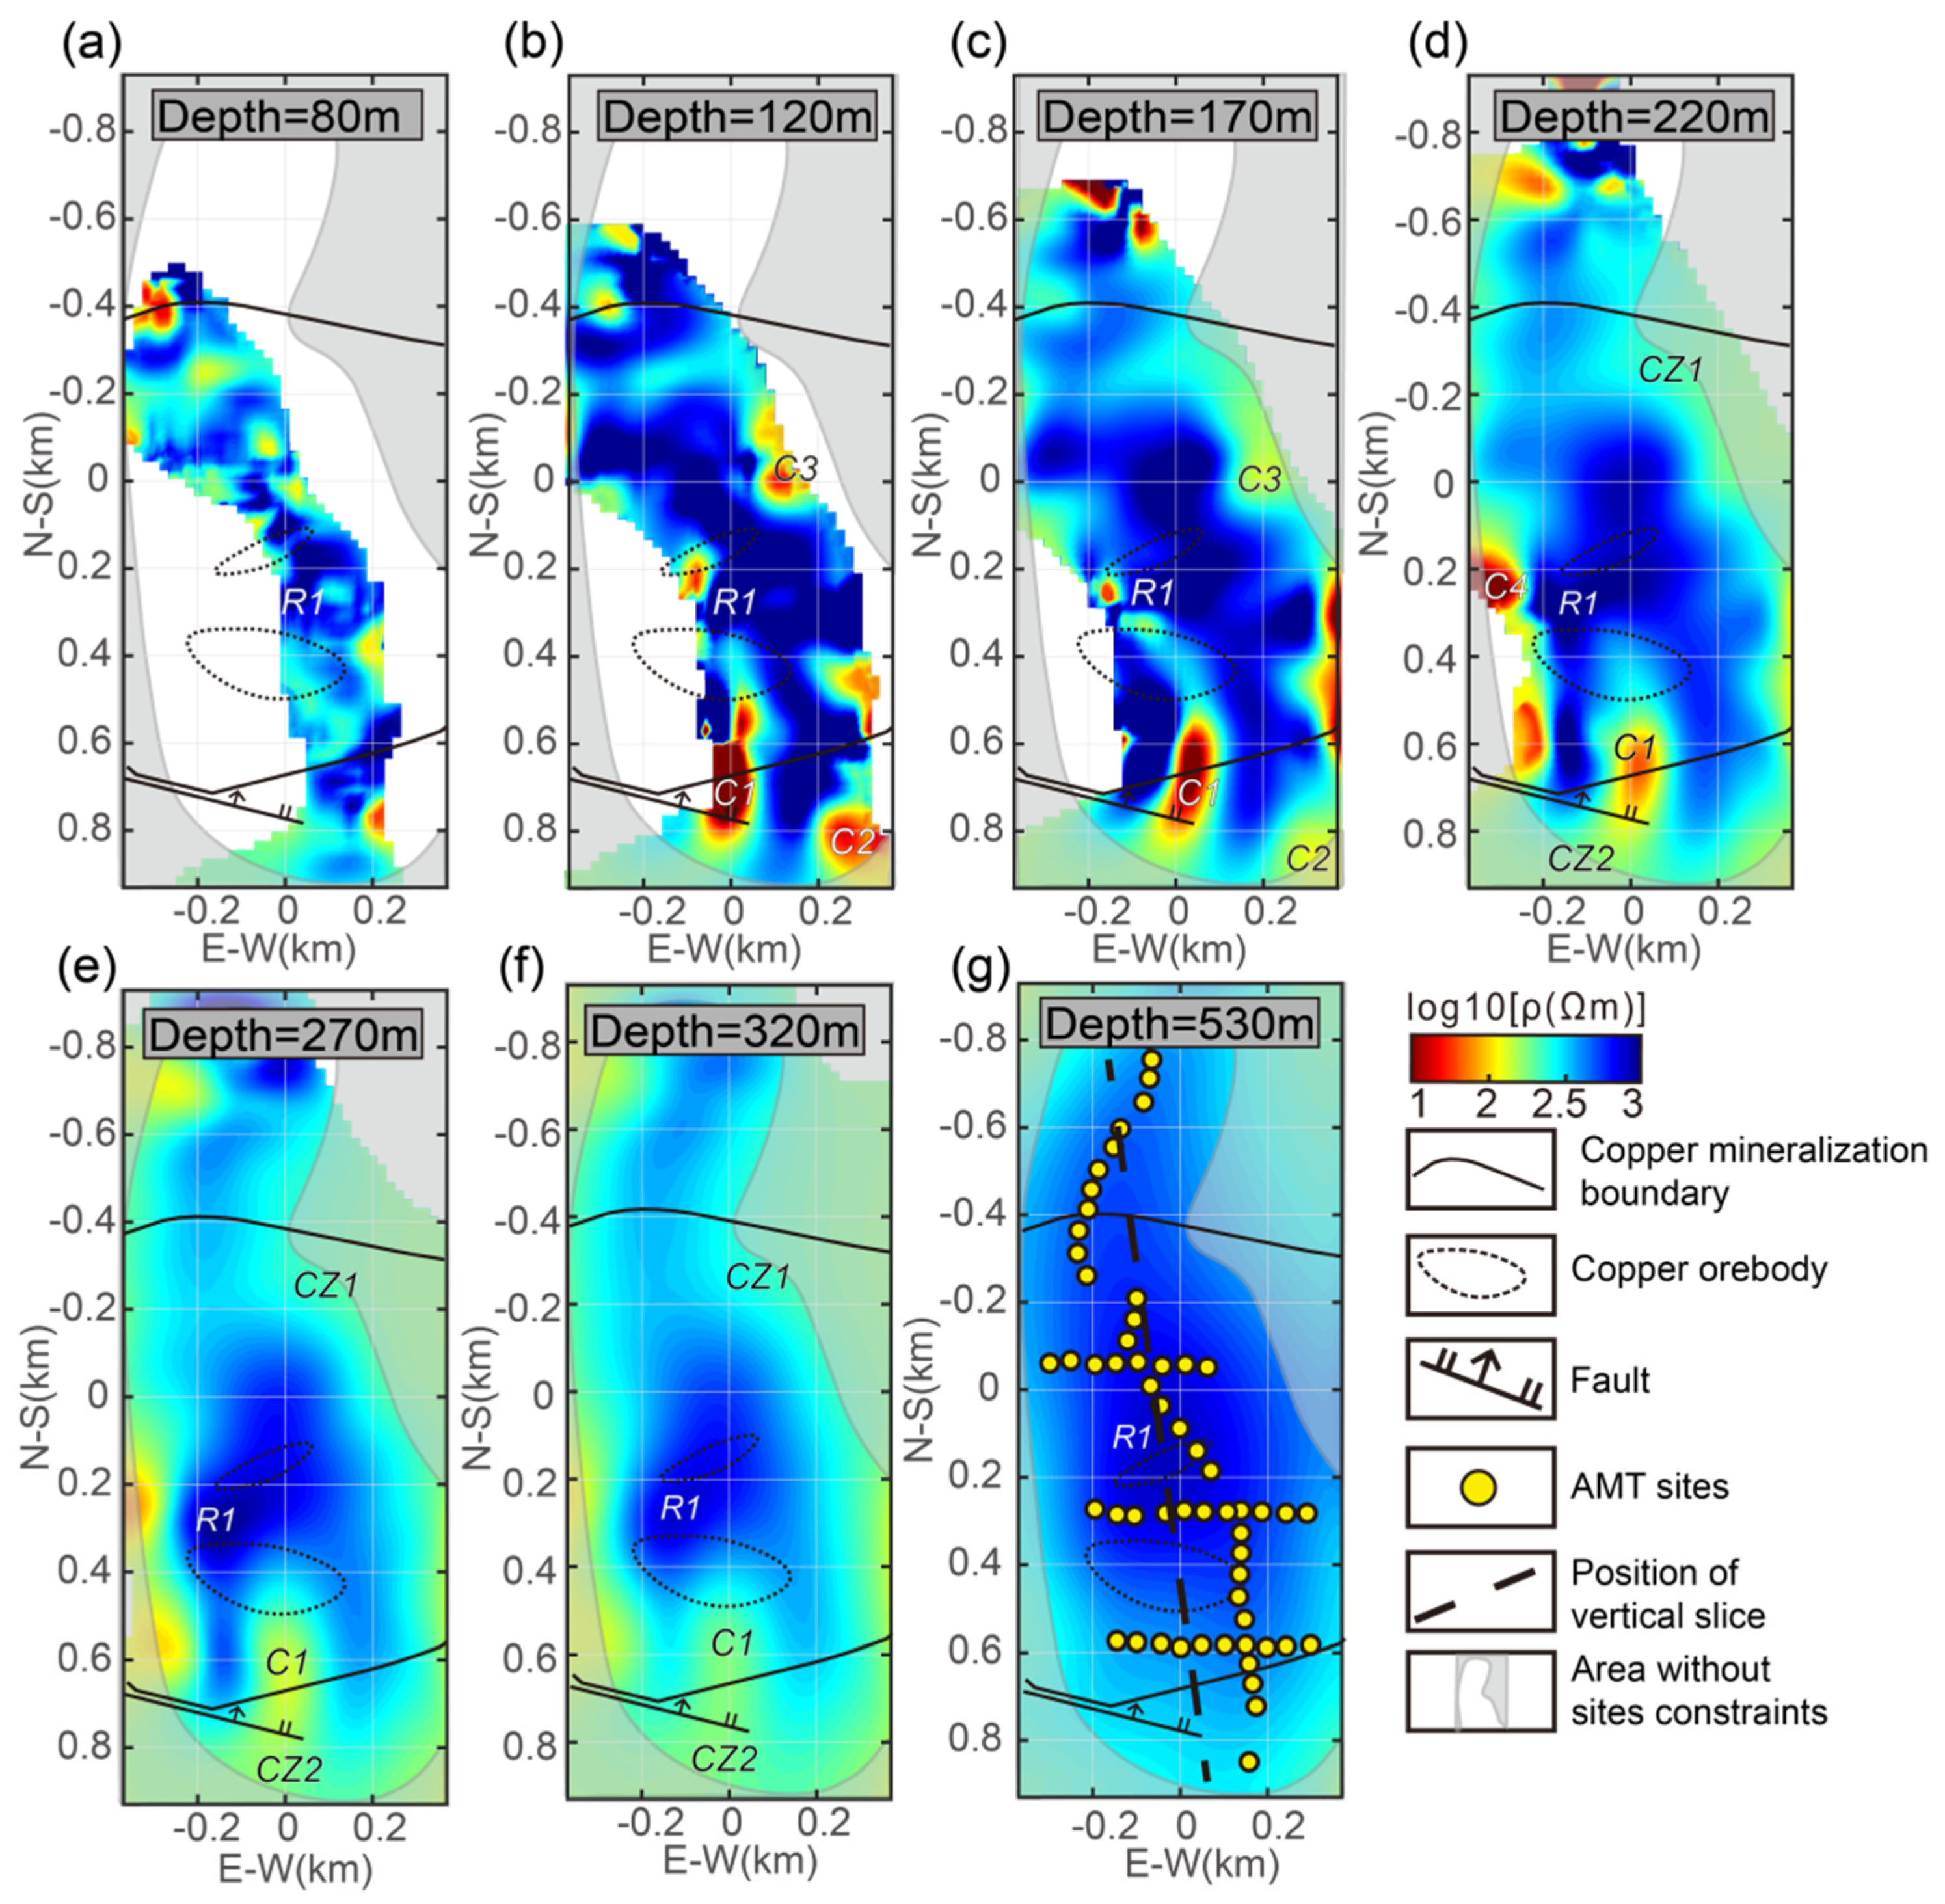
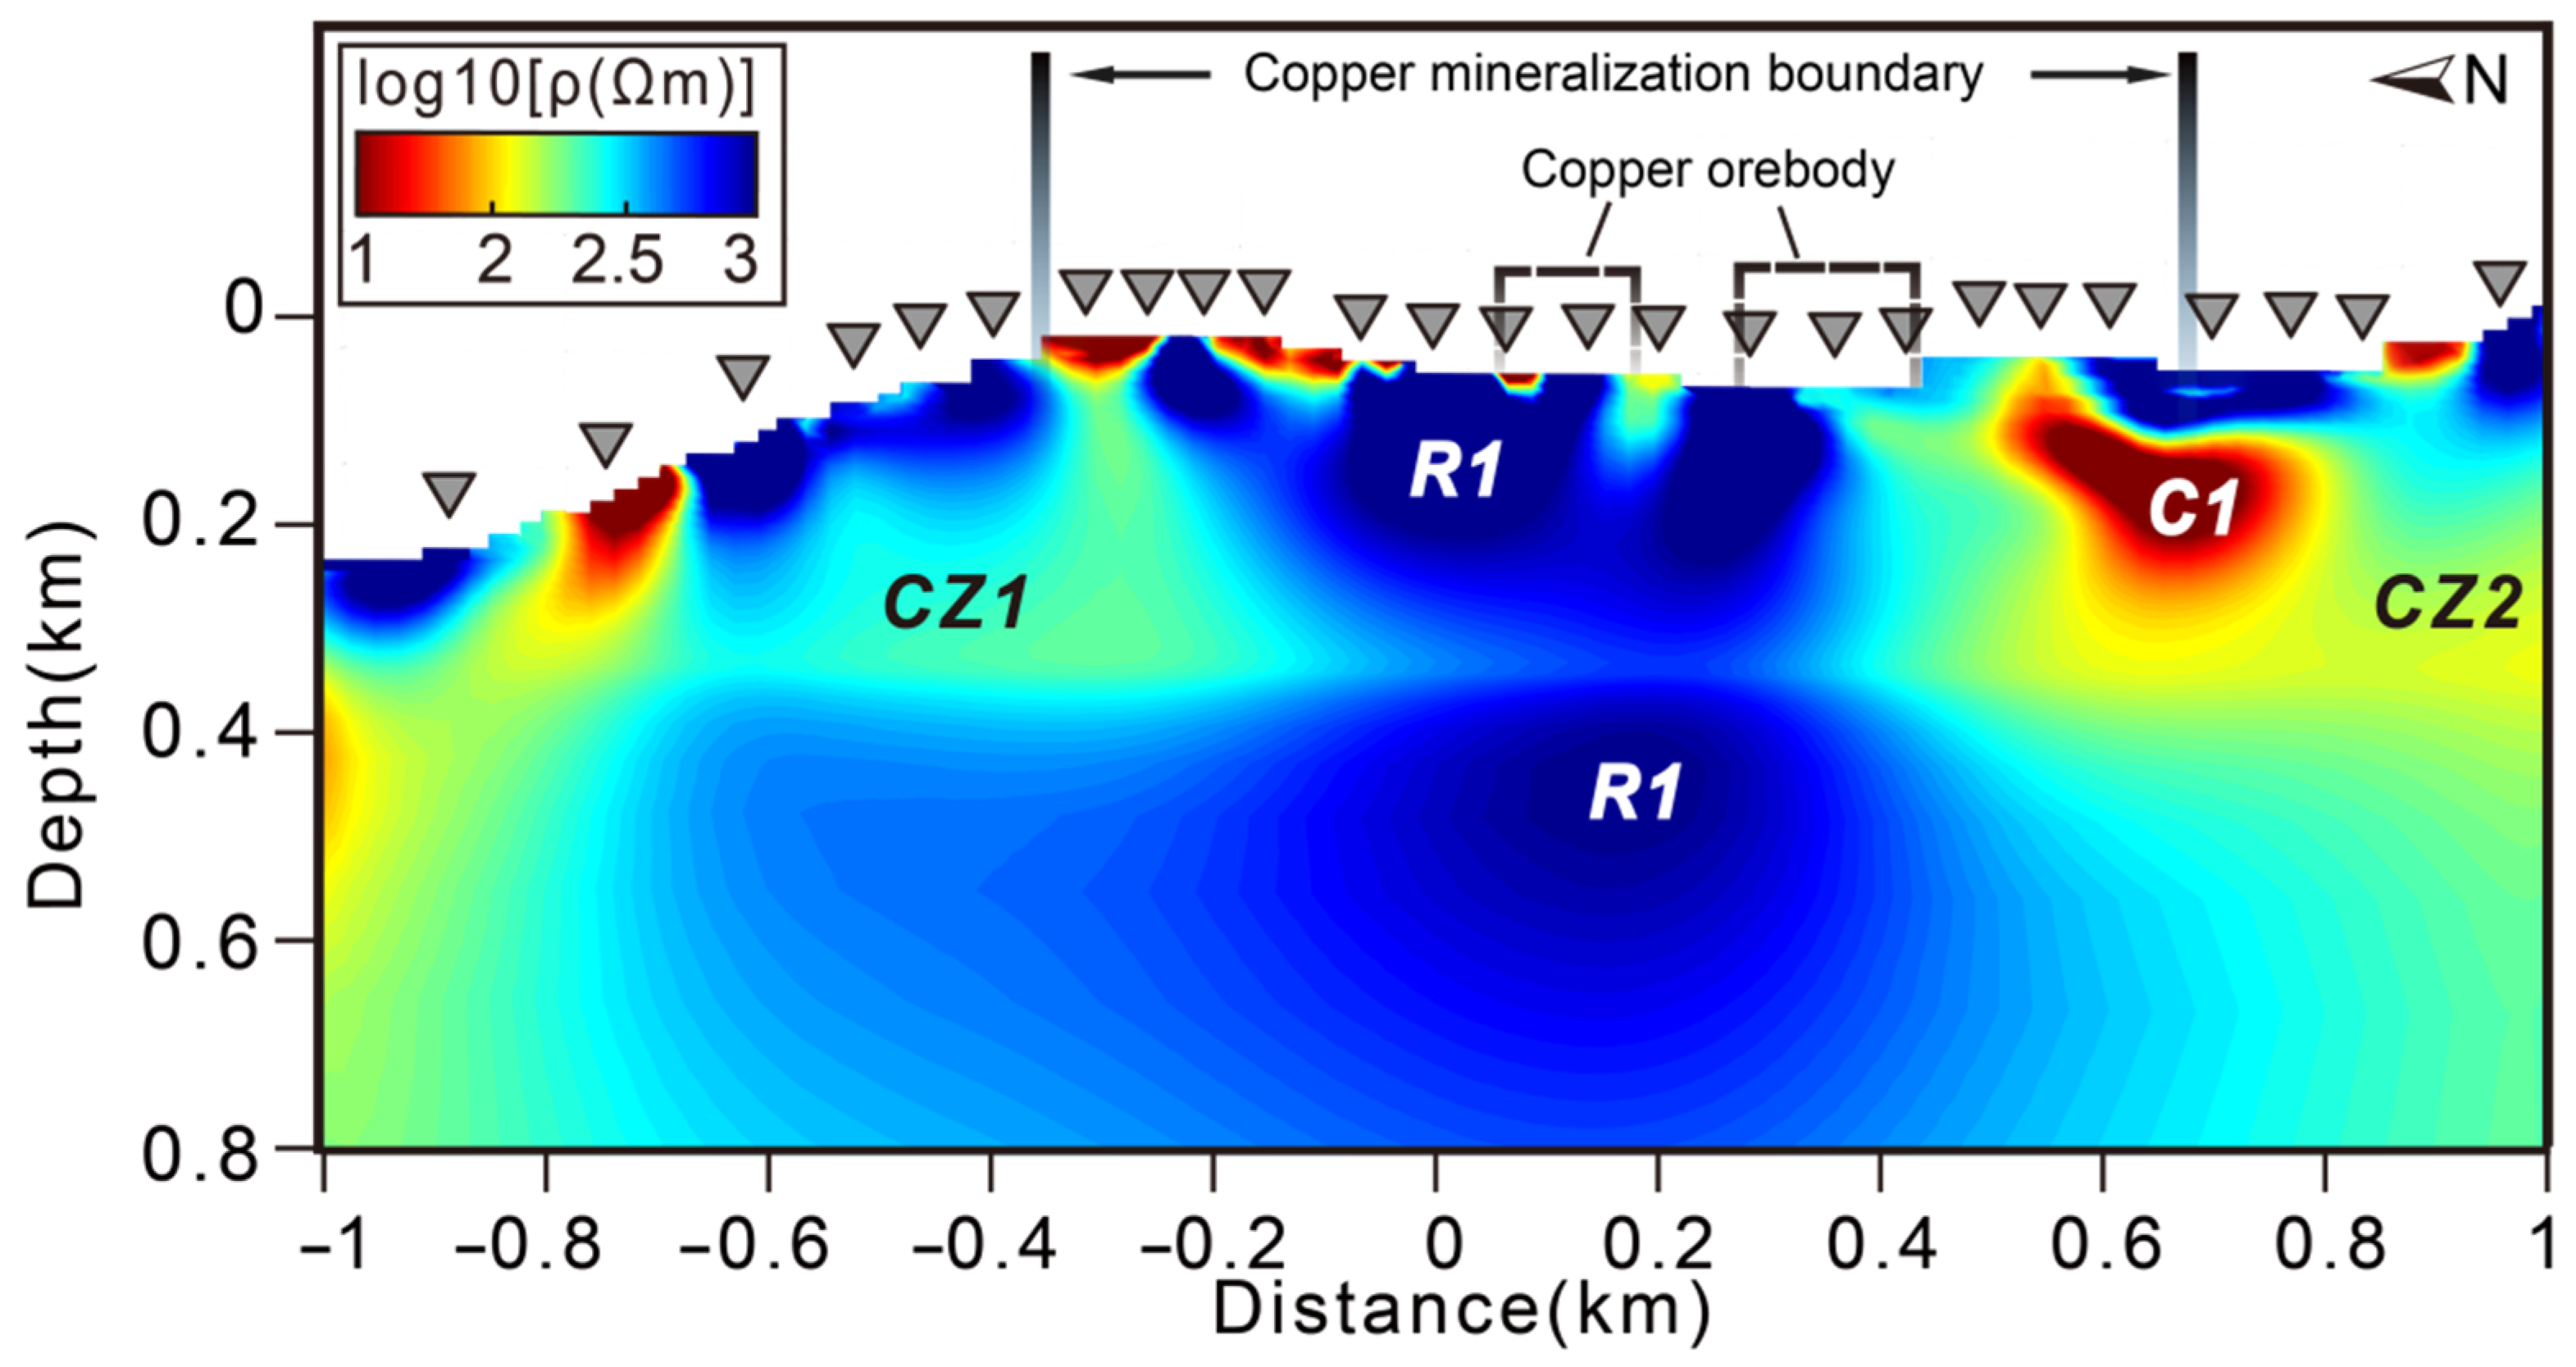
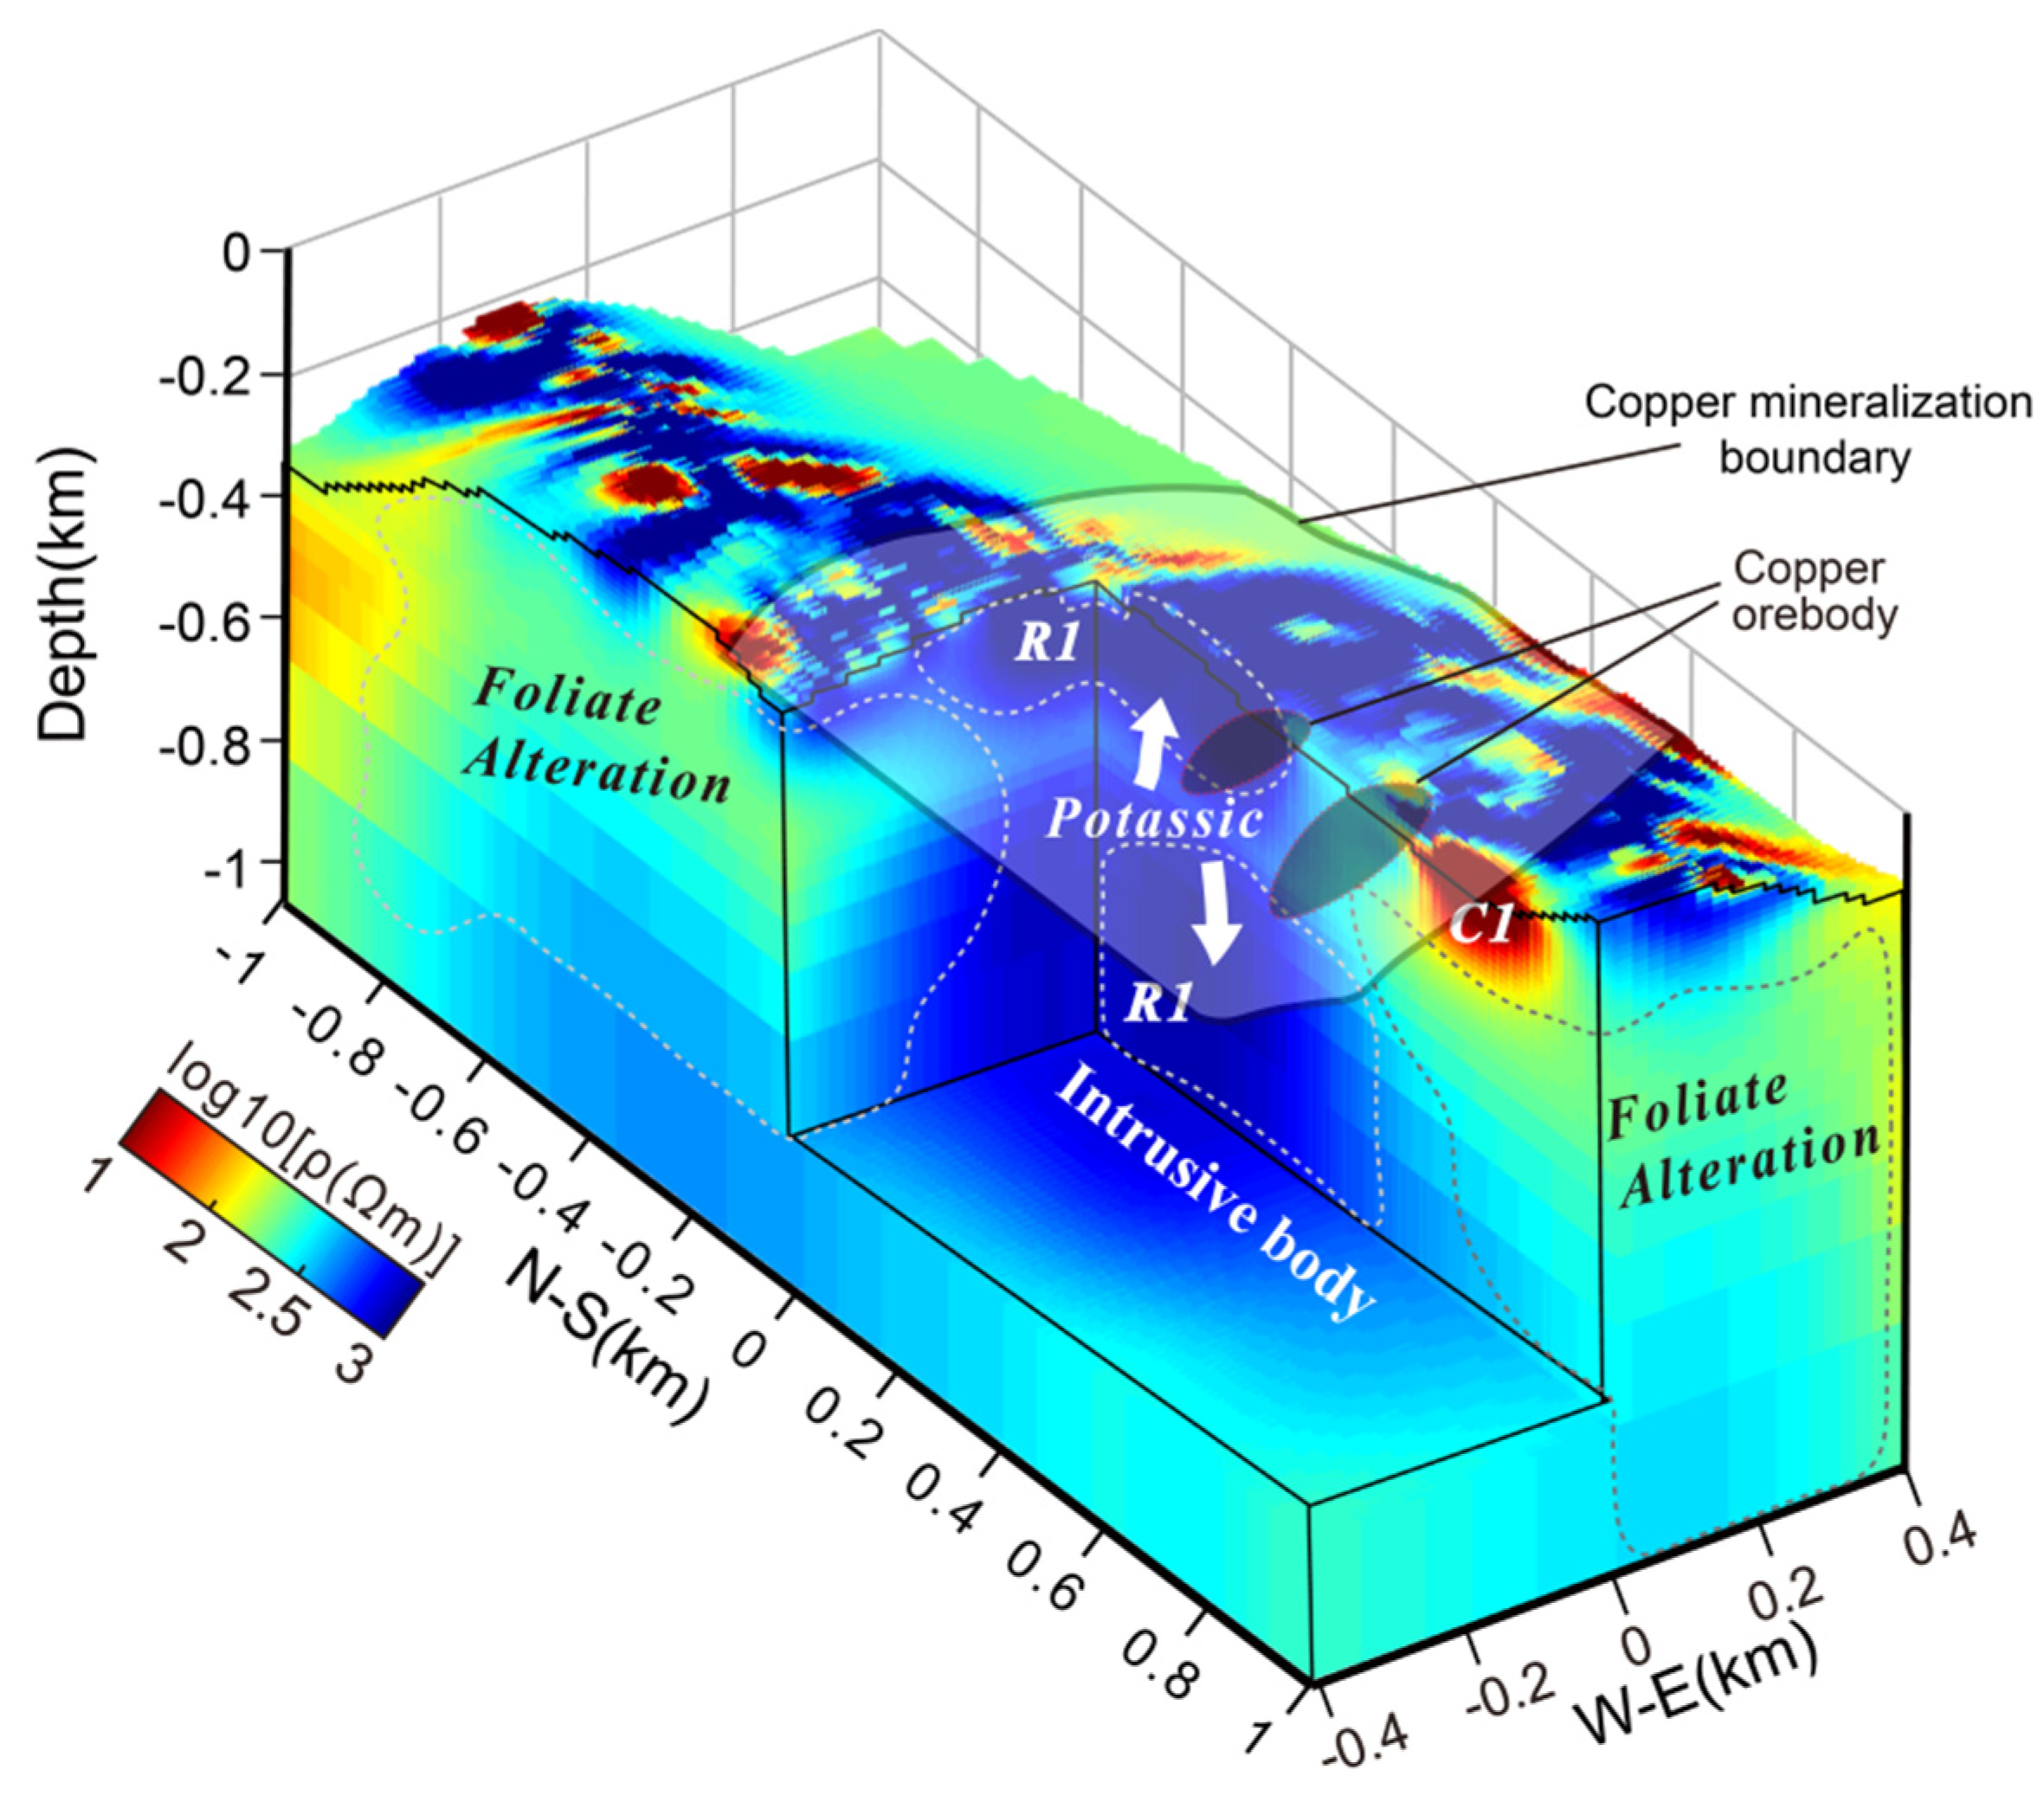
6. Geological Interpretations of the Electrical Resistivity Models

The expected electrical resistivity responses of typical porphyry systems vary depending on alteration degrees and different types of deposits (Figure 1, modified from [12]). The alteration zones are formed under specific temperature and salinity conditions; therefore, the space and depth of each alteration zone differ significantly for different deposits. Accordingly, we made geological interpretations of the inversion model for the Cimabanshuo deposit; the 3D resistivity model with topography is shown in Figure 10.

6.1. High-Resistivity Potassic Intrusive Rocks

A wide range of the high-resistivity zone, R1, occurs beneath the research area, which can be observed in both horizontal and vertical sections (Figure 7 and Figure 8). This is not unexpected. If a deposit is altered to porphyry level, according to the idealized electrical resistivity profile of porphyry system shown in Figure 1 (modified from [12]), the high-resistivity potassic zone dominates the resistivity profile. Potassic zones are composed of crystalline intrusive rocks and usually show high-resistivity features due to the current flow being limited by the absence of micropores within rocks [10]. The resistivity of the newly formed intrusive rocks is generally 1000–5000 Ωm, which varies with the fracturing degree. There is a large area of 15.2 ± 0.8 Ma–15.2 ± 0.7 Ma (~15.2 Ma)-aged Gangdese ore-bearing granitic porphyry outcrop in Cimabanshuo area [23]. However, it can be observed that the resistivity range of R1 is ~500–2000 Ωm, which is clearly lower than newly formed intrusive rock.
In fact, the locations of Cu mineralization delineated by geological mapping are also mainly located in the high-resistivity area (Figure 7). This abnormal observation is actually similar to that of the Morrison porphyry Cu deposit at the Cordillera Mountains, Canada [15]. The resistivity values beneath the 0.3% Cu belt predominantly range from 100 to 1000 Ωm, which was suggested to contain potassic intrusive rocks with low-content or/and disconnected metal sulfides. The average grade of Cu ore in Cimabanshuo is ~0.2629–0.5726% [23], which is essentially the same as that of Morrison (~0.3%, [15]). According to the idealized model in Figure 1, the most likely explanation for the high-resistivity body nearest to the Cu ore body is the potassic intrusive rocks. At the final stage of porphyry mineralization, the metallic elements precipitate in the form of metal sulfides, and then cool down and react with the surrounding rocks. Consequently, chalcopyrite and molybdenite precipitate, present in quartz veins and disseminated in potassic altered rocks, generates Cu, Fe, and Mo sulfides with potentially economical values [4]. The Cimabanshuo chalcopyrite is diffusedly distributed along the rock fractures and K-feldspar phenocrysts of porphyry granites [25]. However, the abundance of sulfide in the potassic rocks is not high (usually only ~1–2 vol%), the interconnection of which is usually poor [13]. Therefore, the resistivity values are usually higher than 1000 Ωm. In conclusion, it is plausible to interpret the medium–high resistivity blocks near the Cu ore body as potassic intrusive rocks.

6.2. High-Conductivity or Sulfide-Rich Foliate Alteration Zone

In the upper part of inversion model (Figure 7 and Figure 8), there are several significantly conductors that are shallower than 200 m, such as C1, C2 and C3. Their resistivity values are all less than 100 Ωm, even less than 5 Ωm, such as C1; its rational existence is verified in Figure 9. According to the idealized resistivity profile in Figure 1, there are several possible explanations for this kind of high conductors, which are discussed one-by-one according to the geological information of the Cimabanshuo deposit as follows.

6.2.1. Argillic Alteration Zone

The porphyry deposits with a shallow argillation and late-stage argillation alteration can show an extremely low resistivity at near-surface depths due to the clay minerals within the argillaceous zone [3]. Clay minerals are usually loose and have a large porosity, resulting in the enrichment of secondary high-conductivity materials, such as saline fluids, which greatly reduce bulk resistivity [34]. However, we do not suggest that the above conductors are caused by the argillaceous alterations. The reason is that most of argillaceous alteration occurs under the condition of low-degree denudation. Under this condition, according to the idealized porphyry metallogenic model (Figure 1a), the hydrothermal Ag-Pb-Zn metallogenic system has not been entirely denuded, and thus the underlying porphyry metallogenic system cannot be well exposed [35]. In this case, the above conclusion that the high-resistivity blocks are porphyry would be invalid. In fact, according to the fission-track dating and thermal simulation/modeling of the Zhunuo porphyry Cu deposit 10 km far to northwest of Cimabanshuo deposit, the main deposits of the western Gangdese belt experienced at least two rapid uplifts, i.e., 8–11 Ma and 4–6 Ma after the main metallogenic period (~15.2 Ma, [36]). The denudation amount of Zhunuo deposit was suggested to be 2.25–2.63 km [37]. Cimabanshuo has a higher elevation than Zhunuo deposit (averagely ~4600 m). Thus, it might experience a larger degree of denudation. Under this condition, the shallow hydrothermal Ag-Pb-Zn metallogenic system and the argillaceous alteration zone are unlikely to be preserved [3], and thus the possibility of interpreting the shallow conductors as argillaceous alteration zones for Cimabanshuo could be ruled out.

6.2.2. Massive Sulfide

Except the argillation excluded above, another possible mechanism for the conductors surrounding the high-resistivity intrusive rocks might be rich in metal sulfides. Nelson [13] collected 109 sets of resistivity measurements from four porphyry Cu deposits, and the results showed that the resistivity was inversely proportional to the sulfide content, although this study did not include massive sulfide samples. However, other studies showed that the sulfides generally weighed more than 50 wt.% and interconnected easily, with an extremely low resistivity (up to ~0.1–1 Ωm, [38]). In fact, most of the apparent conductors in our resistivity model cannot reach such low resistivity values. Instead, most of them range from 10 to 30 Ωm. Additionally, there is no evidence of massive Cu sulfide from drilling work in Cimabanshuo, and the porphyry Cu content here is not very high, with a maximum of 0.5726% [23]. Therefore, this possibility can also be essentially ruled out.

6.2.3. Foliate Alteration Zone

In a porphyry metallogenic system, except for the argillization and massive sulfide excluded above, disseminated sulfides can also reduce whole-rock resistivity. However, this mechanism cannot reduce as drastically as the former two, considering that the significant conductors, C1, C2, and C3, are mainly distributed around the inferred Cu ore body. According to the theory of porphyry mineralization [2], the ore-forming fluids become increasingly acidic when they rise to the near-surface and cool down, which leads to leaf-like (quartz–sericite–pyrite) alterations [4]. According to the idealized resistivity model of the porphyry deposit in Figure 1, the alteration closest to the ore body is dominated by sericitization. The kind of alteration is characterized by a large amount of veinlet disseminated Pyrite (up to 20 vol%), which can significantly lower the whole-rock resistivity. This mainly depends on the number and connectivity of sulfide particles [13]. When the sulfide content is 3–20 wt.%, it is distributed in veins. The corresponding whole-rock resistivity can range between 100 and 1000 Ωm. When the sulfide content reaches 20 wt.%, the connectivity is relatively improved, and the whole-rock resistivity can be reduced to 10 Ωm. The alteration found in the Cimabanshuo deposit is mainly a vein-type block propylitization and white-color sericitization alteration [23]. The conductors around the ore body are mostly ~10–300 Ωm, which are inferred to contain sulfide with a relatively high content or good connectivity. Combined with the location of the high conductors and the actual geological conditions, we suggest that they may represent sericitization alteration containing pyritization. The medium–high conductor (~50–300 Ωm) around the inferred intrusive rocks of Morrison porphyry Cu deposit in Canada [15], is also interpretated in this way, which can be compared to that of Cimabanshuo. In fact, the proven ore bodies of Cimabanshuo are mainly located at the junction zones of high-resistivity intrusive rocks and relatively high-conductivity sericitization alteration zones, which could also be favorable positions for mineralization.

7. Conclusions

We conducted a 3D inversion with topography for 59 AMT sites belonging to an array covering the main mineralization zone and ore bodies of Cimabanshuo Cu porphyry deposit in the western Gangdese metallogenic belt, Tibet. Combined with other geological information, the main following conclusions can be drawn as follows:
(1)
A large range of high-resistivity anomaly (~500–2000 Ωm) appears beneath the proven Cu mineralization zone and ore bodies, and is interpreted as intrusive rock with potassic alterations. Although containing chalcopyrite, it is characterized by middle–high resistivity due to low sulfide content and poor connectivity.
(2)
A series of scattered conductors (~10–300 Ωm) around the Cu ore bodies are distributed in the shallow layer from near-surface area to ~200 m, possibly indicating a phyllic alteration containing pyritization and connected metal sulfides.
(3)
The proven ore bodies of Cimabanshuo are mainly located at the junction regions of high-resistivity intrusive rocks and relatively high-conductivity sericitization alteration zones.
In summary, the 3D inversion with topography of AMT data can visually display the 3D distribution of intrusive rocks and alteration zones beneath porphyry Cu deposits in high-elevation regions, and provide a reference for further exploration works.

Supplementary Materials

The following supporting information can be downloaded at: https://0-www-mdpi-com.brum.beds.ac.uk/article/10.3390/min11121424/s1, Figure S1: title; Table S1: title; Video S1: title. The supplementary materials contain the model and data files of 3D inversion.

Author Contributions

Conceptualization, P.Q. and Y.Y.; methodology, Y.Y.; software, H.D. and P.Q.; validation, P.Q., L.X., J.H.; formal analysis, S.J. and W.W.; investigation, L.X.; resources, Y.Y.; data curation, Y.Y.; writing—original draft preparation, P.Q. and Y.Y.; writing—review and editing, P.Q. and Y.Y.; project administration, Y.Y. All authors have read and agreed to the published version of the manuscript.

Funding

This research was mainly supported by the National Key Research and Development Program of China (NO. 2018YFC0604104). The development of some methods used in this research was supported by National Natural Science Foundation of China (Grant NO. 41974092 and 41704079), Fundamental Research Funds for the Central Universities (NO. 2652018271).

Data Availability Statement

The model and data files of 3D inversion were compressed and uploaded as supplementary files.

Acknowledgments

We thank Gary Egbert and his group members for sharing their 3D inversion code. We thank Alan Jones and Gary NcNeice for using their tensor decomposition codes. We thank all the faculty and graduate students from the MT group in China University of Geosciences (Beijing) for providing facilities for data collection and processing.

Conflicts of Interest

The authors declare no conflict of interest.

References

  1. Kesler, S.E.; Wilkinson, B.H. Earth’s copper resources estimated from tectonic diffusion of porphyry copper deposits. Geology 2008, 36, 255–258. [Google Scholar] [CrossRef]
  2. Richards, J.P. Postsubduction porphyry Cu-Au and epithermal Au deposits: Products of remelting of subduction-modified lithosphere. Geology 2009, 37, 247–250. [Google Scholar] [CrossRef]
  3. Sillitoe, R.H. A Plate Tectonic Model for the Origin of Porphyry Copper Deposits. Econ. Geol. 1972, 67, 184–197. [Google Scholar] [CrossRef]
  4. Richards, J.P. Tectono-Magmatic Precursors for Porphyry Cu-(Mo-Au) Deposit Formation. Econ. Geol. 2003, 98, 1515–1533. [Google Scholar] [CrossRef]
  5. Sillitoe, R.H.; McKee, E.H. Age of supergene oxidation and enrichment in the Chilean porphyry copper province. Econ. Geol. 1996, 91, 164–179. [Google Scholar] [CrossRef]
  6. Mathur, R.; Ruiz, J.; Munizaga, F. Relationship between copper tonnage of Chilean base-metal porphyry deposits and Os isotope ratios. Geology 2000, 28, 555–558. [Google Scholar] [CrossRef]
  7. Hou, Z.Q.; Meng, X.J.; Qu, X.M.; Gao, Y.F. Copperore potential of adakitic intrusives in Gangdese porphyry copper belt: Constrains from rock phase and deep melting process. Miner. Depos. 2005, 24, 121–132. [Google Scholar]
  8. Lowder, G.G.; Dow, J.A.S. Geology and exploration of porphyry copper deposits in North Sulawesi, Indonesia. Econ. Geol. 1978, 73, 628–644. [Google Scholar] [CrossRef]
  9. Pinet, N.; Gloaguen, E.; Giroux, B. Introduction to the special issue on geophysics applied to mineral exploration. Can. J. Earth Sci. 2019, 56, 5–8. [Google Scholar] [CrossRef]
  10. Lowell, J.D.; Guilbert, J.M. Lateral and vertical alteration-mineralization zoning in porphyry ore deposits. Econ. Geol. 1970, 65, 373–408. [Google Scholar] [CrossRef]
  11. Mitchinson, D.E.; Enkin, R.J.; Hart CJ, R. Linking Porphyry Deposit Geology to Geophysics via Physical Properties: Adding Value to Geoscience BC Geophysical Data; Geoscience BC: Vancouver, BC, Canada, 2013. [Google Scholar]
  12. Hübert, J.; Lee, B.M.; Liu, L.; Unsworth, M.J.; Richards, J.P.; Abbassi, B.; Cheng, L.Z.; Oldenburg, D.W.; Legault, J.M.; Rebagliati, M. Three-dimensional imaging of a Ag-Au-rich epithermal system in British Columbia, Canada, using airborne z-axis tipper electromagnetic and ground-based magnetotelluric data. Geophysics 2015, 81, B1–B12. [Google Scholar] [CrossRef] [Green Version]
  13. Nelson, P.H. Estimation of sulfide content from induced polarization data. Geophysics 1983, 48, 62. [Google Scholar] [CrossRef]
  14. Meju, M. Geoelectromagnetic Exploration for Natural Resources: Models, Case Studies and Challenges. Surv. Geophys. 2002, 23, 133–206. [Google Scholar] [CrossRef]
  15. Lee, B.M.; Unsworth, M.J.; Hübert, J.; Richards, J.P.; Legault, J.M. 3D joint inversion of magnetotelluric and airborne tipper data: A case study from the Morrison porphyry Cu–Au–Mo deposit, British Columbia, Canada. Geophys. Prospect. 2018, 66, 397–421. [Google Scholar] [CrossRef]
  16. Strangway, D.W.; Swift, C.M.; Holmer, R.C. The application of audio-frequency magnetotellurics (AMT) to mineral exploration. Geophysics 1973, 38, 1159–1175. [Google Scholar] [CrossRef]
  17. Sandberg, S.K. Controlled-source audiomagnetotellurics in geothermal exploration. Geophysics 1982, 47, 100. [Google Scholar] [CrossRef]
  18. Johannes, S.K.; Alexander, V.G.; Alexey, V.K. Topographic distortions of magnetotelluric transfer functions: A high-resolution 3-D modelling study using real elevation data. Geophys. J. Int. 2018, 215, 1943–1961. [Google Scholar]
  19. Dong, H.; Wei, W.B.; Ye, G.F.; Jin, S.; Jing, J.E. Study of Three-dimensional magnetotelluric inversion including surface topography based on Finite-difference method. Chin. J. Geophys. 2014, 57, 939–952. [Google Scholar]
  20. Li, S.H.; Booker, J.R.; Aprea, C. Inversion of magnetotelluric data in the presence of strong bathymetry/topography. Geophys. Prospect. 2008, 56, 259–268. [Google Scholar] [CrossRef]
  21. Wang, R.; Richards, J.P.; Zhou, L.M.; Hou, Z.Q.; Stern, R.A.; Creaser, R.A.; Zhu, J.J. The role of Indian and Tibetan lithosphere in spatial distribution of Cenozoic magmatism and porphyry Cu–Mo deposits in the Gangdese belt, southern Tibet. Earth Sci. Rev. 2015, 150, 68–94. [Google Scholar] [CrossRef]
  22. Hou, Z.Q.; Zhang, H.R. Geodynamics and metallogeny of the eastern Tethyan metallogenic domain. Ore Geol. Rev. 2015, 70, 346–384. [Google Scholar] [CrossRef]
  23. Zhao, Y.Y.; Liu, X.F.; Liu, Y.C.; Liu, B.; Fu, H.L.; Lv, J.L.; Zheng, C.Y. Copper metallogenic condition of Cimabanshuo area around Zhunuo copper mine in Tibet. Gansu Geol. 2017, 26, 28–36. [Google Scholar]
  24. Sun, X.; Hollings, P.; Lu, Y.-J. Geology and origin of the Zhunuo porphyry copper deposit, Gangdese belt, southern Tibet. Miner. Depos. 2021, 56, 457–480. [Google Scholar] [CrossRef]
  25. Zhao, Y.Y.; Liu, X.F.; Liu, Y.C.; Ci, Q.; Xiao, L.B.; Li, L.; Zhang, X.Q. Zircon U-Pb Ages and Geochemical Characteristics of Youqiumi Porphyry Pluton in Cimabanshuo Area, Tibet. Earth Sci. 2018, 43, 4551–4565. [Google Scholar]
  26. Huang, H.X.; Liu, H.; Li, G.M.; Zhang, L.K.; Cao, H.; Zhou, Q.; Wang, X.X.; Yan, G.Q. Zircon U-Pb, Molybdenite Re-Os and Quartz Vein Rb-Sr Geochronology of the Luobuzhen Au-Ag and Hongshan Cu Deposits, Tibet, China: Implications for the Oligocene-Miocene Porphyry–Epithermal Metallogenic System. Minerals 2019, 9, 476. [Google Scholar] [CrossRef] [Green Version]
  27. Egbert, G.D.; Booker, J.R. Robust estimation of geomagnetic transfer functions. Geophys. J. R. Astron. Soc. 1986, 87, 173–194. [Google Scholar] [CrossRef] [Green Version]
  28. Egbert, G.D. Robust multiple-station magnetotelluric data processing. Geophys. J. Int. 1997, 130, 475–496. [Google Scholar]
  29. Chave, A.D.; Jones, A.G.; Mackie, R.; Rodi, W. The Magnetotelluric Method: Theory and Practice; Cambridge University Press: Cambridge, UK, 2012. [Google Scholar]
  30. Groom, R.W.; Bailey, R.C. Decomposition of magnetotelluric impedance tensors in the presence of local three-dimensional galvanic distortion. J. Geophys. Res. Solid Earth 1989, 94, 1913–1925. [Google Scholar] [CrossRef] [Green Version]
  31. Caldwell, T.G.; Bibby, H.M.; Brown, C. The magnetotelluric phase tensor. Geophys. J. Int. 2004, 158, 457–469. [Google Scholar] [CrossRef] [Green Version]
  32. Egbert, G.; Kelbert, A. Computational recipes for electromagnetic inverse problems. Geophys. J. Int. 2012, 189, 251–267. [Google Scholar] [CrossRef] [Green Version]
  33. Kelbert, A.; Meqbel, N.; Egbert, G.D.; Tandon, K. ModEM: A modular system for inversion of electromagnetic geophysical data. Comput. Geosci. 2014, 66, 40–53. [Google Scholar] [CrossRef]
  34. Kruschwitz, S.; Yaramanci, U. Detection and characterization of the disturbed rock zone in claystone with the complex resistivity method. J. Appl. Geophys. 2005, 57, 63–79. [Google Scholar] [CrossRef]
  35. Leng, C.-B.; Cooke, D.R.; Hou, Z.-Q.; Evans, N.J.; Zhang, X.-C.; Chen, W.T.; Danišík, M.; McInnes, B.I.A.; Yang, J.-H. Quantifying Exhumation at the Giant Pulang Porphyry Cu-Au Deposit Using U-Pb-He Dating. Econ. Geol. 2018, 113, 1077–1092. [Google Scholar]
  36. Zheng, Y.; Sun, X.; Gao, S.; Wang, C.; Zhao, Z.; Wu, S.; Li, J.; Wu, X. Analysis of stream sediment data for exploring the Zhunuo porphyry Cu deposit, southern Tibet. J. Geochem. Explor. 2014, 143, 19–30. [Google Scholar] [CrossRef]
  37. Wan, X.-Q.; Sun, X. Apatite fission track thermochronology of Cenozoic igneous rocks from porphyry copper deposits in the Gangdese belt of southern Tibet: Implications for cooling history and ore preservation. Ore Geol. Rev. 2021, 133, 104075. [Google Scholar] [CrossRef]
  38. Palacky, G.J. Geophysical methods in geology. Earth-Sci. Rev. 1988, 25, 87–89. [Google Scholar] [CrossRef]
Figure 1. (a) Typical porphyry system alteration pattern; (b) Expected sulfide mineralization; (c) Expected electrical resistivity responses for uneroded and eroded porphyry deposits. Py = pyrite, Cp = chalcopyrite. Modified from [12,15].
Minerals 11 01424 g001
Figure 2. (a) Simplified geologic map of the Gangdese metallogenic belt, showing the distribution of Late Triassic to Miocene magmatic rocks and ore deposits in the belt (modified from [7]); (b) Geological map of the Cimabanshuo porphyry copper deposit and the locations of AMT sites (modified from [23,25]). Abbreviations: CLS = central Lhasa subterrane, IYZSZ = Indus-Yarlung–Tsangpo suture zone, LMF = Luobadui–Milashan fault, NLS = northern Lhasa subterrane, SLS = southern Lhasa subterrane, WBF = Wenbu Fault, XDF = Xuru-Dangreyong Fault, YGF = Yadong-Gulu Fault.
Minerals 11 01424 g002
Figure 3. (a) The superposition of geological map and topographic map of the Cimabanshuo deposit with the highest elevation being higher than 5900 m, the lowest elevation reaching nearly 5100 m and an average value of ~5500 m. (b) Locations of AMT sites of this research. The geological map in Figure 3a is same as Figure 2b and modified from [23,25].
Minerals 11 01424 g003
Figure 4. Typical apparent resistivity and phase curves of the research area (scatter), response curves of the 3D inversion model (solid line), and response curves of the 3D inversion model without topography (dashed line). Site1 and Site9 are located in the northern and southern margins of the research area, respectively. Site2−Site4 are located in copper-single-anomaly area. Site5–Site8 are located near the proven copper mineralization zone (Figure 3b). Some data plots for the diagonal components are also shown.
Minerals 11 01424 g004
Figure 5. Geoelectric strike direction and dimensionality analysis of the AMT sites by period. The AMT sites are analyzed by two individual groups according to the location of the copper deposits. The red–blue sectors shown on the rose diagrams illustrate the inherent 90° ambiguity of the results of Groom-Baily decomposition [30]. The phase tensors [31] are represented by colored ellipses filled according to skew (β angle) values.
Minerals 11 01424 g005
Figure 6. (a) Horizontal distribution of model misfits (nRMSE) of the 3D inversion with topography model for each AMT site. (b) Frequency histogram of site-by-site nRMSE.
Minerals 11 01424 g006
Figure 7. Horizontal slices of 3D inversion model at depths of 80, 120, 170, 220, 270, 320, 530 m (ag), respectively. The pure white regions represent air at corresponding depths. The superposed geological features are the same as Figure 3b. Warm and cold colors indicate low and high resistivity, respectively. CZ1 and CZ2 indicate major conductive zones.
Minerals 11 01424 g007
Figure 8. The NW–SE trending vertical slice of the 3D inversion model along the transects shown in Figure 7g. CZ1 and CZ2 are conductive zones. R1 is high-resistivity zone. C1 is a significant conductor.
Minerals 11 01424 g008
Figure 9. Sensitivity tests for foliate alteration and C1 (Figure 8). The existence of a high conductor is plausible by comparing response of the model before and after the tests.
Minerals 11 01424 g009
Figure 10. Perspective display of the 3D resistivity model with topography and schematic geological interpretation. R1 is high-resistivity potassic zone.
Minerals 11 01424 g010
Publisher’s Note: MDPI stays neutral with regard to jurisdictional claims in published maps and institutional affiliations.

