Article

Real-Time Electrical Conductivity Monitoring and Correlation with Sulfate Release and Acid Mine Drainage Potential from a Gold/Silver Paste Tailing Storage

1
Departamento de Química Inorgánica, Facultad de Química y de Farmacia, Pontificia Universidad Católica de Chile, Macul, Santiago 7820436, Chile
2
Departamento de Ingeniería Hidráulica y Ambiental, Pontificia Universidad Católica de Chile, Macul, Santiago 7820436, Chile
3
Departmento de Ingeniería Eléctrica, Pontificia Universidad Católica de Chile, Macul, Santiago 7820436, Chile
*
Author to whom correspondence should be addressed.
Submission received: 14 November 2021 / Revised: 6 December 2021 / Accepted: 16 December 2021 / Published: 18 December 2021
(This article belongs to the Section Environmental Mineralogy and Biogeochemistry)

Abstract

:
Safe disposal of tailings as high-density thickened tailings or paste tailings can reduce the environmental risks of conventional tailings deposits, reduce water use, minimize tailings storage facility footprints, reduce the potential for acid mine drainage (AMD), and minimize risks of failure, among other advantages. In the dewatering process, the addition of flocculants is key to improving the sedimentation of the tailings and the formation of a compact paste. Despite the environmental and operational advantages of using paste tailings, it is not clear how the chemical nature of coagulants and flocculants could influence the discharge of toxic elements (salts and metals) from tailings after storage. In this study, we show the results of the real-time evaluation of the release of polluting runoffs from a paste tailings deposit. To do this, we analyzed paste tailing samples for AMD potential through static and kinetic tests and monitored the electrical conductivity and real-time pH, evaluating the correlation with the sulfate in the thickener and downstream from the tailings deposit. Tailing samples have low sulfur content (<2%) and low acid-generating potential. Moreover, there is no evidence of a significant positive correlation (Pearson’s coefficient r < 0.8) between the sulfate concentrations with the pH or EC. Thus, the chemical nature of the paste tailings prior to discharge has no direct impact on the release of sulfate-rich runoffs from the tailings after its storage. This indicates that the tailings paste at the evaluated site is chemically stable in the short term.

1. Introduction

In northern and central Chile, several mining operations are widely extended [1]. These activities generate large amounts of tailings that must be disposed of properly, in order to limit the effects on surrounding environments [1,2]. Mineral waste is typically deposited in waste repositories referred to as tailing storage or tailings dams. Tailings are characterized by low pH, high salinity, and varying amounts of metals and metalloids [3]. One of the main problems derived from tailings deposits is the generation of acid mine drainage (AMD). AMD is produced by the oxidation of sulfur minerals and is characterized by the generation of runoff with low pH and high concentrations of heavy metals and metalloids [4,5,6]. Various studies have focused efforts on establishing tailings stabilization processes with several techniques [7,8,9]. Likewise, different technological alternatives have been addressed to treat AMD, including active and passive methods [10,11,12,13,14]. Due to the nature and magnitude of the environmental impacts derived from the release of AMD, the mining industry has concentrated its efforts on containing the tailings, in order to avoid the release of AMD. For this reason, for different mining operations, the stability of tailings at storage sites is critical, since chemically reactive mineral components can release toxic pollutants into the environment.
In recent years, several studies have been conducted to find eco-friendly, cost-effective alternative methods to dispose of tailings [15,16]. Thus, the need for safe environmental disposal has led to the adoption of new processes for tailings storage that limit the release of pollutants, reduce seepage, and reduce water use. In particular, the current scarcity of water has prompted the application of the dry and semi-dry tailings generation process before disposal [17,18]. This type of high viscosity tailing referred to as paste tailing is based on a non-Newtonian fluid that promotes the self-consolidation process and favors the transfer of the tailings to the storage site [19,20]. Paste tailing is made up of a mixture of water and solids that forms a compact and self-contained mass, but with sufficient viscosity to be transported through pipes [21,22]. The use of paste for the disposal of tailings can reduce environmental risks of conventional tailings deposits, reduce water use, and limit the generation of AMD.
Reducing the amount of water in the tailings is an important step in the paste formation process. Flucculant addition is key to the dewatering efficiency [23]. Thus, in the market, there is a variety of different flocculants. The efficiency of the flocculant is influenced by several factors and conditions, such as pH, solids concentration, feed particle size distribution, water chemistry, and flocculant type [24,25,26]. Polymeric flocculants induce flucculation by neutralization processes on the surface of the particles, forming bridges between them and allowing the formation of more easily sedimentable aggregates. Moreover, various reagents can be added to the neutralization process in order to improve settling. The chemical nature of the flocculants that are added will depend on the chemistry of the treated water and the mineral matrix. Coagulants such as inorganic salts of iron (e.g., ferric sulfate) and aluminum (e.g., alum) or polymeric flocculants (e.g., polyacrylamides, polyelectrolyte) can be used [27]. For example, in mining, polymeric flocculants based on polyacrylamides (PAMs) are widely used due to their wide range of molecular weight and the potential functional groups that can be attached to them [28]. This improves the sedimentation and compaction efficiency of the tailings [26,29,30].
Paste tailings have the advantage of lower moisture content (10%–30% w/w), higher homogeneity, and no segregation of the particles [31]. For paste tailings, a key rheological property is yield stress, which is defined as the minimum shear stress that must be applied to the material to initiate [32,33]. Cooke [34] estimated that a yield stress > 100 Pa is suitable for paste tailings; however, to achieve mixtures with yield stresses greater than 100 Pa, it is necessary to add a certain dosage of flocculants. The addition of flocculants can produce significant changes in the chemistry of the paste, improving the efficiency of the dewatering process and the formation of the paste. However, in the formed paste, certain elements can remain as soluble toxic elements, which could be released after disposal in tailings storage facilities (TSF). Indeed, there are some studies that suggest that the stabilization of the flocculants used can change over time, which can cause changes in the chemical stability of the tailings. However, the existing literature is scarce.
The release of pollution from the paste tailings will be critical in the long-term storage operation. This paper presents an initial approach to a real-time assessment and monitoring of the water quality of runoffs released from a gold/silver paste tailings deposit. Therefore, the aim of this study is to investigate whether the chemical characteristics of the paste tailings, during its preparation, influence the release of sulfate-rich runoff after storage. Real-time pH and electrical conductivity (EC) were monitored before and after the disposal of paste tailings and correlations were established with the sulfate concentrations released downstream of the tailings deposit. This information will help to properly determine environmentally-friendly optimization processes for paste tailings formation.

2. Materials and Methods

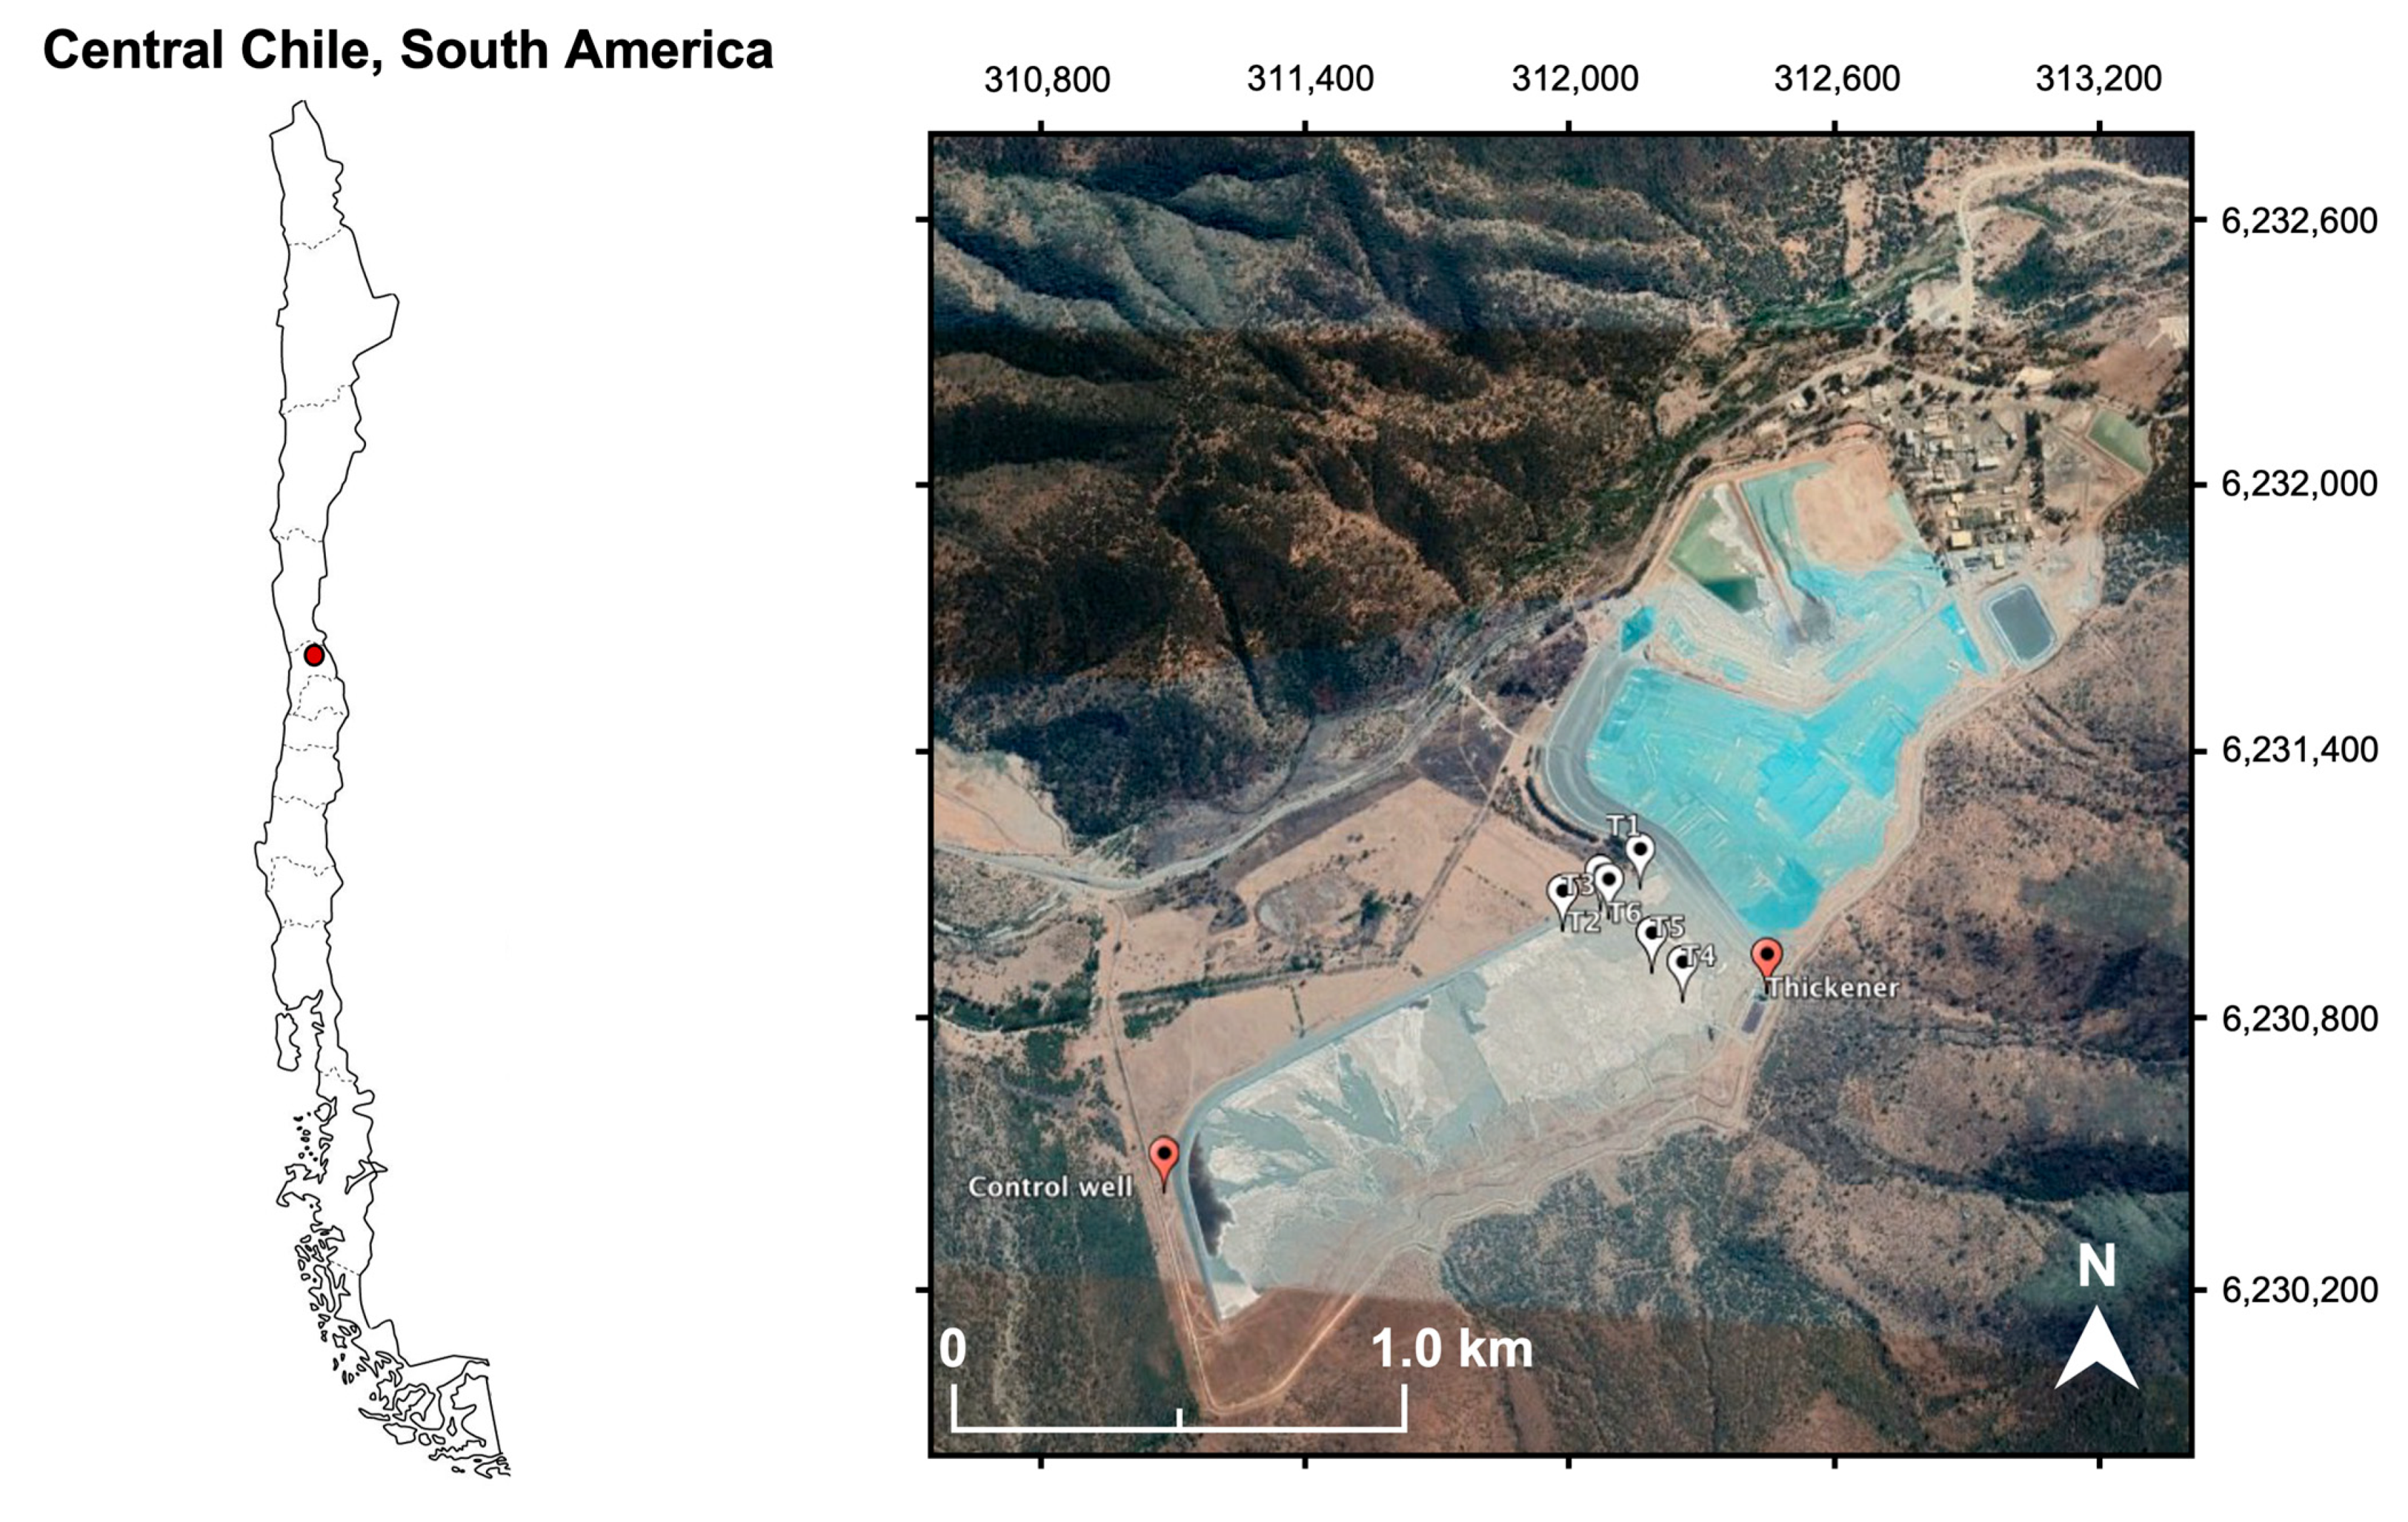
2.1. Site Description

The paste deposit located at the Florida mine (Yamana Gold Inc.) was selected to evaluate the acid mine drainage generation potential and to evaluate the correlation between paste tailing quality and sulfate release (Figure 1). The Florida mine is located in the south-southwest of Santiago in the locality of Alhue, in central Chile (34°02′01′′ S, 71°01′36′′ W). This is an underground mine that produces gold, silver, and zinc, where the extraction procedure includes three stages of crushing, a grinding stage, and flotation followed by leaching of the flotation concentrates. Specifically, the mine is located in mountain ranges of moderate topography with narrow valleys and high hills. Volcanic and intrusive rocks of the upper cretaceous make up the Florida Mine area. The predominant volcanic rocks are porphyritic andesite, brecciated andesite, lithic and crystal tuff, and brecciated tuff. In addition, a sequence of hydrothermal alteration affects the bulk of these rocks. On the other hand, granodiorites and monzodiorites comprise the main intrusive rocks (Florida mine information).
The main deposits of the Florida mine are based on tockwork and vein gold deposits. Native gold and electrum associated with sulfide minerals, such as pyrite (FeS2), chalcopyrite (CuFeS2), sphalerite ((Zn, Fe)S), galena (PbS), hematite (Fe2O3) and magnetite (Fe3O4) are the main mineralizations associated with gold deposits (Florida mine information). Moreover, some metallic veins are located in certain zones, with a zinc-rich silver-rich zone in the upper part of the vein, a gold-rich zone in the central part, and a zinc-rich zone in the lower part of the vein. In total, at least nineteen mineralized veins have been discovered in the Florida mine area, with reserves of approximately 2.7 Mt at 4.8 g/t Au, 37 g/t Ag and 1.16% Zn (Florida mine information).

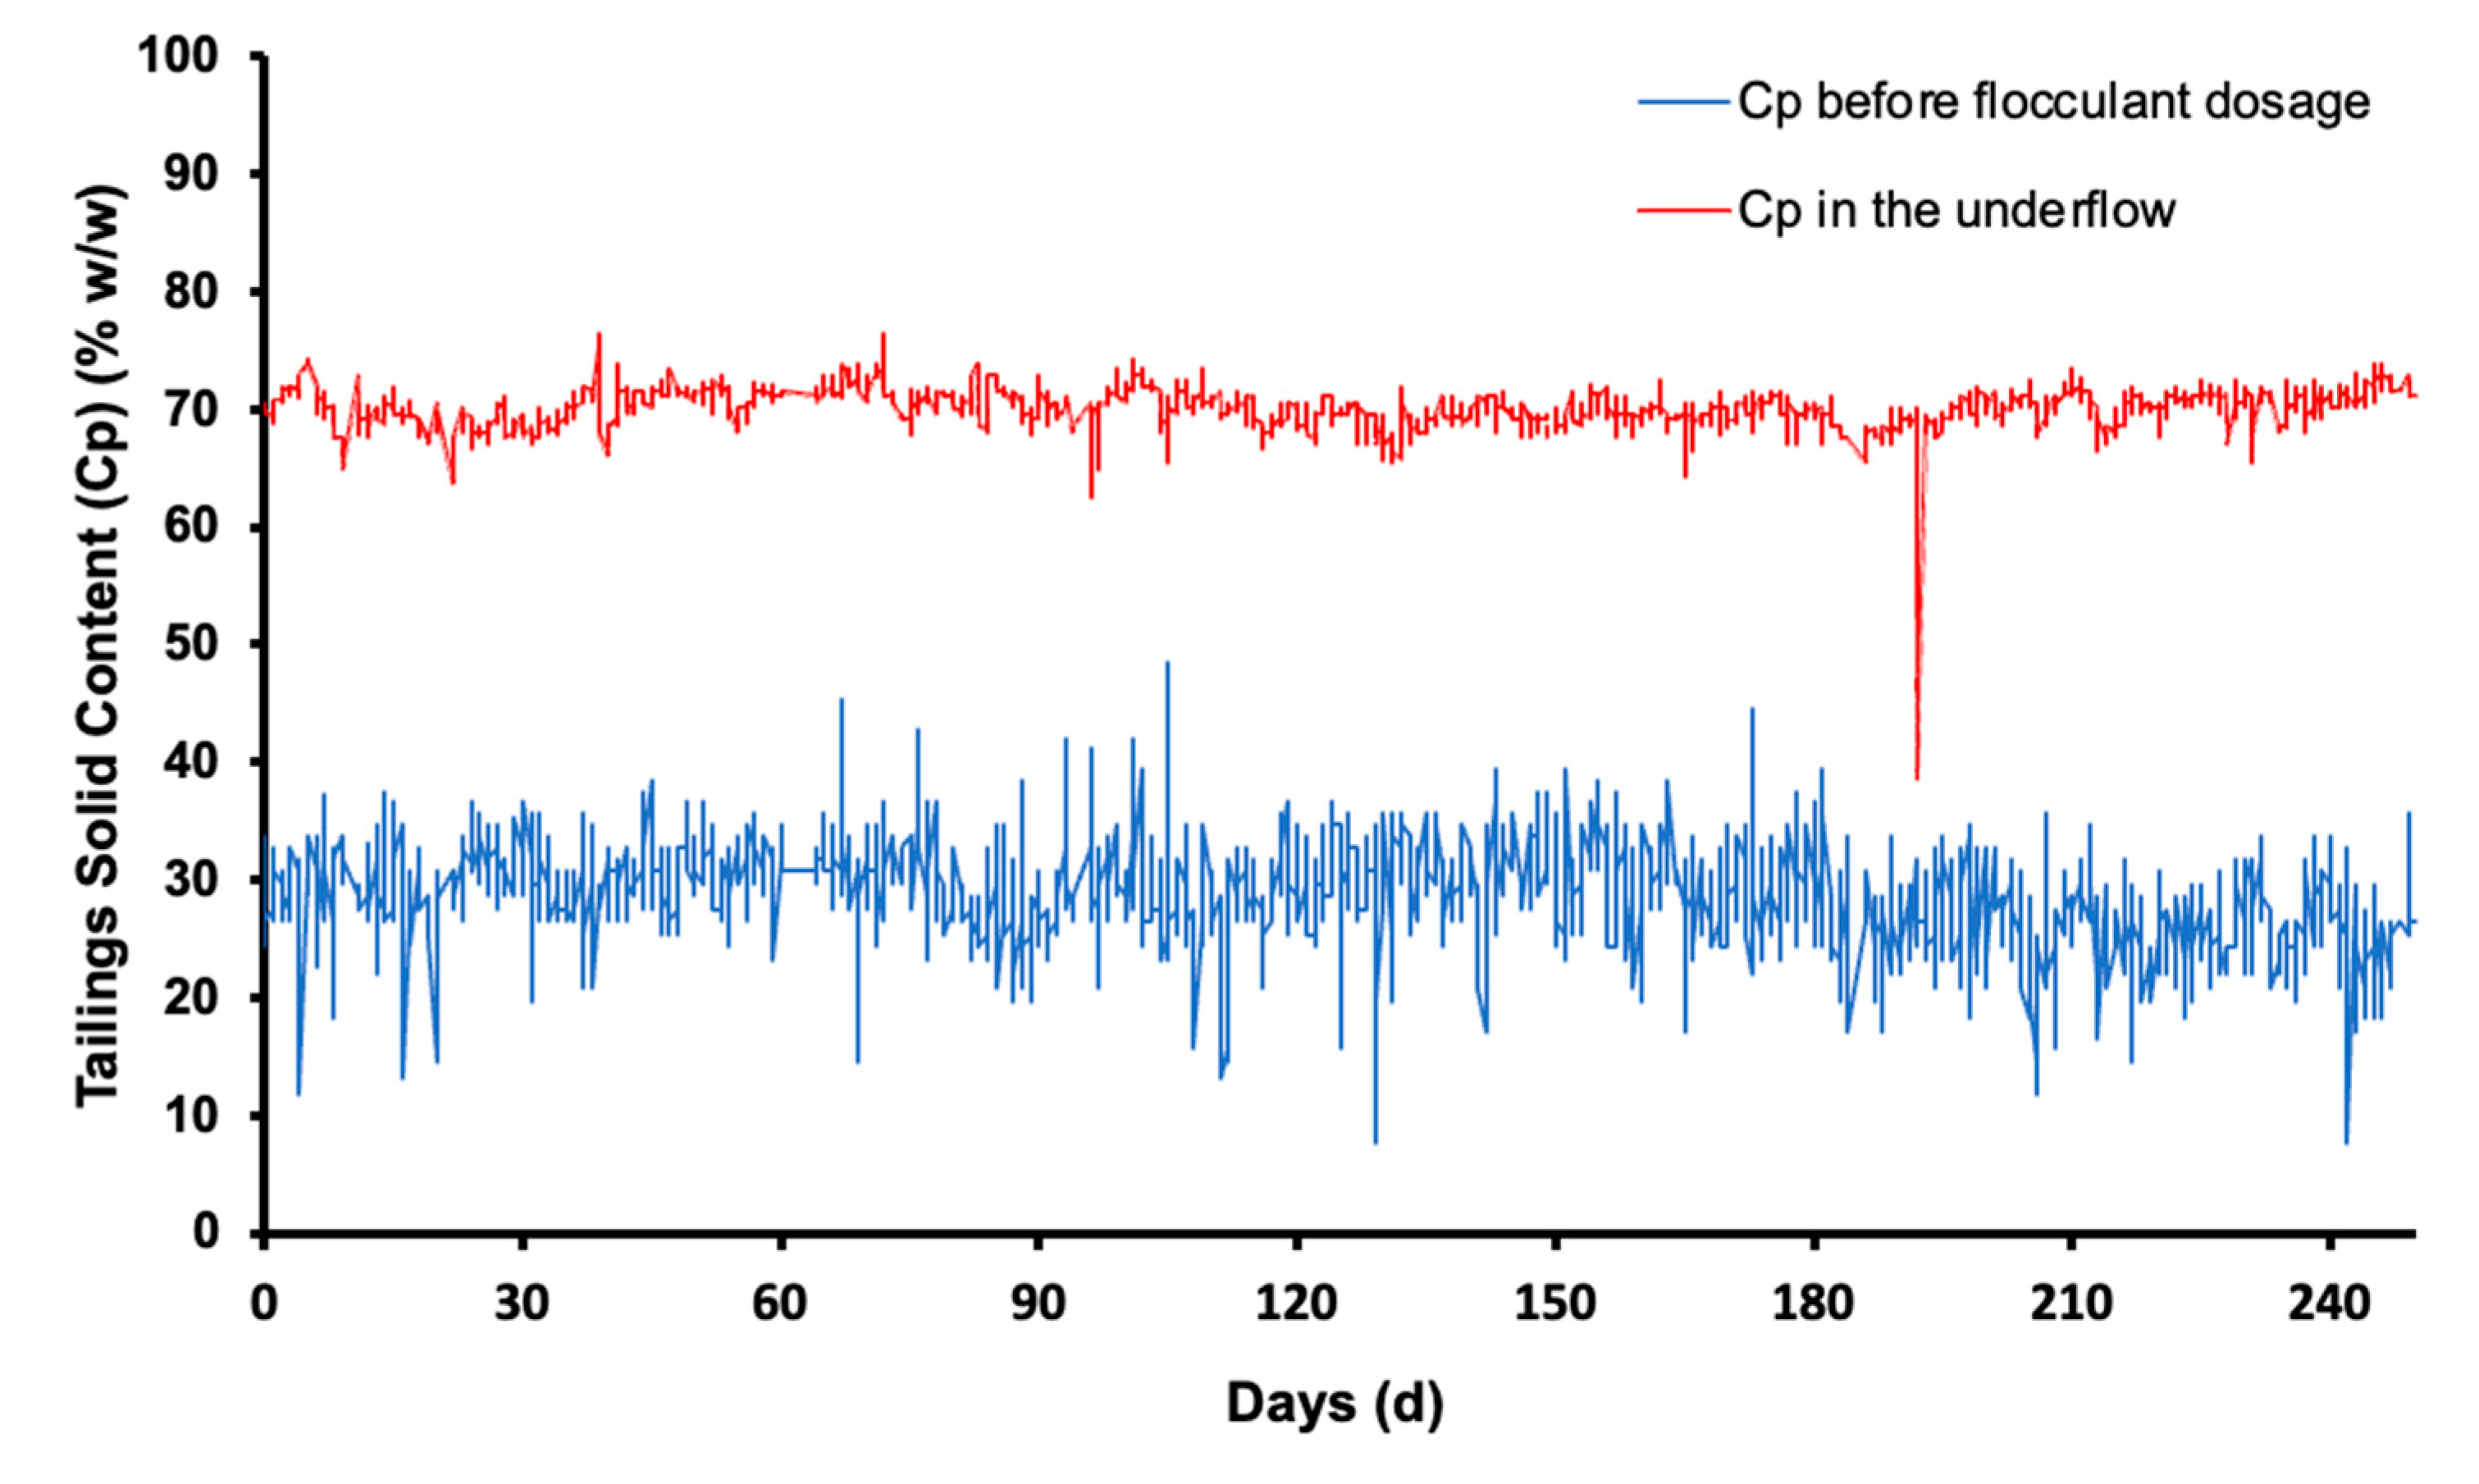
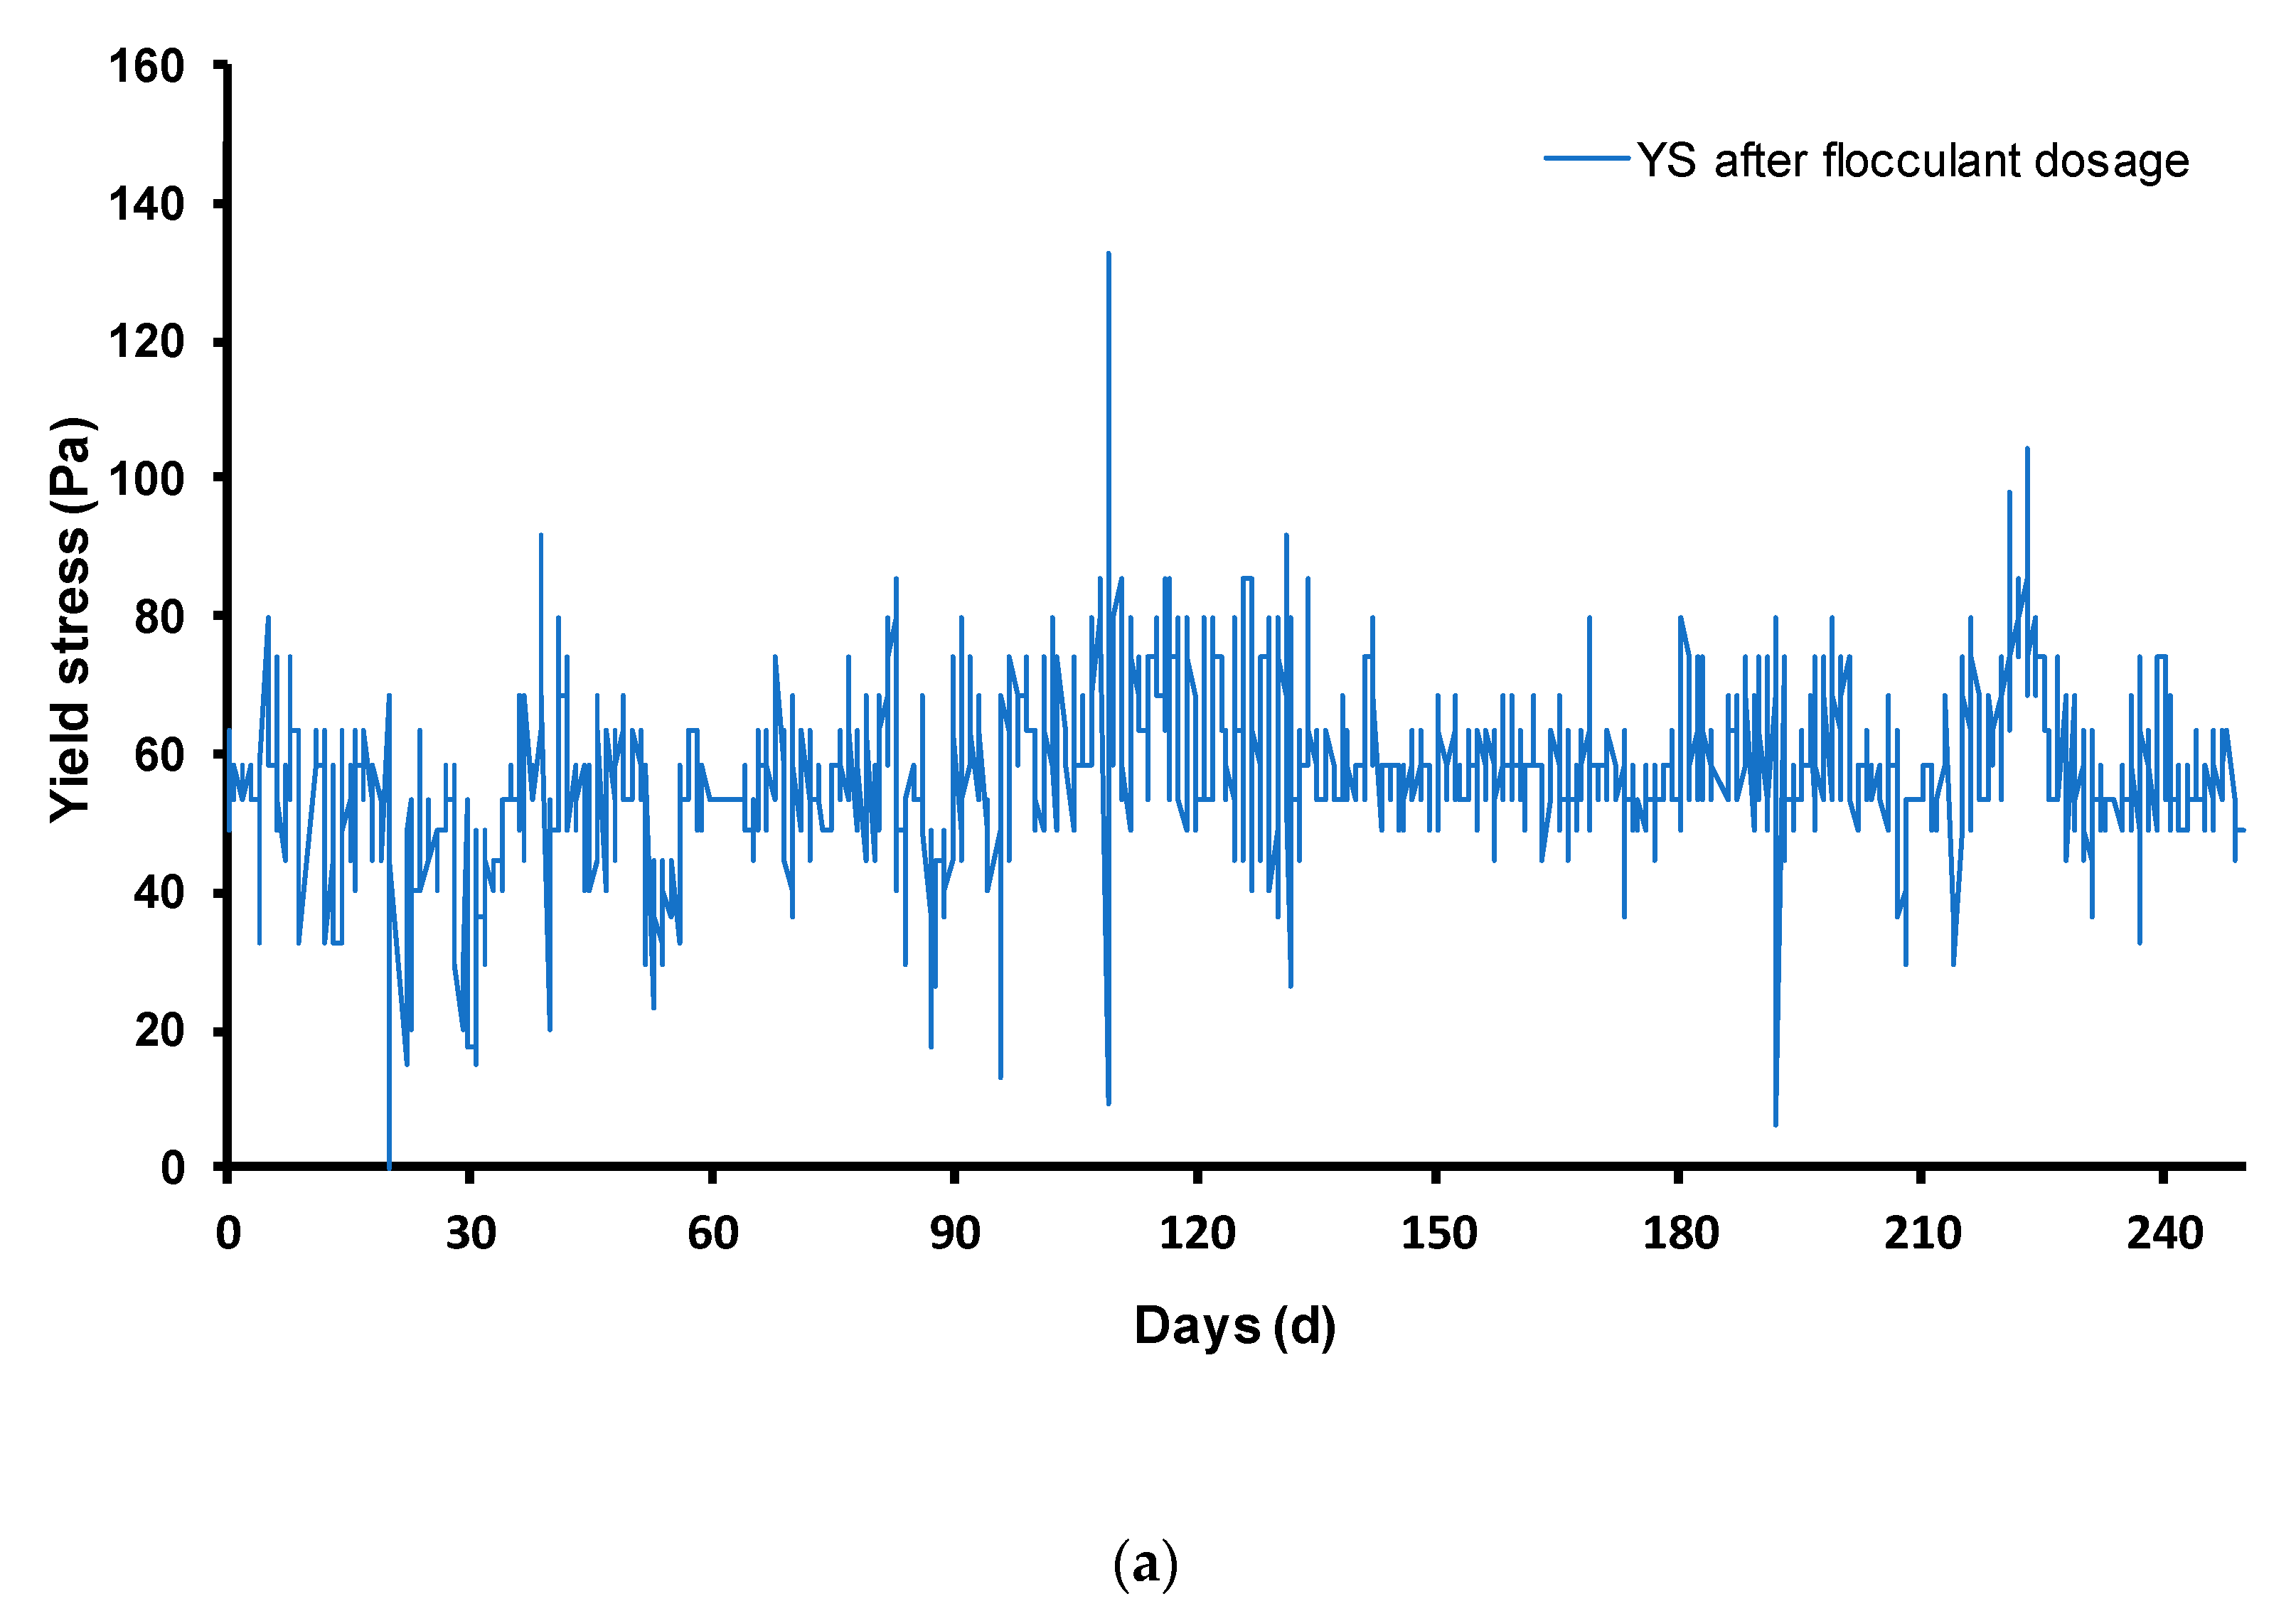
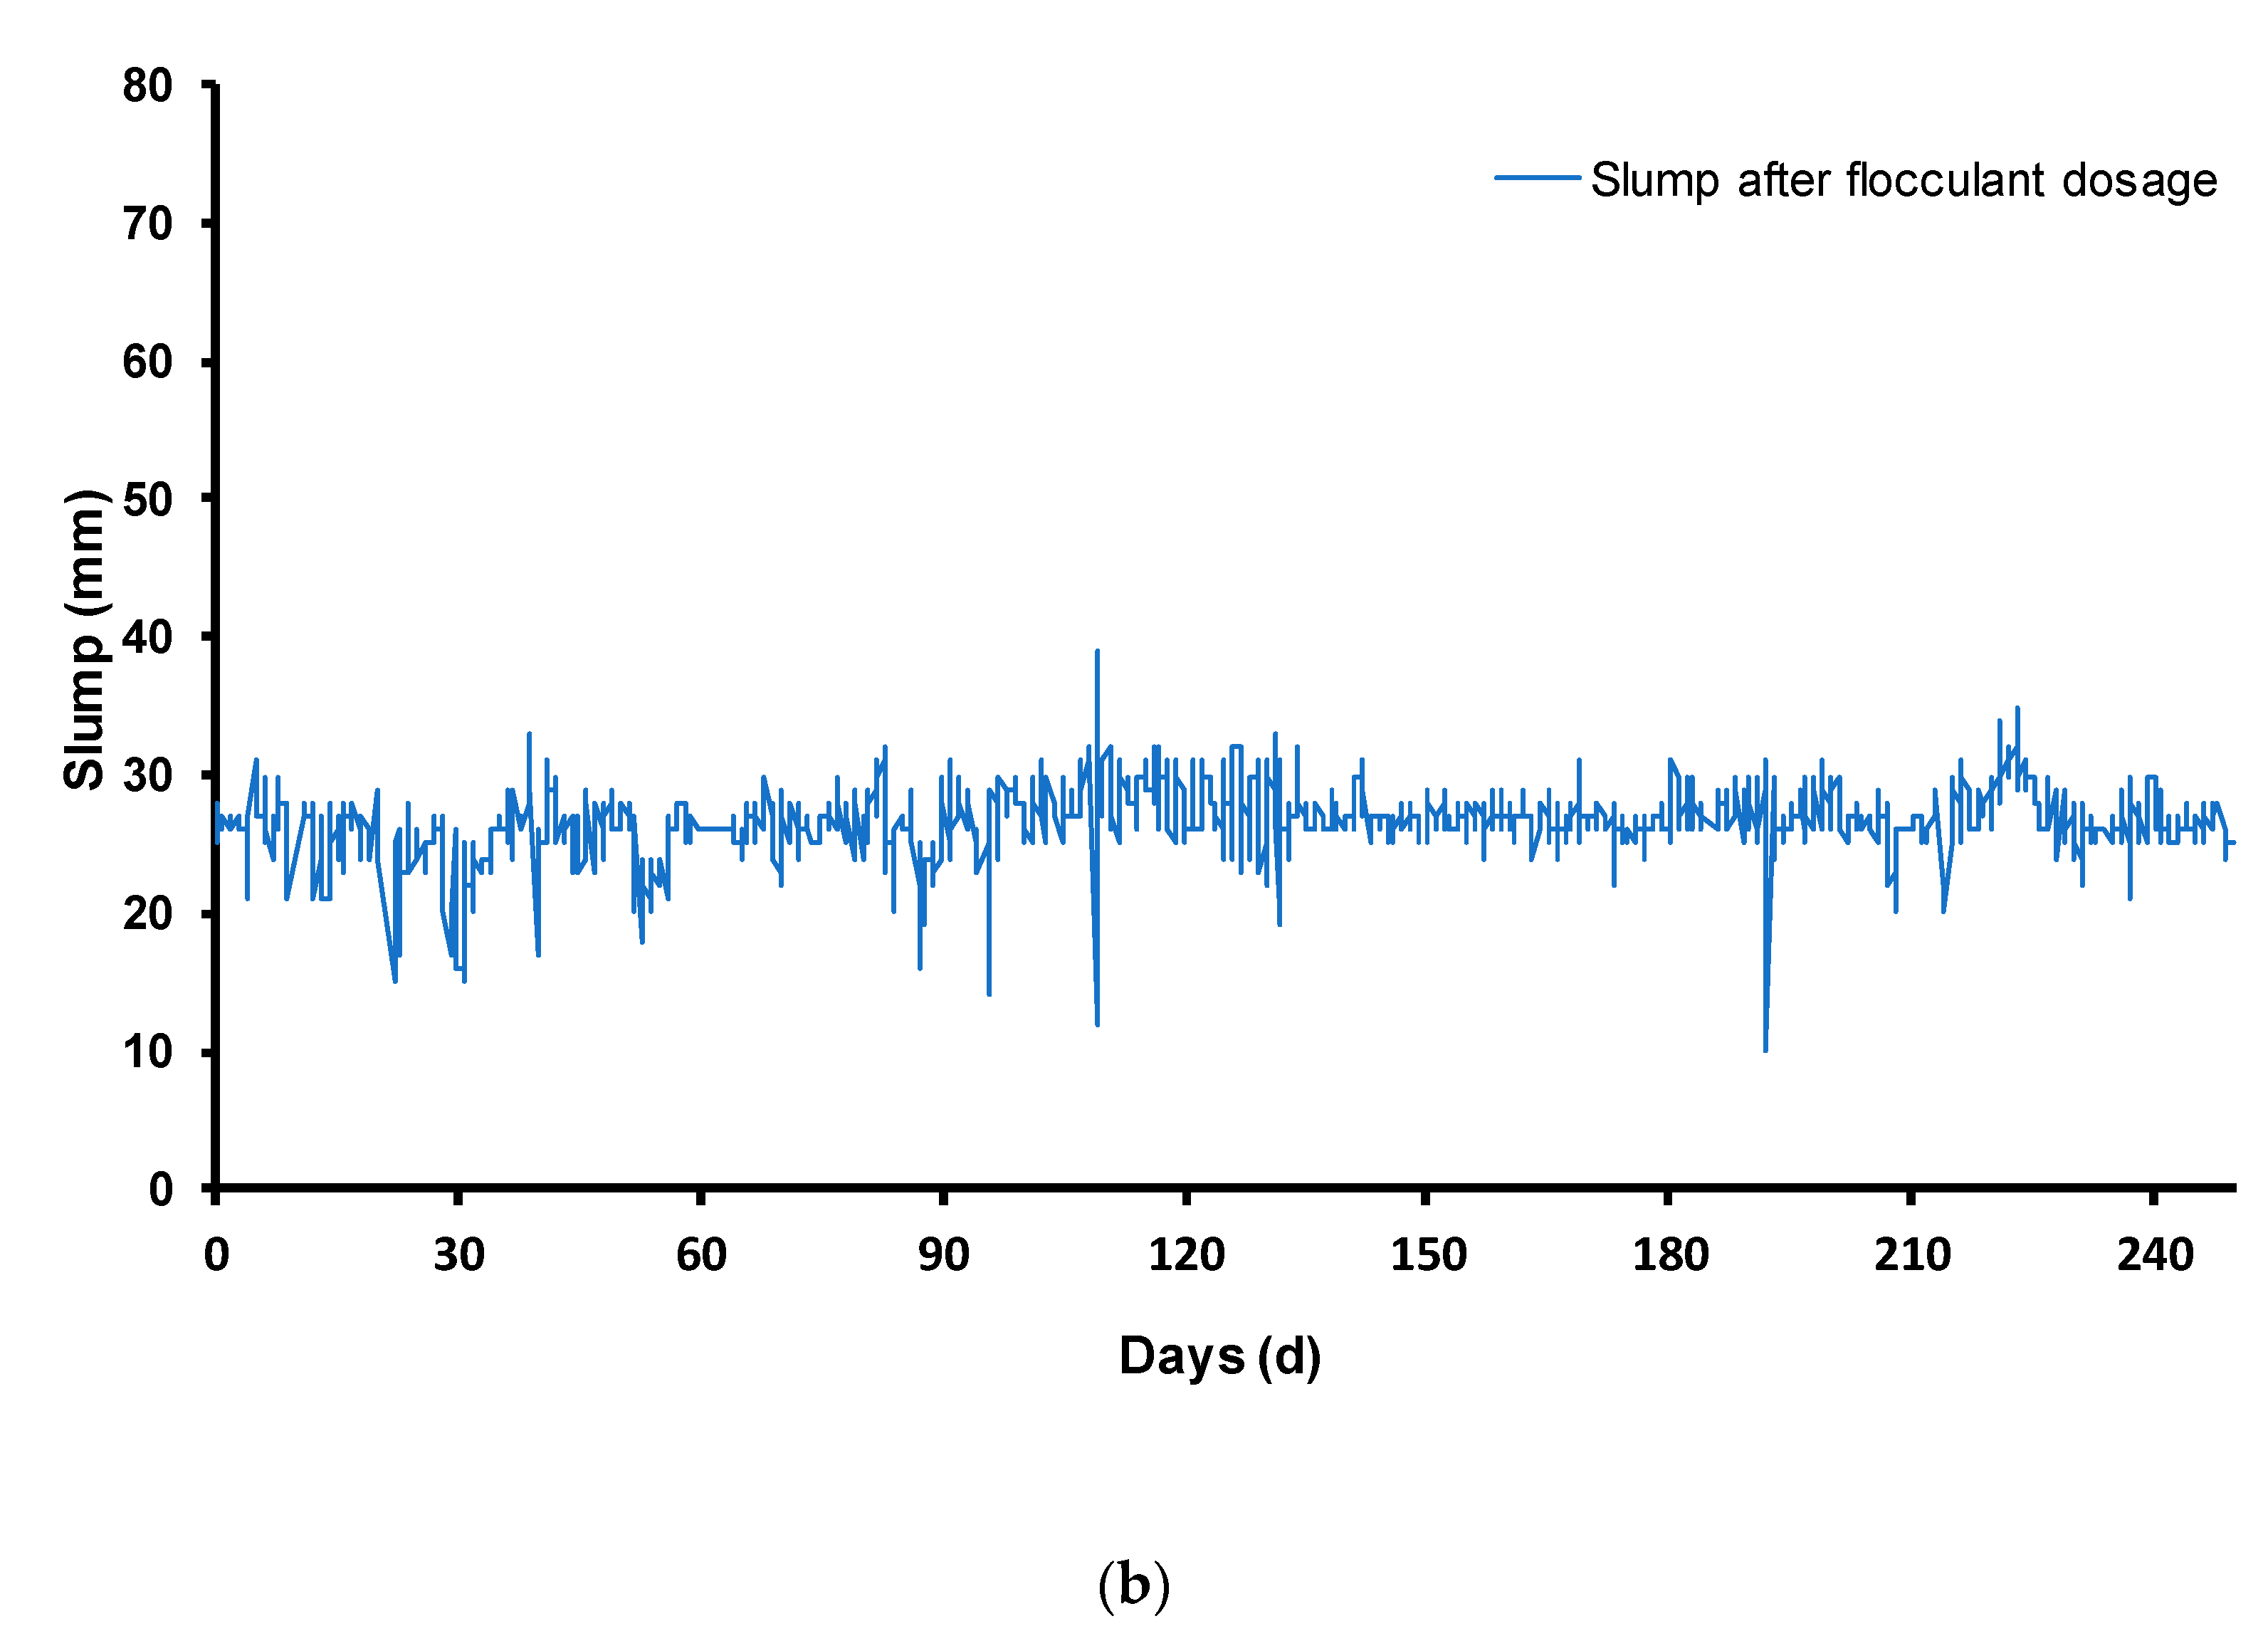
2.2. Paste Characterization

The quality of the Florida mine tailings paste was characterized through tailing solids content (Cp), Yield stress measurements, and slump values. Solid measurements were made at the inlet of the thickener and at the outlet of it, after thickening. Measurements were made with a hydrometer (6055, BOECO, Hamburg, Gerrmany) and a Marcy balance. Slump tests were carried out following the procedure described by Clayton et al. [35]. Yield stress measurements were obtained by plant operators from slump tests.

2.3. Tailings Analysis

Florida mine operates with thickened (paste) tailings from the processing facility that are deposited in Tailings Storage Facilities (TSF). To evaluate the Acid Generation Potential (AGP), tailing samples were selected. Tailings samples were collected between December 2017 and January 2018. For the analysis, different surface tailings samples (30 cm deep) at different points of the TSF were sampled according to their greater contact with water and their greater oxygenation, which affects its potential for AMD generation. The sampling was carried out in a zone of 1 m2 for each point, specifically in a straight line with three equidistant sampling points (T1, T2 and T3), crossed by a perpendicular line with three other sampling points (T4, T5, T6) (Figure 1) [36]. For the selection of sampling points, a visual analysis of the surface of the tailings was carried out, determining different zones on the surface of the deposit.
One kg of tailing samples was collected from the first 30 cm of tailing deposits. The samples were collected in 1 L High Density Polyethylene (HDPE) bottles and then stored and kept in the dark at 4 °C until they were processed and analyzed in the laboratory. At the sampling points, on-site water analyses were performed to determine the local chemical characteristics of the samples. For this, the temperature (PHC301, HACH), EC (CDC401, HACH) and pH (PHC301, HACH) were measured (Hq40d Multi, HACH, Loveland, CO, USA).
The bulk chemical composition of paste tailing samples was analyzed by Inductively Coupled Plasma Optical Emission Spectrometry (ICP–OES) (PerkinElmer Optima 7300 DV ICP–OES, Shelton, CT, USA) and spectrometry (Spectrophotometer DR/2010, Hach, Loveland, CO, USA). The analyses were carried out on previously digested tailings samples according to the EPA 3050B digestion method [37]. The procedure was performed as described in Leiva et al. [36].
Mineralogical analysis of the tailings was performed by XRD. XRD analyses were carried out using the Bruker D8 Advance powder diffractometer (40 kV, 30 mA Cu Kα radiation, λ = 1.5404 Å). In the same way, microanalyses of the surface of the tailings samples and morphological analyses were performed in a scanning electron microscope (JSM-IT300LV; JEOL Ltd., Tokyo, Japan) equipped with an Oxford EDX AZtec detector (Oxford Instruments, High Wycombe, UK). EDS analysis was performed at different analysis points of each sample to achieve representativeness in the analysis.

2.4. Acid Potential Tests

To evaluate the acid generation potential, Net Acid Generation (NAG) Tests, Acid Base Accounting (ABA) tests, paste pH, and kinetic tests were used.

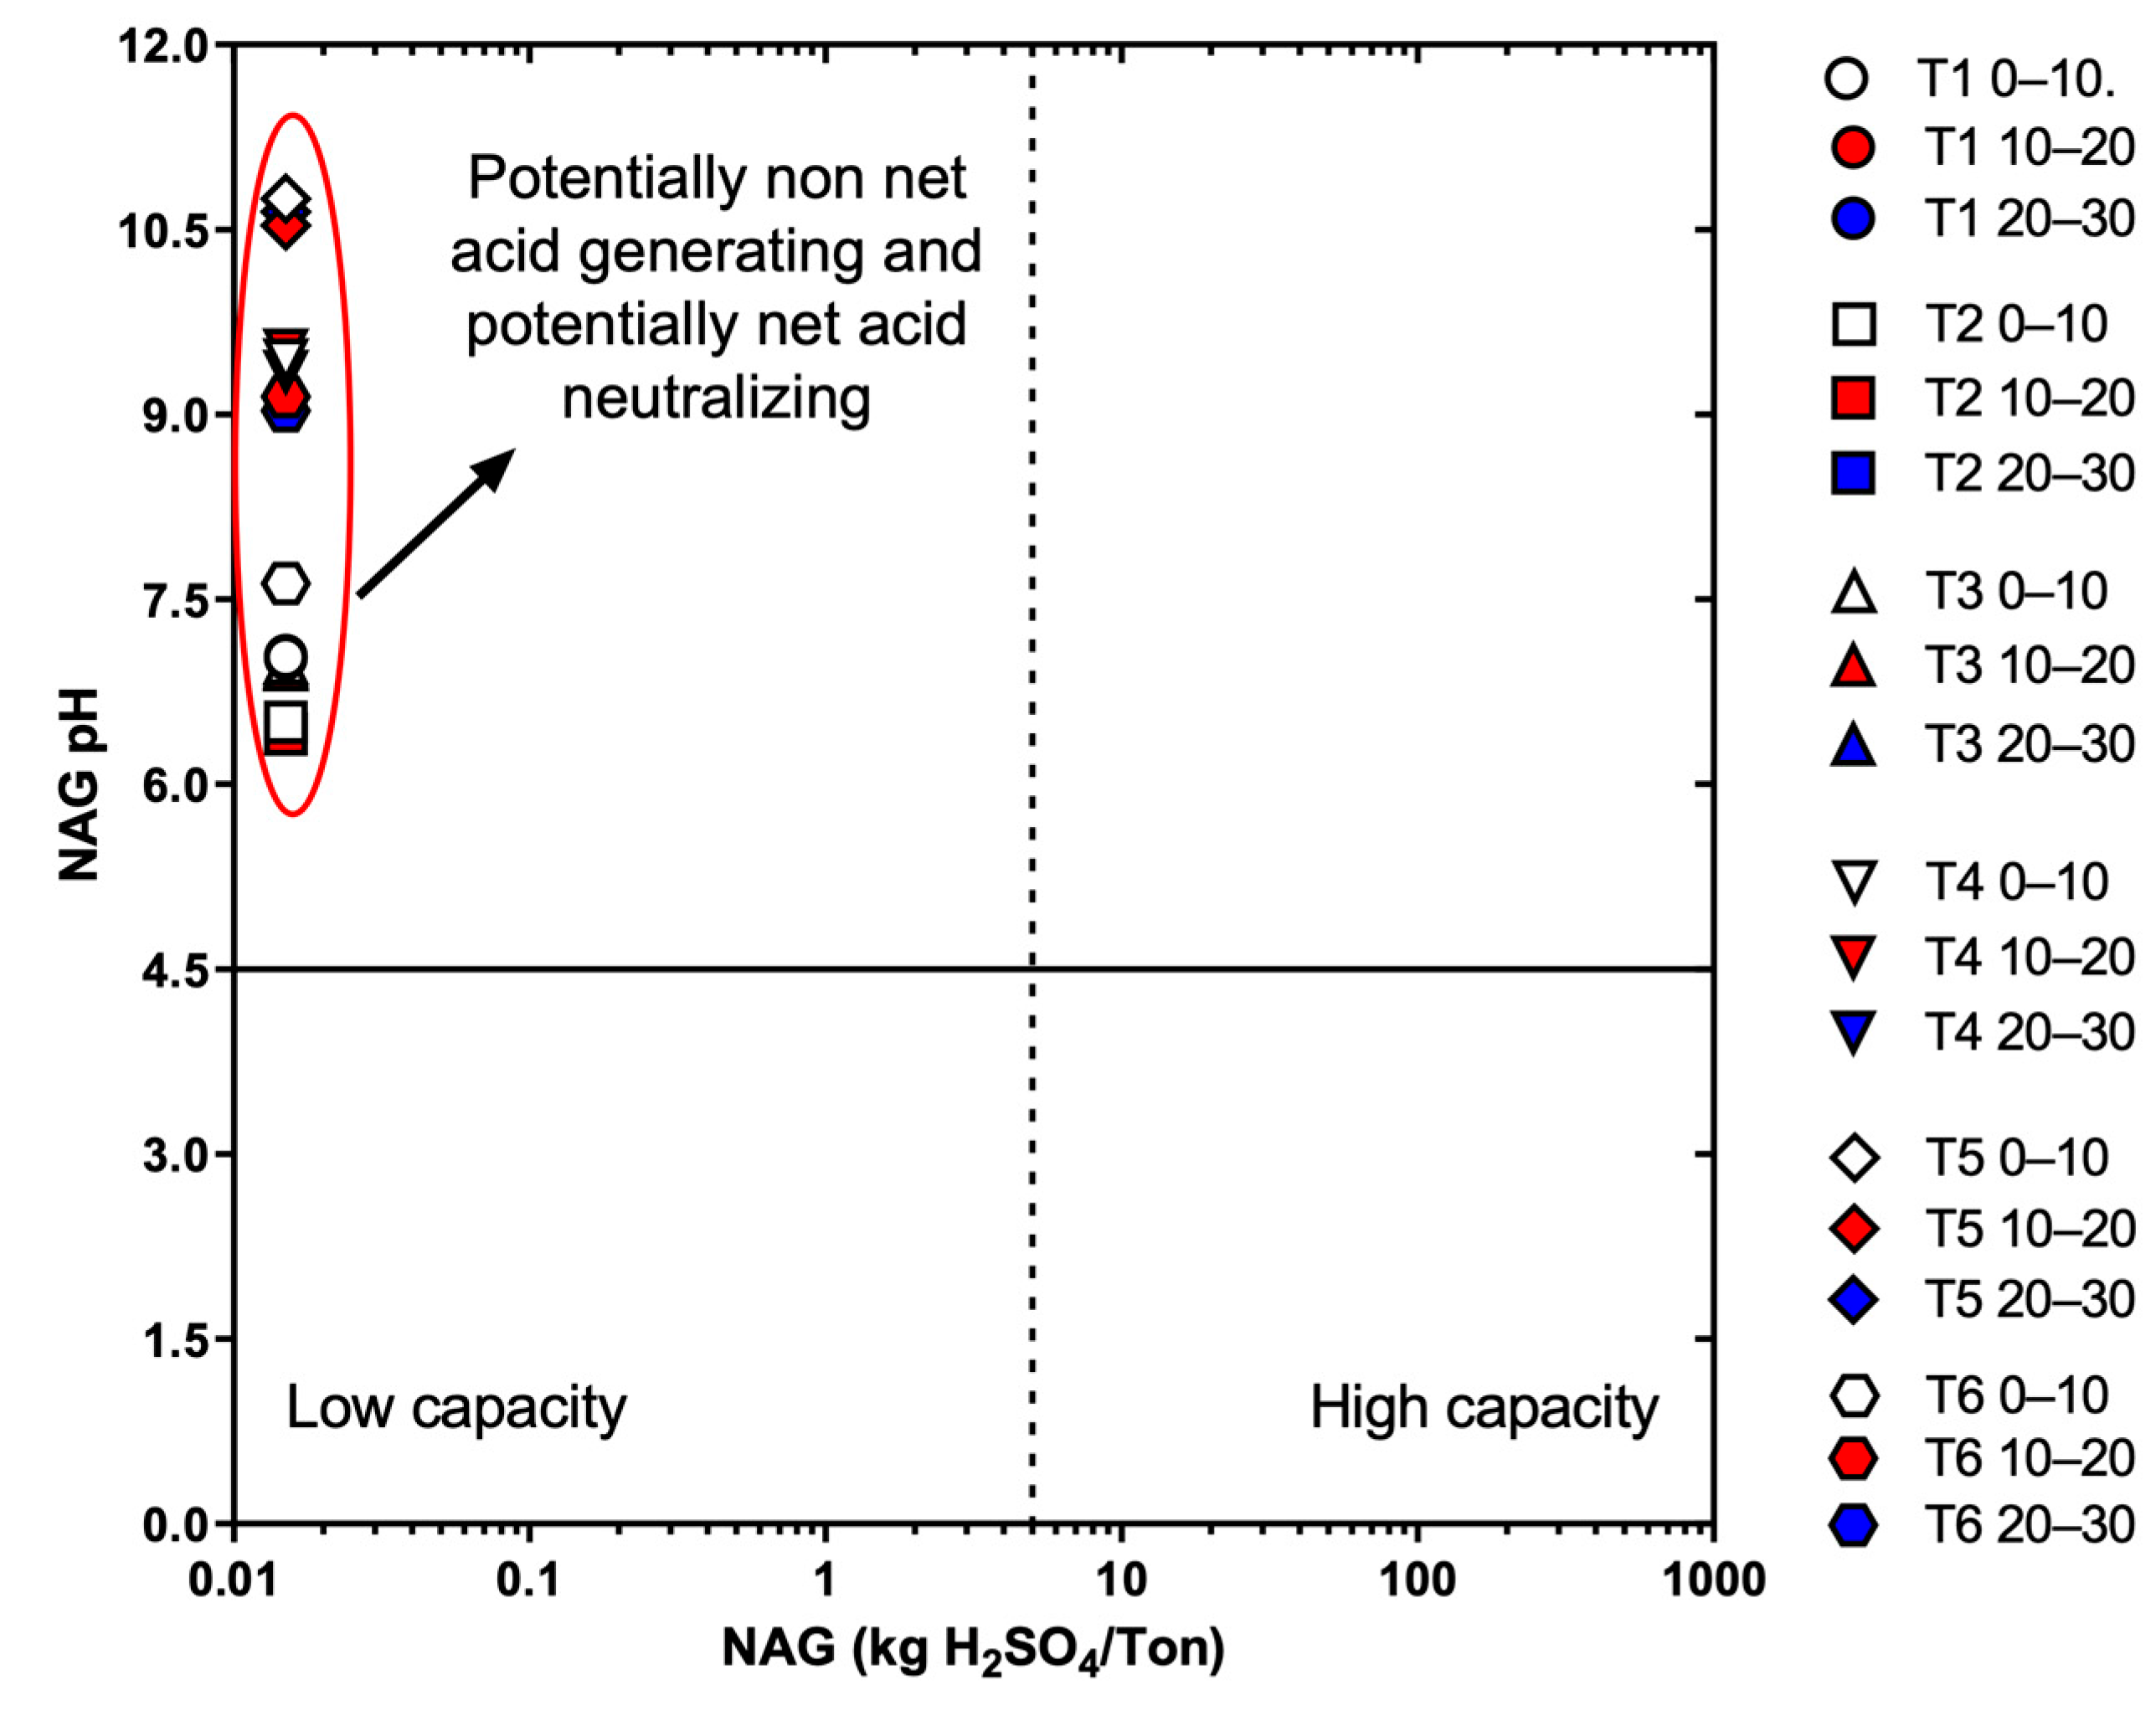
2.4.1. Net Acid Generation (NAG) Tests

Once the collection phase was concluded, each tailing sample was subject to a single additional NAG test to evaluate the AMD potential of the site. This was done to relate the potential of AMD generation with the potential of the tailing deposit to release polluting runoffs from the mineral matrix present in the tailings. Prior to the analysis of the samples, they were decanted and mixed to ensure homogeneity. After this, NAG tests were carried out. NAG tests use hydrogen peroxide (H2O2, a strong oxidizing agent) to rapidly oxidize sulfide minerals. In the process, hydrogen peroxide greatly accelerates the oxidation of the sulfide, assuming that the neutralization potential remains proportional. The objective of this test was to evaluate if a sample can generate acid drainage or if the sample can neutralize the acid produced by forced oxidation.
The NAG capacity was determined by adding 250 mL of 15% H2O2 to 2.5 g of dry paste tailings samples in a 500 mL Erlenmeyer flask. The flask was covered with a watch glass and placed in a fume hood. The reaction proceeded until boiling, cessation of effervescence, or for a minimum of two hours. Then, the sample was cooled to room temperature and the pH of the mixture was recorded (NAG pH). Finally, each solution was made up to a final volume of 250 mL with deionized water. Samples with a NAG pH greater than 4.5 have no NAG potential, while samples that have a NAG pH less than 4.5 have NAG potential. Samples with a pH lower than 4.5 must be titrated with 0.1 M NaOH up to an end point of pH 4.5. The NAG capacity is expressed as kg of H2SO4 per ton of sample (ton H2SO4 1000−1·ton−1). The criteria for the prediction and characterization of the NAG capacity are based on Miller [38]. The pH was measured in the solutions with an Intellical pH Electrode PHC301 (PHC301, HACH) (Hq40d Multi, HACH, Loveland, CO, USA).

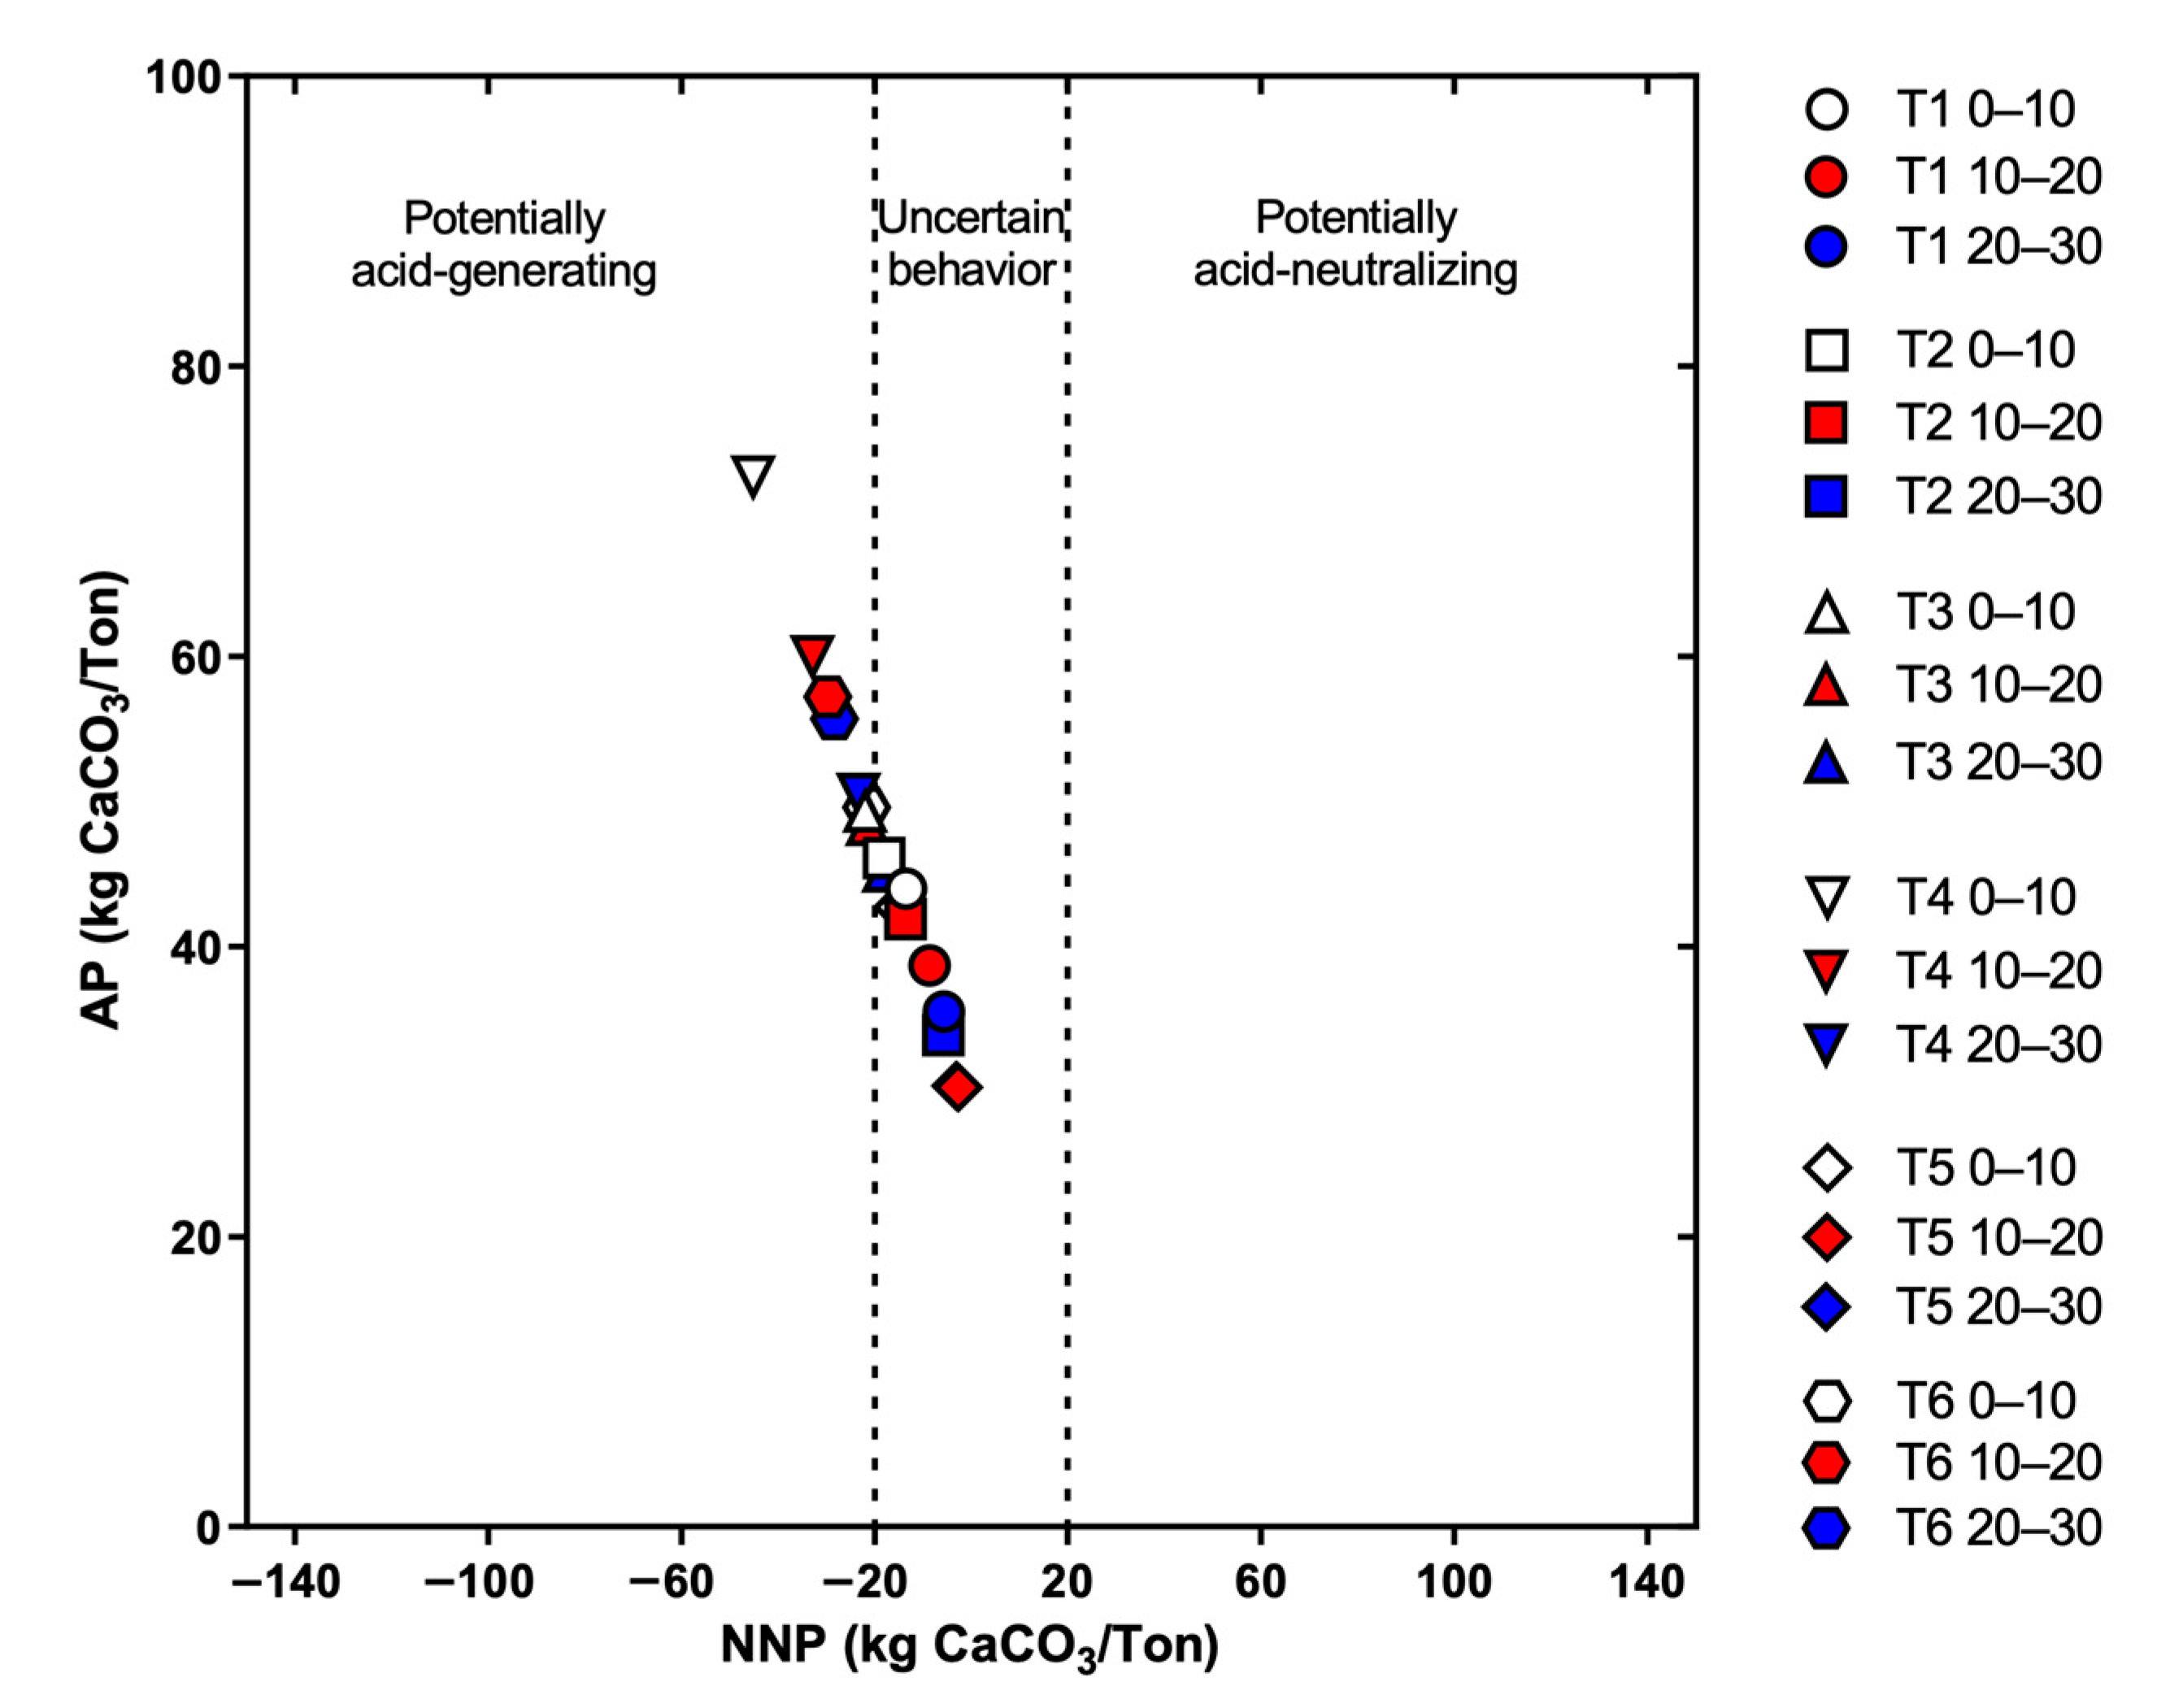
2.4.2. Acid Base Accounting (ABA)

The acid potential (AP) was determined using, as a reference, the original Sobek et al. [39] static test and following the procedure described by Elghali et al. [40] and Bouzahzah et al. [41] This is calculated with the total sulfur content of the samples and is expressed in kg CaCO3/ton. The procedure considers that the total sulfur content of a sample occurs as pyrite and is completely oxidized to generate acidity. The AP was calculated using Equation (1).
AP = 31.25 ° ×   %     S s u l f i d e
The neutralization potential (NP) was calculated following the static test described by Sobek et al. [39] Similarly to AP, the NP is expressed in kg CaCO3/ton. The AP and NP are useful for accessing the net neutralization potential (NNP), which is used to determine if a sample has an effective neutralization potential [39,42]. The NNP is obtained by subtracting the AP from the NP (NNP = NP − AP). NNP values less than −20 kg CaCO3/t indicate that the sample is potentially acid-generating, while values greater than +20 kg CaCO3/ton indicate that the sample is potentially acid-neutralizing [43]. When the NNP is between −20 kg CaCO3/ton and 20 kg CaCO3/t, it is difficult to determine, and the sample is classified as uncertain behavior [43].

2.4.3. Paste pH

In each sample of paste tailings, the paste pH was measured. For the measurement procedure, the original paste tailings sample with a liquid/solid ratio (L/S) between 1.80 and 1.86 was used (adapted protocol from ISO 10390:1994 (E)). Paste pH was measured using a pH electrode (PHC301, Hach, Loveland, CO, USA) (Hq40d Multi, Hach, Loveland, CO, USA).

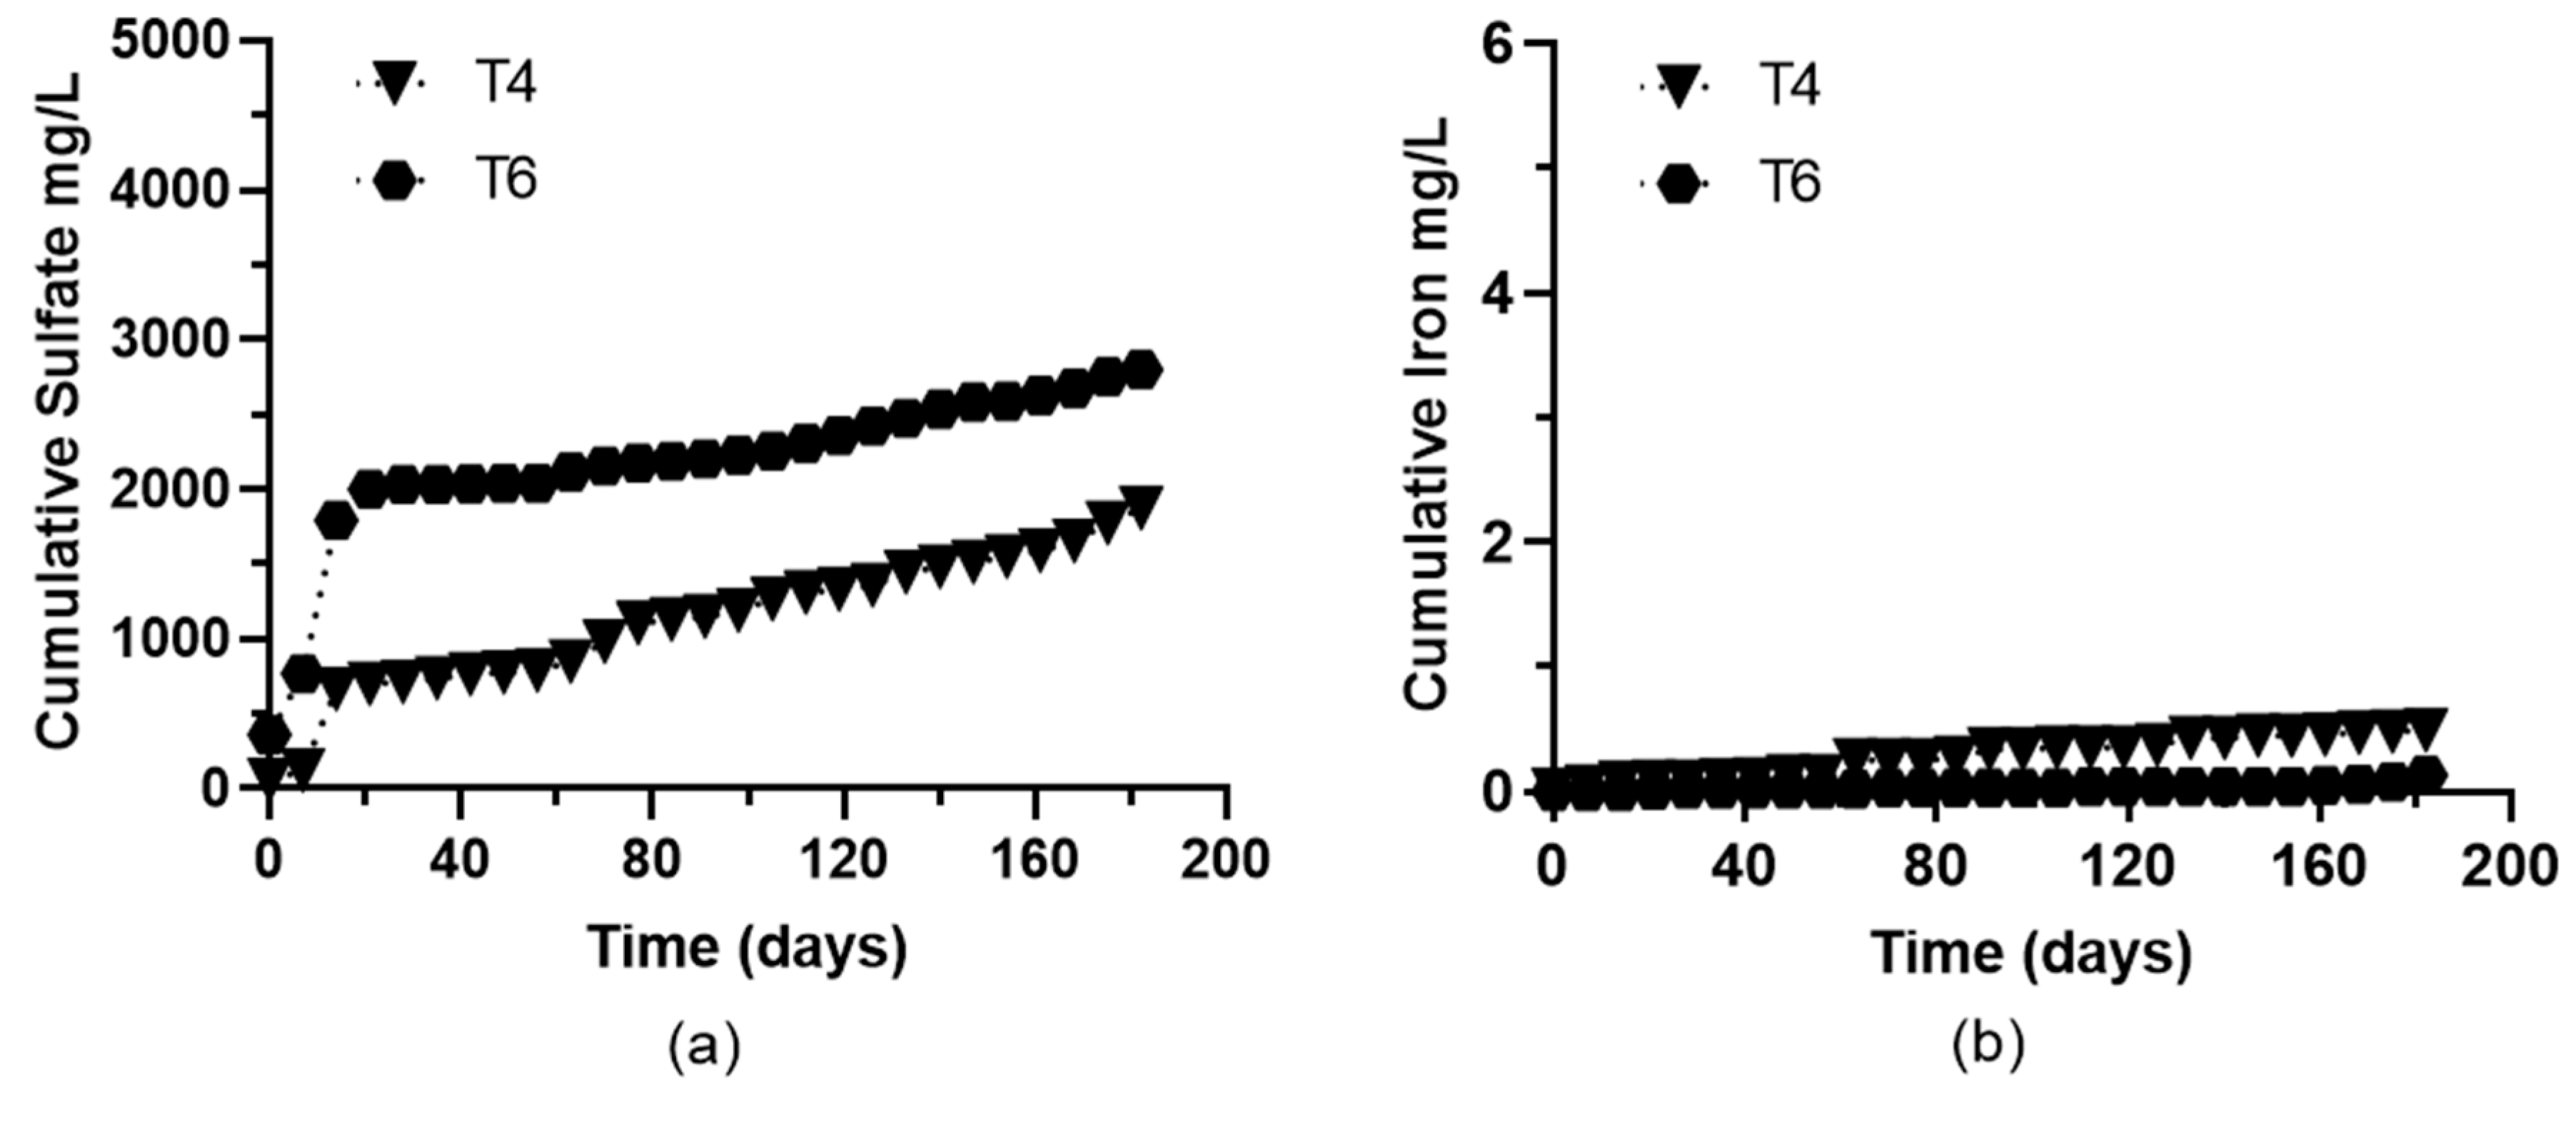
2.4.4. Kinetic Test: Humidity Cells

One kg of fine paste tailing sample (dried at 40 °C, sieved <2 mm) was subjected to kinetic tests to predict the longer-term acid drainage behavior. Humidity cells involve repetitive cycles with the supply of dry air and humid air on a sample, which simulates the oxidation processes of a real sample and thus estimates the release of metals, pH, and sulfate from the weathering of sufides. The kinetic tests were carried out according to protocol first developed by Sobek et al. [39] However, the final procedure used was the same as that described by Leiva et al. [36], which includes adaptations to the protocol of Sobek et al. [39].

2.5. Real-Time Monitoring of Chemical Parameters

To evaluate the impact of the chemical characteristics of the tailings paste, sensors for real-time monitoring, to measure pH and EC, were installed in the thickener and in a control well downstream of the tailings deposit (Figure 1). The installed sensors recorded pH and EC data at a frequency of 1 h, transferring them to the IoT platform (Libelium Smart Water). The Smart Water sensor allows remote measurement of pH and EC in different scenarios, both in natural systems and in industrial processes. For data transfer, Waspmote hardware architecture was used, which is designed to work with extremely low consumption and can be turned on and off from any of the sensor interfaces as well as the radio modules. The EC sensor (Libelium) is a two-pole cell whose resistance varies in function of the conductivity of the liquid it is immersed in. This is a two electrodes platinum sensor with a conductivity cell constant of 1 ± 0.2 cm−1. The pH sensor (Libelium) integrated into the Smart Water sensor board is a combination electrode that provides a voltage proportional to the pH of the solution. Both sensors were subjected to a periodic calibration to ensure accurate measurements.
The conductivity and pH analysis were complemented with punctual and periodic sulfate measurements both in the thickener and in the control well. These analyses were performed to establish a relationship between the EC and pH of the paste tailings with the release of sulfate downstream from the tailings deposit. The pH, EC, and sulfate data were completed using linear interpolation to fit a similar number of data (n) between the variables. Sulfate was analyzed by spectrophotometry (HACH, Loveland, CO, USA) in the water samples.

2.6. Time Series Analysis of Real-Time Monitoring of Chemical Parameters

The time series for the evolution of pH and EC were analyzed in the thickener and in the control well. At each analysis point (thickener and control well), sulfate concentrations were measured to evaluate their correlation with the behavior over time of pH and EC at each monitoring point. For the correlation analysis, the time series of pH and EC were smoothed. Data smoothing is a quantitative procedure that serves to minimize random fluctuations and predict short-term behavior. The procedure transforms a series of raw data into a series of less variable data. Specifically, in this study, the Moving Average method was used for smoothing the recorded data. This method creates a series of averages of selected subsets from the full data set. pH and EC were smoothed using a 168-point moving average corresponding to a 7-day period and associated with a 1-h measurement frequency for the raw data series. The simple moving average (MA) was calculated using Equation (2):
z ( t ) = x   ( t ) n + x   ( t 1 ) n + x   ( t 2 ) n + + x   ( t n + 1 ) n  
where t is the period; z(t) is the moving average of this period; x(t) is the measurement (pH or EC) performed in the current period; n is the number of periods of the moving average, x(t) is the measurement (pH or EC) performed in the current period, x (t − 1), x (t − 2) and x (t − n + 1) are the measured values in the previous periods.

2.7. Quality Assurance/Quality Control (QA/QC)

Quality assurance/quality control (QA/QC) procedures were performed for all chemical analyses and experimental tests performed in this study, in order to obtain reliable and accurate results. The instruments used both in the field and in the laboratory were properly calibrated before using certified reference standards or analytical grade synthetic standards and following instrument guidelines. The EC sensor (Real-time monitoring, Libelium) was calibrated with a two-point calibration procedure using standards of known conductivity according to the measurement range and the K factor associated with the salinity of the water that was measured. Thus, the kits used were: K = 0.1 (220–3000 µS) and K = 1 (10,500–40,000 µS). The pH sensor (Real-time monitoring, Libelium) was calibrated with three pH buffer solutions, one of 7.0 pH and two of higher and lower values (10.0 pH and 4.0 pH). The sensors were calibrated periodically to ensure the accuracy and reproducibility of the recorded data. On the other hand, all the chemicals used in this work were analytical-grade, and all the solutions used in this study were prepared with Milli-Q water. In addition, all laboratory and field materials used in this study were neatly cleaned and rinsed with Milli-Q water.
Analytical measurements in the field and laboratory were verified by performing replicate analyses (reading duplicate). Furthermore, sample blanks were used to ensure the validity of the measured values. Moreover, the validity of the sulfate measurements with spectrophotometry was checked and compared against synthetic standard samples of known concentration and blank samples prepared with Milli-Q water.

2.8. Statistical Analysis

All data were analyzed by using tools associated with GraphPad Prism 8.0.1 (GraphPad Software, La Jolla, CA, USA). The relationship between pH and EC time-series and sulfate was analyzed with the Pearson correlation analyses between two time-series (pH vs. Sulfate and EC vs. sulfate) in the thickener and in the control well.

3. Results and Discussion

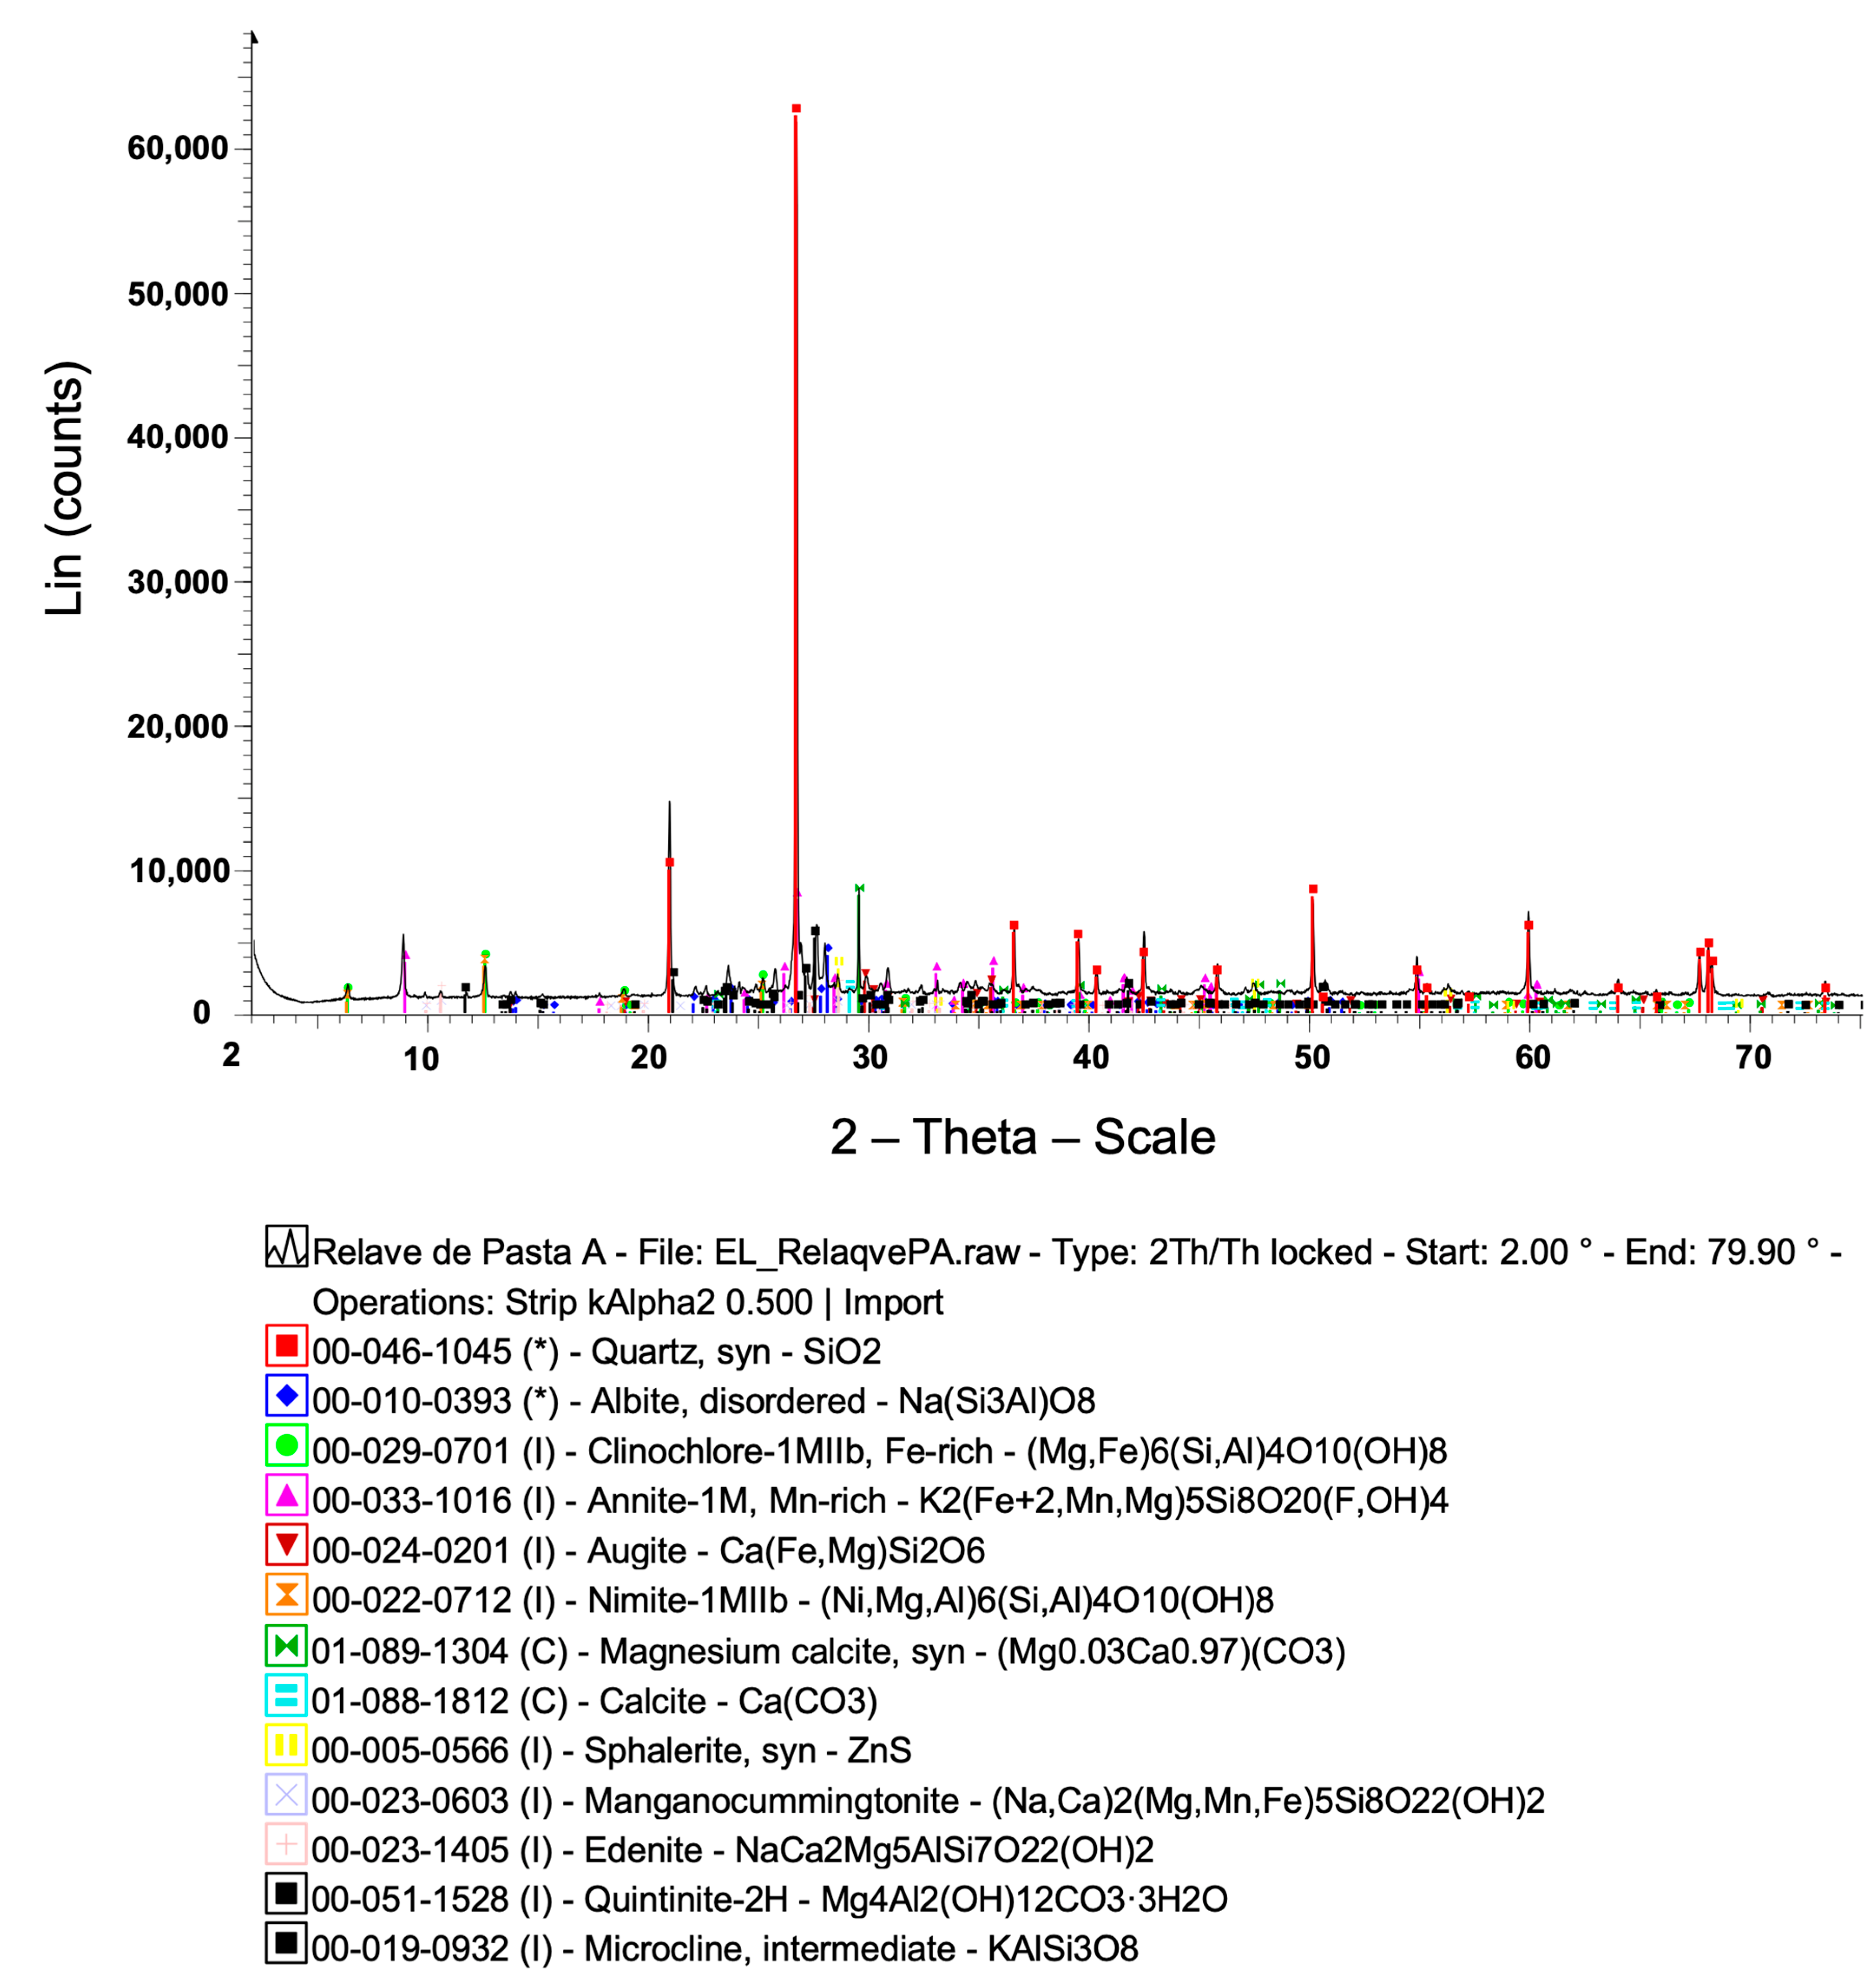
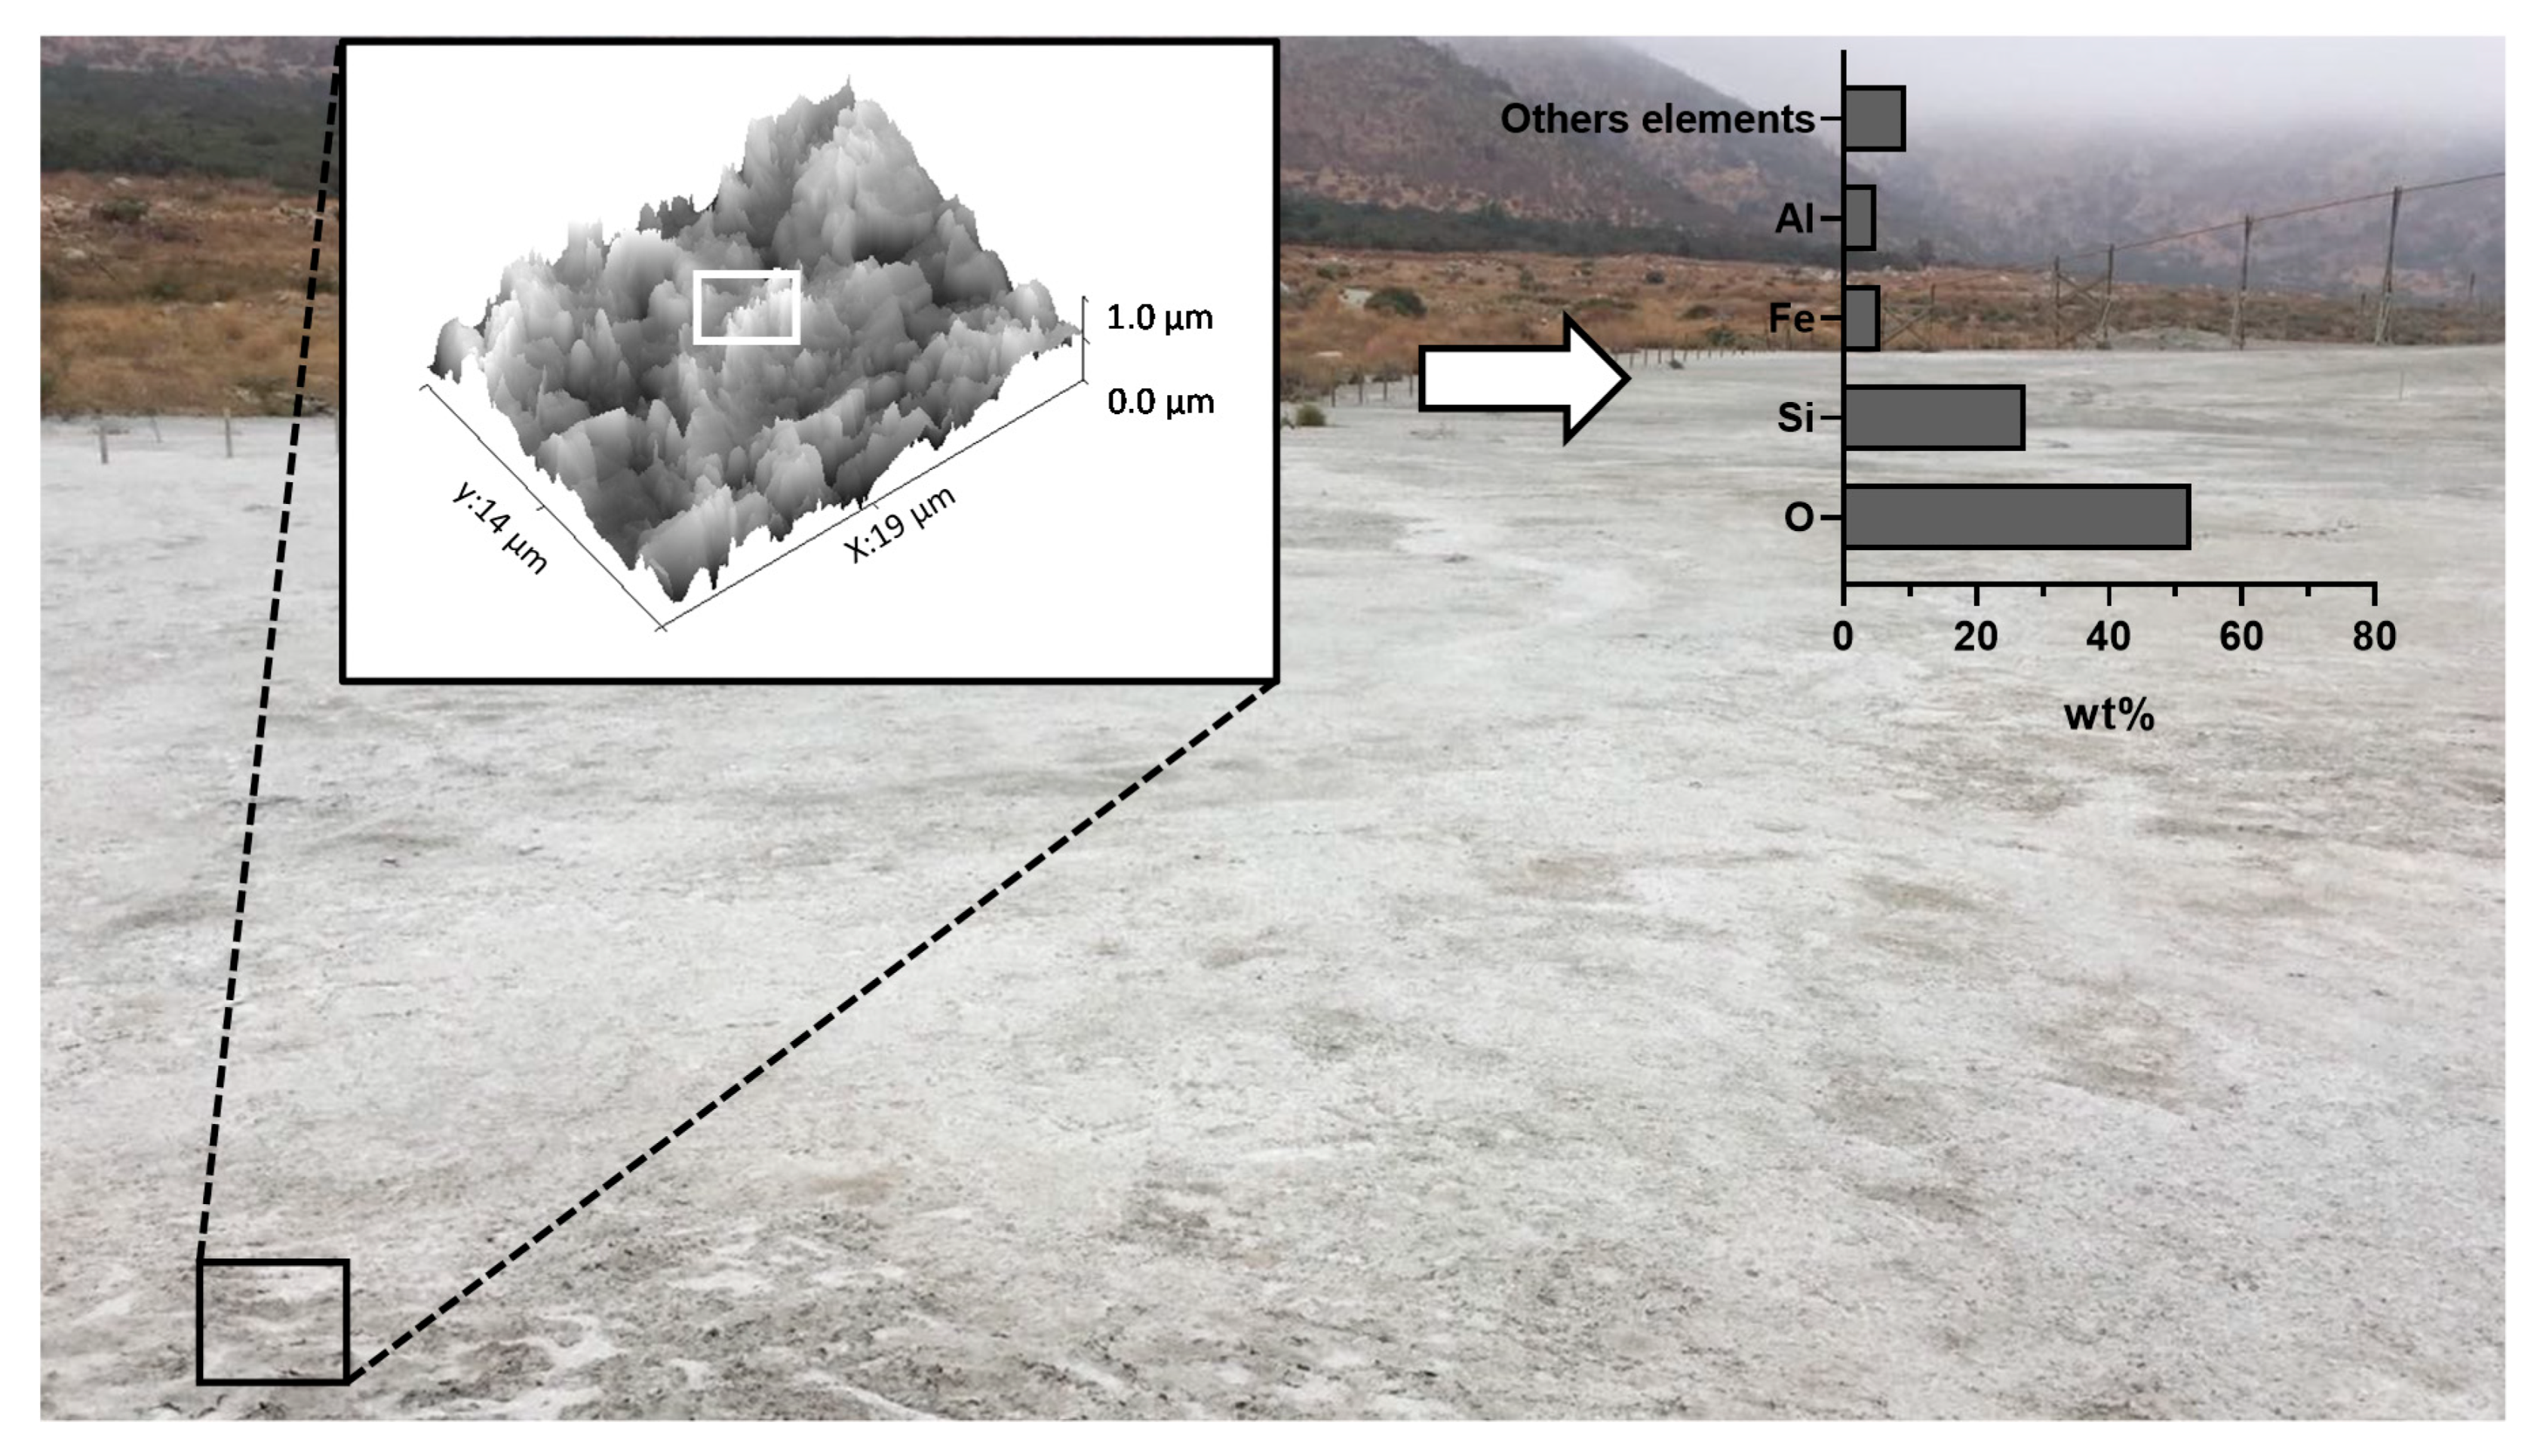
3.1. Paste Tailings Characterization

High density thickened tailings or paste tailings are a mixture of solids and water where the water that runs off is practically negligible. When deposited, they maintain their structure with less deformation, reducing the need for a retaining wall [21,23]. Among the environmental advantages of tailings paste is their ability to reclaim water, process reagents and energy, minimize tailings storage facility footprints, reduce the potential for acid drainage, and maximize the density of tailings and minimize risks of failure, among others [44,45]. High density thickened tailings are obtained with a consistency of about 70%–80% by weight. Flocculants are added to obtain the expected consistency with rheological and resistance specific properties [46,47]. Figure 2 shows how the thickening and dewatering process of the tailings pulp that enters the thickener produces an increase in the tailings solids content (Cp) from values of 28.6 ± 3.8 (% w/p) to 70.1 ± 1.6 (% w/w), achieving the desirable paste consistency for its disposal.
The rheological parameters influence the consistency of high-density thickened tailings. Among the properties that are key to paste tailing formation and affect paste viscosity are particle size, solids concentration, zeta potential, and temperature [46,48,49]. One of these properties is the Yield stress, which is a physical and rheological property for liquid and solid materials that is typically defined as the minimum shear stress that must be applied to the material to initiate flow and is a parameter related to the strength of the coherent network structure [32,33,50]. For the tailings paste, it is critical to achieve an adequate value of yield stress that allows the mobilization and pumping of this towards the tailings deposit. The yield stress values determined from the slump tests during the Florida mine operation are shown in Figure 3a. Specifically, the yield stress values after adding the flocculant dosage reached 56.9 ± 10.2 Pa. It can be seen that the yield stress values were adequate for the disposal and pumping of the paste tailings, despite the fact that other studies have shown that paste tailings are considered to be mixtures with yield stresses greater than 100 Pa [34]. An explanation for these values can be given by the mineral nature of the Florida mine tailings and the characteristics of temperature, percentage of solids, and type of flocculant, among other factors. Similarly, the slump reached values of 26.6 ± 2.2 mm after flocculant dosage (Figure 3b).

3.2. Chemical Analysis of Tailings Samples

The chemical analyses of the tailing samples are presented in Table 1 (complemented from Leiva et al., [36]). It is observed that the sulfur content is less than 2 wt% in all the samples except for the sample T4 0–10 cm (2.25 wt%). Interestingly, samples T5 10–20 and T5 20–30 have values less than 1%. The content of Fe, Al, and Mn in the samples ranges between 2.81–4.69, 1.11–1.63, and 1.81–3.32, respectively. Similarly, the content of Zn, Pb and Cu reaches values between 3225–9385, 448–5841, and 355–628 ppm, respectively. In other metals such as Cr, Ni, Sn, Cd, and Ag, these are below 100 ppm. Even in the case of Ni, its presence was not detected in the paste tailings samples. The low sulfur content (<2 wt%) in the tailing samples suggests that the AMD generation processes could be low in the surface samples of the tailings. However, it is necessary to evaluate the potential acid-generating samples and the contaminant release kinetics in order to provide more information about the reaction rates related to acid-generating and acid-neutralizing processes.
In the tailing samples, it was difficult to find crystalline mineral phases since the X-ray diffraction spectrum (XRD) revealed a strong band of unidentified amorphous minerals. However, after a more specific analysis it was possible to identify crystalline phases of Quartz (SiO2), Albite (Na(Si3Al)O8), Augite (Ca(Fe,Mg)Si2O6), Magnesium Calcite ((Mg0.03Ca0.97)(CO3)), Calcite (Ca(CO3)), Sphalerite (ZnS), Microcline (KAlSi3O8), among others (Figure A1). In addition, the base minerals (gangue and ore) of the deposit correspond to Blenda (ZnS), Galena (PbS), Pyrite (FeS2), Sphalerite ((Zn, Fe)S), Chalcopyrite (CuFeS2), Hematite (Fe2O3), Magnetite (Fe3O4), Calcite (CaCO3) and Dolomite (CaMg(CO3)2) (Florida mine information). The presence of calcite and magnesium calcite in paste tailings samples (XRD analysis) can determine that the neutralizing processes will be relevant for the generation of AMD; however, it is necessary to evaluate this through static and kinetic tests.
To complement the mineralogical and compositional information of the tailing samples, the elemental composition of the surface of tailing samples was determined by using Scanning Electron Microscopy (SEM-EDS). EDS microanalysis showed dominant atomic percentages of Si (27.5%), Fe (5.6%), and Alumnium (5%) (Figure A2, [36]). Similar to those observed for the chemical analysis of the tailing samples, the atomic percentages of Zn and S were low and less than 1% (Figure A2).

3.3. Assessment of Acid Mine Drainage Potential

To evaluate the AMD generation potential of the Florida mine tailing samples, tailing samples (T1-T6; at depths of 0–10 cm, 10–20 cm, and 20–30 cm) were subjected to NAG tests. The analysis of the results of the NAG tests shows that all the surface tailing samples after the reaction with the strong oxidant (H2O2) showed NAG pH values between 6.4 and 10.7 and therefore can be grouped as non-acid generating (Figure 4). However, by this method, it is not possible to separate the acid generation processes from the neutralization processes. Despite this, in the case of the paste tailing samples (T1–T6) in all depths, as they have a pH greater than 4.5, it is established that they have a null NAG potential.
The main sulfide minerals present in the Florida mine deposit correspond to Blenda (ZnS), Galena (PbS) Pyrite (FeS2) sphalerite ((Zn, Fe) S), Chalcopyrite (CuFeS2) (Florida mine information). Although these minerals may influence AMD production, the important presence of calcite (CaCO3), magnesium calcite ((Mg0.03Ca0.97) (CO3)), and dolomite (CaMg(CO3)2) phases may support the idea that neutralization processes are relevant in surface samples from tailings, supporting the static test results. In turn, the surface tailing samples showed low sulfur concentrations (<2 wt%). Thus, the low sulfur content added to the presence of carbonate phases such as calcite and dolomite suggests the potential relevance of the neutralization processes on the acid production process derived from the oxidation of sulfur, which does not make the sample present a net acid production.
In order to determine the acid potential (AP), neutralization potential (NP) and net neutralization potential (NNP) of the paste tailing samples Acid Base Accounting (ABA), tests were performed. The results of the ABA analysis are presented in Figure 5. It is observed that the samples have low AP (<75 kg CaCO3/ton), which is consistent with their low sulfur content (Table 1). However, with the NNP calculation, some samples were classified as potentially acid-generating (T4 and T6 at all depths and T3 at 0–10 cm), although the NNP values determined were greater than −45 kg CaCO3/ton, which indicates that the acid-generating potential is slight. Interestingly, the remaining samples show an uncertain behavior which suggests that neutralization processes could still be important in these samples, although it is not as significant to classify the samples as potentially acid-neutralizing (values greater than +20 kg CaCO3/ton).
The paste pH values of the tailing samples range between 7.3 and 9.2 (T1: 7.7 ± 0.2; T2: 8.5 ± 0.3; T3: 7.8 ± 0.3; T4: 7.5 ± 0.3; T5: 7.6 ± 0.2 and T6: 8.6 ± 0.6), showing predominance of alkaline values. For the analysis, the samples were averaged in the different sections (0–10, 10–20, 20–30 cm). This behavior is contrary to that observed for tailings based on pyrite or with metal sulfides in high quantities, where acid generation processes predominate. These results are consistent with the low percentages of sulfur observed in the tailing samples (<2 wt%) and with the low AP values recorded. Altogether, the static tests indicate that the tailing samples have low or uncertain acid-generation capacity. Hence, in order to confirm and clarify the acid behavior of the paste tailing samples, a kinetic test is still required.
AMD requires the oxidation of sulfide minerals in the presence of oxygen and water [51]. The degree of desaturation of the paste tailings can directly influence the extent of sulfide oxidation of the tailings [52]. Thus, the surface layers of the tailing deposits are more susceptible to oxidation processes of sulfur minerals present in tailings [52]. In addition, AMD generation is also affected by additives [52]. Chafy et al. [53] reported NAG pH values greater than 4.5 (6.8) in low-S thickened graphite tailings samples, while the NAG pH value was 3 for high-S tailings solids samples. Furthermore, Deschamps et al. [54] showed that the addition of a binder such as Portland cement significantly reduced the oxidation rates of surface deposited paste tailings at the La Ronde Cu-Zn-Au-Ag mine in Canada. Furthermore, they also found a marked increase in the neutralization potential of sulfidic tailings.
Another aspect that can influence changes in acid generation can be recharging with layers of the fresh tailing’s paste since this would have a greater amount of water as it has not been subjected to intense evaporation like older tailings. Unoxidized (fresh) tailings can decrease the pH and generate the release of acid at certain points in the tailing’s deposit. From this, it seems desirable to promote the evaporation of these fresh layers of tailings. Indeed, Simms et al. [55] reported that the evaporation of these fresh layers of paste tailings will favor densification and gain resistance. However, excess evaporation will desaturate the tailings and can promote oxygen ingress and increase the risk of acid generation. Yanful [56] showed that the diffusion coefficients of oxygen decreased with an increase in water saturation, which is a consequence of the low diffusivity of gaseous oxygen in the water and the low solubility of oxygen in the water. Thus, the risk of acid-generation may increase as the paste tailings desaturate significantly. This phenomenon will be more evident in climates with higher rainfall, which favor the oxidation of sulfide minerals. This is not evident in the Florida mine where evaporation processes are predominant. Even so, the risk of acid drainage generation will be a balance between the recharge of fresh paste tailing layers with the dehydration processes of the tailings and can influence acid generation peaks at a certain moment due to the presence of an important content of sulfide unoxidized minerals.
The formation of the paste tailings and the mineralogy and the management of the tailings deposit can have a direct impact on the oxidation rates of paste tailings and consequently on the generation of AMD. These factors must necessarily be considered in the evaluation of the release of pollutant runoffs from the paste tailing deposits. Even so, our results show that paste tailing samples are not potentially acid-producing, or the presence of neutralizing minerals is sufficient to limit the generation of acid runoffs released by the oxidation of minerals from the surface samples of tailing deposits.
To clarify the acid-generating potential of the paste tailing samples, the samples that showed a higher acid potential (T4 and T6 (0–30 cm)) according to the ABA tests were subjected to kinetic tests using humidity cells [36]. The results show that the pH values of the leachates remained in neutral-alkaline ranges during the operation (6.86–9.54 T4; 6.55–9.21 T6) while the electrical conductivity showed high values during the first cycles, reaching a maximum of 7042 mS/cm for T4 and 5485 mS/cm to later stabilize at values between 70 and 400 mS/cm for both cells and from the third cycle onwards. The high ionic load during the first leaching cycles suggests the release of ions associated with the thickening process of the paste or by the dissolution of highly soluble mineral phases (secondary minerals formed by high evaporation rates). The tailing’s sulfide oxidation process was not as evident during the operation (182 days) since no marked peaks of increases in the concentration of dissolved metals in the leachates or the presence of significant concentrations of sulfate (after the third cycle) were observed. As observed for the EC, sulfate concentrations increase markedly during the first operating cycles, supporting the idea of the relevance of the initial tailing solubilization processes. After the third cycle (21 days), the increase in the cumulative load of sulfate was gradual without a peak of marked increases. This absence of peaks suggests that the oxidation processes are not as evident in the paste tailing samples, which is consistent with the NAG (Figure 4) and ABA tests (Figure 5) and with the low sulfur content reported in the tailings (Table 1). Although the lower sulfur content in the tailings may influence the lower sulfate release in the humidity cells, the gradual increase in cumulative sulfate may also be influenced by the presence of a high sulfate load during the preparation of the paste. In turn, the presence of water-soluble secondary sulfate minerals on the surface of the tailings may also explain the gradual increase in cumulative sulfate. Dold and Fondbote [57] indicate that with increasing evaporation and decreasing grain size, the surface of the tailings under oxidizing conditions can be enriched in water-soluble secondary sals, a process that occurs by the transfer and migration of oxidation elements to the top of tailings by capilarity forces. Hence, the dissolution of secondary sulfate salts could contribute, in part, to the gradual increase in cumulative sulfate observed in the humidity cells. Even so, the presence of these phases was not observed (XRD analysis), which may be a consequence of the presence of the band of unidentified amorphous minerals or due to the higher proportion of other crystalline phases.
On the other hand, the cumulative iron (Figure 6b) in the leachates was not significant. The cumulative load was less than 0.5 mg/L for T4 and less than 0.2 mg/L for T6. Thus, this again supports the idea that oxidation processes of sulfide minerals are not significant, which is also supported by the low levels of sulfate and the neutral-alkaline pH reported for leachates. Metals found to a lesser extent in the tailings such as Al, Cu, Zn, Pb, Cr, Sn, Ag, were not detected in significant concentrations in the leachates either.
The release of Ca, Mg, and Mn from the tailings (T4 and T6 cells) was not so significant as to confirm the relevance of neutralizing processes. The release of Ca, Mg, and Mn from the tailings (T4 and T6 cells) was not so significant as to confirm the relevance of neutralizing processes. Even so, the Mn content in the tailing samples ranged between 1.81 and 3.33 wt%, while the Ca content was between 2.39 and 4.02 wt%, which suggests that the presence of neutralizing minerals such as calcite and dolimite may partially control the acidity generated (which cannot be detected). In brief, the kinetic tests support what was found in the static tests for the evaluation of the acid-generating potential.

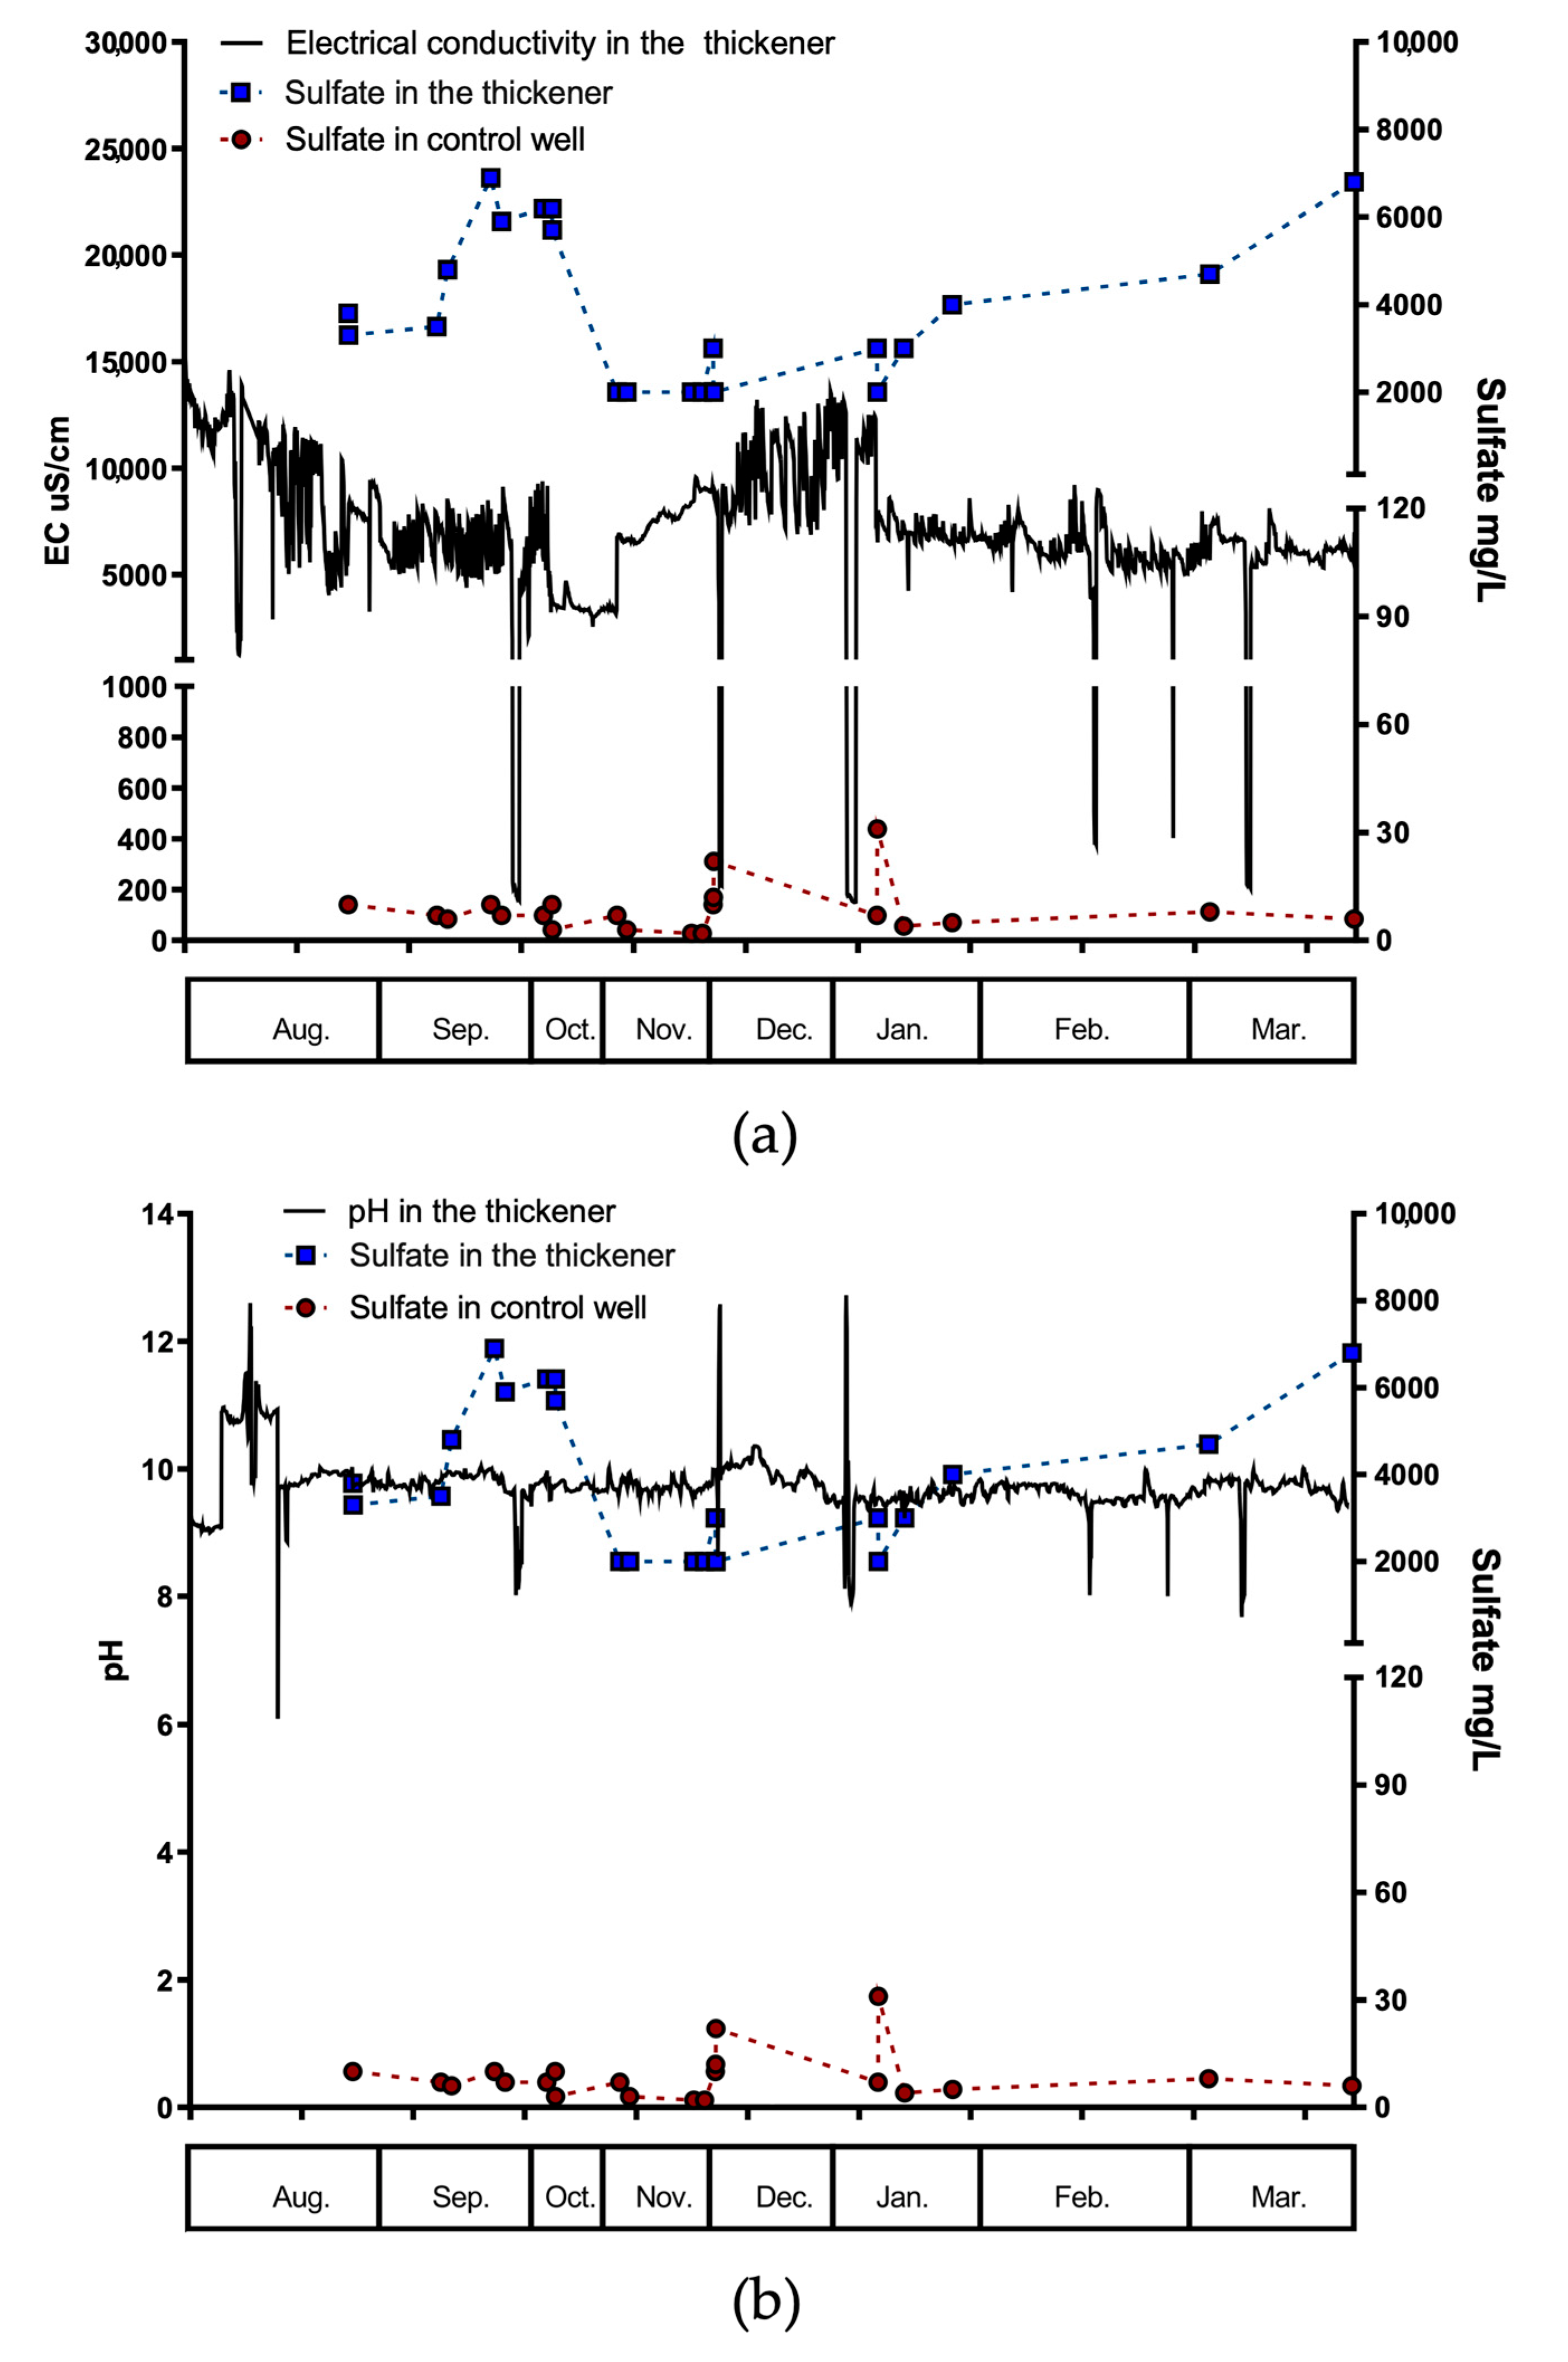
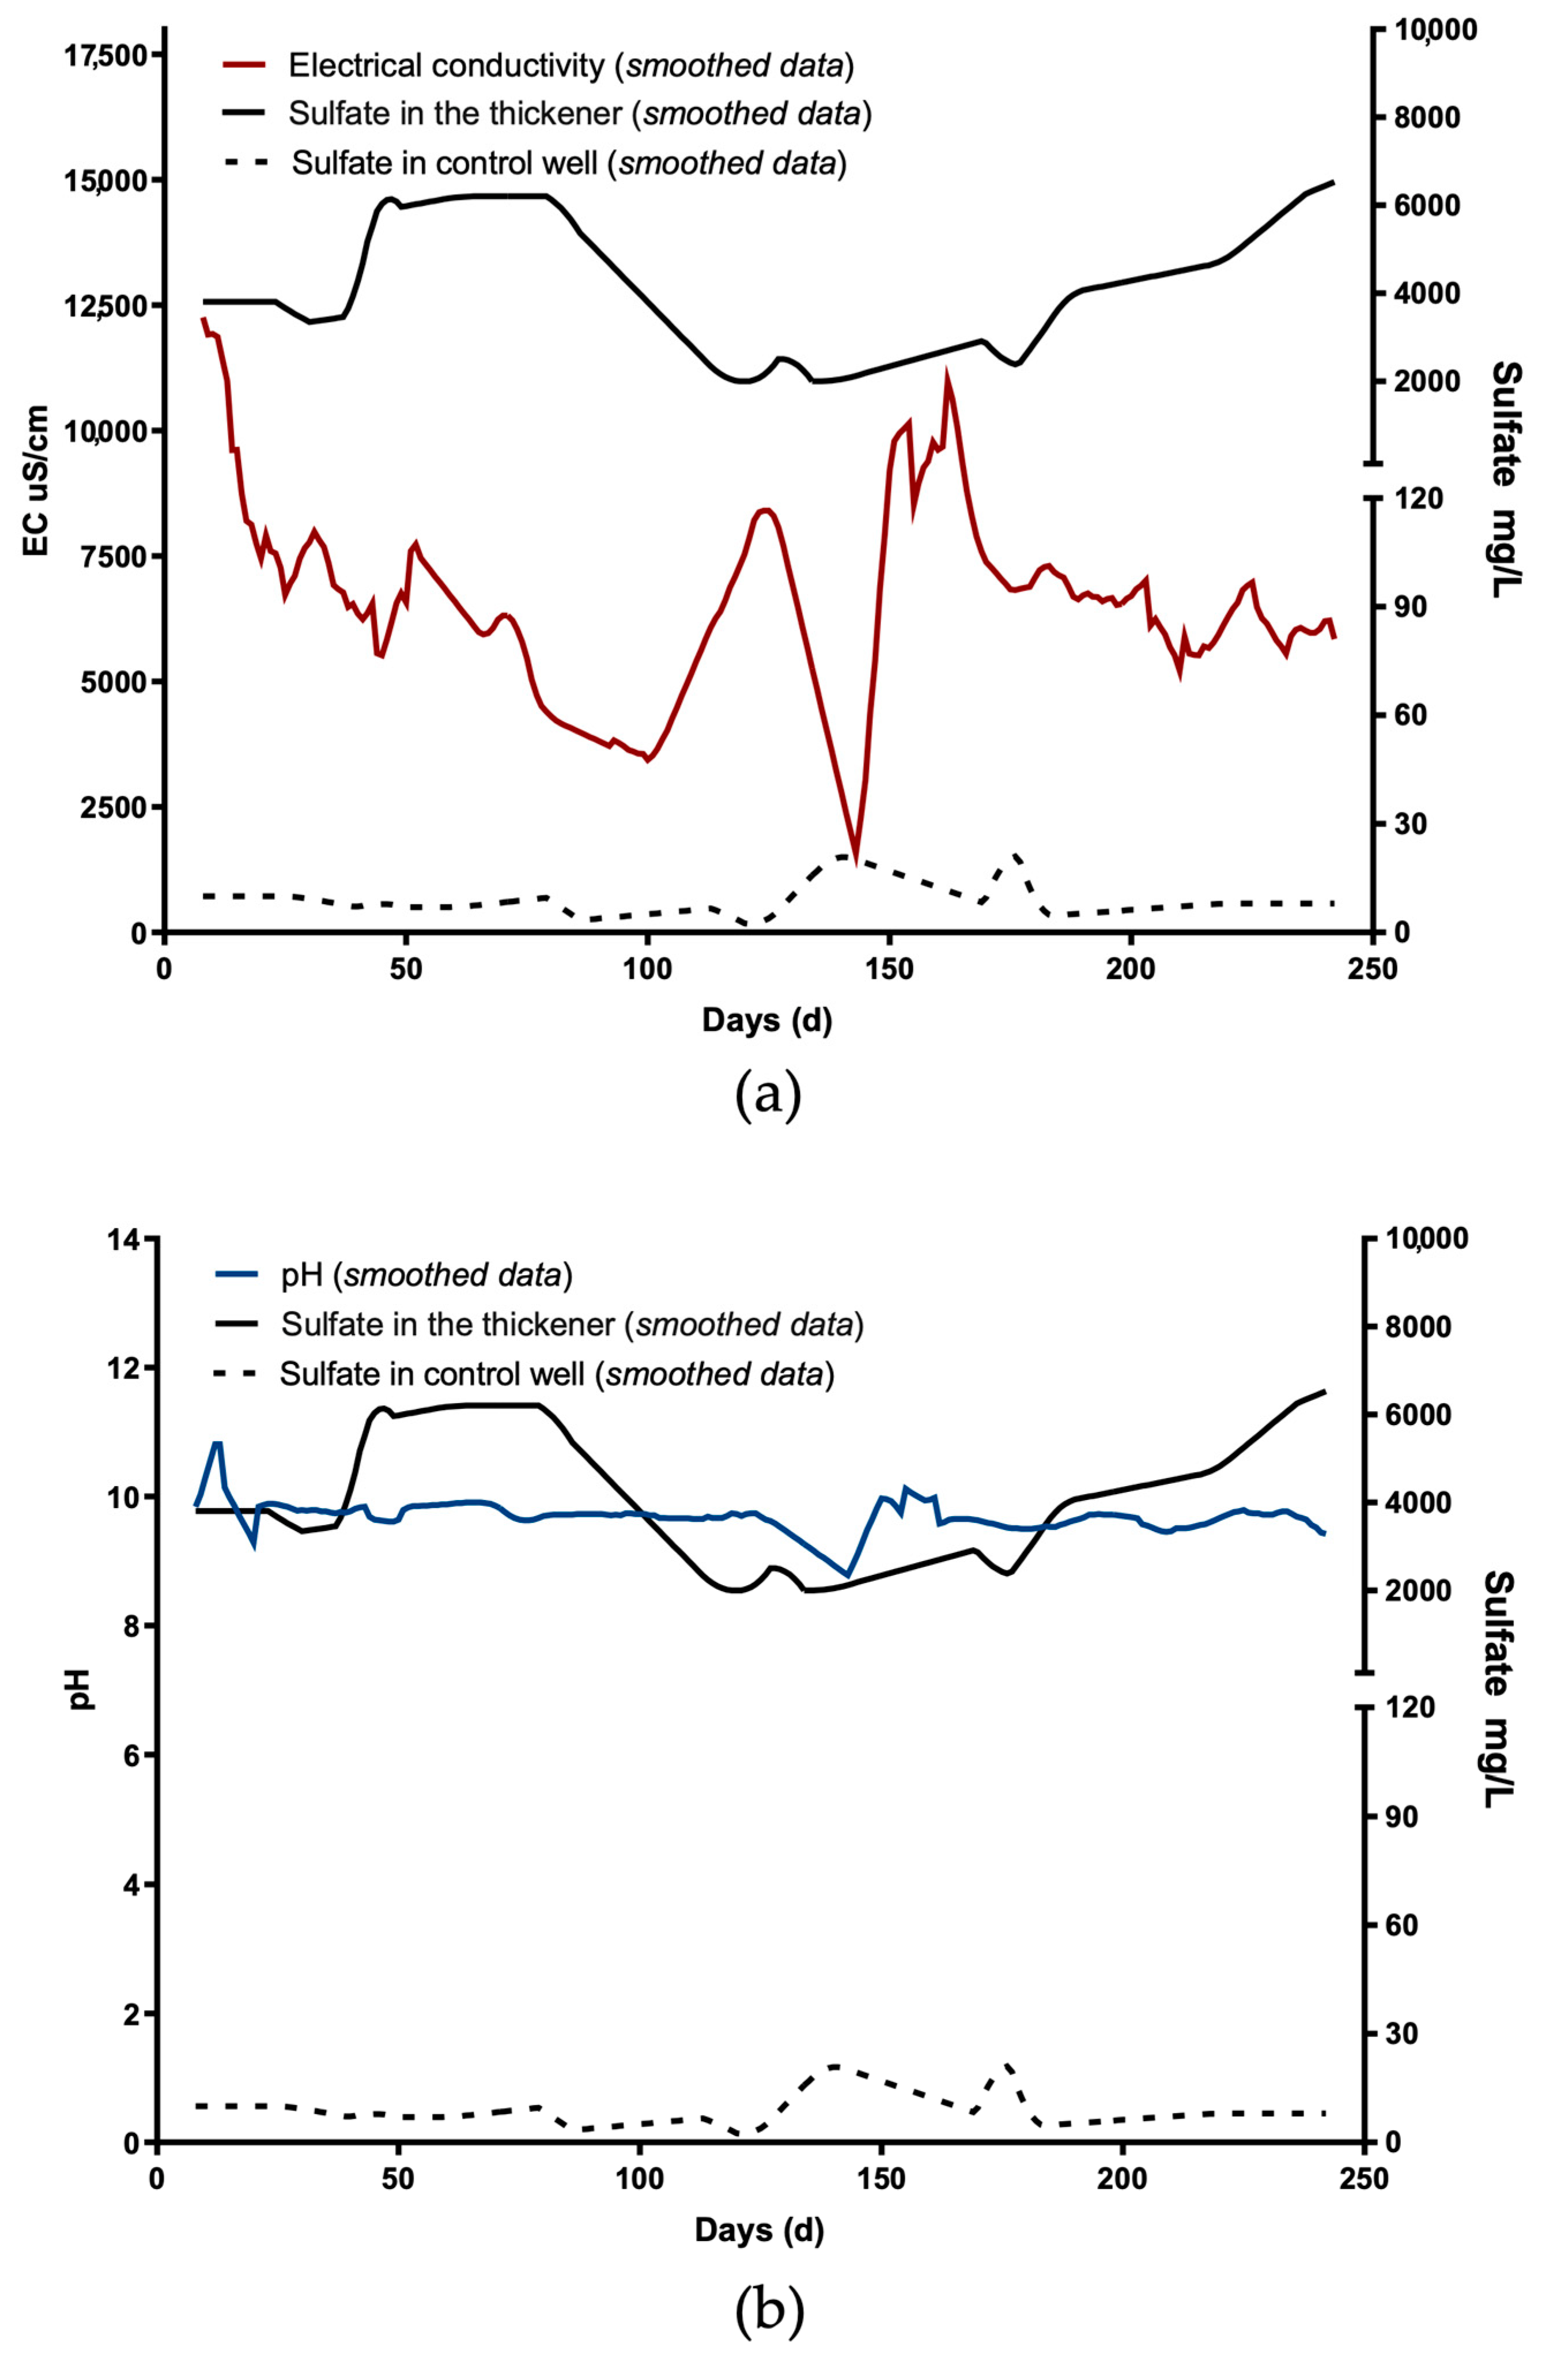
3.4. Electrical Conductivity and pH Time-Series

The time series shows that the EC in the thickener is high, reaching values over 15 mS/cm (Figure 7). The average value of EC was 7.16 mS/cm with a maximum of 15.7 mS/cm and a minimum of 149 uS/cm. The values show variations between 1 and 15 mS/cm, with marked reductions probably produced by changes in the operating conditions of the thickener. In the control well, the EC is below 520 uS/cm (data not shown), suggesting that the deposit is stable and does not generate high salinity runoffs. In the control well, the average EC was 281 uS/cm with a maximum of 518.4 uS/cm and a minimum value of 183.2 uS/cm. Changes in the EC of the thickener are not directly reflected in the EC of the control well, but more marked variations could be reflected in the sum of more than one parameter. On the other hand, the results of the real-time pH monitoring show that the average pH of the thickener is quite alkaline with a value of 9.7, a maximum of 12.7 and a minimum of 6.1 (Figure 7). Interestingly, in the control well downstream from the tailings deposit, the pH values were initially close to neutral values and then fall to acid values. The average pH was 6.1, with a maximum of 7.7 and a minimum value of 4.7 (Data not shown). The increase in acidity reflects the acidification of the runoffs. This could be influenced by changes in the operating conditions of the tailing’s deposit. However, the main consequence may be the consumption of neutralizing mineral phases such as calcite (CaCO3) and dolomite (CaMg(CO3)2), which would be those that control the first stages of acid drainage generation. Sulfide minerals present in the Florida mine deposit such as Galena (PbS), Pyrite (FeS2), Sphalerite ((Zn, Fe)S) and Chalcopyrite (CuFeS2) can lead to the formation of acid and sulfate and, therefore, to the release of these pollutants in acidic runoffs. However, the pH values reported in the real-time monitoring of the control well (pH > 4.7) are consistent with the static test results for the surface tailing samples and show that the potential for acid generation was low. In turn, this is also consistent with the pH values observed in the thickener. Furthermore, the evolution of pH over time also shows the low oxidation potential of sulphide minerals on the surface of the tailings, which is supported by the low percentage of sulfur (<2%).
The observed yield stress values (56.9 ± 10.2 Pa) are consistent with the thickening process and the increase in the solids content (% w/w). However, a clear relationship between yield stress and EC or pH in the thickener was not observed. Ruan et al. [58] have shown that yield stress can be influenced by the flocculant dosage and the acidity (pH) during the flocculation process. They performed yield stress tests of flocculated and thickened copper mineral tailings slurries and reported that pH affects the total interactions (microscopic) between polymer-coated tailing particles. In turn, Fourie [59] showed that the percentage of solids and the yield stress in paste tailings are influenced by the pH. There is an optimal pH value where the percentage of solids and yield stress (Pa) are maximum. Higher or lower values than this optimum pH produce a decrease in thickening yields. In this way, the behavior of yield stress (Figure 3a) could be directly related to changes in pH over time (thickener). However, this is not so evident from the pH time series analysis, since there are other variables that may be relevant such as ion concentration, surface area, and flocculant dosage. The same observation can be deduced from the evolution of the EC over time. Conversely, the high ion concentrations in the aqueous phase of the thickener (over 15 mS/cm, Figure 7a) can affect the correct adsorption of the flocculant and, therefore, the interaction between the flocculant and the fine tailings particles.
When comparing the sulfate concentrations of the thickener with the sulfate concentrations measured in the control well, it is observed that there is no similar behavior, suggesting that the sulfate concentrations of the thickener do not significantly influence the sulfate concentrations released downstream of the tailings deposit (Figure 7). It was observed that the sulfate concentrations in the thickener during the months of September and October were higher than the preceding and subsequent months, but this phenomenon was not reflected in evident changes in the sulfate concentrations of the control well, which remained more stable. Furthermore, between February and March, the sulfate concentrations of the thickener tend to rise, while the sulfate concentrations of the control well have a stable behavior. Similarly, different magnitudes of sulfate concentrations are observed between the thickener and the control well. In the thickener, the sulfate concentrations ranged between 2000 and 6900 mg/L, while the sulfate concentrations in the control well are ranged between 2 and 31 mg/L. This marked difference suggests that the sulfate concentrations in the tailing deposits are relatively stable or show slow-release kinetics. Indeed, sulfate concentrations released are associated with a low percentage of sulfur (<2 wt%) present in the surface tailing samples, which indicates that the higher sulfate concentrations observed in the thickener are associated with the thickening process and are removed in the discard aqueous phase. This indicates that sulfate concentrations in the thickener are not directly related to the sulfate concentrations in the control well and, therefore, other processes can impact downstream water quality. In addition, the low sulfur content of the paste tailings samples (<2 wt%) and the absence of surface tailings samples with potential for acid generation (stratic tests and kinetic tests) support the low release of sulfate in the control well. Even so, it is not possible to rule out that deeper layers of the tailings have a higher potential for acid generation or a higher sulfur content that could influence the generation of polluting runoff. Likewise, the oxidation potential of the deep layers could be lower, due to less diffusion of oxygen into the tailings. However, the high sulfate load in the thickener may partially support the gradual increase in cumulative sulfate observed in leachates of humidity cells (Figure 6a).
It has been shown that the quality of leachates derived from paste tailings can be improved by the addition of bactericide, lime, and cement [60]. However, when these neutralizing elements are consumed, the quality of the runoffs deteriorates [51]. On the other hand, Ran et al. [61] carried out continuous monitoring of water percolation from tailing dams that support paste tailings from fertilizers produced in Israel. They used a novel Vadose Zone Monitoring System (VMS) and found that the levels of water percolation and pollution potential from these ponds were low. This supports the idea that paste tailing disposals can be an environmentally safe alternative that reduces the release of leachate or polluting runoff. In contrast, in northern Tanzania, the Bulyanhulu mine, an underground gold mine, has implemented a total system of tailing disposal as a paste (25% used underground as blended and 75% being disposed on the surface) [62,63]. This system is dominated by pyrite as the most abundant sulfide mineral with lower amounts of chalcopyrite, pyrrhotite, and arsenopyrite [64]. Here, it was observed that mining activities derived from the operation of the mine have caused the progressive deterioration of the water quality of the Bulyanhulu River [65]. Specifically, it was determined that the water quality of the river is polluted with Ni, Fe, and slightly by Zn [65]. Indeed, high concentrations can be a consequence of the weathering of sulphide ore bodies, chemicals used in the process plant, decomposition and leaching of discarded batteries, and old metal scraps in mine areas [65]. This shows that the operation of paste tailings is essential to limit the release of polluting runoff from the tailing deposits. In our case, the results support the idea that although the preparation of the paste can be a critical and a potentially polluting factor, the current operation of the Florida mine deposit is environmentally safe and with little release of sulfate-rich runoff, at least in the monitoring point downstream of the deposit (control well).
The EC of the thickener does not show an evident association or similar geochemical behavior with the values of the sulfate concentrations of the thickener and the control well. On the one hand, it is observed that the EC of the thickener follows a different behavior and a different trend than the sulfate concentrations of the thickener and the control well (Figure 7). This is evident during the months of September and October where sulfate concentrations increase markedly, and EC does not have an evident increase. On the other hand, negative conductivity spikes are not reflected in the sulfate concentrations of both the thickener and the control well. This again supports the independence of the chemical nature of paste tailings and its formation process with the release of pollutant runoffs post-disposal, at least in the current monitoring scenario. However, to determine and rule out whether changes in conductivity may reflect changes in sulfate concentrations or vice versa, the association between these two time series will be analyzed.

3.5. Correlation Analysis

For correlation analysis, the time series data were smoothed with the moving average method (Figure 8). Correlation analysis shows that there is no correlation between the sulfate concentrations of the control well and the EC of the thickener (Figure 8), confirming what was mentioned in Section 3.3. The Pearson correlation coefficient (r) was 0.051. In turn, a similar analysis for thickener sulfate concentrations with thickener EC revealed that the correlation is weak (Pearson’s coefficient r = −0.21). Figure 8b shows the comparison of the smoothed pH data of the thickener with the sulfate concentrations (thickener and control well). The correlation analysis shows a weak correlation of the pH time series data with the thickener sulfate concentrations (Pearson’s coefficient r = 0.27) and with the control well sulfate concentrations (Pearson’s coefficient r = −0.35).
For comparison, other studies have shown strong correlations between EC and sulfate. For example, Khoeurn et al. [66] found a strong correlation (correlation coefficient > 0.8) between EC and sulfate using the Principal Component Analysis (PCA). They analyzed leachate released from tailing samples from an abandoned mine in Shimokawa, Hokkaido, Japan, and found that pyrite and sphalerite were the main minerals that released Fe and Zn. Conversely, they found a negative correlation (i.e., correlation coefficient <−0.6) between sulfate and pH. Similarly, Valente et al. [67] also found strong correlations between EC and sulfate (0.90) from the AMD stream located in the Iberian Pyrite Belt (Chorrito stream, which flows into the Cobica River, SW Spain) and observed negative correlations between pH and EC (−0.7333). Olias et al. [68] found strong correlations between EC and Sulfate in the water of the Odiel River (between October 1980 and October 2002) located in the south of Spain that drains into the Iberian Pyrite Belt (IPB), an important sulphide-mining region. Interestingly, there are no studies that examine the relationship between chemical parameters associated with paste tailing formation and their correlation with the potential release of polluting runoff from the paste tailing deposits. This is the first work that studies and delves into these topics. Thereby, our results confirm that the EC of the thickener is not a variable that can fully explain changes in the sulfate concentrations of the control well and in the same thickener. Despite this, the relevance of EC as a control parameter cannot be ruled out; however, it is necessary to consider other ions in addition to sulfate for monitoring and control. In addition, our analysis shows that the pH of the thickener is not a variable that can explain the variation in sulfate concentrations of the thickener and control well. Indeed, the geochemical behavior of the variables over time follows different trends and relationships that are not explained by a significant association between them.
The correlation analysis between the EC of the thickener and the pH of the thickener showed that there is a moderate correlation between both variables (Pearson’s coefficient r = 0.579), suggesting that in the thickener both variables may be influenced by similar factors. Valente et al. [67] also found correlations lower than 0.8 between EC and pH. The correlation between pH and EC also indicates that the chemicals used for thickening the tailings affect both variables significantly.

4. Conclusions

The potential of AMD generation of paste tailings was evaluated by using NAG, ABA, paste pH, and Kinetic tests. According to the NAG results, all paste tailing samples are considered potentially non-net acid generating. However, ABA tests suggest that part of the samples are slightly potentially acid generating (T4 and T6 at all depths and T3 at 0–10 cm) and the rest show uncertain behavior. Even so, the kinetic test confirmed that the samples did not generate acid runoff release and that the minerals present in the tailings are not potentially oxidizable, indicating that the deposit would be chemically stable. The consumption of neutralizing phases such as calcite and dolomite can control the first stages of drainage generation. Moreover, the low sulfur content of the paste tailing samples (<2%) supports the results of the static and kinetic tests and the idea of the low acid potential observed in the tailings samples. Conversely, the addition of unoxidized (fresh) tailing layers to the surface of the tailing deposits can also affect acid drainage generation by changing chemical conditions. The analysis of the time-series data showed no significant correlations between the pH and EC of the thickener with the sulfate concentrations of the thickener and the control well downstream of the tailing deposits. Pearson’s r was 0.051 for EC in the thickener and sulfate in the control well and −0.21 for EC in the thickener and sulfate in the thickener, which indicates that EC is not a variable that explains the changes in sulfate concentrations. In addition, a moderate correlation was observed between the pH of the thickener and its EC, suggesting a related geochemical behavior. The results also show that the sulfate concentrations released downstream from the tailings deposit, showed values below 40 mg/L while in the thickener they reach values higher than 2000 mg/L. This indicates that there are processes in the tailings that can control sulfate discharge without a direct relationship with the concentrations observed in the thickener, which are mainly removed in the discarded waters of the thickener. Despite this, it is not possible to rule out other ions associated with EC that may be relevant to explain this variable (EC). Even so, continuous real-time pH and EC monitoring complemented by point analysis for sulfate concentrations and other ions could help assess and visualize changes in the geochemical conditions of the tailing deposits. This can favor the development of preventive measures and avoid environmental catastrophes associated with events of chemical instability of the paste tailing deposits. In addition, this will make it possible to make decisions on the operation and disposal of the paste tailings and at the same time propose control measures in the event of failure.

Author Contributions

All authors collaborated in this work. The manuscript was written by E.L., but all the authors contributed to its preparation and review. E.L. performed the design of the experiments and the discussion of results. Experiments and data analysis were performed by E.L. and M.C. Sampling was performed by M.T.; E.L. reviewed and edited the manuscript. All authors have read and agreed to the published version of the manuscript.

Funding

This research was funded by the National Commission for Scientific and Technological Research (CONICYT) of Chile Primer concurso de investigación tecnológica en minería, del Fondo de Fomento al Desarrollo Científico y Tecnológico, FONDEF/CONICYT 2016 IT16M10012: “Supervision and optimizing control of tailings using emergent technologies” and by FONDECYT DE INICIACIÓN 11191154 (2019–2022).

Data Availability Statement

The data presented in this study are available on request from the corresponding author.

Acknowledgments

We thank Marcelo Burstein Gray for his assistance in collecting tailing samples. We also extend acknowledgments to the reviewers for the corrections and suggestions, which contributed significantly to the improvement of the manuscript.

Conflicts of Interest

The authors declare no conflict of interest.

Appendix A

Figure A1. Representative X-ray diffraction (XRD) pattern of paste tailing samples (T4). The presence of crystalline phases is observed, although dominance of amorphous minerals is also evidenced.
Minerals 11 01436 g0a1
Figure A2. SEM-EDS analysis of paste tailings. Representative 3-D SEM image of T2 sample is shown [36].
Minerals 11 01436 g0a2

References

  1. SERNAGEOMIN. Datos Públicos Deposito de Relaves [WWW Document]. 2018. Available online: https://www.sernageomin.cl/datos-publicos-deposito-de-relaves/ (accessed on 6 October 2021).
  2. Araya, N.; Kraslawski, A.; Cisternas, L.A. Towards mine tailings valorization: Recovery of critical materials from Chilean mine tailings. J. Clean. Prod. 2020, 263, 121555. [Google Scholar] [CrossRef]
  3. Nasrabadi, T.; Nabi Bidhendi, G.R.; Karbassi, A.R.; Hoveidi, H.; Nasrabadi, I.; Pezeshk, H.; Rashidnejad, F. Infuence of Sungun copper mine on groundwater quality, NW Iran. Environ. Geol. 2009, 58, 693–700. [Google Scholar] [CrossRef]
  4. Blowes, D.; Ptacek, C.; Jambor, J.; Weisener, C. The Geochemistry of Acid Mine. Environ. Geochem. 2005, 9, 149. [Google Scholar]
  5. Johnson, D.B.; Hallberg, K.B. Acid mine drainage remediation options: A review. Sci. Total Environ. 2005, 338, 3–14. [Google Scholar] [CrossRef]
  6. Nishimoto, N.; Yamamoto, Y.; Yamagata, S.; Igarashi, T.; Tomiyama, S. Acid Mine Drainage Sources and Impact on Groundwater at the Osarizawa Mine, Japan. Minerals 2021, 11, 998. [Google Scholar] [CrossRef]
  7. Yamaguchi, K.; Tomiyama, S.; Igarashi, T.; Yamagata, S.; Ebato, M.; Sakoda, M. Improvement in pH and Total Iron Concentration of Acid Mine Drainage after Backfilling: A Case Study of an Underground Abandoned Mine in Japan. Minerals 2021, 11, 1297. [Google Scholar] [CrossRef]
  8. Elghali, A.; Benzaazoua, M.; Bouzahzah, H.; Bussière, B. Laboratory Study on the Effectiveness of Limestone and Cementitious Industrial Products for Acid Mine Drainage Remediation. Minerals 2021, 11, 413. [Google Scholar] [CrossRef]
  9. Elghali, A.; Benzaazoua, M.; Bussière, B.; Genty, T. In Situ Effectiveness of Alkaline and Cementitious Amendments to Stabilize Oxidized Acid-Generating Tailings. Minerals 2019, 9, 314. [Google Scholar] [CrossRef] [Green Version]
  10. Leiva, E.; Leiva-Aravena, E.; Vargas, I. Acid water neutralization using microbial fuel cells: An alternative for acid mine drainage treatment. Water 2016, 8, 536. [Google Scholar] [CrossRef] [Green Version]
  11. Rodríguez, C.; Leiva, E. Enhanced heavy metal removal from acid mine drainage wastewater using double-oxidized multiwalled carbon nanotubes. Molecules 2020, 25, 111. [Google Scholar] [CrossRef] [PubMed] [Green Version]
  12. Rodríguez, C.; Tapia, C.; Leiva-Aravena, E.; Leiva, E. Graphene oxide–ZnO nanocomposites for removal of aluminum and copper ions from acid mine drainage wastewater. Int. J. Environ. Res. Public Health 2020, 17, 6911. [Google Scholar] [CrossRef]
  13. Chen, J.; Li, X.; Jia, W.; Shen, S.; Deng, S.; Ji, B.; Chang, J. Promotion of bioremediation performance in constructed wetland microcosms for acid mine drainage treatment by using organic substrates and supplementing domestic wastewater and plant litter broth. J. Hazard. Mater. 2021, 404, 124125. [Google Scholar] [CrossRef] [PubMed]
  14. Kefeni, K.K.; Msagati, T.A.M.; Mamba, B.B. Acid mine drainage: Prevention, treatment options, and resource recovery: A review. J. Clean. Prod. 2017, 151, 475–493. [Google Scholar] [CrossRef]
  15. Liu, W.; Chen, X.; Li, W.; Yu, Y.; Yan, K. Environmental assessment, management and utilization of red mud in China. J. Clean. Prod. 2014, 84, 606–610. [Google Scholar] [CrossRef]
  16. Mymrin, V.; Alekseev, K.; Fortini, O.M.; Aibuldinov, Y.K.; Pedroso, C.L.; Nagalli, A.; Winter, E., Jr.; Catai, R.E.; Costa, E.B.C. Environmentally clean materials from hazardous red mud, ground cooled ferrous slag and lime production waste. J. Clean. Prod. 2017, 161, 376–381. [Google Scholar] [CrossRef]
  17. Davies, M. Filtered dry stacked tailings e the fundamentals. In Proceedings of the Tailings and Mine Waste, Vancouver, BC, Canada, 6–9 November 2011. [Google Scholar]
  18. Hua, Y.; Heal, K.V.; Friesl-Hanl, W. The use of red mud as an immobiliser for metal/metalloid-contaminated soil: A review. J. Hazard. Mater. 2017, 325, 17–30. [Google Scholar] [CrossRef] [PubMed] [Green Version]
  19. Cincilla, W.A.; Landriault, D.A.; Verburg, R. Application of paste technology to surface disposal of mineral wastes. In Proceedings of the Fourth International Conference on Tailings and Mine Waste, Fort Collins, CO, USA, 13–17 January 1997; pp. 343–356. [Google Scholar]
  20. Henriquez, J.; Simms, P. Dynamic imaging and modelling of multilayer deposition of gold paste tailings. Miner. Eng. 2009, 22, 128–139. [Google Scholar] [CrossRef]
  21. Brackebusch, F.; Shillabeer, J. Use of paste for tailings disposal. In Proceedings of the Sixth International Symposium on Mining with Backfill; Bloss, M., Ed.; The Australasian Institute of Mining and Metallurgy: Brisbane, Australia, 1998; pp. 53–58. [Google Scholar]
  22. Newman, P.; Landriault, D. The Use of Paste Technology in the Surface Disposal of Mineral Waste; Waste Minimisation and Recycle: Birmingham, UK, 1997. [Google Scholar]
  23. Trampus, B.C.; Franca, S.C. Performances of two flocculants and their mixtures for red mud dewatering and disposal based on mineral paste production. J. Clean. Prod. 2020, 257, 120534. [Google Scholar] [CrossRef]
  24. Arslan, S.; Ucbeyiay, H.; Celikel, B.; Baygul, M.; Avcu, S.; Demir, G.K. ETI aluminum red mud characteristics and evaluation of dewatering performance. In Proceedings of the Bauxite Residue Valorization and Best Practices Conference, Leuven, Belgium, 4–7 October 2015. [Google Scholar]
  25. Meggyes, T.; Debreczeni, A. Paste technology for tailings management. Land Contam. Reclamat. 2006, 14, 815–827. [Google Scholar] [CrossRef]
  26. Trampus, B.C.; França, S.C.A. Reologia aplicada ao desaguamento de lama vermelha como suporte para a produçao de pasta mineral. In Proceedings of the XXVII Encontro Nacional de Tratamento de Minerios e Metalurgia Extrativa, Belém, Pará, Brasil, 23–27 October 2017. [Google Scholar]
  27. Hogg, R. Flocculation and dewatering. Int. J. Miner. Process. 2000, 58, 223–236. [Google Scholar] [CrossRef]
  28. Guezennec, A.G.; Michel, C.; Bru, K.; Touze, S.; Desroche, N.; Mnif, I.; Motelica-Heino, M. Transfer and degradation of polyacrylamide based flocculants in hydrosystems: A review. Environ. Sci. Pollut. Res. 2015, 22, 6390–6406. [Google Scholar] [CrossRef] [Green Version]
  29. Bortoleto, D.A.; Camargos, M.A.; Davo, J.B. Powder flocculant application for Bayer residue sedimentation in the aluminium industry. Holos 2017, 6, 217–223. [Google Scholar] [CrossRef] [Green Version]
  30. Gregory, J.; Barany, S. Adsorption and flocculation by polymers and polymer mixtures. Adv. Colloid Interface Sci. 2011, 169, 1–12. [Google Scholar] [CrossRef] [PubMed]
  31. Boger, D.V. Rheology of slurries and environmental impacts in the mining industry. Annu. Rev. Chem. Biomol. Eng. 2013, 4, 239–257. [Google Scholar] [CrossRef] [PubMed]
  32. Uhlherr, P.H.T.; Guo, J.; Fang, T.N.; Tiu, C. Static measurement of yield stress using a cylindrical penetrometer. Korea Aust. Rheol. J. 2002, 14, 17–23. [Google Scholar]
  33. Bhattacharya, S. Yield stress and time-dependent rheological properties of mango pulp. J. Food Sci. 1999, 64, 1029–1033. [Google Scholar] [CrossRef]
  34. Cooke, R. Thickened and paste tailings pipeline systems: Design procedure–Part 1. In Proceedings of the Ninth International Seminar on Paste and Thickened Tailings; Australian Centre for Geomechanics: Crawley, Australia, 2006; pp. 371–381. [Google Scholar]
  35. Clayton, S.; Grice, T.G.; Boger, D.V. Analysis of the slump test for on-site yield stress measurement of mineral suspensions. Int. J. Min. Process. 2003, 70, 3–21. [Google Scholar] [CrossRef]
  36. Leiva, E.; Cayazzo, M.; Dávila, L.; Torres, M.; Ledezma, C. Acid Mine Drainage Dynamics from a Paste Tailing Deposit: Effect of Sulfate Content on the Consistency and Chemical Stability after Storage. Metals 2021, 11, 860. [Google Scholar] [CrossRef]
  37. USEPA. Method 3050B. Acid digestion of sediments, sludges, and soils. In Test Methods for Evaluating Solid Waste; USEPA: Washington, DC, USA, 1996. [Google Scholar]
  38. Miller, S.D. Predicting Acid Drainage. Groundwork; Australian Minerals and Energy Environment Foundation: Melbourne, Australia, 1998; Volume 2, pp. 8–9.
  39. Sobek, A.A. Field and Laboratory Methods Applicable to Overburdens and Minesoils; Industrial Environmental Research Laboratory, Office of Research and Development, US Environmental Protection Agency: Washington, DC, USA, 1978. [Google Scholar]
  40. Elghali, A.; Benzaazoua, M.; Bouzahzah, H.; Bussière, B.; Villarraga-Gómez, H. Determination of the available acid-generating potential of waste rock, part I: Mineralogical approach. Appl. Geochem. 2018, 99, 31–41. [Google Scholar] [CrossRef]
  41. Bouzahzah, H.; Benzaazoua, M.; Plante, B.; Bussiere, B. A quantitative approach for the estimation of the “fizz rating” parameter in the acid-base accounting tests: A new adaptations of the Sobek test. J. Geochem. Explor. 2015, 153, 53–65. [Google Scholar] [CrossRef]
  42. MEND. Prediction Manual for Drainage Chemistry from Sulphidic Geological Materials. MEND Report 1.20.1; Report Prepared by Price, W.A. December 2009, p. 579. Available online: http://mend-nedem.org/wp-content/uploads/1.20.1_PredictionManual.pdf (accessed on 14 June 2021).
  43. Morin, K.A.; Hutt, N.M. Observed preferential depletion of neutralization potential over sulfide minerals in kinetic tests: Site-specific criteria for safe NP/AP ratios. In Proceedings of the Third International Conference on the Abatement of Acidic Drainage, Pittsburgh, PA, USA, 24–29 April 1994. [Google Scholar]
  44. Mudd, G.M.; Boger, D.V. The ever growing case for paste and thickened tailings—towards more sustainable mine waste management. J. Aust. Inst. Min. Metall. 2013, 2, 56–59. [Google Scholar]
  45. Edraki, M.; Baumgartl, T.; Manlapig, E.; Bradshaw, D.; Franks, D.M.; Moran, C.J. Designing mine tailings for better environmental, social and economic outcomes: A review of alternative approaches. J. Clean. Prod. 2014, 84, 411–420. [Google Scholar] [CrossRef]
  46. Sofra, F.; Boger, D.V. Environmental rheology for waste minimisation in the minerals industry. Chem. Eng. J. 2002, 86, 319–330. [Google Scholar] [CrossRef]
  47. Sofra, F.; Boger, D.V. Rheology for thickened tailings and paste e history, stateof-the-art and future directions. In Proceedings of the 14th International Seminar on Paste and Thickened Tailings, Perth, Australia, 5–7 April 2011; pp. 121–133. [Google Scholar]
  48. Kwak, M.; James, D.F.; Klein, K.A. Flow behaviour of tailings paste disposal. Int. J. Miner. Process. 2005, 77, 139–153. [Google Scholar] [CrossRef]
  49. Crowder, J.J. Deposition, Consolidation, and Strength of a Non-Plastic Tailings Paste for Surface Disposal. Ph.D. Thesis, University of Toronto, Toronto, ON, Canada, 2004. [Google Scholar]
  50. Liddell, P.V.; Boger, D.V. Yield Stress Measurements with the vane. J. Nonnewton. Fluid Mech. 1996, 63, 235–261. [Google Scholar] [CrossRef]
  51. Blowes, D.W.; Ptacek, C.J.; Jambor, J.L.; Weisener, C.G. The Geochemistry of Acid Mine Drainage. In Treatise on Geochemistry; Elsevier Inc.: Amsterdam, The Netherlands, 2003; Volume 9, pp. 149–204. [Google Scholar]
  52. Bryan, R. Drying and Oxidation of Surface-Disposed Paste Tailings. Ph.D. Thesis, Carleton University, Ottawa, ON, Canada, 2009. [Google Scholar]
  53. Chafy, A.; Tidswell, M.; Lane, C. Case study: Project start-up for thickened graphite tailings, storage and water recovery strategies. In Proceedings of the 21st International Seminar on Paste and Thickened Tailings; Australian Centre for Geomechanics: Crawley, Australia, 2018; pp. 531–544. [Google Scholar]
  54. Deschamps, T.; Benzaazoua, M.; Bussiere, B.; Aubertin, M.; Belem, T. Microstructural and geochemical evolution of paste tailings in surface disposal conditions. Miner. Eng. 2008, 21, 341–353. [Google Scholar] [CrossRef]
  55. Simms, P.; Grabinsky, M.; Zhan, G. Modelling evaporation of paste tailings from the Bulyanhulu mine. Can. Geotech. J. 2007, 44, 1417–1432. [Google Scholar] [CrossRef]
  56. Yanful, E.K. Oxygen diffusion through soil covers on sulphidic mine tailings. J. Geotech. Eng. 1993, 119, 1207–1228. [Google Scholar] [CrossRef]
  57. Dold, B.; Fontboté, L. Element cycling and secondary mineralogy in porphyry copper tailings as a function of climate, primary mineralogy, and mineral processing. J. Geochem. Explor. 2001, 74, 3–55. [Google Scholar] [CrossRef]
  58. Ruan, Z.; Wu, A.; Bürger, R.; Betancourt, F.; Wang, Y.; Wang, Y.; Jiao, H.; Wang, S. Effect of interparticle interactions on the yield stress of thickened flocculated copper mineral tailings slurry. Powder Technol. 2021, 392, 278–285. [Google Scholar] [CrossRef]
  59. Fourie, A.B. Material Characteristics. In Proceedings of the High Density & Paste Seminar, Santiago, Chile, 9–11 April 2002. [Google Scholar]
  60. Verburg, R.; Johnson, B.; Fordham, M.; Logsdon, M. A rapid and costeffective method for bench screening of geochemical performance and disposal options for high-sulphide tailings. In Proceedings of the 6l International Conference on Acid Rock Drainage, Cairns, Australia, 12–18 July 2003. [Google Scholar]
  61. Ran, A.; Pérez, N.; Dahan, O. Real Time Monitoring of Infiltration and contamination from Paste Tailing Site. In Proceedings of the 23rd International Conference on Paste, Thickened and Filtered Tailings—PASTE 2020; Gecamin Publications: Santiago, Chile, 2020. [Google Scholar]
  62. Theron, M.; Addis, P.C.; Wates, J.A.; Martin, V. Bulyanhulu mine (Tanzania) paste tailings facility: Relating the unsaturated properties of gold tailings to rate of rise. In Proceedings of the International Seminar on Paste and Thickened Tailings 2005; Australian Centre for Geomechanics: Crawley, Australia, 2005; pp. 219–229. [Google Scholar]
  63. Theriault, J.A.; Frostiak, J.; Welch, D. Surface disposal of past tailings at the Bulyanhulu gold mine, Tanzania. In Proceedings of Sudbury Mining and Environment Conference; Spiers, G., Beckett, P., Conroy, H., Eds.; Centre for Environmental Monitoring, Laurentian University: Sudbury, ON, Canada, 2003; p. 149. [Google Scholar]
  64. Chamberlain, C.M.; Wilkinson, J.J.; Herrington, R.J.; Boyce, A.J. The Bulyanhulu enigma: An atypical Archaean lode gold deposit—Evidence for a pre-ore magmatic input. Trans. Inst. Min. Metall. 2003, 112B, 112–113. [Google Scholar]
  65. Nkuli, G. Effects of Mining at Bulyanhulu Gold Mine (BGM) on the Water Quality of Bulyanhulu River: Shinyanga-Tanzania. 2012. Available online: https://ir.uz.ac.zw/handle/10646/1021 (accessed on 10 October 2021).
  66. Khoeurn, K.; Sasaki, A.; Tomiyama, S.; Igarashi, T. Distribution of zinc, copper, and iron in the tailings dam of an abandoned mine in Shimokawa, Hokkaido, Japan. Mine Water Environ. 2019, 38, 119–129. [Google Scholar] [CrossRef]
  67. Valente, T.; Ferreira, M.J.; Grande, J.A.; de la Torre, M.L.; Borrego, J. pH, electric conductivity and sulfate as base parameters to estimate the concentration of metals in AMD using a fuzzy inference system. J. Geochem. Explor. 2013, 124, 22–28. [Google Scholar] [CrossRef]
  68. Olıas, M.; Nieto, J.M.; Sarmiento, A.M.; Cerón, J.C.; Cánovas, C.R. Seasonal water quality variations in a river affected by acid mine drainage: The Odiel River (Activities South West Spain). Sci. Total Environ. 2004, 333, 267–281. [Google Scholar] [CrossRef]
Figure 1. Location of Florida gold-silver Mine, south of Santiago, central Chile. Chemical real-time monitoring was performed in the thickener and in a control well (red marks) located in the mining area. For the analysis of the tailing deposit, tailing samples (T1–T6) were sampled in the points indicated in the figure (white marks).
Minerals 11 01436 g001
Figure 2. Tailing solids content of the Florida mine tailings at the inlet and outlet of the thickener (with the addition of flocculant dosage). The flocculant used for thickening was ORIFLOC AP 2020, a polyacrylamide powder, with a low anionic charge and high molecular weight. The added dosage was 28.3 ± 6.9 g/ton.
Minerals 11 01436 g002
Figure 3. Yield stress measurements (a) and slump values (b) of the paste tailings after flocculant dosage. The slump tests were used to obtain the yield stress from thickened tailings. The added flocculant (ORIFLOC AP 2020) dosage was 28.3 ± 6.9 g/ton.
Minerals 11 01436 g003aMinerals 11 01436 g003b
Figure 4. Evaluation of the net acid generation potential with the NAG test. NAG pH values are shown on a linear scale and NAG values on a logarithmic scale. On the abscissa axis, the tailings samples are represented referentially in a NAG value of 0.015 (detection limit of the method).
Minerals 11 01436 g004
Figure 5. Results of the ABA test. AP and NNP are expressed in kg CaCO3/ton. For interpretation, vertical lines in NNP at −20 and +20 kg CaCO3/ton are shown.
Minerals 11 01436 g005
Figure 6. Evolution of cumulative concentrations of sulfate (a) and iron (b) collected throughout the humidity cells [36].
Minerals 11 01436 g006
Figure 7. Analysis of the time series of real-time electrical conductivity (a) and pH (b) of the thickener and the relationship with the sulfate concentrations of the thickener and the control well. The time-series data were measured hourly.
Minerals 11 01436 g007
Figure 8. Time-series of smoothed electrical conductivity data (a) and pH data (b) of the thickener and relationship to the smoothed sulfate concentrations of the thickener and the control well. The pH and EC time series were smoothed using a 168-point moving average corresponding to a 7-day period.
Minerals 11 01436 g008
Table 1. Chemical composition of paste tailings samples.
ElementT1
0–10 cm
T1
10–20 cm
T1
20–30 cm
T2
0–10 cm
T2
10–20 cm
T2
20–30 cm
T3
0–10 cm
T3
10–20 cm
T3
20–30 cm
S (wt%)1.491.361231.431.551.311.411.671.52
Fe (wt%)2.812.842.872.842.912.872.822.842.88
Si (wt%)16.6116.7216.5115.6715.8115.9417.2517.3717.49
Al (wt%)1241.341.431.311.211.111231.331.41
Mn (wt%)1.811.831.871.931.901.861.901.931.86
Ca (wt%)2.482.422.392.402.442.472.382.44246
Zn (ppm)637964436508629162286164649964416379
Pb (ppm)327333073343316231963233316431303098
Cu (ppm)399412385483471461392380364
Cr (ppm)505445ND4132564125
Ni (ppm)ND *NDNDNDNDNDNDNDND
Sn (ppm)81220253110SNDND
Cd (ppm)7NDNDNDNDND402614
Ag (ppm)NDND2431NDNDND1814
ElementT4
0–10 cm
T4
10–20 cm
T4
20–30 cm
T5
0–10 cm
T5
10–20 cm
T5
20–30 cm
T6
0–10 cm
T6
10–20 cm
T6
20–30 cm
S (wt%)2.251.861.571.330.940.941.541.771.73
Fe (wt%)3.833.652974.683.823.583.693.673.60
Si (wt%)19.916.818.420.817.819.318.017.017.0
Al (wt%)1.611.361.521.461.381.441.601.471.41
Mn (wt%)2.983.322782.972.902.781.882.23225
Ca (wt%)3.272.962.844.023.703.772.523.133.07
Zn (ppm)730293854767537834413225576182188253
Pb (ppm)434358412964176821722444393346104480
Cu (ppm)526532355419372361540545628
Cr (ppm)5153436610079534546
Ni (ppm)NDNDNDNDNDNDNDNDND
Sn (ppm)831NDND1423NDND5
Cd (ppm)46851019712404425
Ag (ppm)29413141NDND3415ND
* ND: not detectable.
Publisher’s Note: MDPI stays neutral with regard to jurisdictional claims in published maps and institutional affiliations.

