Article

Mudrocks Lithofacies Characteristics and North-South Hydrocarbon Generation Difference of the Shahejie Formation in the Dongpu Sag

1
State Key Laboratory of Marine Geology, Tongji University, Shanghai 200092, China
2
College of Marine Geosciences, Ocean University of China, Qingdao 266100, China
3
SINOPEC Zhongyuan Oilfield Company, Puyang 457001, China
*
Authors to whom correspondence should be addressed.
Submission received: 19 January 2021 / Revised: 13 May 2021 / Accepted: 14 May 2021 / Published: 19 May 2021
(This article belongs to the Special Issue Characterisation of Mudrocks: Textures and Mineralogy)

Abstract

:
Lacustrine mudrocks are composed of minerals and organic matter (OM). The origin and preservation of OM are two controlling factors of the hydrocarbon generation capacity of mudrocks. It is a key method in source rock research to study the deposition process from the view of the OM and sedimentary environment. Following this idea, the reason for the discrepancy in hydrocarbon production between the northern and the southern part of Dongpu Sag is analyzed and discussed. The lacustrine mudrocks of the Shahejie Formation in Dongpu Sag are sampled and analyzed for information about mineralogy, microstructure, elemental geochemistry, and OM characteristics. The mudrocks are then divided into three lithofacies: silt-rich massive mudstone, homogeneous massive mudstone, and laminated mudstone. Each lithofacies shows distinct characteristics, and the hydrocarbon generation ability of them increases in sequence. Further discussion that the differences in hydrocarbon generation are caused by the sedimentary environment. The water depth, salinity, and reducibility of the sedimentary environments of these three lithofacies increase in sequence, as well. The correlation analysis indicates that it is the environment that controls the origin, accumulation, and preservation of OM in each lithofacies and then causes the great differences in hydrocarbon generation capacity. In Dongpu Sag, the proportion of laminated mudstone is much higher in the northern part, which leads to greater oil/gas production than the southern part. In research of source rocks, both the lithofacies characteristics and the sedimentary environments that control the characteristics should be studied.

1. Introduction

The Dongpu Sag is one of the important exploration areas of the Jiyang Depression in East China. Many exploration practices have found that the hydrocarbon production of the northern part reaches 9 times larger than the southern part in Dongpu Sag. What causes such a great difference? The answer could be obtained from studies on the deposition process of the source rocks. The source rocks are of various lithofacies, and each lithofacies shows distinct mineral and organic matter (OM) composition and belongs to a specific sedimentary environment.
During the sedimentary period, the environmental factors control the deposition of the source rocks: on the one hand, the sedimentary environment greatly influences the deposition of OM, and the OM in rocks are multi-source, consisting of both terrigenous higher plants OM and aquatic amorphous OM [1]. In shallow water environment, the OM in sediments is dominated by the terrigenous component [2,3]; as the water depth and the distance from source area increase, the aquatic OM increases and gradually becomes the chief component of OM in sediments [4]. In addition, the degree of water eutrophication and the salinity would affect the paleoproductivity and the enrichment of OM [5,6], and the redox condition would determine the preservation state of OM [7,8]. On the other hand, the environment controls the deposition of mudrocks petrologically. In mudrocks, both the deposition process of minerals and the mineral-OM relationship are influenced by environment factors. In environments lacking in OM, the clay minerals precipitate via electrochemical action [9]; in environments rich in OM, the clay minerals are able to absorb and aggregate OM, and the two are able to settle down together [10]. Additionally, the sedimentary environmental factors, such as hydrodynamic condition, and periodical changes in water environment could affect the structural features of the rocks: for example, the massive structure in mudrocks could resulted from turbidity currents or gravity flows [11,12]. The laminated structure is generally formed in a periodical changing environment [13]. Thus, the various microstructures in mudrocks are formed. As can be seen, sedimentary environment controls both the enrichment of OM and the deposition of mudrocks. It is of great significance to analyze the environment in studies on deposition process and hydrocarbon generation of source rocks.
A large number of studies and analyses have been carried out on the source rocks of Dongpu Sag. Some studies focus on the OM characteristics and the hydrocarbon generation potential evaluation of the source rocks in different strata [14,15]. Some other studies conduct the classification of the lithofacies on the source rocks and make clear the sedimentary environments of the lithofacies [16,17]. However, there is still a series of problems to be solved in the study of Dongpu Sag. Compared to studies on the lithofacies characteristics, there are less studies about the influences of depositional environments on the origins, types, and enrichment patterns of OM. Starting with lithofacies analysis, this paper attempts to investigate the sedimentary environment and OM characteristics of the lithofacies so as to figure out the influences of environment on the origin, type, and enrichment of OM. On this basis, the discrepancy in hydrocarbon production between the northern and the southern part of Dongpu Sag are to be explained through discussion of lithofacies proportion difference between the two parts, which will help to offer a better explanation to the north-south hydrocarbon production difference in Dongpu Sag and provide a new idea for research on source rocks deposition.

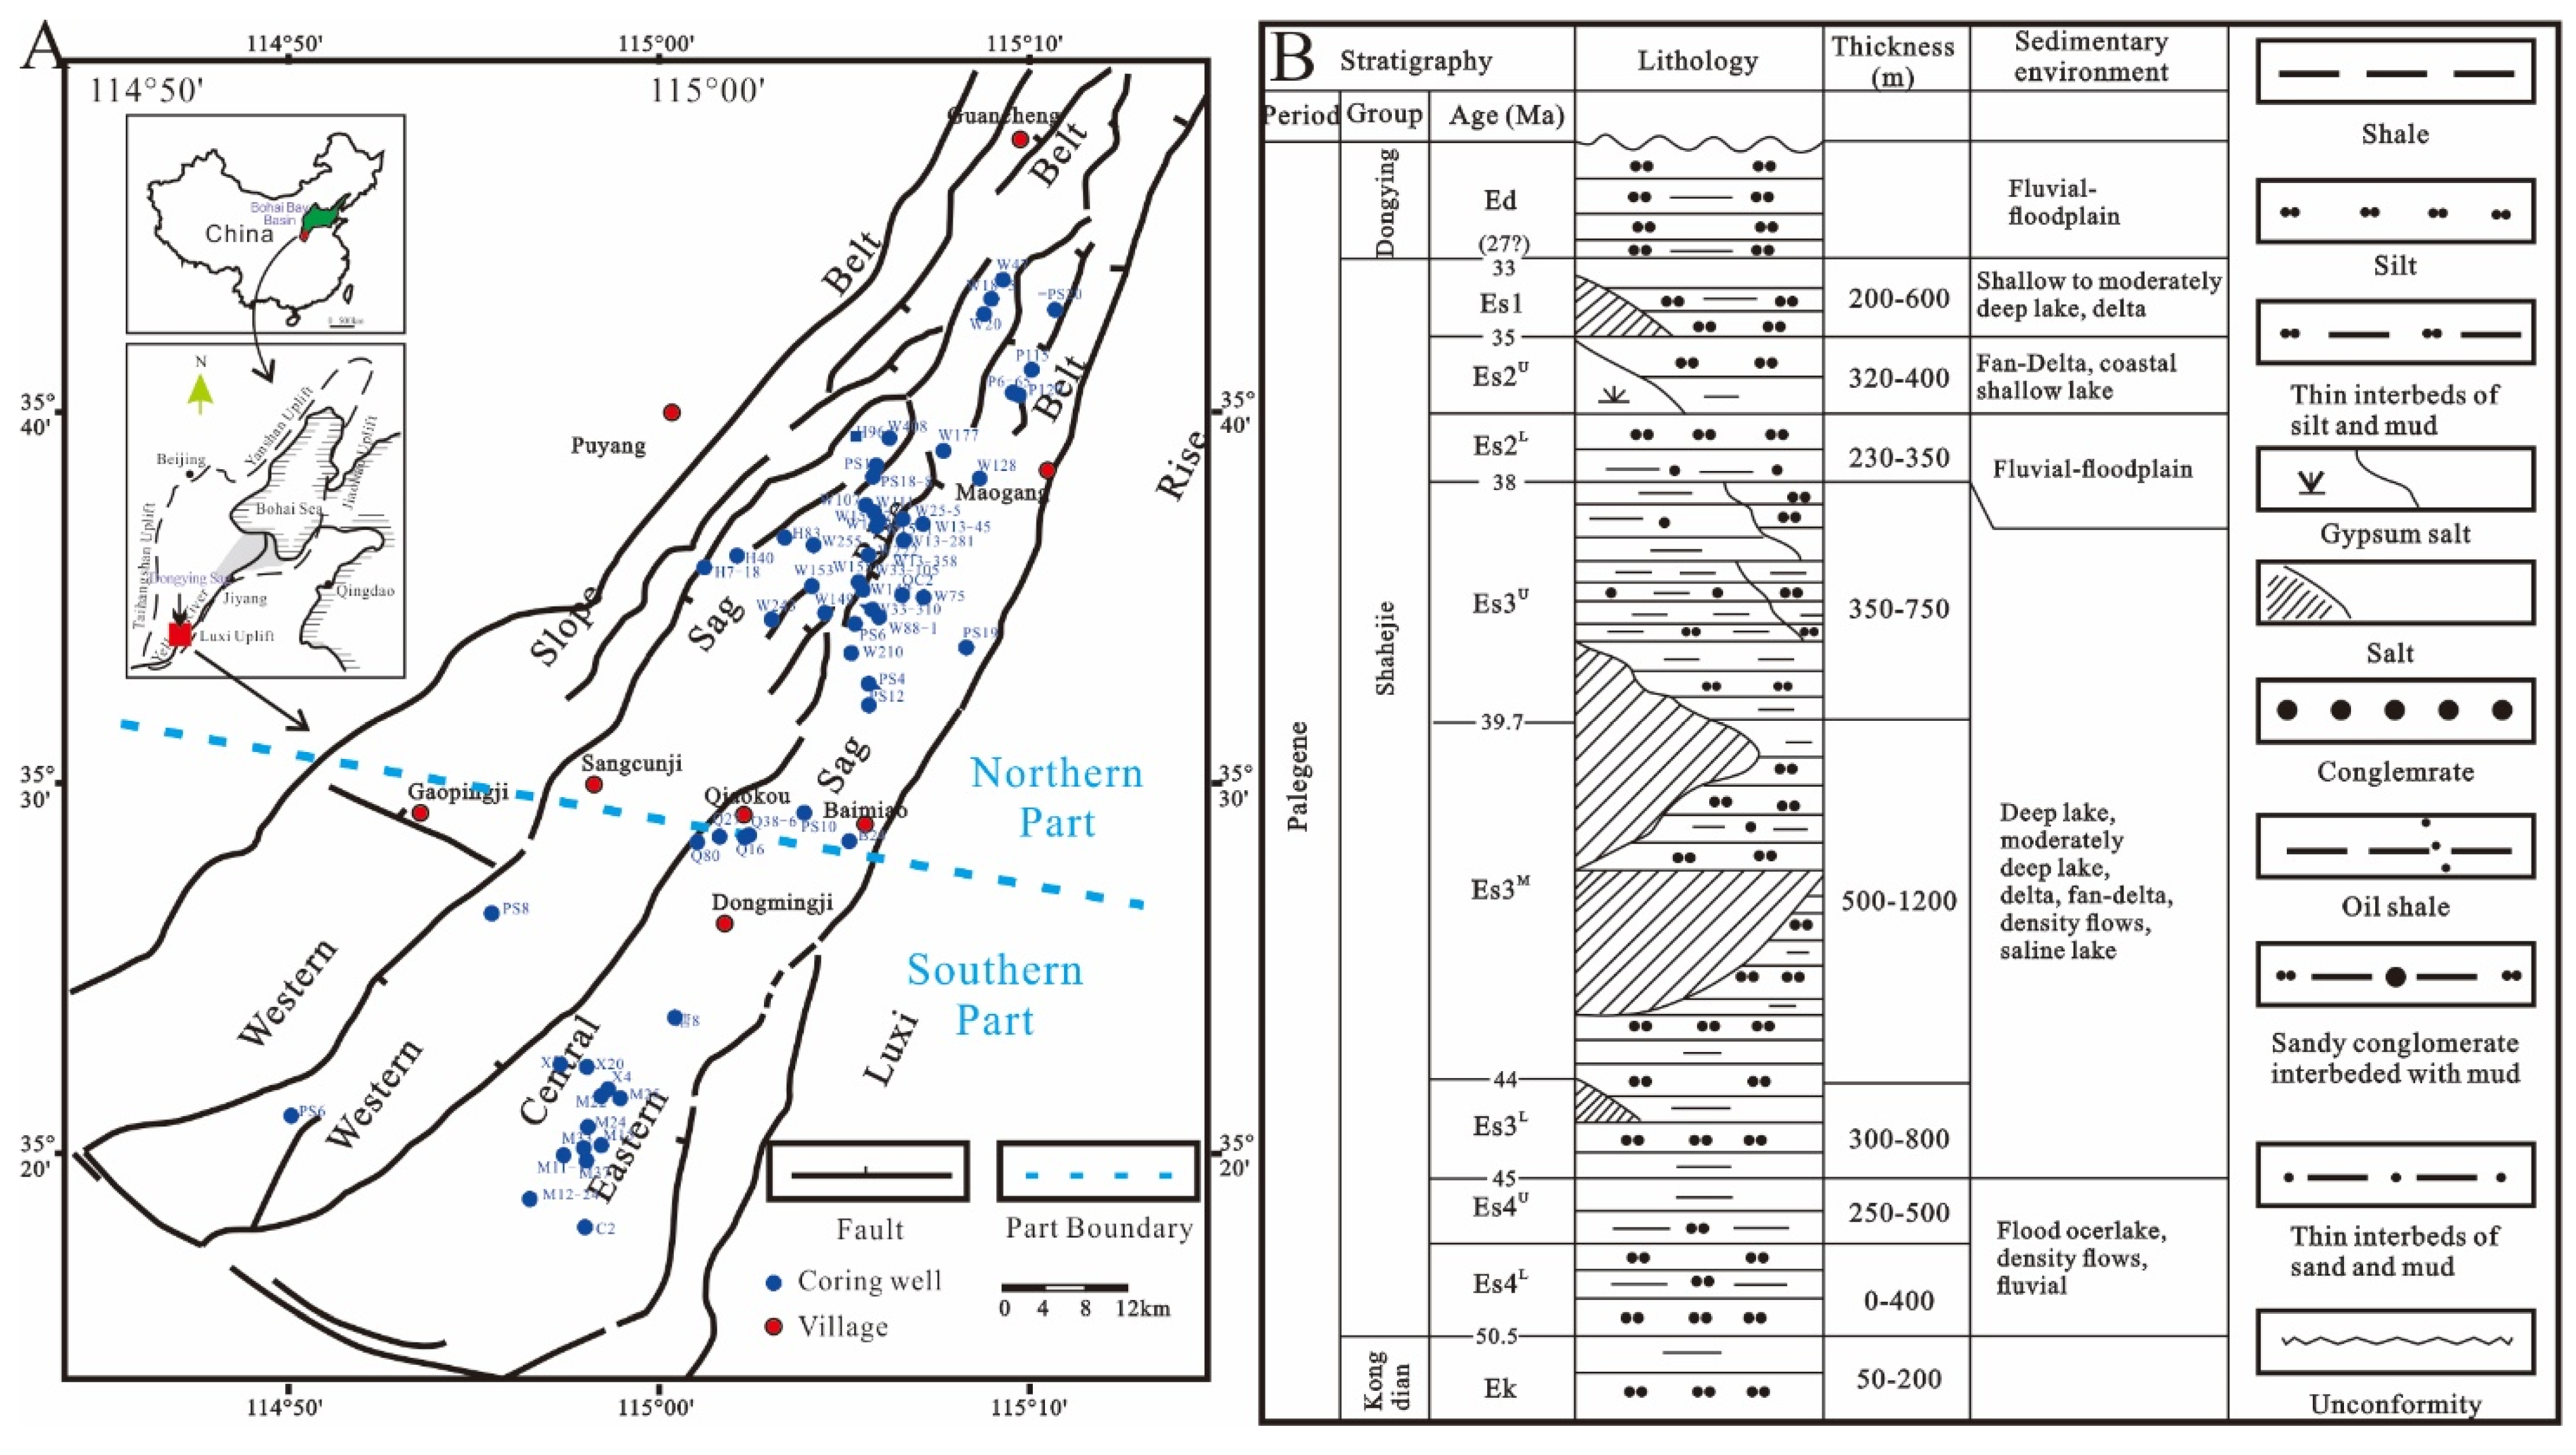
2. Geological Background

Dongpu Sag, located in the southeastern part of Linqing Depression in Bohai Bay Basin, is a Cenozoic fault basin formed by tension and faults. The Sag generally shows a spatial trend of NNE and a tectonic feature of “two sags, one uplift, one steep and one slope” in the east-west direction. In the north-south direction, the Dongpu Sag is divided into the southern and the northern parts by the line of the south of Baimiao-Qiaokou-Sangcunji [18] (Figure 1).
As a part of the Bohai Bay oil/gas bearing area, the Dongpu Sag is both rich in oil and gas resources. However, current exploration results show that over 90% of the oil resources and nearly 80% of the gas resources of the whole Sag are distributed in the northern part. The reasons for the north-south difference and the exploration potential of the south part are getting more and more attention and are worth studying.
The most important source rock sets of the Dongpu Sag are the massive lacustrine mudstones, developed during the period of Es3 to Es4 (Figure 1b). During this period, the ancient lake basin underwent a series of evolutionary processes: The lake basin expanded during the period of Es4, developing from a shallow lake to a deep salt lake, with groups of red and gray mudrocks depositing down. During the period of Es3, the main sediment features were the thick layers of dark sandstones and mudstones, which belonged to deep-water salt lake facies. When it came to late Es3, the basin gradually shrank, and a set of purple-red sandstones and mudrocks was formed as the top of this stratum series [19].

3. Materials and Methods

A total of 141 samples of the Shahejie Formation (the Es3u to the Es4u sub-members) were collected from over 60 wells (Figure 1) in the Dongpu Sag, covering a depth from 2100 to 5300 m. In total, 94 of the samples were from the northern part of the Sag, while the other 47 samples were from the southern part of the Sag. While sampling, we tried to pick the samples from different wells by same standards to avoid the variance of samples. The samples were analyzed by tests needed for the current study, including thin-section observation, pyrolysis analysis, X-ray diffraction, ICP-MS, and ICP-AES.

3.1. Thin-Section Observation

Comprehensive petrographical examination was performed on the samples using microscope (Eclipse 200, Nikon, Shanghai, China). The thin sections were analyzed under optical plane-polarized and fluorescent light at magnifications ranging from 25× to 200×.

3.2. X-Ray Diffraction

The mineral composition of the samples were estimated using X-ray diffraction (XRD) analysis. The XRD analyses were conducted using diffractometer (Rigaku D/max-III X-ray diffractometer, Rigaku Corporation, Tokyo, Japan) at conditions of 20 mA and 40 kV with a curved graphite monochromator. The scanning speed was 2°(2θ)/min. The scanning angle was 5–40°.The proximate analysis was measured by using GB/T 212-2008 (corresponding to ISO 11722-2013, ISO 1171-2010, ISO 562-2010). The side-packing method proposed by the National Bureau of Standards was used to prepare the powder (i.e., non-oriented) mounts [20,21]. Mineral identification was performed using the Jade software version 9.0 (MDI, Livermore, CA, USA), and mineral contents were semi-quantitatively estimated by the whole-pattern fitting method, using Siroquant software (Sietronics Pty Ltd, ACT, Australia). Replicate analyses of a few selected samples yielded a precision of approximately 2%.

3.3. Elements Measurement

For major and trace element concentrations, a two-step acid-digestion method (first with HNO3 and secondly with mixtures of HNO3, HF, and HClO4) was used prior to determination to retain any volatile elements of the studied samples in solution. The resulting solutions were analyzed by inductively coupled plasma atomic-emission spectrometry (Thermo ICP-IRIS Intrepid II, ThermoFisher, Shanghai, China) for major element concentrations and by inductively coupled plasma mass spectrometry (Thermo X-Series, ThermoFisher, Shanghai, China) for trace element concentration.

3.4. Pyrolysis

The samples were powdered to 100 mesh after surface cleaning and pyrolyzed using a Rock-Eval 6 instrument (RE6, Vinci Technologies, Nanterre, France). A series of successive stages were performed. First, 50 mg of each sample was subjected to a temperature of 300 °C and a hydrocarbon (peak S1, mg/g of rock) was qualified. Second, a programmed pyrolysis was performed at temperatures increasing from 300 °C to 650 °C to qualify the potential hydrocarbon (peak S2, mg/g of rock). Simultaneously, oxygenated products, including CO and CO2, were measured; these products were referred to as peak S3 (mg CO2/g of rock) at temperatures between 300 °C and 390 °C, and residual carbon at 600 °C (which was referred to as peak S4 (mg CO2/g of rock)) was recorded. A number of parameters, including TOC, the hydrogen index (HI), and the oxygen index (OI), were assessed at S1, S2, S3, and S4. The value of Tmax corresponds to the temperature at the maximum S2 [10].

4. Results

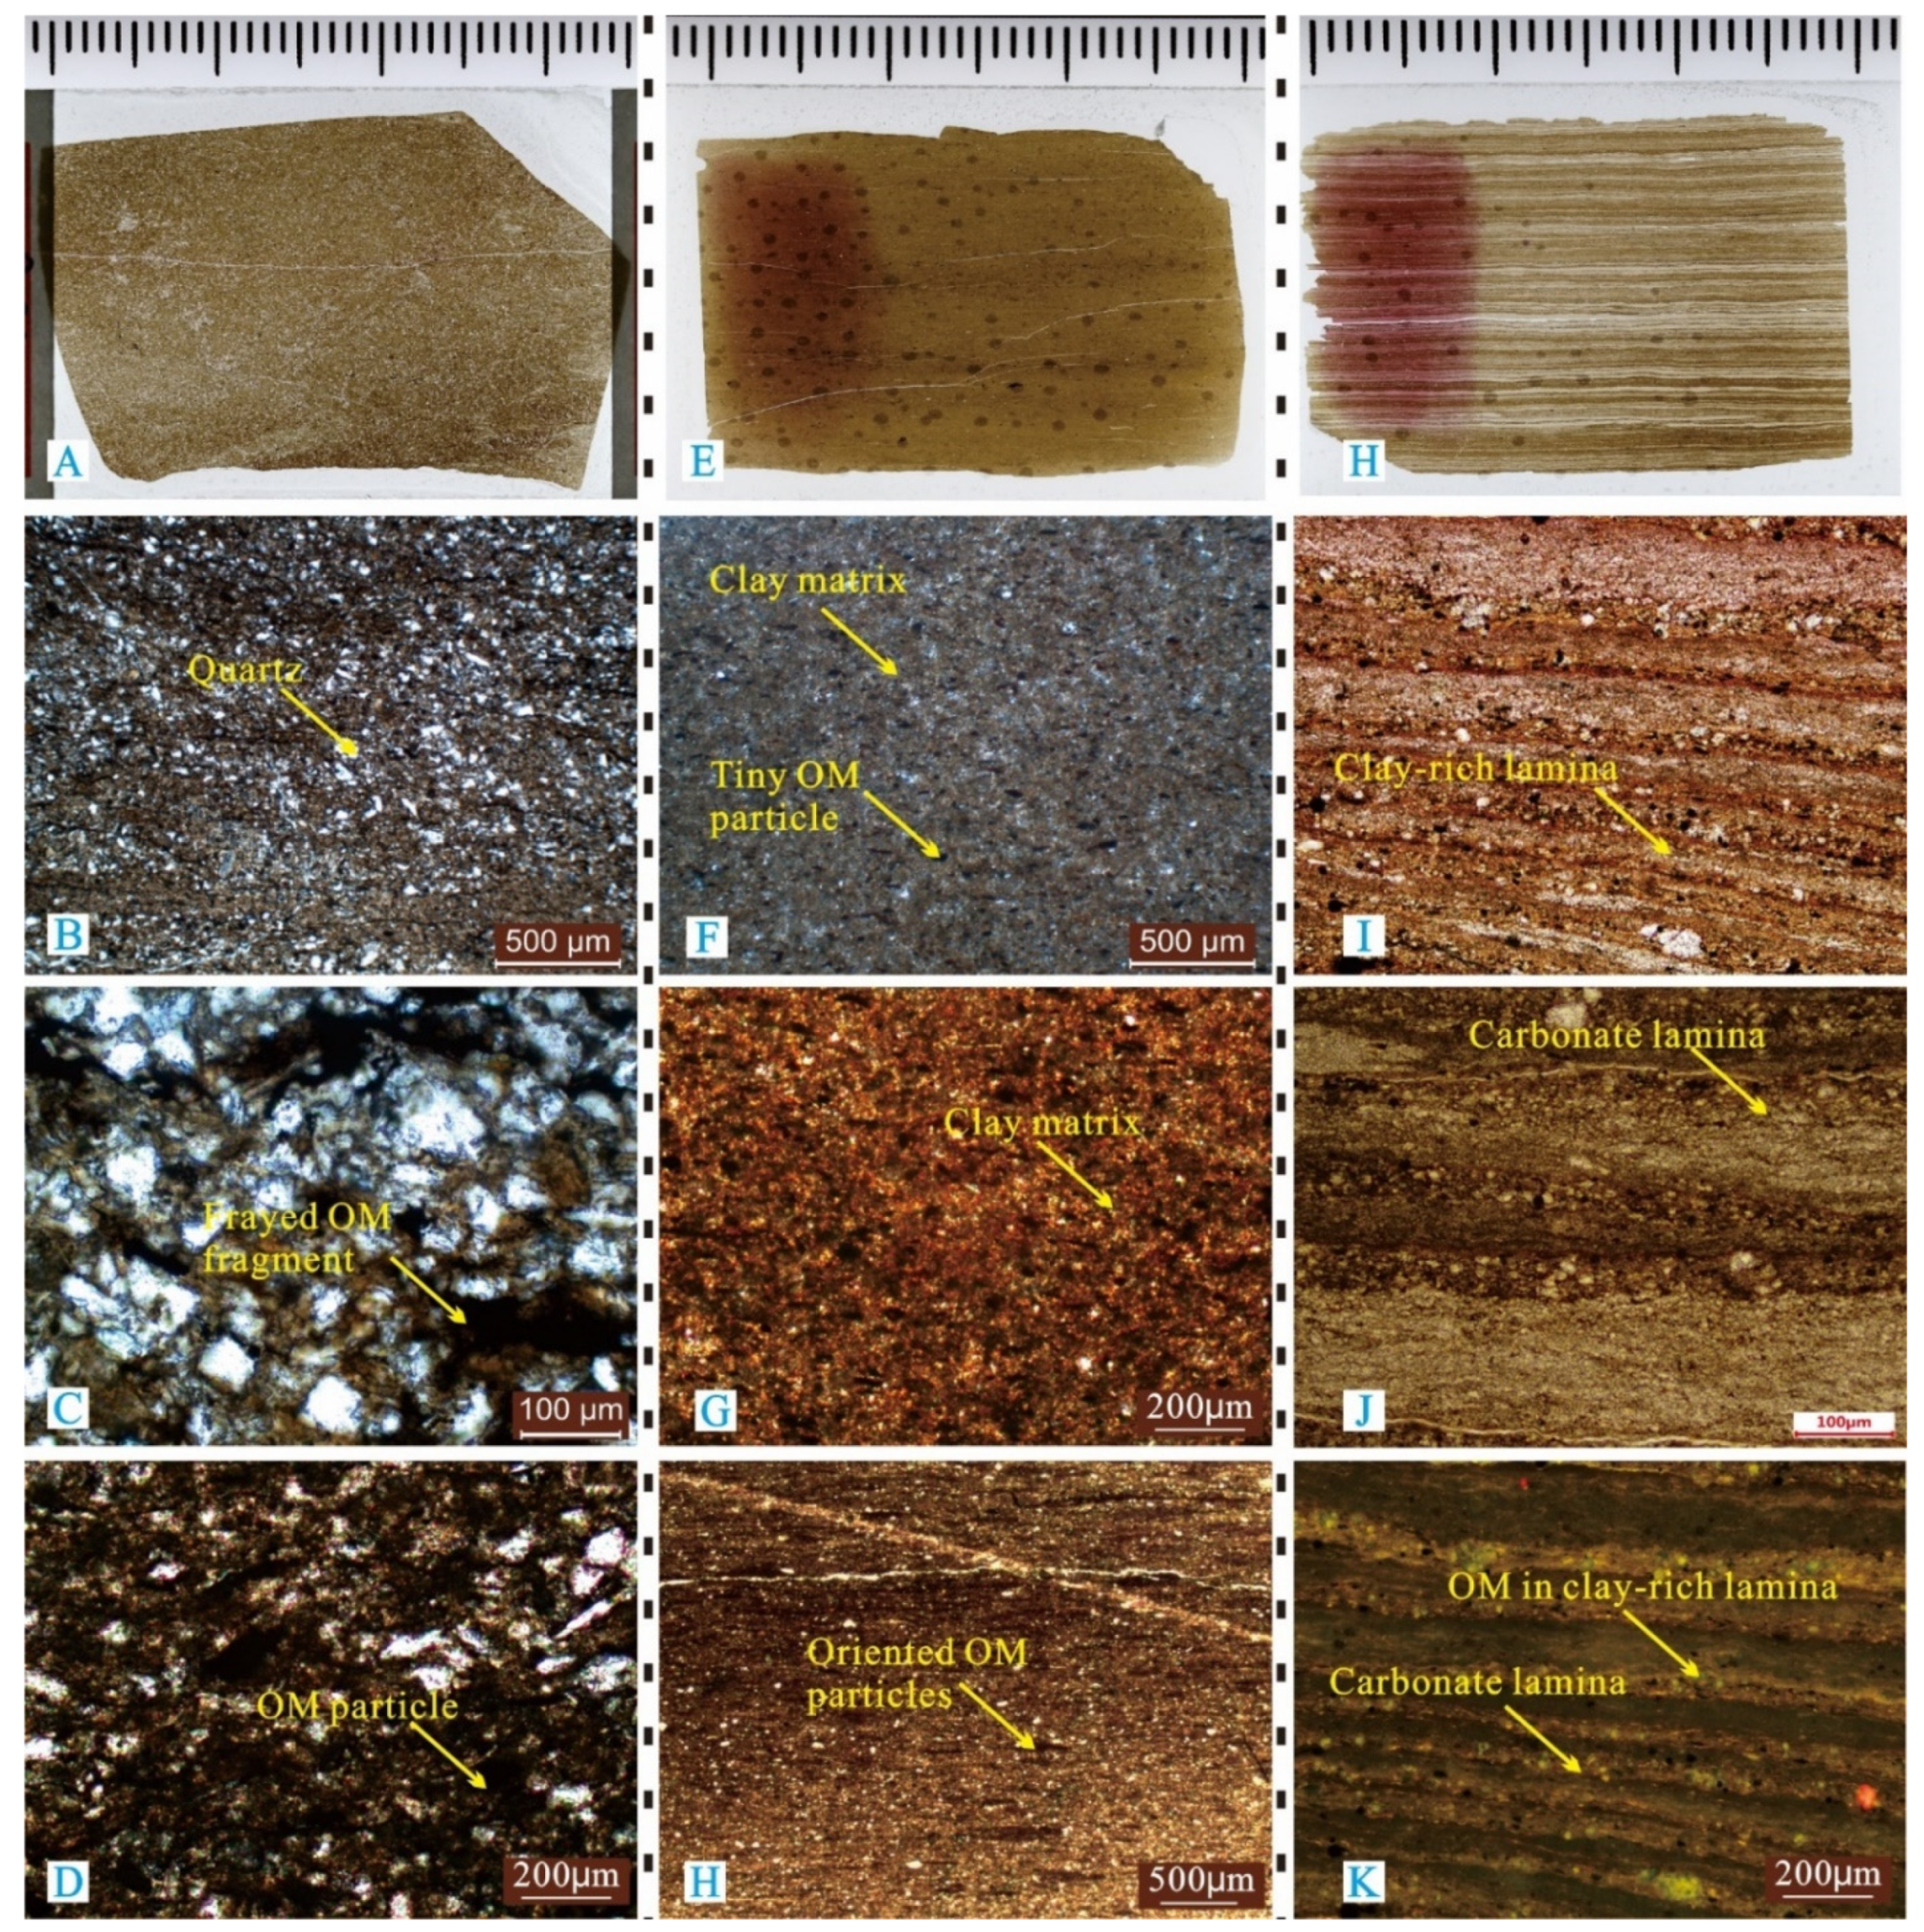
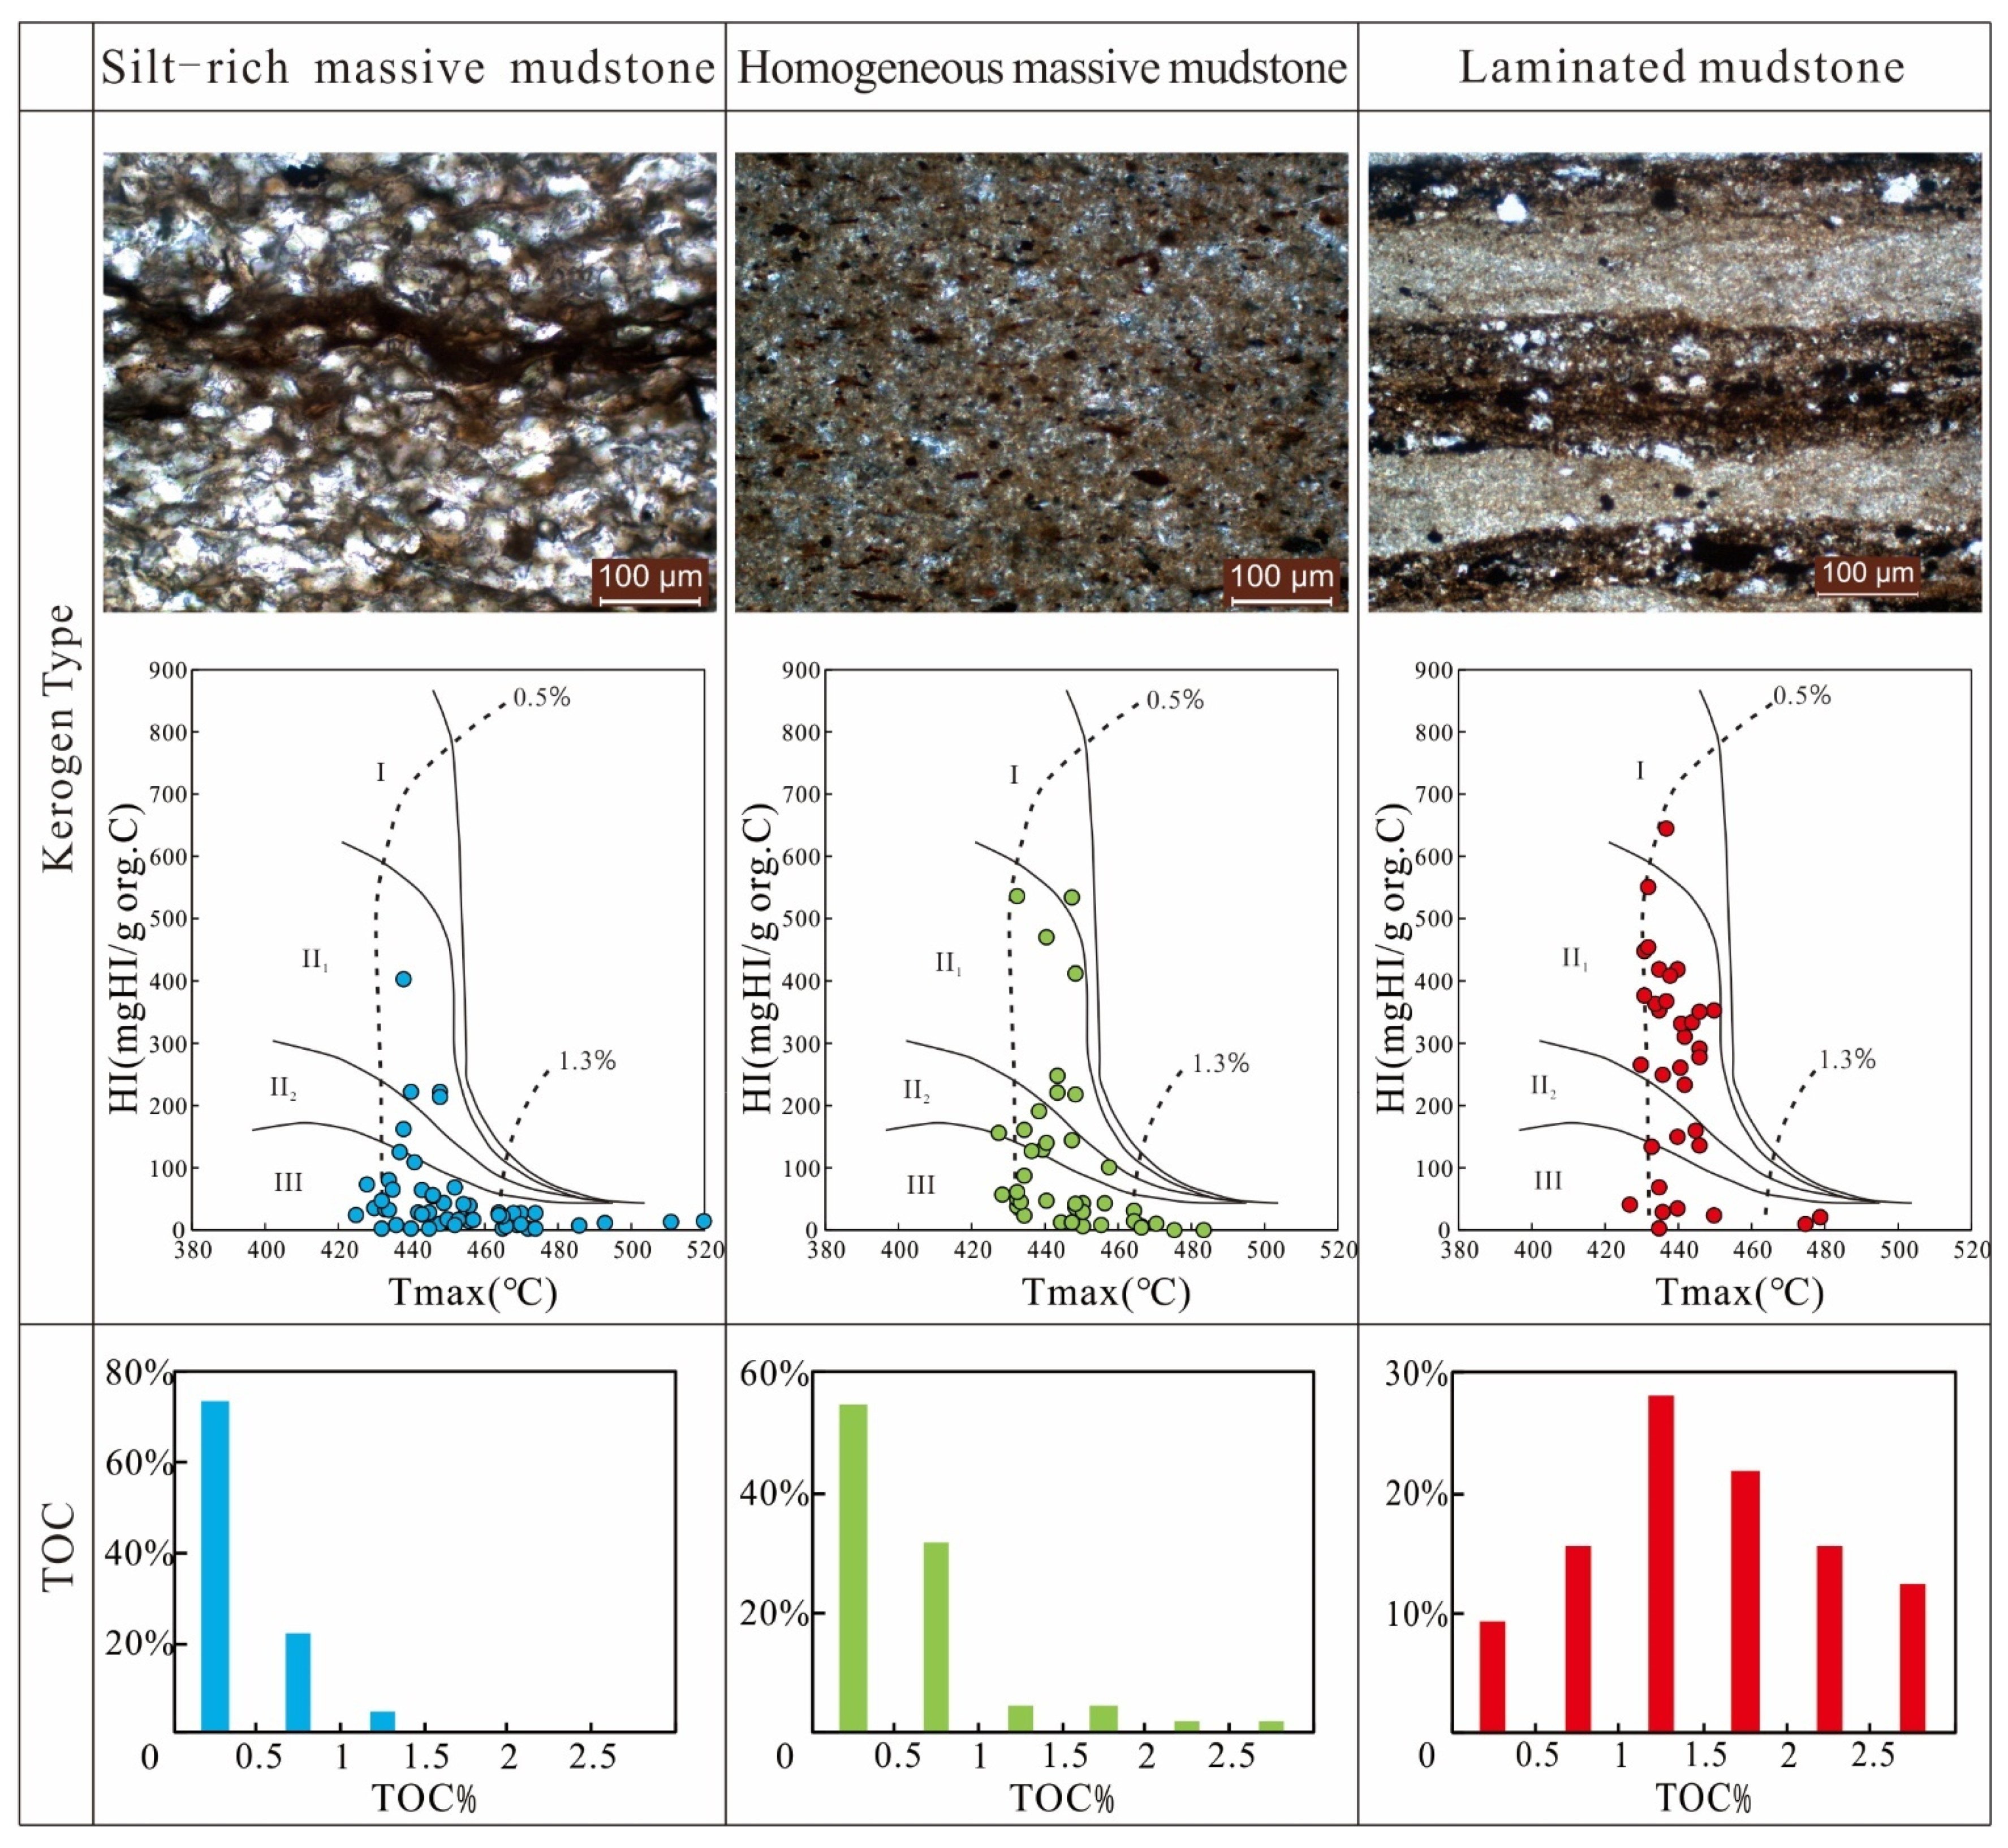
4.1. Lithofacies Microstructure Characteristics

Under a microscope, the mudrock samples of Dongpu Sag showed various structure features. In consideration of microstructure characteristics and mineral composition, as well as referring to the lithofacies classification scheme of Zeng (2017) [22,23], the mudrocks of study area were divided into three lithofacies (Figure 2): silt-rich massive mudstone, homogeneous massive mudstone, and laminated mudstone.
The silt-rich massive mudstone showed a relatively homogeneous microstructure and mainly comprised silt-size detrital minerals and clay minerals; the average content of quartz and feldspar was the highest among the lithofacies. Observed under a microscope, most silt-size detrital minerals were well sorted, less than 63 μm in particle size, and distributed in mud matrix evenly (Figure 2A,B). The content of OM was low, and only a few dark brown-black OM fragments with frayed edges were observed (Figure 2C,D).
The homogeneous massive mudstone was quite homogeneous inside and lacked bioturbation structure (Figure 2E,F). XRD test results showed that the matrix was mainly composed of clay minerals (of the highest content). Under a microscope, nearly no silt-size detrital mineral particles could be seen; besides minerals, tiny OM particles were found distributed in the mud matrix in a similar orientation (Figure 2G,H). Dark pyrite particles could also be observed.
The laminated mudstone had the lowest content of silt-size detrital mineral and a high content of carbonate mineral. This lithofacies mainly consisted of clay-rich laminae and micrite laminae. Most laminae were straight, with a thickness of 20–200 μm (Figure 2H,I). The clay-rich laminae were reddish brown to dark brown in color and ranged from 50 to 100 µm in thickness, showing intense fluorescence under a fluorescent microscope (Figure 2K). These laminae mainly comprised clay minerals (Figure 2I,J), while silt-size detrital mineral particles and framboidal pyrite particles were also found to be distributed in these laminae. The micrite laminae were relatively homogeneous inside and commonly more than 70 μm thick. These laminae were mainly composed of fine-grained calcite (<4 μm) and showed weak fluorescence (Figure 2K).
The differences in microstructure of the lithofacies implied different environments during the sedimentary period. Generally, the silt-rich massive microstructure of the first lithofacies indicated a shallow water condition with much terrigenous input, while the laminated structure of the third lithofacies implied a deep, periodically changing condition with much less terrigenous input.

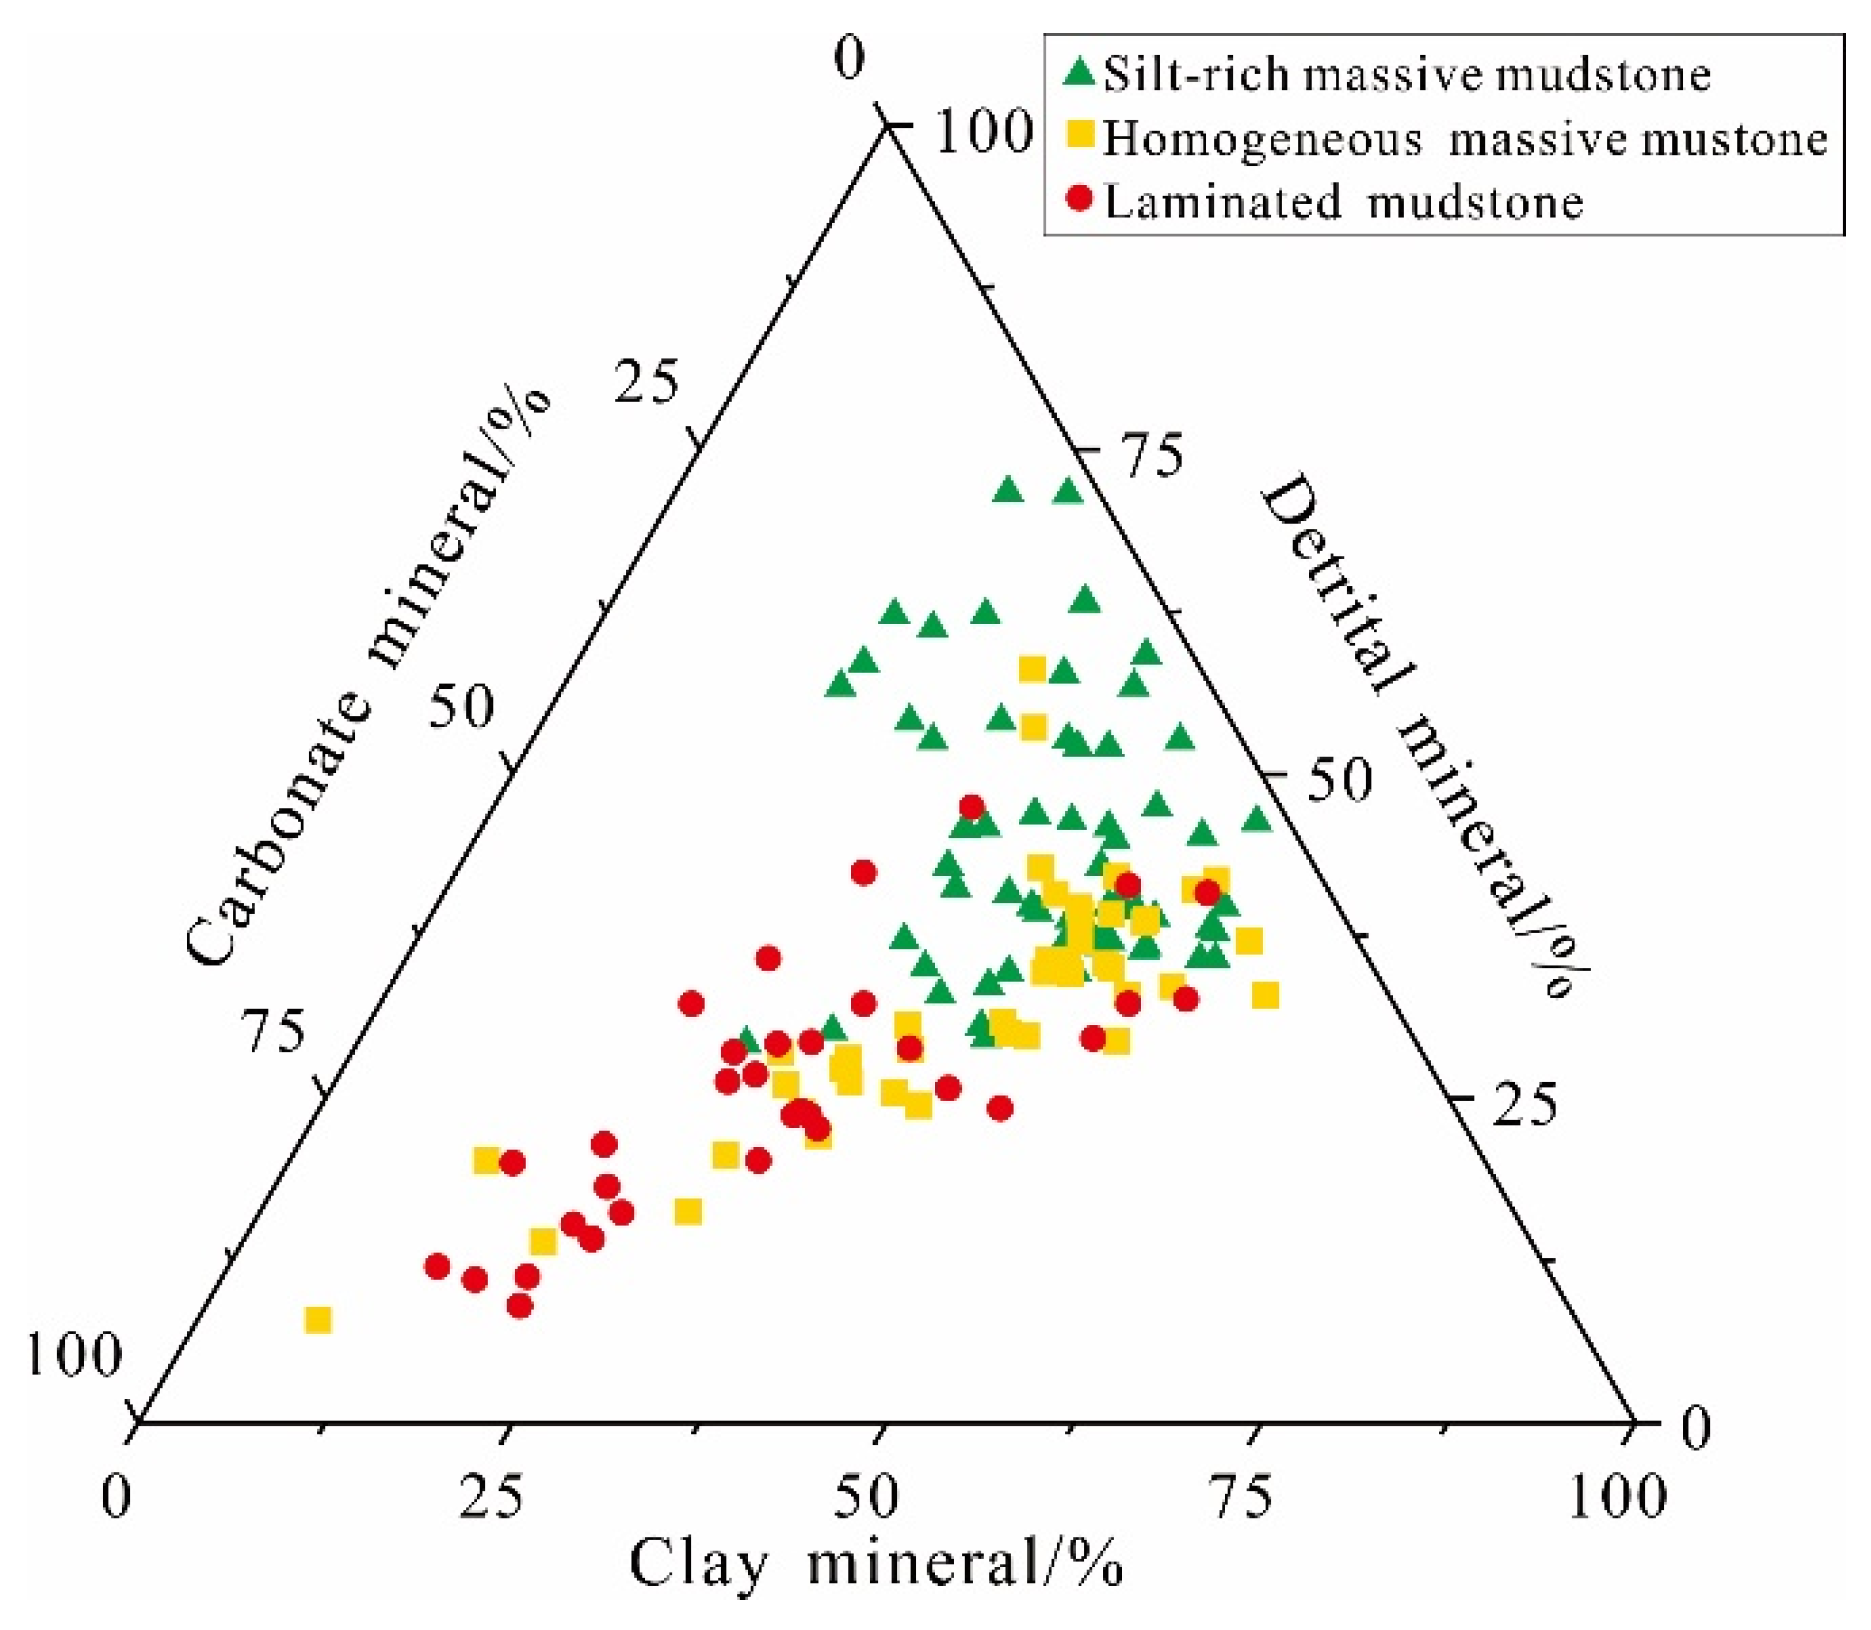
4.2. Lithofacies Mineralogical Composition

The results of the XRD test are given in the Table 1. Petrologically, the samples mainly contained clay mineral, silt-size detrital mineral, carbonate mineral, anhydrite, and pyrite. Most minerals showed a wide range in content (Figure 3). The clay, silt-size detrital, and carbonate minerals had the highest contents. The clay minerals content ranged between 8 and 57% and averaged 36%. The silt-size detrital minerals mainly included quartz and feldspar; the quartz content averaged 23% and the feldspar content averaged 13%. The carbonate minerals mainly included calcite and dolomite; the average calcite content was 26% and the dolomite was 7%. In addition, the average content of anhydrite, pyrite, and other auxiliary minerals were all below 2%.
The three lithofacies showed different mineral composition. Among them, the silt-rich massive mudstone had the highest content of silt-size detrital mineral (quartz and feldspar), which reached 43%, and a relative high content of clay mineral (37.6%), while the carbonate content in this lithofacies was the lowest (15.6%). The homogeneous massive mudstone showed the highest clay mineral content (38.2%) and medium content of detrital mineral (averages 31.3%) and carbonate mineral (averages 26.4%). Contrary to the first lithofacies, the laminated mudstone had the lowest silt-size detrital mineral content (25.1%) and the highest carbonate mineral content (42.5%), while the clay mineral content of this lithofacies averaged 29.9%, and was also the lowest among the three lithofacies.

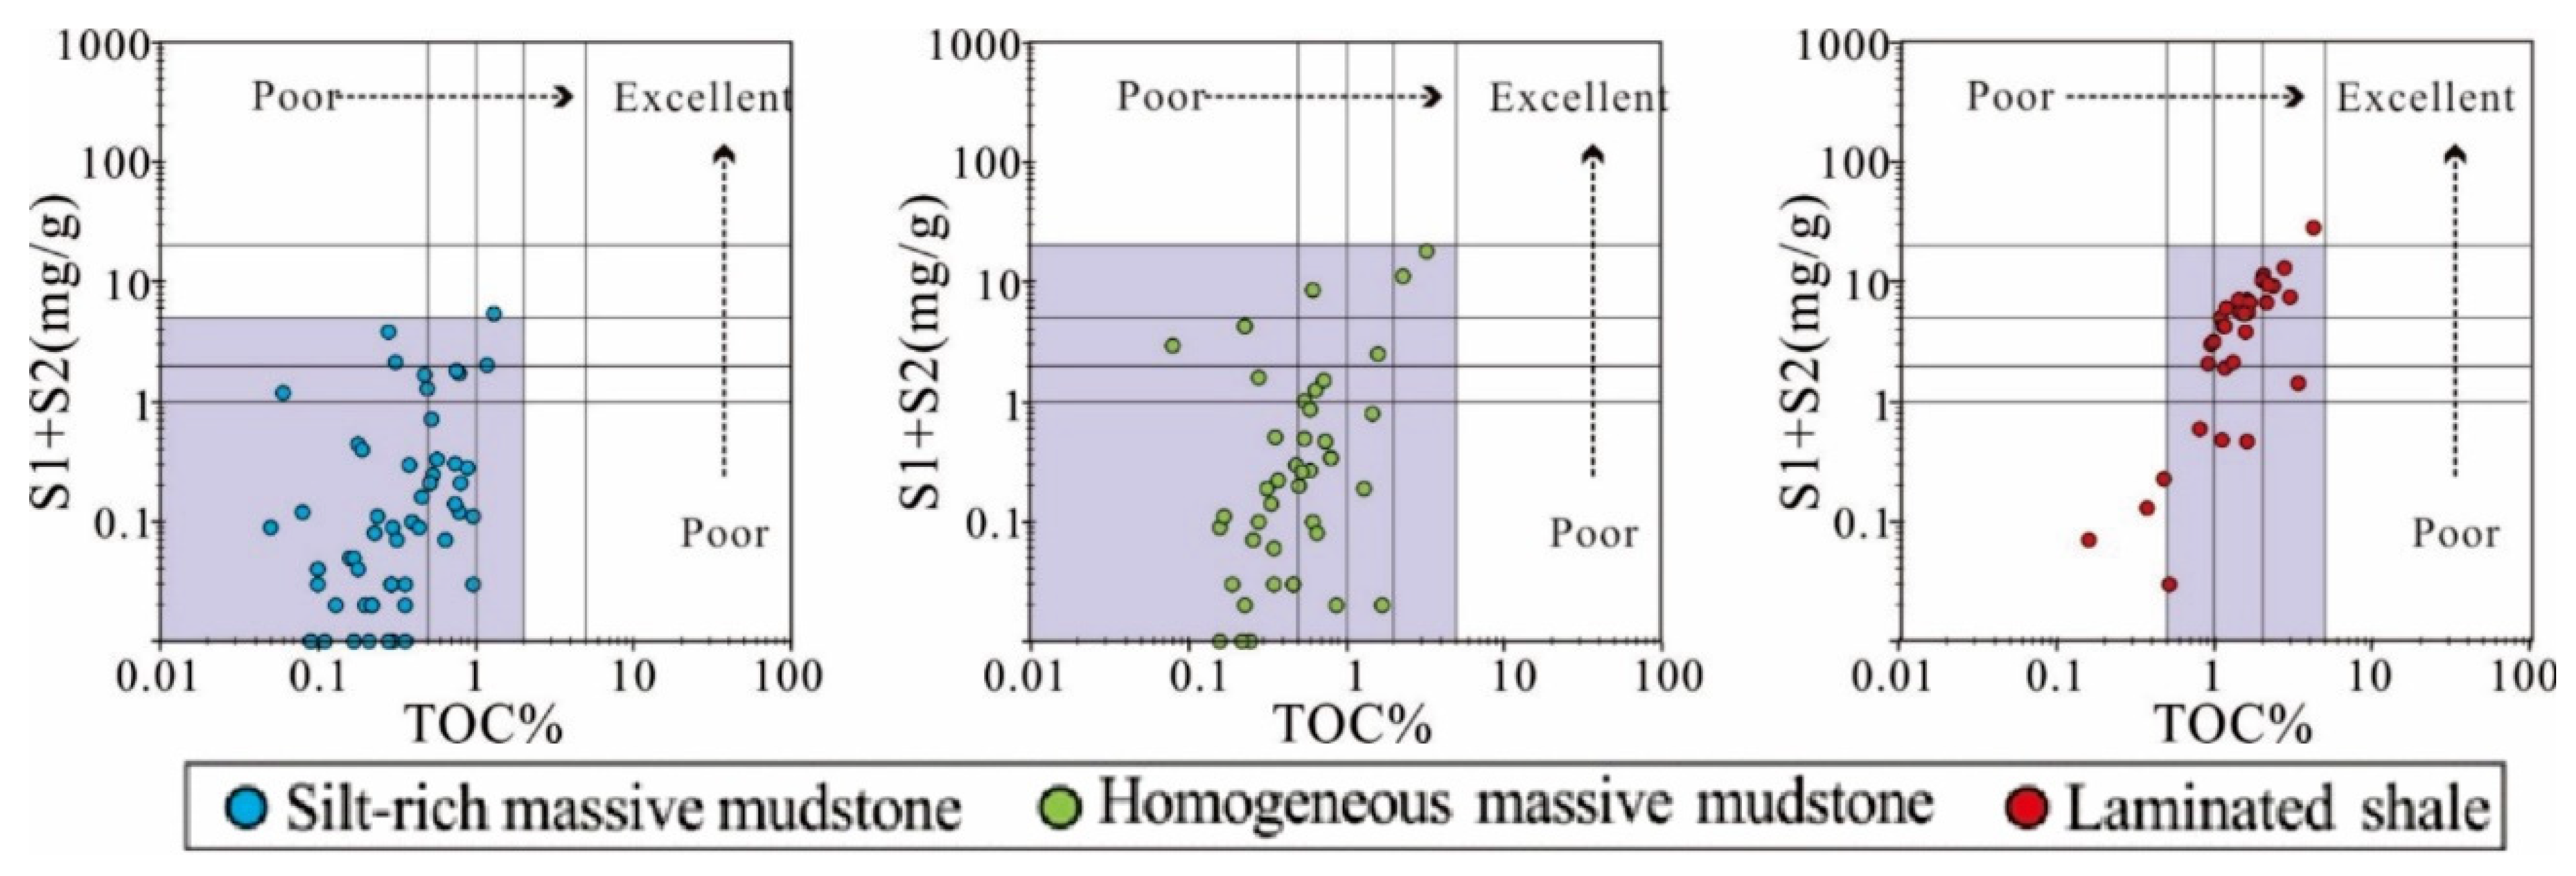
4.3. Lithofacies Pyrolysis Analysis Results

The pyrolysis results of the samples are given in the Table 1. In general, the samples did not show high values in the pyrolysis parameters. The average TOC, HI, OI, S1, S2, PI, and Tmax were 0.73 wt.%, 111.1 mgHC/g org.C, 164.9 mgCO2/g org.C, 0.21 mg/g, 1.67 mg/g, 0.21, and 451.9 °C, respectively.
The silt-rich massive mudstone had the lowest TOC, S1, and S2 values, which were 0.4%, 0.05, and 0.31 mg/g, respectively. Most samples of this lithofacies were below 0.5% in TOC value (Figure 5) and featured low HI value and high OI value, which indicates that the OM was mainly of type III. The homogeneous massive mudstone was slightly higher than the silt-rich massive mudstone in TOC, S1, and S2 values, which were 0.6%, 0.14, and 1.29 mg/g, respectively. In most samples, the TOC value was below 1% and the OM generally featured mid to low HI value and high OI value. The kerogen of this lithofacies was mainly of type III and II. The laminated mudstone had the highest TOC, S1, and S2 values, which were 1.56%, 0.61, and 4.83 mg/g, respectively. The average HI and OI values of this lithofacies were 264 mgHC/g org.C and 97 mgCO2/g org.C, indicating that the kerogen was mainly of type II (Figure 5). Considering the thermal maturity, the three lithofacies were slightly different in Tmax value but were generally all in the same mature stage of thermal evolution.

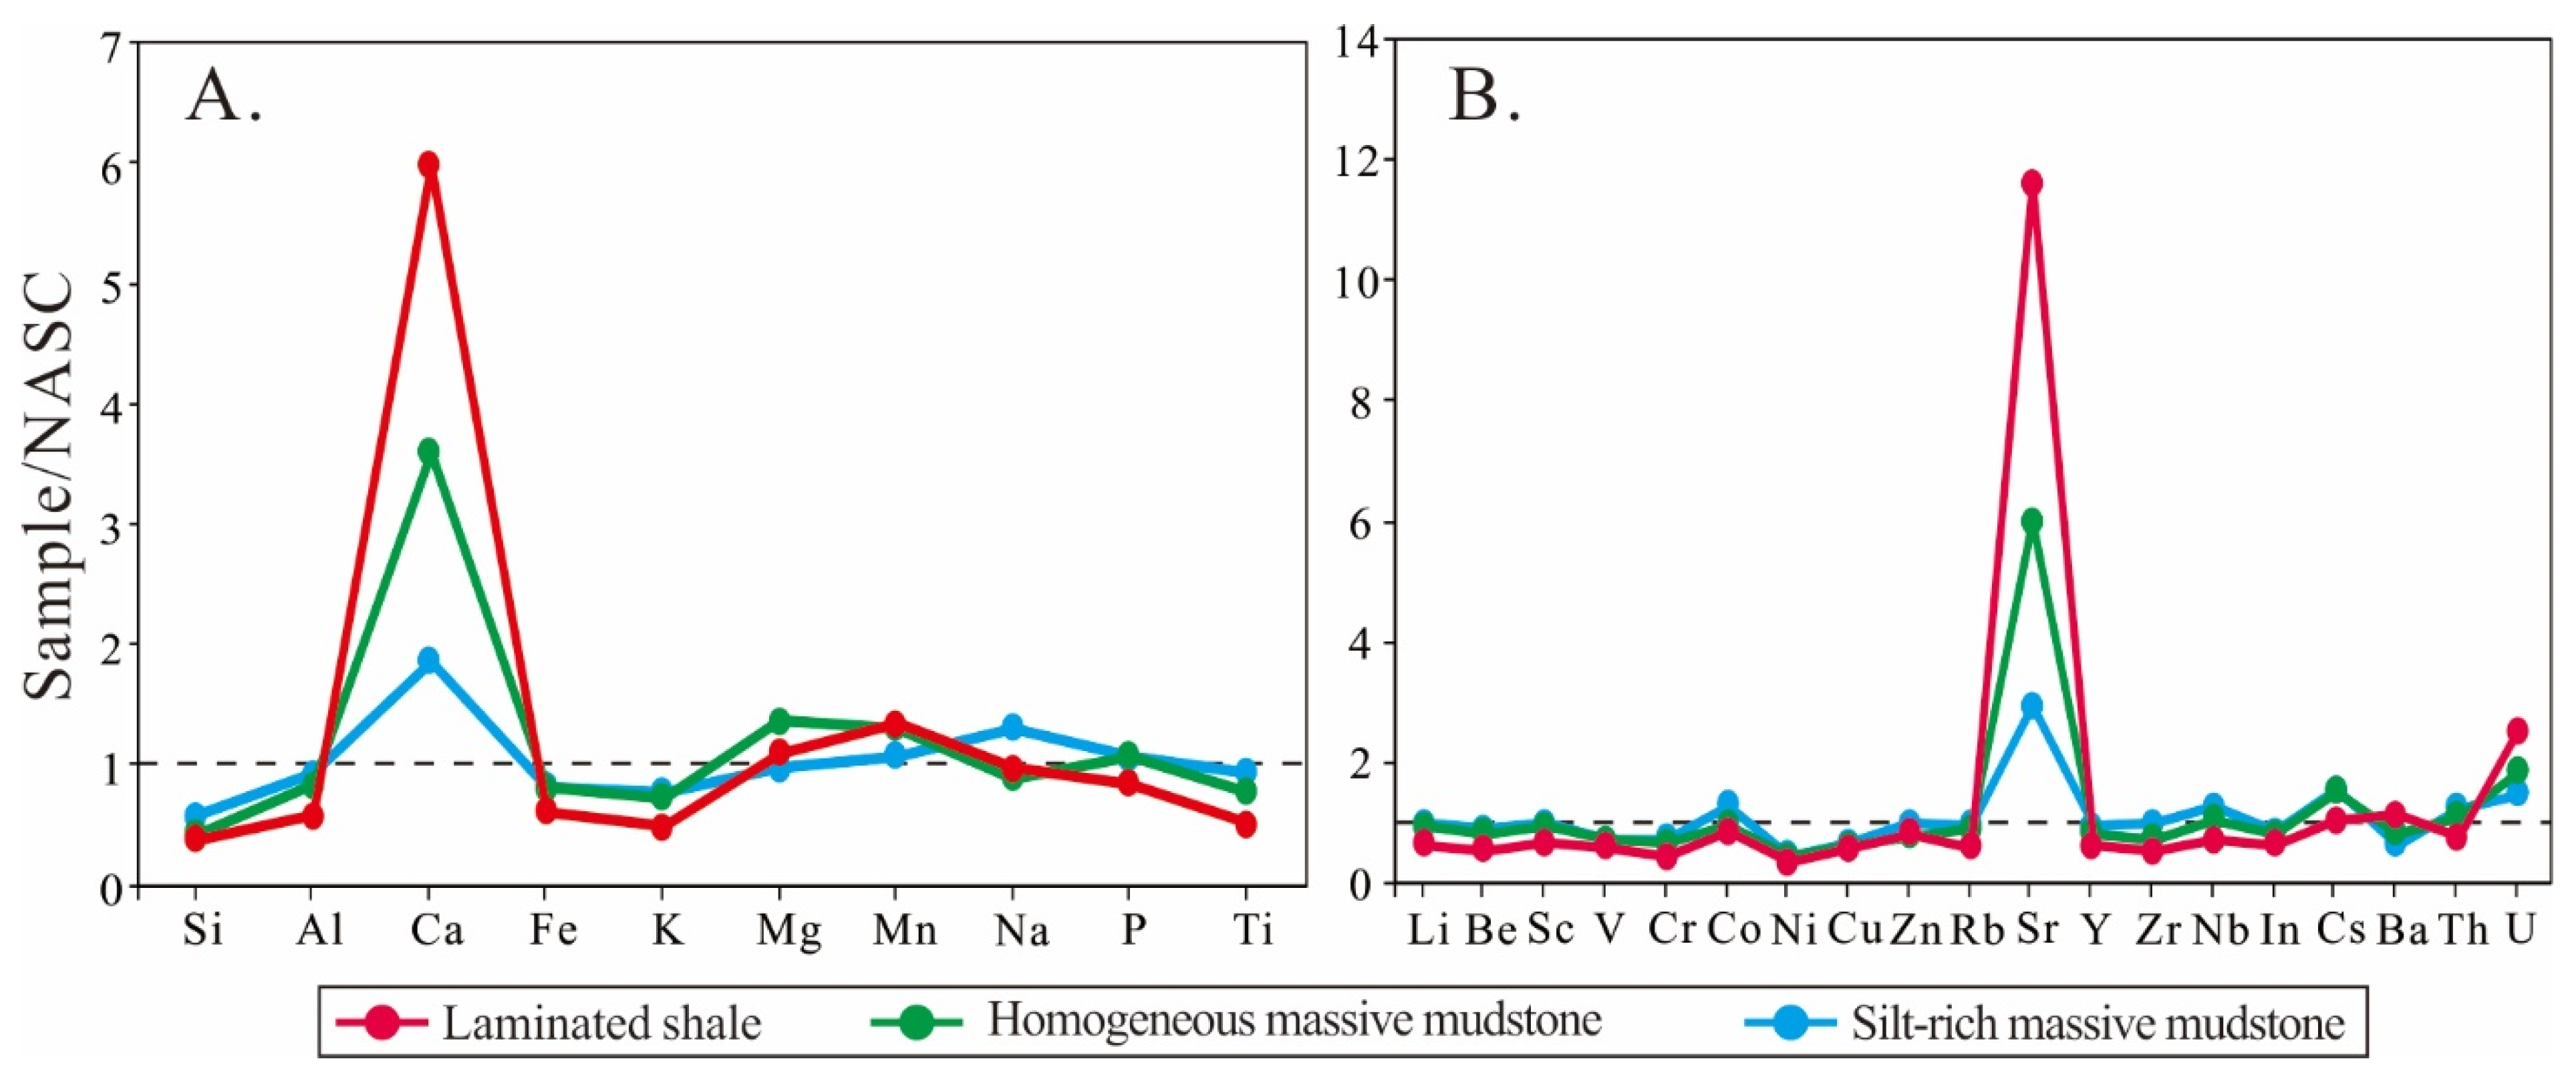
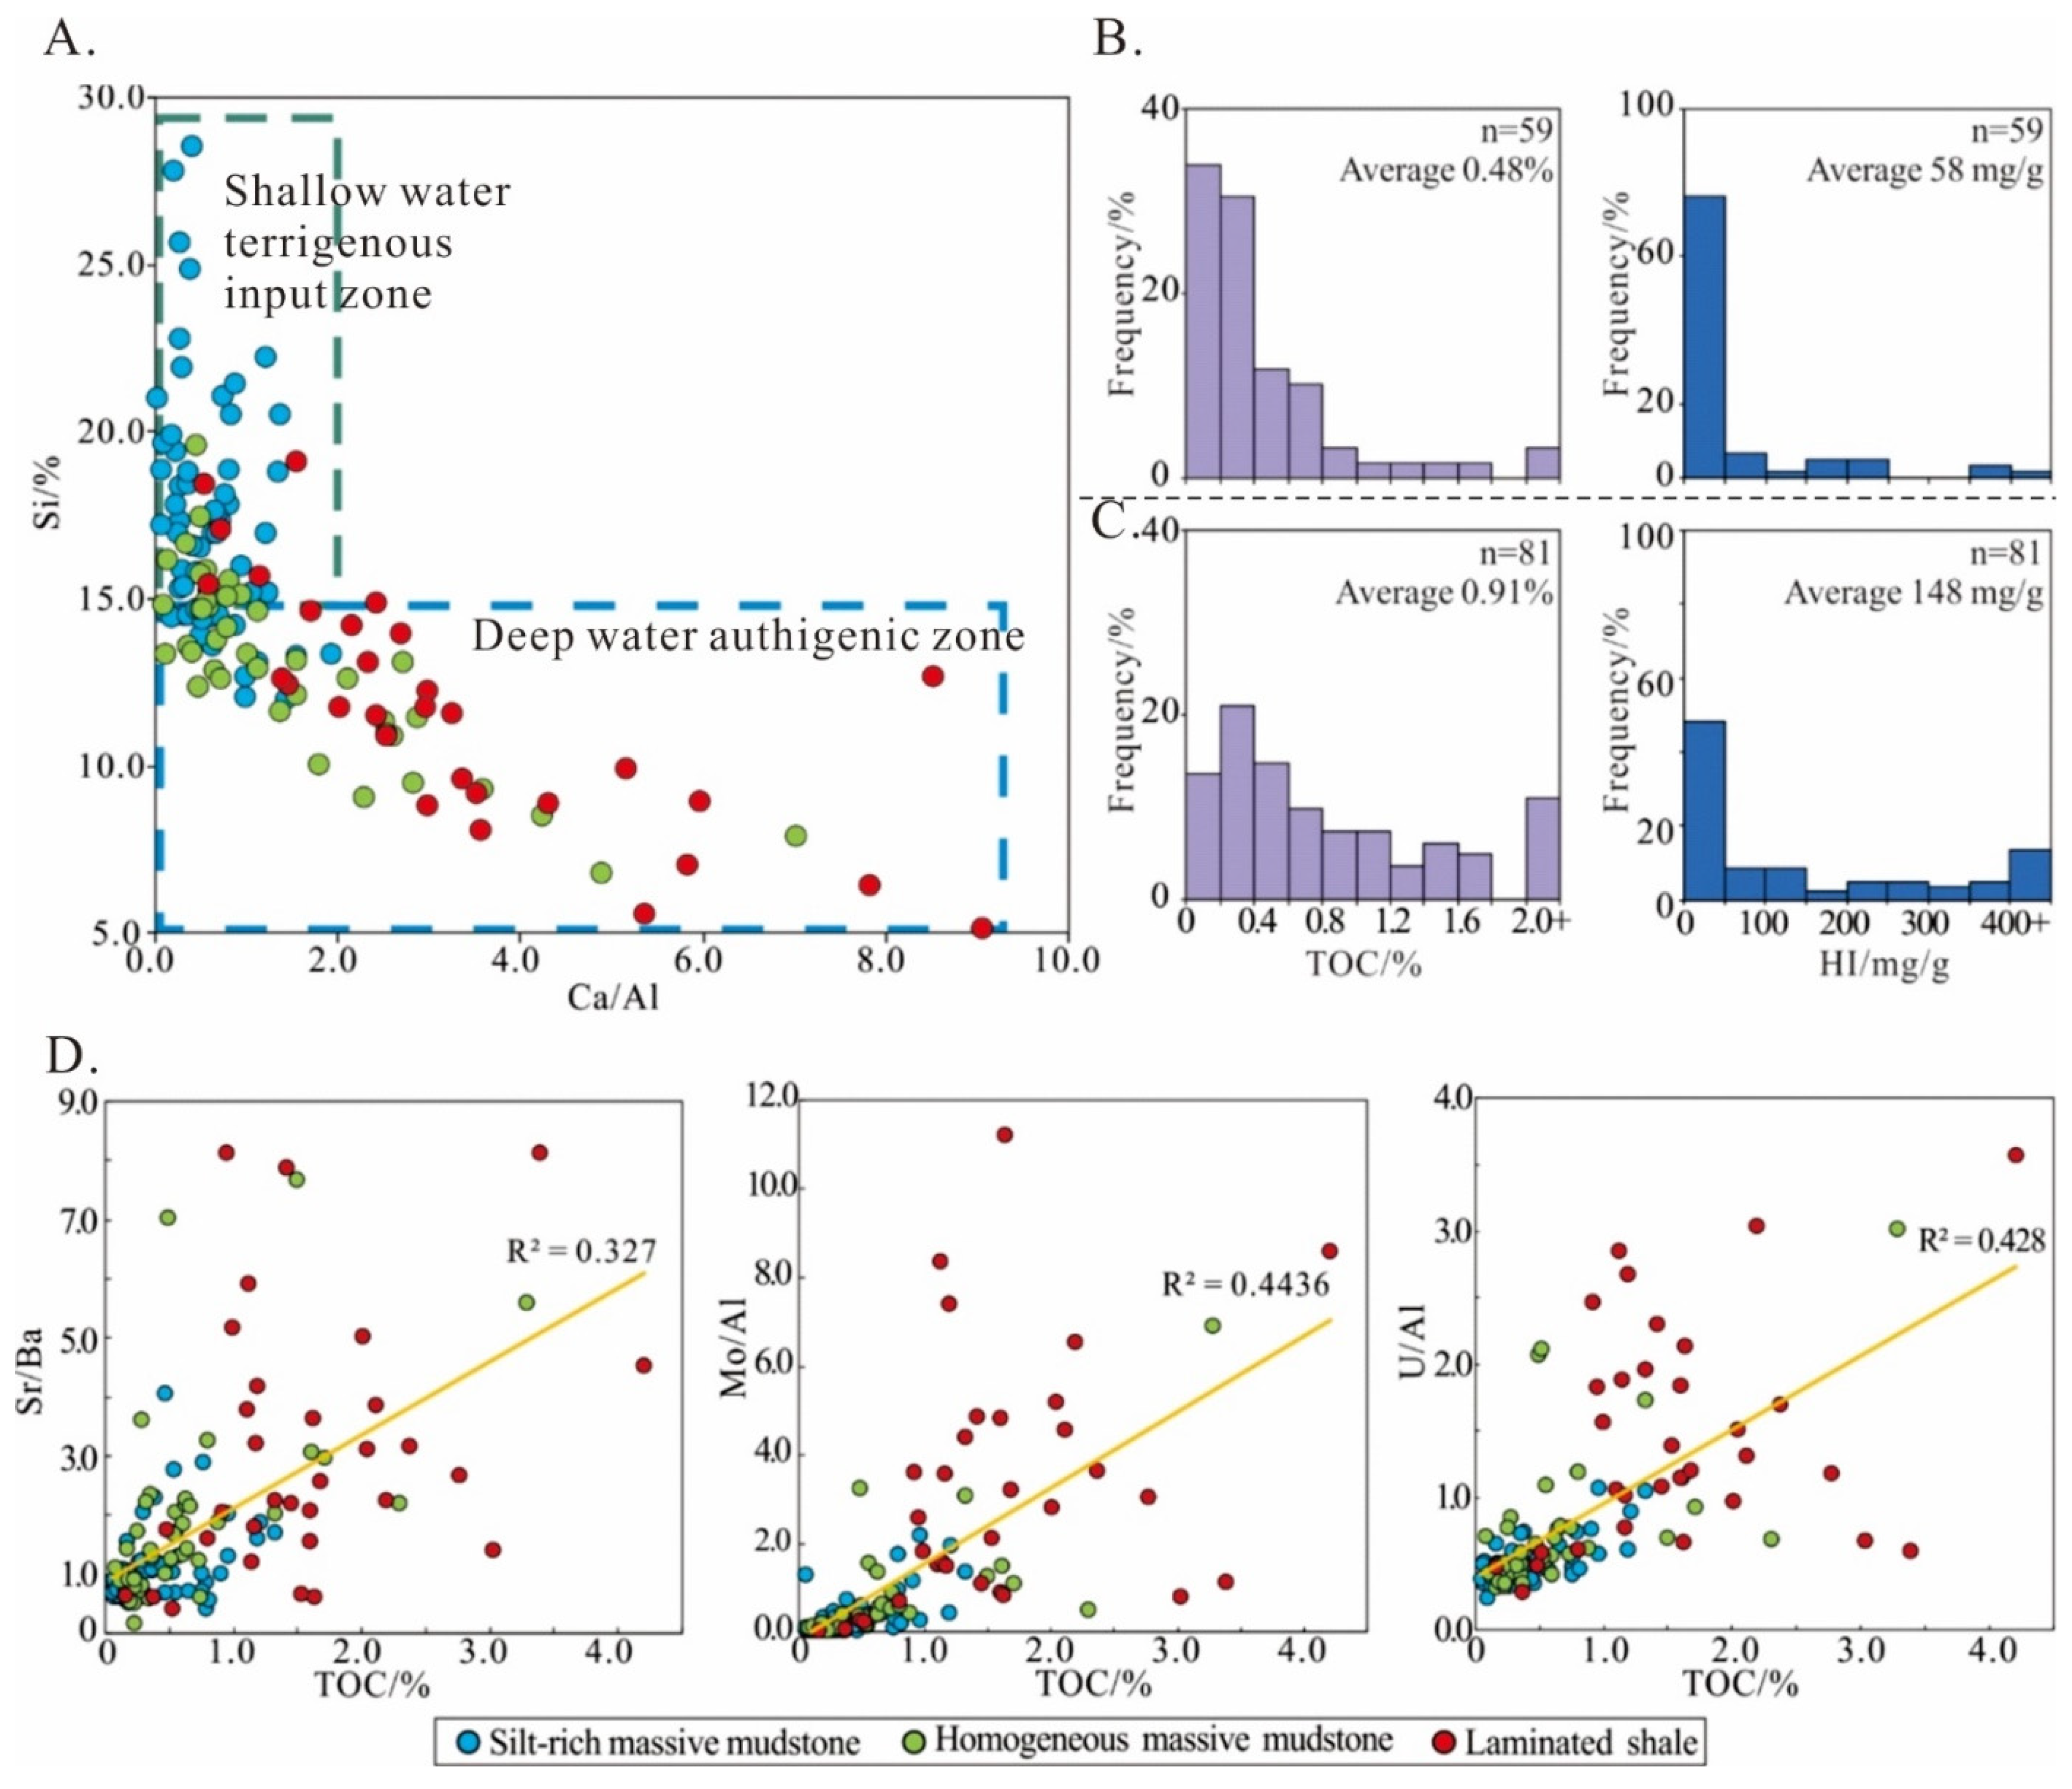
4.4. Lithofacies Elemental Geochemistry Characteristics

The abundances of major and minor elements of the samples were tested. For better evaluation of elements enrichment, the abundances of the elements of the North American Shale Composite (NASC) are commonly seen as standards for general sedimentary mudrocks [7]. In this paper, the elements abundances of the samples were standardized using the NASC for a better evaluation of the enrichment degree of the elements. The results (relative to the NASC) are shown in the Figure 4. In the major elements, the abundances of Al, Fe, K, and Ti of the samples were slightly lower than that of the NASC, while the abundances of the Mg, Mn, Na. and P were slightly higher. The Ca abundance was significantly higher than that of the NASC. In the minor elements, the Li, Be, Sc, V, Cr, Ni, Cu, Zn, Rb, Y, Zr, In, and Ba of the samples showed lower abundances than that of the NASC, while the Co, Nb, Cs, Th, and U showed higher abundances and the abundance of Sr was much higher in the samples than in the NASC.
As far as the lithofacies differences, the three lithofacies showed similar distribution patterns in most elements. Most obviously, the enrichment degree of Ca, Sr, and U were all the highest in the laminated mudstone and the lowest in the silt-rich massive mudstone, while the enrichment degree of Al and Ti were on the contrary: the lowest in the laminated mudstone and the highest in the silt-rich massive mudstone.

5. Discussion

5.1. Lithofacies OM Characteristics

As seen from pyrolysis analysis and thin section observation, the OM of the three lithofacies showed significant differences in many aspects (Figure 5). Here, the origins and characteristics of OM are discussed.
The values of TOC, S1, and S2 were all the lowest in the silt-rich massive mudstone among the three lithofacies (Figure 5). As indicated by the HI value and high OI value, the OM of this lithofacies was mainly of I type kerogen. Seen under a microscope, most OM fragments were distributed in the mud matrix sporadically and coexisted with silt-size detrital minerals, which were mostly dark brown to black in color. The OM fragments were different sizes, generally larger than 63μm, and showed a laterally continuous structure. Because the thin sections of the samples were grinded vertical to the lamina plane, the intact morphology characteristics of the OM were hard to observe; only the intersecting surface features could be seen; thus the origins of the OM were difficult to figure out through microscope observation. However, it can be seen from previous genesis studies on this kind of OM in similar lithofacies [22] that these lithofacies are rich in III type kerogen and most OM belongs to terrestrial OM.
The homogeneous massive mudstone was a bit higher than the silt-rich massive mudstone in TOC, S1, and S2 values and mainly comprised OM of type III and II kerogen. Under a microscope, OM with an intact shape was hard to find, and most OM dispersed in the mud matrix as tiny chips and particles (<63 μm) with similar orientation (Figure 3). Previous studies have revealed that OM preserved in a single particle form is generally originated from the terrestrial higher plant fragments or destructed microbial mats [14,24]. Like the previous lithofacies, the transportation to deposition of OM here was mainly dominated by a mechanical process.
The laminated mudstone was the highest in TOC, S1. and S2 values among the three lithofacies and mainly comprised type I kerogen (Figure 5). Under a microscope, granular OM was hard to observe, while the clay laminae showed intense fluorescence under a fluorescent microscope (Figure 2K), which indicates that the OM was mainly preserved in these laminae. During the sedimentary period, the clay laminae are formed, accompanied by the deposition of aquatic OM from a water column [20]. The aquatic OM is small in size and high in surface activity so that it can combine with clay minerals through flocculation, and then they settle down together to form the clay laminae [16,17]. This is the reason why the OM particle is hard to see while the clay laminae often show good fluorescence [13]. Deposited in a lake environment rich in aquatic organisms, this kind of lithofacies is not only of good kerogen type but is also higher in TOC.
In addition, as shown in the Figure 5 and Table 1, three lithofacies showed similar maturity level and were all in the mature stage of thermal evolution, which is consistent with previous studies [25]. Thus, it can be seen that the evolution factor was not the main cause of the differences between the lithofacies in this paper. The differences in OM characteristics indicate that the sedimentary environment was the main reason for the difference in hydrocarbon generation between lithofacies.

5.2. Co-Response Between Sedimentary Environment and Lithofacies Characteristics

5.2.1. Sedimentary Environment Reconstruction

The mineral composition, OM origin, and microstructure of the mudrocks are greatly affected by sedimentary environments, such as hydrodynamic condition, water salinity, redox condition, and so on. Geochemistry analysis is commonly used in the reconstruction of sedimentary environment, and the enrichment pattern of major and minor elements is believed to be able to indicate paleoenvironment [26]. Here, a series of elemental geochemical proxies were adopted to reflect the depositional environment in which the three lithofacies are formed.
In studies on modern silicate sediments, the Al/Si ratio is usually used as an effective proxy to reflect the sorting of water currents on mineral types and grain size [27,28,29]. In this paper, we followed this idea to figure out the hydrodynamic condition during the sedimentary period. Taking into consideration the high content of carbonate minerals in the study area, the abundance of Ca was also introduced as an indicator for the sedimentation of authigenic minerals. A Si-Ca/Al chart (Figure 6A) was then plotted to reflect the hydrodynamic condition: high content of Si indicates the enrichment of silicon-bearing sediments, which belongs to shallow and proximal environments; while high Ca/Al ratio implies a weak hydrodynamic environment in which quantity of authigenic minerals get deposited.
Meanwhile, some trace elements, such as U and Mo, are typically redox-sensitive and tend to accumulate in sediments under reducing condition [30]. Here, these two elements were picked to indicate the palaeoredox condition. Al is believed to be a terrestrial element and rather stable after sedimentation, so the concentrations of U and Mo were normalized to Al before application to correct the dilution by OM and authigenic minerals [30]. Additionally, the enrichment factors of U and Mo were calculated, as the U-Mo co-variation (Figure 6) was used to reflect redox condition [31]. Furthermore, palaeredox condition, palaeosalinity, is commonly indicated by Sr/Ba ratio [32] (Figure 6).
Shown by the palaeoenvironment proxies (Figure 6), the sedimentary environments in which the three lithofacies were formed showed remarkable differences. The silt-rich massive mudstone had the highest Si concentration and the lowest Ca/Al ratio, with low Sr/Ba ratio and RSE abundance, and indicates a shallow, dysoxic, and low salinity environment with intense hydrodynamic condition, which normally belongs to the shore-shallow lake system. Under such circumstances, the silt-size detrital minerals are more likely to be enriched and the silt-rich massive structure is easy to form, triggered by a high-density turbidity current [33]. The homogeneous massive mudstone was low in Si concentration and Ca/Al ratio, while it had a higher Sr/Ba ratio and RSE abundance than the silt-rich massive mudstone. These indicate a mid-to-low salinity and shallow-to-mid water depth environment with relative weak reducing and hydrodynamic condition, which generally belongs to a shallow semi-deep lake system. The laminated mudstone had the lowest Si concentration, the highest Ca/Al ratio, and high Sr/Ba ratio and RSE abundance. This implies a deep, high salinity environment, with a strong reducing and weak hydrodynamic condition, which attaches to a semi-deep-deep salt-lake system. In general, from silt-rich massive mudstone to homogenous massive mudstone to laminated mudstone, the depositional environment changed as follows: the water column changed from shallow to deep, water salinity changed from low to high, redox condition changed from dysoxic to reducing, the terrigenous input decreased, and the authigenic sedimentation intensified.
In addition, the reconstructed depositional environments of the lithofacies could also be corroborated by their mineral composition. As shown in the results, the three lithofacies showed conspicuous differences in mineralogical composition. The silt-rich massive mudstone contained a large amount of detrital minerals, which belonged to proximal terrigenous input materials; In contrast, the laminated mudstone was rich in carbonate minerals, which are authigenic minerals precipitated from a water column, while the homogeneous massive stone was situated between the two. The mineralogical differences confirmed that the environment analysis is reliable.

5.2.2. Influences of Environment on the Deposition of Mudrocks and OM

The content and type of OM are discussed, together with geochemical proxies to figure out the influences of sedimentary environment on the OM in the mudrocks. The OM showed obvious positive correlation with water depth, salinity, and palaeoredox condition (Figure 6).
Based on the Si-Ca/Al graph, the depositional environments were divided into two parts—the shallow water terrigenous input zone and the deep water authigenic zone—to identify and compare the OM characteristics of mudrocks in different water conditions. It can be seen from Figure 6A that, in the shallow water terrigenous input zone, over half of the samples were below 0.49% in TOC values, while, in the deep water authigenic zone, the average TOC value of the samples was 0.98%, which was much higher than the previous zone. Additionally, the differences in HI values were also conspicuous, since samples of the shallow water terrigenous input zone were much lower in HI value than their counterparts, indicating that the mudrocks formed in shallow waters were more easy to get enriched in terrigenous OM originated from terrestrial higher plants. In shallow waters, sedimentary OM was dominated by terrigenous higher plant component and was generally deposited together with silt-size detrital minerals, such as quartz. The total OM content was relatively low and could be diluted by detrital input; thus, the mudrocks formed in such environments commonly showed low TOC value. As the water depth increased, the proportion and content of authigenic minerals and aquatic OM increased together. Furthermore, most OM was well preserved in clay minerals, which could be observed under a microscope. Previous studies have also confirmed that, in a shallow environment, minerals and OM simply settle down together through mechanical process. When lacking terrigenous input, the clay minerals could absorb and aggregate OM from a water column, then they would deposit together through flocculation, forming a close connection, which helps to avoid the destruction of OM during deposition [21]. Thus, it can be seen that the water depth and the distance to source region are both essential factors in the origin and enrichment of OM in deposition.
Besides water depth, the OM content also showed a positive correlation with water salinity, and the samples formed in higher salinity environment also showed higher TOC values. Within limits, both the metabolism rate and the intake of nutritive salt of the aquatic microorganism would be accelerated by the increase of water salinity [34], which will in turn contribute to the flourishment of the aquatic algae and the accumulation of sedimentary OM [5,6,35]. On the other hand, the higher concentration of metal cation in salt waters will make it easier for the OM and clay minerals to combine with each other to form the clay-polymer complexes, which show good stability [36] and could serve as a protection of the OM in deposition, so that the OM is more easily well preserved. In general, the water salinity also matters in the accumulation of OM in mudrocks.
A reducing condition is necessary for the preservation of OM in sediments [7]. The good correlation between OM content and palaeoredox parameters (Figure 6) indicates that OM is more likely to be accumulated and preserved into sediments in a reducing and high productivity environment, leading to a higher TOC in mudrocks. On the one hand, the concentration of U and Mo would increase as the water reducibility increases [37]; on the other hand, the accumulation of OM in sediments would also accelerate the enrichment of these elements.
In summary, during sedimentary period, the type and the content of OM are greatly affected by sedimentary environment, as is the OM-mineral relationship. A high productivity and reducing condition will inevitably induce the enrichment of OM in sediments, and the differences in origin, content, and preservation of OM will inevitably lead to disparity in the hydrocarbon generation of the source rocks.

5.3. Hydrocarbon Generation Discussion

5.3.1. The Deposition Process and Hydrocarbon Generation of the Lithofacies

The deposition process of the lithofacies can be described on the basis of mineral composition, OM characteristics, and geochemical environment proxies pattern. As the elemental proxies indicate, the silt-rich massive mudstone is formed in near source, shallow, and low salinity environments and comprises large amounts of silt-size detrital minerals and terrestrial OM fragments. These terrigenous components are dispersed in the mud matrix, indicating a deposition process triggered by turbidity currents under the control of gravity [38]. Due to the characteristics of large particle size, low specific surface area, and high stability, silt-size detrital minerals generally settle down as single particles; similarly, terrigenous OM also deposits in particle form due to its high content of cellulose and lignin. Under such circumstances, the silt-rich massive mudstone mainly contains terrigenous OM and shows low hydrocarbon generation potential (Figure 6).
The homogeneous massive mudstone was deposited in deeper lake environments with higher water salinity compared to the previous lithofacies. In these lithofacies, there were more carbonate minerals and the clay minerals showed high content (39% on average), while silt-size detrital mineral particles could hardly be observed under a microscope (Figure 2I,J). This indicates a low energy and less terrigenous input environment. As can be seen, the clay minerals are charged layered silicate minerals and have strong absorption capacity [39]; thus, they were easily flocculated with carbonate minerals and OM through electrochemical action. They then deposited together to form the homogeneous massive structure. Additionally, the OM-rich laminae were hardly seen in this lithofacies, implying that there were few biological activities in the deposition process. In short, the homogeneous massive mudstone was deposited in less terrigenous input and low-to-mid productivity lake environment, mainly through a chemical process.
The laminated mudstone was formed in the maximum depth and highest salinity environment among the three lithofacies. In the featured laminated structure, this lithofacies mainly consisted of micrite laminae, clay laminae, and a small number of OM-rich laminae. The average content of calcite was much higher than the other two lithofacies, reaching 44%, while the content of silt-size detrital minerals was relatively low (Figure 6). The micrite laminae were homogeneous inside, without other minerals or structures, and, in previous studies, the existence of planktonic algae fossils were observed in these laminae under SEM. It is believed that deposition of the micrite laminae is triggered by planktonic OM [40]. During the period of high salinity, the plankton could change the microenvironment of water column and induce the precipitation of carbonate minerals [41,42], thus the micrite laminae were formed (Figure 6). During the intermittent period of carbonate precipitation, fine clay minerals were aggregated and enriched from the water column. These clay minerals were large in SSA and charged on the surface so that they could absorb and combine with OM, then they settled down by flocculation [43], thus the clay laminae were formed. The rhythmic combination of different laminae reflects a stable, low-energy, and periodically changing lake environment, in which these laminae were deposited through a bio-chemical process.
In pyrolysis parameters, the free hydrocarbon (S1) and the pyrolysis hydrocarbon (S2) reflected the content of movable OM in rocks and were ideal indicators for the hydrocarbon generation capacity of source rocks [44]. By discussing the correlation between TOC and (S1 + S2), a better comprehension on the hydrocarbon generation capacity of the samples can be reached (Figure 7). Among the three lithofacies, the laminated mudstone showed the strongest potential in hydrocarbon generation; most samples were of high-quality source rocks (Figure 7). The homogeneous massive mudstone was weaker than the laminated mudstone in hydrocarbon generation, not reaching the threshold of high-quality source rock (Figure 7). It was clear that the silt-rich massive mudstone belonged to a poor source rock with much weaker hydrocarbon generation capacity than the other two lithofacies (Figure 6E,F). When taking the deposition process analyses and the environment influences on OM together, it can be seen that the hydrocarbon generation capacity of source rocks was dominated by the deposition process. Mudrocks formed in deep and high salinity lake environment showed relatively high hydrocarbon generation capacity, which serves as the main source rocks in the study area.

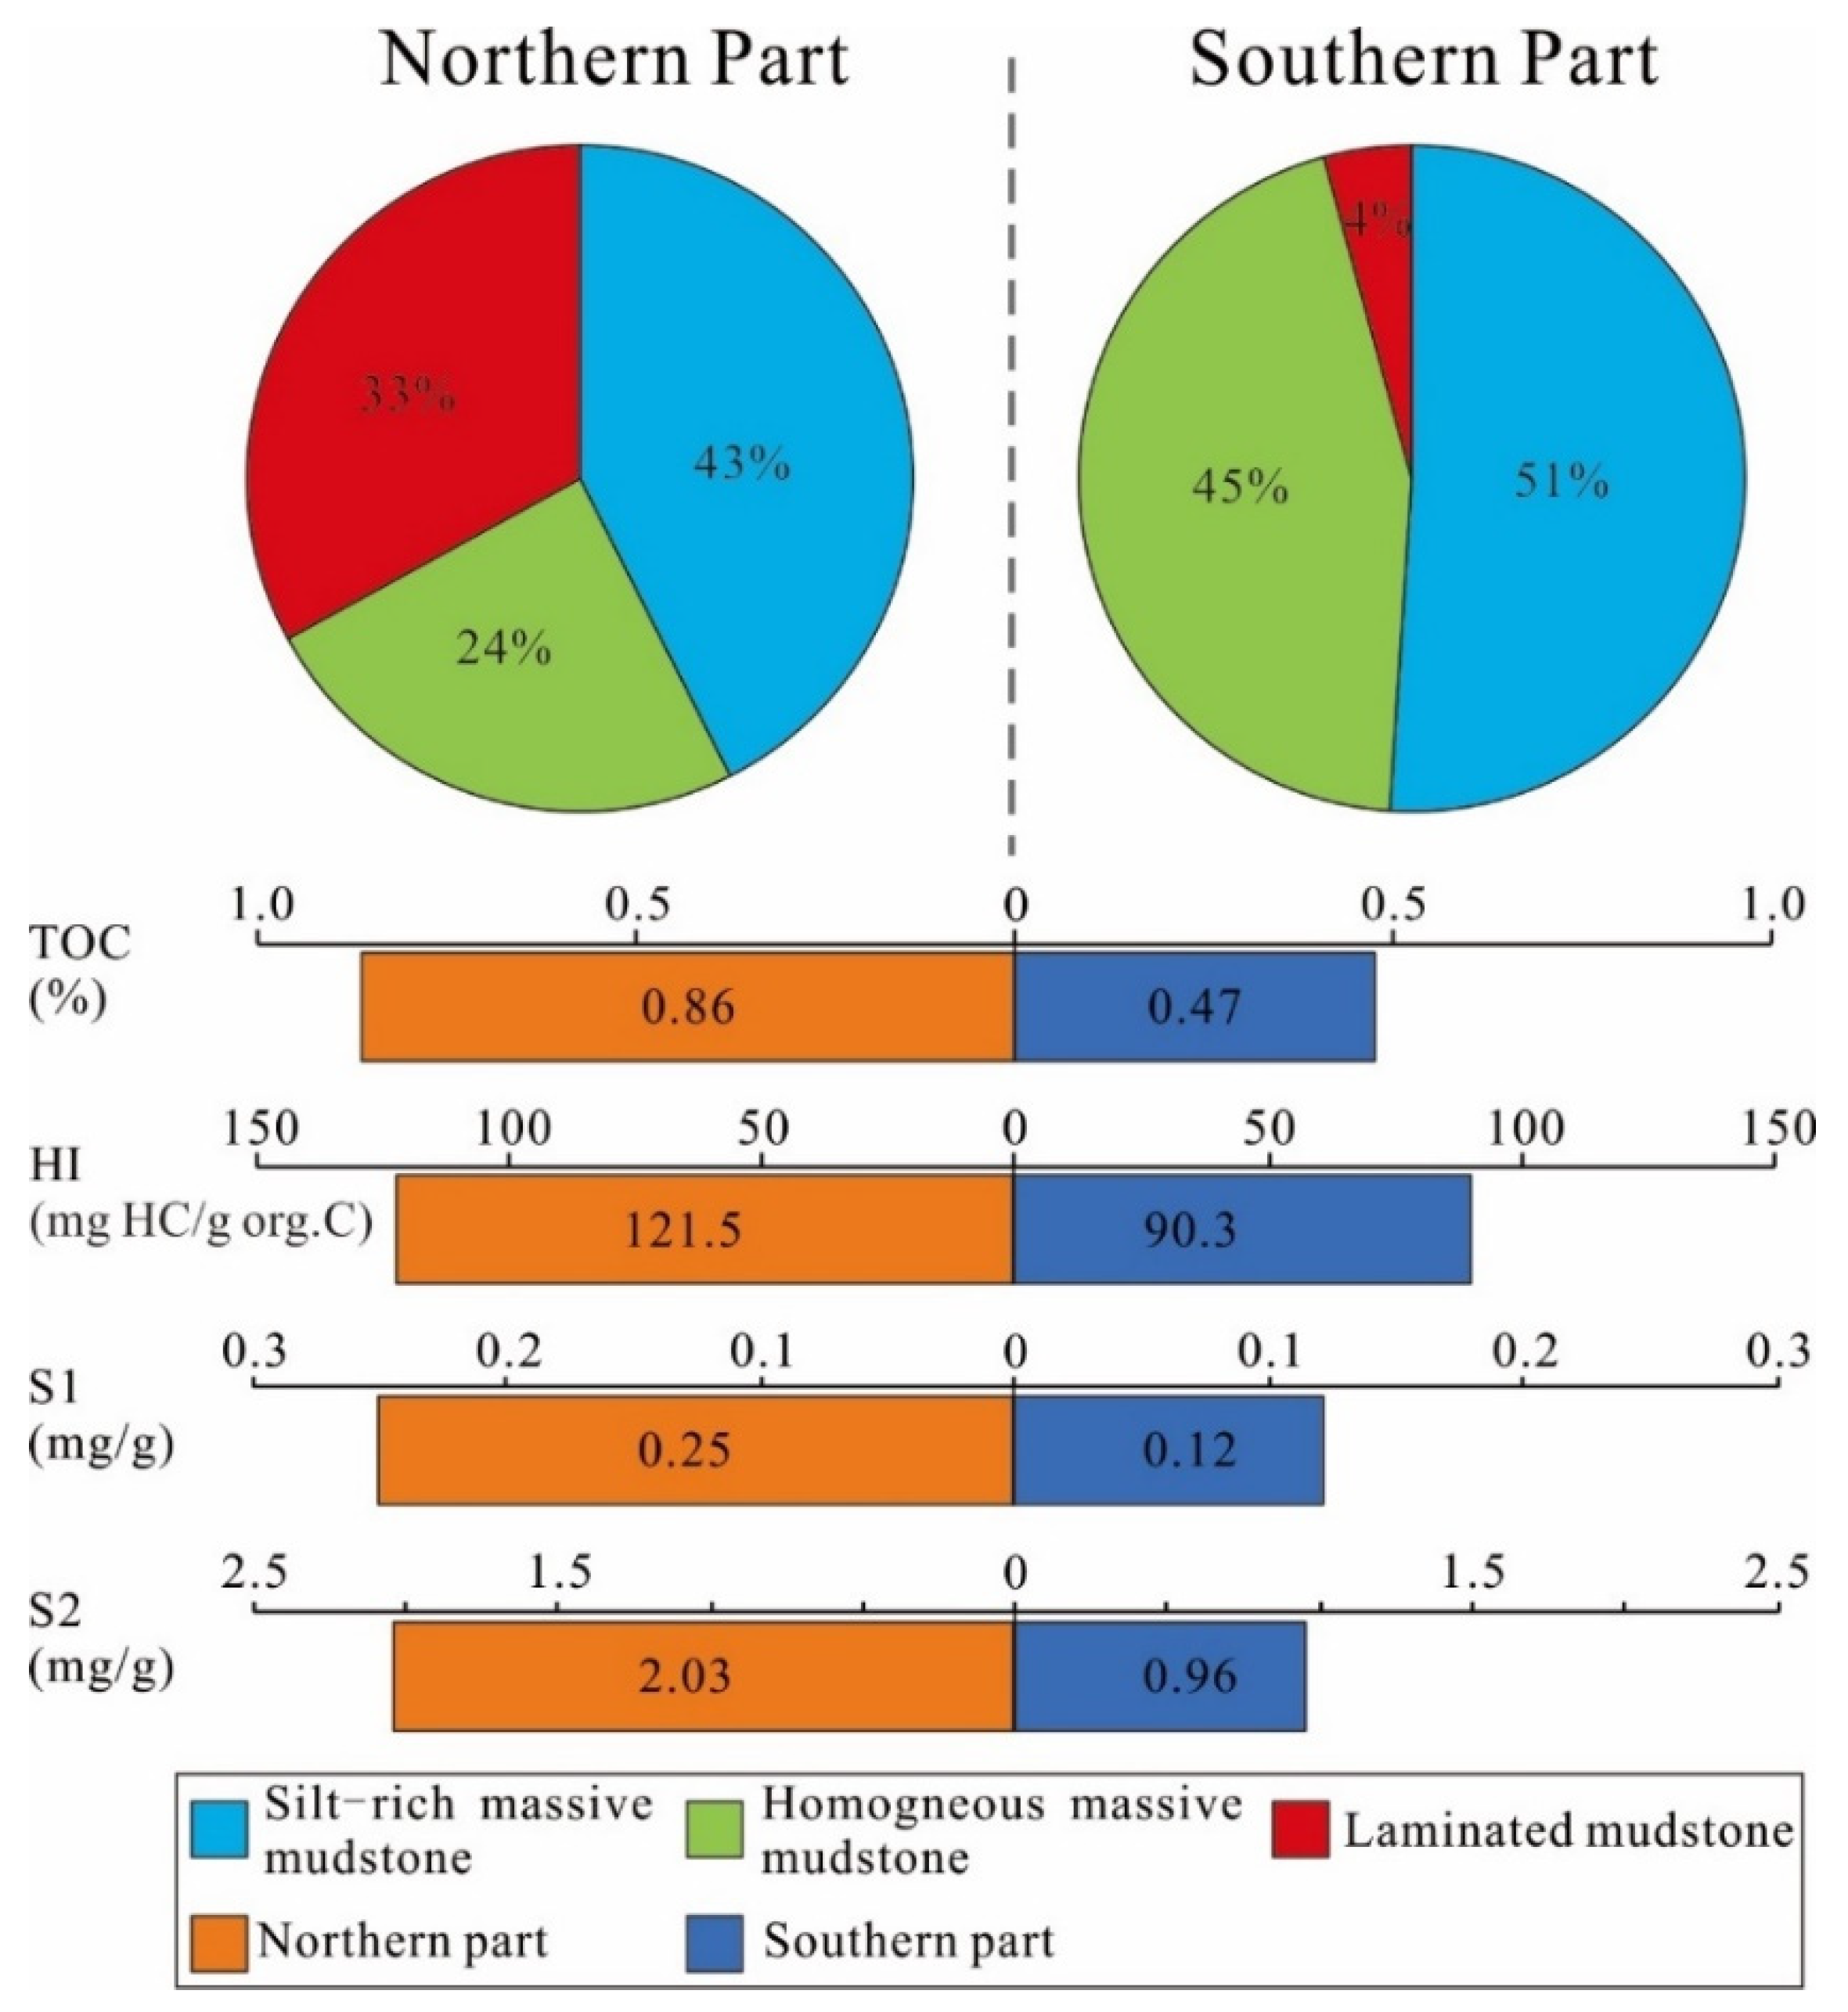
5.3.2. Discussion of the North-South Hydrocarbon Production Difference of Dongpu Sag

As the pyrolysis analysis results show (Figure 8), the TOC and HI values (average 0.86% and 122 mgHC/g org.C) of the northern part were significantly higher than that of the southern part (average 0.47% and 90 mgHC/g org.C), indicating that the northern source rocks are higher in OM content and better in OM type. Additionally, the S1 and S2 values were also much higher in the northern part (average 0.25 and 2.03 mg/g) than those in the southern part (average 0.12 and 0.96 mg/g), implying that the northern source rocks have larger hydrocarbon generation capacity. As far as the thermal maturity, samples of the two parts showed less differences (Figure 8). In consideration of pyrolysis parameters, though the average values of pyrolysis parameters of the whole Dongpu Sag are not high, the northern part shows pretty good potential of hydrocarbon generation.
The northern part and the southern part of the Dongpu Sag also show great discrepancy in lithofacies combination, according to the statistics: in the north, about 33% of the samples belonged to the laminated mudstone, while in the south, over 95% of the samples belonged to the silt-rich massive mudstone and the homogeneous massive mudstone. The much higher proportion of laminated mudstone in the northern part implies a deeper and more stable lake environment during the sedimentary period; on the contrary, the southern part was shallower and closer to the provenance area. The differences in sedimentary environment resulted in different mineral and OM components in the mudrocks between the two parts of the Sag: silt-size detrital minerals and terrigenous OM were more enriched in the southern part, while the clay minerals, authigenic carbonate minerals, and authigenic OM all showed higher content in the north. Considering the lithofacies distribution, the laminated mudstone, which showed the highest hydrocarbon generation capacity, was mainly distributed in the north so that it directly resulted in a larger hydrocarbon generation potential in the northern part. As can be seen, the discrepancy in lithofacies combination not only reflected the changes and differences in sedimentary environment, but also served as the immediate cause of hydrocarbon production difference between the northern and southern parts of Dongpu Sag.

6. Conclusions

The mudrocks of Shahejie Formation in Dongpu Sag mainly consist of three lithofacies: silt-rich massive mudstone, homogeneous massive mudstone, and laminated mudstone. The sedimentary environments of these lithofacies varies from shallow to deep, fresh to salt, and dysoxic to anoxic.
In Dongpu Sag, the deposition and accumulation of OM in the mudrocks are mainly controlled by sedimentary environment: in littoral, shallow, and low salinity lake environment, the OM in rocks are mainly land-originated and deposited with silt-size detrital minerals through a mechanical process to form the silt-rich massive mudstone. This lithofacies has the lowest hydrocarbon generation potential among the three lithofacies; in mid-salinity and a semi-deep lake environment with less terrigenous input, the OM and clay minerals could bind with each other and then deposit together through flocculation to form the homogeneous massive mudstone. The hydrocarbon generation capacity of this lithofacies is larger than the previous capacity; in high salinity and deep lake environment, most OM originates from a water column and settles down with clay minerals via a bio-chemical mechanism in a periodically changing water condition, thus the laminated mudstone is formed. Therefore, this lithofacies has the largest hydrocarbon generation potential and serves as the main source rock of the study area.
The northern part and southern part of Dongpu Sag show great differences in lithofacies distribution: the northern part shows much higher proportion of the laminated mudstone, while the southern part is dominated by silt-rich mudstone. The lithofacies distribution pattern indicates that, during the sedimentary period, the water depth and salinity are both higher in the north, which finally leads to the differences in hydrocarbon generation capacity of the mudrocks and the discrepancy in hydrocarbon production between the two parts.

Author Contributions

Conceptualization, Y.L. and X.Z.; methodology, Y.L. and X.Z.; software, validation, X.Z.; formal analysis, Y.L.; investigation, Y.L., X.Z., J.C., and X.W.; resources, X.M. and Y.Z.; data curation, X.Z.; writing—original draft preparation, Y.L.; writing—review and editing, Y.L., X.Z., and J.C.; supervision, J.C.; project administration, X.Z.; funding acquisition, J.C. All authors have read and agreed to the published version of the manuscript.

Funding

This work was financially supported by the Natural Science Foundation of China [Grant number: 41,972,126], and the State Key Laboratory of Shale Oil and Gas Enrichment Mechanisms and Effective Development (Grant number. G5800-19-ZS-KFZY007).

Data Availability Statement

Data available on request due to restrictions eg privacy or ethical. The data presented in this study are available on request from the corresponding author. The data are not publicly available due to privacy reasons.

Acknowledgments

We are grateful for the support from Zhongyuan Oilfield Company for their help in providing core samples. We would also like to thank the State Key Laboratory of Marine Geology for the support on analyses including XRD, Thin-section Obsertvation.

Conflicts of Interest

The authors declare no conflict of interest.

References

  1. Tyson, R.V. Sedimentary Organic matter: Organic Facies and Palynofacies; Springer: Berlin/Heidelberg, Germany, 1995. [Google Scholar]
  2. Hedges, J.I.; Keil, R.G. Sedimentary organic matter preservation: An assessment and speculative synthesis. Mar. Chem. 1995, 49, 81–115. [Google Scholar] [CrossRef]
  3. Lu, L.; Cai, J.; Lei, T.; Guo, Z.G.; Teng, G.E. Composition and geochemical characteristics of free and bound fatty acids in clay fraction of surface sediments, Easy China Sea. Geochimica 2011, 40, 188–198. [Google Scholar]
  4. Cai, J.G.; Zeng, X.; Wei, H.L.; Song, M.S.; Wang, X.J.; Liu, Q. From water body to sediments: Exploring the depositional pro-cesses of organic matter and their implications. J. Palaeogeogr. 2019, 21, 55–72. [Google Scholar]
  5. Taylor, R.; Fletcher, R.L.; Raven, J.A. Preliminary Studies on the Growth of Selected ‘Green Tide’ Algae in Laboratory Culture: Effects of Irradiance, Temperature, Salinity and Nutrients on Growth Rate. Bot. Mar. 2001, 44, 327–336. [Google Scholar] [CrossRef]
  6. Moisander, P.H.; McClinton, E.; Paerl, H.W. Salinity Effects on Growth, Photosynthetic Parameters, and Nitrogenase Activity in Estuarine Planktonic Cyanobacteria. Microb. Ecol. 2002, 43, 432–442. [Google Scholar] [CrossRef] [PubMed]
  7. Tribovillard, N.; Algeo, T.J.; Lyons, T.; Riboulleau, A. Trace metals as paleoredox and paleoproductivity proxies: An update. Chem. Geol. 2006, 232, 12–32. [Google Scholar] [CrossRef]
  8. Tribovillard, N.; Algeo, T.; Baudin, F.; Riboulleau, A. Analysis of marine environmental conditions based onmolybdenum–uranium covariation—Applications to Mesozoic paleoceanography. Chem. Geol. 2012, 324–325, 46–58. [Google Scholar] [CrossRef]
  9. Chiou, W.; Faas, R.; Kasprowicz, J.; Li, H.; Lomenick, T.; OBrien, N.; Pamukcu, S.; Smart, P.; Weaver, C.; Yamamoto, T. Mi-crostructure of Fine-Grained Sediments: From Mud to Shale; Springer Science & Business Media: Berlin/Heidelberg, Germany, 2012. [Google Scholar]
  10. Haberlah, D.; McTainsh, G.H. Quantifying particle aggregation in sediments. Sedimentology 2010, 58, 1208–1216. [Google Scholar] [CrossRef]
  11. Zhang, J.; Jiang, Z.; Liang, C.; Wu, J.; Xian, B.; Li, Q. Lacustrine massive mudrock in the Eocene Jiyang Depression, Bohai Bay Basin, China: Nature, origin and significance. Mar. Pet. Geol. 2016, 77, 1042–1055. [Google Scholar] [CrossRef]
  12. Cantero, M.I.; Cantelli, A.; Pirmez, C.; Balachandar, S.; Mohrig, D.; Hickson, T.A.; Yeh, T.-H.; Naruse, H.; Parker, G. Emplacement of massive turbidites linked to extinction of turbulence in turbidity currents. Nat. Geosci. 2012, 5, 42. [Google Scholar] [CrossRef]
  13. Ilgen, A.G.; Heath, J.E.; Akkutlu, I.Y.; Bryndzia, L.T.; Cole, D.R.; Kharaka, Y.K.; Kneafsey, T.J.; Milliken, K.L.; Pyrak-Nolte, L.J.; Suarez-Rivera, R. Shales at all scales: Exploring coupled processes in mudrocks. Earth-Sci. Rev. 2017, 166, 132–152. [Google Scholar] [CrossRef] [Green Version]
  14. Zhang, P.; Jiang, F.; Zhu, C.; Huang, R.; Hu, T.; Xu, T.; Li, W.; Xiong, H. Gas Generation Potential and Characteristics of Oil-Prone Shale in the Saline Lacustrine Rifting Basins: A Case Study of the Dongpu Depression, Bohai Bay Basin. Energy Fuels 2021, 35, 2192–2208. [Google Scholar] [CrossRef]
  15. Chen, J.; Lu, K.; Feng, Y.; Yuan, K.H.; Wang, D.B.; Cui, H.; Zhang, W.J. Evaluation on hydrocarbon source rocks in different environments and characteristics of hydrocarbon generation and expulsion in Dongpu Depression. Fault-Block Oil Gas Field 2012, 19, 35–38. [Google Scholar]
  16. Zhang, P.; Zhang, J.C.; Huang, Y.Q. The lithofacies characteristics of Es3 in the Northern Dongpu Depression. Sci. Technol. Eng. 2015, 2015, 21. [Google Scholar]
  17. Huang, C.; Zhang, J.; Hua, W.; Yue, J.; Lu, Y. Sedimentology and lithofacies of lacustrine shale: A case study from the Dongpu sag, Bohai Bay Basin, Eastern China. J. Nat. Gas Sci. Eng. 2018, 60, 174–189. [Google Scholar] [CrossRef]
  18. Tang, L.; Pang, X.; Xu, T.; Hu, T.; Pan, Z.; Guo, K. Hydrocarbon generation thresholds of Paleogene Shahejie Fm source rocks and their north-south differences in the Dongpu Sag, Bohai Bay Basin. Nat. Gas Ind. 2017, 37, 26–37. [Google Scholar]
  19. Yawar, Z.; Schieber, J. On the origin of silt laminae in laminated shales. Sediment. Geol. 2017, 360, 22–34. [Google Scholar] [CrossRef]
  20. Turner, J.T. Zooplankton fecal pellets, marine snow, phytodetritus and the ocean’s biological pump. Prog. Oceanogr. 2015, 130, 205–248. [Google Scholar] [CrossRef]
  21. Kase, Y.; Sato, M.; Nishida, N.; Ito, M.; Mukti, M.M.; Ikehara, K.; Takizawa, S. The use of microstructures for discriminating turbiditic and hemipelagic muds and mudstones. Sedimentology 2016, 63, 2066–2086. [Google Scholar] [CrossRef]
  22. Zeng, X.; Cai, J.; Zhe, D.; Wang, X.; Hao, Y. Sedimentary characteristics and hydrocarbon generation potential of mudstone and shale: A case study of Middle Submember of Member 3 and Upper Submember of Member 4 in Shahejie Formation in Dongying sag. Acta Pet. Sin. 2017, 38, 31–43. [Google Scholar]
  23. Zeng, X.; Cai, J.; Dong, Z.; Bian, L.; Li, Y. Relationship between Mineral and Organic Matter in Shales: The Case of Shahejie Formation, Dongying Sag, China. Minerals 2018, 8, 222. [Google Scholar] [CrossRef] [Green Version]
  24. Schieber, J.; Bose, P.K.; Eriksson, P.G.; Banerjee, S.; Sarkar, S.; Altermann, W.; Catuneanu, O. Atlas of Microbial Mat Features Preserved within the Siliciclastic Rock Record; Elsevier: Amsterdam, The Netherlands, 2007; Volume 2. [Google Scholar]
  25. Jiang, Z.R.; Zuo, Y.H.; Yang, M.H.; Zhang, Y.X.; Zhou, Y.S. Source rocks evaluation of the Paleogene Shahejie 3 Formation in the Dongpu Depression, Bohai Bay Basin. Energy Explor. Exploit. 2019, 37, 394–411. [Google Scholar] [CrossRef] [Green Version]
  26. Das, S.K.; Routh, J.; Roychoudhury, A.N.; Klump, J.V. Major and trace element geochemistry in Zeekoevlei, South Africa: A lacustrine record of present and past processes. Appl. Geochem. 2008, 23, 2496–2511. [Google Scholar] [CrossRef]
  27. Bouchez, J.; Gaillardet, J.; France-Lanord, C.; Maurice, L.; Dutra-Maia, P. Grain size control of river suspended sediment geochemistry: Clues from Amazon River depth profiles. Geochem. Geophys. Geosyst. 2011, 12. [Google Scholar] [CrossRef] [Green Version]
  28. Lupker, M.; France-Lanord, C.; Lavé, J.; Bouchez, J.; Galy, V.; Métivier, F.; Gaillardet, J.; Lartiges, B.; Mugnier, J.-L. A Rouse-based method to integrate the chemical composition of river sediments: Application to the Ganga basin. J. Geophys. Res. Space Phys. 2011, 116, 4. [Google Scholar] [CrossRef] [Green Version]
  29. Garzanti, E.; Andó, S.; France-Lanord, C.; Censi, P.; Vignola, P.; Galy, V.; Lupker, M. Mineralogical and chemical variability of fluvial sediments 2. Suspended-load silt (Ganga–Brahmaputra, Bangladesh). Earth Planet. Sci. Lett. 2011, 302, 107–120. [Google Scholar] [CrossRef]
  30. Gan, S.; Wu, Y.; Zhang, J. Bioavailability of dissolved organic carbon linked with the regional carbon cycle in the East China Sea. Deep Sea Res. Part II Top. Stud. Oceanogr. 2016, 124, 19–28. [Google Scholar] [CrossRef]
  31. Liu, Q.; Zeng, X.; Wang, X.J.; Cai, J.G. Lithofacies of mudstone and shale deposits of the Es3z-Es4s formation in Dongying Sag and their depositional environment. Mar. Geol. Quat. Geol. 2017, 3, 147–156. (In Chinese) [Google Scholar] [CrossRef]
  32. Wenzhi, Z.H.A.O.; Rukai, Z.H.U.; Suyun, H.U.; Lianhua, H.O.U.; Songtao, W.U. Accumulation contribution differences between lacustrine organic-rich shales and mudstones and their sig-nificance in shale oil evaluation. Pet. Explor. Dev. 2020, 47, 1160–1171. [Google Scholar]
  33. Emmings, J.F.; Davies, S.J.; Vane, C.H.; Moss-Hayes, V.; Stephenson, M.H. From marine bands to hybrid flows: Sedimentology of a Mississippian black shale. Sedimentology 2019, 67, 261–304. [Google Scholar] [CrossRef]
  34. Zhang, Y.L.; Xi, B.D.; Xu, Q.J. Research of the possibility of using salinity as entrophication criteria indicator of saline lakes. J. Environ. Eng. Technol. 2011, 1, 260–263. (In Chinese) [Google Scholar] [CrossRef]
  35. Crump, B.C.; Hopkinson, C.S.; Sogin, M.L.; Hobbie, J.E. Microbial Biogeography along an Estuarine Salinity Gradient: Combined Influences of Bacterial Growth and Residence Time. Appl. Environ. Microbiol. 2004, 70, 1494–1505. [Google Scholar] [CrossRef] [PubMed] [Green Version]
  36. Svarovsky, L. Solid-Liquid Separation; Butterworth-Heinemann: Oxford, UK, 2000. [Google Scholar]
  37. Algeo, T.J.; Maynard, J. Trace-element behavior and redox facies in core shales of Upper Pennsylvanian Kansas-type cyclothems. Chem. Geol. 2004, 206, 289–318. [Google Scholar] [CrossRef]
  38. Homewood, P.W. Fine-Grained Turbidite Systems. Basin Res. 2001, 13, 377. [Google Scholar] [CrossRef]
  39. Bergaya, F.; Lagaly, G. Handbook of Clay Science; Elsevier: Amsterdam, The Netherlands, 2011; Volume 1. [Google Scholar]
  40. Li, W.; Liu, L.P.; Cao, L.; Yu, L.J. Research status and prospect of biological precipitation of carbonate. Adv. Earth Sci. 2009, 24, 597–605. (In Chinese) [Google Scholar]
  41. Dupraz, C.; Reid, R.P.; Braissant, O.; Decho, A.W.; Norman, R.S.; Visscher, P.T. Processes of carbonate precipitation in modern microbial mats. Earth-Sci. Rev. 2009, 96, 141–162. [Google Scholar] [CrossRef]
  42. Dupraz, C.; Visscher, P.T.; Baumgartner, L.K.; Reid, R.P. Microbe-mineral interactions: Early carbonate precipitation in a hypersaline lake (Eleuthera Island, Bahamas). Sedimentology 2004, 51, 745–765. [Google Scholar] [CrossRef]
  43. Zhang, W.; Cao, Q.; Xu, G.; Wang, D. Flocculation–Dewatering Behavior of Microalgae at Different Growth Stages under Inorganic Polymeric Flocculant Treatment: The Relationships between Algal Organic Matter and Floc Dewaterability. ACS Sustain. Chem. Eng. 2018, 6, 11087–11096. [Google Scholar] [CrossRef]
  44. Peters, K.E. Guidelines for Evaluating Petroleum Source Rock Using Programmed Pyrolysis. AAPG Bull. 1986, 70, 318–329. [Google Scholar] [CrossRef]
Figure 1. Geological settings of study area. (A) Location and structural features of Dongpu Sag; (B) geology synthesis columnar section of study formation.
Minerals 11 00535 g001
Figure 2. Photomicrographs of lithofacies characteristics of the mudrocks from the Dongpu Sag. (A,E,H) Scanned thin sections of the three lithofacies; (BD) detrital minerals and OM in silt-rich massive mudstone; (FH) clay matrix and OM particles of the homogeneous massive mudstone; (I,J) clay-rich laminae and micrite laminae in the laminated mudstone; (K) the OM in clay-rich laminae under a fluorescence microscope.
Minerals 11 00535 g002
Figure 3. The mineralogical composition of the lithofacies.
Minerals 11 00535 g003
Figure 4. Major and minor elements distribution of the lithofacies. (A) Major elements abundance relative to the NASC; (B) minor elements abundance relative to the NASC.
Minerals 11 00535 g004
Figure 5. OM shape and type and TOC proportion of each lithofacies.
Minerals 11 00535 g005
Figure 6. Geochemical proxies and correlation chart of each lithofacies. (A) Si-Ca/Al chart; (B) TOC and HI value distribution histogram of the shallow water terrigenous input zone; (C) TOC and HI value distribution histogram of the deep water authigenic zone; (D) salinity and palaeoredox proxies—TOC correlation plot of the lithofacies.
Minerals 11 00535 g006
Figure 7. The hydrocarbon generation capacity of the three lithofacies (the circles stand for the samples of each lithofacies).
Minerals 11 00535 g007
Figure 8. Differences between the northern and the southern part.
Minerals 11 00535 g008
Table 1. Mineralogical composition and pyrolysis results of the mudrocks of Dongpu Sag. XRD test.
SamplesClay Minerals/%Detrital Minerals/%Carbonate Minerals/%Pyrite/%Anhydrite/%
QuartzFeldsparCalciteDolomite
Min of all samples8.004.002.001.000.000.001.00
Max of all samples57.0046.0044.0067.0083.006.0023.00
AverageAll samples35.9622.8212.6017.507.381.112.05
Northern part35.7421.5112.9517.978.411.142.21
Southern part36.3825.4311.8916.556.541.061.75
Silt-rich massive mudstone37.5927.7315.8010.674.881.092.02
Homogeneous massive mudstone38.1620.7710.5716.849.531.072.68
Laminated mudstone29.8516.009.0931.6110.552.351.19
Pyrolysis Analysis
TOC/
wt.%
HI/mgHC/g org.COI/mgCO2/g org.CS1/
mg/g
S2/
mg/g
PITmax/°C
Min0.050.06.00.000.000.00335.0
Max4.21648.0871.02.7727.261.00611.0
AverageAll samples0.73111.1164.90.211.670.21451.9
Northern part0.86121.5186.70.252.030.24453.5
Southern part0.4790.3121.50.120.960.16448.6
Silt-rich massive mudstone0.3939.5184.50.050.310.25454.4
Homogeneous massive mudstone0.61100.5187.50.141.290.20457.2
Laminated mudstone1.56264.296.80.614.830.14440.8
Publisher’s Note: MDPI stays neutral with regard to jurisdictional claims in published maps and institutional affiliations.

