Article

Experimental Study on Relative Permeability Characteristics for CO2 in Sandstone under High Temperature and Overburden Pressure

1
State Key Laboratory for Geomechanics and Deep Underground Engineering, China University of Mining and Technology, Xuzhou 221116, China
2
School of Mines, China University of Mining and Technology, Xuzhou 221116, China
*
Author to whom correspondence should be addressed.
Submission received: 28 July 2021 / Revised: 24 August 2021 / Accepted: 30 August 2021 / Published: 31 August 2021
(This article belongs to the Special Issue Minerals Impact on CO2 Geo-sequestration in Deep Reservoirs)

Abstract

:
In this study, CO2 seepage of sandstone samples from the Taiyuan-Shanxi Formation coal seam roof in Ordos Basin, China, under temperature-stress coupling was studied with the aid of the TAWD-2000 coal rock mechanics-seepage test system. Furthermore, the evolution law and influencing factors on permeability for CO2 in sandstone samples with temperature and axial pressure were systematically analyzed. The results disclose that the permeability of sandstone decreases with the increase in stress. The lower the stress is, the more sensitive the permeability is to stress variation. High stress results in a decrease in permeability, and when the sample is about to fail, the permeability surges. The permeability of sandstone falls first and then rises with the rise of temperature, which is caused by the coupling among the thermal expansion of sandstone, the desorption of CO2, and the evaporation of residual water in fractures. Finally, a quadratic function mathematical model with a fitting degree of 98.2% was constructed between the temperature-stress coupling effect and the permeability for CO2 in sandstone. The model provides necessary data support for subsequent numerical calculation and practical engineering application. The experimental study on the permeability characteristics for CO2 in sandstone under high temperature and overburden pressure is crucial for evaluating the storage potential and predicting the CO2 migration evolution in underground coal gasification coupling CO2 storage projects.

1. Introduction

The emissions of greenhouse gases are responsible for global warming and eventually will lead to catastrophic consequences [1,2]. This has become a consensus among international academia and government departments. Since the industrialization period, the concentrations of major greenhouse gases (such as CO2, CH4, N2O, and O3) in the atmosphere have reached a record high due to human activities that are overly dependent on fossil fuels (coal, oil, natural gas, etc.) [3,4,5]. It can be predicted that the atmospheric CO2 concentration will reach 540–970 ppm by the year 2100; the global average ground temperature will rise by 1.4–5.8 °C in the period 1990–2100, and the average ground temperature in China will rise by 3.9–6.0 °C in the year 2100 [6,7,8,9]. The “greenhouse effect” of global climate will bring potentially catastrophic threats to humankind and the entire environmental system of the Earth. Therefore, reducing CO2 emissions to the atmosphere is the most effective way to prevent or decelerate the continuing climate warming.
The technology of CO2 capturing and storage (CCS) [10,11], one of the direct and effective technologies to reduce CO2 emissions and alleviate the greenhouse effect, captures CO2 from large emission sources like thermal power plants and then transports it to designated positions (the ground or the seabed) for permanent storage [12,13]. Al-Khdheeawi et al. [14,15,16,17,18,19,20,21,22,23,24,25,26] conducted some beneficial research in this regard. They investigated important effecting parameters on the CO2 trapping capacity and CO2 storage efficiency (e.g., CO2-rock wettability, reservoir heterogeneity, injection well configuration, salinity, relative permeability hysteresis). It is verified that the CCS technology can reduce CO2 emissions and is expected to greatly solve climate problems in the future. In CO2 geological storage engineering, the reservoir roof serves as the main isolator medium, and its permeability and porosity directly affect the CO2 storage efficiency and the time of safe storage. Thus, scholars have carried out extensive experimental and theoretical research on rock permeability and pore structure [27,28,29,30,31,32]. Fatt et al. [33] studied the relationship between sandstone permeability and overburden pressure/confining pressure and found that permeability was negatively correlated with the two pressure forms, and the variation was notable in the low-pressure area. Toderas et al. [34] deemed that under the action of water and underground climate, most of the rocks experienced degradation and reduction of mechanical strength and elastic characteristics so that their permeability characteristics were affected. Amalia et al. [35] simulated CO2 injection into sandstone and explored relative permeability characteristics for CO2 in sandstone under normal temperature and overburden pressure. Zhang et al. [36] held that the permeability of salt rock with different components rose with the increase in pore pressure and was affected by the Klinkenberg effect. Al-Khdheeawi et al. [37,38] studied the effects of rock properties on geochemical reactivity and CO2 storage efficiency and the effects of CO2 injection on permeability. Vairogs et al. [39] and Zheng et al. [40] believed that the variation of effective stress affected the permeability of rock by influencing its pore structure characteristics and skeleton structure characteristics. Moosavi et al. [41] thought that in the whole stress-strain process, the permeability varied in different ways in the elastic stage, the elastic-plastic stage, and the residual flow stage due to the different deformation degrees of rock samples. Killough et al. [42], Agheshlui et al. [43], and Lu et al. [44] constructed single function mathematical models such as cubic polynomial, logarithmic function, and power function of confining pressure and permeability, respectively. Many studies have focused on the variations, influence mechanisms, and mathematical models of the relationship between rock permeability and stress.
However, with the development of the technology of underground coal gasification (UCG), Thomas Kempka used three different-rank coals in Germany as gasification raw materials to simulate the actual gasification process at 800 °C in the laboratory. The simulation results revealed a 42% increase in the physical adsorption capacity after gasification compared with that before gasification [45,46,47,48,49]. This indicates that supercritical high-pressure CO2 storage in the UCG combustion zone is feasible in terms of physical properties. As a new CCS technology, the technology of underground coal gasification coupling CO2 storage (UCG-CCS) has been attracting attention, but the CO2 permeability law of coal seam roof under high temperature and overburden pressure requires more research reports. Therefore, taking the UCG-CCS demonstration project in Ordos Basin, China, as the background, this research collected sandstone roof samples of a coal seam in Taiyuan Formation-Shanxi Formation and systematically tested the permeability characteristics for CO2 under the coupling among temperature, pressure, and confining pressure. These research results not only provide a basis for numerical simulation calculation and engineering practice of UCG-CCS in Ordos Basin but also boast guiding significance for the site selection and safety evaluation of UCG-CCS projects.

2. Experimental Materials and Methods

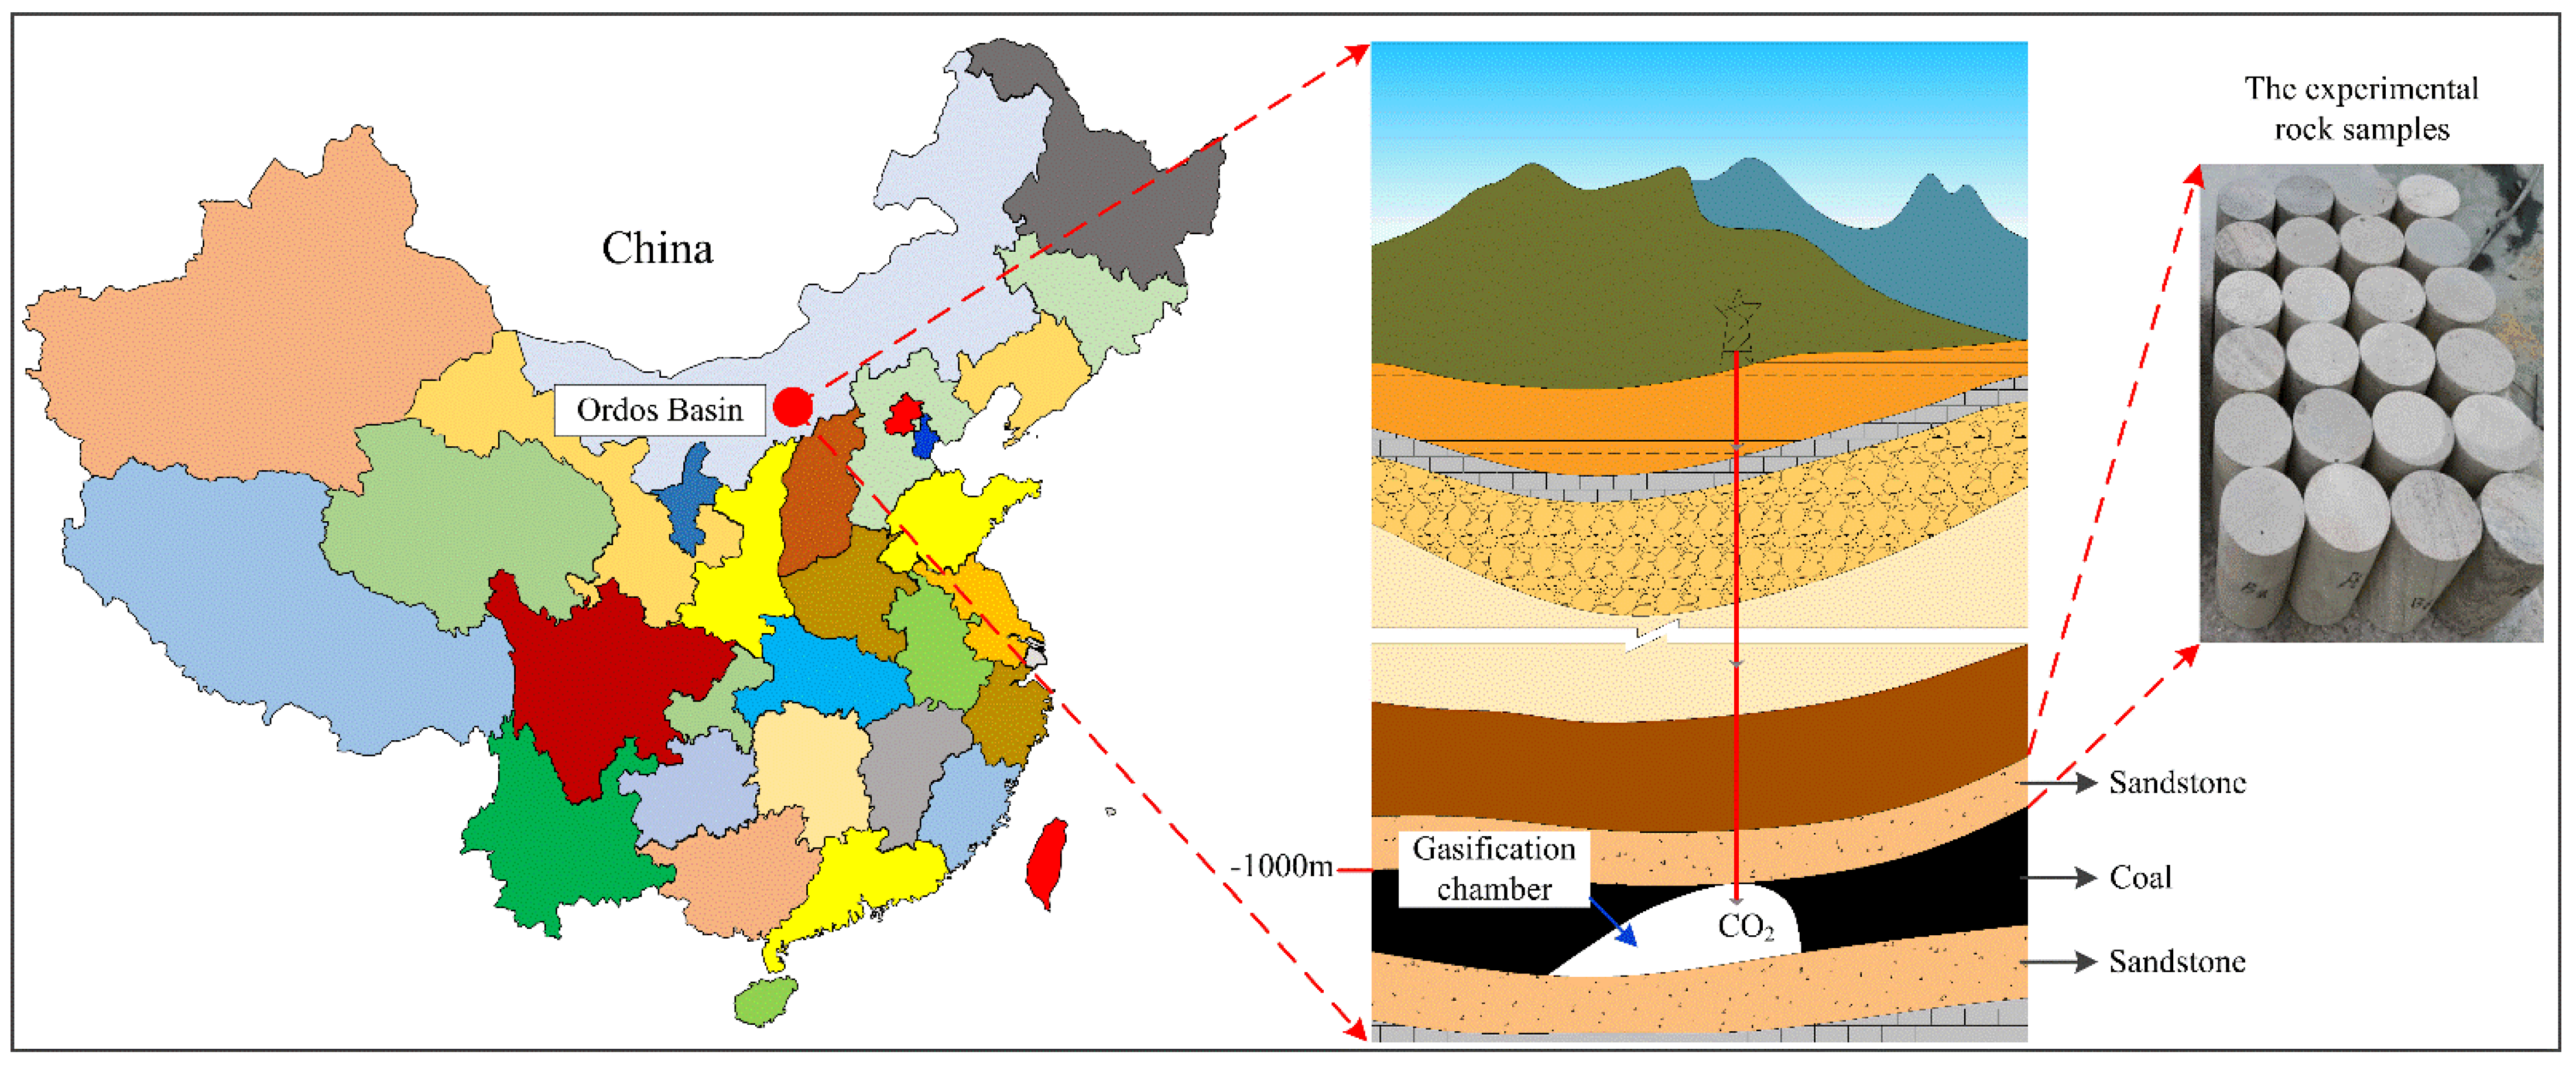
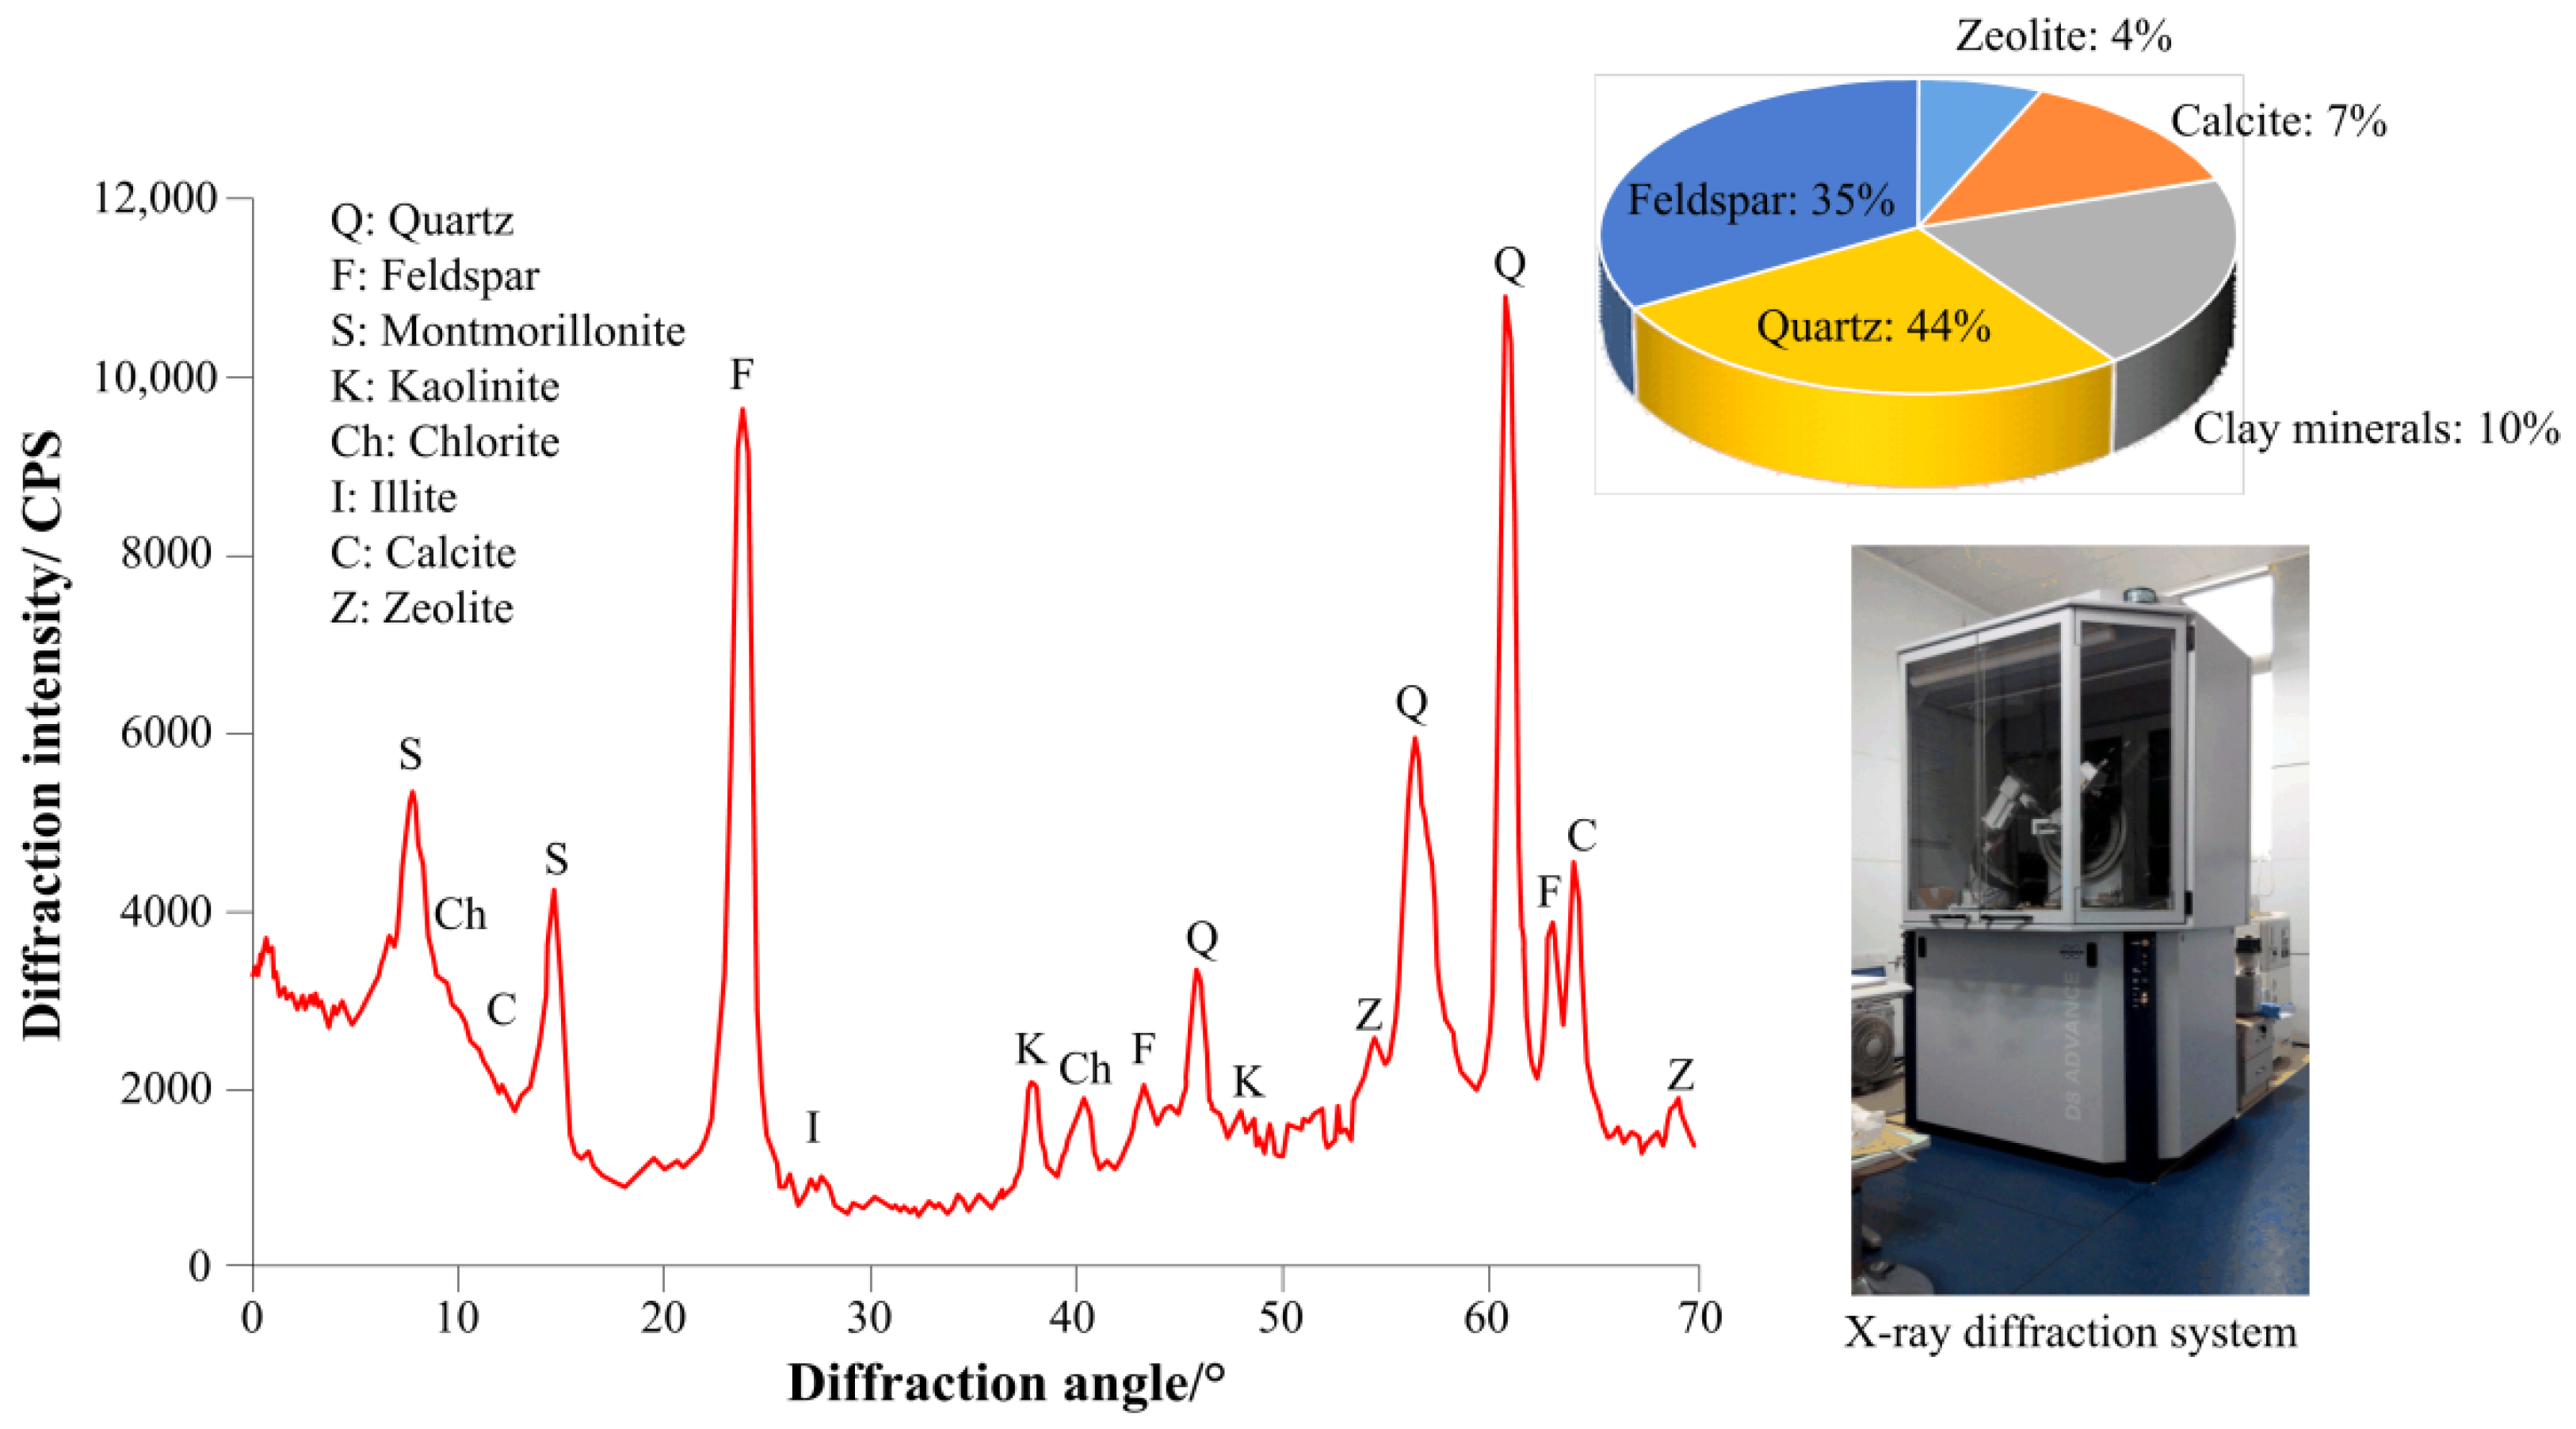
2.1. Experiment Materials

The experimental rock samples were taken from the sandstone roof of a coal seam in the Taiyuan Formation-Shanxi Formation in Ordos Basin, China. The rock blocks were directly transported from the field to the Mechanical Experiment Center of China University of Mining and Technology for centralized drilling and processing. According to the test platform and test specifications, the processed rock samples were cylindrical samples with a height of 95–102 mm, a diameter of about 50 mm, a parallelism below ±0.05 mm between the upper and lower ends, and a flatness below 0.02 mm between the ends (Figure 1). The processed rock samples were all sealed and preserved for the test. The results of X-ray diffraction analysis revealed that the rock samples were feldspar quartz sandstone, containing 44% quartz, 35% feldspar minerals, 10% clay minerals, 7% calcite, and 4% zeolite. In addition, the sandstone samples contained considerable clay minerals, among which montmorillonite had the highest content. The ratio of montmorillonite to total clay minerals in the sandstone samples was 55%, and the ratios of kaolinite, chlorite, and illite are 16%, 27%, and 2%, respectively. The X-ray diffraction spectrum is shown in Figure 2.

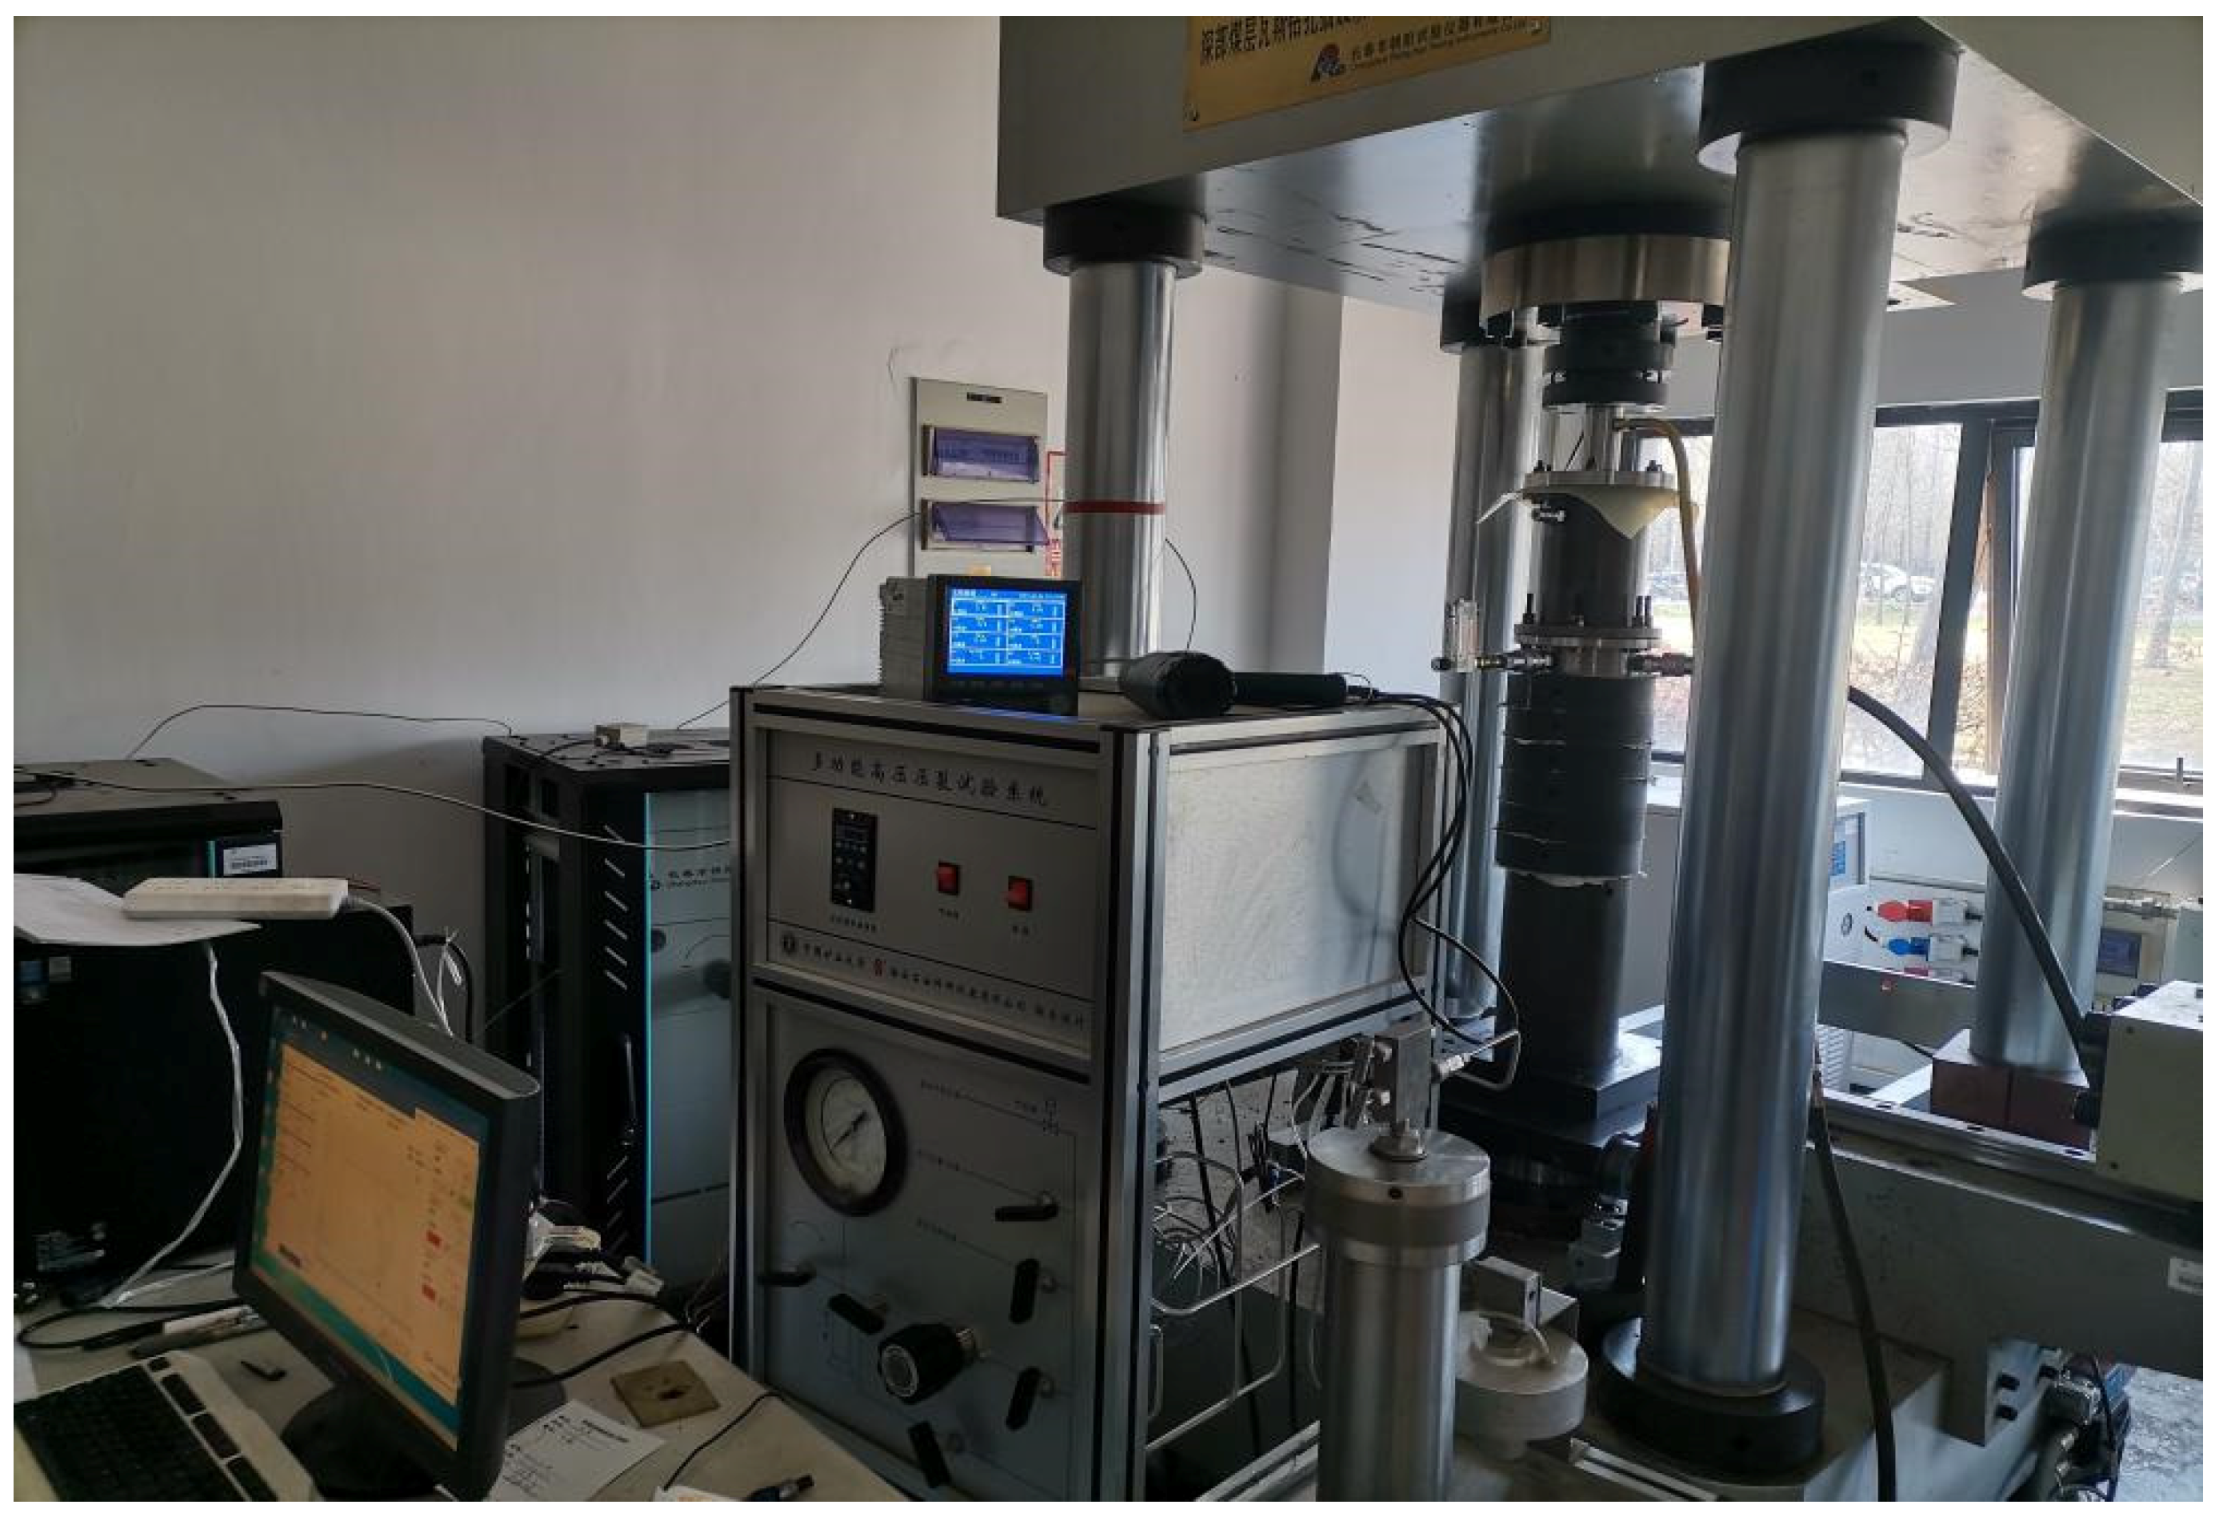
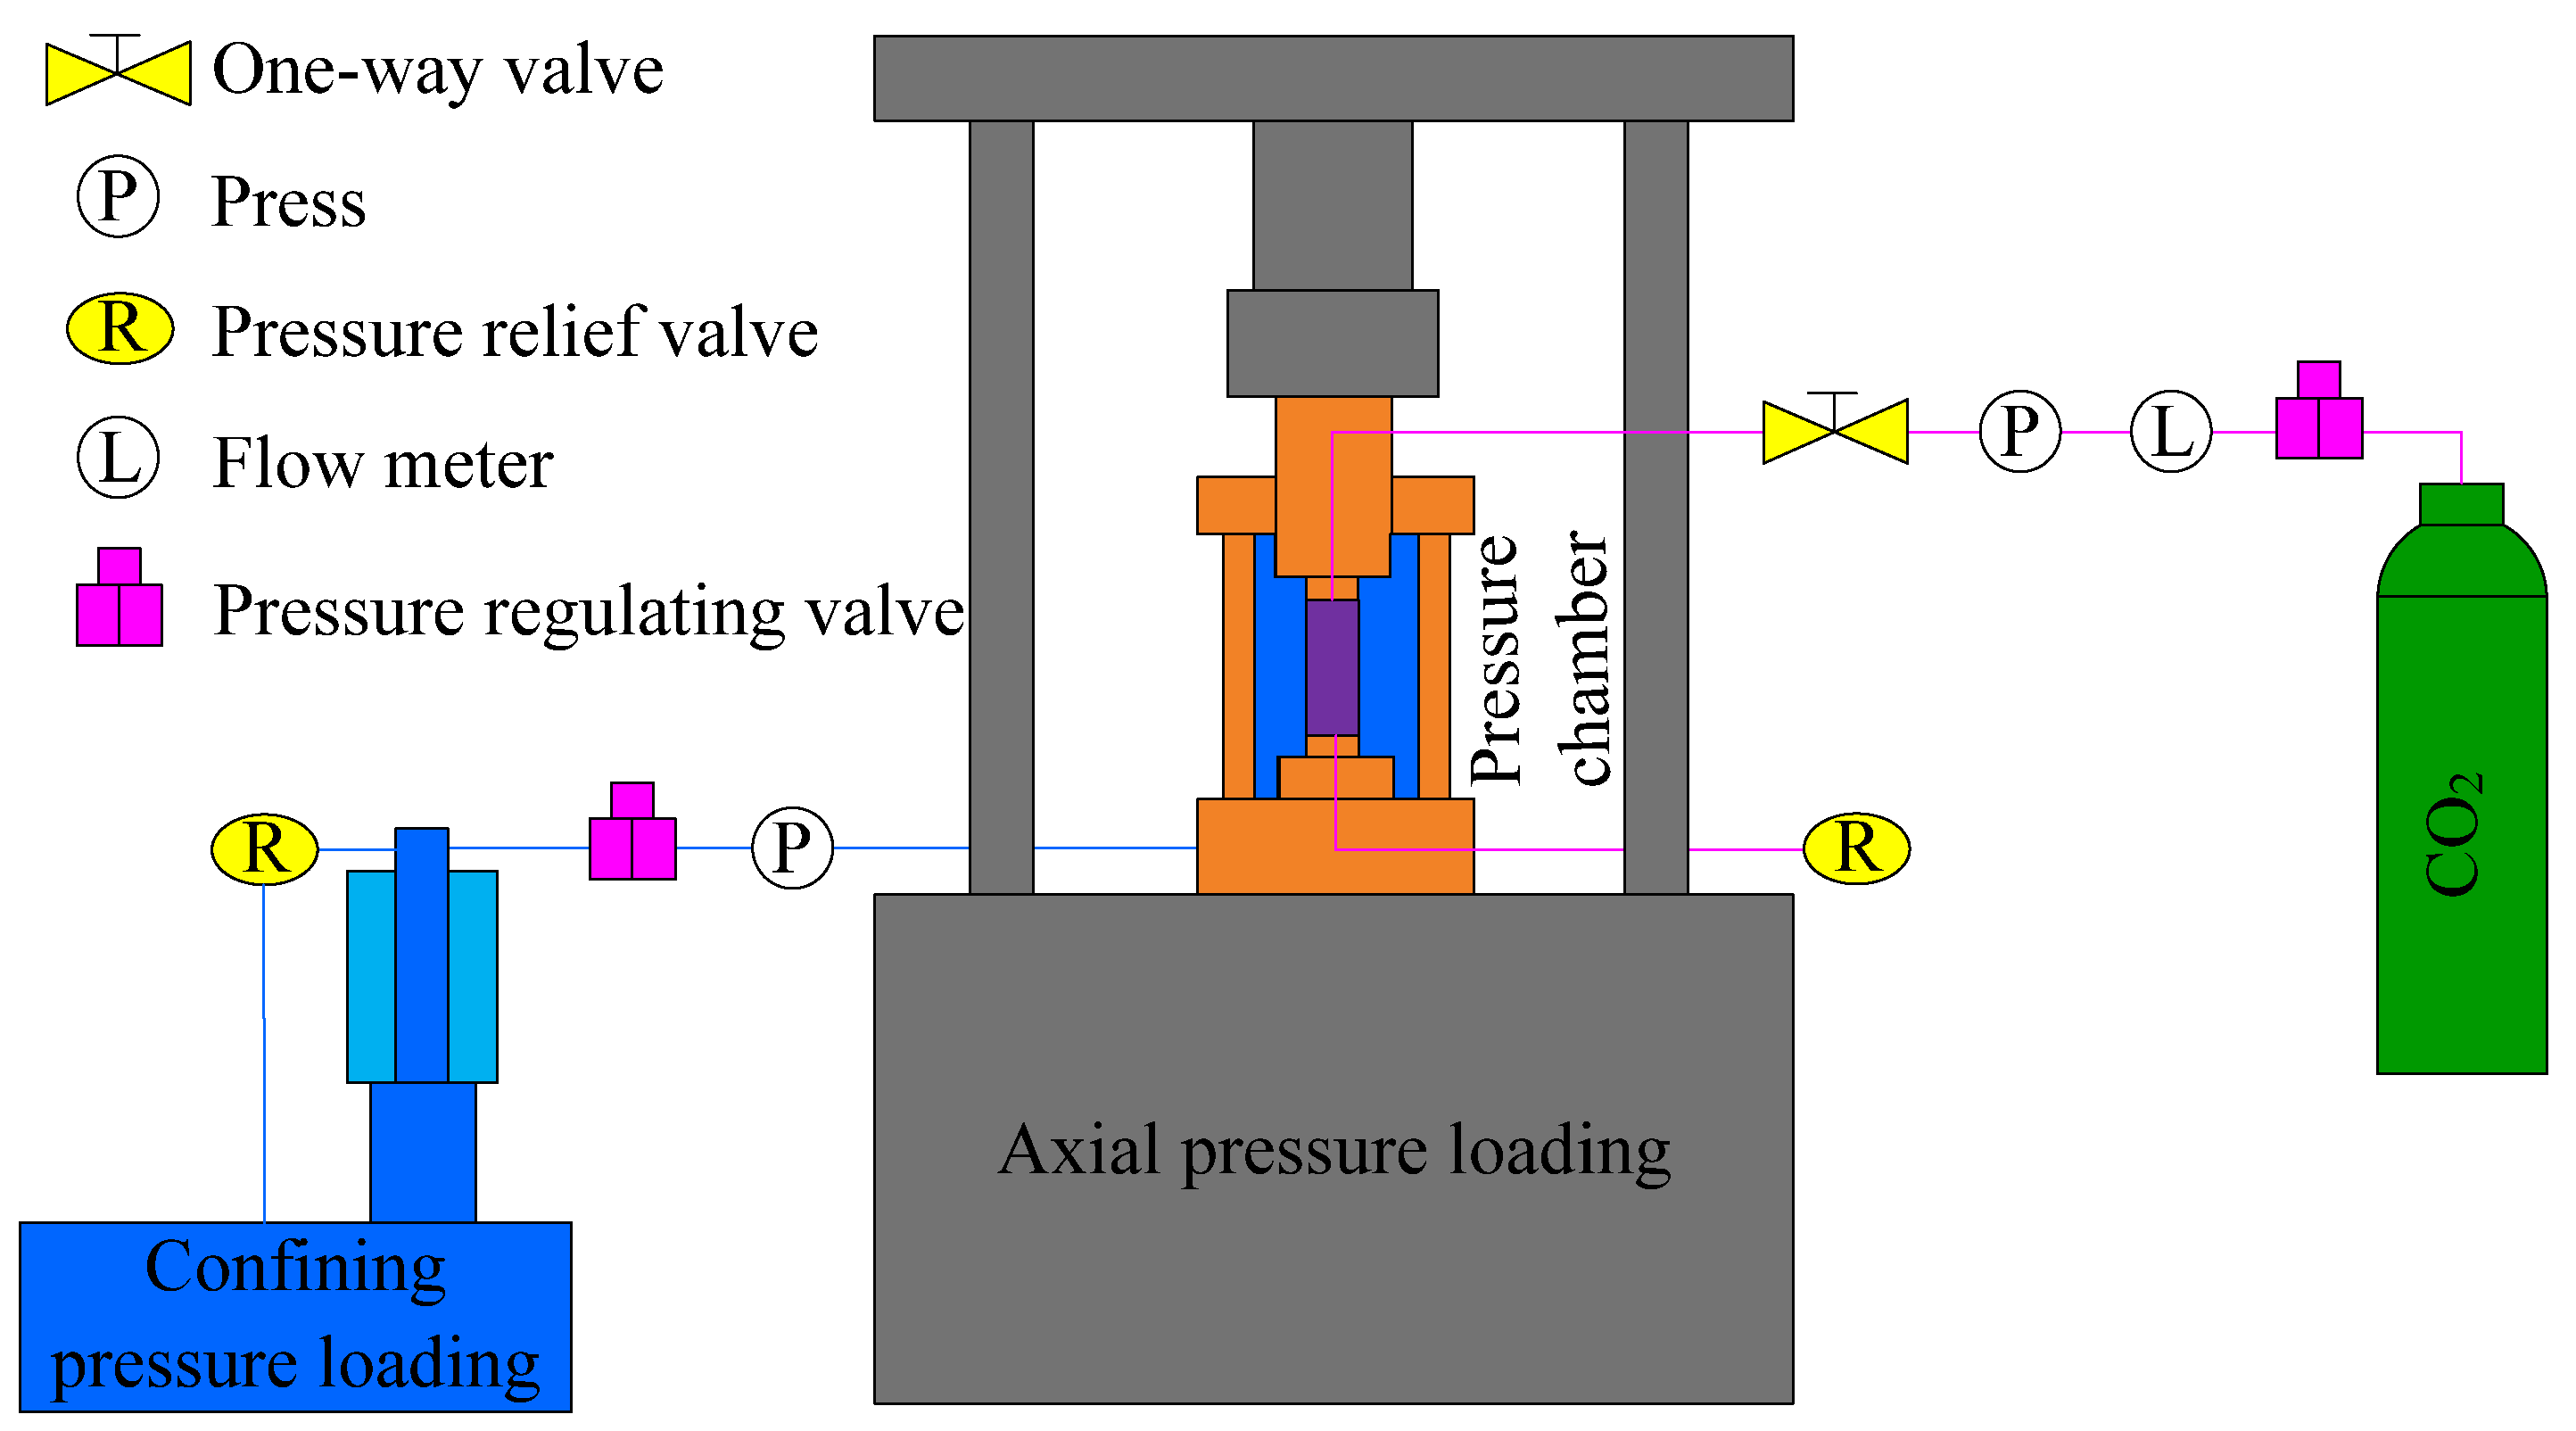
2.2. Test Equipment and Principle
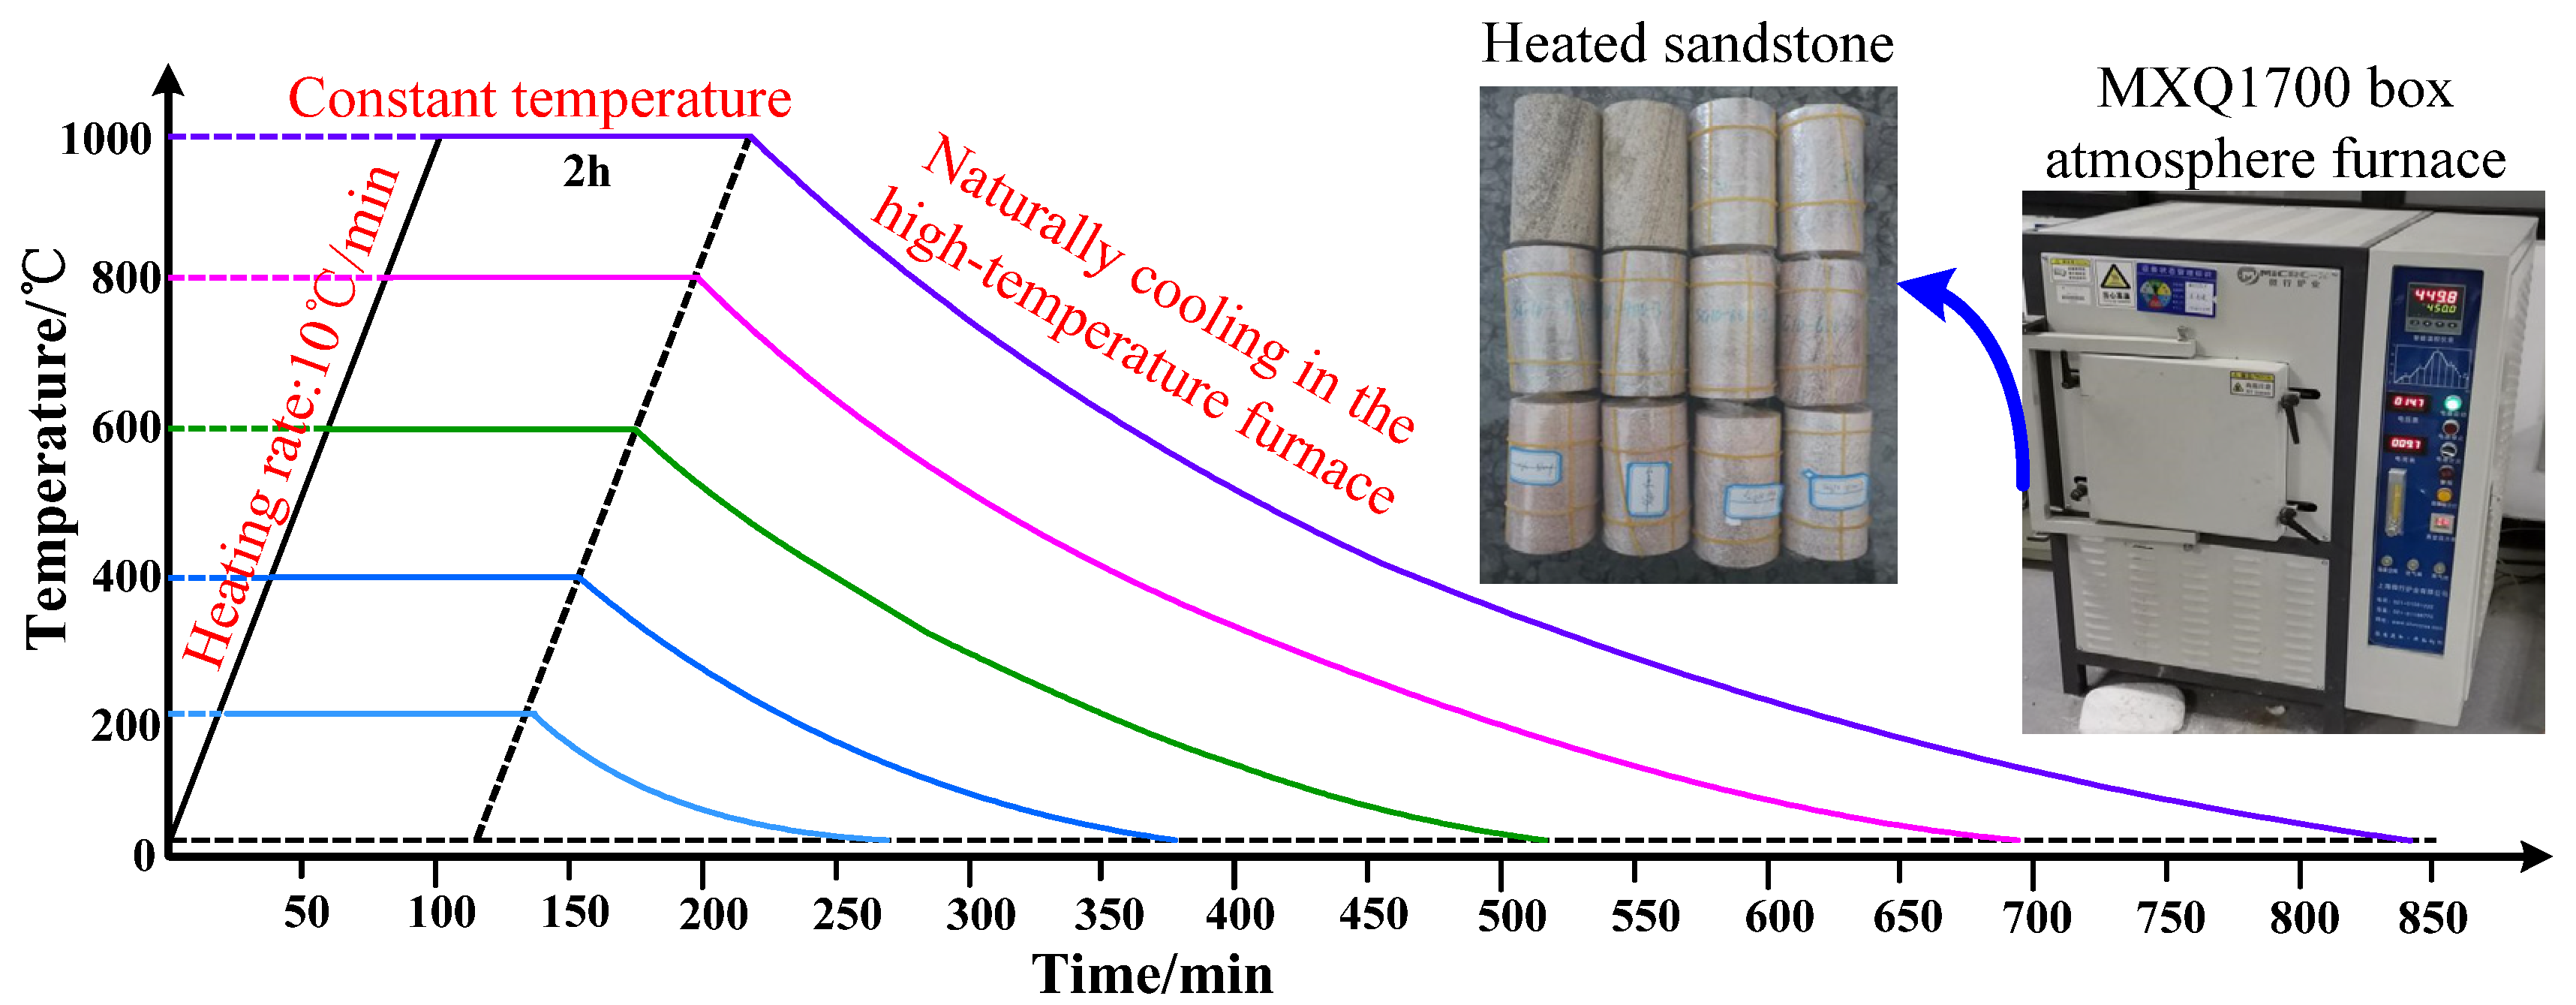
The test was conducted on the TAWD-2000 coal-rock mechanics-seepage test system in China University of Mining and Technology (Figure 3). The system, which mainly consisted of a pressure host system, a pressure and temperature control system, and a microcomputer operating system, could determine rock permeability under different pressure conditions. The maximum working pressures of confining pressure and injection pressure were both 70 MPa, and the maximum working pressure of axial pressure was 800 MPa. The pressure fluctuation within 48 h was below 0.5%. The experiment was performed at a constant temperature of 25 °C, with CO2 being the seepage medium.
The principle of the rock sample permeability measurement test is illustrated in Figure 4. Considering the compressibility of gas, gas seepage is calculated by the average pressure of gas.
P ¯ = P 1 + P 2 2
According to Boyle’s law [47]
V 0 P 0 = V ¯ · P ¯ = V ¯ P 1 + P 2 2
Then
V ¯ = 2 V 0 P 0 P 1 + P 2
Based on Darcy’s law of gas seepage [47]
Q = k A μ Δ P Δ L
Combine Equations (3) and (4), then
Q ¯ = V ¯ t = 2 V 0 P 0 t ( P 1 + P 2 ) = k A ( P 1 P 2 ) μ L
Q = V 0 t = k A ( P 1 2 P 2 2 ) 2 μ P 0 L
The above equation can be rewritten as
k = 2 P 0 Q μ L A ( P 1 2 P 2 2 )
Coefficients are set
η = 2 P 0 μ L A ( P 1 2 P 2 2 )
Then
k = η Q
where k is the permeability, Darcy; Q is the transient flow rate of gas under the standard condition, mL/s; μ is the aerodynamic viscosity, mPa·s; L is the sample height, cm; A is the sample seepage cross-sectional area, cm2; P0 is the standard atmospheric pressure, 0.1 MPa; P1 is the gas injection pressure, 0.1 MPa; P2 is the outlet pressure, MPa.
The permeability test parameters are shown in Table 1.
Through calculation, it can be obtained that
η = 3.8197 × 10 5 Darcy · s / SmL

2.3. Test Process

The control targets for confining pressure and gas pressure were 10 MPa and 2 MPa, respectively, and those for temperature were room temperature, 200 °C, 400 °C, 600 °C, 800 °C, and 1000 °C. The initial value and gradient of sandstone axial pressure loading were 15 MPa and 5 MPa, respectively. In practice, due to the instability of gas flow and the hysteresis of temperature variation, some targets deviated slightly, as shown in the test results. The specific steps of the test are as follows:
(1) Heat treatment: Samples were placed in the atmosphere furnace whose mouth was sealed with asbestos, and then the furnace door was closed. Before heating, the heating rate was set at 10 °C/min, and the heating temperatures were room temperature, 200 °C, 400 °C, 600 °C, 800 °C, and 1000 °C, respectively. Three samples were arranged for each temperature gradient, the constant temperature time being 2 h. After heating, the atmosphere furnace remained closed until the sample naturally cooled to about 50 °C. Subsequently, the samples were taken out (Figure 5).
(2) Samples were taken out for physical measurement (Table 2). After measurement, samples were sealed and placed in the pressure chamber, which was then placed on the platform of the testing machine. Next, the confining pressure line and the gas line were connected.
(3) The test machine was turned on, with the axial loading rate being 0.02 mm/s and the loading target value being 15 MPa. When the axial pressure reached the target value, the confining pressure loading device was turned on, the confining pressure being 10 MPa.
(4) The cylinder was opened. The injection pressure was controlled at 2 MPa through the pressure regulating valve. Then, the gas pressure relief valve at the outlet of the pressure chamber was opened. After the flow meter reading stabilized, it was recorded as the transient flow value to calculate the sandstone CO2 permeability under such load.
(5) The axial pressure was raised to the next target value at the loading gradient of 5 MPa. Step (4) was repeated until the sample failure.

3. Test Results and Analysis

The gas transient flow values of sandstone after heat treatment at different temperatures under different loads during loading were obtained through tests. With reference to the test principle, the permeability values of sandstone samples after heat treatment at different temperatures were calculated.

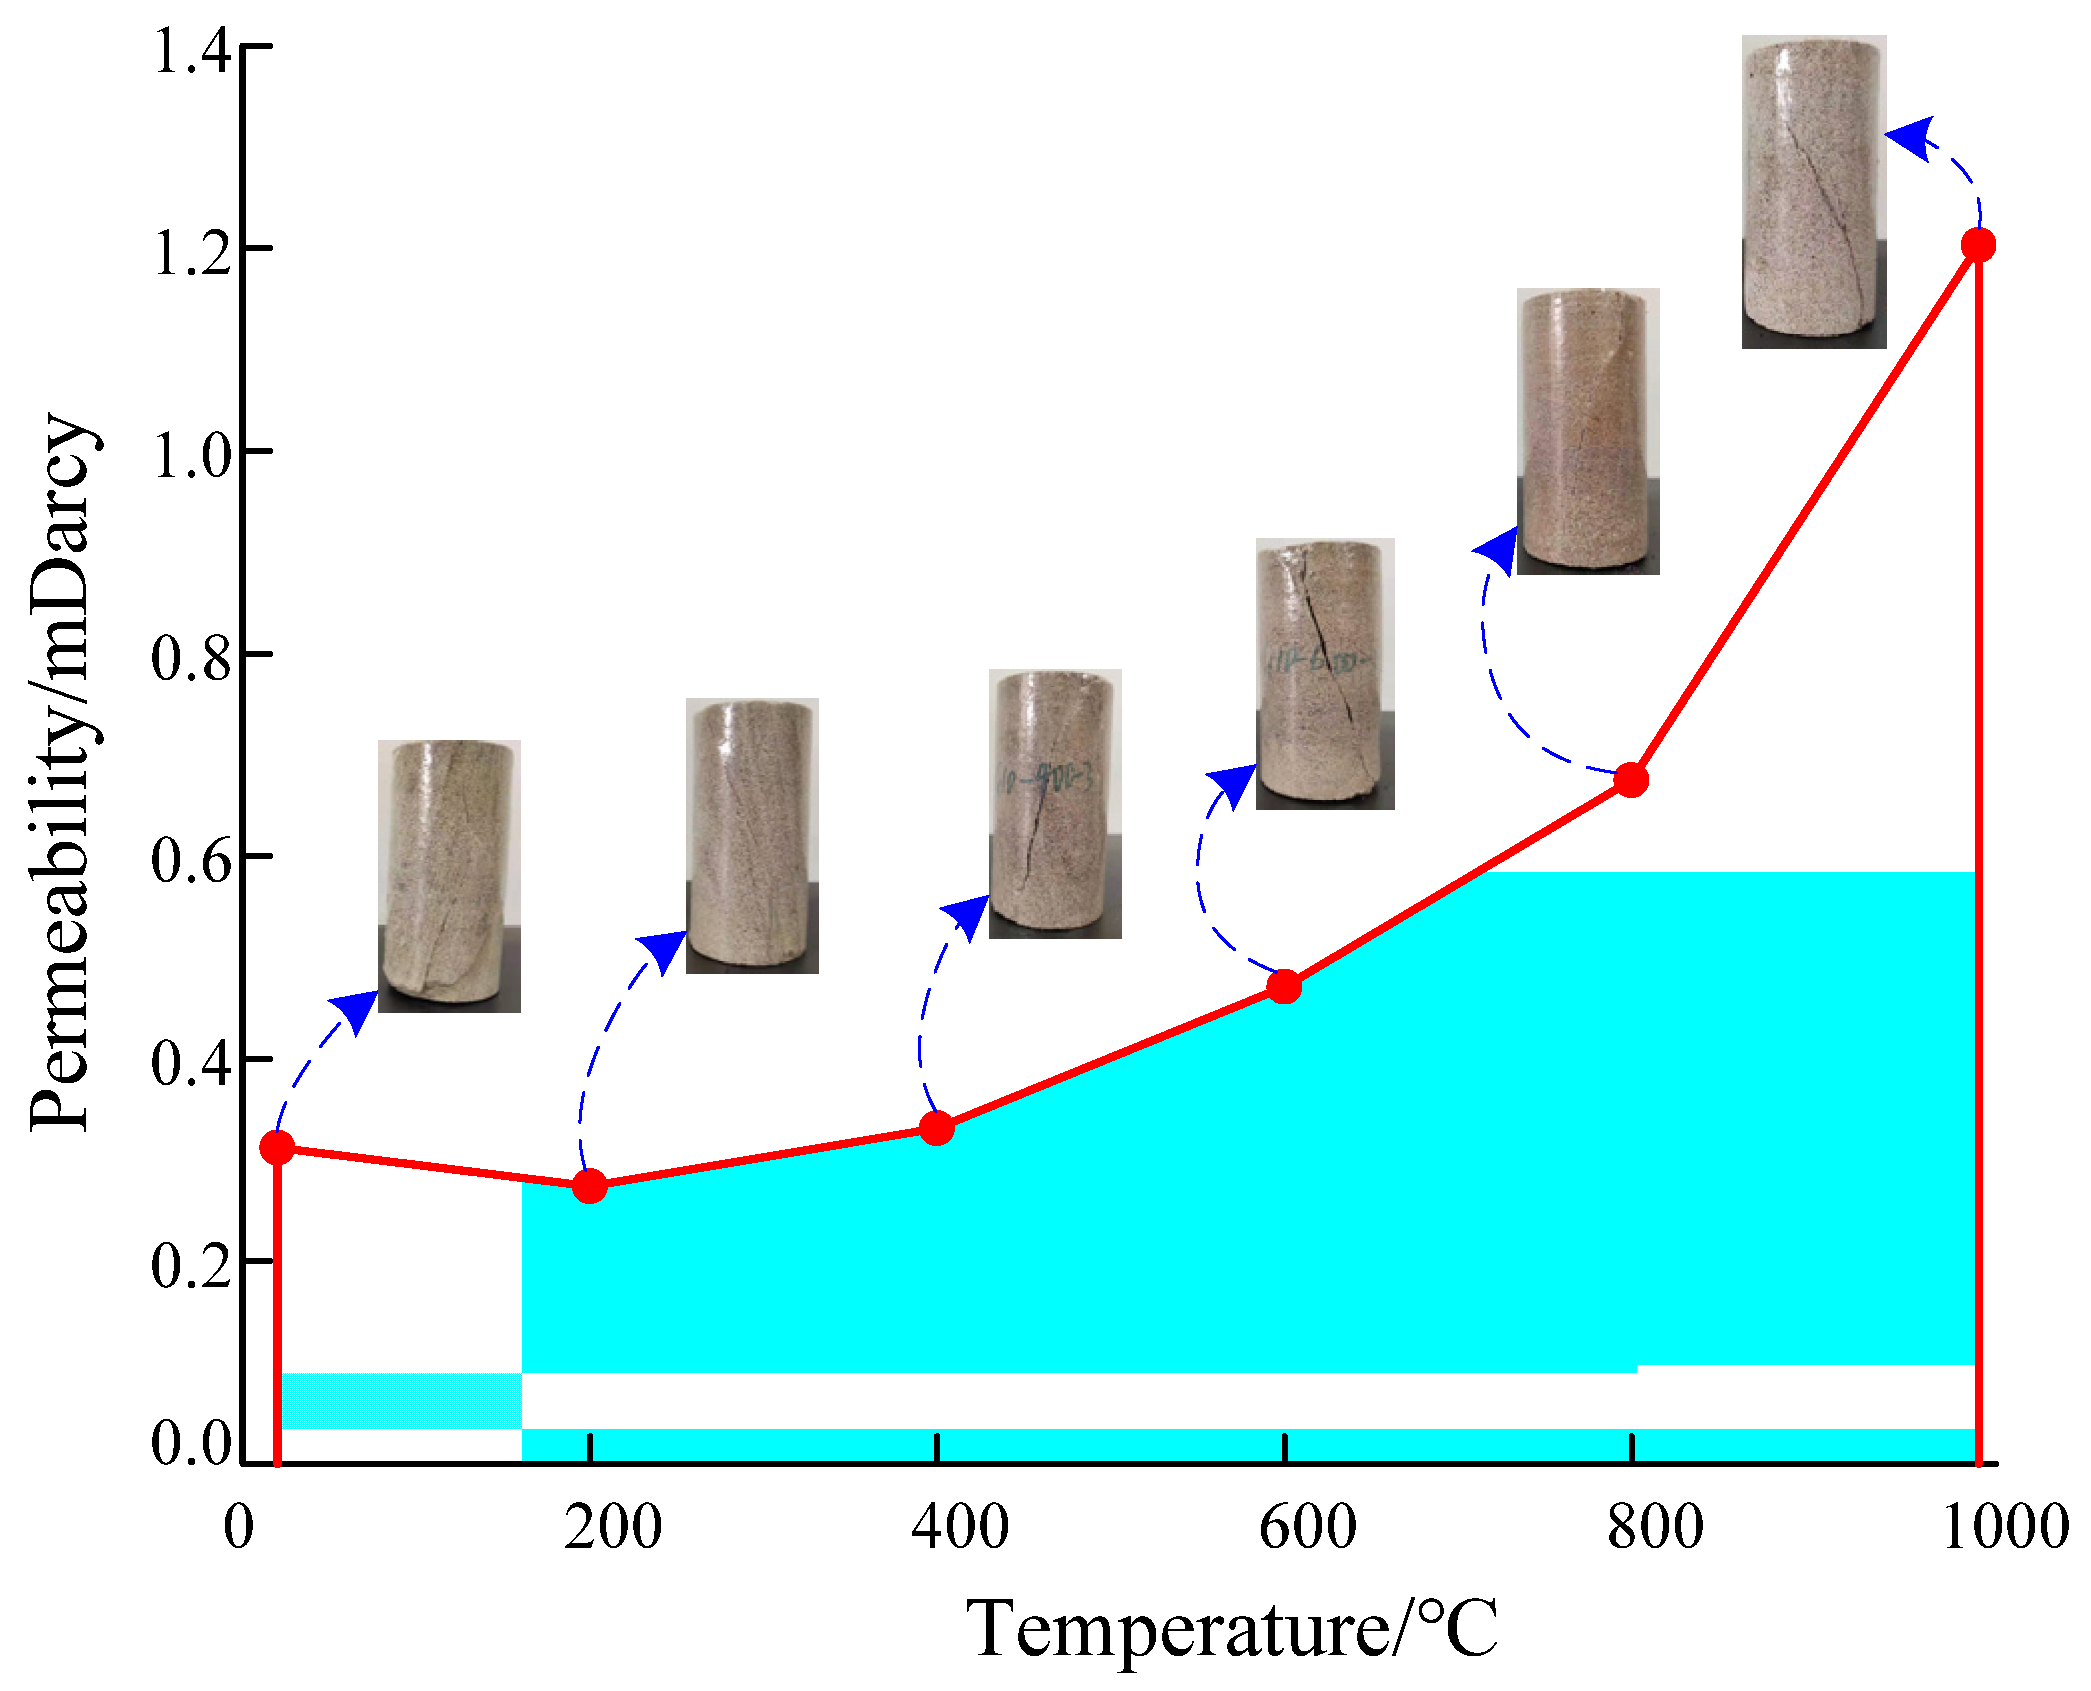
3.1. Variation of Permeability with Temperature

The variation of permeability with temperature under the initial stress conditions (axial pressure 15 MPa and confining pressure 10 MPa) is shown in Figure 6. With the rise of temperature, the permeability of sandstone slightly decreases first and then increases. When the temperature rises from room temperature to 200 °C, the permeability declines slightly from 0.312 mDarcy to 0.274 mDarcy by 12.2%. The above permeability variation with temperature can be explained by the following three reasons: First, a certain degree of increase in temperature causes thermal expansion of rock mass and extrusion of fracture channels, thereby lowering the permeability. Second, a certain degree of increase in temperature lowers the CO2 adsorption capacity of sandstone and minimizes the pore channels, resulting in a decrease in permeability. Third, after the volatilization of residual water in the sandstone fracture channel, the pore space is in a compressed state, and the rate of gas passing through pores decreases. However, as the temperature continues to rise, the rock matrix shrinks, and the pore channel increases, resulting in thermal failure inside the rock. Hence, when the temperature continues to increase from 200 °C, the permeability jumps. At sandstone temperatures of 400 °C, 600 °C, 800 °C, and 1000 °C, the permeability of sandstone increases to 0.331 mDarcy, 0.471 mDarcy, 0.675 mDarcy, and 1.203 mDarcy by 6.0%, 51.0%, 116.3%, and 285.6%, respectively, compared with the value at normal temperature.

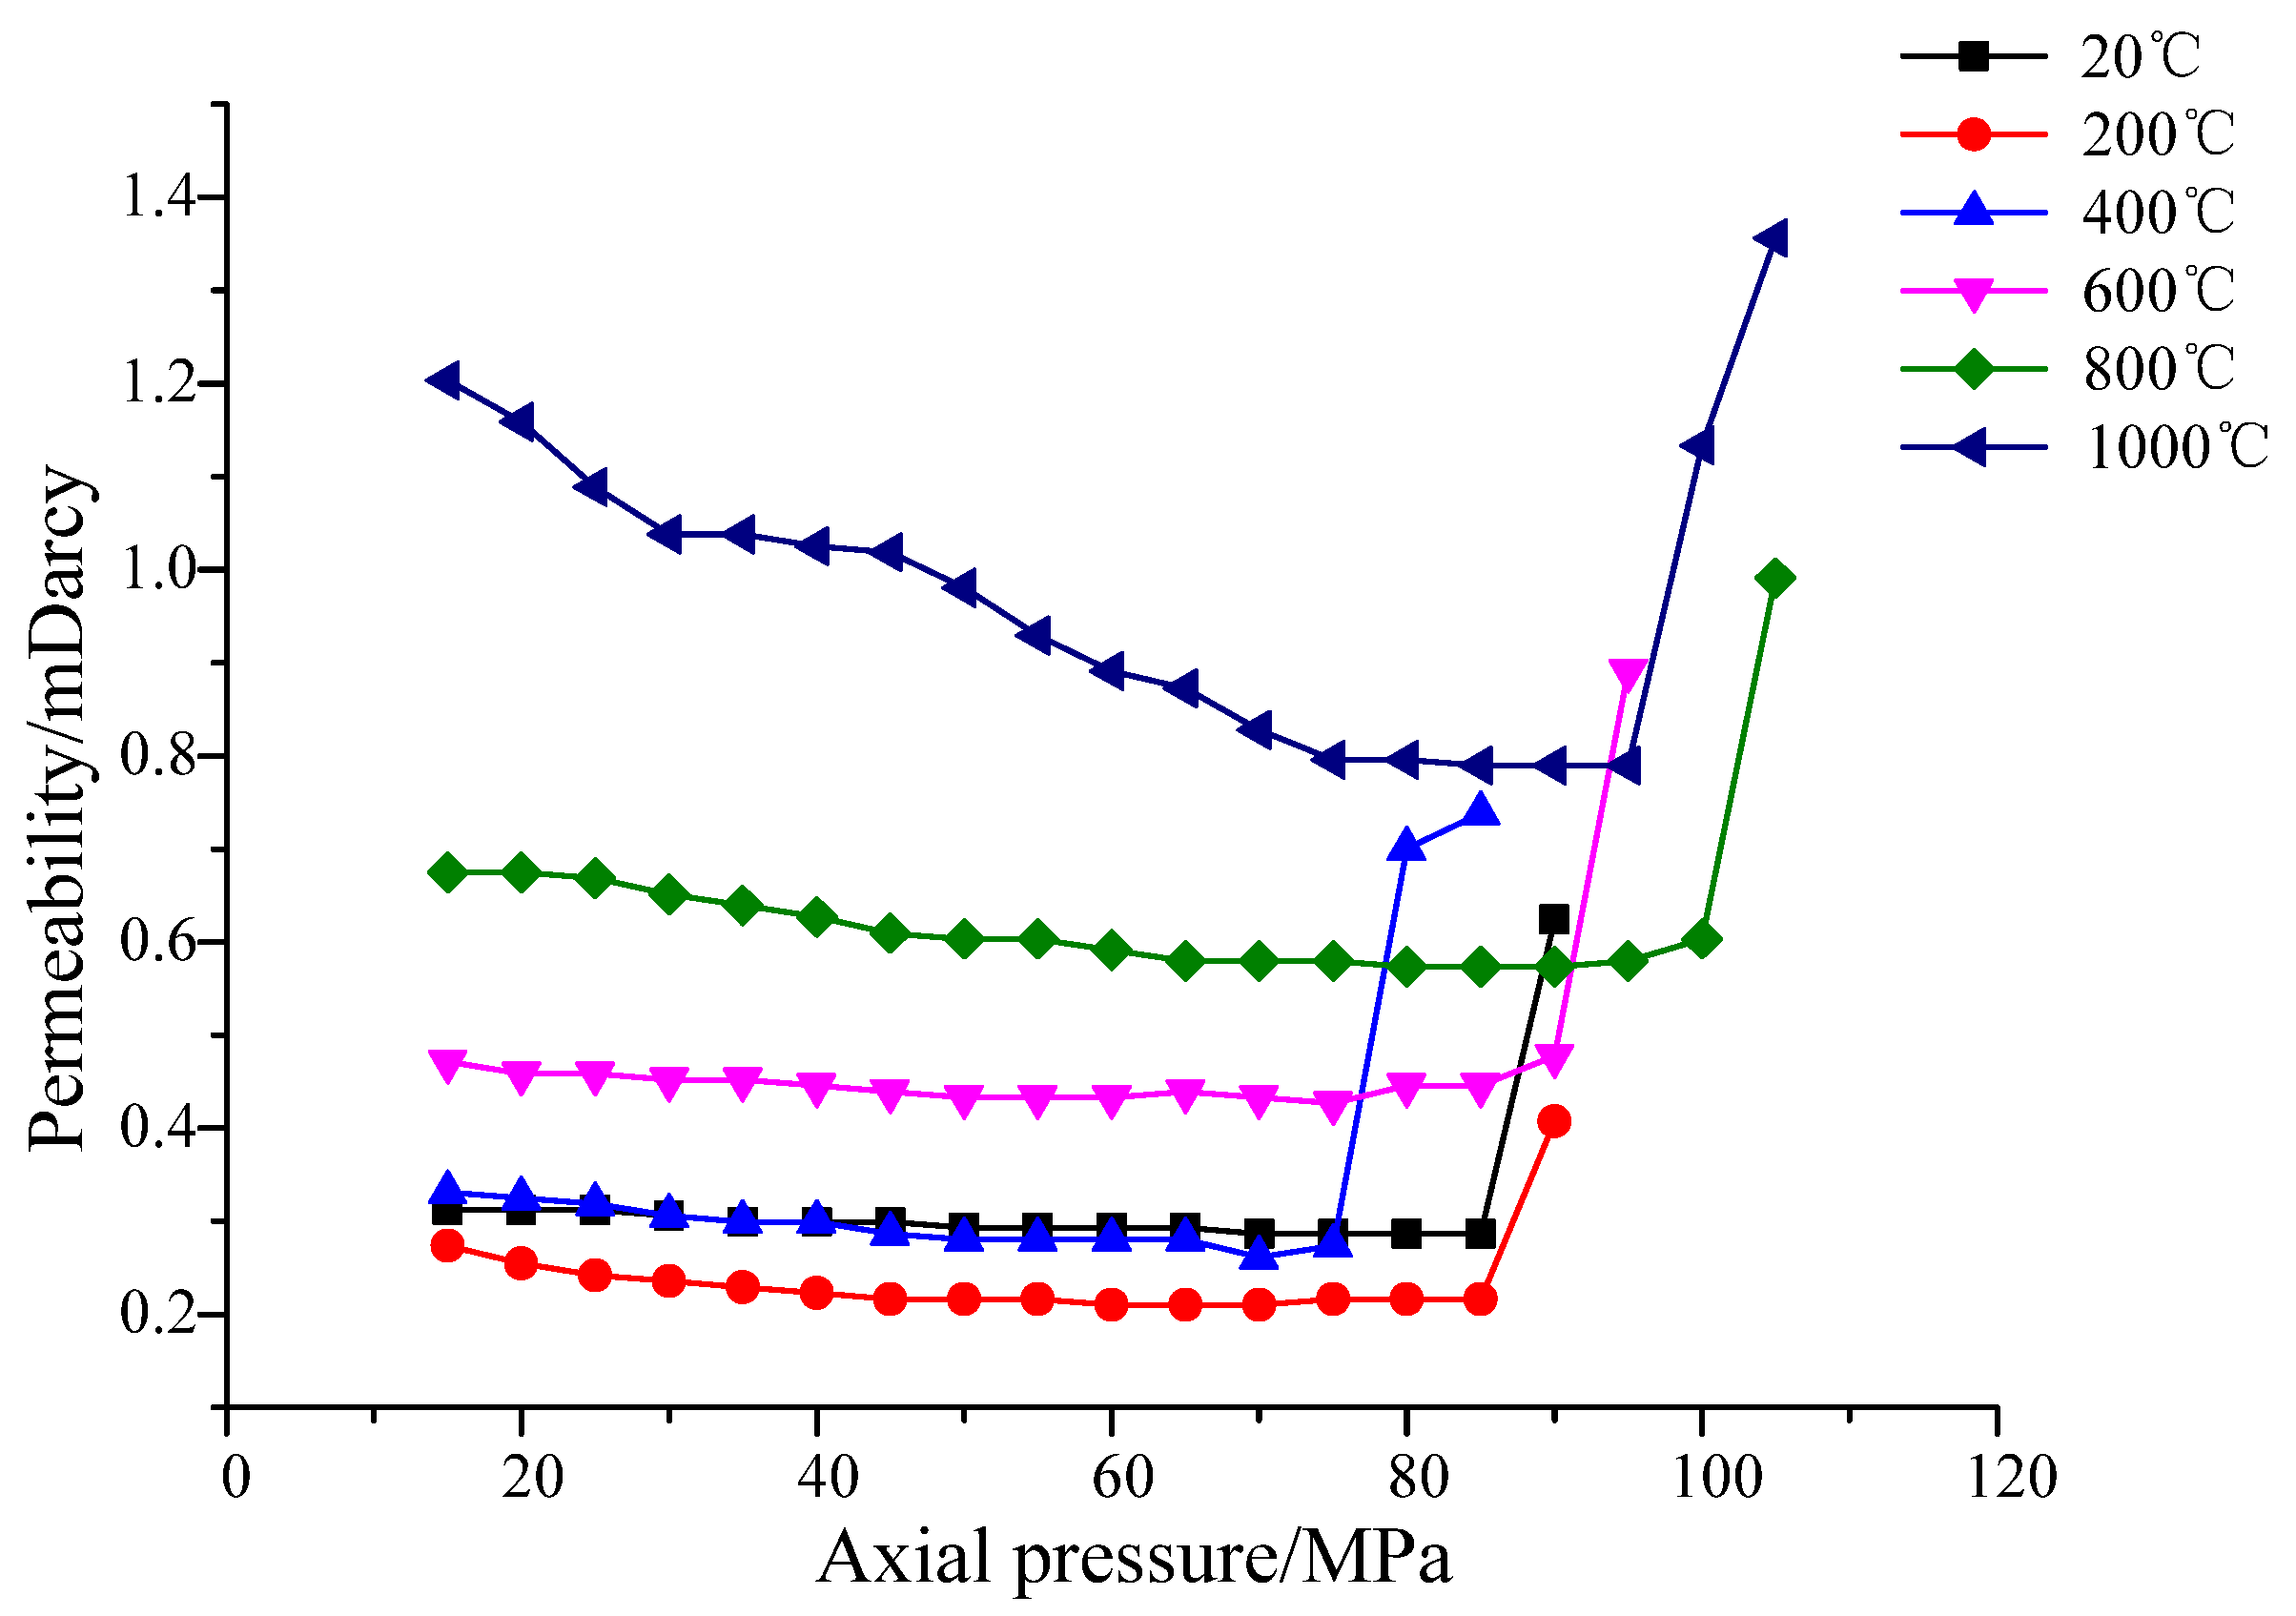
3.2. Variation of Permeability with Stress

Figure 7 shows the variation of permeability under the condition of constant confining pressure (10 MPa) and rising axial pressure increases (initial value 15 MPa). Under the condition of axial compression loading, before the sample fails, the permeability for each temperature gradient goes down gradually with the rise of axial pressure. The axial pressure is negatively correlated with permeability. For example, after heat treatment at 200 °C, the permeabilities of sandstone samples under the axial pressures of 15 MPa, 45 Mpa, and 75 MPa are 0.274 mDarcy, 0.216 mDarcy, and 0.210 mDarcy, respectively. After heat treatment at 800 °C, the permeabilities under the three axial pressures are 0.675 mDarcy, 0.609 mDarcy, and 0.579 mDarcy, respectively. Before the sample fails, the permeabilities for different temperature gradients decrease continuously. This phenomenon can be analyzed as follows: Pores, which are the main channels for fluid flow in sandstone, exist in sandstone samples after heat treatment at different temperatures. Under axial pressure loading, pores in sandstone close as a result of stress compression, leading to a decrease in the permeability. However, influenced by temperature, the decreases in permeabilities for different temperature gradients before failure differ. The dividing point is 200 °C. When the heat treatment temperature is lower than 200 °C, the permeability decreases slightly. For example, at room temperature, the peak strength of the sample is 90 MPa; the axial pressure of the sample rises from 15 MPa to 85 MPa, and the permeability falls from 0.312 mDarcy to 0.286 mDarcy by 8.3%. After heat treatment at 200 °C, the peak strength of the sample is 85 MPa; the axial pressure of the sample increases from 15 MPa to 80 MPa, and the permeability decreases from 0.274 mDarcy to 0.255 mDarcy by 6.9%. When the heat treatment temperature is higher than 200 °C, the decrease range of permeability surges. For example, after heat treatment at 400 °C, the peak strength of the sample is 85 MPa; the axial pressure of the sample rises from 15 MPa to 75 MPa, and the permeability decreases from 0.331 mDarcy to 0.274 mDarcy by 17.2%. After heat treatment at 1000 °C, the peak strength of the sample is 105 MPa; the axial pressure of the sample increases from 15 MPa to 95 MPa, and the permeability drops from 1.203 mDarcy to 0.789 mDarcy by 34.4%. High-temperature treatment leads to an increase in micro-cracks and pore channels in sandstone. Moreover, by observing the effect of stress on the evolution of sandstone permeability with temperature, it is found that the permeability is very sensitive to stress variation. As stress increases, the evolution intensity plunges, although the evolution trend of permeability with temperature remains basically unchanged.

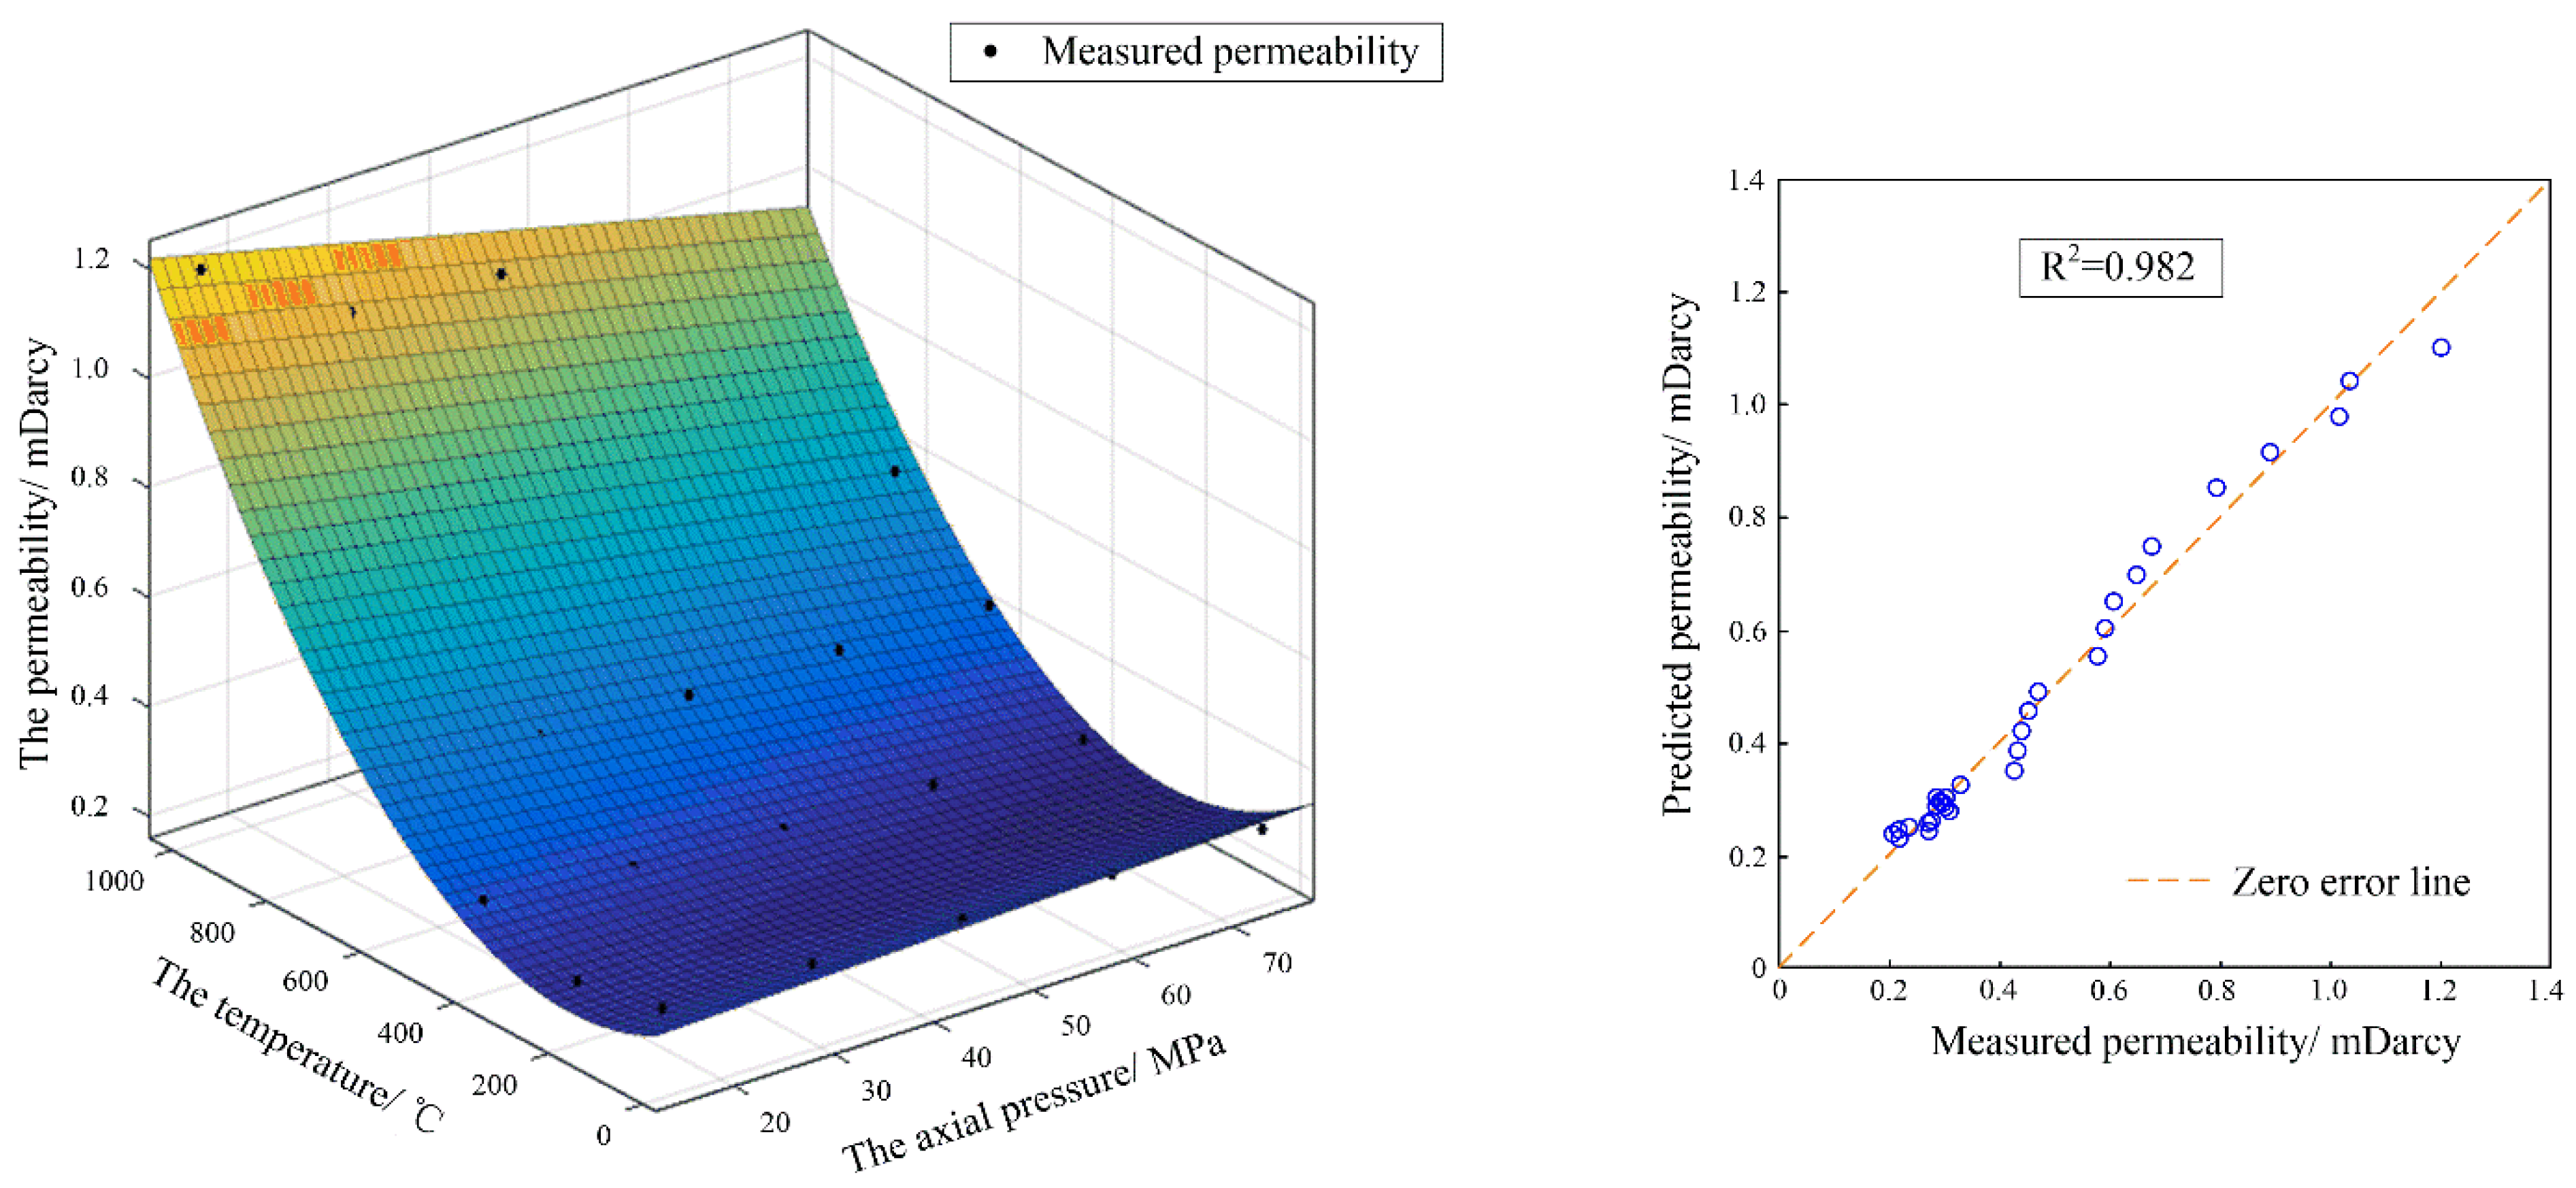
3.3. Mathematical Modeling of the Relationship between Temperature-Stress and Sandstone Permeability

In order to quantitatively describe the evolution process of rock permeability, scholars all over the world have established numerous permeability models, but the existing permeability models have certain defects. For one thing, the seepage theory mainly includes the capillary beam theory and Darcy’s law. The capillary beam theory abstracts complex rock objects into capillaries with equal or unequal diameters and then uses the Hagen-Poiseuille flow equation for flow simulation. Since the capillary beam theory fails to reflect the real internal structure of rock, the permeability model established based on it is of limited prediction accuracy. Darcy’s law is a classical formula in seepage mechanics, but the application of Darcy’s law also has limitations. When the flow rate increases (such as rock fracture development) or fluid viscosity increases, Darcy’s law fails, as the flow is a non-Darcy flow. Due to the limitations of the capillary beam theory and Darcy’s law, the permeability model is established by analyzing the influence of various influencing factors on permeability and adopting statistical methods at present. Nevertheless, a lack of guiding theoretical research results in small application and low accuracy of the established permeability models. For another, no general permeability model is proposed. Since rocks differ in lithology and complex internal structure, permeability is subject to many factors. Scholars have proposed different permeability models and applied them to rocks with different characteristics. So far, no universal and unified permeability model has been proposed. Therefore, in engineering applications, polynomial fitting is usually used according to the actual test results.
According to the test results, the variations of sandstone permeability with temperature and stress are analyzed. According to the fitting of test data using various mathematical models, the binary polynomial is of a relatively high fitting degree. The comparison results are shown in Table 3. The fitting equation of sandstone permeability with temperature and stress is:
k = 0.2815 + 0.0004918 x 0.0003115 y 4.651 e 6 x y + 1.195 e 6 y 2
where k is the permeability, mDarcy; x is the axial pressure, MPa; y is the temperature, °C.
The fitting curve of sandstone permeability with temperature and stress of experimental samples during temperature-stress variation is shown in Figure 8. According to the mathematical model of sandstone permeability variations with temperature and stress, the relationship of permeability and axial pressure satisfies a quadratic function, with a high fitting degree of data, the fitting degree R2 being 98.2%. The fitting function can be used to predict the permeability variations caused by different temperature-stress variations, which provides necessary data support for the subsequent numerical calculation on gas migration in the surrounding rock of the UCG chamber and UCG-CCS.

4. Discussion

An analysis of the previous test results reveals that the evolution law of sandstone permeability with temperature displays various forms for three reasons: First, a rise in temperature leads to the thermal expansion of rock mass and the decrease in permeability. Second, with the rise of temperature, the adsorption capacity of sandstone for CO2 decreases; the rock matrix shrinks; and the permeability increases. Third, the evaporation of residual water in rock fractures leads to an increase in permeability. The permeability evolution of sandstone is attributable to the coupling effect of the above three reasons. With the increase in axial pressure, the permeability decreases significantly before sandstone damage, which is the result of the combined action of effective stress of sandstone and permeability pressure in the fracture channel under stress.
The results suggest that both temperature and stress significantly influence sandstone permeability. However, the evolution laws of permeability with the two differ, so the establishment of a permeability model that can describe the influence of various factors is the focus of future research. In addition, analyzing the microscopic mechanism of permeability evolution with influencing factors is also the fundamental way to study the law of permeability evolution and reveal its essential causes.

5. Conclusions and Suggestions

(1) The permeability for CO2 in sandstone decreases first and then increases with the rise of temperature. The axial stress fails to change the evolution of sandstone permeability with temperature, but it exerts some effects. With the increase in axial stress, the evolution intensity of permeability with temperature declines.
(2) The permeability for CO2 in sandstone decreases with the increase in stress. The lower the stress is, the more sensitive the permeability is to the stress variation. An increase in stress causes a decrease in permeability. Then, when the sample is about to fail, the permeability jumps. As for the influence of temperature on the evolution of permeability, temperature cannot change the decreasing trend of permeability with stress, but it has a certain mitigation effect.
(3) A quadratic function mathematical model with a high correlation between temperature-stress coupling effect and permeability for CO2 in sandstone is constructed, the fitting degree being 98.2%. The fitting function can be used to predict the permeability variations caused by different temperature-stress variations, which provides necessary data support for the subsequent numerical calculation and practical engineering application of gas migration in the surrounding rock of the UCG chamber and UCG-CCS.

Author Contributions

Conceptualization, L.W. and Z.L.; methodology, K.D.; software, B.R.; data curation, S.W.; writing—original draft preparation, K.D.; writing—review and editing, K.D.; visualization, C.J. All authors have read and agreed to the published version of the manuscript.

Funding

This study was supported by the National Key Research and Development Program of China (No. 2017YFC0603004), Natural Science Foundation of Jiangsu Province, China (Grant No. BK20200628), and the funded project by the China Postdoctoral Science Foundation (Grant No. 2020M671649). These supports are gratefully acknowledged.

Data Availability Statement

The data presented in this study are available in article.

Conflicts of Interest

The authors declare that they have no conflicts of interest regarding the publication of this work.

References

  1. Fauziah, C.A.; Al-Khdheeawi, E.A.; Barifcani, A.; Iglauer, S. Wettability Measurements on Two Sandstones: An Experimental Investigation Before and After CO2 Flooding. APPEA J. 2020, 60, 117–123. [Google Scholar] [CrossRef]
  2. Fauziah, C.A.; Al-Khdheeawi, E.A.; Iglauer, S.; Barifcani, A. Effect of Clay Minerals Heterogeneity on Wettability Measurements: Implications for CO2 Storage. In Proceedings of the Offshore Technology Conference Asia, Kuala Lumpur, Malaysia, 19 August–2 November 2020. [Google Scholar]
  3. Fauziah, C.A.; Al-Khdheeawi, E.A.; Iglauer, S.; Barifcani, A. Influence of Total Organic Content on CO2-Water-Sandstone Wettability and CO2 Geo-Storage Capacity. In Proceedings of the SPE Europec, Virtual, 1–3 December 2020. [Google Scholar]
  4. Al-Khdheeawi, E.A.; Fauziah, C.A.; Mahdi, D.S.; Barifcani, A. A New Approach to Improve the Assessments of CO2 Geo-Sequestration Capacity of Clay Minerals. In Proceedings of the International Petroleum Technology Conference, Virtual, 23 March–1 April 2021. [Google Scholar]
  5. Fauziah, C.A.; Al-Khdheeawi, E.A.; Iglauer, S.; Lagat, C.; Barifcani, A. Influence of Gas Density on the Clay Wettability: Implication for CO2 Geo-Sequestration. In Proceedings of the 15th Greenhouse Gas Control Technologies Conference, Virtual, 15–18 March 2021. [Google Scholar]
  6. Rezk, M.G.; Foroozesh, J. Study of Convective-diffusive Flow During CO2 Sequestration in Fractured Heterogeneous Saline Aquifers. J. Nat. Gas Sci. Eng. 2019, 69, 102926. [Google Scholar] [CrossRef]
  7. An, H.; Wei, X.R.; Wang, G.X.; Massarotto, P.; Wang, F.Y.; Rudolph, V.; Golding, S.D. Modeling Anisotropic Permeability of Coal and Its Effects on CO2 Sequestration and Enhanced Coalbed Methane Recovery. Int. J. Coal Geol. 2015, 152, 15–24. [Google Scholar] [CrossRef] [Green Version]
  8. Zhao, Y.; Xia, L.; Zhang, Q.; Yu, Q. The Influence of Water Saturation on Permeability of Low-permeability Sandstone. Procedia Earth Planet. Sci. 2017, 17, 861–864. [Google Scholar] [CrossRef]
  9. Soong, Y.; Howard Bret, H.; Hedges, S.W.; Haljasmaa, I.; Warzinski, R.P.; Irdi, G.; McLendon, T.R. CO2 Sequestration in Saline Formation. Aerosol Air Qual. Res. 2014, 14, 522–532. [Google Scholar] [CrossRef]
  10. Amann Hildenbrand, A.; Dietrichs, J.P.; Krooss, B.M. Effective Gas Permeability of Tight Gas Sandstones as a Function of Capillary Pressure: A Non-steady-state Approach. Geofluids 2016, 16, 367–383. [Google Scholar] [CrossRef]
  11. Perera, M.; Samintha, A. A Comprehensive Overview of CO2 Flow Behaviour in Deep Coal Seams. Energies 2018, 11, 906. [Google Scholar] [CrossRef] [Green Version]
  12. Lebedev, M.; Zhang, Y.H.; Sarmadivaleh, M.; Barifcani, A.; Al-Khdheeawi, E.; Iglauer, S. Carbon Geosequestration in Limestone: Pore-scale Dissolution and Geomechanical Weakening. Int. J. Greenh. Gas Control. 2017, 66, 106–119. [Google Scholar] [CrossRef]
  13. Fauziah, C.A.; Al-Khdheeawi, E.A.; Barifcani, A.; Iglauer, S. Wettability Measurements of Mixed Clay Minerals at Elevated Temperature and Pressure: Implications for CO2 Geo-Storage. In Proceedings of the SPE Gas & Oil Technology Showcase and Conference, Dubai, United Arab Emirates, 21–23 October 2019. [Google Scholar]
  14. Juanes, R.; Spiteri, E.J.; Orr, F.M.; Blunt, M.J. Impact of Relative Permeability Hysteresis on Geological CO2 Storage. Water Resour. Res. 2006, 42, W12418. [Google Scholar] [CrossRef]
  15. Al-Khdheeawi, E.A.; Vialle, S.; Barifcani, A. Impact of Reservoir Wettability and Heterogeneity on CO2-plume Migration and Trapping Capacity. Int. J. Greenh. Gas Control. 2017, 58, 142–158. [Google Scholar] [CrossRef]
  16. Al-Khdheeawi, E.A.; Vialle, S.; Barifcani, A.; Sarmadivaleh, M.; Iglauer, S. Influence of CO2-wettability on CO2 Migration and Trapping Capacity in Deep Saline Aquifers. Greenh. Gases Sci. Technol. 2017, 7, 328–338. [Google Scholar] [CrossRef] [Green Version]
  17. Al-Khdheeawi, E.A.; Vialle, S.; Barifcani, A.; Sarmadivaleh, M.; Iglauer, S. Influence of Rock Wettability on CO2 Migration and Storage Capacity in Deep Saline Aquifers. Energy Procedia 2017, 114, 4357–4365. [Google Scholar] [CrossRef]
  18. Al-Khdheeawi, E.A.; Vialle, S.; Barifcani, A.; Sarmadivaleh, M.; Iglauer, S. Effect of Wettability Heterogeneity and Reservoir Temperature on CO2 Storage Efficiency in Deep Saline Aquifers. Int. J. Greenh. Gas Control. 2018, 68, 216–229. [Google Scholar] [CrossRef]
  19. Al-Khdheeawi, E.A.; Vialle, S.; Barifcani, A.; Sarmadivaleh, M.; Iglauer, S. Influence of Injection Well Configuration and Rock Wettability on CO2 Plume Behaviour and CO2 Trapping Capacity in Heterogeneous Reservoirs. J. Nat. Gas Sci. Eng. 2017, 43, 190–206. [Google Scholar] [CrossRef]
  20. Al-Khdheeawi, E.A.; Vialle, S.; Barifcani, A.; Sarmadivaleh, M.; Zhang, Y.; Iglauer, S. Impact of Salinity on CO2 Containment Security in Highly Heterogeneous Reservoirs. Greenh. Gases-Sci. Technol. 2018, 8, 93–105. [Google Scholar] [CrossRef]
  21. Al-Khdheeawi, E.A.; Vialle, S.; Barifcani, A.; Sarmadivaleh, M.; Iglauer, S. Effect of Brine Salinity on CO2 Plume Migration and Trapping Capacity in Deep Saline Aquifers. APPEA J. 2017, 57, 100–109. [Google Scholar] [CrossRef]
  22. Al-Khdheeawi, E.A.; Vialle, S.; Barifcani, A.; Sarmadivaleh, M.; Iglauer, S. Impact of Injection Scenario on CO2 Leakage and CO2 Trapping Capacity in Homogeneous Reservoirs. In Proceedings of the Offshore Technology Conference Asia, Kuala Lumpur, Malaysia, 20–23 March 2018. [Google Scholar]
  23. Al-Khdheeawi, E.A.; Vialle, S.; Barifcani, A.; Sarmadivaleh, M.; Iglauer, S. Impact of Injected Water Salinity on CO2 Storage Efficiency in Homogenous Reservoirs. APPEA J. 2018, 58, 44–50. [Google Scholar] [CrossRef]
  24. Al-Khdheeawi, E.A.; Vialle, S.; Barifcani, A.; Sarmadivaleh, M.; Iglauer, S. Effect of the Number of Water Alternating CO2 Injection Cycles on CO2 Trapping Capacity. APPEA J. 2019, 59, 357–363. [Google Scholar] [CrossRef]
  25. Al-Khdheeawi, E.A.; Vialle, S.; Barifcani, A.; Sarmadivaleh, M.; Iglauer, S. Enhancement of CO2 Trapping Efficiency in Heterogeneous Reservoirs by Water-alternating Gas Injection. Greenh. Gases Sci. Technol. 2018, 8, 920–931. [Google Scholar] [CrossRef]
  26. Al-Khdheeawi, E.A.; Vialle, S.; Barifcani, A.; Sarmadivaleh, M.; Iglauer, S. The Effect of Waco2 Ratio on CO2 Geo-sequestration Efficiency in Homogeneous Reservoirs. Energy Procedia 2018, 154, 100–105. [Google Scholar] [CrossRef]
  27. Niu, Q.; Cao, L.; Sang, S.; Zhou, X.; Liu, S. Experimental Study of Permeability Changes and Its Influencing Factors with CO2 Injection in Coal. J. Nat. Gas Sci. Eng. 2019, 61, 215–225. [Google Scholar] [CrossRef]
  28. Yan, H.; Zhang, J.; Rahman, S.S.; Zhou, N.; Suo, Y. Predicting Permeability Changes with Injecting CO2 in Coal Seams During CO2 Geological Sequestration: A Comparative Study Among Six Svm-based Hybrid Models. Sci. Total. Environ. 2020, 705, 135941. [Google Scholar] [CrossRef] [PubMed]
  29. Zhao, Y.; Yu, Q. CO2 Breakthrough Pressure and Permeability for Unsaturated Low-permeability Sandstone of the Ordos Basin. J. Hydrol. 2017, 550, 331–342. [Google Scholar] [CrossRef]
  30. Pollyea, R.M. Influence of Relative Permeability on Injection Pressure and Plume Configuration During Co2 Injections in a Mafic Reservoir. Int. J. Greenh. Gas Control. 2016, 46, 7–17. [Google Scholar] [CrossRef] [Green Version]
  31. Chiao, C.; Yu, C.; Lei, S.; Lin, J.-Y.; Lu, C.-Y. A Study of Relative Permeability Parameters on Rock Cores Using a Two-phase Flow Test. Terr. Atmos. Ocean. Sci. 2017, 28, 177–192. [Google Scholar] [CrossRef] [Green Version]
  32. Li, Y.; Wang, Y.; Wang, J.; Pan, Z. Variation in Permeability During CO2-CH4 Displacement in Coal Seams: Part 1-experimental Insights. Fuel 2020, 263, 116666. [Google Scholar] [CrossRef]
  33. Fatt, I.; Davis, D.H. Reduction in Permeability with Overburden Pressure. J. Pet. Technol. 1952, 4, 16. [Google Scholar] [CrossRef]
  34. Toderas, M.; Moraru, R. The Effect of Increasing the Water Content on Rocks Characteristics from Şuior, Romania. Min. Miner. Depos. 2017, 11, 1–14. [Google Scholar] [CrossRef] [Green Version]
  35. Lekić, A.; Jukić, L.; Arnaut, M.; Macenić, M. Simulation of CO2 Injection in a Depleted Gas Reservoir: A Case Study for Upper Miocene Sandstone, Northern Croatia. Min. Geol. Pet. Eng. Bull. 2019, 34, 139–149. [Google Scholar] [CrossRef] [Green Version]
  36. Zhang, Q.; Liu, J.; Wang, L.; Luo, M.; Liu, H.; Xu, H.; Zou, H. Impurity Effects on the Mechanical Properties and Permeability Characteristics of Salt Rock. Energies 2020, 12, 1366. [Google Scholar] [CrossRef] [Green Version]
  37. Al-Khdheeawi, E.A.; Mahdi, D.S.; Ali, M.; Fauziah, C.A.; Barifcani, A. Impact of Caprock Type on Geochemical Reactivity and Mineral Trapping Efficiency of CO2. In Proceedings of the Offshore Technology Conference Asia, Kuala Lumpur, Malaysia, 2 November–19 August 2020. [Google Scholar]
  38. Al-Khdheeawi, E.A.; Mahdi, D.S.; Ali, M.; Iglauer, S.; Barifcani, A. Reservoir Scale Porosity-Permeability Evolution in Sandstone Due to CO2 Geological Storage. In Proceedings of the 15th Greenhouse Gas Control Technologies Virtual Conference, Virtual, 15–18 March 2021. [Google Scholar]
  39. Vairogs, J.; Hearn, C.L.; Dareing, D.W.; Rhoades, V.W. Effect of Rock Stress on Gas Production from Low-permeability Reservoirs. J. Pet. Technol. 1971, 23, 1161–1167. [Google Scholar] [CrossRef]
  40. Zheng, J.; Zheng, L.; Liu, H.; Ju, Y. Relationships Between Permeability, Porosity and Effective Stress for Low-permeability Sedimentary Rock. Int. J. Rock Mech. Min. Sci. 2015, 78, 304–318. [Google Scholar] [CrossRef] [Green Version]
  41. Moosavi, S.A.; Goshtasbi, K.; Kazemzadeh, E.; Bakhtiari, H.A.; Esfahani, M.R.; Vali, J. Relationship Between Porosity and Permeability with Stress Using Pore Volume Compressibility Characteristic of Reservoir Rocks. Arab. J. Geosci. 2014, 7, 231–239. [Google Scholar] [CrossRef]
  42. An, C.; Killough, J.; Xia, X. Investigating the Effects of Stress Creep and Effective Stress Coefficient on Stress-dependent Permeability Measurements of Shale Rock. J. Pet. Sci. Eng. 2021, 198, 108155. [Google Scholar] [CrossRef]
  43. Agheshlui, H. Stress Influence on the Permeability of a Sample Heterogeneous Rock. Geomech. Geophys. Geo-Energy Geo-Resour. 2019, 5, 159–170. [Google Scholar] [CrossRef]
  44. Lu, J.; Yin, G.; Deng, B.; Zhang, W.; Li, M.; Chai, X.; Liu, C.; Liu, Y. Permeability Characteristics of Layered Composite Coal-rock Under True Triaxial Stress Conditions. J. Nat. Gas Sci. Eng. 2019, 66, 60–76. [Google Scholar] [CrossRef]
  45. Wang, F.; Mi, Z.; Sun, Z.; Li, X.; Lan, T.; Yuan, Y.; Xu, T. Experimental Study on the Effects of Stress Variations on the Permeability of Feldspar-Quartz Sandstone. Geofluids 2017, 2017, 8354524. [Google Scholar] [CrossRef] [Green Version]
  46. Wu, W.; Zoback Mark, D.; Kohli Arjun, H. The Impacts of Effective Stress and CO2 Sorption on the Matrix Permeability of Shale Reservoir Rocks. Fuel 2017, 203, 179–186. [Google Scholar] [CrossRef]
  47. Nooraiepour, M.; Bohloli, B.; Park, J.; Sauvin, G.; Skurtveit, E.; Mondol, N.H. Effect of Brine-CO2 Fracture Flow on Velocity and Electrical Resistivity of Naturally Fractured Tight Sandstones. Geophysics 2018, 83, WA37–WA48. [Google Scholar] [CrossRef] [Green Version]
  48. Ju, Y.; Wang, J.; Wang, H.; Zheng, J.; Ranjith, P.G.; Gao, F. CO2 Permeability of Fractured Coal Subject to Confining Pressures and Elevated Temperature: Experiments and Modeling. Sci. China Technol. Sci. 2016, 59, 1931–1942. [Google Scholar] [CrossRef]
  49. Abbaszadeh, M.; Shariatipour, S.; Ifelebuegu, A. The Influence of Temperature on Wettability Alteration During CO2 Storage in Saline Aquifers. Int. J. Greenh. Gas Control. 2020, 99, 103101. [Google Scholar] [CrossRef]
Figure 1. Schematic diagram of the sampling site for sandstone samples.
Minerals 11 00956 g001
Figure 2. X-ray diffraction spectrum.
Minerals 11 00956 g002
Figure 3. TAWD-2000 coal-rock mechanics-seepage test system.
Minerals 11 00956 g003
Figure 4. Schematic diagram of permeability test principle.
Minerals 11 00956 g004
Figure 5. Curves of sandstone samples in the heat treatment.
Minerals 11 00956 g005
Figure 6. Variation curve of sandstone permeability with temperature.
Minerals 11 00956 g006
Figure 7. Curves of sandstone permeability variation with axial pressure at different temperatures.
Minerals 11 00956 g007
Figure 8. Fitting surface of sandstone permeability under temperature-stress coupling.
Minerals 11 00956 g008
Table 1. Parameters in the permeability test.
Test ParameterSample Seepage Cross-Sectional Area (A)/cm2Standard Atmospheric Pressure (P0)/0.1 MPaGas Injection Pressure (P1)/0.1 MPaOutlet Pressure (P2)/0.1 MPaAerodynamic Viscosity (μ)/mPa·sSample Height (L)/cm
Value19.63512000.01510
Table 2. Physical parameters of rock samples.
Sample TemperatureSample No.Diameter/mmHeight/mmMass/gPorosity/%
Before HeatingAfter Heating
Room temperatureSG1-149.099.5469.01469.013.15
SG1-249.599.2450.51450.513.11
SG1-350.295.9470.25470.253.17
200 °CSG2-149.7101.4453.30452.153.39
SG2-250.4100.8454.15453.083.41
SG2-350.3100.2455.34454.323.38
400 °CSG3-149.196.4458.51446.854.57
SG3-250.997.8429.58428.534.58
SG3-349.795.6460.95459.904.57
600 °CSG4-150.298.3459.93456.787.19
SG4-250.797.2461.57458.847.18
SG4-349.9100.7453.11451.007.21
800 °CSG5-150.0100.2457.86455.2011.28
SG5-250.797.5449.62447.0311.24
SG5-350.298.2451.94448.1011.31
1000 °CSG6-150.7101.4455.22453.8713.27
SG6-249.299.5440.60437.4713.15
SG6-349.597.7451.63449.8113.33
Table 3. Summary of mathematical models for sandstone permeability under temperature-stress coupling.
Function ExpressionFitting Degree R2Average Error
K = 0.2129 − 0.001849x + 0.000696y78.5%0.46310
K = 0.1295 − 7.665e−4x + 9.053e−4y + 1.398e−5x2 − 4.651e−6xy80.1%0.42920
K = 0.2815 + 4.918e−4x − 3.115e−4y − 4.651e−6xy + 1.195e−6y298.2%0.03982
Publisher’s Note: MDPI stays neutral with regard to jurisdictional claims in published maps and institutional affiliations.

