1. Introduction
The mining process of underground resources significantly disturbs the structure of the rock mass. This leads to negative effects manifested on the surface of mining areas. Usually, these take the form of large-scale continuous deformations [
1,
2], mining tremors [
3,
4] and local discontinuous deformations [
5,
6]. All these phenomena are a potential threat both in the context of safety [
7,
8], and often they are the cause of a significant reduction in the utility of buildings [
9,
10]. Regarding both of these issues, there have been efforts for many years to optimize the possibility of extraction of resources with the lowest possible degree of degradation of the existing buildings on the surface of the mining area. Today, apart from the issues related to mining technology, the assessment of potential mining damage is one of the most important problems conditioning the possibility of conducting underground operations. It is a very complex socio-economic problem, which concerns both owners or managers of buildings and mine officials. From a practical point of view, it is very important to be able to reliably predict the expected damage to buildings before mining activities start, as well as to diagnose the causes of the damage during the occurrence of effects. An additional difficulty is the uncertainty occurring in the process of collecting information on the technical condition of buildings over a long period of exploitation and imprecise impact forecasts for the planned exploitation. Awareness of the complexity of this problem led the authors to undertake research using methods classified as artificial intelligence (AI) [
11,
12]. Particular attention was paid to methods operating on the basis of probabilistic notation of uncertainty, which include Naive Bayes Classifier and Bayesian networks [
13,
14].
The research was carried out on a database created of masonry buildings, for which information was established on the intensity of long-term impacts at the location of each structure and on the structural and material features of buildings, the quality of maintenance and the diagnosed range and intensity of damage. On this basis, two prognostic models, understood as decision-making systems for damage risk assessment, were created and compared. The first was the learned and tested structure of the Naive Bayes Classifier (NBC) [
15]. The second, methodologically more complex model, was the Bayesian network structure [
16]. During the construction of this model, an advanced technique involving the optimal extraction of the Bayes network structure from data (TAN-CL Chow-Liu’s Tree Augmented Naive Bayes) [
17] was used. Thus, a method belonging to the field of Bayesian networks structure learning from data (BNSL) [
18] was used.
The research methodology adopted in this paper to establish a meaningful decision system for damage risk assessment is currently under development, especially in the areas of medical science [
19], biology [
20], genetics [
21,
22]. This type of methodology is also used in civil engineering issues, especially in the context of safety [
23], risk [
24] and reliability [
14] assessment. In addition, a great number of scientific studies indicate the effectiveness of this type of approach in issues related to hazards arising from the impact of random phenomena of natural origin (floods [
25], earthquakes [
26], tsunami [
27]). However, recently one can also encounter implementation of this approach in the interdisciplinary area combining mining and civil engineering [
13,
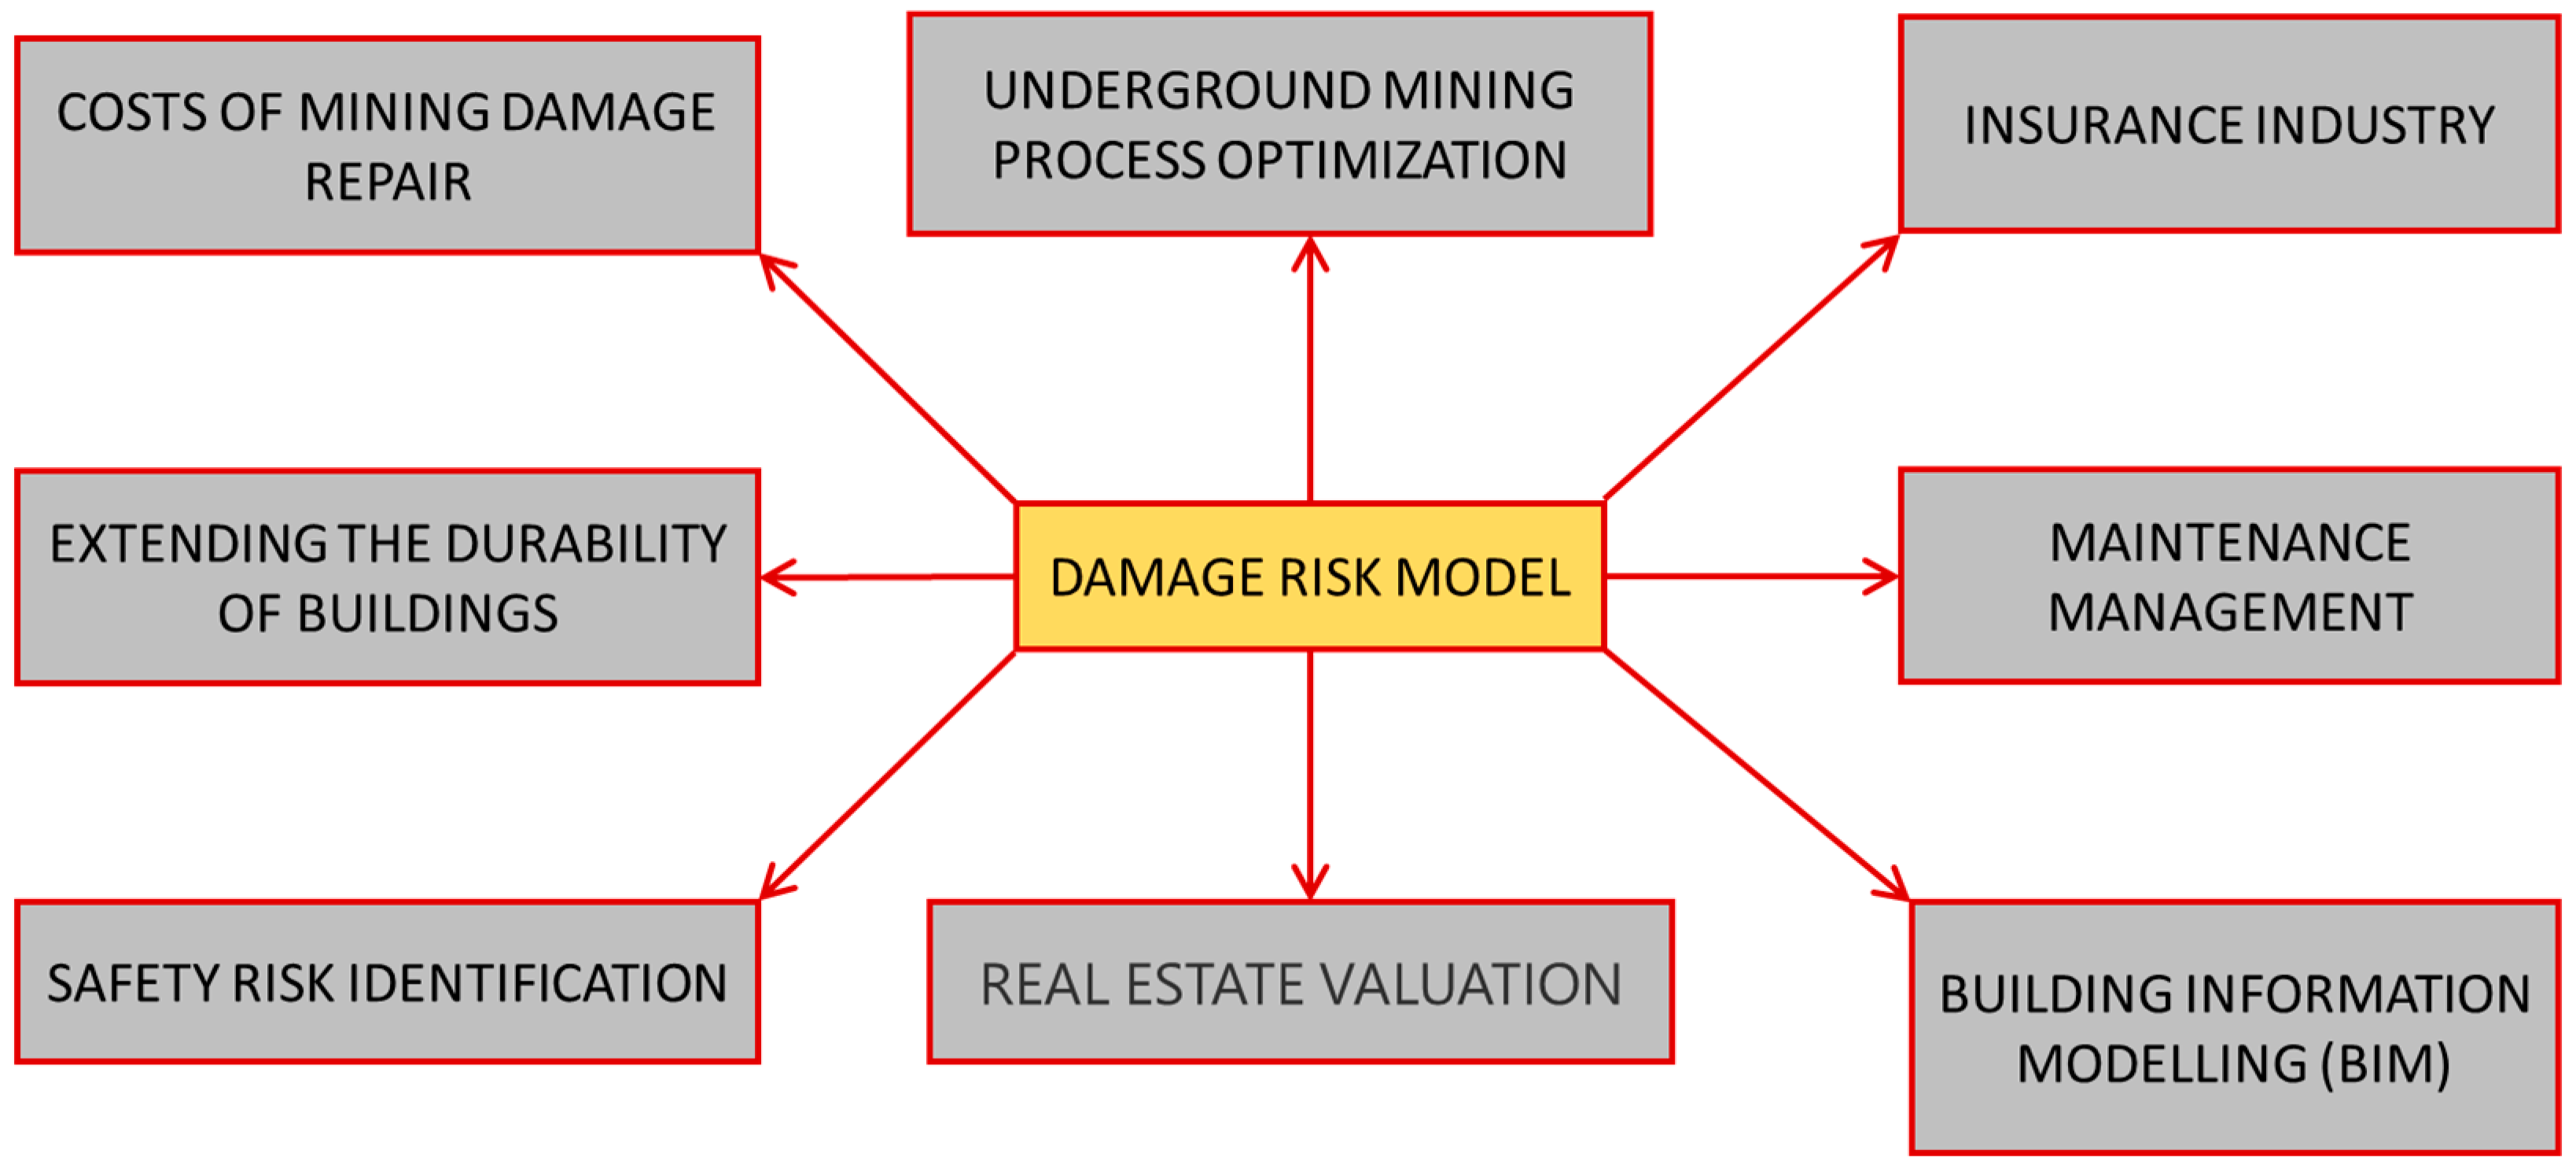
28]. The separation of a model for damage risk assessment in buildings, in addition to the benefits in terms of optimizing the planning of the mining process, can be used in a wide spectrum of socio-economic issues and the digitalization of the construction industry—cf.
Figure 1. It seems particularly important to implement such a tool in the intensively increasing trend of BIM, as an important component for the area of AEC (Architecture-Engineering-Construction) [
29] and FM (Facilities Management) [
30,
31]. On the other hand, integration of building issues with the mining process allows us to include the problem of damage risk assessment into the activities related to the development of the Industry 4.0 [
32].
Evaluating the issue addressed in this paper only through the narrow prism of the development of digitalization and the need for optimal planning of the mining exploitation process, it is clear that there is a need to create a tool to improve the work of both mining and civil engineers involved in the process related to the underground exploitation of resources. An additional advantage of such a tool, based on AI methodology, is the ability to update the model with access to new data resources. This is especially the case with Bayesian networks, which, in addition to allowing inference in the mode of prediction of the range and intensity of damage and diagnosis of its causes [
13,
28]. This significantly extends the possibilities of implementing such a tool in other industrial sectors that coexist with the mining industry.
2. Indicating the Innovation of the Methodological Approach Used for the Research
AI methods are currently used in many areas of science and technology, especially where, due to the complexity of the issues, it is necessary to apply heuristic approaches. Although individual tools belonging to this group are still being developed and improved, the effectiveness of many of them has already been confirmed. The validity of AI methods has also been justified by research conducted within the interdisciplinary field of mining and civil engineering [
9,
13,
28,
33,
34]. Among the available AI methods, the methods that allow representation of formal uncertainty during inference are particularly useful for describing the risk of building damage. To date, the most popular methods that allow a mathematical representation of formal uncertainty are systems based on fuzzy logic [
34] and Bayesian inference principle using probabilistic formalism [
35]. Currently, there are also hybrids resulting from the combination of these two approaches [
36,
37].
From the point of view of the problem undertaken, there were two main criteria for the choice of methodology for the construction of the damage risk model. The first criterion was the use of a notation that would allow mathematical treatment of uncertainty during the construction and subsequent operation of such a system. The second criterion was dictated by the practice of making assessments, in which sometimes a prediction of damage intensity is required for predicted mining impacts, and sometimes a diagnosis of the causes of damage that has occurred. Therefore, it was decided to reduce the group of potential AI methods to those based on probabilistic notation. This form of uncertainty description is used every day by engineers and is found in international standards guidelines [
38].
At this point, it should be indicated that other methods whose high efficiency in relation to the analysis of building damage has been confirmed by numerous studies. The main tool for failure analysis in building structures, from a mechanical point of view, is the Finite Elements Method (FEM). With regard to the issues of mining impacts, it is applicable and confirms its effectiveness, both in static issues related to the impact of land subsidence [
39,
40,
41], and in dynamic issues related to the impact of mining tremors [
4,
42]. However, this type of approach cannot be effectively applied when it is necessary to forecast the intensity of damage for a large number of buildings. An additional aspect that hinders this type of approach is often the differences between the structural arrangement of individual buildings and the lack of transparency of their spatial static arrangements. For this reason, with regard to the undertaken problem, with full awareness of the advantages of the FE methodology, it was decided to undertake research based on in-situ data and apply advanced statistical methods, which include machine learning tools.
In this paper, two methods using probabilistic uncertainty notation are used: Naive Bayes Classifier (NBC) and Bayesian Network (BN) methodology. The NBC methodology was used to obtain a reference model for the methodologically more complex approach using Bayesian networks. The results obtained for NBC provided a reference basis for assessing the quality of the established BN structure, which was considered the target model for describing the issue addressed in this paper.
Although Bayesian networks have already been successfully applied in issues of risk assessment of the occurrence of various types of negative natural or anthropogenic phenomena [
43,
44], the main problem is to determine the appropriate structure of such a model. Applications of Bayesian networks, whose structure is mostly arbitrarily determined by an expert, are encountered in mining and civil engineering problems. This approach is efficient but is limited by finite human perception. This makes it impossible to build expert systems for processes or phenomena with a large number of variables. The risk problem related to the phenomenon of damage to existing buildings affected by mining exploitation depends on dozens of factors, the influence of which cannot be neglected in the analysis. Therefore, the application of a methodology based on the detection of the BN structure from data is indispensable in this case. In this regard, the issue is still open and requires testing various methods involving BN structure learning from data (BNSL—Bayesian Network Structure Learning). Implementations of BNSL methods are not often seen in engineering problems, especially civil engineering and mining. For this reason, the issue addressed in this paper is considered original and innovative in the above engineering fields.
3. Characteristics of the Information Collected in the Building Database and Description of Mining Impacts
Fulfilling the set research purposes, which consisted in building and verifying the NBC classifier and the BN structure, at the beginning required collecting data on the behavior of buildings subjected to the influence of mining exploitation. The most relevant factor here was the observed damage in the buildings before the mining operation and the actualization of the damage after it.
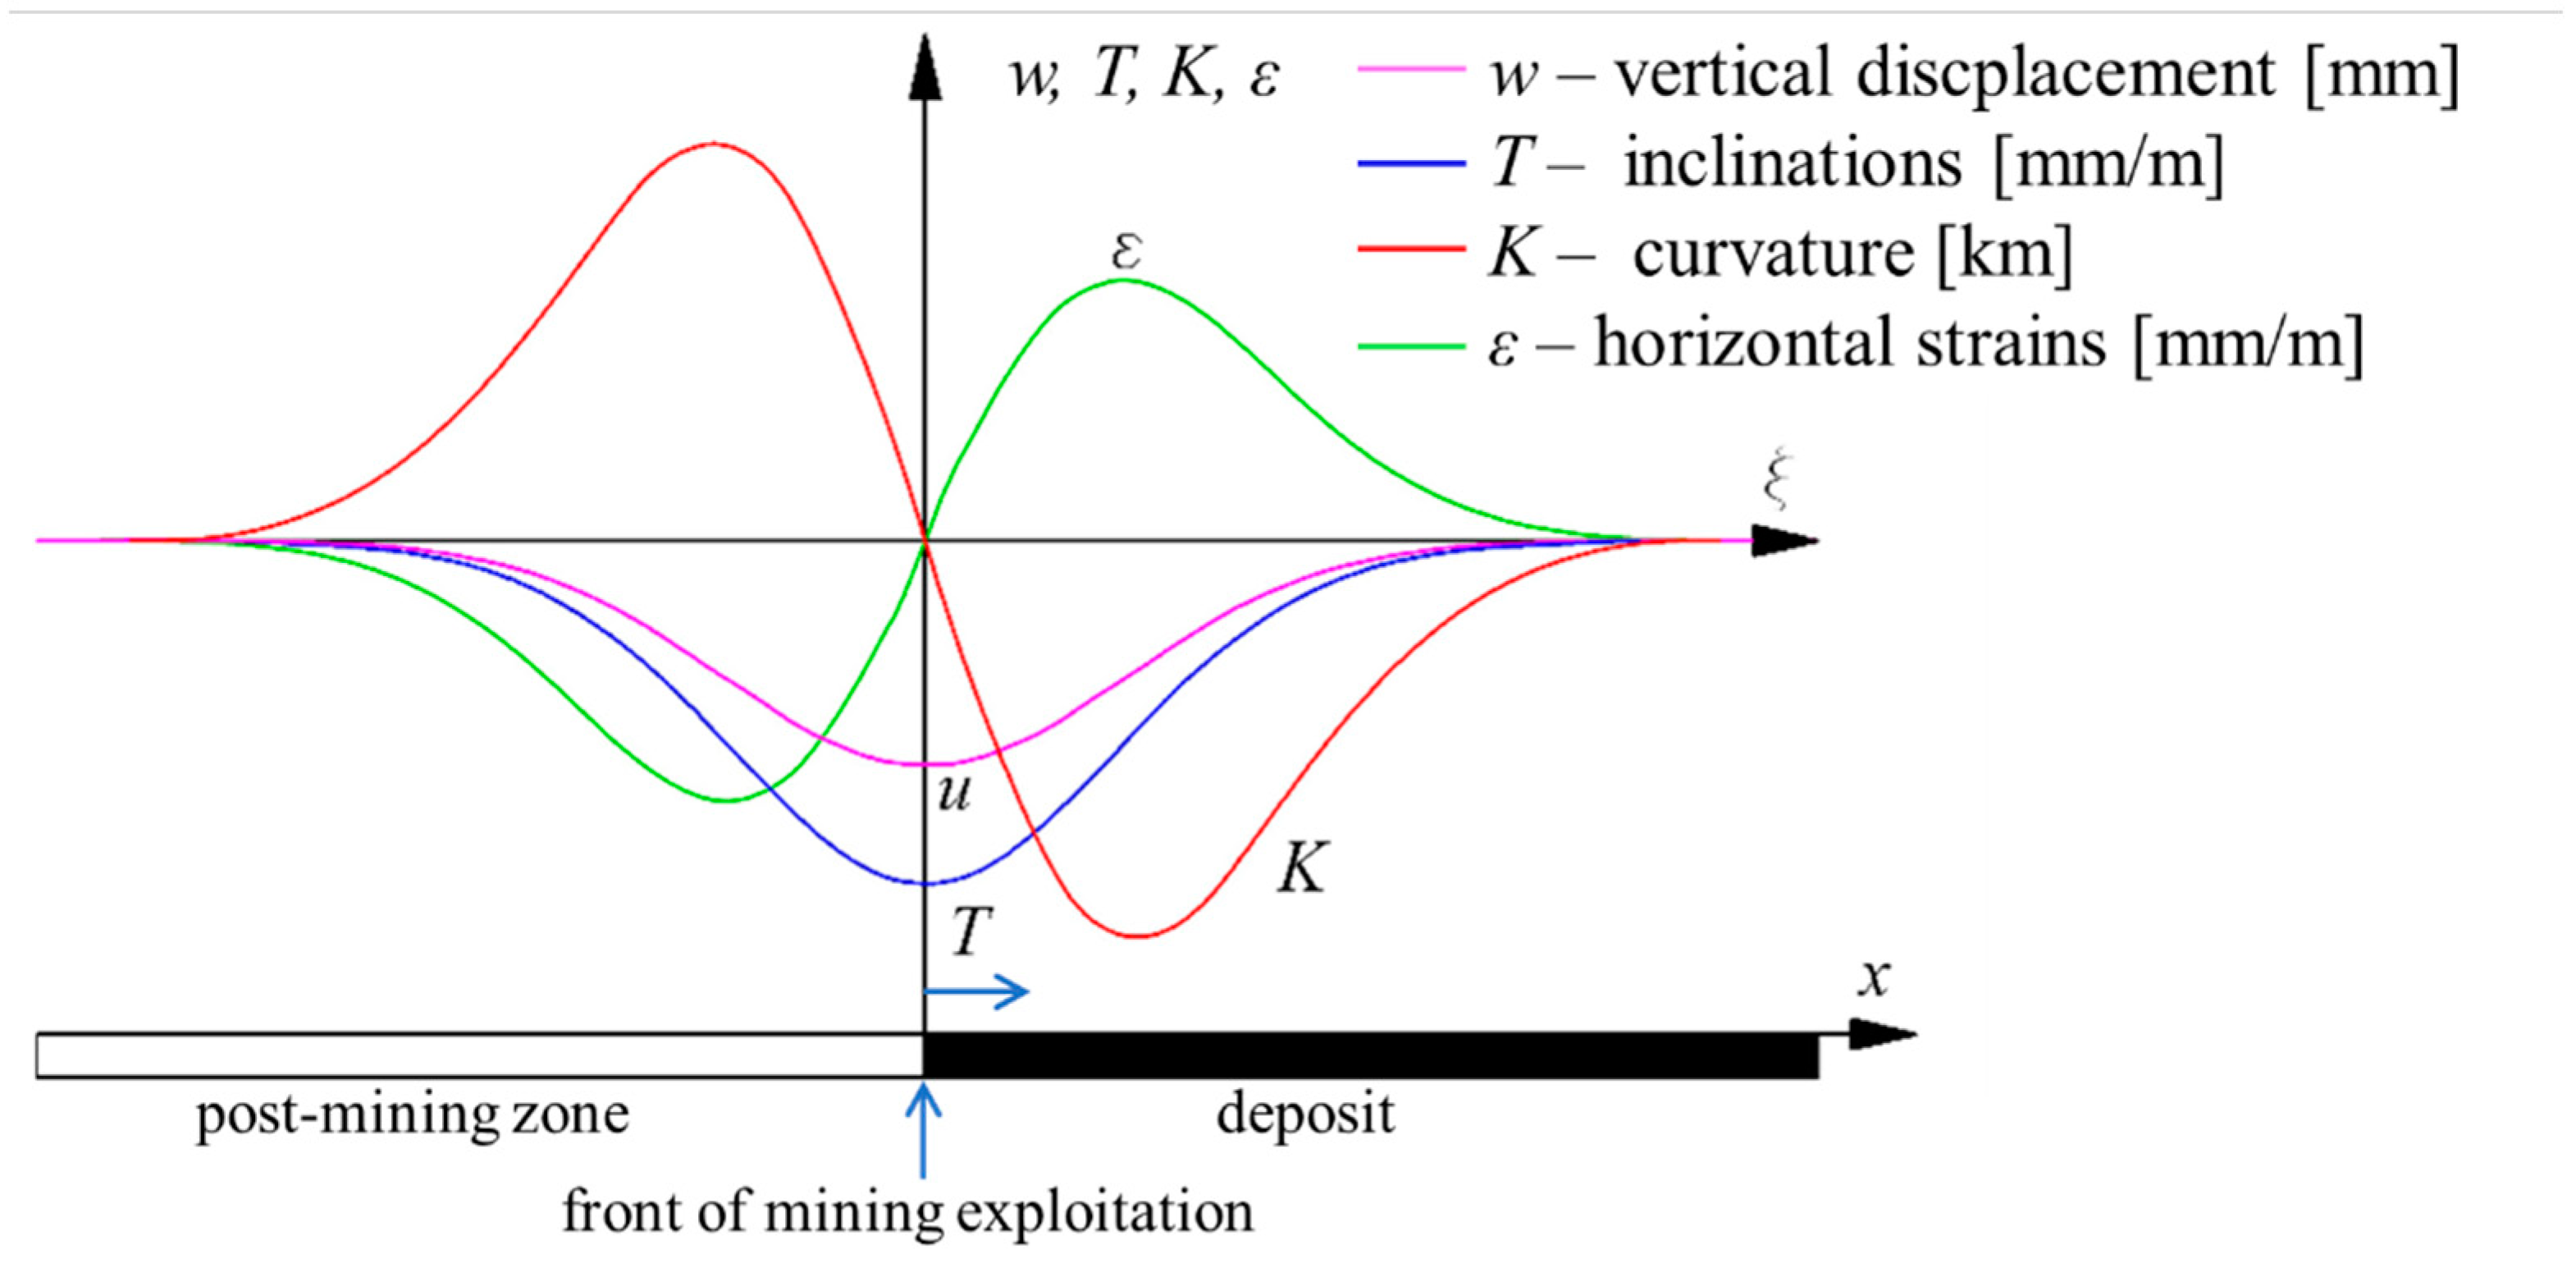
During the passage of underground exploration on the ground surface, deformation occurs. In general, vertical (
w [mm]) and horizontal (
u [mm]) displacements occur. However, in order to relate the deformation of the terrain to the problem of the threat of buildings, detailed measures are introduced, which are derived from vertical and horizontal displacements. These measures are horizontal deformations (ε [mm/m]), inclinations (T [mm/m]) and curvatures (
R [km] of terrain. The values of these parameters may be established on the basis of model tests or as a result of geodetic measurements [
45].
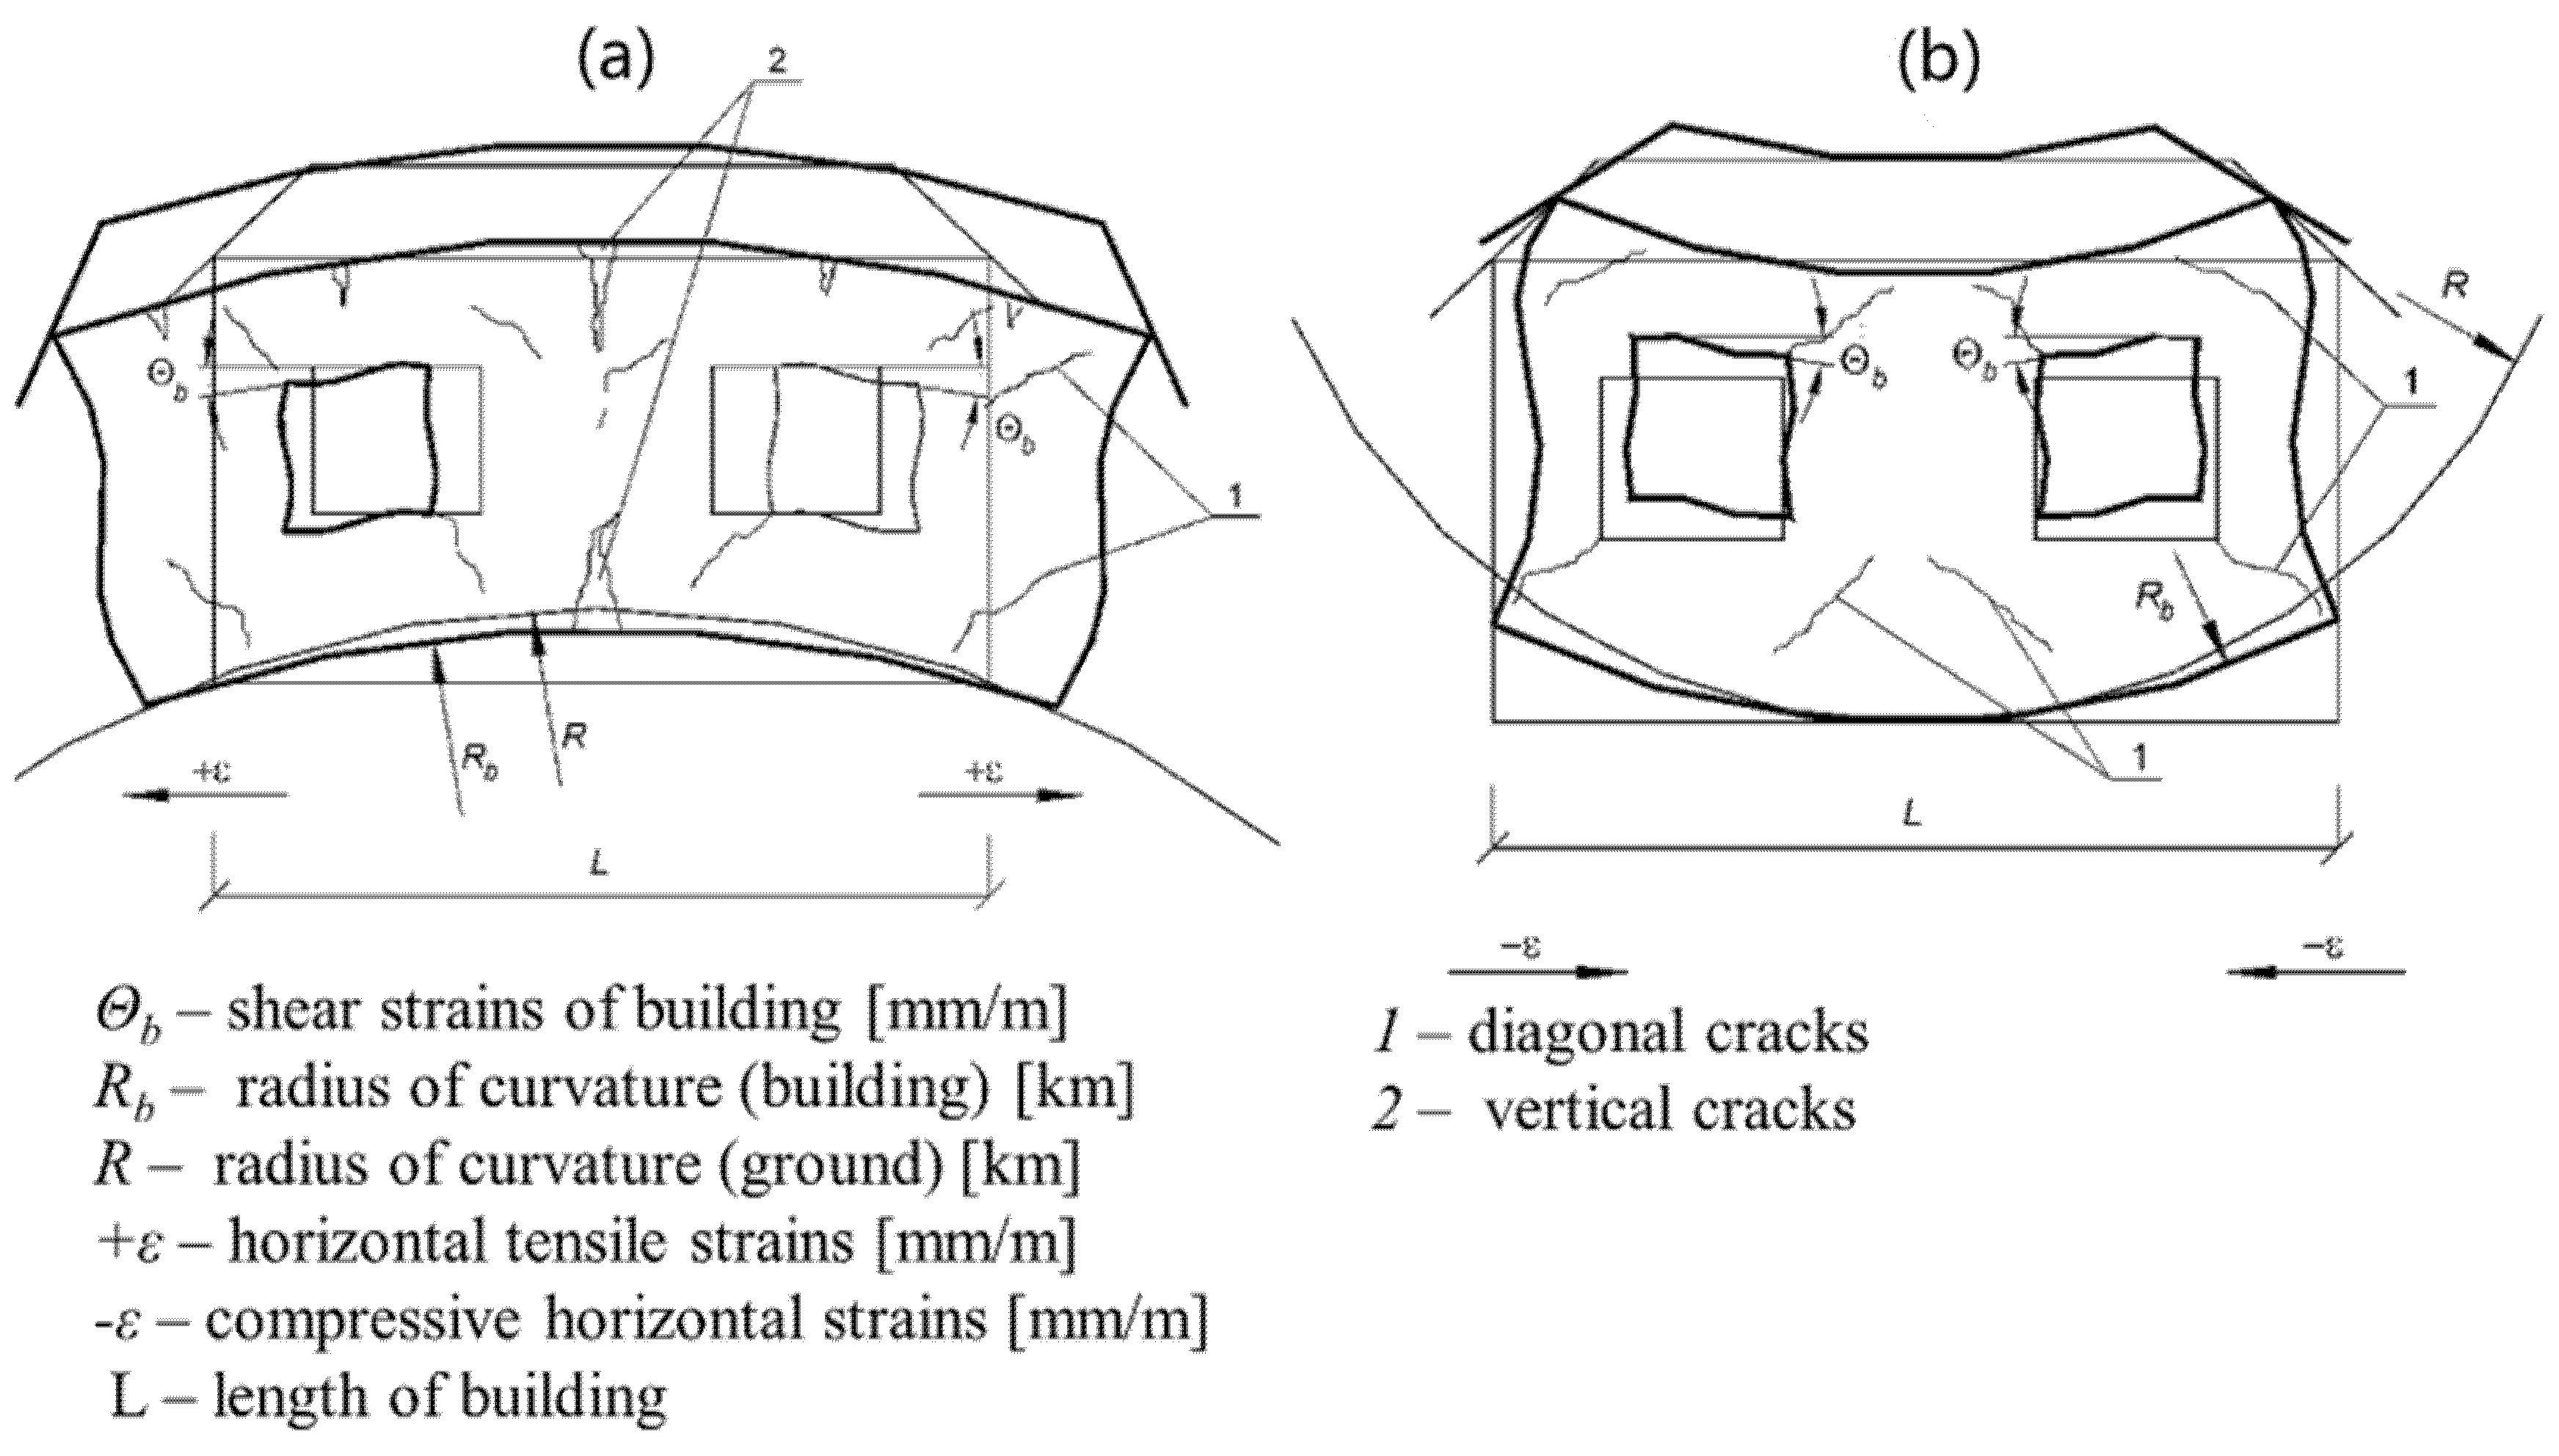
In order to explain the meaning of variables used in the research, the process of formation of a mining basin was presented and interpreted schematically in
Figure 2. However, the characteristic damage to buildings on the convex and concave margins of a mining basin is illustrated in
Figure 3.
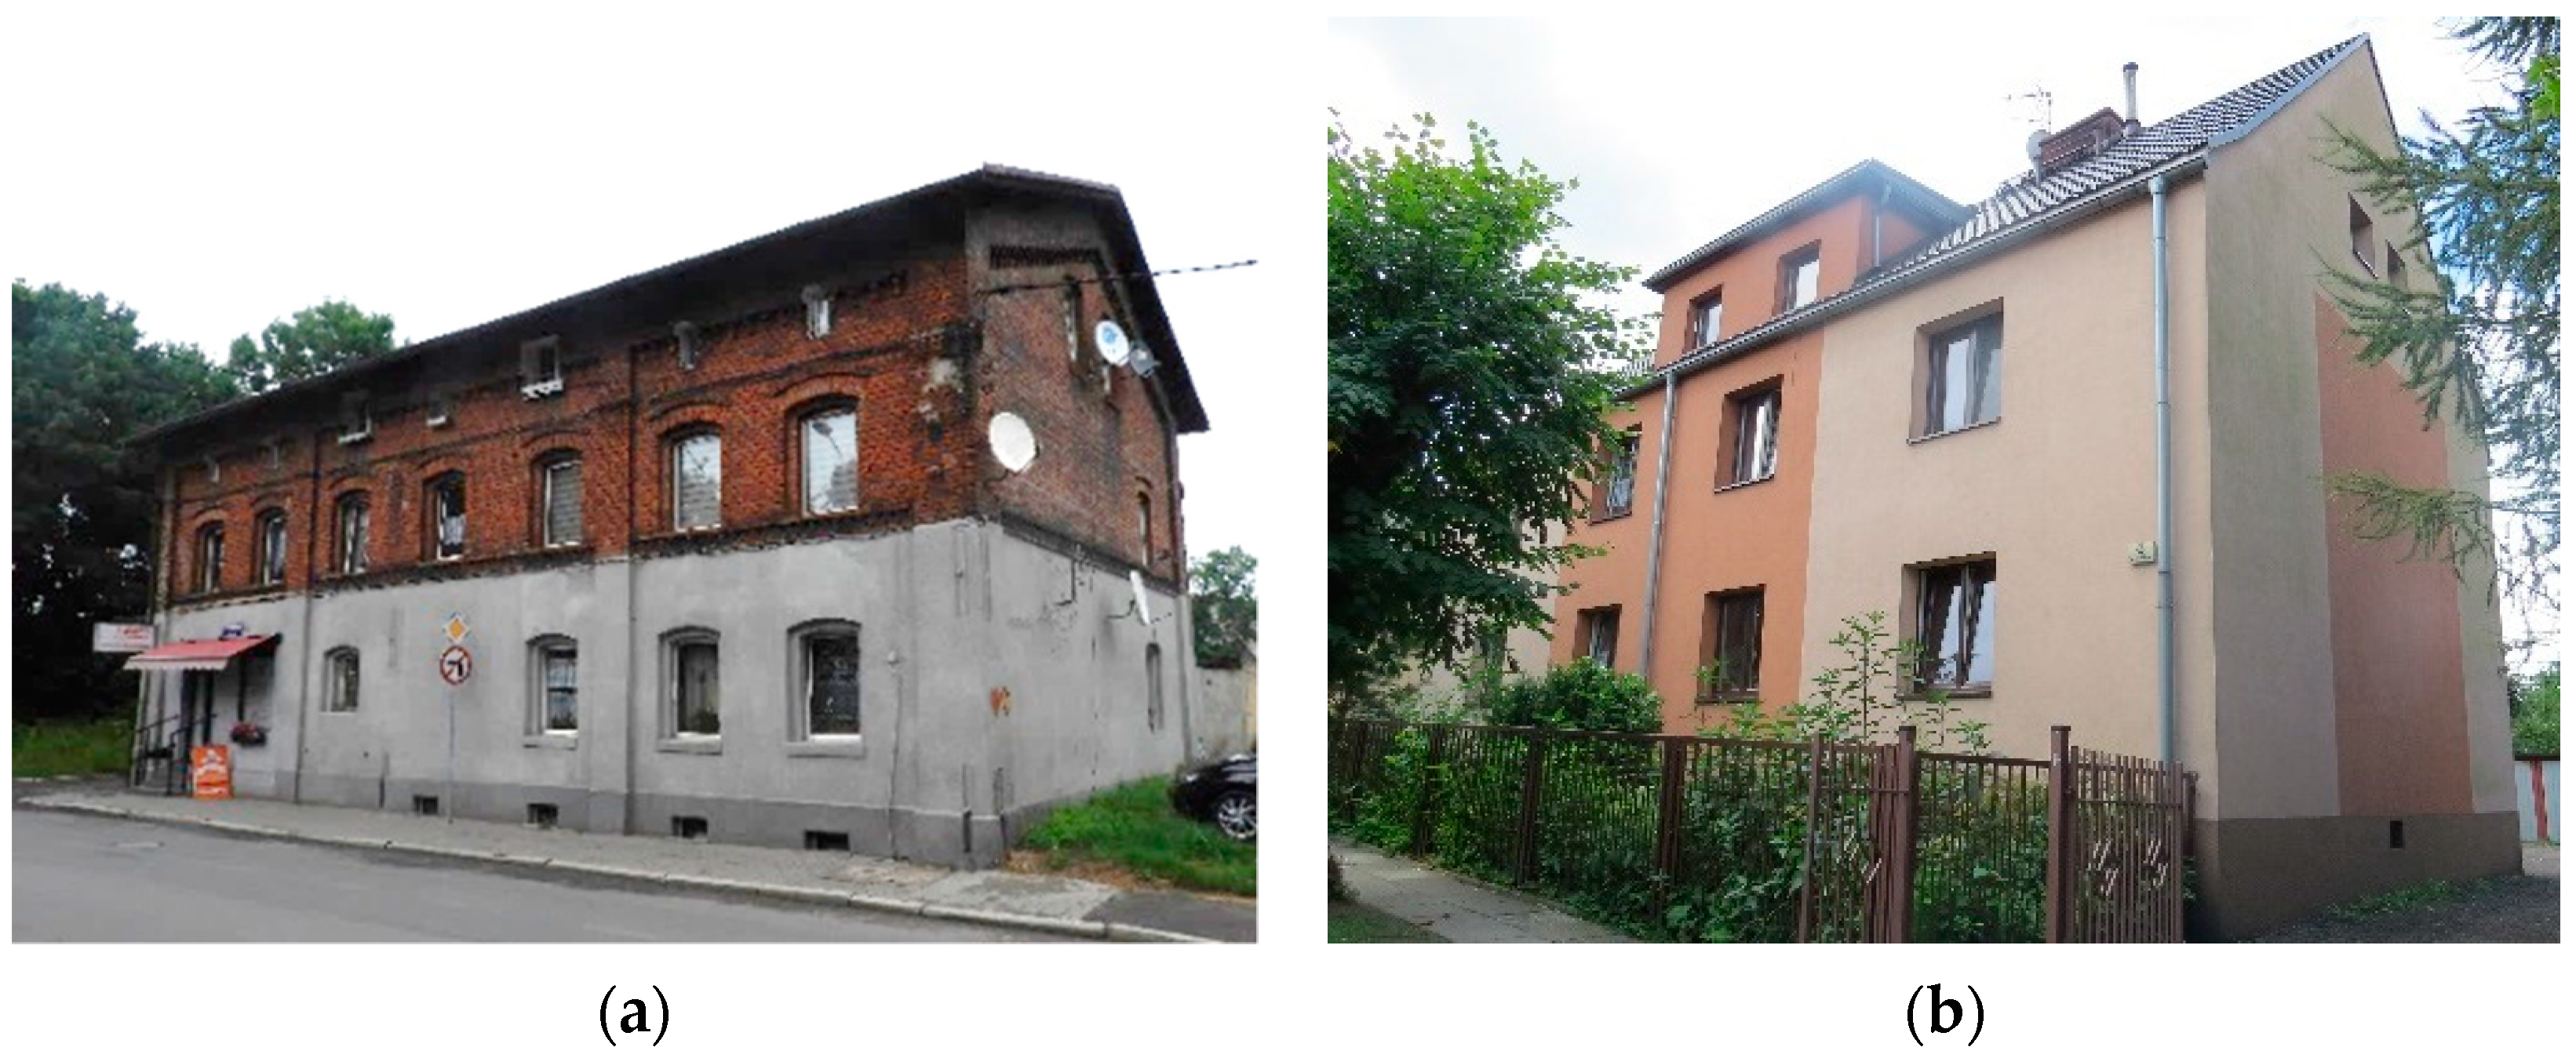
Finally, a group of 207 buildings was qualified for further analysis. Next, “in-situ” field research was carried out, during which information on the buildings was collected and finally archived in the database. The “in-situ” field research for the selected group of buildings concerned the determination of, among others, the geometrical parameters, applied structural solutions, existing protection against mining influence and the range and intensity of the existing damage. An example of two representative buildings from among all those qualified for the survey is presented in
Figure 4.
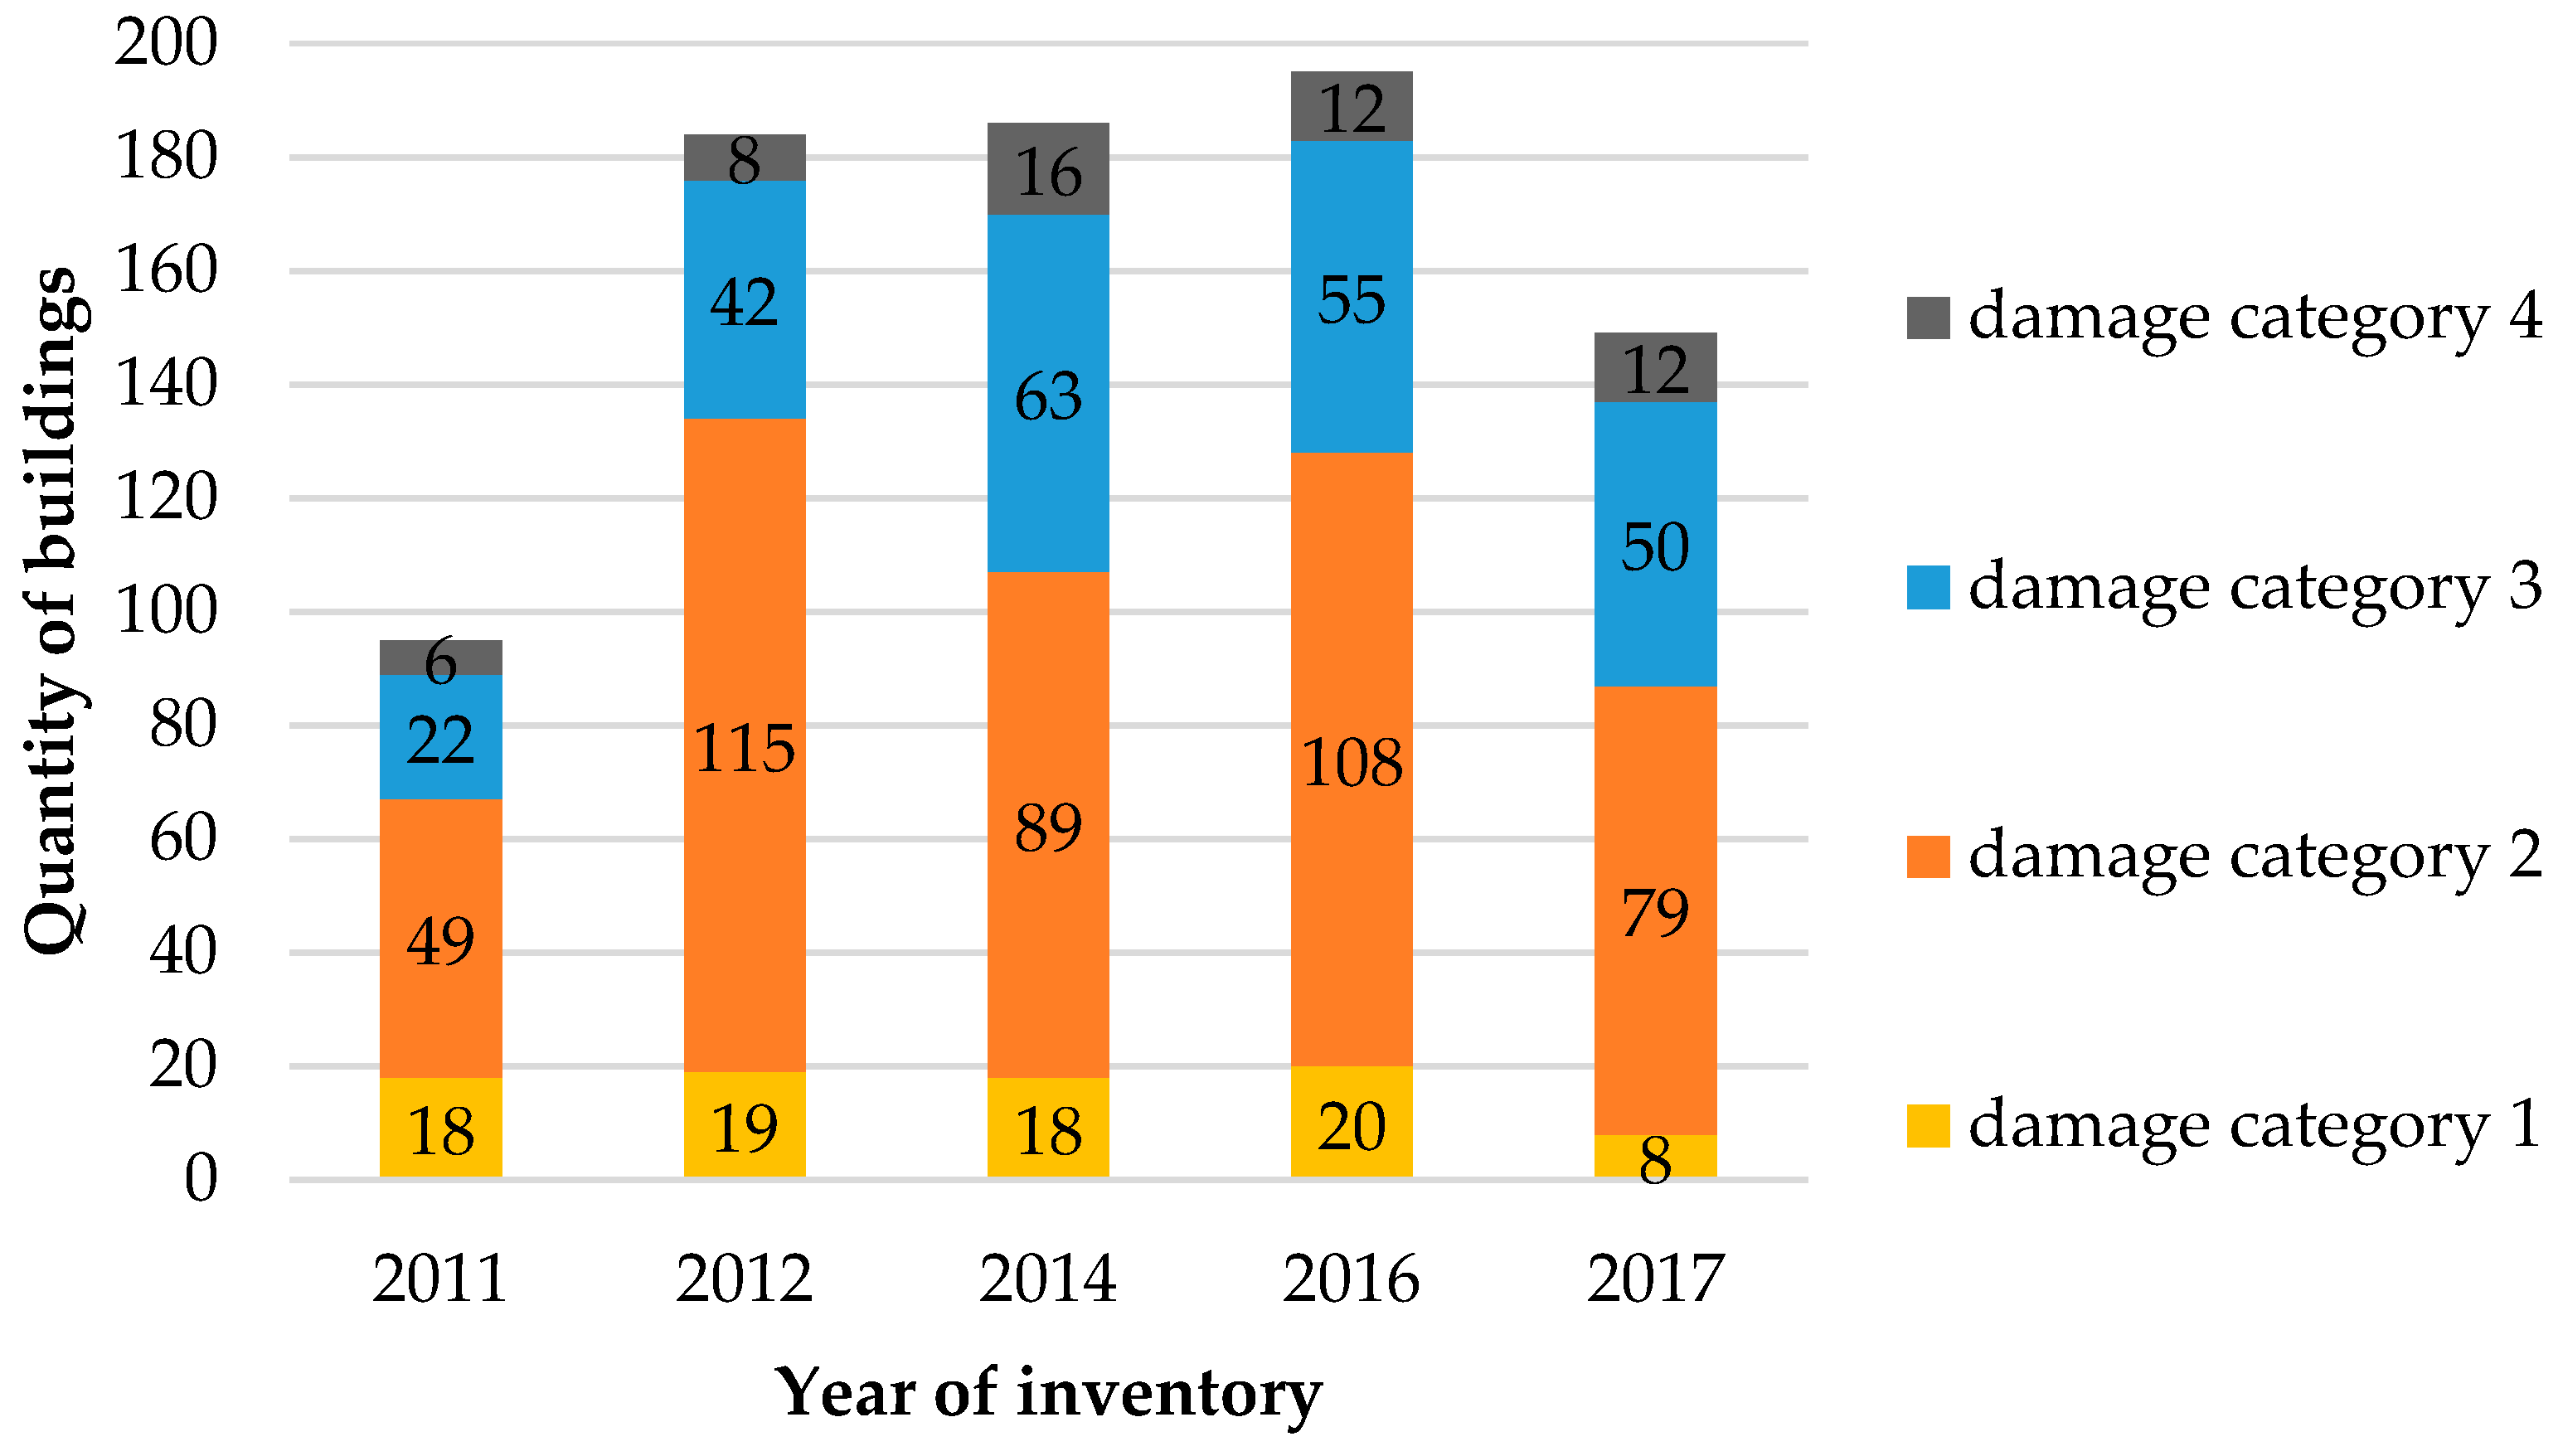
Investigations of the state of damage to buildings taking into account the range and intensity, as well as the threat to the safety of the structure and users, made it possible to classify each case into one of four categories [
47].
The description of the accepted building damage categories can be presented as follows:
damage category 1: no structural damage, possible occurrence of damage in the form of insignificant cracks on the plaster of walls and ceilings.
damage category 2: more intensive damage to non-structural elements and finishing elements, such as cracking or local separation of ceiling soffits, trimming of ceiling and wall plaster, cracking of elevation and interior wall plaster.
damage category 3: damage in structural elements, the range, intensity and location of which, in the case of further ground deformation influences, may lead to the local loss of load-bearing capacity or stability of structural elements
damage category 4: damage threatening the local load-bearing capacity of its elements (which could have already been subjected to temporary protective works), or buildings in which there is large natural wear of structural elements, manifested by extensive and advanced erosion of masonry or concrete and reinforcement.
The distribution of damage intensity to buildings in the period 2011–2017 according to the adopted categorization is presented in
Figure 5.
In the period of research, i.e., in the years 2011–2017, the development in the study was subjected to the influence of coal mining, carried out in the system with roof collapse, whose characteristic parameters are summarized in
Table 1.
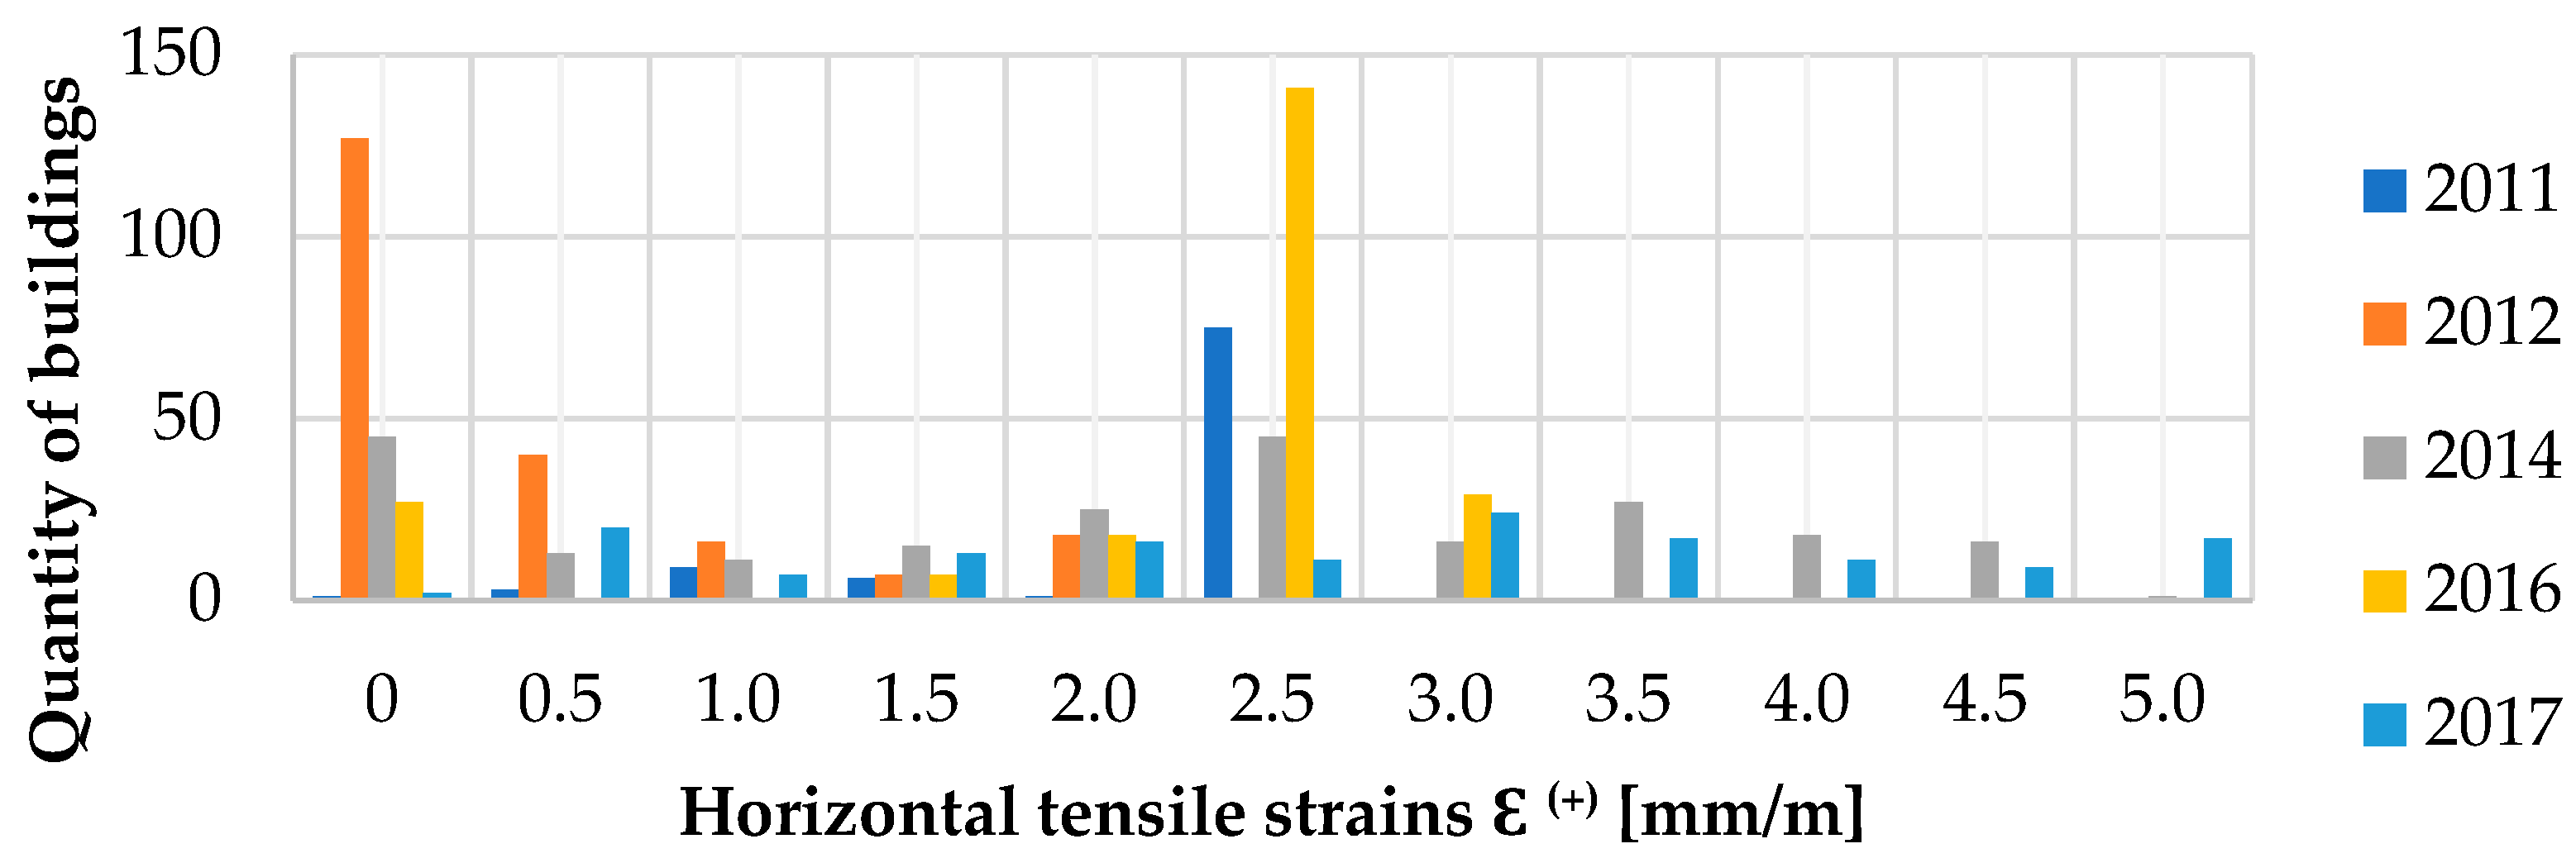
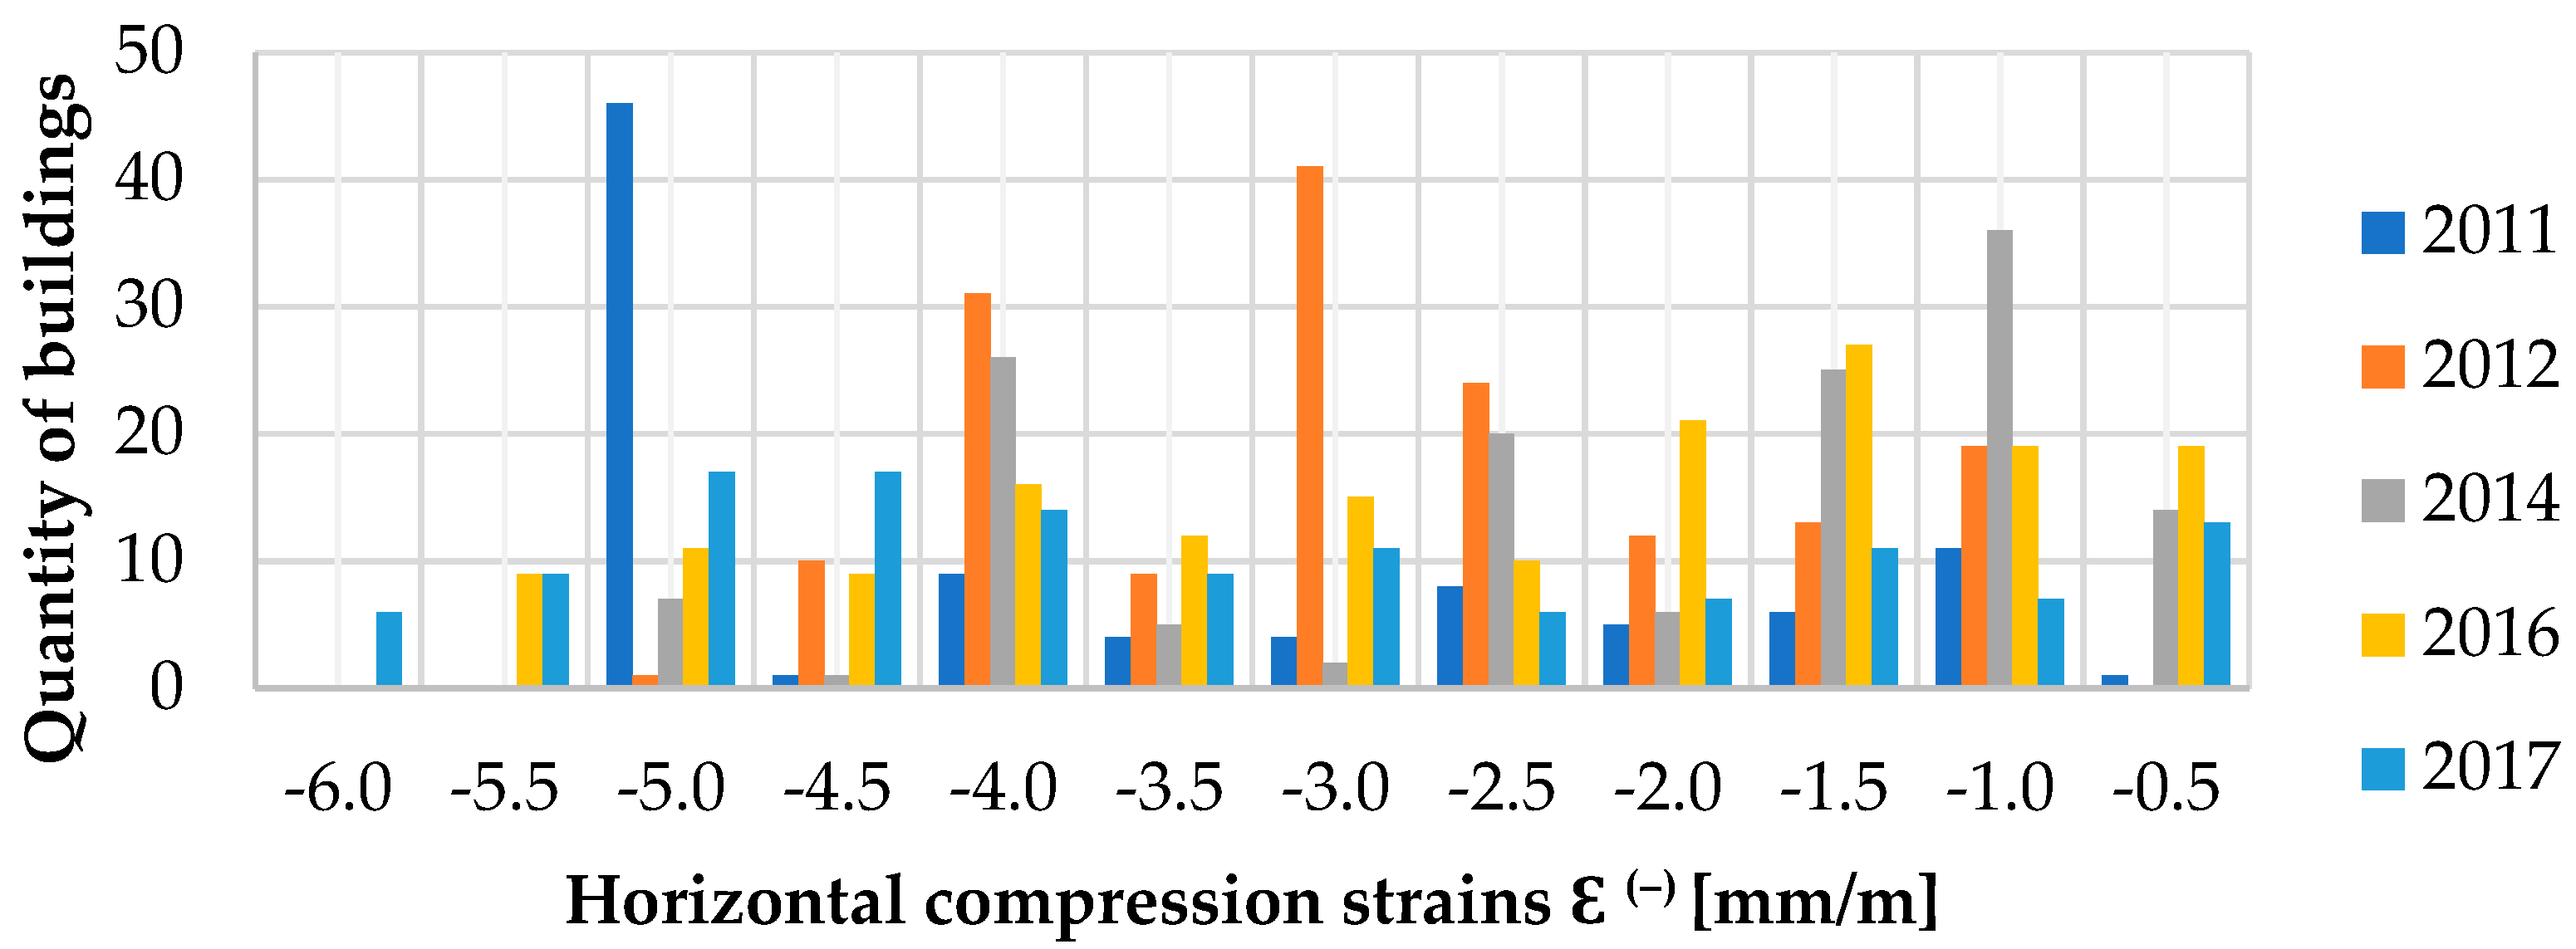
In the process of creating the database, information was collected on the occurring values of the horizontal ground deformations (ε—cf.
Figure 2) in the locations of particular buildings. The basis for determining the values and directions of strains were the results of surveying measurements conducted by the mine. In turn, approximation of values and directions of strains to the location of each building was performed using dedicated modeling methods based on Budryk–Knothe theory [
48]. The quantity of buildings, which were affected by horizontal tensile strain ε
+, together with their values with the accuracy of 0.5 mm/m, is presented in
Figure 6. Whereas the quantity of buildings, which were affected by horizontal compressive strain ε
− is presented in
Figure 7.
Based on the horizontal deformation impacts collected above, the resulting mining terrain categories were determined [
46]. In this form, the intensity of influences from continuous deformation of the mining area was classified and included in the database.
Finally, taking into account multiple inspections of the technical state for the same buildings, a study material of 594 design cases was collected. A synthetic summary of building data and meaningful mining impacts is presented in
Table 2.
4. Characteristics of the AI Methods Used in the Research
As part of the research, it was decided to choose supervised learning as the optimal method to achieve the purpose [
49]. Within this area, the NBC (Naive Bayes Classification) and BNs (Bayesian Networks) methods were qualified for further research. This choice was dictated by the fact that these methods allow notation of risk in a probabilistic form, which is in accordance with the functioning nomenclature in this area at an international level [
50]. An additional advantage of these methods is the ability to capture uncertainty and, in the case of BNs, additionally incompleteness of information concerning the input variables. The last very important advantage from the utilitarian point of view, and concerning only BNs, is the possibility of inference in any direction. In the problem of damage risk, this proves that this model can be used both in the case of predicting the intensity of damage as well as to diagnose its causes.
Finally, it was concluded that the target damage risk model would be created using the BN method. The NBC method, on the other hand, would serve as a reference basis for verifying the quality of the model described by the extracted optimal BN structure.
4.1. NBC—Naive Bayes Classification
The NBC method determines the probability of occurrence of particular classes/labels/categories of the so-called decision variable depending on a given set of input variables. On the basis of the probability value, the classification result is determined by means of ranking. This result is called the classifier indication. Unlike BN, the assumption of mutual independence of particular input variables is used here. Taking
n input variables described as
x1,
x2,
x3, …,
xn and the output variable
y described by the number of classes:
c1,
c2,
c3, …,
ck the mathematical form of the inference process expressed as [
51] is obtained (1):
The assumption of independence is often overly optimistic (naive), but it allows for significant simplification of the computational procedure.
The schematic diagram of the NBC network structure is presented in
Figure 8.
Two procedures are used to build an NBC classifier from the learning dataset: Maximum Likelihood Estimation (MLE), which maximizes the conditional likelihood
understood here as the verifiable claim of the existence of each class for the learning data [
51] (2):
or Maximum a Posteriori Estimation (MAP), which maximizes the posteriori probability of occurrence of each class for the learning set [
51] (3):
The main advantages of the NBC classifier include high learning speed with relatively high classification accuracy. The quality of classification is not strongly determined by the number of learning data, which is also considered to be an advantage of this approach. However, due to the assumption of mutual independence of all input variables, it can be assumed that the model structure may not reflect the real relationships between the analyzed variables in the issue of describing the risk of building damage. Therefore, in the framework of the present research, the NBC model created will play a comparative role, giving an idea about the effectiveness of a more complex model in the form of a separate BN structure.
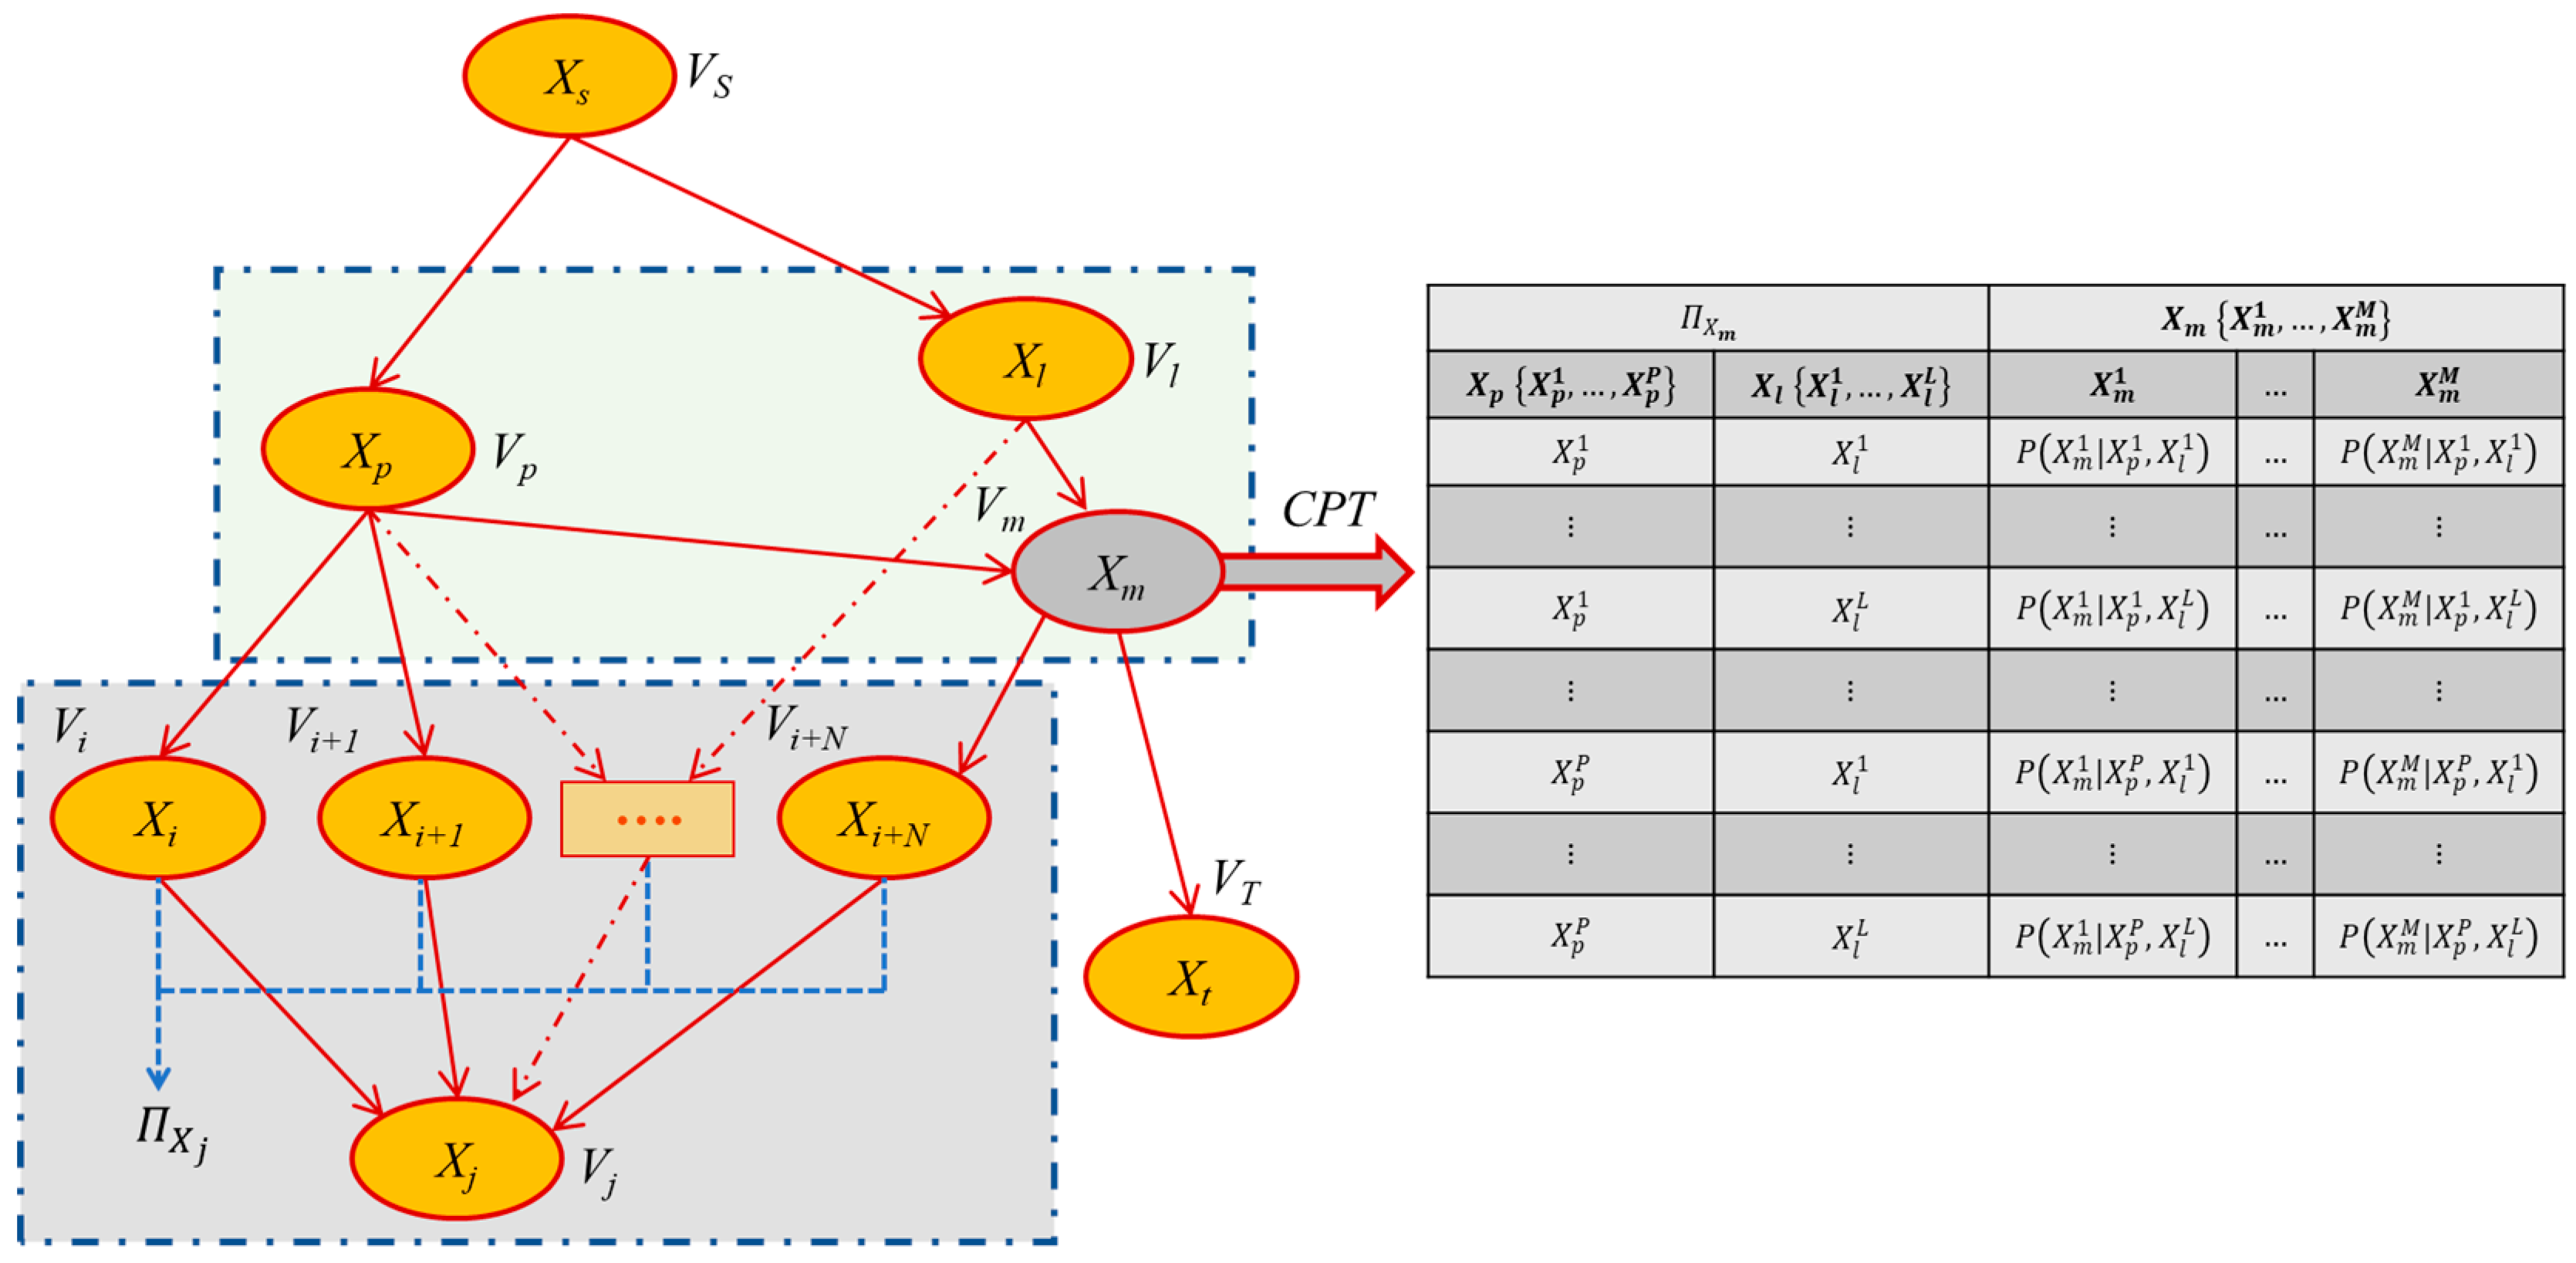
4.2. BN—Bayesian Network
The Bayesian network (BN) can be interpreted as a Directed Acyclic Graph (DAG). The graph structure (G) encodes information about the interrelationships between the variables
, k which is represented by graph edges (E) and nodes (V). In a meaningful sense, the fixed BN represents the joint probability distribution over the set of all random variables, which can be represented as [
52] (4):
where:
—mathematical notation for describing the acyclic directed graph structure
—the set of all variables that belong to the nodes of the graph
—states of the i-th variable of
—set of all edges
—set of all nodes
—the set of parents, i.e., all nodes of the graph that determine the state of the node
—the set of all parameters of conditional relations between particular nodes , and a set of their parents
In the case of discrete variables, the latent parameters of the model
are represented in terms of a multinomial Conditional Probability Table (CPT) whose elements are expressed as [
51] (5):
According to relation (4), the joint distribution
is decomposed based on the conditional local distributions
, described over each random variable
relative to its corresponding set of conditional variables so-called parents
. This formulation is possible due to the concept of conditional independence introduced by Pearl [
53]. This allows for a significant reduction in the number of links that do not show cause-and-effect relationships. The introduction of the proposed linkage reduction allows significant simplification of the calculations related to the modelling of the joint probability distribution and simplifies the subsequent interpretation of the structure by the human user.
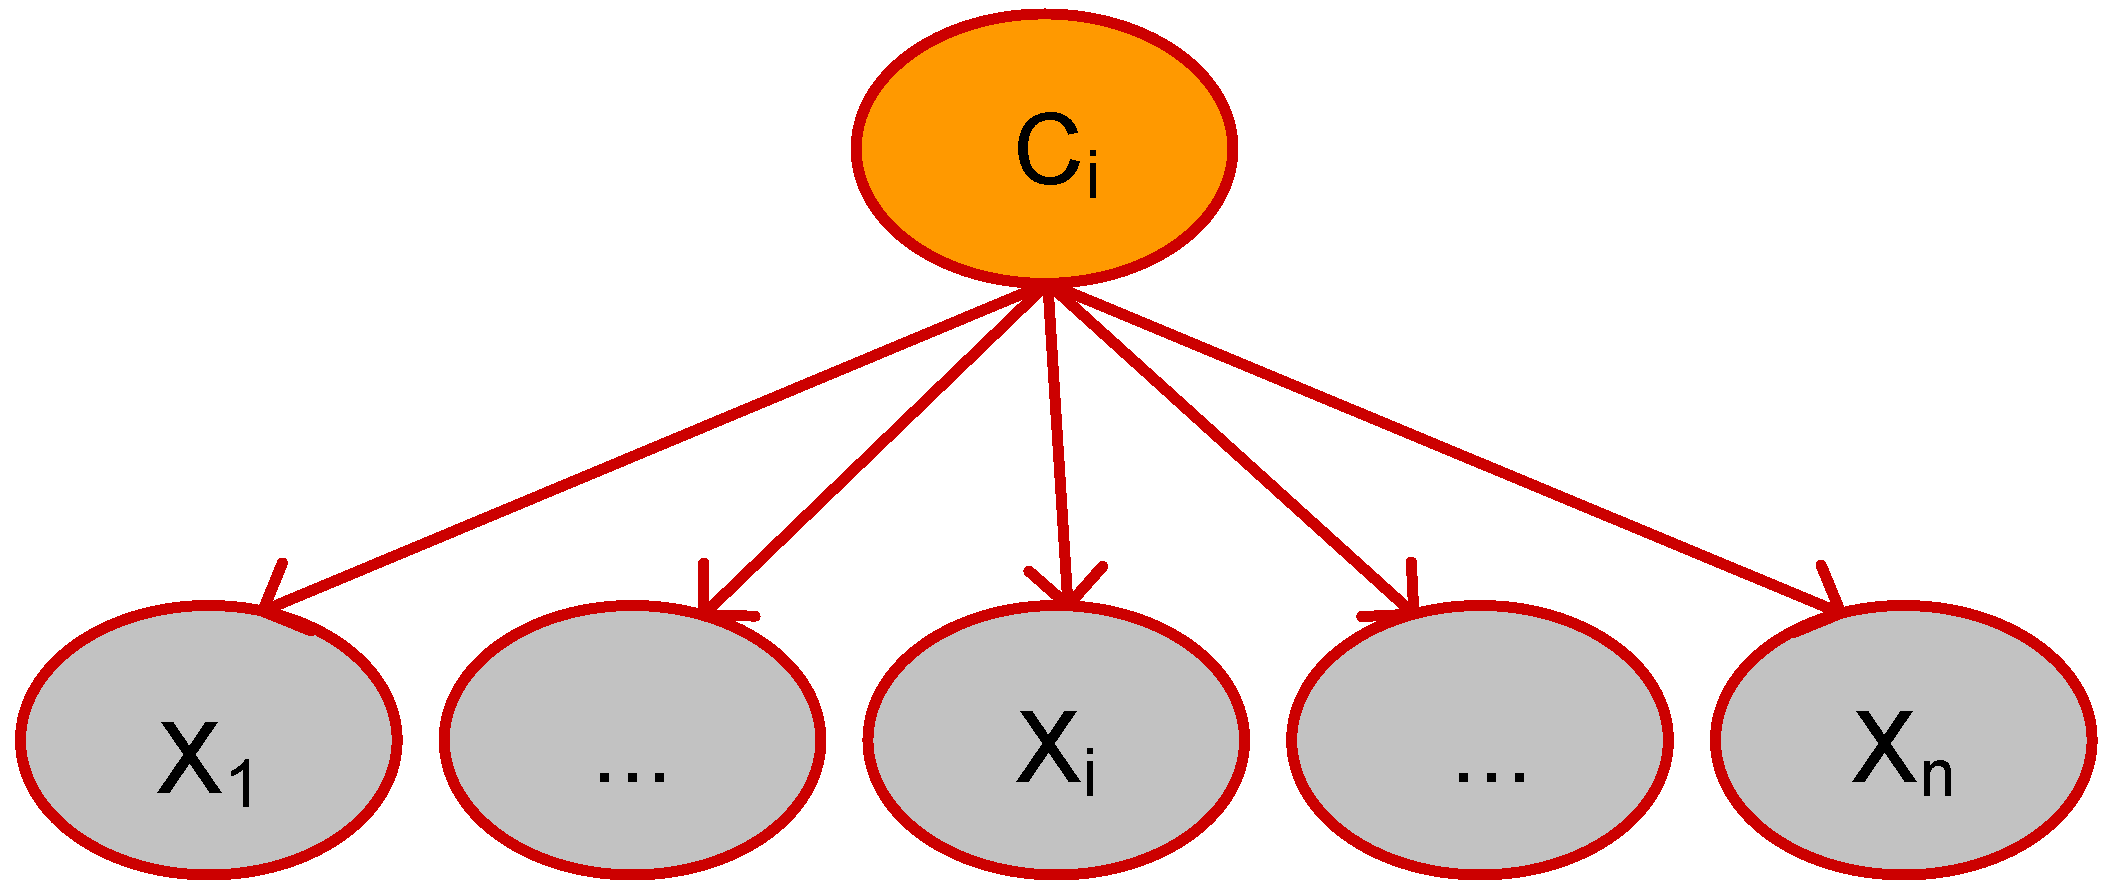
A diagram of an exemplary BN structure is presented in
Figure 9. The provided diagram illustrates in a simplified manner the coding within CPT and the meaning interpretation of the nodes of the so-called parents.
The procedure for learning a BN from data consists of two interconnected steps:
Structure Learning and
Parameter Learning [
54], which can be written as (6):
The self-contained extraction of BN structure from the data is much more difficult than the implementation of an arbitrarily determined model, e.g., based on expert knowledge. This approach is mostly used where it is required to extract relationships among a large number of variables used to describe a given process. In such situations, determining the network structure from the data based on expert knowledge is impossible. This is dictated by the limited human perception when it comes to analyzing multivariate problems.
With respect to learning the BN structure from data, the unknowns are both the network structure (
) and the parameters (
) of the multinomial probability distribution tables (CPTs). In general, there are three different approaches in learning BN structure from data: constraint-based structure learning, score-based structure learning, and hybrid algorithms [
35].
The risk of damage to buildings is described by numerous factors with subtle contributions, as demonstrated by years of research described, among others, in [
10]. With these considerations in view, it is important that as many of the variables as possible are included in the model when extracting the BN structure. In turn, the basic criterion is that the probability distribution represented by the BN has the highest possible agreement with the information contained in the learning dataset. With this in mind, the research conducted analyses through a number of available score-based and constraint-based algorithms. As a result of these analyses, the optimal form of the DAG network was obtained for the learning method using Chow-Liu’s tree Augmented Naive Bayes (TAN-CL) algorithm [
17].
5. Results
In order to select the optimal method of building a damage risk assessment model, the assembled database was adapted for analysis. Then the calculation stage was carried out to obtain classifiers to assess the risk of damage to masonry buildings. In line with the previous justification regarding the choice of research methodology, the NBC and BN approaches were used for further analysis. At the same time, as part of the BNs methodology, an approach was used based on teaching the structure of BN from data (BNSL).
The classifiers were built in the R [
55] development environment with the use of the following packages:
bnlearn [
54],
bnclassify [
17],
caret [
56] oraz
naivebayes [
57].
5.1. Preparation of Data for Analysis
At the initial stage of data preparation for further analysis, extreme cases were rejected, the relative frequency of which for each of the variables did not exceed 5%. The data set filtered in this way was used for the stage in which the training and testing of individual models commenced.
Moving on to the learning stage, the data set was divided into training and test sets in the proportion of 80:20. Additionally, in order to maintain the completeness of the patterns for the learning and testing processes, the stratified sampling approach was applied [
58]. In general, it forces the presence of patterns of the same category in both the training set and the test set. Thus, the information is complete for both the learning process and the subsequent testing.
Ultimately, the number of separated sets was 478 cases for the training set and 116 cases for the test set.
The training set was used for learning, as required for each method included in the research. The test set, which did not participate in the learning process, was used as unbiased to evaluate the created models in the context of generalization properties.
5.2. Interpretation of the Results and the Adopted Method of Their Verification
In order to effectively compare the results of individual methods, a universal measure of the classification correctness assessment was used, namely the confusion matrix. An example of such a matrix in a binary (dichotomous) classification is presented in
Table 3.
The basic comparative parameter here is the overall accuracy, which is the quotient of the sum of correctly classified cases and their total number [
59] (7):
It is advisable that the chosen method should also be characterized by the highest possible precision and sensitivity:
Positive Predictive Value (PPV) [
59] (8):
True Positive Rate (TPR) [
59] (9):
As part of building models from the AI group, a very important feature is the generalization of the knowledge obtained during the learning process, which can be verified on the testing set. In this sense, knowledge generalization is defined as the ability of a model to predict the right response for non-learning cases.
In order to compare the generalization abilities of individual models, the relative difference in the accuracy of the classification for the training set and the test set ΔACC was calculated in relation to the results obtained on the training set.
Finally, after creating the NBC model and after extracting the structure for the BN method, they were compared in terms of the quality of classification and generalization properties. These results, together with a detailed discussion, are presented in
Section 5.3 and
Section 5.4 of this work. As part of the presentation of the obtained results, error matrices were used, taking into account the division into training and test sets. In accordance with the formulas (7)–(9), these matrices also summarize the results on the accuracy of classification as well as the average precision and sensitivity.
5.3. The Results Obtained for the NBC Method
The construction of the NBC classifier was carried out using four packages in the R environment. The best classification accuracy was characterized by the classifier built using the
naivebayes package [
57] and this model was taken into account in the further part of the research.
In the selected package, the implemented algorithm detects and assigns classes to individual variables, which allows the use of different distributions for each of them [
60]. A multinomial distribution was assigned to 23 variables. For the remaining four variables, with dichotomous values, Bernoulli distribution was proposed. In turn, the parameters for the conditional probability distribution tables (CPT) were determined by the maximum likelihood method (MLE—p. 4.1).
At the stage of building the NBC classifier, it is also necessary to use the
Laplace smoothing parameter. It is characterized by the fact that for its lower values, the accuracy of classification increases, but its effectiveness deteriorates significantly in atypical cases [
9]. Based on the multiple analyses carried out, it was found that when this parameter equal to the value of
pL = 10 was used, good classification accuracy was obtained while maintaining appropriate generalization properties.
The created model was assessed in the context of the correctness of the classification on the training and test sets as well as the generalization properties, in accordance with the criteria specified in
Section 5.2. The results in the form of a confusion matrix are presented in
Table 4.
Table 4 shows that the constructed model is characterized by a good classification accuracy of 83.89% for the training set. The results for the test set are satisfactory and the classification accuracy is 75.86%. Using the previously defined relative measure of Δ
ACC, the generalization abilities of the model were assessed as satisfactory (Δ
ACC = 9.57%).
5.4. The Results Obtained for the BN Method
The assumption of the possible mutual influence of individual variables allowed the analyses to be carried out in accordance with the BNs methodology.
The BN approach results in a network structure that depends on the selected classifier training method. The results for selected eight methods of learning the network structure were analysed. Some of the methods studied qualified for the constraint-based approach, and some for the score-based structure learning approach. These methods are available in the bnlearn [
54] and bnclassify [
17] packages.
The best results were obtained using the Chow-Liu’s tree Augmented Naive Bayes (TAN-CL) learning method. The chosen method of training the TAN-CL network is the result of a combination of two methods. The Tree Augmented Naive Bayes (TAN) method [
61], which approximates the interactions between variables using a tree-shaped structure, with the
Chow-Liu junction detection algorithm [
62].
The controlling parameter in the construction of the model is the measure of the fit of the model acting as an objective function for score-based optimization. The impact of three selected functions was analysed: Log-Likelihood (loglik), Akaike Information Criterion (AIC) and Bayesian Information Criterion (BIC). Ultimately, the best results were obtained for the AIC criterion.
The created model was assessed in the context of the correctness of classification and generalization properties. For this purpose, the results obtained from the simulation of the model response for the training and test set were used. As in the case of the NBC classifier, the representation of the results in the form of a matrix of errors was used, which is summarized in
Table 5.
Table 5 shows that the created BN network is characterized by a high classification accuracy of 83.89% for the training set. The results for the test set are also high and the classification accuracy is 87.07%. On the other hand, using the previously defined relative measure Δ
ACC, it can be concluded that the BN model has high generalization properties of the acquired knowledge from the learning stage (Δ
ACC = 3.79%). In this case, it proves an advantage in terms of the separated structure of BN (DAG), as well as correctly determined parameters in the learning process (
).
5.5. Comparison of Established NBC and BN Models
Considering the fact that both models achieved a high degree of correct classification for the training set, the main criterion for selecting a model to assess the risk of damage was the verification of generalization properties. This was done by analysing the classification accuracy of both models for the test set. In order to detail the verification process, the obtained results were additionally analysed in terms of precision (PPV) and sensitivity (TPR). The list of reliable criterion values is summarized in
Table 6 and subjected to a graphic interpretation, which is illustrated in
Figure 10.
As a result of the comparative analysis of the NBC and BN models, it was found that the separated structure of BN allows for the description of the modelled process, obtaining better results than in the case of the NBC model. As shown in
Table 3 and
Table 6, the BN network obtained better results in relation to each of the verified criteria (ACC, PPV and TPR). Additionally, by simulating both models on the data from the test set, it was shown that the BN network has better generalization properties than NBC. This is evidenced by the value of the defined measure Δ
ACC, which for the BN model reached the value of Δ
ACC = 3.79%, and for the NBC model Δ
ACC = 9.57%. In this case, the smaller the value means the smaller the difference in the correctness of the classification for the training set and the test set. Thus, a lower value of the Δ
ACC measure indicates better generalization properties.
Taking into account the results of the comparative analysis, it was found that a more effective tool for modelling the risk of damage to masonry buildings is the separated structure of the BN. In addition, implicit evidence was obtained that in order to model the risk of damage, it is necessary to take into account the relationship between individual variables, which is not taken into account in the NBC method.
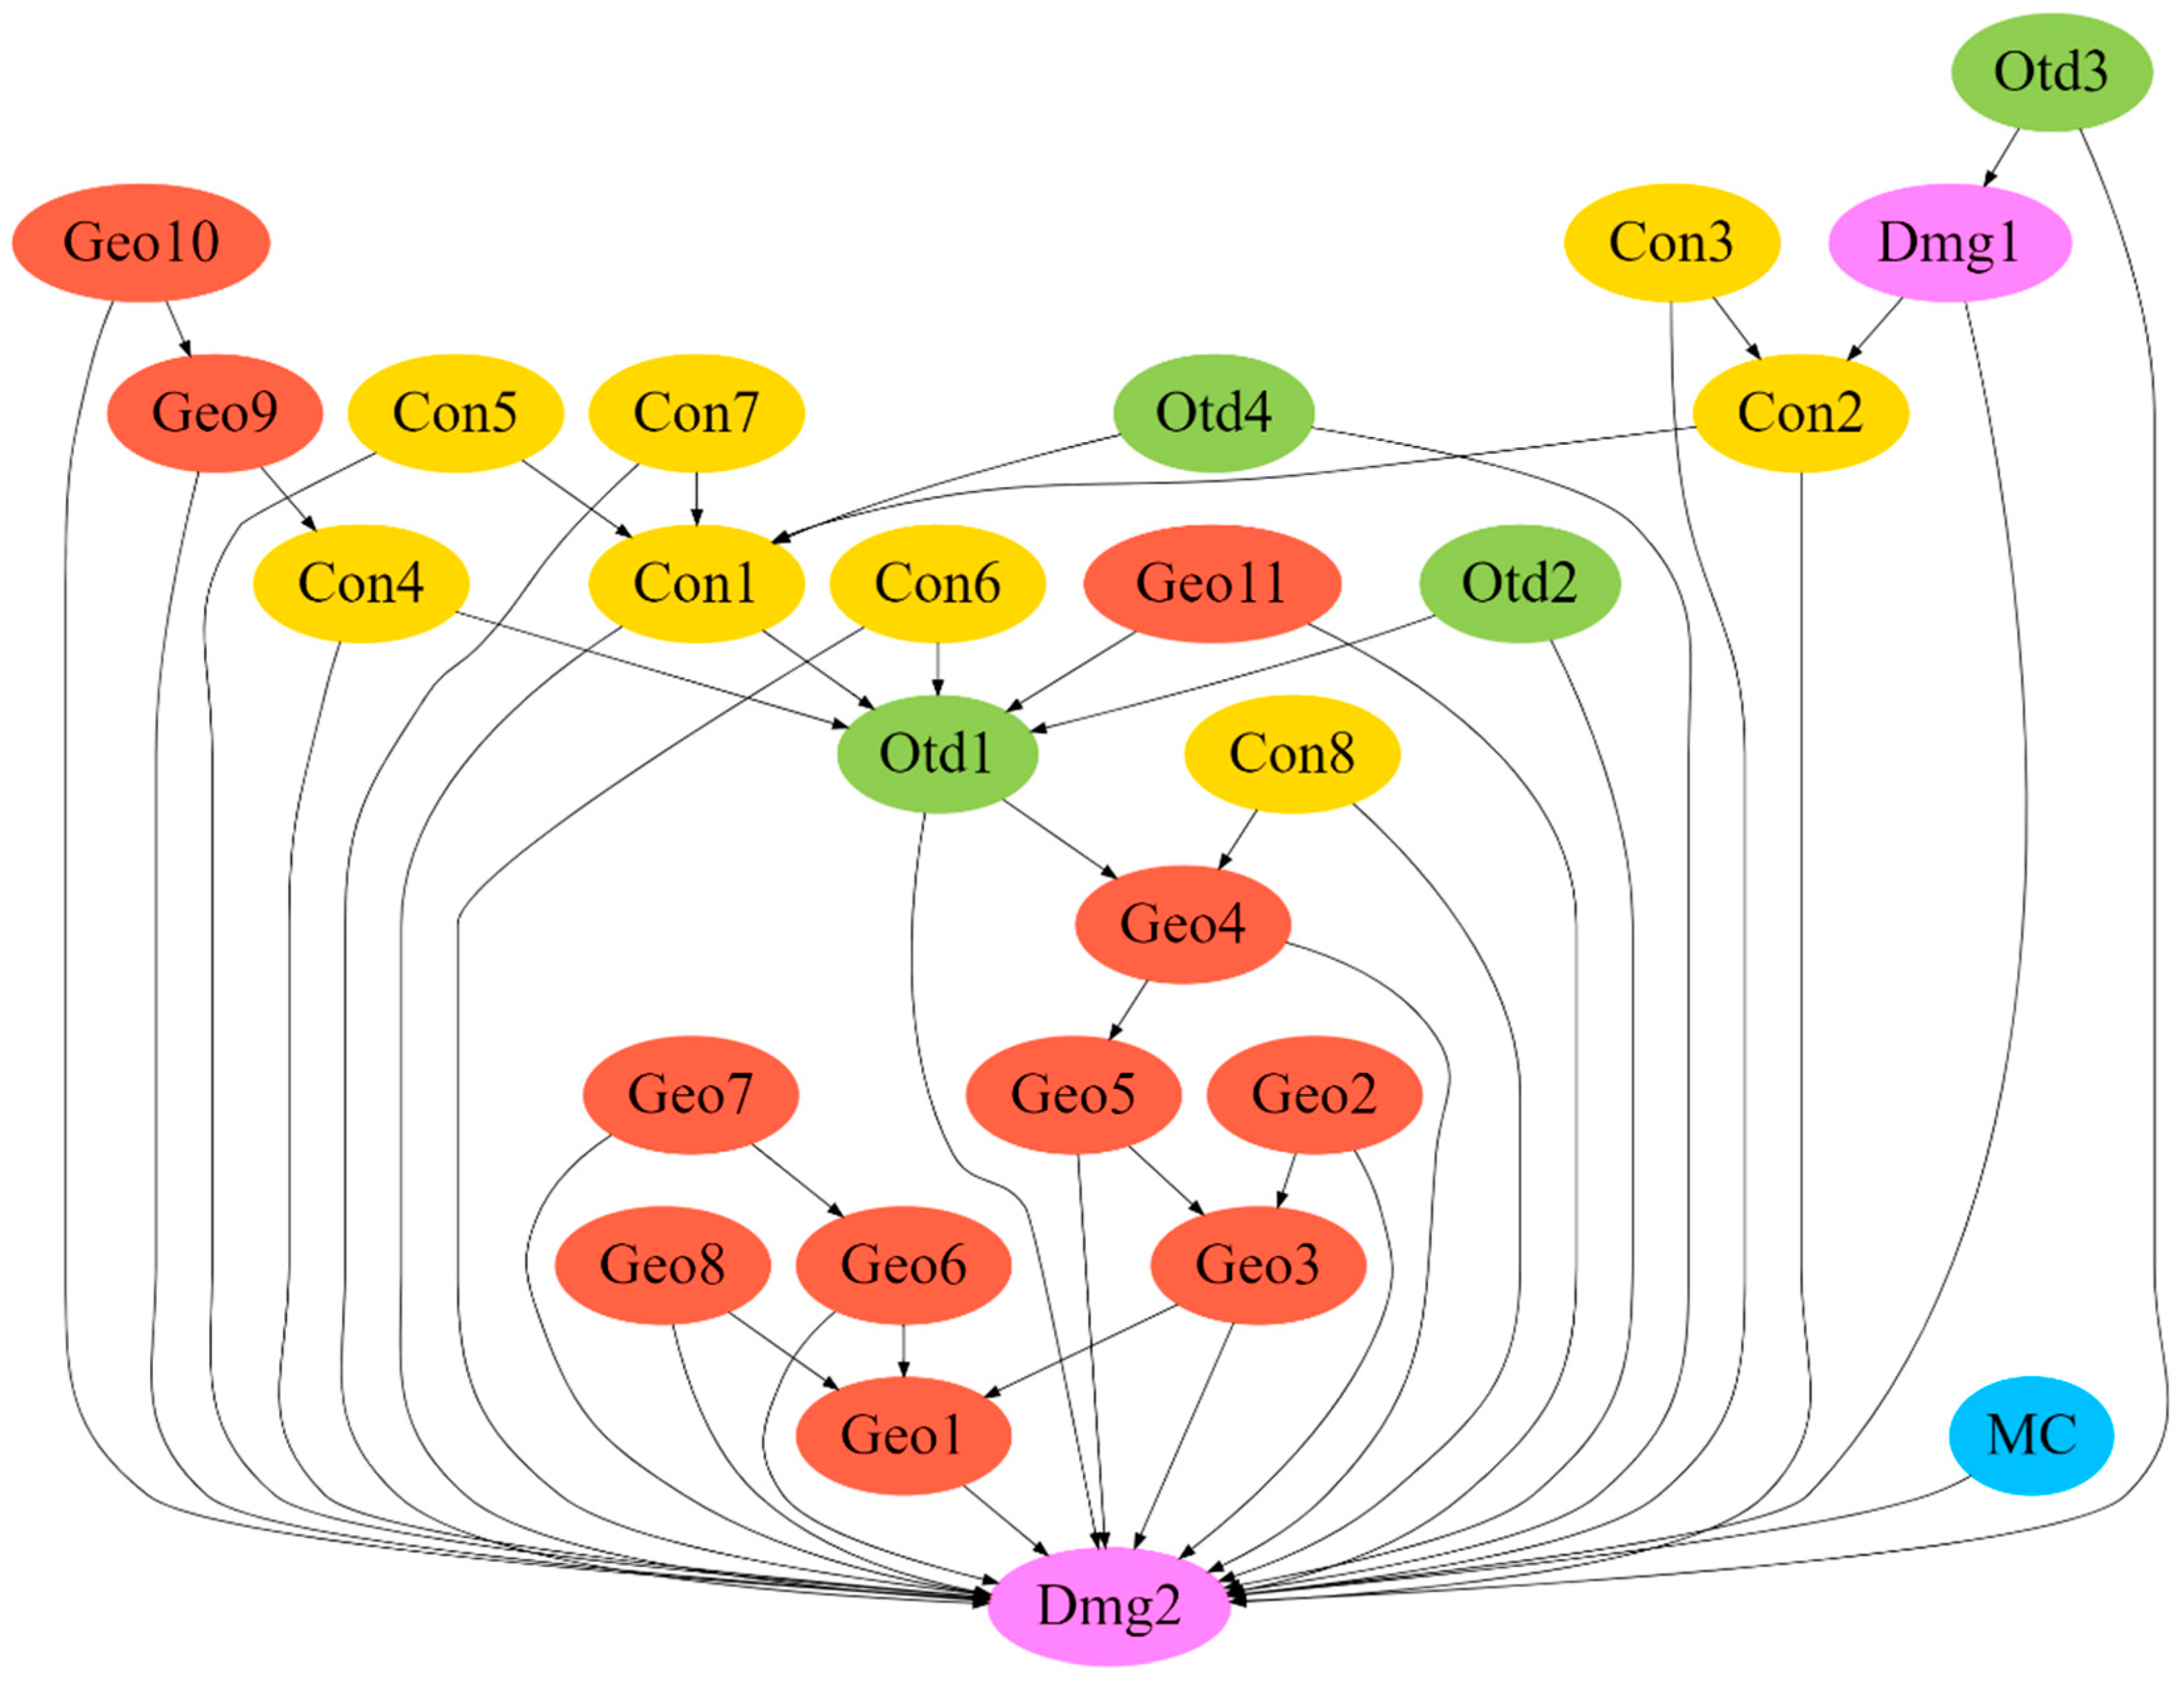
5.6. Analysis of Connections Occurring in the Separated Structure of the Bayesian Network
One of the advantages of the BN approach is the possibility of representing the model in the form of a graph structure (
DAG), which increases the interpretability of the model itself, and also supports the user in making decisions (
Decision Support Tool) [
63].
During the process of learning the BN structure from the data, any external interference in the relationships between the variables was abandoned. And so, for the TAN-CL learning method, the definition of constraints (in the form of lists defining blocked or forced connections) [
54] was abandoned, thus giving full autonomy to the adopted method of teaching the BN network structure.
Figure 11 shows the structure of the Bayesian network, indicating the direction of inference, and presents the variables taken into account in the decision-making process.
Based on the qualitative assessment of the relationships occurring in the separated BN structure, created by applying the TAN-CL learning algorithm (
Figure 11), it was found that there are numerous cause-effect relationships:
geometry variables (Geo) are linked together, as are the structure variables (Con),
the variable on mining impacts MC is not related to other variables and has an impact on the output variable Dmg2,
out of 48 connections, 45 were positively assessed, and three connections were neutral.
To sum up, it is estimated that the network structure is coherent and logical, and the obtained connections between the variables mostly coincide with those observed in engineering practice.
6. Conclusions
This work presents an example of the use of selected tools from the group of artificial intelligence (AI) methods to assess the risk of damage to masonry buildings located in the mining area of active mining facilities. After taking into account a number of criteria resulting from the practice of making these types of assessments for the protection of the development of mining areas, two AI tools belonging to the group of supervised learning methods were selected for analysis: NBC—Naive Bayes Classification and BN—Bayesian Networks.
Ultimately, using the “in-situ” data collected over many years of inspections of the technical condition of buildings in the mining area, 574 cases were collected and recorded in the form of a database. These data were used to train and test the NBC and BN models. At the same time, as part of building the BN model, it was necessary to isolate the unknown structure of connections between the variables describing the process under study. This task was finally carried out using the TAN-CL algorithm, which belongs to the group of methods for teaching the structure of BN from data (BNSL).
The obtained results were subjected to detailed individual and collective assessment. On this basis, it was found that the BN methodology was more effective than the simpler NBC approach. Thus, it has been shown implicitly that in order to describe a complex process which is the risk of damage to buildings, it is necessary to involve dependencies between individual variables, and thus to use BNSL methods.
The paper shows that better results in the context of mapping the information contained in the original data set were obtained for the extracted DAG structure of the Bayesian network compared to the simpler NBC model. This indicates the need to take into account the interrelationships between individual variables that are not taken into account in other AI methods, including the NBC model. Moreover, during the process of extracting the DAG structure of the Bayesian network, the connection between the variable describing the damage and the variable indicating the intensity of mining impacts was spontaneously separated.
The authors of the paper have currently undertaken research in the context of determining the significance of the relationships between the individual variables. Establishing the significance between individual nodes of the Bayesian network is necessary to complete the description of the damage process and to enable a more effective application of such a model in practice.
It should be emphasized that as in the case of all AI methods based on supervised learning, the reliability of the results obtained is strictly dependent on the information contained in the model data. This also means that a lot of emphasis should be placed already at the stage of collecting and archiving the data saved in the database. The authors dealt with the problem closely related to the issues of decision making under uncertainty. For this reason, based on specific criteria (Chapter 2), two presented methods based on the Bayesian inference formalism were distinguished for analysis. However, the choice of method depends absolutely on the type of problem. And so, for example, in the analysis of structural reliability assessment, other heuristic models, e.g., artificial neural networks, can be successfully used as a supporting tool for the FORM or SORM methods (First and Second Order Reliability Methods) [
64,
65].
As mentioned in chapter 1, the methodology of Bayesian networks is characterized by a very wide range of applications, an example of which can be found in issues related to threats of natural origin (e.g., floods, earthquakes, tsunamis, etc.).
The implementation of this type of tool may be implemented in the near future within the developing BIM concept. In conjunction with the IoT technology [
66], it will allow for permanent monitoring of building structures along with the simultaneous assessment of the risk from the impact of the industrial environment, which also includes the impact of mining activities. In turn, automatic data archiving and updating the damage risk model will contribute to a more detailed understanding of this phenomenon, which may bring great socio-economic benefits.
Author Contributions
L.C.—conceptualization, methodology, software analysis, validation, formal analysis, investigation, resources, data collection, writing—original draft preparation, writing—review and editing, visualization. J.R.—conceptualization, methodology, formal analysis, investigation, writing—original draft preparation, writing—review and editing, visualization, supervision. L.S.—conceptualization, formal analysis, supervision, project administration, funding acquisition. All authors have read and agreed to the published version of the manuscript.
Funding
This research received no external funding.
Data Availability Statement
The data presented in this study are available on request from the corresponding author. The data are not publicly available because they were taken from studies carried out for private enterprises.
Conflicts of Interest
The authors declare no conflict of interest.
References
- Dudek, M.; Tajduś, K. FEM for prediction of surface deformations induced by flooding of steeply inclined mining seams. Geomech. Energy Environ. 2021, 28, 100254. [Google Scholar] [CrossRef]
- Tajduś, K. The nature of mining-induced horizontal displacement of surface on the example of several coal mines. Arch. Min. Sci. 2014, 59, 971–986. [Google Scholar] [CrossRef] [Green Version]
- Tajduś, K.; Tajduś, A.; Cała, M. Seismicity and rock burst hazard assessment in fault zones: A case study. Arch. Min. Sci. 2018, 747–765. [Google Scholar] [CrossRef]
- Pachla, F.; Tatara, T. Dynamic Resistance of Residential Masonry Building with Structural Irregularities. In Seismic Behaviour and Design of Irregular and Complex Civil Structures II; Springer: Berlin, Germany, 2020; pp. 335–347. [Google Scholar]
- Lian, X.; Zhang, Y.; Yuan, H.; Wang, C.; Guo, J.; Liu, J. Law of Movement of Discontinuous Deformation of Strata and Ground with a Thick Loess Layer and Thin Bedrock in Long Wall Mining. Appl. Sci. 2020, 10, 2874. [Google Scholar] [CrossRef] [Green Version]
- Chen, S.; Chen, B.; Yin, D.; Guo, W. Characteristics of Discontinuous Surface Deformation Due to Mining in Hard, Thick Bedrock: A Case Study. Geotech. Geol. Eng. 2019, 37, 2639–2645. [Google Scholar] [CrossRef]
- Straub, D.; Schneider, R.; Bismut, E.; Kim, H.J. Reliability analysis of deteriorating structural systems. Struct. Saf. 2020, 82, 101877. [Google Scholar] [CrossRef]
- Drobiec, Ł.; Niemiec, T.; Kawulok, M.; Słowik, L.; Chomacki, L. The method of strengthening the church building in terms of the planned mining exploitation. MATEC Web Conf. 2019, 284, 05003. [Google Scholar] [CrossRef]
- Rusek, J. The Point Nuisance Method as a Decision-Support System Based on Bayesian Inference Approach. Arch. Min. Sci. 2020, 65, 117–127. [Google Scholar]
- Firek, K.; Rusek, J. Partial least squares method in the analysis of the intensity of damage in prefabricated large-block building structures. Arch. Min. Sci. 2017, 62. [Google Scholar] [CrossRef] [Green Version]
- Carleo, G.; Cirac, I.; Cranmer, K.; Daudet, L.; Schuld, M.; Tishby, N.; Vogt-Maranto, L.; Zdeborová, L. Machine learning and the physical sciences. Rev. Mod. Phys. 2019, 91, 45002. [Google Scholar] [CrossRef] [Green Version]
- Pan, Y.; Zhang, L. Roles of artificial intelligence in construction engineering and management: A critical review and future trends. Autom. Constr. 2021, 122, 103517. [Google Scholar] [CrossRef]
- Rusek, J.; Tajduś, K.; Firek, K.; Jędrzejczyk, A. Score-based Bayesian belief network structure learning in damage risk modelling of mining areas building development. J. Clean. Prod. 2021, 296, 126528. [Google Scholar] [CrossRef]
- Cai, B.; Liu, Y.; Liu, Z.; Chang, Y.; Jiang, L. Bayesian Networks for Reliability Engineering; Springer: Singapore, 2020. [Google Scholar]
- Li, B.; Li, H. Prediction of tunnel face stability using a naive Bayes classifier. Appl. Sci. 2019, 9, 4139. [Google Scholar] [CrossRef] [Green Version]
- Scanagatta, M.; Salmerón, A.; Stella, F. A survey on Bayesian network structure learning from data. Prog. Artif. Intell. 2019, 8, 425–439. [Google Scholar] [CrossRef]
- Mihaljević, B.; Bielza, C.; Larrañaga, P. bnclassify: Learning Bayesian Network Classifiers. R J. 2019, 10, 455. [Google Scholar] [CrossRef] [Green Version]
- Zhang, Z.; Cui, P.; Zhu, W. Deep Learning on Graphs: A Survey. IEEE Trans. Knowl. Data Eng. 2020. [Google Scholar] [CrossRef] [Green Version]
- Cherny, S.S.; Nevo, D.; Baraz, A.; Baruch, S.; Lewin-Epstein, O.; Stein, G.Y.; Obolski, U. Revealing antibiotic cross-resistance patterns in hospitalized patients through Bayesian network modelling. J. Antimicrob. Chemother. 2020, 76, 239–248. [Google Scholar] [CrossRef]
- Liber, Y.; Cornet, D.; Tournebize, R.; Feidt, C.; Mahieu, M.; Laurent, F.; Bedell, J.-P. A Bayesian network approach for the identification of relationships between drivers of chlordecone bioaccumulation in plants. Environ. Sci. Pollut. Res. 2020, 27, 41046–41051. [Google Scholar] [CrossRef] [PubMed]
- bint E Ajmal, H.; Madden, M.G. Dynamic Bayesian Network Learning to Infer Sparse Models from Time Series Gene Expression Data. IEEE/ACM Trans. Comput. Biol. Bioinform. 2021, 1. [Google Scholar] [CrossRef] [PubMed]
- Qu, L.; Wang, Z.; Huo, Y.; Zhou, Y.; Xin, J.; Qian, W. Distributed Local Bayesian Network for Gene Regulatory Network Reconstruction. In Proceedings of the 2020 6th International Conference on Big Data Computing and Communications (BIGCOM), Deqing, China, 24 July 2020; pp. 131–139. [Google Scholar]
- Kabir, S.; Papadopoulos, Y. Applications of Bayesian networks and Petri nets in safety, reliability, and risk assessments: A review. Saf. Sci. 2019, 115, 154–175. [Google Scholar] [CrossRef]
- Zhou, Y.; Li, C.; Zhou, C.; Luo, H. Using Bayesian network for safety risk analysis of diaphragm wall deflection based on field data. Reliab. Eng. Syst. Saf. 2018, 180, 152–167. [Google Scholar] [CrossRef]
- Wu, Z.; Shen, Y.; Wang, H.; Wu, M. Urban flood disaster risk evaluation based on ontology and Bayesian Network. J. Hydrol. 2020, 583, 124596. [Google Scholar] [CrossRef]
- Zhang, S.; Li, C.; Zhang, L.; Peng, M.; Zhan, L.; Xu, Q. Quantification of human vulnerability to earthquake-induced landslides using Bayesian network. Eng. Geol. 2020, 265, 105436. [Google Scholar] [CrossRef]
- Song, M.J.; Cho, Y.S. Modeling maximum tsunami heights using bayesian neural networks. Atmosphere 2020, 11, 1266. [Google Scholar] [CrossRef]
- Rusek, J.; Firek, K.; Słowik, L. Extracting structure of bayesian network from data in predicting the damage of prefabricated reinforced concrete buildings in mining areas. Eksploat. Niezawodn. 2020, 22. [Google Scholar] [CrossRef]
- Noghabaei, M.; Heydarian, A.; Balali, V.; Han, K. Trend Analysis on Adoption of Virtual and Augmented Reality in the Architecture, Engineering, and Construction Industry. Data 2020, 5, 26. [Google Scholar] [CrossRef] [Green Version]
- Hilal, M.A.; Maqsood, T.; Abdekhodaee, A. A Hybrid Conceptual Model for BIM Adoption in Facilities Management: A Descriptive Analysis for the Collected Data BT—Collaboration and Integration in Construction, Engineering, Management and Technology; Ahmed, S.M., Hampton, P., Azhar, S., D. Saul, A., Eds.; Springer International Publishing: Berlin, Germany, 2021; pp. 327–332. [Google Scholar]
- Amos, D.; Au-Yong, C.P.; Musa, Z.N. Overview of Facilities Management and the Public Healthcare System in Ghana BT—Measurement of Facilities Management Performance in Ghana’s Public Hospitals; Amos, D., Au-Yong, C.P., Musa, Z.N., Eds.; Springer: Berlin, Germany, 2021; pp. 9–19. ISBN 978-981-33-4332-0. [Google Scholar]
- Ghobakhloo, M. Industry 4.0, digitization, and opportunities for sustainability. J. Clean. Prod. 2020, 252, 119869. [Google Scholar] [CrossRef]
- Rusek, J. Support Vector Machines and Probabilistic Neural Networks in the Assessment of the Risk of Damage to Water Supply Systems in Mining Areas. Available online: https://depot.ceon.pl/handle/123456789/12466 (accessed on 9 August 2021).
- Malinowska, A.; Hejmanowski, R.; Rusek, J. Estimation of the Parameters Affecting the Water Pipelines on the Mining Terrains with A Use of An Adaptive Fuzzy System. Arch. Min. Sci. 2016, 61. [Google Scholar] [CrossRef] [Green Version]
- Scutari, M.; Vitolo, C.; Tucker, A. Learning Bayesian networks from big data with greedy search: Computational complexity and efficient implementation. Stat. Comput. 2019, 29, 1–14. [Google Scholar] [CrossRef] [Green Version]
- Zhang, L.; Wu, X.; Qin, Y.; Skibniewski, M.J.; Liu, W. Towards a Fuzzy Bayesian Network Based Approach for Safety Risk Analysis of Tunnel-Induced Pipeline Damage. Risk Anal. 2016, 36, 278–301. [Google Scholar] [CrossRef] [PubMed]
- Rostamabadi, A.; Jahangiri, M.; Zarei, E.; Kamalinia, M.; Alimohammadlou, M. A novel Fuzzy Bayesian Network approach for safety analysis of process systems; An application of HFACS and SHIPP methodology. J. Clean. Prod. 2020, 244, 118761. [Google Scholar] [CrossRef]
- International Organization for Standardization Switzerland for PN ISO 2394: 2000. General Principles on Reliability for Structures; International Organization for Standardization: Geneva, Switzerland, 2000. [Google Scholar]
- Qin, J.; Zhu, J.; Hua, D.; Yuan, Y.; Yang, S. FEM analysis on masonry houses subjected to ground deformation. Ind. Constr. 2002, 32, 41–44. [Google Scholar]
- Abdallah, M.; Verdel, T. Behavior of a masonry wall subjected to mining subsidence, as analyzed by experimental designs and response surfaces. Int. J. Rock Mech. Min. Sci. 2017, 100, 199–206. [Google Scholar] [CrossRef]
- Capanna, I.; Aloisio, A.; Di Fabio, F.; Fragiacomo, M. Sensitivity assessment of the seismic response of a masonry palace via non-linear static analysis: A case study in l’aquila (italy). Infrastructures 2021, 6, 8. [Google Scholar] [CrossRef]
- Tatara, T. Influence of rigid lintels for dynamic response of low masonry buildings due to mining-related surface vibrations. Czas. Tech. Bud. 2006, 103, 143–157. [Google Scholar]
- Han, L.; Zhang, J.; Zhang, Y.; Ma, Q.; Alu, S.; Lang, Q. Hazard Assessment of Earthquake Disaster Chains Based on a Bayesian Network Model and ArcGIS. ISPRS Int. J. Geo-Inform. 2019, 8, 210. [Google Scholar] [CrossRef] [Green Version]
- Mitra, D.; Bhandery, C.; Mukhopadhyay, A.; Chanda, A.; Hazra, S. Landslide Risk Assessment in Darjeeling Hills Using Multi-criteria Decision Support System: A Bayesian Network Approach BT—Disaster Risk Governance in India and Cross Cutting Issues; Pal, I., Shaw, R., Eds.; Springer: Berlin, Germany, 2018; pp. 361–386. ISBN 978-981-10-3310-0. [Google Scholar]
- Tajduś, K. Analysis of horizontal displacement distribution caused by single advancing longwall panel excavation. J. Rock Mech. Geotech. Eng. 2015, 7, 395–403. [Google Scholar] [CrossRef]
- Kawulok, M. Diagnozowanie budynków zlokalizowanych na terenach górniczych; Instytut Techniki Budowlanej: Warsaw, Poland, 2021. [Google Scholar]
- Kawulok, M. Osąd eksperta w ochronie istniejących obiektów budowlanych na terenach górniczych. Przegląd Górniczy 2015, 71, 38–43. [Google Scholar]
- Hejmanowski, R. Modeling of time dependent subsidence for coal and ore deposits. Int. J. Coal Sci. Technol. 2015, 2, 287–292. [Google Scholar] [CrossRef] [Green Version]
- Qin, T. Machine Learning Basics BT—Dual Learning; Qin, T., Ed.; Springer: Berlin, Germany, 2020; pp. 11–23. ISBN 978-981-15-8884-6. [Google Scholar]
- ISO ISO 2394:2015. General Principles on Reliability for Structures; International Organization for Standardization: Geneva, Switzerland, 2015. [Google Scholar]
- Murphy, K. Machine Learning A Probabilistic Perspective; Massachusetts Institute of Technology: Cambridge, MA, USA, 2012. [Google Scholar]
- Scutari, M.; Graafland, C.E.; Gutiérrez, J.M. Who learns better Bayesian network structures: Accuracy and speed of structure learning algorithms. Int. J. Approx. Reason. 2019, 115, 235–253. [Google Scholar] [CrossRef] [Green Version]
- Pearl, J. Probabilistic Reasoning in Intelligent Systems: Networks of Plausible Inference; Elsevier: Amsterdam, The Netherlands, 2014. [Google Scholar]
- Scutari, M.; Ness, R. Package ‘bnlearn’. 2019. Available online: https://cran.r-project.org/web/packages/bnlearn/bnlearn.pdf (accessed on 9 August 2021).
- R Core Team. R: A Language and Environment for Statistical Computing. 2019. Available online: http://r.meteo.uni.wroc.pl/web/packages/dplR/vignettes/intro-dplR.pdf (accessed on 9 August 2021).
- Kuhn, M.; Wing, J.; Weston, S.; Williams, A.; Keefer, C.; Engelhardt, A.; Cooper, T.; Mayer, Z.; Ziem, A.; Scrucca, L.; et al. Package ‘caret’ R Topics Documented. 2020. Available online: https://cran.r-project.org/web/packages/caret/caret.pdf (accessed on 9 August 2021).
- Majka, M. Package Naivebayes: High Performance Implementation of the Naive Bayes Algorithm in R. 2019. Available online: https://cran.r-project.org/web/packages/naivebayes/naivebayes.pdf (accessed on 9 August 2021).
- Ramezan, C.A.; Warner, T.A.; Maxwell, A.E. Evaluation of sampling and cross-validation tuning strategies for regional-scale machine learning classification. Remote Sens. 2019, 11, 185. [Google Scholar] [CrossRef] [Green Version]
- Chicco, D.; Jurman, G. The advantages of the Matthews correlation coefficient (MCC) over F1 score and accuracy in binary classification evaluation. BMC Genom. 2020, 21, 1–3. [Google Scholar] [CrossRef] [PubMed] [Green Version]
- Majka, M. Introduction to naivebayes package Main functions. Cran. R-Proj. 2020, 1–15. Available online: https://cran.r-project.org/web/packages/naivebayes/vignettes/intro_naivebayes.pdf (accessed on 9 August 2021).
- Long, Y.; Wang, L.; Sun, M. Structure extension of tree-augmented naive bayes. Entropy 2019, 21, 721. [Google Scholar] [CrossRef] [PubMed] [Green Version]
- Russell, S.; Norvig, P. Artificial Intelligence: A Modern Approach; Prentice Hall: Upper Saddle River, NJ, USA, 2009; ISBN 0131038052. [Google Scholar]
- Olivier, J.; Aldrich, C. Use of decision trees for the development of decision support systems for the control of grinding circuits. Minerals 2021, 11, 595. [Google Scholar] [CrossRef]
- Papadopoulos, V.; Giovanis, D.G. Reliability Analysis. In Stochastic Finite Element Methods: An Introduction; Springer International Publishing: Berlin, Germany, 2018; pp. 71–98. ISBN 978-3-319-64528-5. [Google Scholar]
- Xiao, N.C.; Zuo, M.J.; Zhou, C. A new adaptive sequential sampling method to construct surrogate models for efficient reliability analysis. Reliab. Eng. Syst. Saf. 2018, 169, 330–338. [Google Scholar] [CrossRef]
- Scuro, C.; Sciammarella, P.F.; Lamonaca, F.; Olivito, R.S.; Carni, D.L. IoT for structural health monitoring. IEEE Instrum. Meas. Mag. 2018, 21, 4–14. [Google Scholar] [CrossRef]
Figure 1.
Diagram of the interaction of damage risk issues in various mining and civil engineering fields (own source).
Figure 1.
Diagram of the interaction of damage risk issues in various mining and civil engineering fields (own source).
Figure 2.
Distribution of deformation indices over the excavation: (u) vertical displacement; (T) inclination; (K) ground curvature; (ε) horizontal ground strain (own source).
Figure 2.
Distribution of deformation indices over the excavation: (u) vertical displacement; (T) inclination; (K) ground curvature; (ε) horizontal ground strain (own source).
Figure 3.
Diagram of characteristic damage to buildings in a mining basin: (
a) convex edge of the basin; (
b) concave edge of the basin; (1) diagonal cracks, (2) vertical cracks [
46].
Figure 3.
Diagram of characteristic damage to buildings in a mining basin: (
a) convex edge of the basin; (
b) concave edge of the basin; (1) diagonal cracks, (2) vertical cracks [
46].
Figure 4.
Two examples of the 207 masonry buildings qualified for the study: (a) example of a partially renovated building; (b) example building after full renovation.
Figure 4.
Two examples of the 207 masonry buildings qualified for the study: (a) example of a partially renovated building; (b) example building after full renovation.
Figure 5.
Distribution of building damage categories determined during the inventory in the years 2011–2017.
Figure 5.
Distribution of building damage categories determined during the inventory in the years 2011–2017.
Figure 6.
Distribution of data on the occurrence of tensile horizontal strain ε+ [mm/m] at the location of buildings from the period 2011–2017.
Figure 6.
Distribution of data on the occurrence of tensile horizontal strain ε+ [mm/m] at the location of buildings from the period 2011–2017.
Figure 7.
Distribution of data on the occurrence of compressive horizontal strain ε− [mm/m] at the location of buildings from the period 2011–2017.
Figure 7.
Distribution of data on the occurrence of compressive horizontal strain ε− [mm/m] at the location of buildings from the period 2011–2017.
Figure 8.
Schematic diagram of the NBC network structure.
Figure 8.
Schematic diagram of the NBC network structure.
Figure 9.
Schematic diagram of Bayesian Network structure (BN) as a Directed Acyclic Graph (DAG) with tables of conditional probabilities for a selected node (CPT).
Figure 9.
Schematic diagram of Bayesian Network structure (BN) as a Directed Acyclic Graph (DAG) with tables of conditional probabilities for a selected node (CPT).
Figure 10.
Comparison of the criteria values used to verify the effectiveness of the created NBC and BN models.
Figure 10.
Comparison of the criteria values used to verify the effectiveness of the created NBC and BN models.
Figure 11.
Network structure for the BN classifier obtained using the TAN-CL learning methods.
Figure 11.
Network structure for the BN classifier obtained using the TAN-CL learning methods.
Table 1.
Summary of basic parameters of mining exploitation in the study area.
Table 1.
Summary of basic parameters of mining exploitation in the study area.
| Deck | Wall | Height [m] | Depth [m] | Period of Exploitation |
|---|
| 503 | 4 | 2.6–3.3 | 625–720 | 2011–2013 |
| 510 wg | 30a and 31a | 2.0–2.4 | 725–805 | 2013–2015 |
| 503 | 5 i 6 | 2.0–2.3 | 670–680 | 2015–2017 |
Table 2.
List of variables with indication of their discretization (categories).
Table 2.
List of variables with indication of their discretization (categories).
| Variable Type | Variable | Code | No. of Categories |
|---|
| Geometry | Length | Geo1 | 8 |
| Width | Geo2 | 6 |
| Building area | Geo3 | 10 |
| Number of overground storeys | Geo4 | 5 |
| Volume | Geo5 | 11 |
| Length of a series of compact buildings | Geo6 | 12 |
| Dilation method | Geo7 | 3 |
| The shape of the building’s body | Geo8 | 4 |
| Basement | Geo9 | 3 |
| Variable level of foundation | Geo10 | 2 |
| Variable building height | Geo11 | 2 |
| Construction | Foundation type | Con1 | 3 |
| Basement wall material | Con2 | 3 |
| Material of the walls of the ground floor and above | Con3 | 2 |
| Ceiling above the basement | Con4 | 5 |
| Ceiling above the ground floor and above | Con5 | 3 |
| Lintels | Con6 | 3 |
| Protections for mining influence | Con7 | 4 |
| Protections—supplementary data | Con8 | 3 |
| Other technical data | Year of construction | Otd1 | 8 |
| Natural wear (technical condition) | Otd2 | 5 |
| Repair factor | Otd3 | 2 |
| Static (deformation) resistance category | Otd4 | 3 |
| Mining impacts | Mining threat category of the terrain | MC | 3 |
| Damage | Damage category before impacts | Dmg1 | 4 |
| Damage category after impacts | Dmg2 | 4 |
Table 3.
Confusion matrix for a binary classifier.
Table 3.
Confusion matrix for a binary classifier.
| Actual Positive | Actual Negative |
|---|
| Predicted positive | True positives TP | False positives FP |
| Predicted negative | False negatives FN | True negatives TN |
Table 4.
Confusion matrix of the NBC classifier—number of cases, precision, sensitivity and accuracy of classification.
Table 4.
Confusion matrix of the NBC classifier—number of cases, precision, sensitivity and accuracy of classification.
| Training Set—478 Cases |
| Damage State Category after Impacts (Dmg2) | Observed | Σ | PPV |
| 1 | 2 | 3 | 4 |
| Predicted | 1 | 28 | 33 | 12 | 0 | 73 | 38.36% |
| 2 | 12 | 216 | 1 | 8 | 237 | 91.14% |
| 3 | 1 | 3 | 140 | 6 | 150 | 93.33% |
| 4 | 0 | 1 | 0 | 17 | 18 | 94.44% |
| Σ | 41 | 253 | 153 | 31 | 478 | avg. PPV
79.32% |
| TPR | 68.29% | 85.38% | 91.50% | 54.84% | avg. TPR
75.00% | ACC
83.89% |
| Test Set—116 Cases |
| Damage State Category after Impacts (Dmg2) | Observed | Σ | PPV |
| 1 | 2 | 3 | 4 |
| Predicted | 1 | 7 | 6 | 5 | 0 | 18 | 38.89% |
| 2 | 4 | 58 | 1 | 3 | 66 | 87.88% |
| 3 | 0 | 2 | 20 | 7 | 29 | 68.97% |
| 4 | 0 | 0 | 0 | 3 | 3 | 100.00% |
| Σ | 11 | 66 | 26 | 13 | 116 | avg. PPV
73.93% |
| TPR | 63.64% | 87.88% | 76.92% | 23.08% | avg. TPR
62.88% | ACC
75.86% |
Table 5.
Confusion matrix of the BN classifier—number of cases, precision, sensitivity and accuracy of classification.
Table 5.
Confusion matrix of the BN classifier—number of cases, precision, sensitivity and accuracy of classification.
| Training Set—478 Cases |
| Damage State Category after Impacts (Dmg2) | Observed | Σ | PPV |
| 1 | 2 | 3 | 4 |
| Predicted | 1 | 40 | 15 | 0 | 0 | 55 | 72.73% |
| 2 | 1 | 220 | 29 | 5 | 255 | 86.27% |
| 3 | 0 | 15 | 118 | 3 | 136 | 86.76% |
| 4 | 0 | 3 | 6 | 23 | 32 | 71.88% |
| Σ | 41 | 253 | 153 | 31 | 478 | avg. PPV
79.41% |
| TPR | 97.56% | 86.96% | 77.12% | 74.19% | avg. TPR
83.96% | ACC
83.89% |
| Test set—116 cases |
| Damage State Category after Impacts (Dmg2) | Observed | Σ | PPV |
| 1 | 2 | 3 | 4 |
| Predicted | 1 | 11 | 2 | 0 | 0 | 13 | 84.62% |
| 2 | 0 | 58 | 4 | 0 | 62 | 93.55% |
| 3 | 0 | 5 | 22 | 3 | 30 | 73.33% |
| 4 | 0 | 1 | 0 | 10 | 11 | 90.91% |
| Σ | 11 | 66 | 26 | 13 | 116 | avg. PPV
85.60% |
| TPR | 100.00% | 87.88% | 84.62% | 76.92% | avg. TPR
87.35% | ACC
87.07% |
Table 6.
Comparison of classification accuracy (ACC), mean precision (avg. PPV) and sensitivity (avg. TPR) for selected artificial intelligence methods.
Table 6.
Comparison of classification accuracy (ACC), mean precision (avg. PPV) and sensitivity (avg. TPR) for selected artificial intelligence methods.
| Model Building Method | ACC for Training Set | ACC for Testing Set | Average PPV for Testing Set | Average TPR for Testing Set |
|---|
| NBC | 83.89% | 76.72% | 74.55% | 64.80% |
| BN | 83.89% | 87.07% | 85.60% | 87.35% |
| Publisher’s Note: MDPI stays neutral with regard to jurisdictional claims in published maps and institutional affiliations. |
© 2021 by the authors. Licensee MDPI, Basel, Switzerland. This article is an open access article distributed under the terms and conditions of the Creative Commons Attribution (CC BY) license (https://creativecommons.org/licenses/by/4.0/).


