
Influence Mechanism of Magnetized Modified Kerosene on Flotation Behavior of Molybdenite


1
School of Resources and Civil Engineering, Northeastern University, Shenyang 110819, China
2
School of Resources Engineering, Xi’an University of Architecture and Technology, Xi’an 710055, China
3
China Molybdenum Co., Ltd., Luanchuan 471500, China
*
Author to whom correspondence should be addressed.
Minerals 2022, 12(1), 2; https://0-doi-org.brum.beds.ac.uk/10.3390/min12010002
Submission received: 7 November 2021
/
Revised: 10 December 2021
/
Accepted: 15 December 2021
/
Published: 21 December 2021
(This article belongs to the Special Issue Flotation Chemistry, Volume II)
Abstract
:The effects and mechanism of magnetized kerosene on the flotation behaviors of molybdenite were studied by micro-flotation, ultraviolet spectrum, infrared spectrum, surface tension, and liquid viscosity. According to the results of micro-flotation, magnetized kerosene improved the flotation recovery of molybdenite, and the improvements were more obvious with smaller molybdenite particles. Spectral analysis showed that the magnetization did not change the chemical composition of kerosene, but transformed the linear aliphatic hydrocarbons in kerosene into linear isomers and reduced the lengths of the carbon chains. Moreover, the magnetization reduced the viscosity of kerosene and oil/water interfacial tension, and improved the dispersion of kerosene in the pulp. The external magnetic field transformed the disorder of the additional magnetic moment in the kerosene molecules into order, and reduced the compactness of the kerosene molecules. The experimental results provided a theoretical explanation for the role of magnetization in mineral flotation.
1. Introduction
Molybdenum is a rare metal with a high melting point, high strength, and high elastic coefficient. As a strategic mineral resource, molybdenum is widely used in the fields of iron and steel, petroleum, chemical industry, electrical and electronic technology, medicine, and agriculture [1,2,3]. Molybdenum deposits in China are mainly porphyry and porphyry skarn molybdenum deposits, which have the problems of low raw ore grade, fine embedded particle size, low recovery, and high production cost [4,5,6]. Therefore, the flotation behaviors and differences in different particle size of molybdenite are worthy of in-depth study. We ought to explore the reasons for the reduction in the floatability of fine-grained molybdenite and possible improvement measures [7,8].
Nonpolar hydrocarbon oil (such as kerosene, diesel oil, solar oil, and transformer oil) is one of the most extensively used collectors of floating molybdenite due to its excellent selectivity [9,10,11]. The floatability of molybdenite particles depends on the relative surface exposure of hydrophobic faces and hydrophilic edges [9,12]. The face is normally hydrophobic, resulting from the breaking of S–S molecular bonds (nonpolar faces), and the edge is normally hydrophilic, resulting from the rupturing of the strong covalent Mo–S bonds (polar edges). Nonpolar hydrocarbon oils are used as collectors to enhance the hydrophobicity of molybdenite faces, and therefore, the molybdenite’s flotation. since these oils are readily to adsorb on molybdenite faces through hydrophobic interactions and van der Waals forces. Wei et al. [4,13] studied the crystal structure and surface properties of molybdenite by using density functional theory. The hydrophobicity of molybdenite’s {001} surface is greater than that of its {100} surface. This is because the covalency of S–Mo bonds on the molybdenite {001} plane is greater than that on the {100} plane. Therefore, non-polar hydrocarbon oil agents easily interact with molybdenite’s {001} surface to collect molybdenite, whereas polar agents such as xanthate more easily interact with the {100} surface. However, the effect of temperature on the flotation performance of nonpolar hydrocarbon oil (e.g., kerosene and diesel oil) has been frequently reported [14,15,16] and is attributed to solubility, which is temperature dependent. The solubility and activity of nonpolar hydrocarbon oil in pulp are reduced at low temperatures, especially during cold winters. This reduction causes decreased collecting capability and increased required dosage for any oil at low temperatures. A relatively simple method is to improve the solubility of the collector by increasing the pulp temperature, but this is uneconomical. Hence, it is necessary to study new methods of improving the low-temperature flotation performance of nonpolar oils.
In recent years, magnetization technology has been used as an auxiliary method of gravity separation and flotation, which improves the properties of the minerals or reagents, thereby enhancing their flotation indexes [17,18,19,20]. Zeng et al. studied the effects of magnetized 2-octanol at different magnetization times and magnetic field intensities on the flotation performance of low-rank coal. They found that after 2-octanol was subjected to the magnetized pretreatment, the interfacial tension of 2-octanol and pulp conditioned with magnetized 2-octanol gradually decreased. Additionally, the clean coal yield was improved, whereas the clean coal ash content barely changed [19].
Kerosene is one of the most commonly used collectors in the molybdenite flotation, which has excellent collection ability for molybdenite [21,22]. The addition of kerosene, which enhances the floatability of molybdenite fines, promotes the aggregation of molybdenite particles [22]. However, these collectors are difficult to dissolve in water and have poor dispersion in water [23]. Improving the dispersion of this hydrocarbon oil in the pulp is the key to improving the flotation recovery of fine molybdenite [22,24,25]. Gao et al. studied the mechanism of froth flotation of molybdenite using oily collectors from the perspective of thinning and rupturing of a thin liquid film [24]. They found that both the thinning kinetics and the rupture thicknesses of the thin liquid films (TLFs) correlate with both the coverage and sizes of the oil droplets on molybdenite surfaces. Kerosene exhibits better dispersibility in deionized (DI) water than dodecane, and therefore, it performs better as a collector than dodecane from the perspective of film stability.
In this paper, the improvements in molybdenite floatation granted by a magnetized flotation reagent and its mechanismagnetizedtic impacts on the flotation of molybdenite were investigated, which provided theoretical support for the optimization of the flotation process and the determination of a reagent system for fine molybdenite.
2. Materials and Methods
2.1. Materials and Reagents
The molybdenite single mineral used in the test was taken from Guilin, Guangxi, China. The final products of five particle sizes were obtained after crushing, manual sorting, grinding, and screening of massive molybdenite samples (−180 + 125 μm, −125 + 74 μm, −74 + 45 μm, −45 + 20 μm and −20 μm). The average particle sizes of the five samples were 138.74 μm, 87.45 μm, 65.30 μm, 28.49 μm and 11.04 μm, respectively (in Table 1).
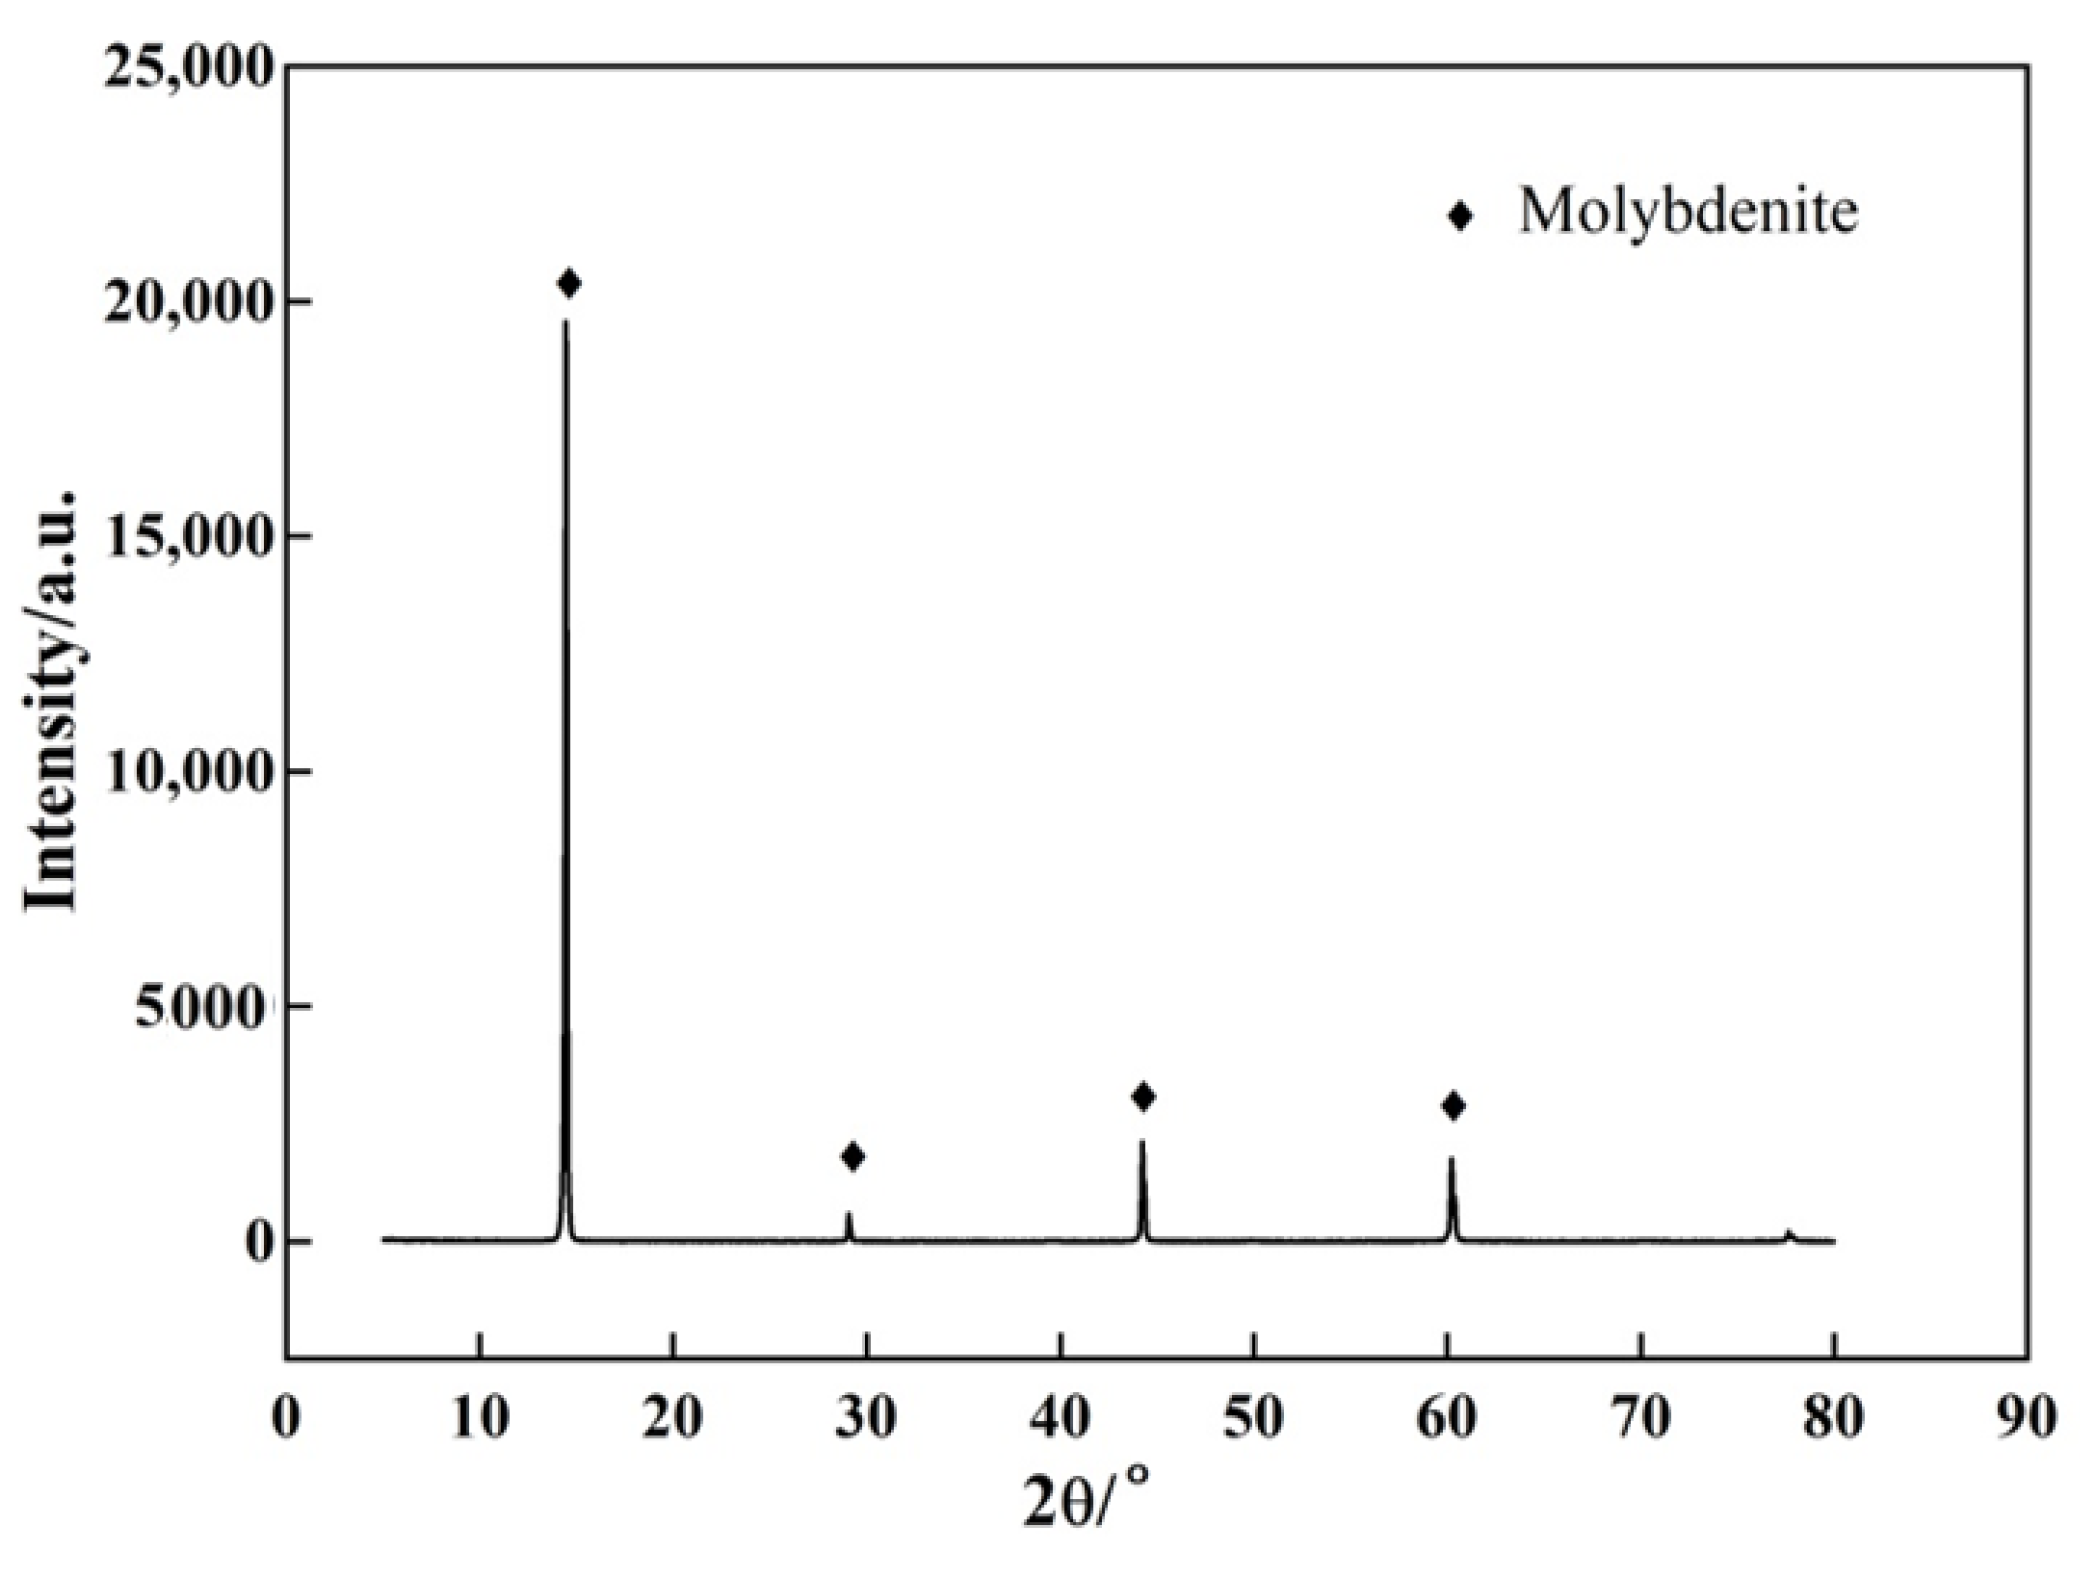
The X-ray diffraction (XRD) (D/MAX 2500PC, Rigaku, Tokyo, Japan) pattern of the molybdenite single mineral is shown in Figure 1. The result shows that the main mineral in the ore was molybdenite, and the content of MoS2 in the molybdenite was 98.6%.
2.2. Methods
2.2.1. Micro-Flotation Tests
The single mineral flotation test was carried out on an RK/FGC hanging cell flotation machine (Wuhan Rock Crush & Grand Equipment Manufacture Co., Ltd., Wuhan, China) with a flotation cell volume of 50 mL, and a spindle speed of 1780 r/min. Two grams (2.0) of single mineral was added into a flotation cell containing 50 mL of distilled water. The slurry was mixed and stirred for 2 min. The pH value of the slurry was adjusted to 6.0 with H2SO4 or NaOH, and stirred for 3 min after stabilization. The collectors and foaming agent were added successively, stirred for 3 min respectively, inflated for 1 min, and finally scraped with an average of 20 times per minute for 3 min. The foam and slot products were filtered, dried, and weighed separately, and the recovery rate was calculated.
2.2.2. Magnetization Experiment
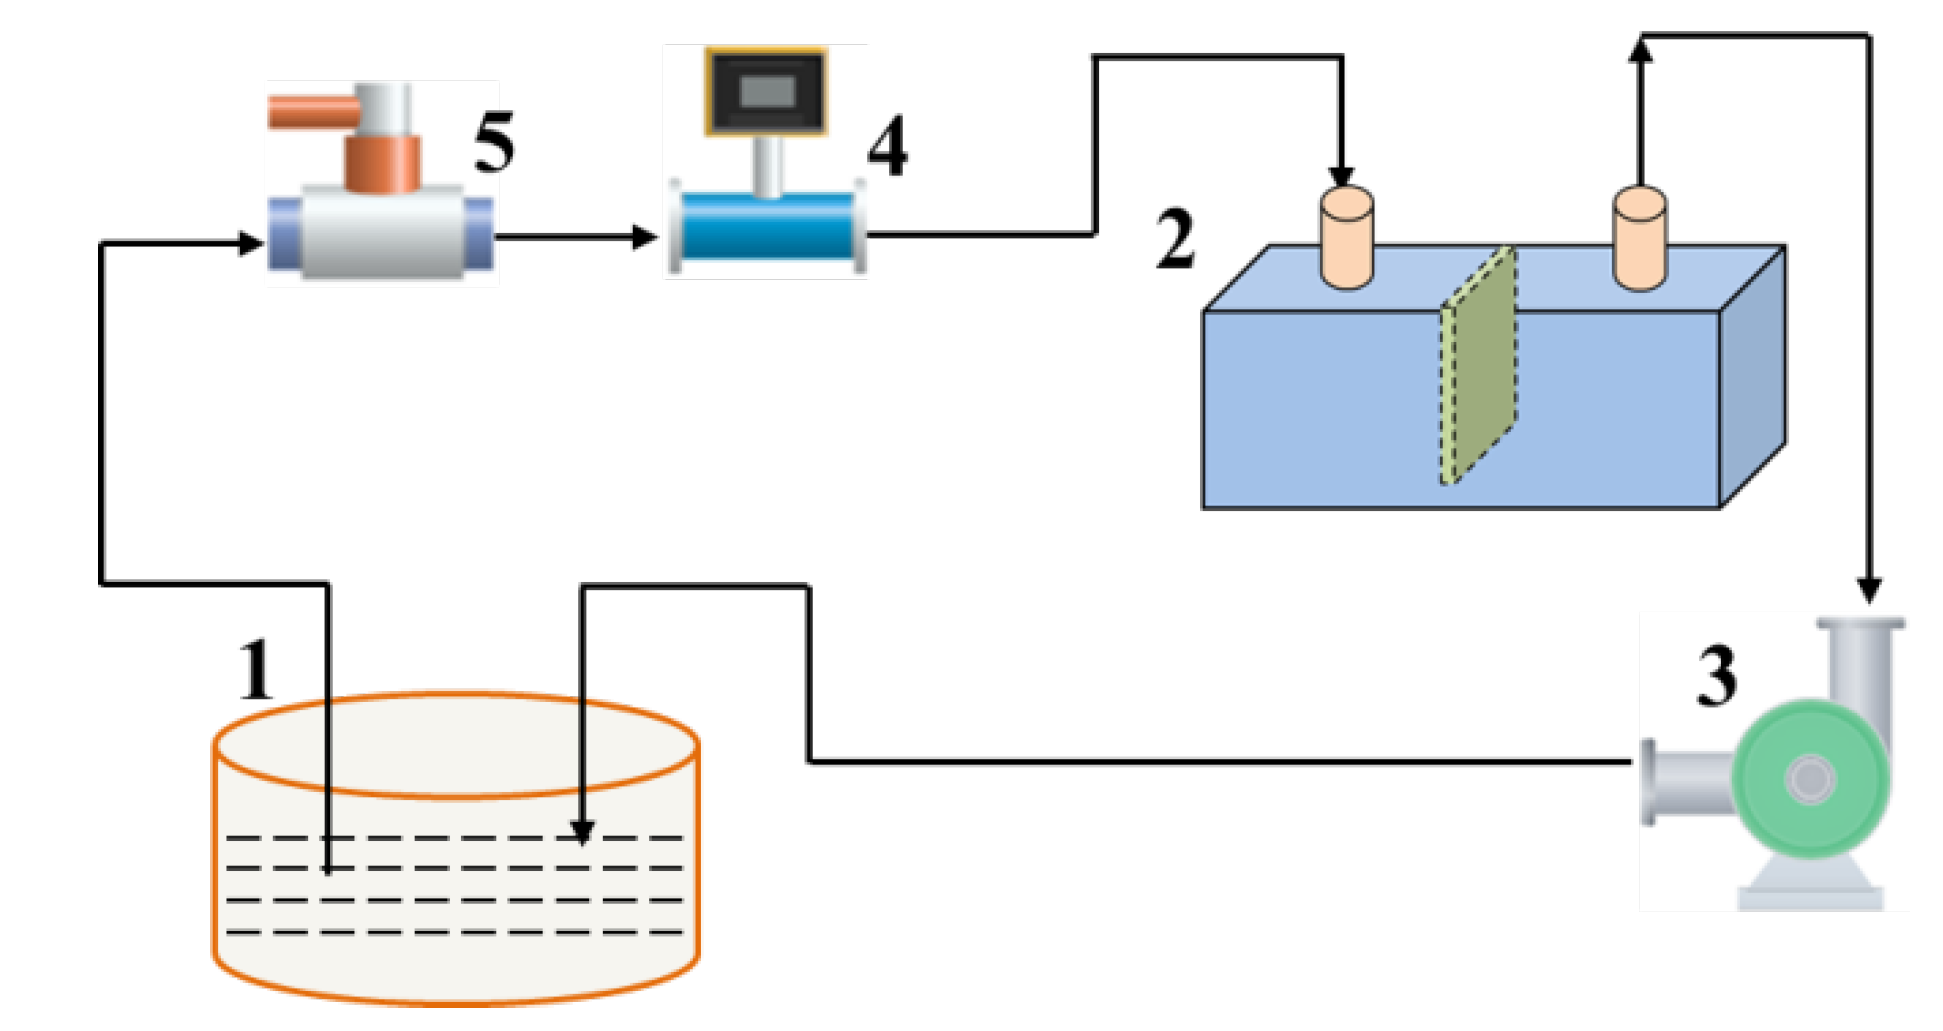
The self-made magnetization device [26] was used to magnetize the flotation reagent according to the process in Figure 2. A small amount of reagent was put into a special plexiglass container, the magnetic induction intensity was changed at a certain temperature, and the reagent was magnetized. The flotation test, surface tension measurement, and viscosity measurement were carried out immediately after magnetization.
2.2.3. Interfacial Tension Measurements
The interfacial tension of the solutions was measured by a BZY-1 automatic tensiometer (Shanghai Equitable Instrument and Meter Factory, Shanghai, China) with a platinum plate at an environmental temperature of 25 °C. Any possible organic contaminants on the Pt plate were removed using a microbeam flame until the Pt turned bright. The tabulated interfacial tension of deionized water at the same room temperature was used to calibrate each set of measurements. Before the measurements, each sample was stabilized for 10 min until reaching equilibrium. Three successive measurements were taken and averaged for each point.
2.2.4. Viscosity Measurements
The NDJ-8S rotary viscometer (Shanghai Fangrui Instrument Co., Ltd., Shanghai, China) is used to measure the viscosity of a liquid. Place the prepared liquid in a beaker with a diameter of 100 mm and keep the liquid at room temperature. Gradually immerse the rotor into the measured liquid until the liquid level mark is level with the liquid level. Turn the speed change knob, press the pointer control lever after the pointer is stable, and read the data. Parallel test three times, and take the average value as the viscosity of the liquid at this temperature.
2.2.5. Infrared Spectrum
Nicolet 50, the infrared spectrum analyzer (Thermo Fisher Scientific, Waltham, MA, USA), was used for infrared spectrum tests and analysis. The sample preparation conditions were consistent with those of the single mineral flotation. All reagents were added to the slurry, and fully stirred for 30 min. Finally, the pulp was filtered, and the sample was washed twice with distilled water. The cleaned sample was dried in a vacuum drying oven and stored. The KBr tablet pressing method was used for detection. One milligram of sample was evenly mixed with 100 mg of spectrally pure KBr, grounded with agate mortar, and then produced and measured in a special mold. The working parameters of the instrument were the scanning range of 4000–400 cm−1, the minimum resolution of 0.09 cm−1, and the wave-number accuracy of 0.01 cm−1.
3. Results and Discussion
3.1. Single Mineral Flotation
3.1.1. Effect of the Magnetized Collector on the Flotation Behavior of Molybdenite
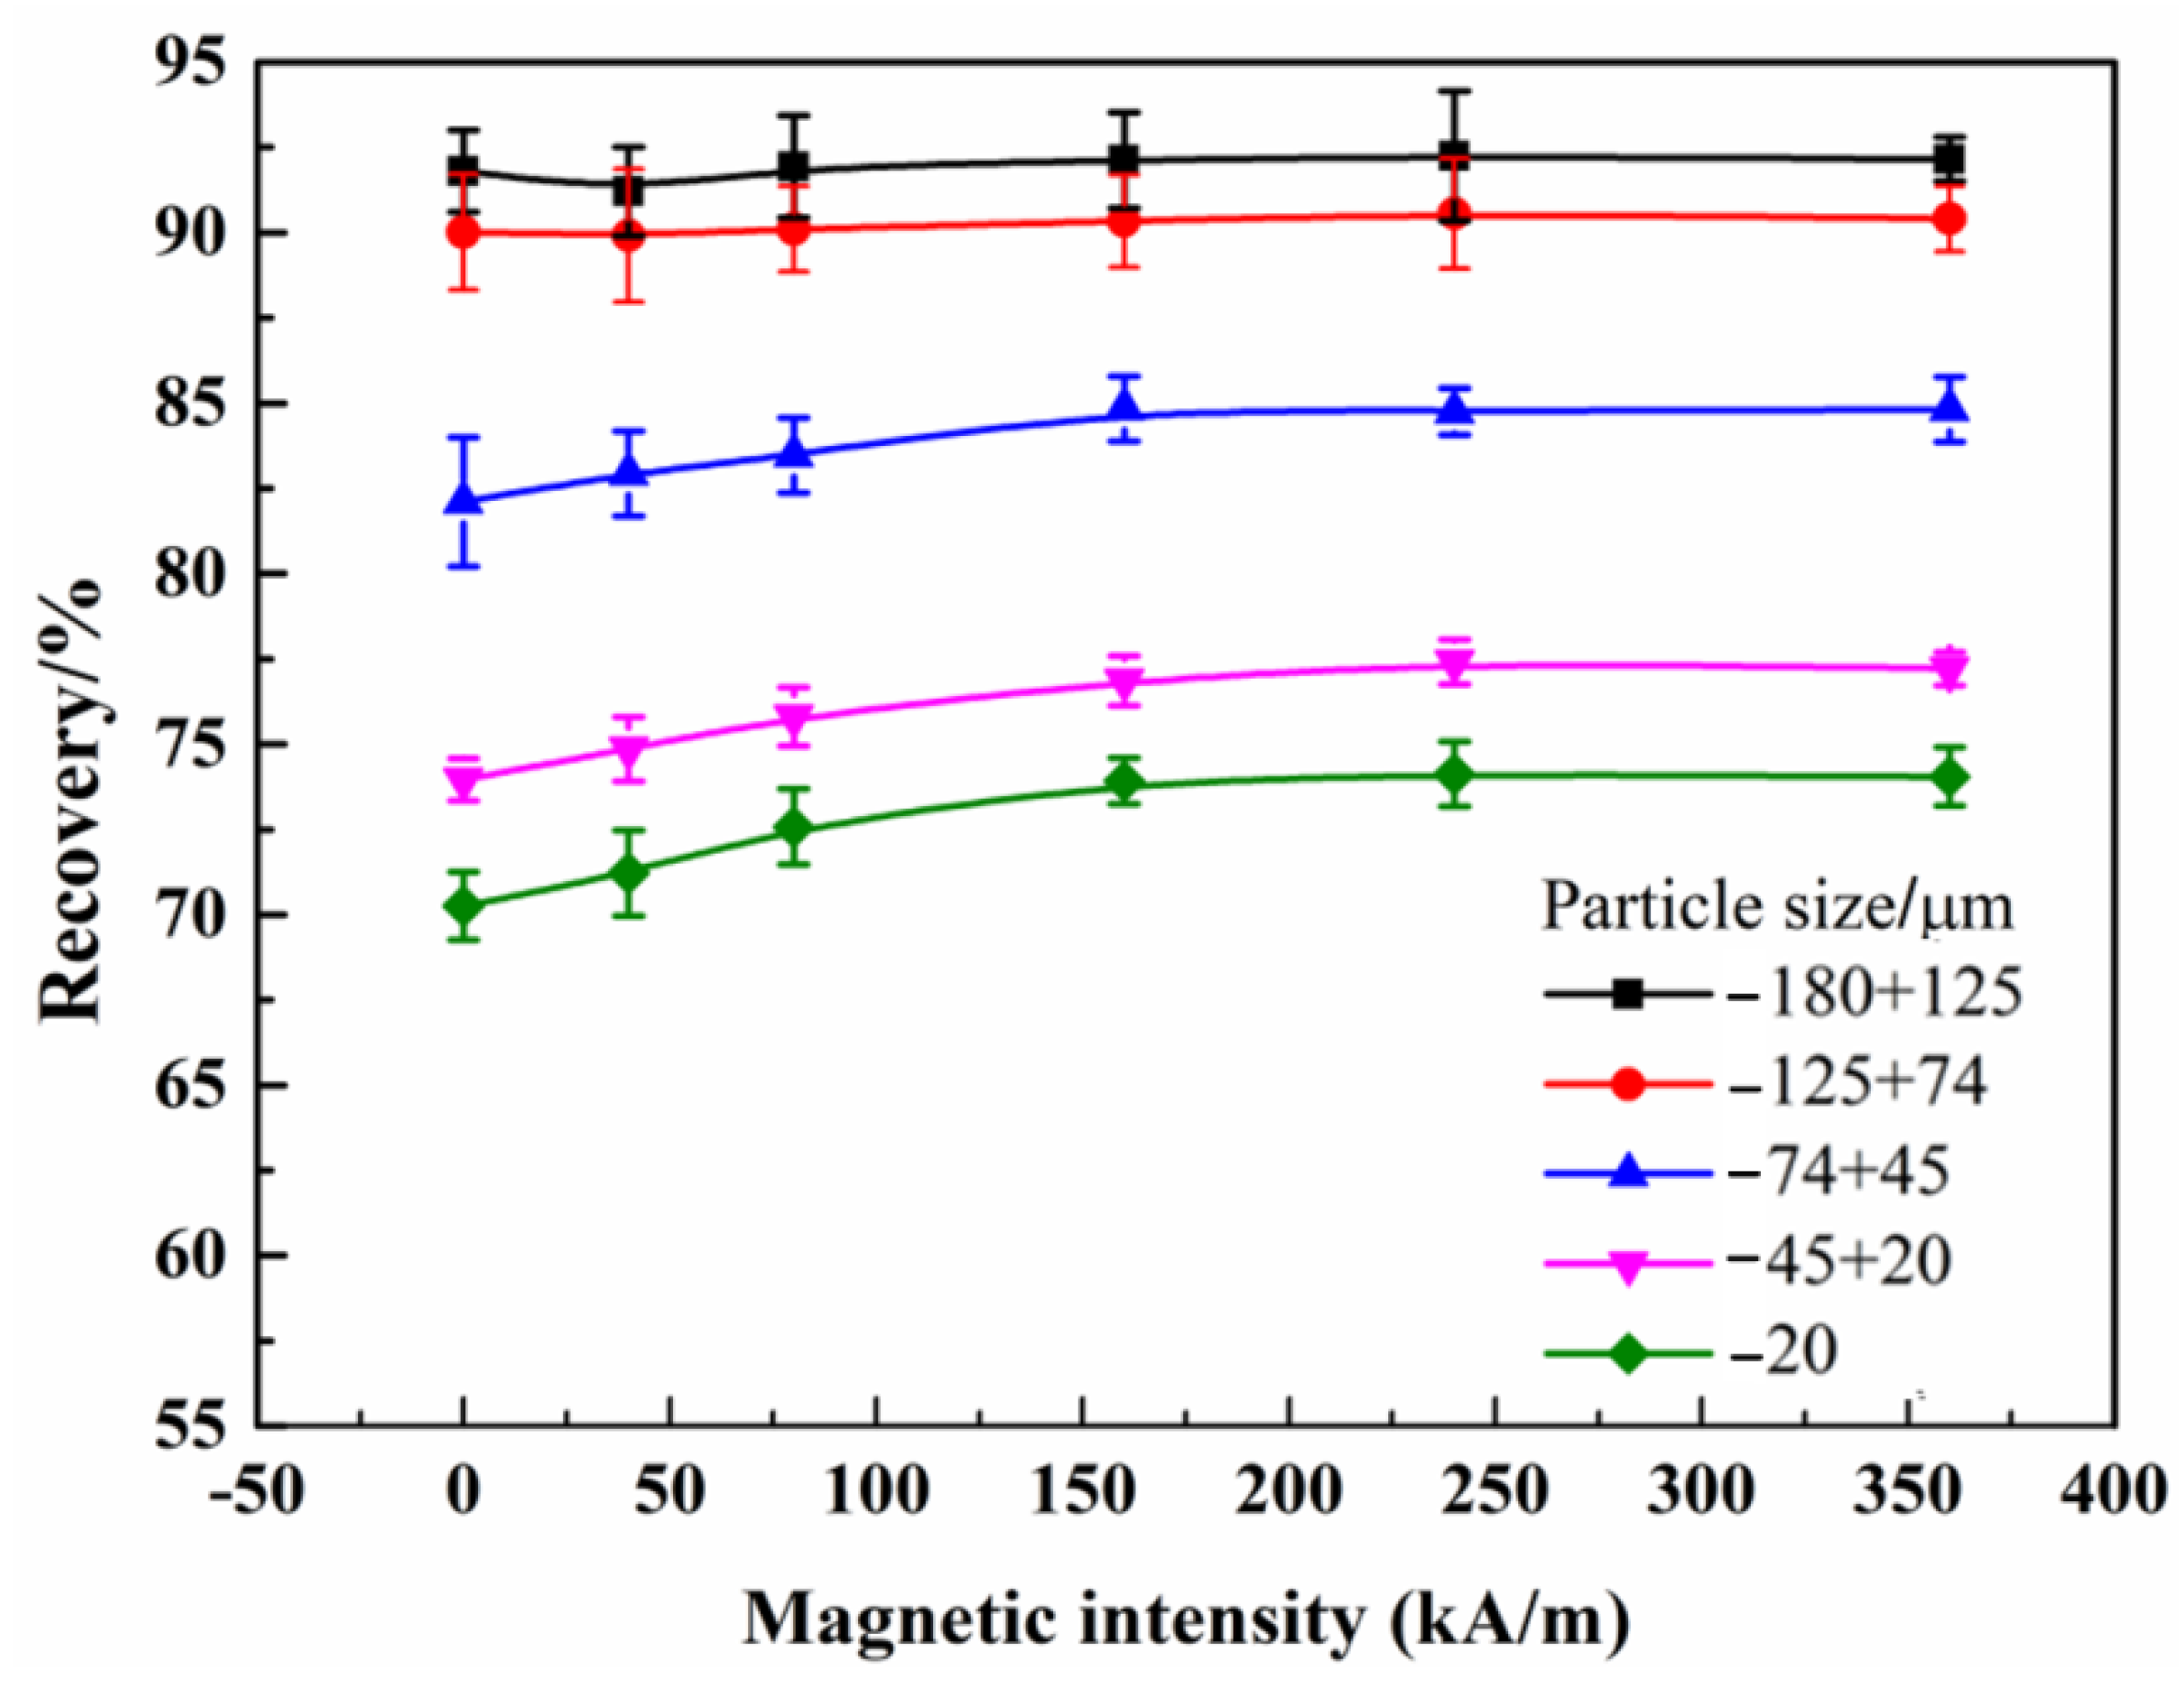
The effects of the magnetized kerosene on the flotation behaviors of molybdenite with different particle sizes are shown in Figure 3. When the magnetic field intensity was 0, the recoveries of the molybdenite samples with five particle sizes were 91.81%, 90.02%, 82.11%, 73.96%, and 70.25%, respectively. The recovery of each sample increased first and then gradually stabilized as the magnetic field intensity increased. When the magnetic field intensity was 160 kA/m, the recoveries of the molybdenite sample with each particle size were 92.13%, 90.34%, 84.84%, 76.86%, and 73.92%, respectively—0.32%, 0.32%, 2.73%, 2.90%, and 3.67% higher than those when the magnetic field intensity was 0. The results showed that magnetized kerosene was conducive to the flotation of molybdenite, and the smaller the particle size was, the greater the improvement was. Kerosene is adsorbed on the “surface” of molybdenite, not on the “edge.” As particle size increases, the specific surface area of molybdenite particles gradually increases, and the area of the “surface” also increases. Therefore, the adsorption capacity of kerosene on the surfaces of fine-grained minerals is greater than that on the surfaces of coarse-grained minerals. Therefore, once kerosene is magnetized, the dispersion becomes stronger, which is reflected in that the amount of kerosene adsorbed on fine-grained molybdenite was greater than that adsorbed on coarse-grained molybdenite, so the recovery of fine-grained molybdenite was improved more greatly.
3.1.2. Effect of Magnetization Time on the Flotation Behavior of Molybdenite
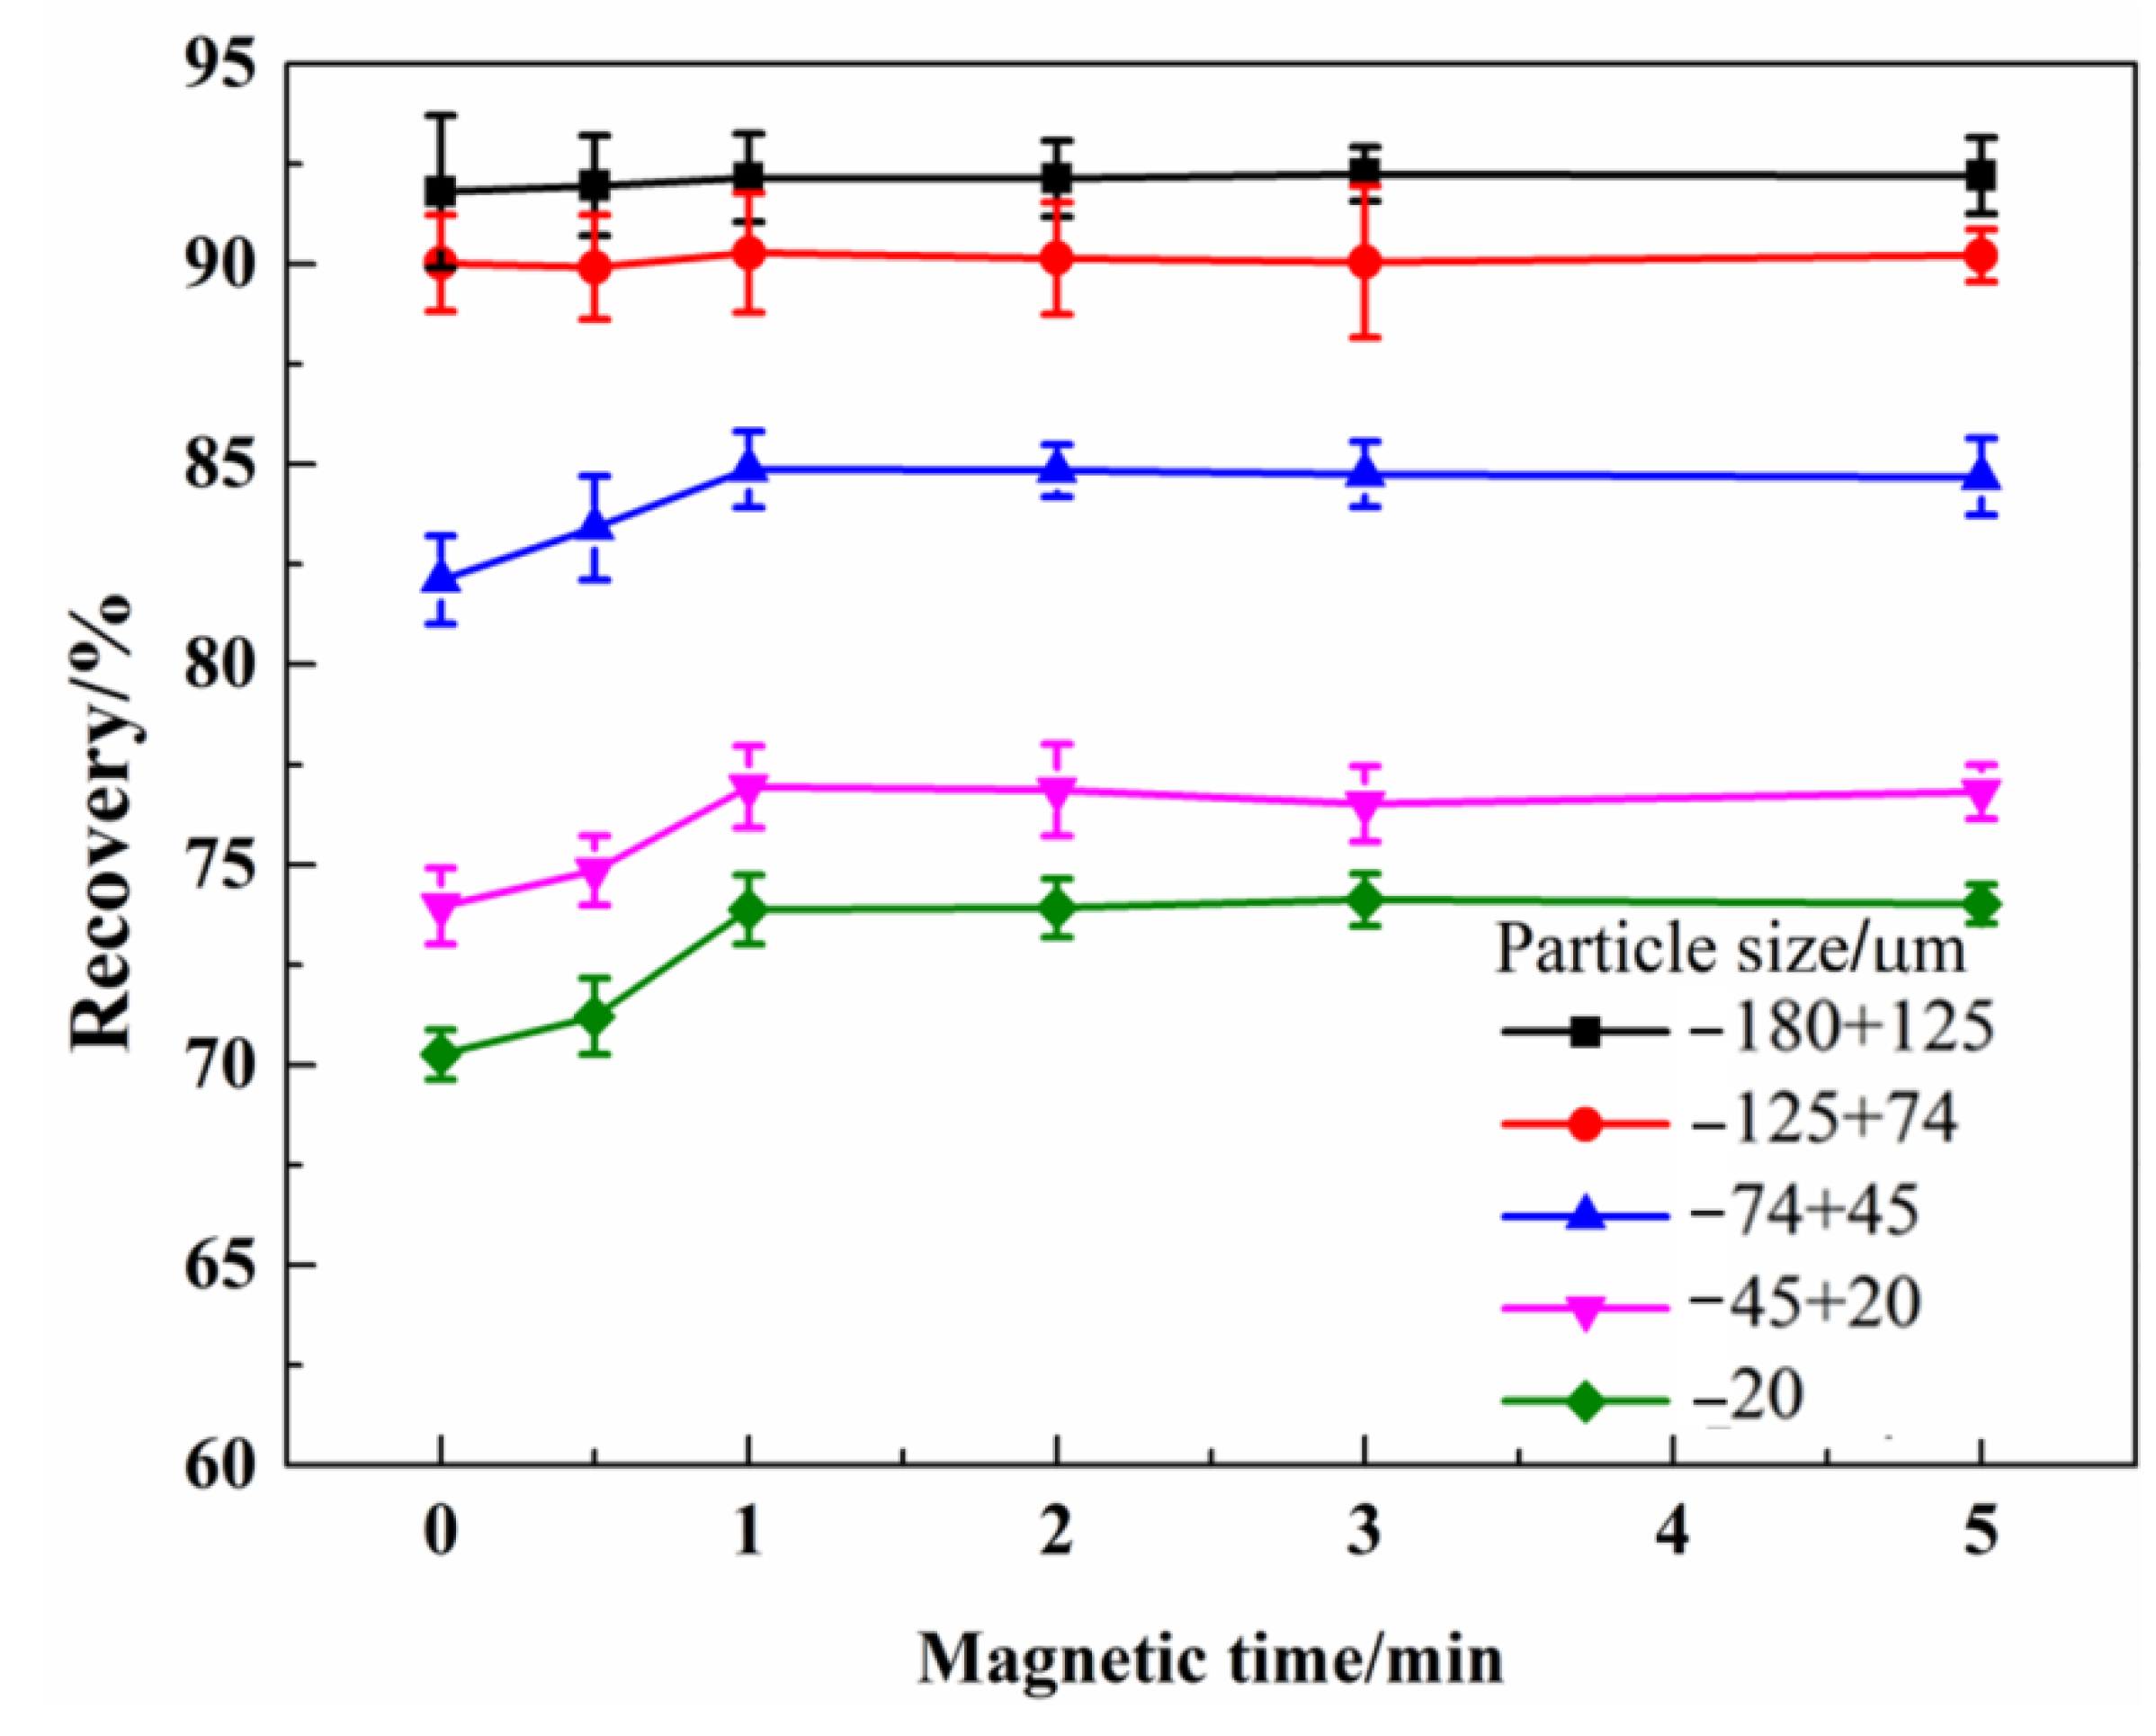
The transformation relationship between the flotation recovery of the molybdenite samples with different particle sizes and kerosene magnetization time under the condition of magnetic field intensity of 160 kA/m is shown in Figure 4. The flotation recovery of five particle sizes of molybdenite began to increase when kerosene was magnetized for more than 0.5 min. When the magnetization time was more than 1 min, the flotation recovery of molybdenite was significantly improved, and the recovery increased a little by prolonging the magnetization time. Therefore, the magnetization time of kerosene must not be less than 1 min, and the appropriate extension of magnetization time ensured the magnetization effect. Similarly, the improvement of flotation recovery with fine particle size was greater. This was mainly due to the increase in the “face” area of fine particles. Once the adsorption effect of kerosene was improved, the effect on fine particles was clearly superior.
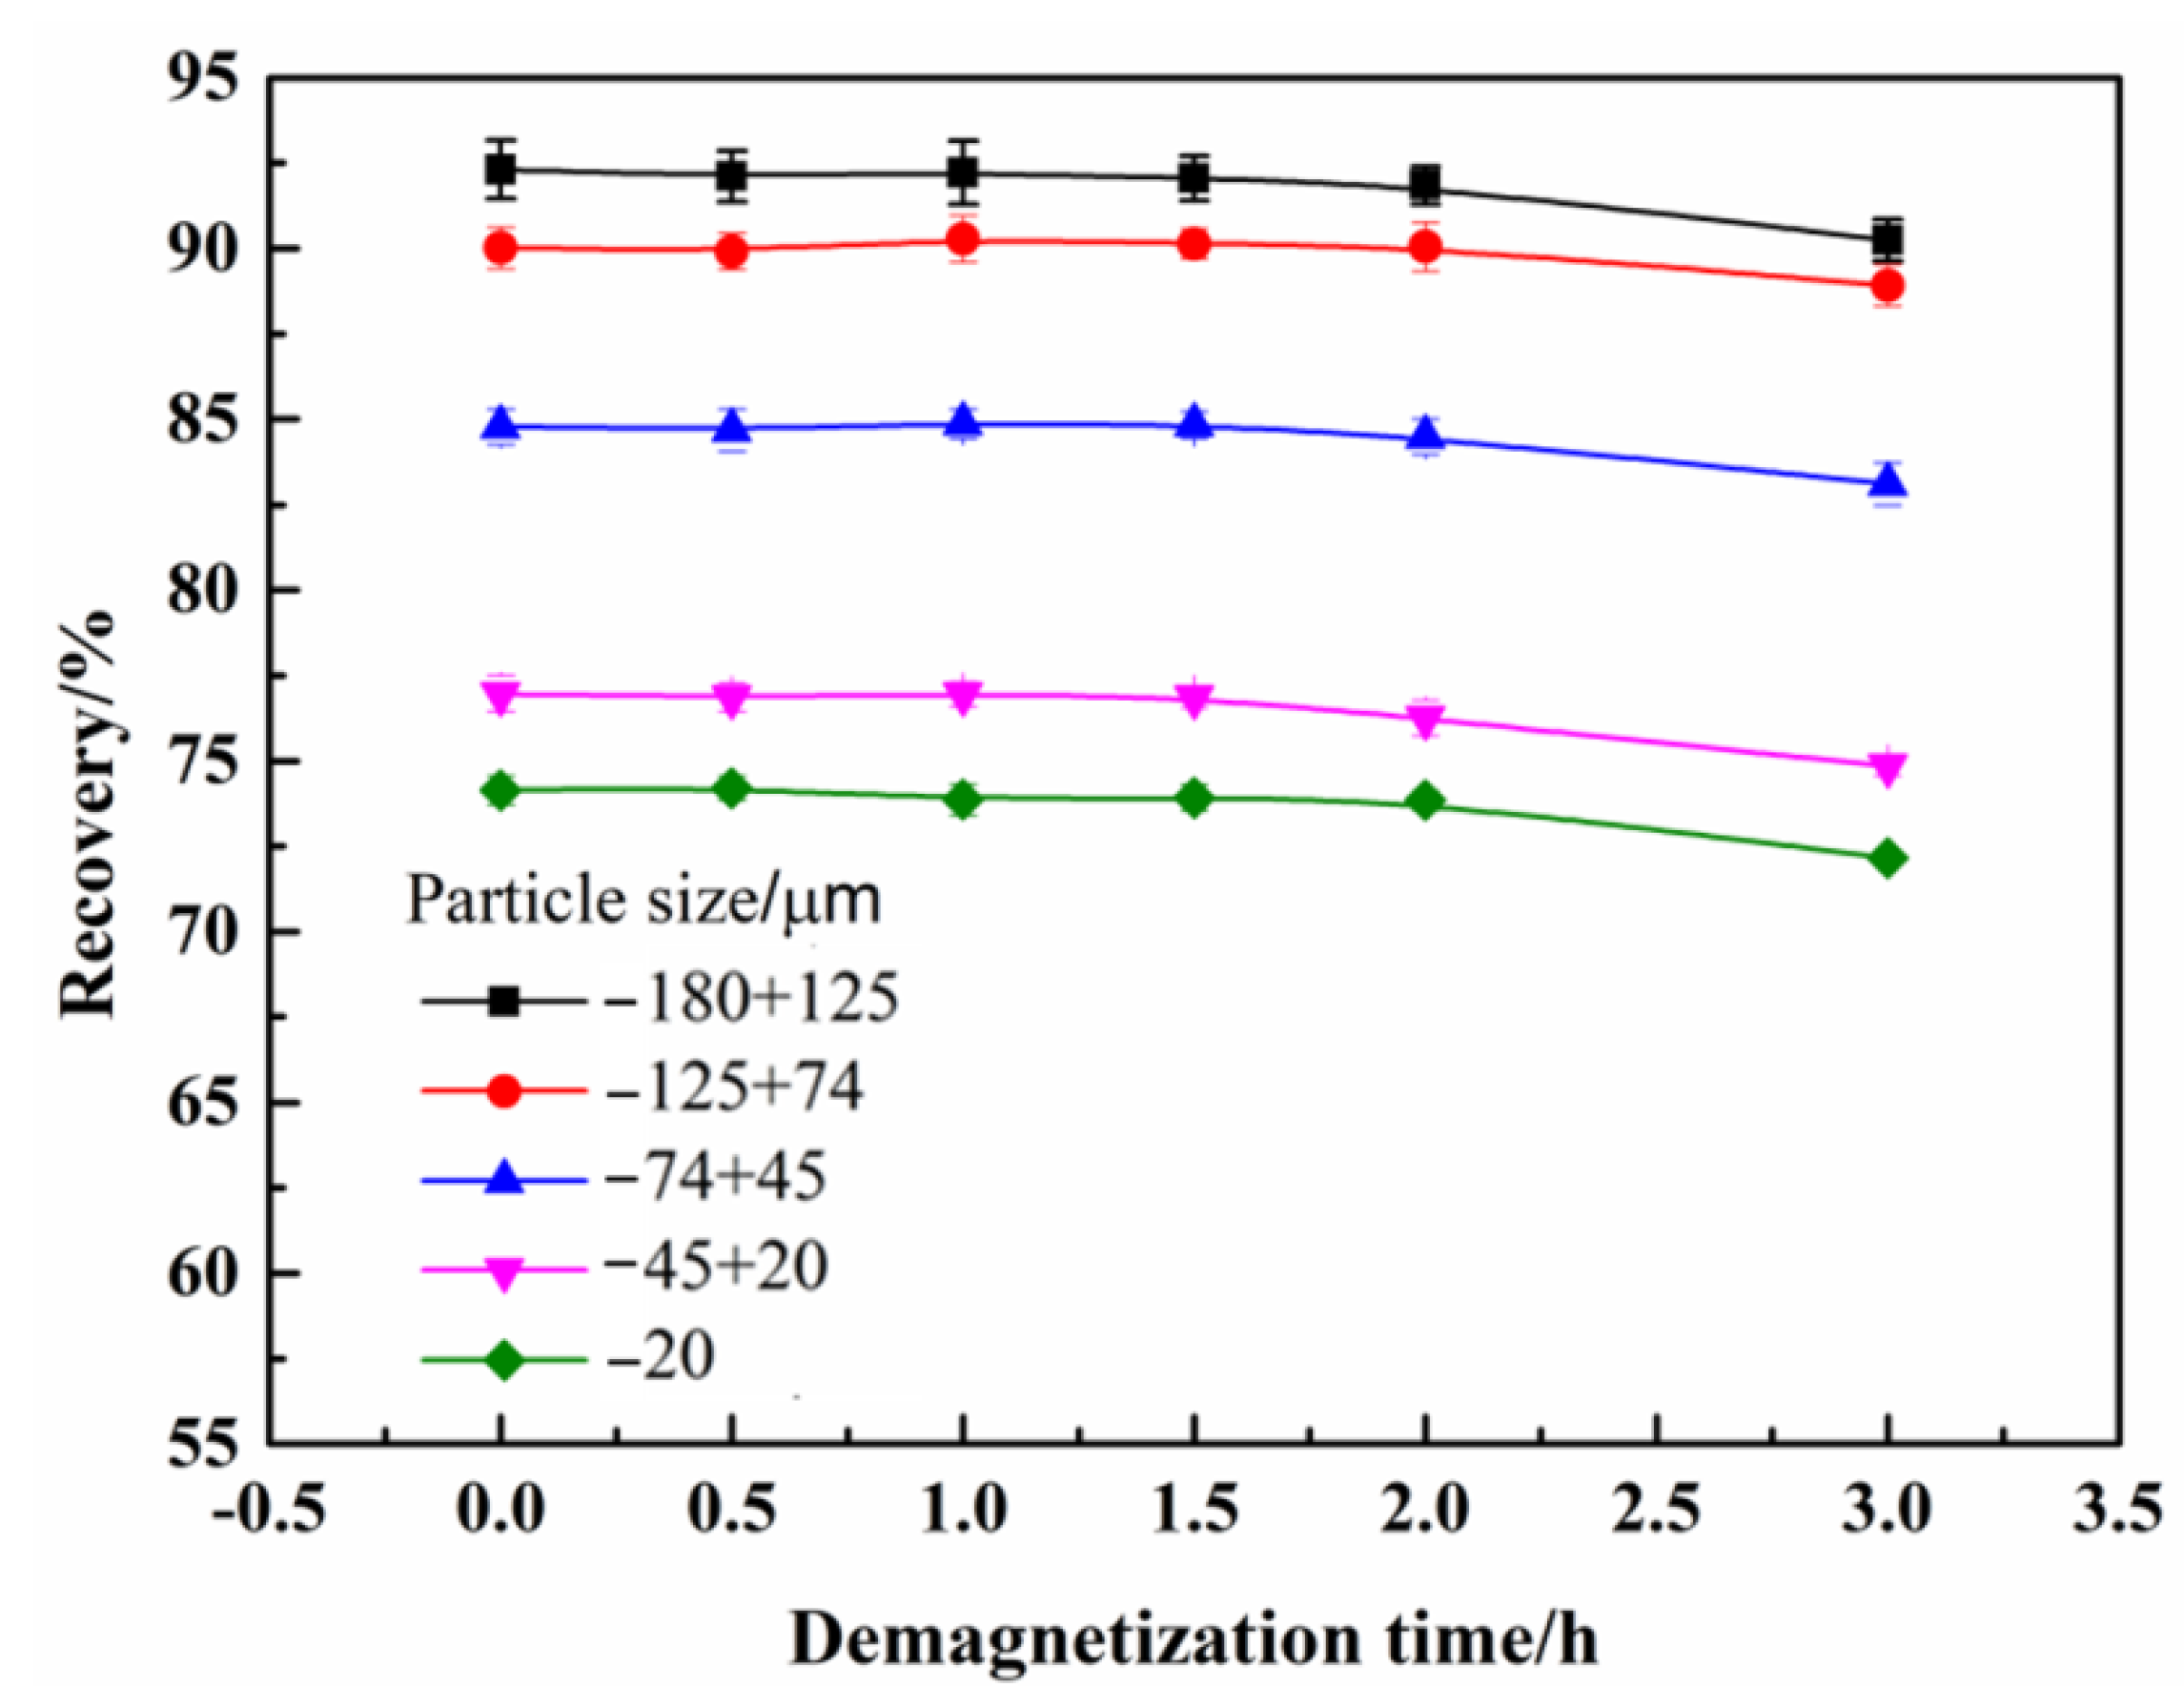
3.1.3. Effect of Demagnetization Time on Flotation Behavior of Molybdenite
The kerosene standing time (demagnetization time) tests were carried out to investigate the physicochemical properties of the magnetized kerosene and the collection effects of kerosene standing for a period of time after magnetization. The effects of demagnetization time on the flotation recovery of molybdenite are shown in Figure 5. When the kerosene was magnetized, the flotation recoveries were 92.31%, 90.02%, 84.78%, 76.96%, and 74.14% respectively. When the standing time of magnetized kerosene was 2.0 h, the flotation recoveries of molybdenite samples were 91.85%, 90.05%, 84.48%, 76.25%, and 73.84% by particle size respectively. When the standing time reached 3.0 h, the flotation recoveries of molybdenite samples began to decline. Floatation recoveries were 90.24%, 88.92%, 83.11%, 74.84%, and 72.15% by particle size, respectively—2.07%, 1.10%, 1.67%, 2.12%, and 1.99% lower than when the standing time was 0. It can be seen that the flotation recoveries of the molybdenite samples changed little when the standing time of magnetized kerosene was less than 2.0 h. The flotation recoveries the molybdenite samples began to decline when the standing time reached 2.0 h. The results showed that the magnetized properties of the magnetized kerosene were still maintained within 2.0 h, which improved the floatability of molybdenite.
3.2. Effect of Magnetization on the Molecular Structure of Kerosene
Substances with different structures have their own characteristic spectra. Spectral analysis is a method used to investigate the structure and chemical components of substances by using characteristic spectra [27]. The ultraviolet absorption spectra and infrared spectra of kerosene were analyzed to explore the changes in the material composition of kerosene and after magnetization.
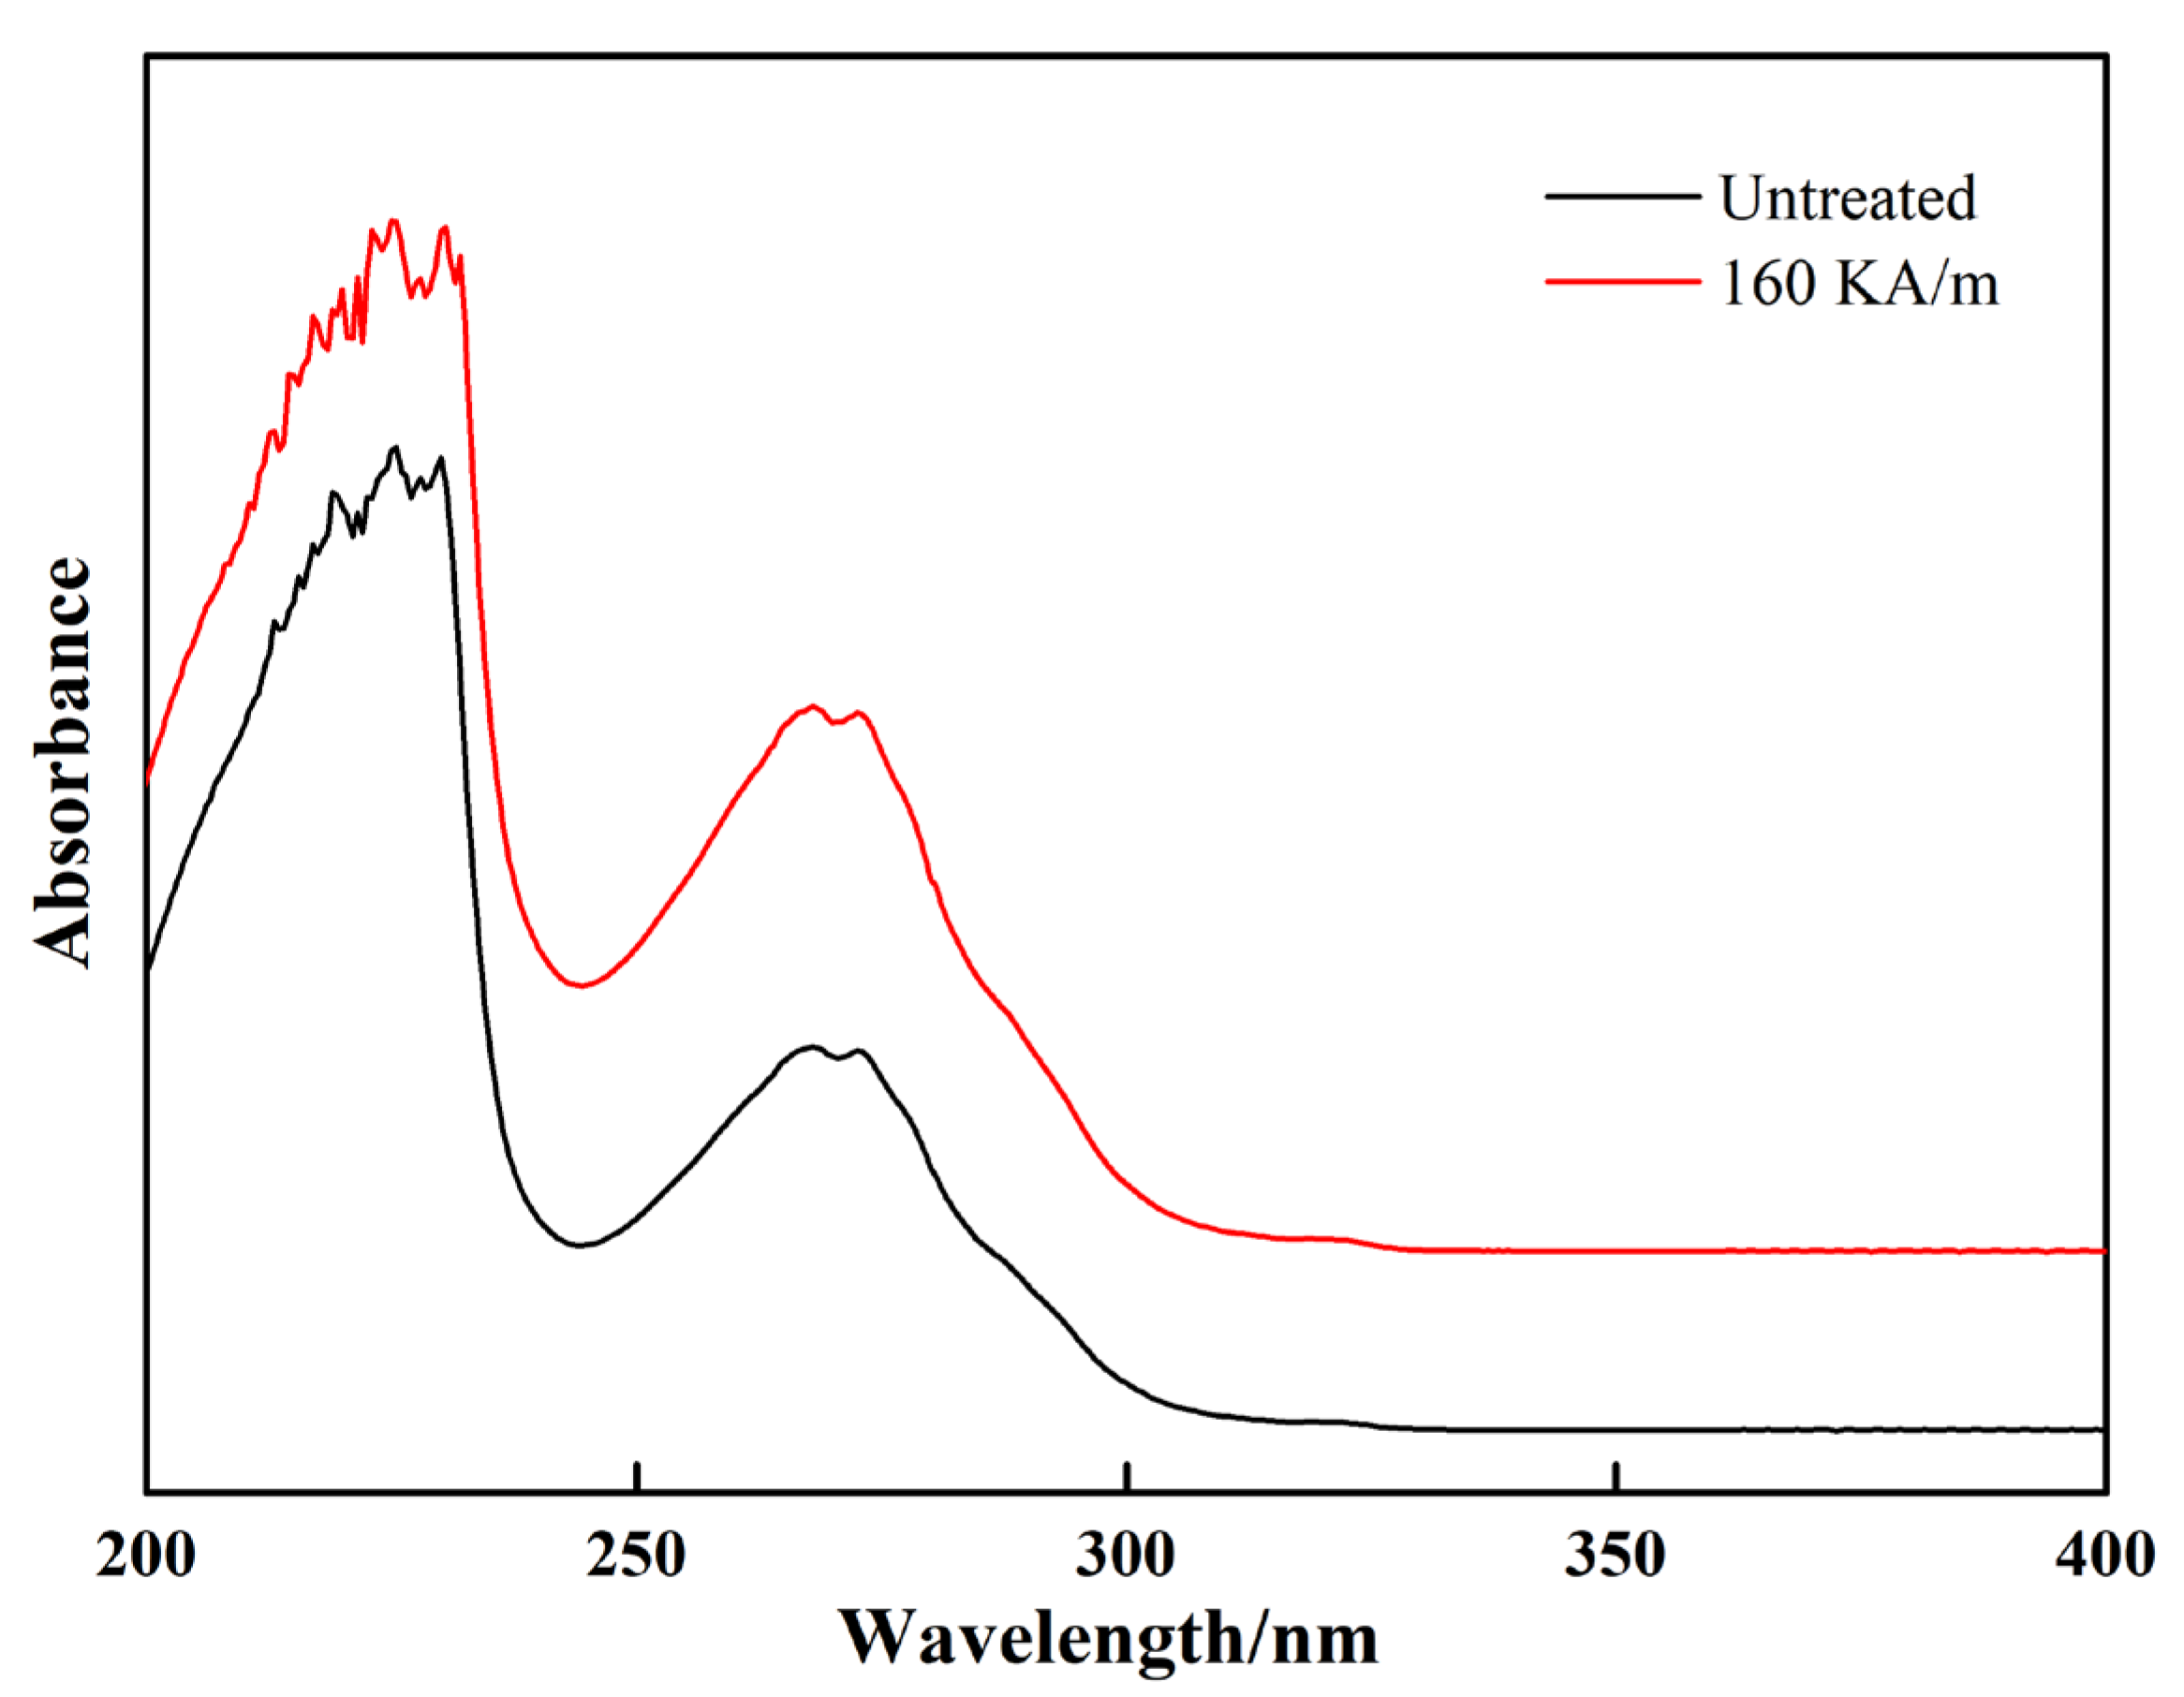
3.2.1. UV–Vis
Figure 6 shows the ultraviolet absorption spectrum of kerosene before and after magnetization. The magnetization magnetic field intensity of kerosene was 160 kA/m, and the magnetization time was 10 min. There were mainly two characteristic absorption peaks in the UV (Ultraviolet visible) spectral region of kerosene, which were located at 230 and 272 nm [14]. The absorption peaks of the main functional groups in the kerosene did not shift significantly after magnetization, which was due to the fact that the magnetostatic energy provided by magnetization was not enough to excite electrons to produce energy-level transitions. The energy required for an electron energy level transition is generally about 1−20 eV. The static magnetic energy of the magnetic moment in the magnetic field is M·H (M is the magnetic moment and H is the external magnetic field). The magnetic field strength provided by magnetization treatment is generally roughly hundreds of millitesla. If the magnetic moment is a Bohr magneton μB (about 10−29 J/A/m), the magnetic field strength is H = 102 mT, and the magnetic moment has static magnetic energy in the magnetic field of about μ BH = 5 × 10⁻⁸ eV, which is lower than the energy required for electron energy-level transition and cannot change the main functional group in kerosene.
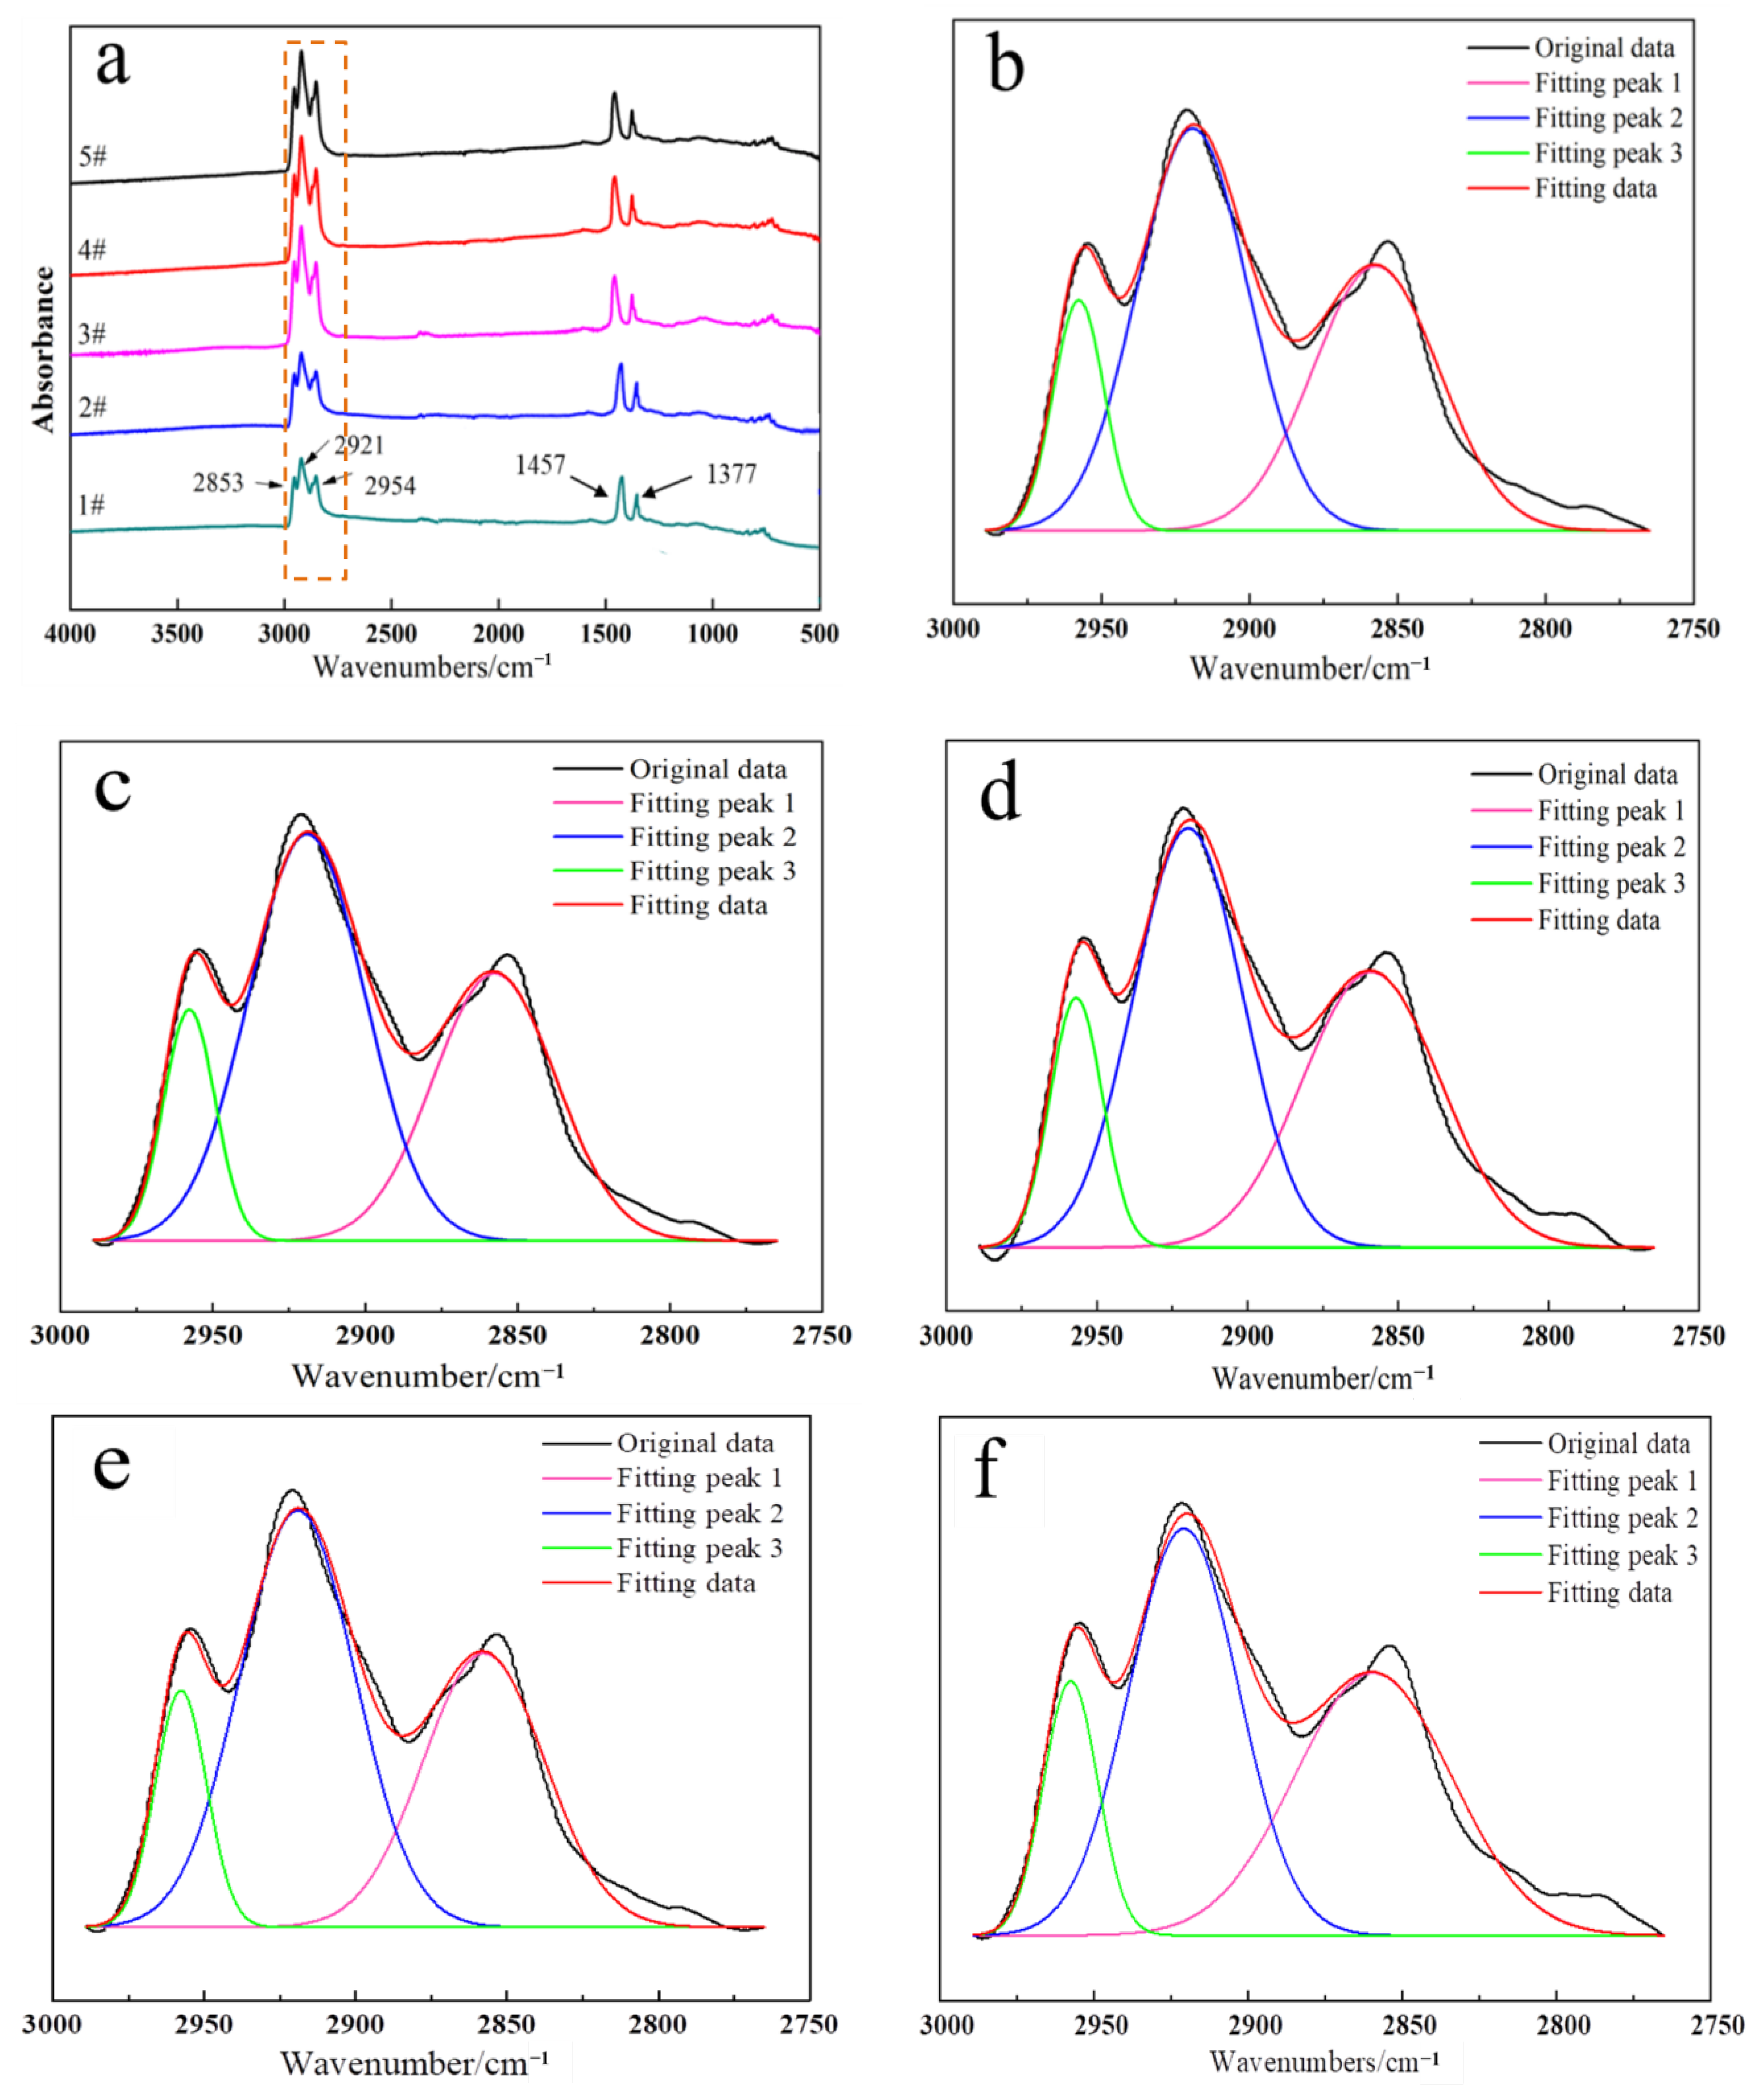
3.2.2. FT-IR
Figure 7a shows the infrared spectra of kerosene magnetized with different magnetic field intensities. The peaks of methyl and methylene were finely treated, and the results are shown in Figure 7b–f and Table 2. Kerosene mainly contains saturated hydrocarbons, partially unsaturated hydrocarbons, and aromatic hydrocarbons. The absorption peak at 2800–3000 cm−1 was assigned to -CH stretching vibrations, the peak at 2957 cm−1 was attributed to -CH3 stretching vibrations, the peaks at 2925 and 2856 cm−1 were related to C–H symmetric stretching vibrations in methylene, and the peak at 1461 cm−1 corresponded to the antisymmetric deformation of -CH3 or the shear vibration peak of -CH2 (Figure 7a) [28]. The characteristic peaks with wave numbers of 2957, 2925, 2855, and 1461 cm−1 were strengthened after the magnetization modification. The intensity of the infrared absorption band was directly proportional to the change in the dipole moment when the atom passed through its equilibrium position. The infrared absorption band of magnetized kerosene was enhanced, indicating that the dipole moment of the molecule was increased and the polarity of the molecule was enhanced.
The relative proportion of methyl in the kerosene molecules increased after magnetization, and the proportion of methylene decreased (in Figure 7b–f and Table 2). As the magnetic field intensity increased, the proportion of methyl in kerosene molecules further increased and the proportion of methylene further decreased. Therefore, the straight-chain aliphatic hydrocarbons in kerosene were transformed to multibranched isomers after magnetization, which endowed kerosene with good dispersion in the pulp, leading to an excellent flotation. Some studies believed that the number of molecules containing 11–15 carbon atoms decreased after the magnetization of kerosene, the number of molecules containing 8–10 carbon atoms increased, and some molecular isomers with 8–10 carbon atoms were produced.
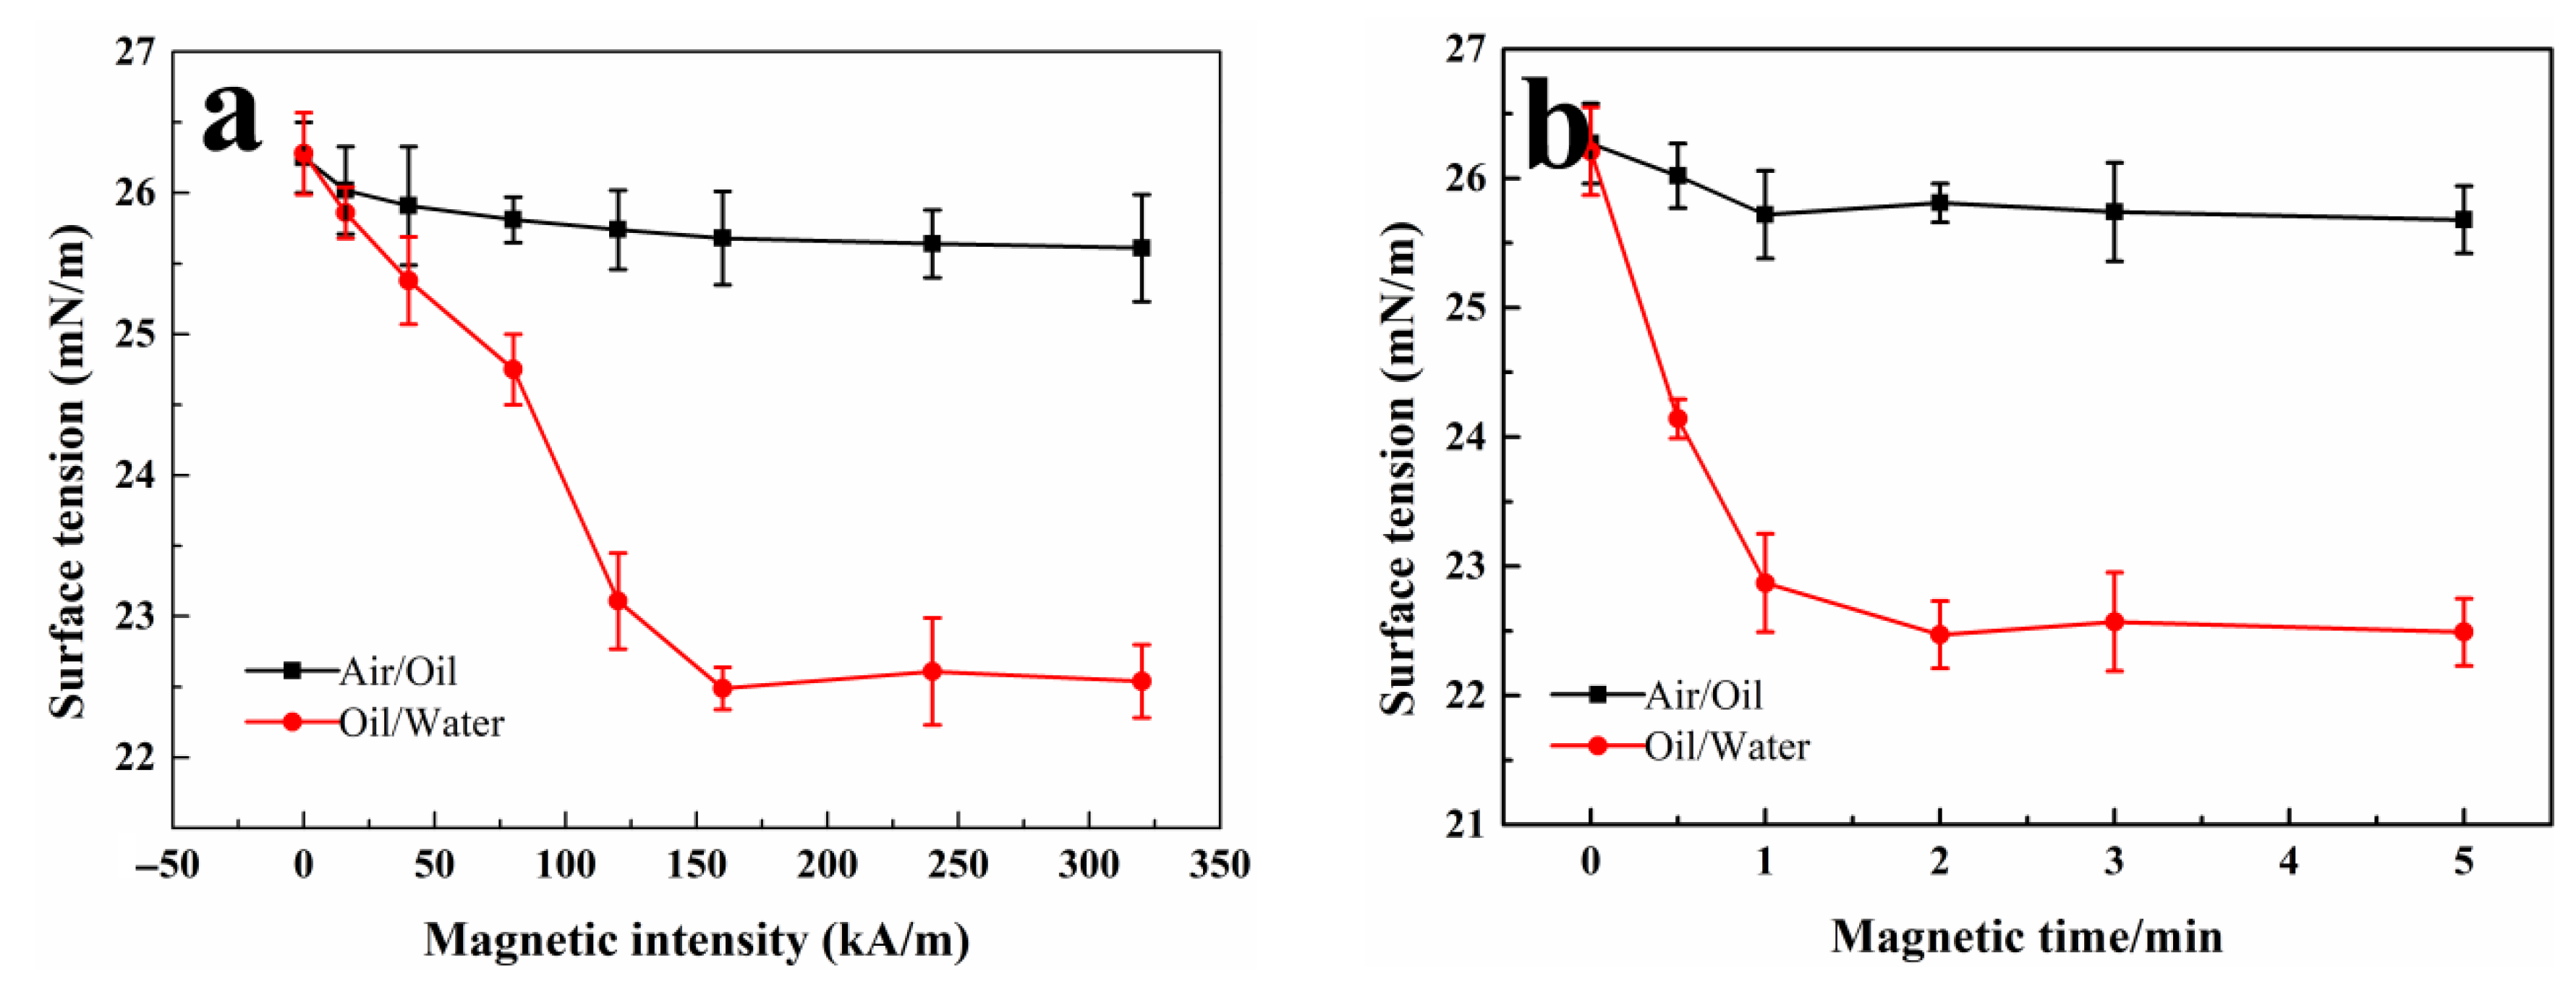
3.3. Effect of Kerosene Magnetization on Interfacial Tension
The variations in oil/gas and oil/water interfacial tension with magnetization conditions are shown in Figure 8. As can be seen from Figure 8a, the interfacial tension of the air/kerosene and kerosene/water decreased when the magnetic field intensity increased from 0 to 160 kA/m, and the decrease in the air/kerosene interfacial tension was much smaller than that in the kerosene/water interfacial tension. The interfacial tension of oil/water tended to be stable when the magnetic field strength was greater than 160 kA/m; during this time, the oil/water interfacial tension was reduced by 14.23% compared with the unmagnetized state, and the magnetization effect was obvious. The oil/water interfacial tension changed little when the magnetic field intensity continued to increase.
Kerosene is mainly C12–C15 hydrocarbons, which are diamagnetic substances. The magnetic susceptibility of the diamagnetic materials is negative, the electron shells of the atoms and molecules are full, and the total magnetic moment of the electrons is zero. The kerosene molecules moved disorderly in the thermal equilibrium under the action of a very weak dispersion force before magnetization, and the magnetic moment vector of the kerosene molecules was zero. When magnetized in the external magnetic field, the current of the kerosene molecular magnetic moment opposite to the direction of the external magnetic field was enhanced, and the molecular current with the same magnetic moment as the external magnetic field was weakened, resulting in an additional magnetic field opposite to the external magnetic field. At this time, the intermolecular force of the kerosene close to the air was still much higher than that of the air, and the interfacial tension of air/kerosene changed little. The kerosene molecules with an additional magnetic moment on the water’s surface were more likely to induce dipoles by water molecules, which resulted in a stronger inducing force than kerosene molecules before magnetization, balancing the force of the internal water molecules on the surface water molecules on a part of the kerosene/water interface, and reducing the tension of the oil/water interface. The 160 kA/m magnetic field intensity made kerosene molecules close to the magnetic saturation state, and the induced force of the water molecules on the kerosene molecules with an additional magnetic moment approached the extreme value. Therefore, there was no obvious change in the oil/water interfacial tension under magnetic field intensities greater than 160 kA/m.
As can be seen from Figure 8b, the interfacial tension of air/oil decreased slowly and gradually became stable with the extension of magnetization time. The oil/water interfacial tension decreased by 15.04% after magnetization for 1 min. When the magnetization time increased to 2 min, the oil/water interfacial tension decreased by 14.19%. When the magnetization time was extended to 5 min, the interfacial tension was maintained at about 22.49 mN/m. There was an obvious difference between the gas/oil interfacial tension curve and the oil/water interfacial tension. The additional magnetic moment opposite to the direction of the external magnetic field was generated after the diamagnetic kerosene molecules were magnetized by the external magnetic field, and the water molecules had a relatively stronger inducing force on the magnetized kerosene molecules to reduce the coal oil/water interfacial tension. Kerosene was close to magnetic saturation after magnetization for 2 min, and the kerosene/water interfacial tension decreased significantly. The interactive force between the kerosene surface molecules in contact with air and kerosene internal molecules was much greater than that between air molecules, and the change in the air/kerosene interfacial tension was not obvious. The interfacial tension of oil/gas and oil/water changed little with the extension of magnetization time. It is also confirmed that the effects of the magnetic field intensity on the oil/gas and oil/water interfacial tension were explained by magnetic saturation.
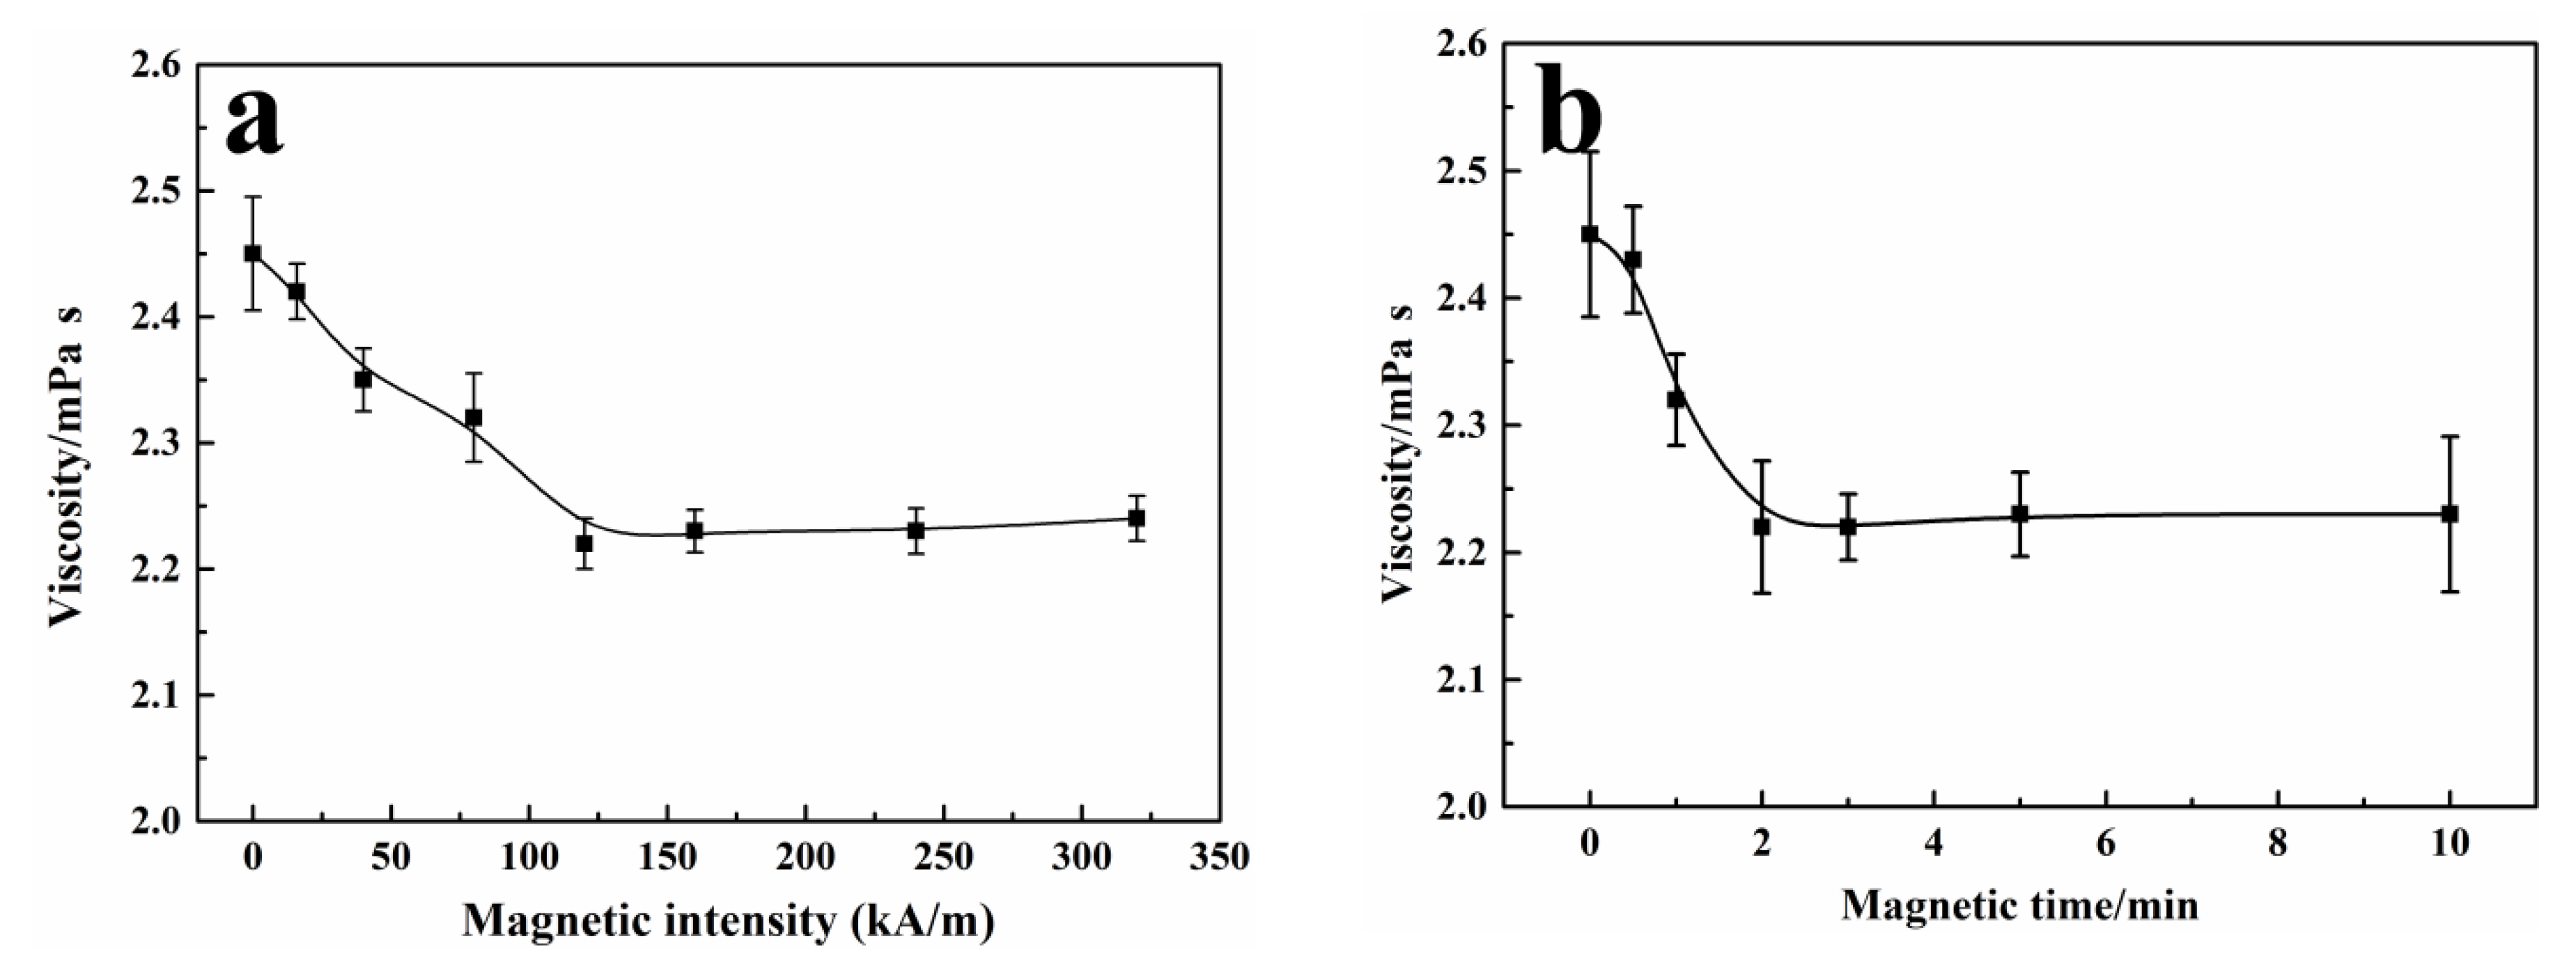
3.4. Effect of Kerosene Magnetization on Viscosity of Kerosene
The variation in the kerosene viscosity with magnetization conditions is shown in Figure 9. When the magnetic field intensity increased from 0 to 320 kA/m, the viscosity of kerosene first decreased and then stabilized, decreasing from 2.45 to 2.23 mPa·s. When the magnetization was 160 kA/m, the viscosity of kerosene gradually decreased as the magnetization time increased. The decrease in the kerosene viscosity increased its dispersion in the pulp, thereby improving the flotation.
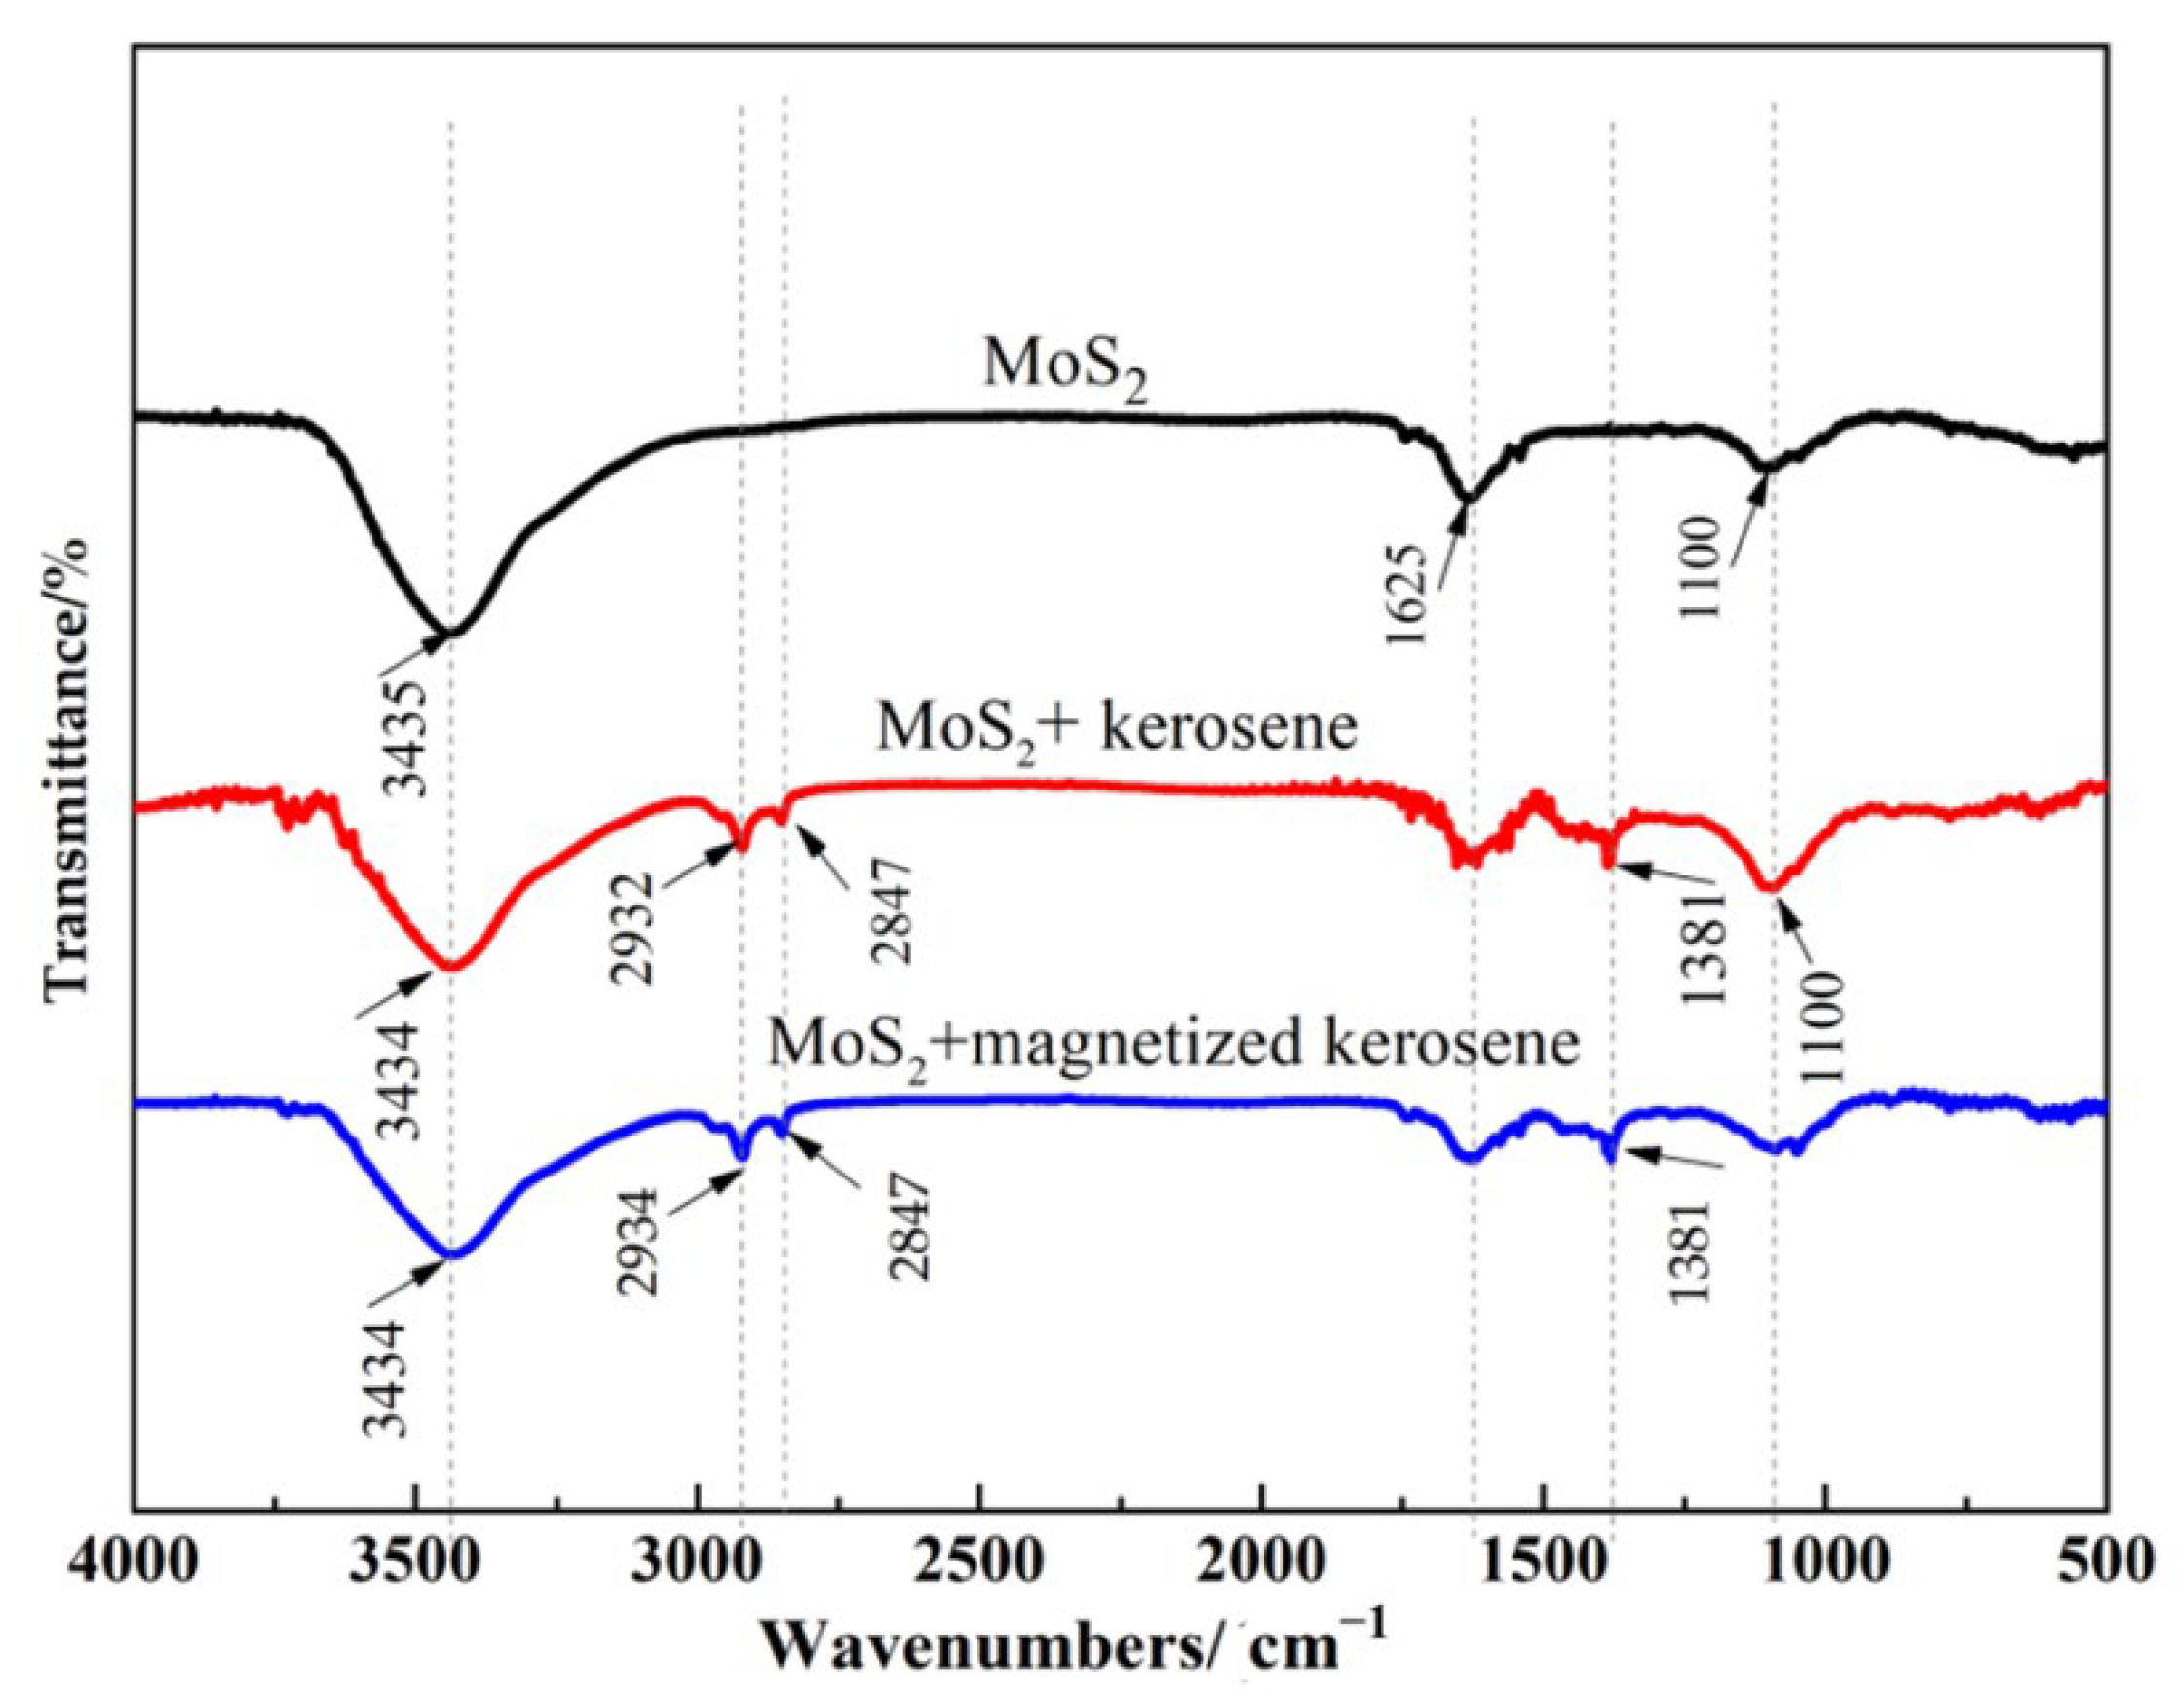
3.5. FTIR Characterization of Molybdenite before and after Magnetization of Kerosene
The infrared spectra of kerosene adsorbed on the surface of molybdenite before and after magnetization are shown in Figure 10. There were the characteristic absorption peaks at 3435 and 1625 cm−1 in molybdenite before the action of the collector, which were mainly caused by the stretching vibrations of -OH and the adsorbed water, consistent with the research of Derycke et al. [29]. The characteristic absorption peak of sulfate located at 1100 cm−1 was caused by the oxidation of molybdenite.
There were absorption peaks at 2957, 2925, 2855, and 1464 cm−1 after the action of unmagnetized kerosene, which correspond to -CH and -CH3 stretching vibration peaks, C-H symmetric stretching vibration peaks in methylene, antisymmetric deformation of -CH3, and shear vibration peaks of -CH2 [28,30]. The results show that unmagnetized kerosene was adsorbed on the surface of molybdenite. Similarly, the characteristic absorption peaks were located at 2957, 2925, 2855, and 1464 cm−1 after the interaction between magnetized kerosene and molybdenite, indicating that magnetized kerosene molecules were also adsorbed on the surface of molybdenite [30].
3.6. Mechanism of Magnetized Kerosene Improving the Flotation of Molybdenite
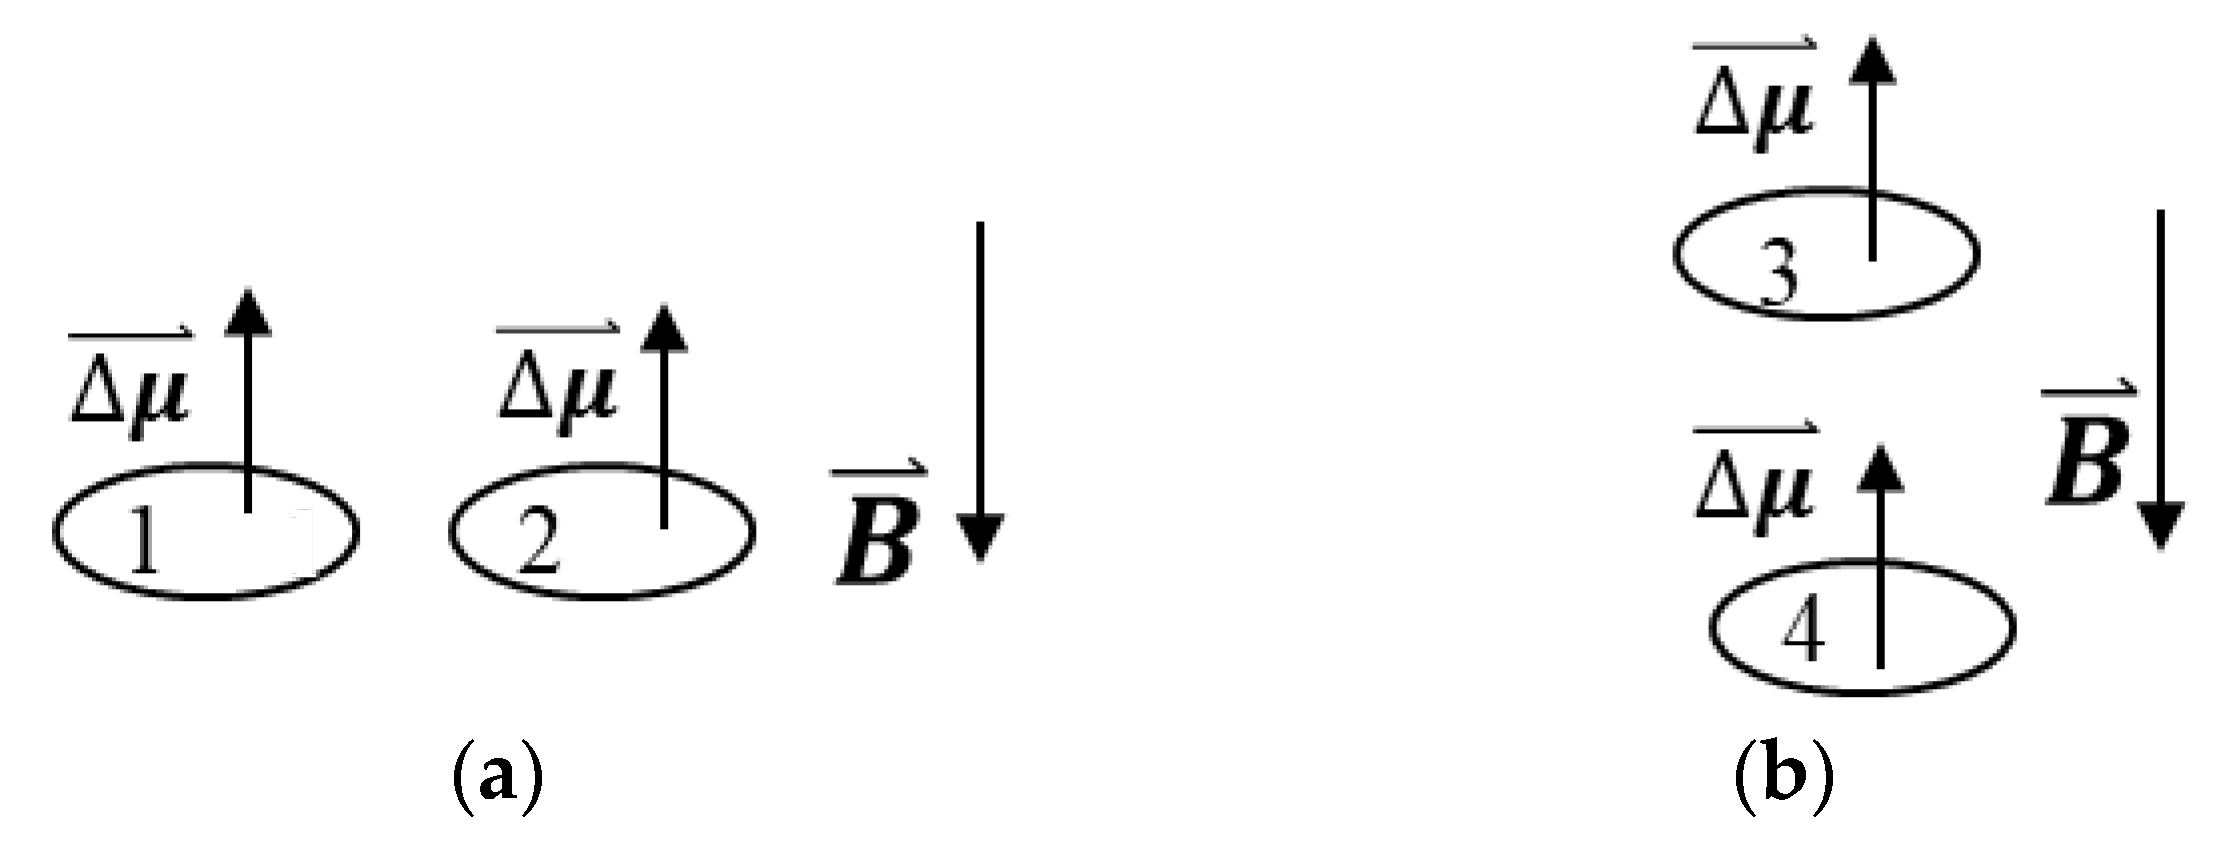
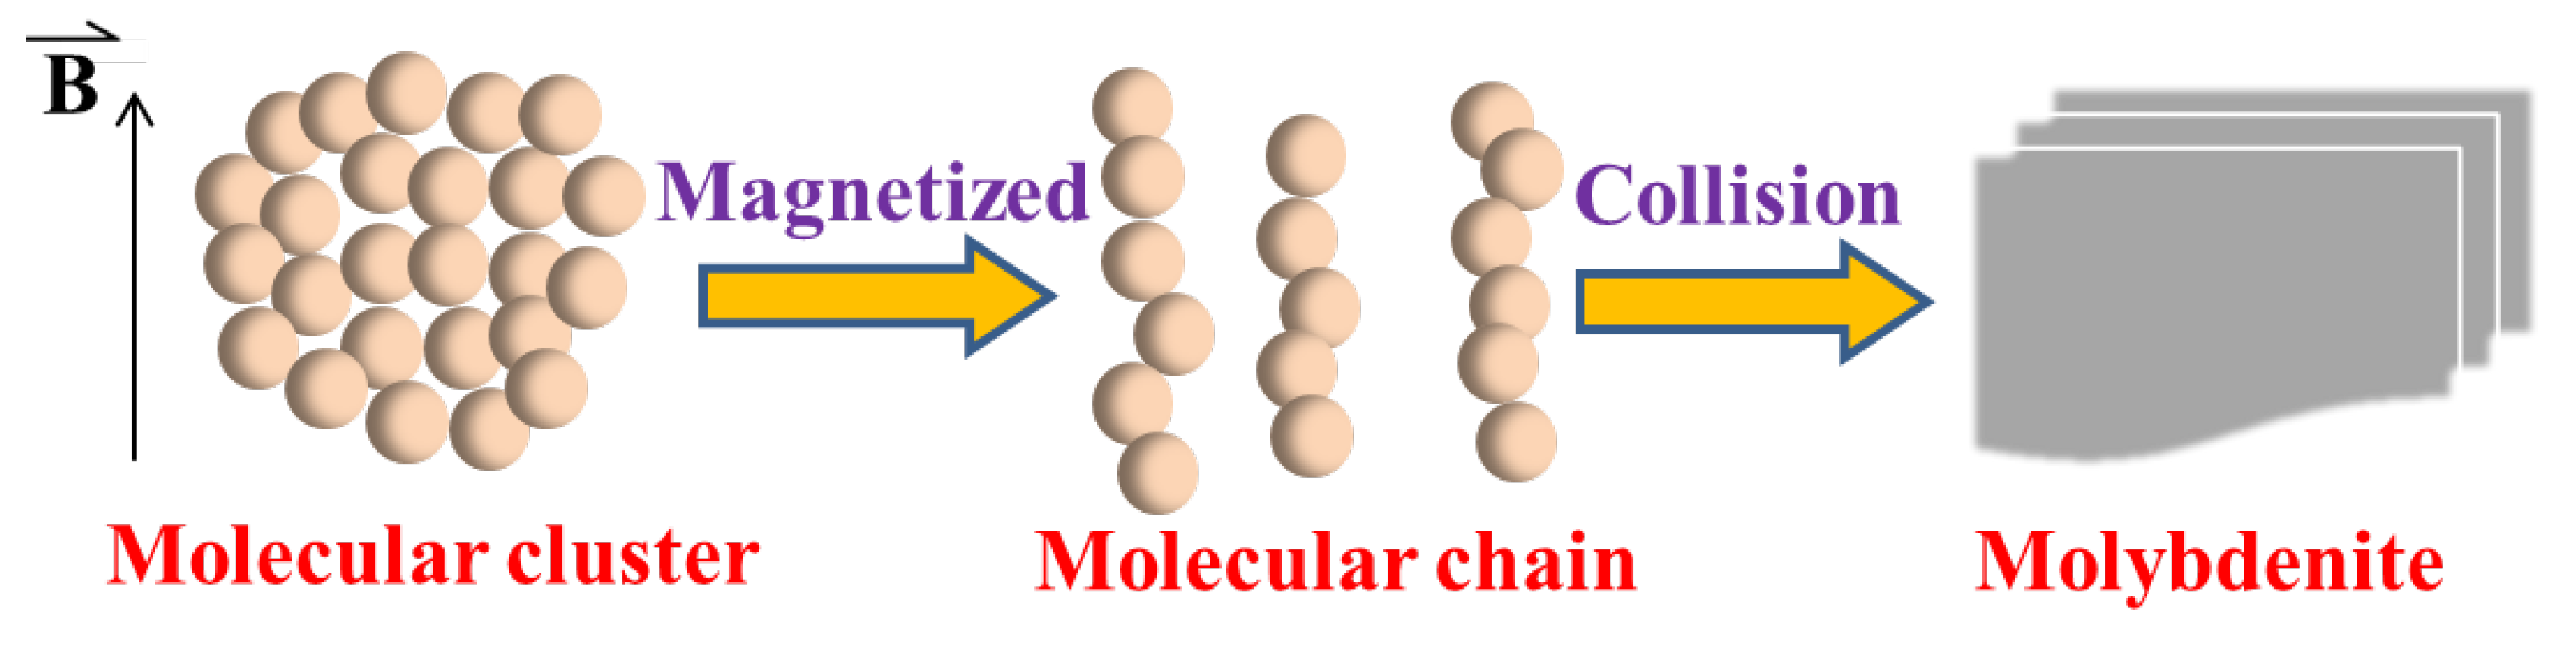
The results of the effects of magnetized kerosene on the surface tension and viscosity showed that the magnetic field had a certain effect on the physical properties of kerosene. Kerosene was usually distributed in the form of small droplets when dissolved in water, and the distribution form of kerosene after magnetization in water also changed with the changes in the physical and chemical properties. According to Zhu Wenwen’s explanation about the change in the fuel molecular magnetism, kerosene’s viscosity was reduced and its molecular magnetism was changed. The results are shown in Figure 11. According to Guo Hejun’s [31] analysis on the mechanism of magnetized fuel energy-saving, the schematic diagram of magnetized kerosene improving the flotation of molybdenite was established, as shown in Figure 12.
Kerosene is a diamagnetic hydrocarbon. The vector magnetic moment of the kerosene molecule was zero without an external magnetic field, and kerosene was distributed in the form of small droplets in the magnetic field. The kerosene molecules with additional magnetic moments were arranged against the direction of the external magnetic field when the kerosene was magnetized in the magnetic field. According to the theory of magnetic moment interaction, the interactive force between two magnetic moments arranged in parallel is a repulsive force, as shown in Figure 11a, whereas the interaction between two magnetic moments arranged along the same straight line is an attractive force, as shown in Figure 11b. The small droplets of kerosene arranged in parallel repelled each other, but they attracted each other along the same straight line, and kerosene maintained a certain short-chain form after magnetization in the magnetic field. Liquid has the characteristics of short-range order—that is, a liquid’s molecules maintain a certain regular arrangement in a small range for a short time, which is destroyed when the liquid leaves the magnetic field. According to the nature of a magnetic moment’s interactive force, the molecular groups of kerosene combined by van der Waals forces (intermolecular forces) before magnetization tended to be linear molecular chains in the magnetic field, as shown in Figure 12. The linear molecular chain was not too long in the presence of the non-uniform flow rate of the hydrocarbon oil in the direction of the magnetic field. Moreover, the additional magnetic moment disappeared after kerosene left the magnetic field, resulting in the fracturing of the molecular chain. In other words, the tightness of hydrocarbon oil molecules decreased. The agglomerations of kerosene composed of many small droplets became agglomerations of small numbers of droplets under the action of an external magnetic field, which improved the dispersion of kerosene in the slurry.
The physical and chemical properties of kerosene were changed after magnetization, which led to relatively small oil droplets in the slurry. The kerosene molecules were better dispersed in the pulp, the specific surface area of kerosene dispersed in the pulp was increased, and the collision probability between kerosene oil mass and molybdenite was enhanced, thereby improving the flotation of molybdenite.
4. Conclusions
- Magnetized kerosene improved the flotation recovery of molybdenite, and the improvement increased as the molybdenite particle size decreased.
- Magnetization did not change the chemical composition of kerosene, but it converted linear aliphatic hydrocarbons in kerosene to linear isomers and reduced the lengths of the carbon chains.
- Magnetization reduced the viscosity of kerosene and oil/water interfacial tension, and improved the dispersion of kerosene in the pulp. The applied magnetic field transformed the disorder of the additional magnetic moment in kerosene molecules into order, and reduced the compactness of the kerosene molecules.
Author Contributions
H.L. and W.X. conceived of and designed the experiments; J.J. prepared the samples and performed the experiments; H.L. and J.J. analyzed the data; W.X. and Y.H. contributed to the writing and revising of the paper. All authors have read and agreed to the published version of the manuscript.
Funding
This research was funded by the National Natural Science Foundation of China (51904222 and 52004197), and the General Project (Youth) of the Natural Science Basic Research Plan in Shaanxi Province of China (2020JQ-667).
Data Availability Statement
Not applicable.
Conflicts of Interest
The authors declare no conflict of interest.
References
- Liu, P.; Liu, L.C.; Gong, H.R. Stacking fault energy and electronic structure of molybdenum under solid solution soften-ing/hardening. J. Cent. South Univ. 2021, 28, 39–47. [Google Scholar] [CrossRef]
- Plotinskaya, O.Y.; Shilovskikh, V.V.; Najorka, J.; Kovalchuk, E.V.; Seltmann, R.; Spratt, J. Grain-scale distribution of molyb-denite polytypes versus rhenium contents: Mu XRD and EBSD data. Mineral. Mag. 2019, 83, 639–644. [Google Scholar] [CrossRef]
- Chen, X.; Liu, X.; Zhao, Z.; Hao, M. Research of the dissolving capacity of molybdenite in the white matte. Int. J. Refract. Met. Hard Mater. 2015, 52, 1–5. [Google Scholar] [CrossRef]
- Lin, Q.-Q.; Gu, G.-H.; Wang, H.; Liu, Y.-C.; Fu, J.-G.; Wang, C.-Q. Flotation mechanisms of molybdenite fines by neutral oils. Int. J. Miner. Met. Mater. 2018, 25, 1–10. [Google Scholar] [CrossRef]
- Li, S.; Ma, X.; Wang, J.; Xing, Y.; Gui, X.; Cao, Y. Effect of polyethylene oxide on flotation of molybdenite fines. Miner. Eng. 2020, 146, 106146. [Google Scholar] [CrossRef]
- Yi, G.; Macha, E.; Van Dyke, J.; Macha, R.E.; McKay, T.; Free, M.L. Recent progress on research of molybdenite flotation: A review. Adv. Colloid Interface Sci. 2021, 295, 102466. [Google Scholar] [CrossRef]
- Castro, S.; Laskowski, J. Depressing effect of flocculants on molybdenite flotation. Miner. Eng. 2015, 74, 13–19. [Google Scholar] [CrossRef]
- Deng, Q.; Fan, X.; Gan, M.; Chen, X. Oxidation separation of low-grade molybdenum with rheniumbearing by two-stage roasting. J. Cent. South Univ. Sci. Technol. 2019, 50, 1778–1786. [Google Scholar]
- He, T.; Wan, H.; Song, N.; Guo, L. The influence of composition of nonpolar oil on flotation of molybdenite. Miner. Eng. 2011, 24, 1513–1516. [Google Scholar] [CrossRef]
- Wan, H.; Yang, W.; Cao, W.C.; He, T.S.; Liu, Y.Y.; Yang, J.B.; Guo, L.; Peng, Y.J. The Interaction between Ca2+ and Molybdenite Edges and Its Effect on Molybdenum Flotation. Minerals 2017, 7, 141. [Google Scholar] [CrossRef] [Green Version]
- Li, H.; He, T.; Wan, H.; Han, Y.; Guo, Y.; Jin, J. Insights into Selection of the Auxiliary Collector and Its Applicability Analysis for Improving Molybdenite Flotation. Minerals 2021, 11, 528. [Google Scholar] [CrossRef]
- Yang, B.; Song, S.; Lopez-Valdivieso, A. Effect of Particle Size on the Contact Angle of Molybdenite Powders. Miner. Process. Extr. Met. Rev. 2013, 35, 208–215. [Google Scholar] [CrossRef]
- Wei, Z.; Li, Y.; Huang, L. New insight into the anisotropic property and wettability of molybdenite: A DFT study. Miner. Eng. 2021, 170, 107058. [Google Scholar] [CrossRef]
- Kitamura, Y.; Huang, Q.F.; Miyachi, A.; Yoshizako, K.; Takahashi, T. Effect of temperature on interfacial tension in kerosene-surfactant-water systems. J. Colloid Interface Sci. 1992, 154, 249–254. [Google Scholar] [CrossRef]
- Bhattacharya, S.; Pascoe, R.D. Effect of Temperature on Coal Flotation Performance—A Review. Miner. Process. Extr. Met. Rev. 2004, 26, 31–61. [Google Scholar] [CrossRef]
- Konar, B.B.; Sarkar, G.G.; Chakrava, A.K. Improved coal flotation by use of diesel oil + low temperature carbonization tar fractions as collecting agents. Indian J. Technol. 1968, 6, 269. [Google Scholar]
- Qiu, T.S.; Cui, L.F.; Fang, X.H. Effect of magnetization on flotation reagents and process. Chin. J. Nonferrous Met. 2009, 19, 1338–1344. [Google Scholar]
- Lu, J.; Yuan, Z.; Wang, N.; Lu, S.; Meng, Q.; Liu, J. Selective surface magnetization of pentlandite with magnetite and magnetic separation. Powder Technol. 2017, 317, 162–170. [Google Scholar] [CrossRef]
- Zheng, C.; Zhang, H.; Ru, Y. Effects of magnetized 2-octanol on low-rank coal flotation. Energy Sources Part A Recover. Util. Environ. Eff. 2017, 39, 1290–1297. [Google Scholar] [CrossRef]
- Yuan, Z.T.; Zhao, X.; Meng, Q.Y.; Zhang, Y.H.; Xu, Y.K. Investigation of selective adsorption of sodium oleate during separation of ilmenite from titanaugite via surface magnetization. Miner. Eng. 2021, 171, 107128. [Google Scholar] [CrossRef]
- He, T.; Li, H.; Jin, J.; Peng, Y.; Wang, Y.; Wan, H. Improving fine molybdenite flotation using a combination of aliphatic hydrocarbon oil and polycyclic aromatic hydrocarbon. Results Phys. 2019, 12, 1050–1055. [Google Scholar] [CrossRef]
- Wan, H.; Qu, J.P.; Li, H.; He, T.S.; Bu, X.Z.; Yang, W. A Novel Method for Improving Low-Temperature Flotation Performance of Nonpolar Oil in the Molybdenite Flotation. Minerals 2019, 9, 609. [Google Scholar] [CrossRef] [Green Version]
- Zhao, W.; Wang, Z.; Wang, D.; Li, J.; Li, Y.; Hu, G. Contribution and significance of dispersed liquid hydrocarbons to reservoir formation. Pet. Explor. Dev. 2015, 42, 439–453. [Google Scholar] [CrossRef]
- Gao, Y.; Pan, L. Understanding the mechanism of froth flotation of molybdenite using oily collectors from a perspective of thinning and rupture of thin liquid film. Miner. Eng. 2021, 163, 106805. [Google Scholar] [CrossRef]
- Healy, T.W.; Fuerstenau, D.W. The isoelectric point/point-of zero-charge of interfaces formed by aqueous solutions and nonpolar solids, liquids, and gases. J. Colloid Interface Sci. 2007, 309, 183–188. [Google Scholar] [CrossRef]
- Wang, Y.; Dang, W.; Li, H.; Wang, Y.; Xun, J. Effect of sodium silicate on the flotation behavior of molybdenite in magnetized distilled water system. J. China Univ. Min. Technol. 2020, 49, 602–608. [Google Scholar]
- Chen, Y.; Chen, X.; Peng, Y. The effect of sodium hydrosulfide on molybdenite flotation as a depressant of copper sulfides. Miner. Eng. 2020, 148, 106203. [Google Scholar] [CrossRef]
- Tarkan, H.; Gelinas, S.; Finch, J. Measurement of thickness and composition of a solvent film on a bubble. J. Colloid Interface Sci. 2005, 297, 732–737. [Google Scholar] [CrossRef] [PubMed]
- Derycke, V.; Kongolo, M.; Benzaazoua, M.; Mallet, M.; Barrès, O.; De Donato, P.; Bussière, B.; Mermillod-Blondin, R. Surface chemical characterization of different pyrite size fractions for flotation purposes. Int. J. Miner. Process. 2013, 118, 1–14. [Google Scholar] [CrossRef]
- Reyes-Bozo, L.; Escudey, M.; Vyhmeister, E.; Higueras, P.; Godoy-Faúndez, A.; Salazar, J.L.; Valdés-González, H.; Wolf-Sepúlveda, G.; Herrera-Urbina, R. Adsorption of biosolids and their main components on chalcopyrite, molybdenite and pyrite: Zeta potential and FTIR spectroscopy studies. Miner. Eng. 2015, 78, 128–135. [Google Scholar] [CrossRef]
- Guo, H.J.; Liu, Z.Z. Discussion on energy saving mechanism of fuel magnetization. Energy Conserv. 1997, 4, 4–6. [Google Scholar]
Figure 1.
The XRD pattern of our molybdenite.

Figure 2.
Schematic diagram of magnetization equipment system. 1—vessel; 2—magnetization equipment; 3—pump; 4—electromagnetic flowmeter; 5—regulating valve.
Figure 2.
Schematic diagram of magnetization equipment system. 1—vessel; 2—magnetization equipment; 3—pump; 4—electromagnetic flowmeter; 5—regulating valve.

Figure 3.
Effect of kerosene magnetized with different magnetic intensities on molybdenite floatability. Magnetization time of 5 min, dosage of 60 mg/L, dosage of terpineol oil of 40 mg/L, and pH of 6.
Figure 3.
Effect of kerosene magnetized with different magnetic intensities on molybdenite floatability. Magnetization time of 5 min, dosage of 60 mg/L, dosage of terpineol oil of 40 mg/L, and pH of 6.

Figure 4.
Effect of magnetized kerosene with different magnetic times on molybdenite floatability. The magnetic field strength was 160 kA/m, the amount of kerosene was 60 mg/L, the amount of terpineol oil was 40 mg/L, and the pH was 6.
Figure 4.
Effect of magnetized kerosene with different magnetic times on molybdenite floatability. The magnetic field strength was 160 kA/m, the amount of kerosene was 60 mg/L, the amount of terpineol oil was 40 mg/L, and the pH was 6.

Figure 5.
Effects of kerosene demagnetization time on the floatability of molybdenite. The magnetization time of kerosene was 5 min, the magnetization magnetic field intensity was 160 kA/m, the amount of kerosene was 60 mg/L, the amount of terpineol oil was 40 mg/L, and the pH was 6.
Figure 5.
Effects of kerosene demagnetization time on the floatability of molybdenite. The magnetization time of kerosene was 5 min, the magnetization magnetic field intensity was 160 kA/m, the amount of kerosene was 60 mg/L, the amount of terpineol oil was 40 mg/L, and the pH was 6.

Figure 6.
Ultraviolet absorption spectra of kerosene before and after magnetization.

Figure 7.
Infrared analysis of kerosene before and after modification in magnetic fields. The corresponding magnetic field intensities of 1–5# were 0, 40, 80, 160, and 240 kA/m, respectively, and the magnetization time was 10 min. (a) Infrared spectrum analysis of kerosene magnetized with different magnetic field intensities; (b–f) Narrow slit peak fitting of 1~5# samples with different magnetic field intensities.

Figure 8.
Variations in oil/gas and oil/water interfacial tension with magnetization conditions. (a) Magnetic field intensity; (b) magnetization time.
Figure 8.
Variations in oil/gas and oil/water interfacial tension with magnetization conditions. (a) Magnetic field intensity; (b) magnetization time.

Figure 9.
Effect of magnetization on surface tension of kerosene. (a) Magnetic field intensity; (b) magnetization time.
Figure 9.
Effect of magnetization on surface tension of kerosene. (a) Magnetic field intensity; (b) magnetization time.

Figure 10.
Infrared analysis of molybdenite before and after adsorption of kerosene. The magnetization magnetic field intensity was 160 kA/m, and the magnetization time was 5 min.
Figure 10.
Infrared analysis of molybdenite before and after adsorption of kerosene. The magnetization magnetic field intensity was 160 kA/m, and the magnetization time was 5 min.

Figure 11.
Arrangement of additional magnetic moments of kerosene molecules before and after magnetization. (a) before magnetization; (b) after magnetization.
Figure 11.
Arrangement of additional magnetic moments of kerosene molecules before and after magnetization. (a) before magnetization; (b) after magnetization.

Figure 12.
Mechanism of magnetized kerosene improving molybdenite flotation.


Table 1.
Results of the particle size distribution of molybdenite.
| Particle Size Range/μm | D10/μm | D50/μm | D90/μm | Average Particle Size/μm |
|---|---|---|---|---|
| −180 + 125 | 19.942 | 52.48 | 145.4 | 138.74 |
| −125 + 74 | 29.179 | 49.00 | 113.3 | 87.45 |
| −74 + 45 | 33.81 | 59.96 | 75.97 | 65.30 |
| −45 + 20 | 3.277 | 18.55 | 44.50 | 28.49 |
| −20 | 1.908 | 8.182 | 18.21 | 11.04 |
Table 2.
Methyl and methylene infrared spectra were used to fit the parameters of absorption peaks.
| Sample No. | Peak/cm−1 | Attribution | Peak Area | Ratio/% |
|---|---|---|---|---|
| 1# | 2957.5 | -CH3 | 216.4 | 58.66 |
| 2920.7 | -CH3 | 700.5 | ||
| 2859.4 | -CH | 646.1 | 41.34 | |
| 2# | 2956.9 | -CH3 | 215.0 | 60.70 |
| 2919.8 | -CH3 | 747.9 | ||
| 2859.0 | -CH | 623.3 | 39.30 | |
| 3# | 2957.7 | -CH3 | 340.6 | 62.62 |
| 2919.3 | -CH3 | 1289.6 | ||
| 2857.4 | -CH | 972.9 | 37.38 | |
| 4# | 2957.7 | -CH3 | 343.9 | 64.27 |
| 2919.2 | -CH3 | 1357.3 | ||
| 2857.6 | -CH | 945.7 | 35.73 | |
| 5# | 2958.1 | -CH3 | 352.8 | 65.52 |
| 2919.6 | -CH3 | 1298.6 | ||
| 2858.5 | -CH | 869.2 | 34.48 |
Publisher’s Note: MDPI stays neutral with regard to jurisdictional claims in published maps and institutional affiliations. |
© 2021 by the authors. Licensee MDPI, Basel, Switzerland. This article is an open access article distributed under the terms and conditions of the Creative Commons Attribution (CC BY) license (https://creativecommons.org/licenses/by/4.0/).
Share and Cite
MDPI and ACS Style
Li, H.; Xiao, W.; Jin, J.; Han, Y. Influence Mechanism of Magnetized Modified Kerosene on Flotation Behavior of Molybdenite. Minerals 2022, 12, 2. https://0-doi-org.brum.beds.ac.uk/10.3390/min12010002
AMA Style
Li H, Xiao W, Jin J, Han Y. Influence Mechanism of Magnetized Modified Kerosene on Flotation Behavior of Molybdenite. Minerals. 2022; 12(1):2. https://0-doi-org.brum.beds.ac.uk/10.3390/min12010002
Chicago/Turabian StyleLi, Hui, Wei Xiao, Jianping Jin, and Yuexin Han. 2022. "Influence Mechanism of Magnetized Modified Kerosene on Flotation Behavior of Molybdenite" Minerals 12, no. 1: 2. https://0-doi-org.brum.beds.ac.uk/10.3390/min12010002
Note that from the first issue of 2016, this journal uses article numbers instead of page numbers. See further details here.