
Unconventional Gas Geochemistry—An Emerging Concept after 20 Years of Shale Gas Development?
Geological Survey of Canada, Natural Resources Canada, Calgary, AB T2L 2A7, Canada
Minerals 2022, 12(10), 1188; https://0-doi-org.brum.beds.ac.uk/10.3390/min12101188
Submission received: 17 August 2022
/
Revised: 16 September 2022
/
Accepted: 19 September 2022
/
Published: 22 September 2022
(This article belongs to the Special Issue Shale and Tight Reservoir Characterization and Resource Assessment)
Abstract
:Geochemical studies of gases from low-permeability reservoirs have raised new questions regarding the chemical and stable isotope systematics of gas hydrocarbons. For instance, the possibility of thermodynamic equilibrium is recurrently in discussion. However, it is not clear whether there is anything “unconventional” in the way these systems continue to be studied. Using molecular and stable carbon isotope data from North American unconventional and conventional reservoirs, this research has applied two parameters that well describe key transformation stages during gas generation. The δ13C of ethane and the C2/C3 ratio increase from baseline values (<1%Ro, prominent kerogen cracking) until a first inflexion at 1.5%Ro. The same inflexion leads to 13C depletion of ethane and a rapidly increasing C2/C3 ratio as hydrocarbon cracking becomes prominent. The transition between these two stages is proposed to be a crossover from equilibrium to non-equilibrium conditions. There is no evidence for these characteristics to be limited to low-permeability reservoirs. Unconventional gas geochemistry should represent an approach that acknowledges that chemical and isotope distributions are not ruled by only one mechanism but several and at specific intervals of the thermal history.
1. Introduction
The term “unconventional gas geochemistry” has been ambiguously mentioned in recent years, usually to refer to geochemical tools applied to study low-permeability hydrocarbon reservoirs [1,2,3]. However, is there anything unconventional in the way we interpret the geochemistry of such environments? That is a question we have not found a complete answer for.
Previous studies suggested that the main isotopic difference between unconventional and conventional gas resources is the carbon isotope reversal of ethane with respect to methane at thermal maturities above 2%Ro [4,5]. The reversal consists in δ13C values of ethane that are more negative than the δ13C values of methane from the same gas charge (δ13Cethane < δ13Cmethane). Recent explanations for this phenomenon include partly reversible free radical reactions for the formation of isotopically light ethane [6], diffusion fractionation due to basin uplift [7], and methane cracking with subsequent generation of ethane and propane [8].
Although less common then, isotope reversals had already been mentioned in the 1970s [9], and were proposed to result from a late increment of gas produced by its source, where previously produced gas had been lost [9]. Additionally, open pyrolysis experiments found 13C depletion of methane at temperatures above 600 °C, which was attributed to a second precursor pool producing lighter methane [10,11]. It was also mentioned that decreasing δ13C values of methane were probably seldom observed because the 13C depletion is not perceived in the cumulative isotopic trend of methane in commercial gas accumulations [8,9,10].
A more recent study [12] reported an additional feature in the isotopic composition of low-permeability gas reservoirs that seems to be unique. Using gas isotope data from 26 reservoirs around the world, these authors showed the tendency towards an even isotopic distribution (EID) of 6‰ between methane and ethane, and between ethane and propane at a thermal maturity of 1.5%Ro. This likely universal isotopic characteristic implies that the carbon isotope distribution may shift towards equilibrium, and the same tendency is interrupted by secondary cracking of hydrocarbons at the indicated maturity level (~1.5% Ro). Around the same time, carbon isotope equilibrated gases were also identified in other global conventional and unconventional gas isotope datasets [13,14], at a thermal maturity of around 1.5%Ro.
Furthermore, pyrolysis experiments on Woodford Shale samples indicated the possibility of both, isotopic and chemical equilibrium, in gas hydrocarbons [15]. The concept of chemical equilibrium alone had been proposed by Mango et al. (2009) [16], and later applied by Cesar et al. (2021a) [17] to identify hydrocarbon plays within the Montney Formation, Western Canadian Sedimentary Basin (WCSB).
Although the findings mentioned above point towards new ways of interpreting gas geochemical data, the geochemical parameters to study low-permeability reservoirs continue to be applied in a rather traditional way (i.e., interpreted as conventional hydrocarbon systems, kinetic isotope fractionation during the entire maturation process). The concept of “unconventional gas geochemistry” as a new understanding of the molecular and isotope systematics of hydrocarbons from low-permeability reservoirs has not settled in.
In order to continue exploring different trends in the geochemistry of gas accumulations, this study proposes new graphical tools that exhibit variances in molecular and stable carbon isotope distribution of gases from low-permeability reservoirs compared to conventional accumulations. It investigates how important changes in certain molecular and isotope parameters may be attributed to key geochemical transformations during the thermal history of hydrocarbon generation. Furthermore, it shows some caveats of using an “unconventional gas geochemistry” approach, suggesting paths for improvement. The data presented in this work were obtained from public molecular and carbon isotope data of well-known North American low-permeability reservoirs.
2. Materials and Methods
Fundamental characteristics of the samples and low-permeability reservoirs included in this study can be found in Table 1 and Table S1, with their corresponding sources. The unconventional reservoirs include the Barnett Shale and the Fayetteville Shale from the USA, and the Lorraine Shale from Eastern Canada; whereas, the conventional samples originated in Kansas Midcontinent (USA). The selection of these datasets was based on the public knowledge about them, and their relatively wide thermal maturity range (0.7–3%Ro). An example from a well through Jurassic, Triassic, and Devonian strata from the Western Canadian Sedimentary Basin has also been included for discussion (Table S2).
3. Results
3.1. The δ13C of Ethane and the Δ13CC1-C2 Versus the C2/C3 Ratio
The significance of the molecular ratio ethane/propane (C2/C3) probably goes back to the work of Prinzhofer and Huc (1995) [23], who studied the thermal maturity evolution of these two compounds given the multiple origins of methane and its susceptibility to migration. Then, methane was the only hydrocarbon gas considered to also have a microbial origin (recent studies report 13C depleted ethane associated with microbial methane [24,25]). The authors [23] found that in thermogenic gases, the C2/C3 ratio remains almost constant during kerogen cracking and increases at higher thermal maturity, specifically during hydrocarbon cracking. However, over the years, it is more common to observe gas geochemistry studies using parameters such as the Bernard ratio C1/[C2 + C3], and the isobutane to butane ratio i-C4/C4 (e.g., [7,26]).
Given the importance of hydrocarbon cracking for Early Triassic low-permeability reservoirs in Western Canada (because it has generated gas/condensate fluids of economic significance and lower carbon footprint), Cesar et al. (2021a) [17] reconsidered the ideas presented by Prinzhofer and Huc (1995) [23], and used the C2/C3 ratio to identify regional thresholds for the start of hydrocarbon cracking, which became target areas for natural gas liquids (i.e., very light condensate) within the Lower Triassic Montney Formation. Earlier, the same authors [12] had shown that changes in the C2/C3 ratio were also consistent with key stable carbon isotope variations in these molecules. For example, 13C depletion of ethane only registers during increasing C2/C3 ratio.
The above-mentioned provides the motivation for the application of the δ13C of ethane, the Δ13CC1-C2, and C2/C3 in the following subsections. The δ13C of ethane is used because ethane is expected to be less affected by migration (compared to methane). Additionally, the δ13C values of propane have not been included since they are less often reported due to the lower propane abundance for isotope measurements.
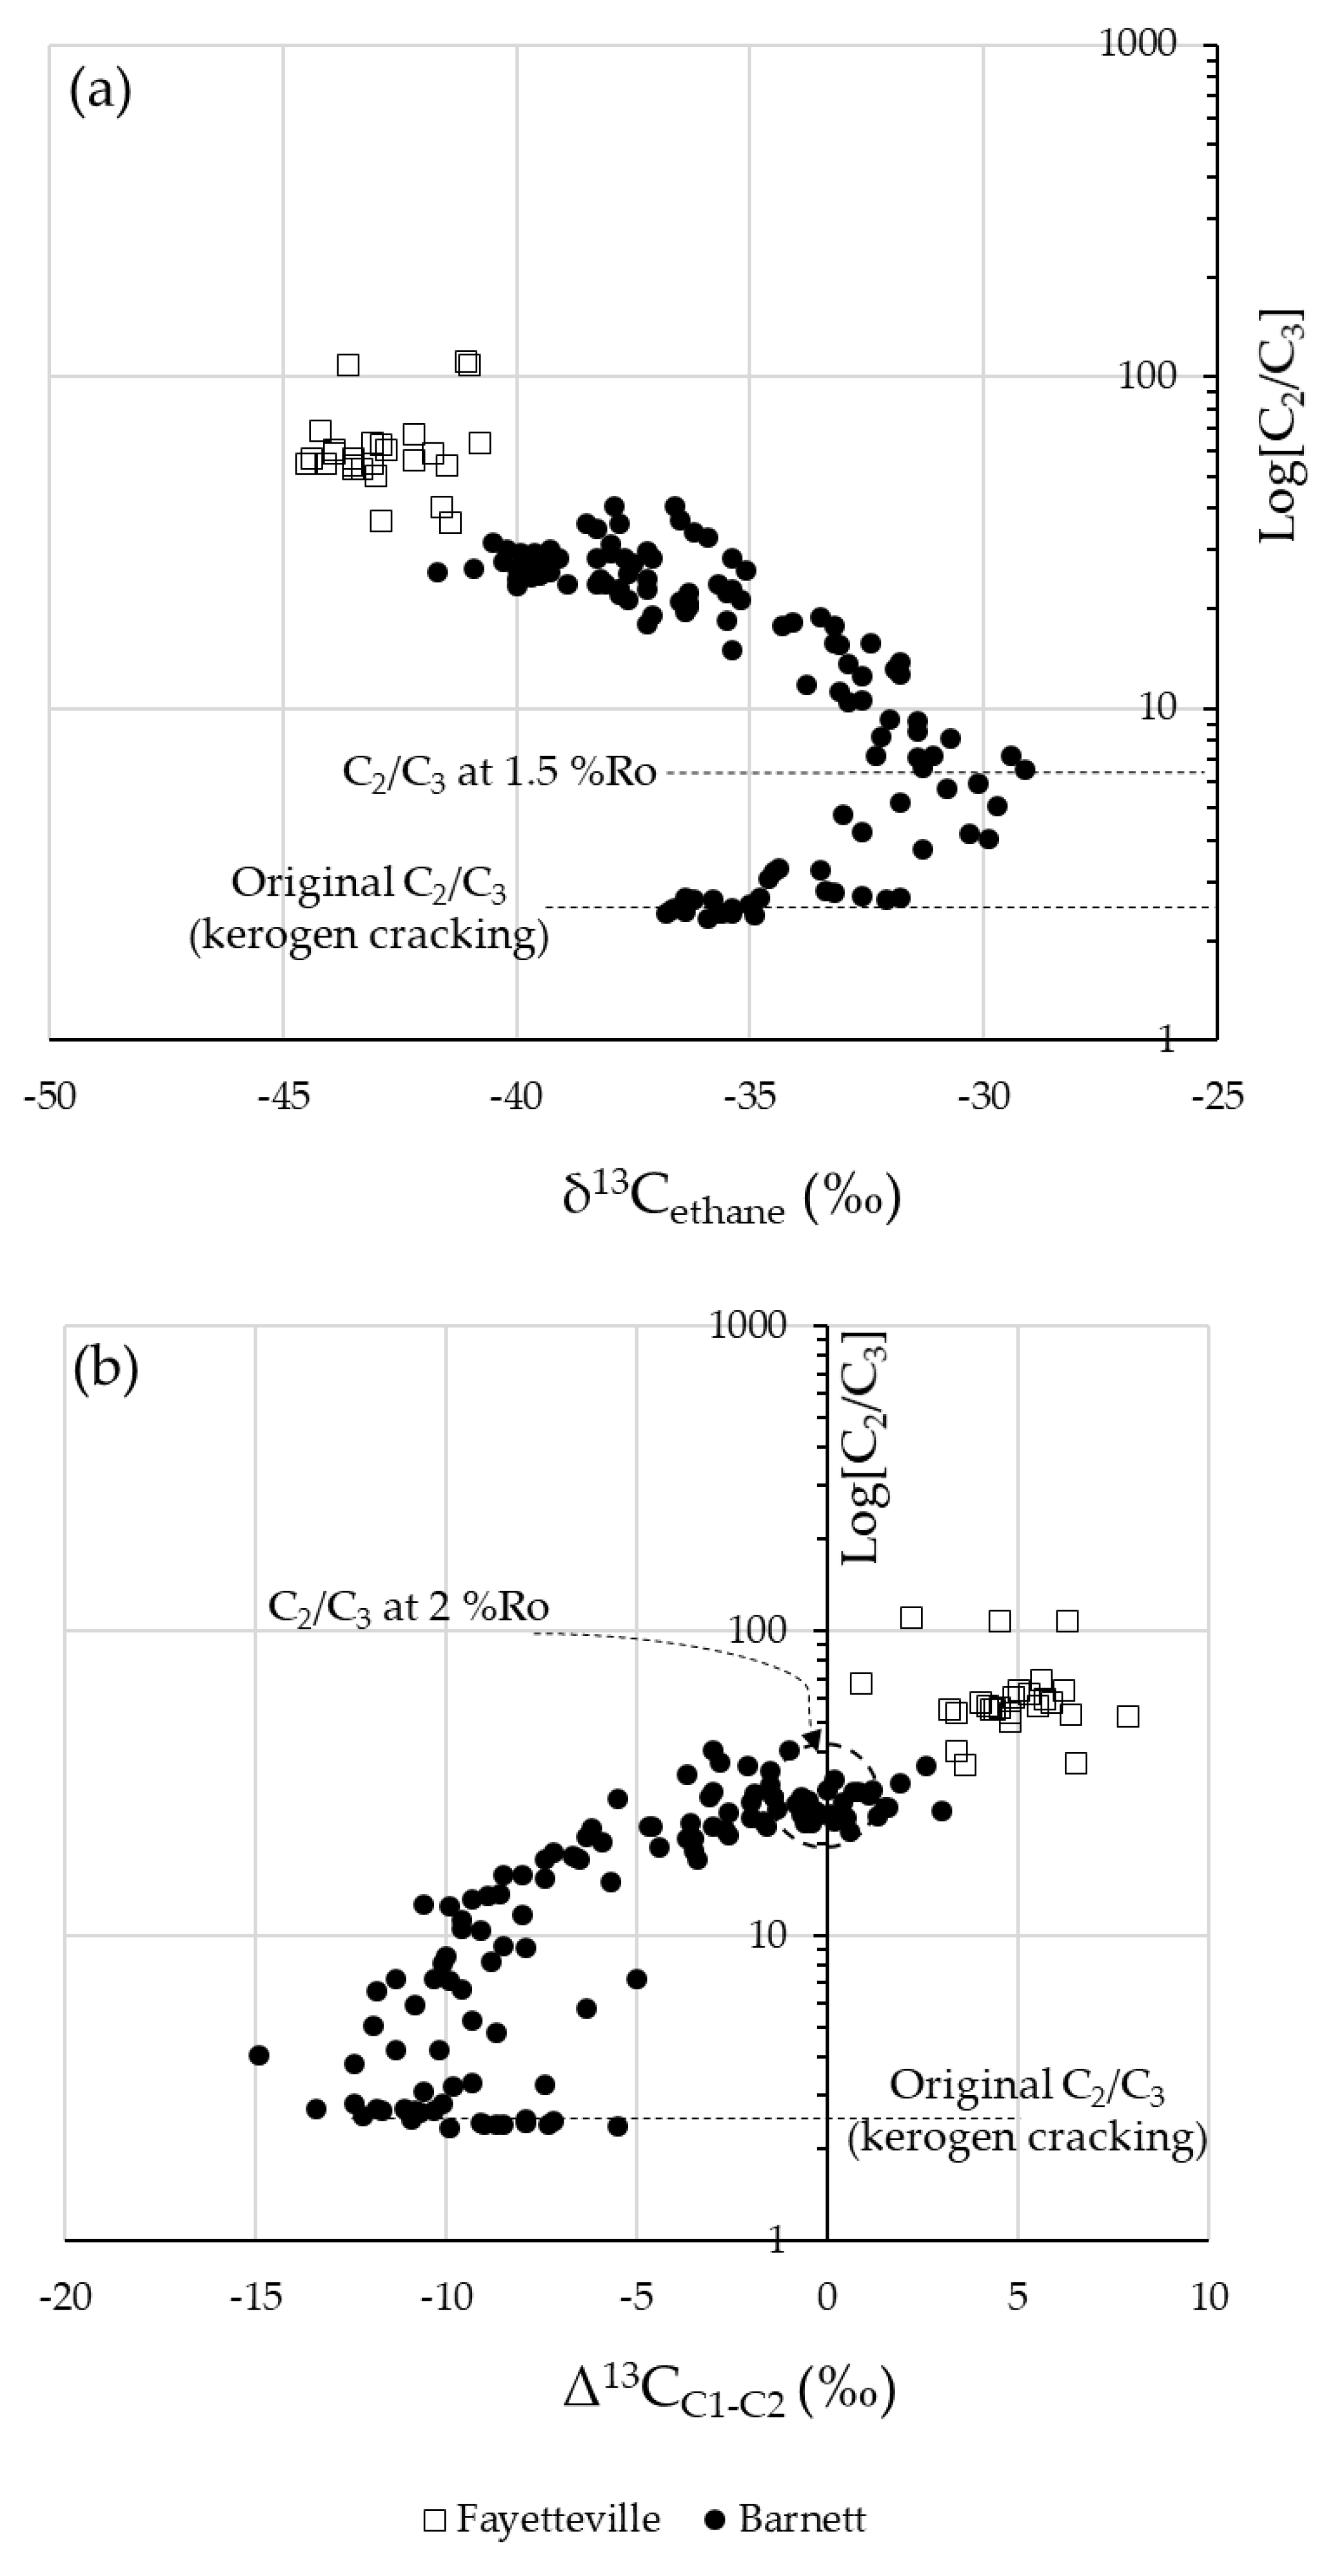
3.1.1. The Barnett Shale and the Fayetteville Shale
The Barnett shale (Fort Worth Basin, USA) was selected as an example of self-sourced low-permeability reservoir (e.g., [2,27]) because of the availability of data covering a thermal maturity range from 1 to 2%Ro, approximately [5]. The Barnett Shale consists of black marine shales with some limestone; its total organic carbon (TOC) content averages 2.5%–3.5% and the organic matter is primarily Type II kerogen [2]. Data from the Fayetteville Shale (Arkoma Bain, USA), also of Mississippian age, were included to cover a higher thermal maturity range (>2.5%Ro). The higher thermal maturity has obscured the original organic matter type of the Fayetteville shale, although it is estimated to be a mixture of types II and III kerogen [28]. The molecular and stable isotope characteristics of produced gas from these reservoirs can be found in the Table S1.
Figure 1a shows the variation of the δ13C values of ethane as the C2/C3 ratio increases. For the Barnett Shale, the δ13C of ethane increases from −37‰ to −32‰ with a relatively constant C2/C3 ratio of 2.5 (original or baseline C2/C3). As this ratio starts to increase, the δ13C of ethane increases to a maximum of −29‰, which is reached at a C2/C3 value of 6.6. After this section, ethane starts to deplete in 13C down to values as negative as −42‰ at C2/C3 values above 26. For highly mature gases (2–3%Ro), such as those from the Fayetteville Shale, δ13C values of ethane are more negative (<−41‰) and show the highest C2/C3 ratios (>40).
The Δ13CC1-C2 difference of the original Barnett Shale ranges from −13 to −6‰ (Figure 1b) with a relatively constant C2/C3 ratio of 2.5. As the C2/C3 ratio increases, the Δ13CC1-C2 difference shifts towards a value of zero, which is reached at a C2/C3 ratio of 25. The trend in Figure 1b confirms that the Δ13CC1-C2 values are never above −6‰ when the C2/C3 ratio is relatively constant (original or baseline C2/C3). This is consistent with previous findings indicating that Δ13CC1-C2 > −6‰ values are only identified when secondary cracking of hydrocarbons is prominent as evidenced by a continuous increase in the C2/C3 ratio [12]. Likewise, Figure 1b allows identifying the C2/C3 value at which the Δ13CC1-C2 reaches 0‰. Therefore, it is now possible to detect the C2/C3 value at which the ethane carbon isotope reversal takes place (~26 for the Barnett Shale). The Fayetteville gases all exhibit methane–ethane isotope reversal (Δ13CC1-C2 > 0) associated with the highest C2/C3 ratios.
It is important to mention that although the Fayetteville gases look like a continuation of the Barnett Shale trend in Figure 1, this does not mean that less mature Fayetteville gases would necessarily follow the Barnett Shale trend in the lower maturity section of the curve. Even though they are similar in age, their original organic matter composition and thermal history cannot be expected to be identical.
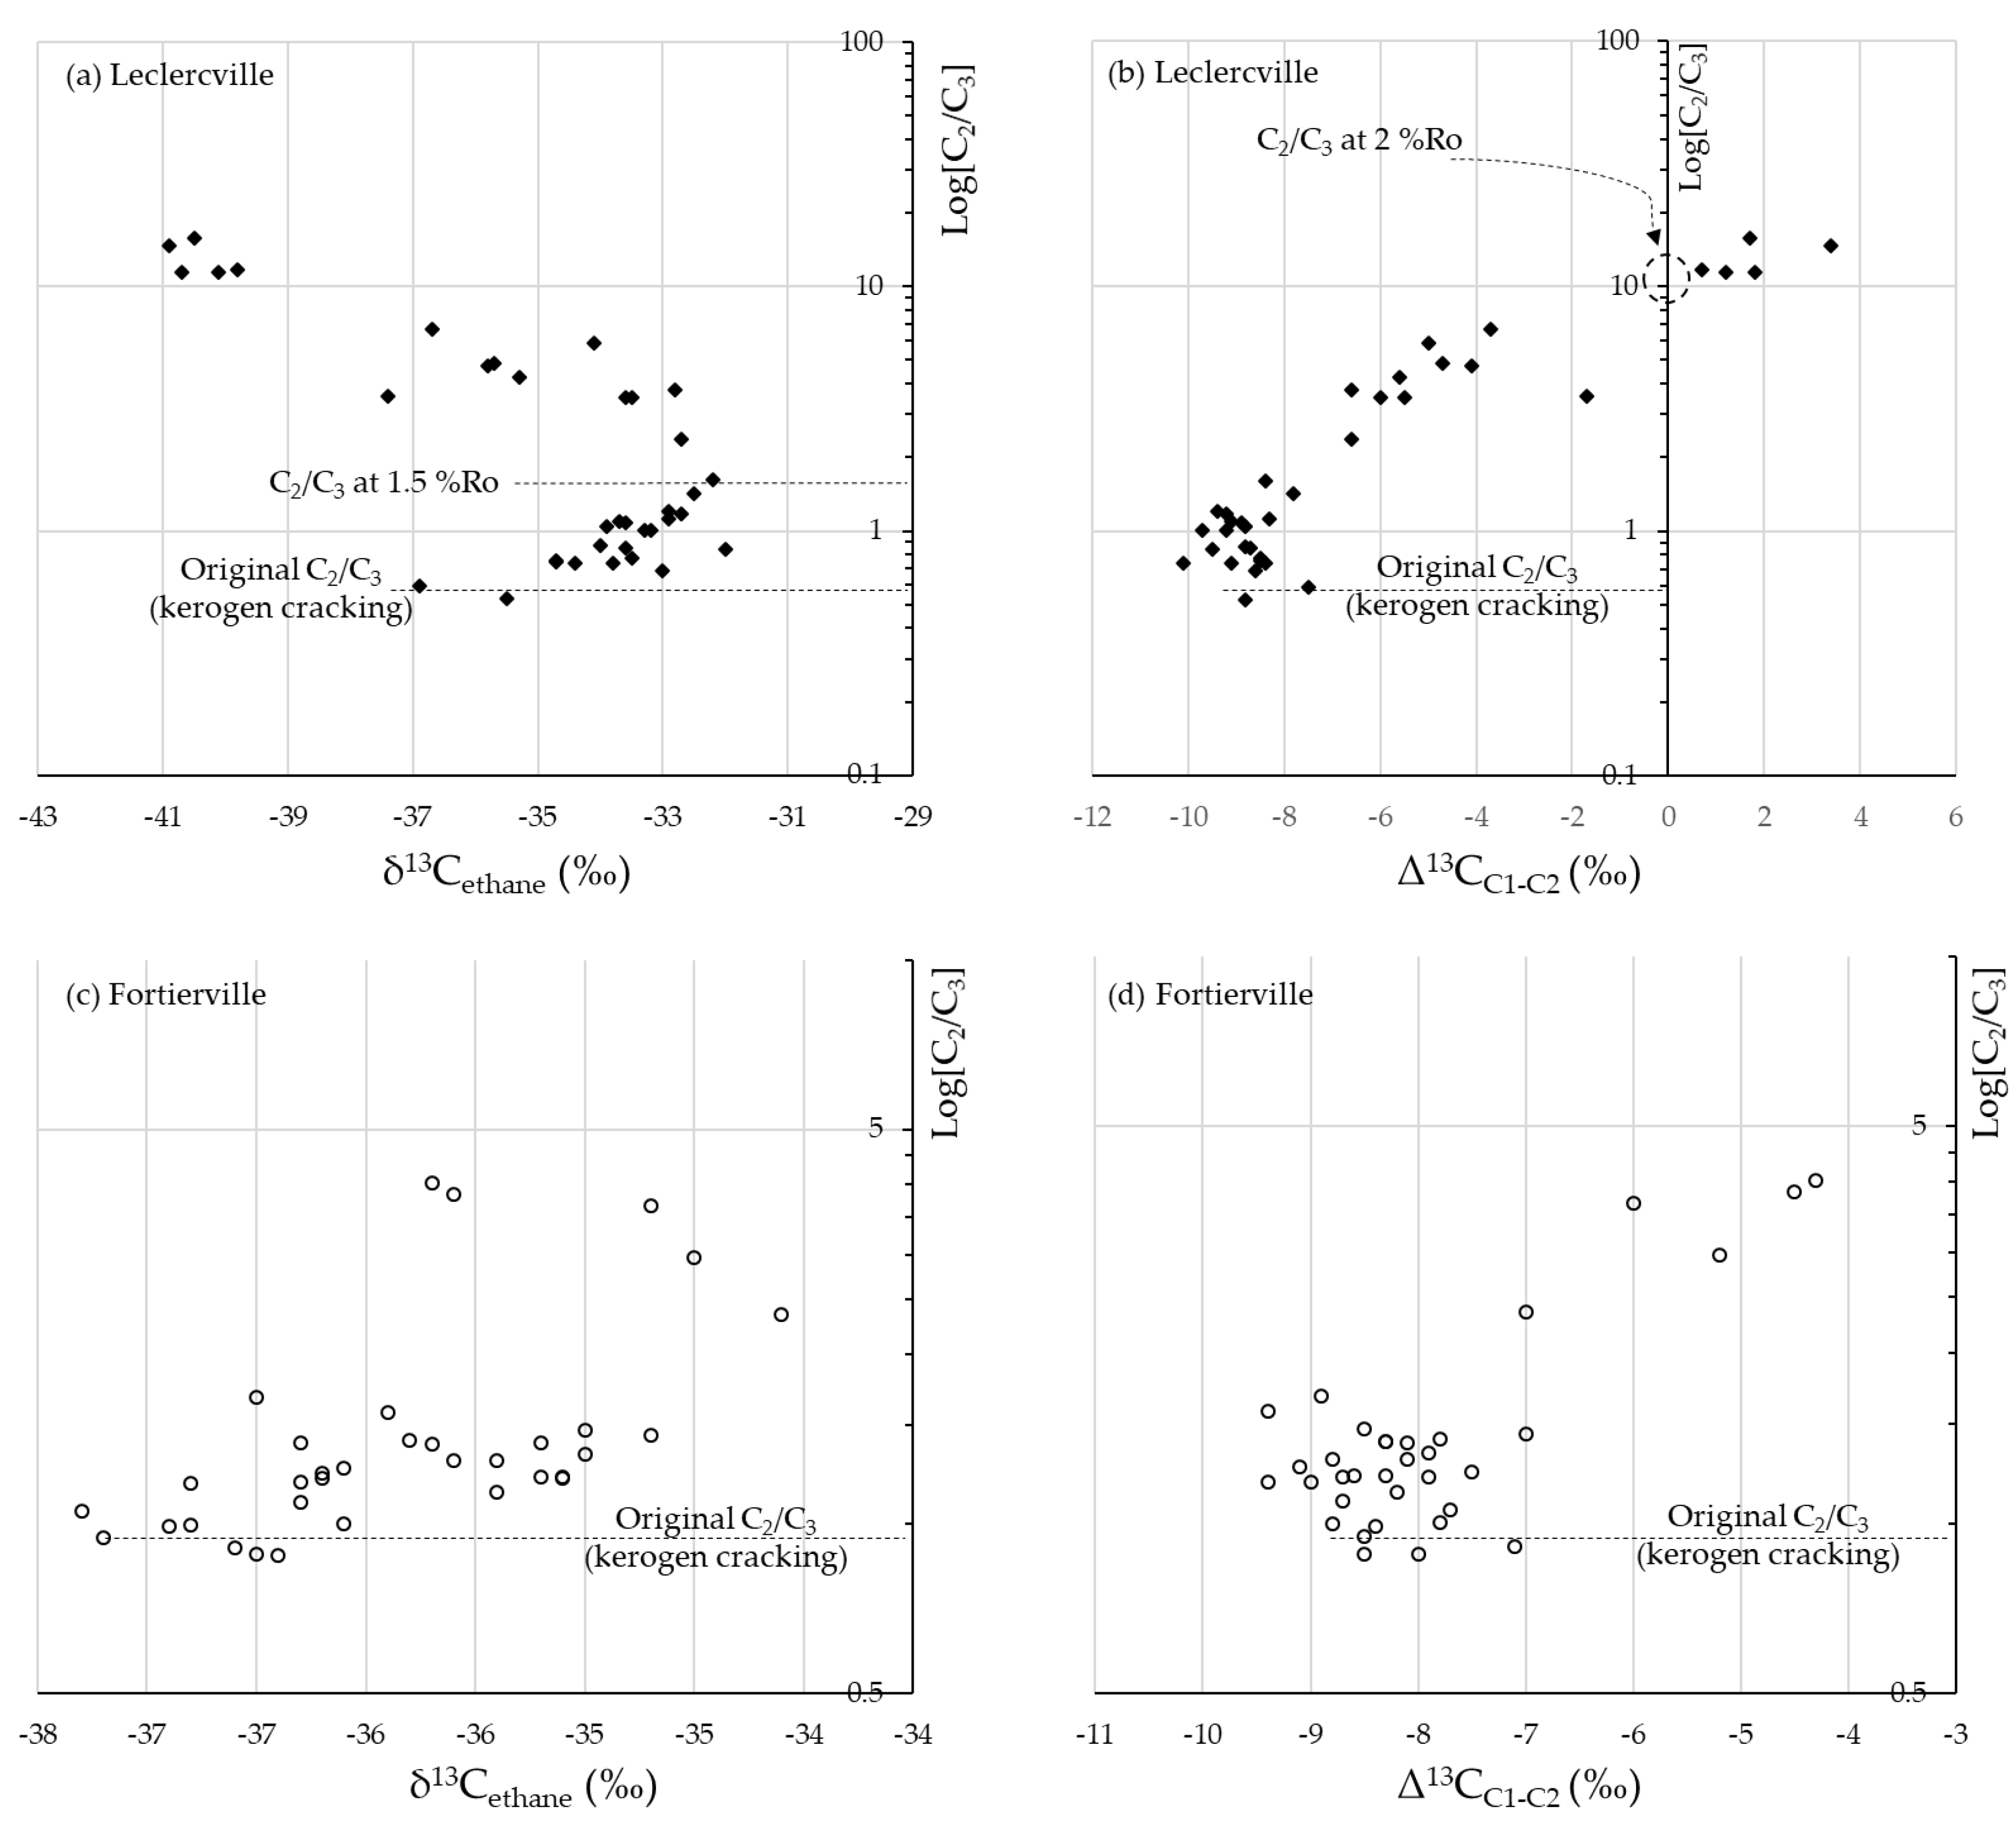
3.1.2. The Lorraine Shale
This section applies the same graphical tools described above, for two examples of gases from the Lorraine Shale (Quebec, Canada). The Ordovician Lorraine Shale in the St. Lawrence Lowlands is a flysch succession dominated by mudstones and siltstones with locally thicker bedded sandstones [29]. This dataset covers a wide thermal maturity range (from ≈0.6 to ≈2.0%Ro [16]); the samples correspond to mud-gas and two different profiles (<10 km apart) of the same geological formation.
Mud-gas profiles of the Lorraine Shale show similar trends to those of the Barnett Shale. In the case of the Leclercville well (Figure 2a), the δ13C values of ethane start at −37‰ with a C2/C3 value of 0.6, and increase to a value of −32‰ at a C2/C3 value of 1.6. Subsequently, the 13C depletion starts until reaching values of −41‰ with a C2/C3 ratio above 10. Additionally, Figure 2b shows that the methane–ethane isotope reversal starts at a C2/C3 value of approximately 10.
In the Fortierville well (Figure 2c), the δ13C values of ethane start at −37‰ with a C2/C3 value of 0.9, and increase to a value of −34‰ at a C2/C3 value of 2.4. Subsequently, the 13C depletion starts until reaching values of −36‰ with a C2/C3 ratio of 4. Although fewer data points are available for this well, the trend in Figure 2d suggests that the C2/C3 value at the start of the isotope reversal is close to 5.
It is interesting to note that although both wells cross the same geological unit and overlapping maturity ranges (higher maturity reached in Leclercville), key isotope and molecular fluctuations are not the same. This matter will be expanded in the discussion section.
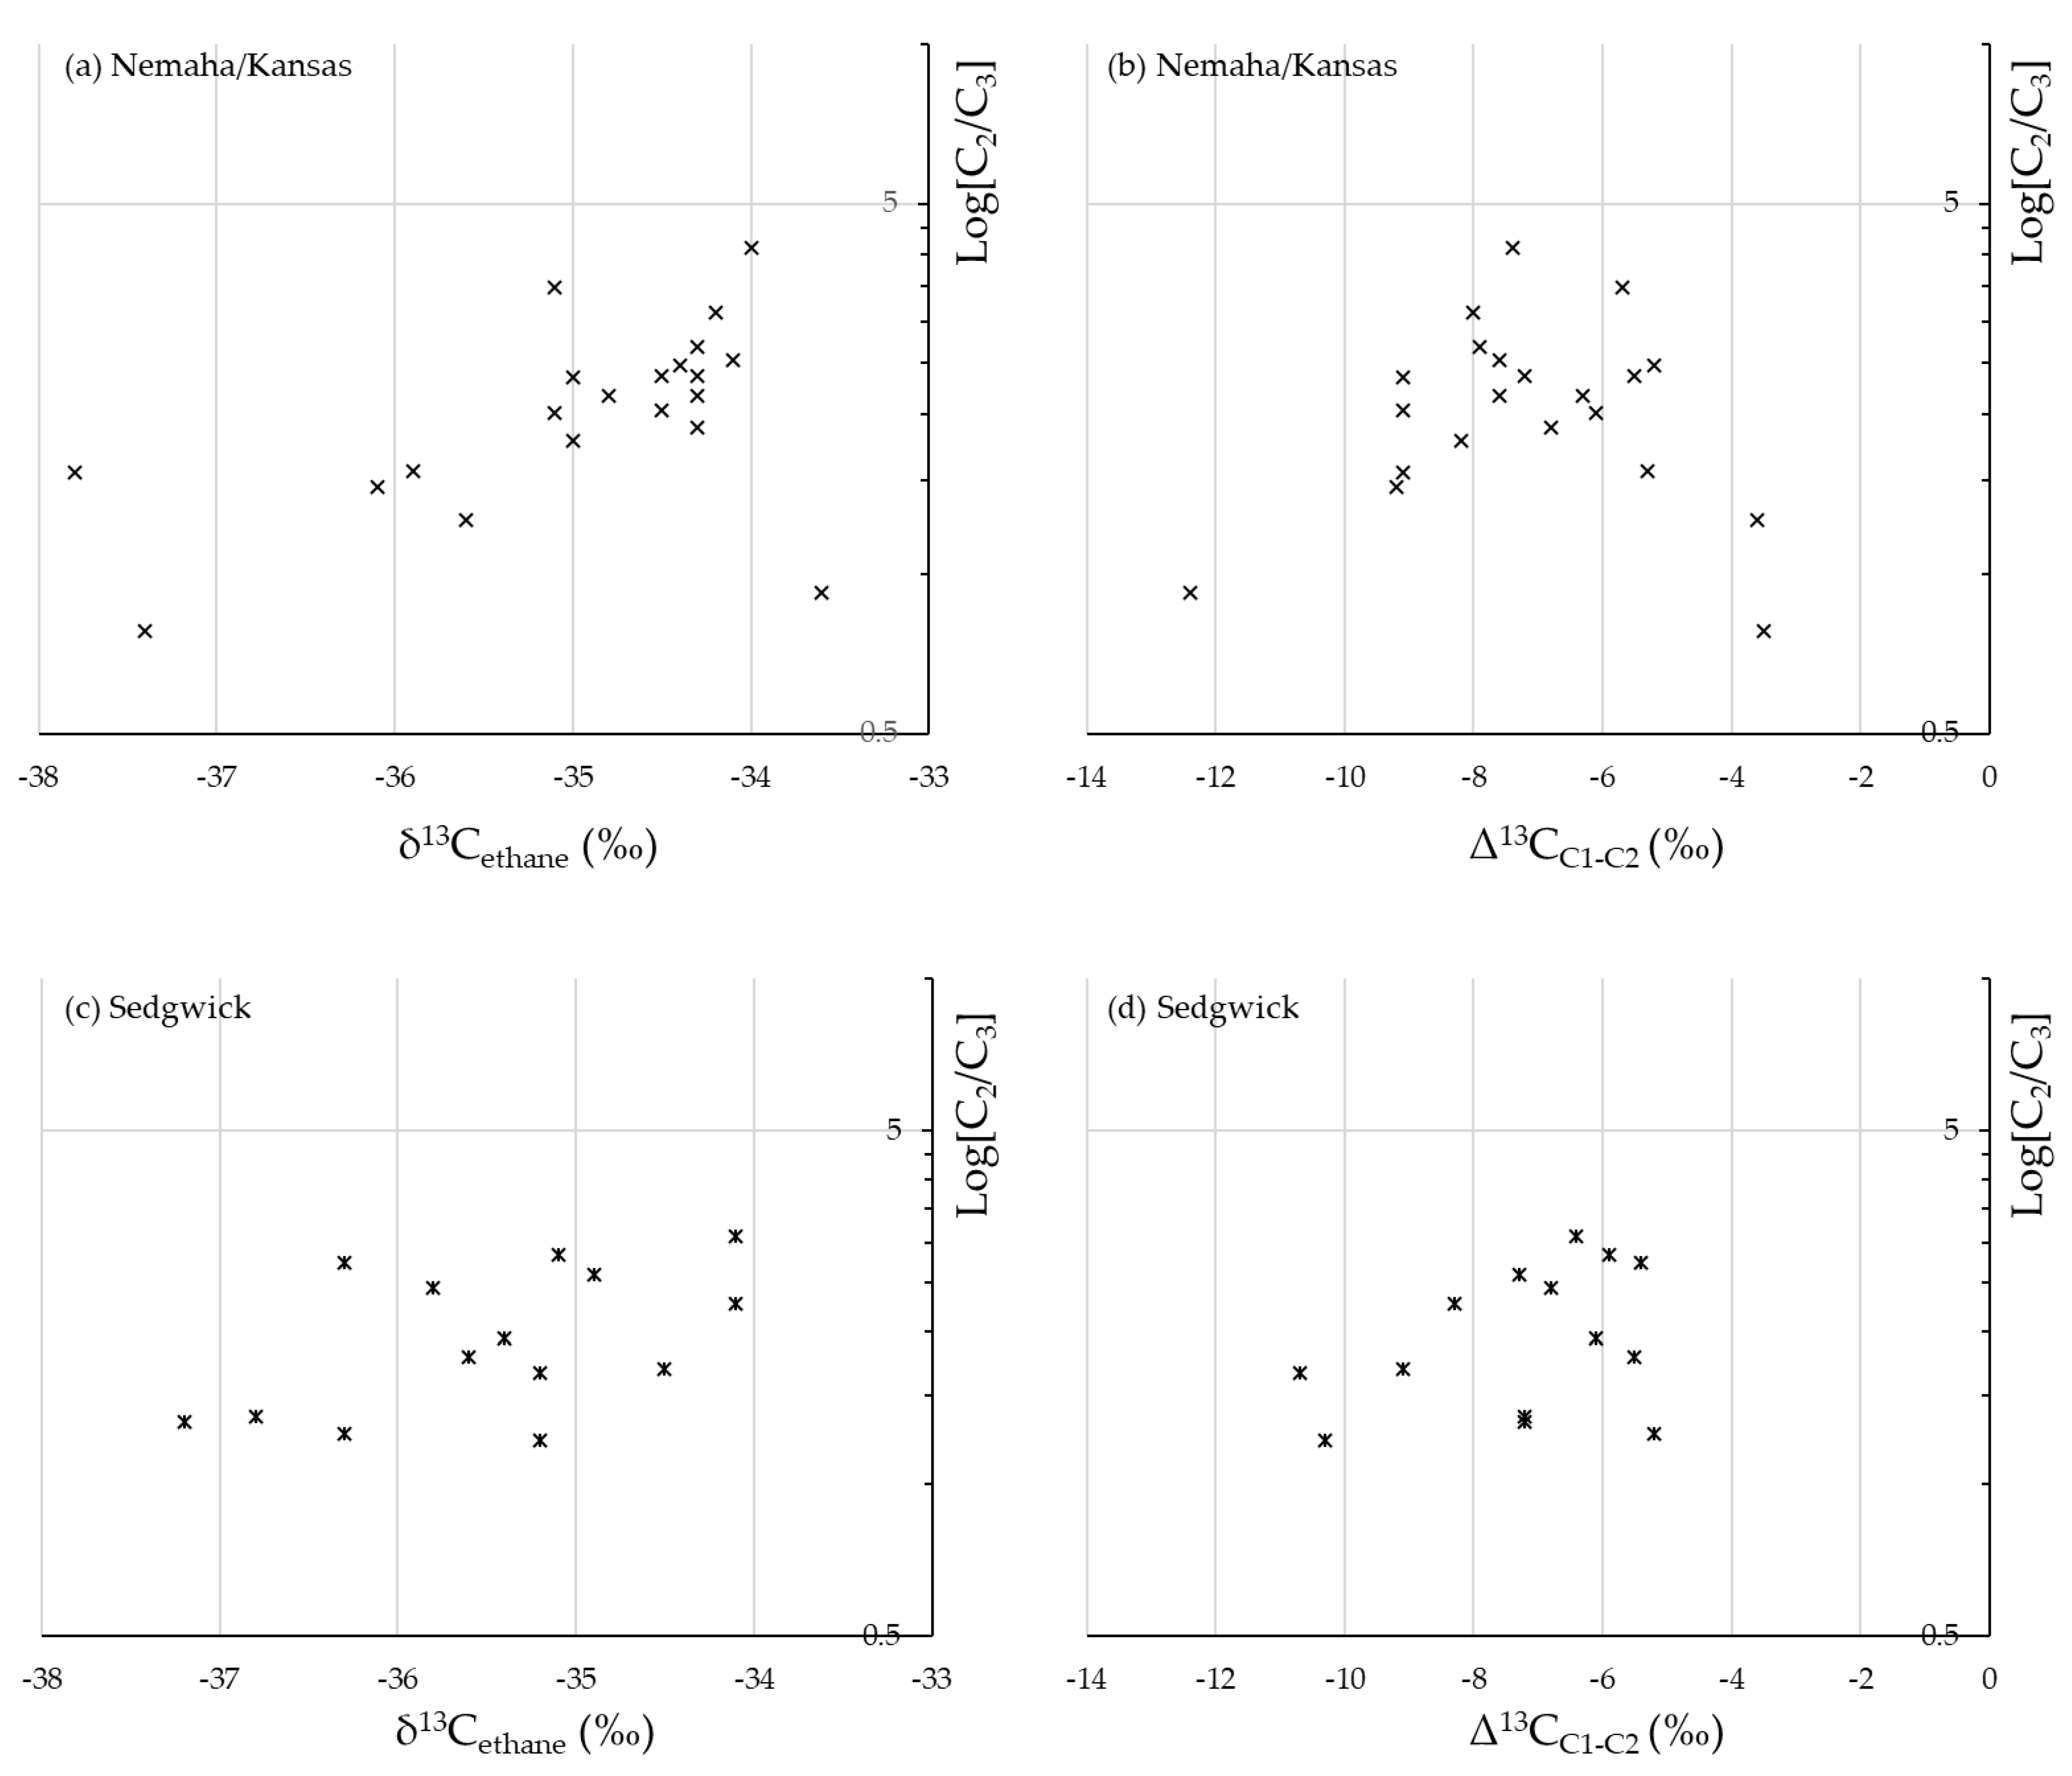
3.1.3. Nemaha/Kansas Uplift and Sedgwick Basin
Data of conventionally produced gases from Nemaha/Kansas [20] have been included because they were previously used to describe secondary cracking of oil at variable C2/C3 ratios [23]. These gases originated in the Andarko Basin (thermally mature rocks 1–1.4%Ro) and migrated more than 160 km [20]. The specific source was later confirmed to be the Woodford Shale [21]. With respect to conventional gas from the Sedgwick Basin, these fluids are considered to originate from local source rocks of lower maturity (Chattanooga Shale, 0.7%Ro [20], Woodford shale [22]). In this way, we cover a large variety of thermal maturity levels and migration distances.
Isotopic and chemical composition trends are less clear for the conventional gas samples. In the Nemaha/Kansas gases, the δ13C values of ethane increase from −38 to −34‰ as the C2/C3 ratio increases from 0.8 to 4.1 (Figure 3a), whereas the Δ13CC1-C2 difference varies from −12 to −4‰ (Figure 3b). For the gases of the Sedgwick Basin, the δ13C of ethane ranges between −37 and −34‰ as the C2/C3 ratio increases from 1.2 to 3.1 (Figure 3c). The Δ13CC1-C2 varies from −11 to −5‰ (Figure 3d).
3.2. Devonian Duvernay Formation—Well SCL HZ KAYBOB 4-16-64-20
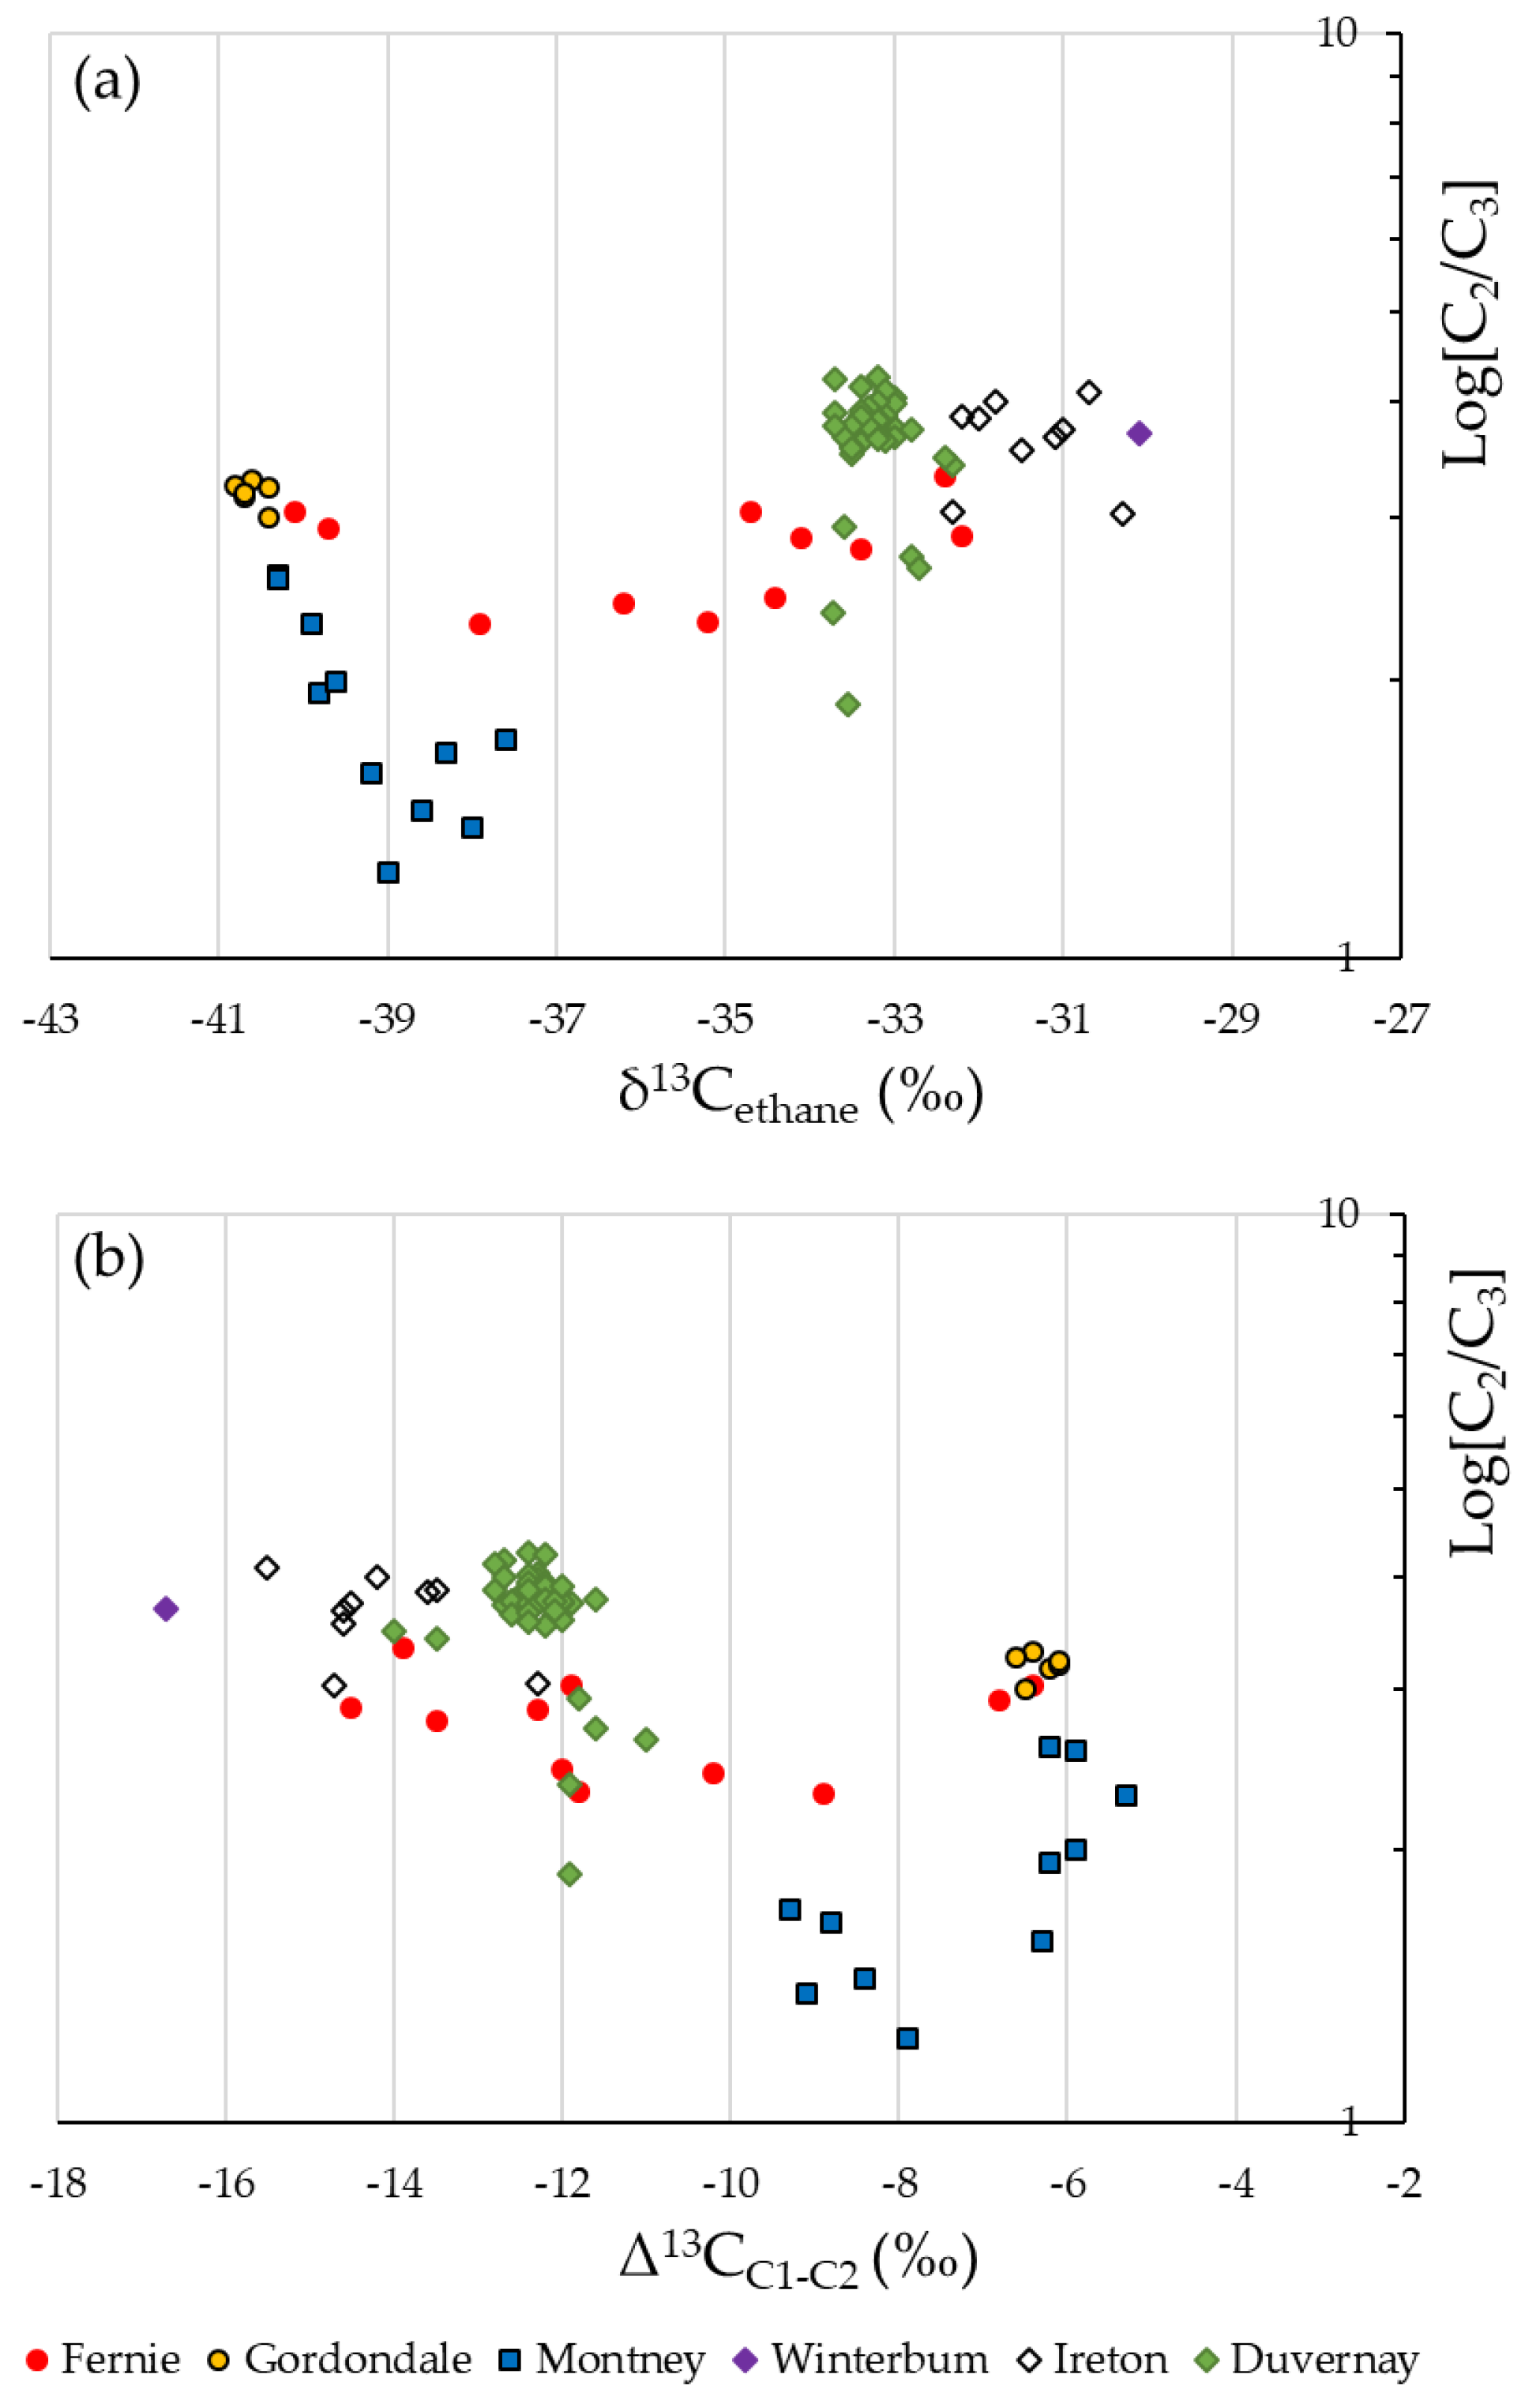
The example used in this section corresponds to a well from the Fox Creek area in west-central Alberta. The same well lands its horizontal section within the Devonian Duvernay Formation, which is intensively developed as a low-permeability reservoir nowadays. However, enough gas for measurement was detected in the overlying Devonian Winterbum and Ireton Formations, the Lower Triassic Montney Formation, and the Jurassic Fernie Formation (including its Gordondale/Nordegg Member). The data and specific corresponding depths can be found in Table S2. Gas data from this section are included to test the applicability of the parameters described above to multiple gas sources from the same well.
Although the thermal maturity ranged from 0.8%VReq in Gordondale/Nordegg to 1.8%VReq in Duvernay [29], the isotope data in Figure 4 do not display a maturity corresponding trend. The youngest samples from the Jurassic Fernie Formation (50 m interval) have δ13C values of ethane from −40 to −32‰, with C2/C3 ratios between 2.3 and 3.4, and Δ13CC1-C2 from −15 to −7‰. Also of Jurassic age, samples from Gordondale/Nordegg (25 m interval) have δ13C values of ethane around −40‰ with a C2/C3 ratio of 3.2, and a methane–ethane carbon isotope difference of −6‰. The Lower Triassic Montney Formation (70 m interval) exhibits carbon isotope values of ethane from −40 to −38‰, equivalent to C2/C3 ratios from 1.2 to 2.6 and Δ13CC1-C2 from −9 to −5‰. The Devonian Winterbum and Ireton Formations (310 m interval) have the most positive δ13C of ethane (up to −30‰) with a C2/C3 value around 3.7 and Δ13CC1-C2 differences below −14‰. In the case of the Devonian Duvernay Formation (2 km horizontal interval), most of the samples oscillate around −33‰ in their δ13C of ethane, C2/C3 values of ~3.7, and Δ13CC1-C2 of ~−12‰.
Although the δ13C values of ethane are less negative in the Devonian strata, a thermal maturity of 1.8%VReq in the Duvernay Formation would predict these gases to be in ethane isotope reversal or at least have Δ13CC1-C2 approaching zero, which is not the case. Only the Gordondale–Montney interval seems to have a more unconventional character with Δ13CC1-C2 approaching −6‰ and most negative δ13C values of ethane. These observations will be further expanded in the discussion below.
4. Discussion
Using the distribution of stable carbon isotopes of ethane from the Barnett Shale (Figure 1a) allows us to confirm that during kerogen cracking, i.e., when the C2/C3 ratio is relatively constant (2.5), the δ13C values of ethane tend to increase as it would be expected during normal kinetic fractionation (e.g., [13,30]). Likewise, ethane starts to deplete in 13C at a specific C2/C3 ratio (~6.6) which has been previously reported to take place circa 1.5%Ro [12,19]. From there, the C2/C3 ratio increases towards values of up to 40 as secondary cracking of hydrocarbons takes place, including cracking of wet gas components (C2-C5). It is the time where enough radicals may be available, for example, for certain reactions to occur and regenerate 13C depleted ethane (e.g., [6,8]). It is particularly interesting to note in Figure 1a that with an increase in the C2/C3 ratio from 2.5 to 6.6, the δ13C value of ethane increases, too. To the current knowledge, this interval, representing a 13C enrichment of ethane by 3‰ for the Barnett Shale, has not been identified before. This stage may be a transition interval from gas generation by kerogen cracking to gas generation dominated by hydrocarbon cracking (we should remember that even during hydrocarbon cracking, compounds continue to be released from kerogen [23,31,32]).
We may anticipate that the C2/C3 inflexions and isotope enrichment/depletion mentioned above are unique of different source rocks/reservoirs. For instance, in the Lorraine Shale from Leclercville (Figure 2a), the curve changes in C2/C3 ratio happen at 0.6 and ~1.6 with a 13C enrichment of ~4‰, whereas the same rock in the Fortierville well (Figure 2c) has C2/C3 ratio varying from 0.9 to ~2.4 with a 13C enrichment of ~4‰. This demonstrates that even for the same geological formation, chemical and isotopic composition of hydrocarbon gases can vary on relatively small scales.
Moving forward in thermal maturity, plotting the C2/C3 ratio versus Δ13CC1-C2 (Figure 1b) proved helpful because it allows us to identify the C2/C3 value at which the ethane isotope reversal starts—~26 for the Barnett Shale. If Δ13CC1-C2 > 0 values had been reported to happen above 2%Ro [5,12], this means we are now able to identify a C2/C3 value for such thermal maturity boundary (i.e., dry gas zone). The same boundary for the Lorraine Shale seems to have values of 10 (in Leclercville, Figure 2b) and 5 (in Fortierville, Figure 2d). Gases in ethane isotope reversal such as those from the Fayetteville Shale (Figure 1b) and the Lorraine Shale (Leclercville, Figure 2b) have the highest C2/C3 ratios of their corresponding curves, as it would be expected for their maturity levels.
When interpreting the conventional gas data, both trends (Figure 3a,c) show increasing δ13C values of ethane with increasing C2/C3 ratio, which is consistent with stable carbon isotope distributions described before unconventional gas development (e.g., [27,30,31]. However, we could also argue to be seeing the equivalent thermal maturity section approaching towards 1.5%Ro, discussed for the unconventional shales, where there is a transition from prominent kerogen cracking to prominent hydrocarbon cracking. Knowing the thermal maturity of Nemaha/Kansas (1–1.4%Ro) and Sedgwick (0.7%Ro) gases, we may infer that the mentioned transition is not necessarily the case. Another aspect to consider is migration and hydrocarbon mixing always affecting conventional gas accumulations, which overprint the original carbon isotope signature of the gas. Additionally, it is challenging to find a wide range of thermal maturity in conventional gases that come from the same source rock and develop an isotope curve such as the ones developed for the Barnett Shale and Lorraine Shale.
4.1. Implications on Isotope Equilibrium
Although thermodynamic equilibrium or meta-stable equilibrium conditions for natural gas are more often stated in recent literature [12,13,14,15], the exact equilibrium conditions continue to be a mystery as they lack precise definitions. It seems that hydrogen exchange may play an important role in free radical activation and other transformations responsible for the equilibrium [15,33].
Some authors had considered that chemical and isotope equilibrium were perhaps limited to gases in low-permeability reservoirs that have not experienced major migration [12,17]. This was based on the significance of residence time for isotope equilibrium to be established [34]. However, other studies found that equilibrium was also possible in conventional gas [13,14] (supported by clumped isotope analysis as well). Therefore, it may simply be more difficult to study the possibility of isotope equilibrium in conventional gases due to hydrocarbon mixing and extended migration distances.
Another aspect to question is that the equilibrium is probably not reached at 1.5%Ro. This is based on the fact that the even isotopic distribution of 6‰ (“even isotopic distribution (EID)” is the situation where the difference between the δ13C values of methane and ethane equals the difference between the δ13C values of ethane and propane [12]) could not be explained by the isotope equilibrium calculations for a wide range of temperatures by Thiagarajan et al. (2020) [13]. It should be mentioned that the later study also included CO2 in the equilibration process. It is possible that the even isotopic distribution of 6‰ simply represents the last stage of the quasi-equilibrium leading to a completely new type of chemical transformations, which ultimately generate ethane depleted in 13C.
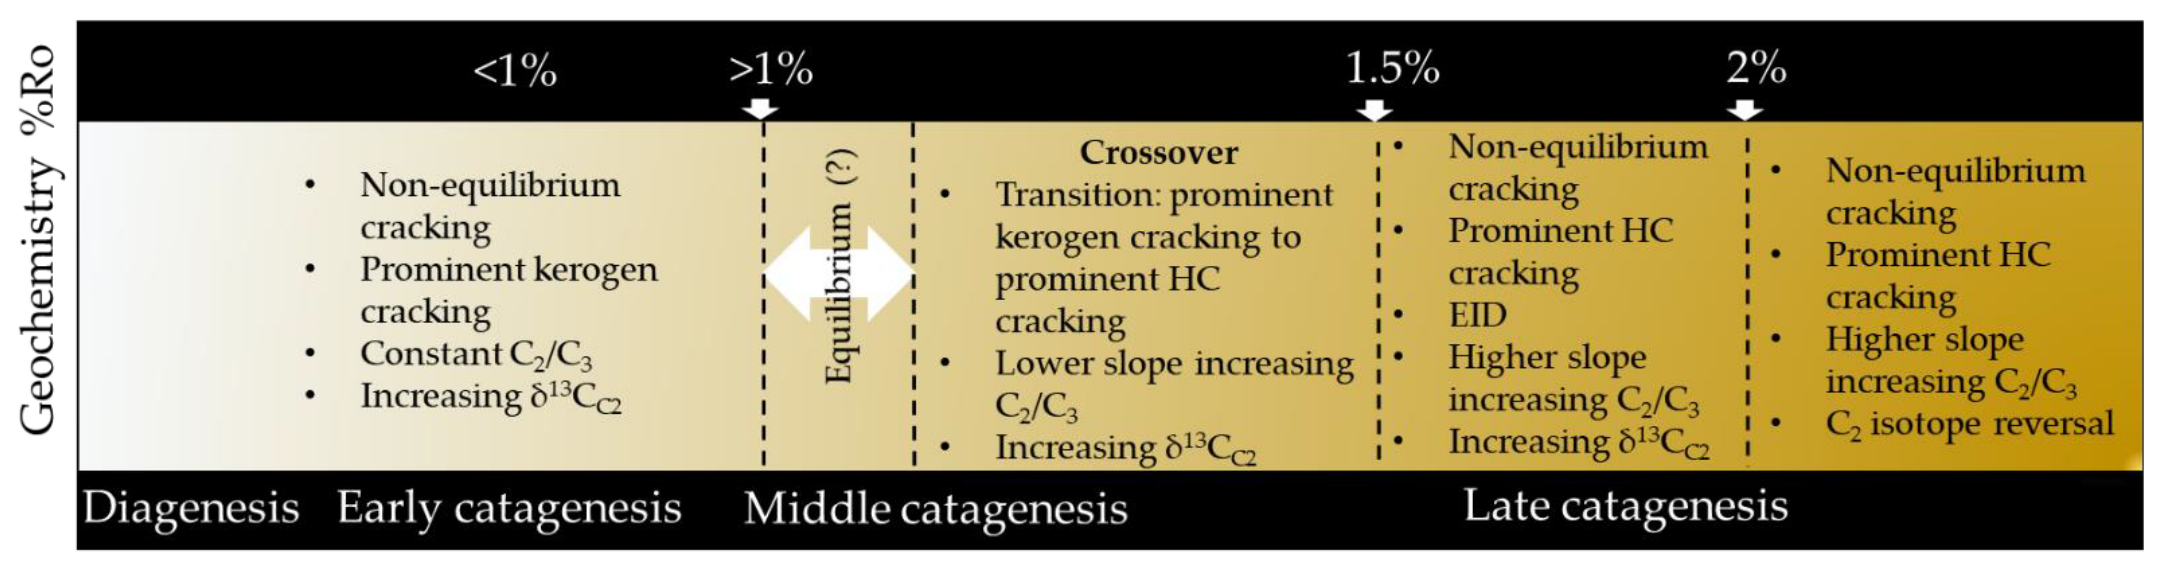
The crossover from equilibrium to disequilibrium conditions might not occur at a specific maturity as stated before (1.5%Ro, [14]), but rather over a maturity range finishing at 1.5%Ro. For example, in the case of the Barnett Shale, the crossover might be equivalent to the interval where the C2/C3 ratio increases from 2.5 (initial or original value) to 6.6 (value at 1.5%Ro) as the transition from prominent kerogen cracking to prominent hydrocarbon cracking takes place. This reinterpretation has been represented in Figure 5.
The geochemical variability presented in Figure 5 for the generation of gas hydrocarbons may also explain why the isotopic composition of natural samples have satisfied all previous empirical models reported in the literature (usually consisting of maturity versus δ13C calibrations). For instance, natural samples have satisfied equilibrium models [35], kinetic models [36,37,38], and adaptations of these [39]. In reality, all these processes are possible, but one dominates over the other at a particular interval of the thermal evolution of the source rock/reservoir. Understanding the order in which the isotope fractionation mechanisms take turn during thermal history will be key for fluid-fluid and fluid-source correlation studies.
4.2. Devonian Duvernay Formation—Well SCL HZ KAYBOB 4-16-64-20
In this sample set, all gases in Devonian reservoirs, including the target Duvernay Formation, have large carbon isotope differences between methane and ethane (Δ13CC1-C2 < −12‰, Figure 4b). For their level of thermal maturity (>1.5%Ro), gases formed at post-equilibrium conditions would be expected to have Δ13CC1-C2 approaching 0 and even a methane–ethane isotope reversal (in the case of Duvernay with 1.8%Ro), which is not the case of these samples. Therefore, we can interpret that these gases are probably mixtures or gases whose molecular composition has fractionated during migration. The Duvernay Formation is a well-known source rock for conventional hydrocarbons [40], thus it is conceivable that gases from the tight sections of the same rock have migrated variable distances.
Only the gases from the Jurassic and Triassic reservoirs (Fox Creek, Alberta) seem to resemble gases from reservoirs such as the Barnett Shale. For instance, the carbon isotope difference between methane and ethane approaches −6‰ at a relatively constant C2/C3 ratio in gases from the Jurassic Fernie Formation (including its Gordondale/Nordegg Member). The Δ13CC1-C2 also approaches values of −6‰ in gases from the Montney Formation associated with an increase in their C2/C3 ratio.
At a larger scale, the composition of gases from Montney and Fernie might be more consistent with chemical and isotope equilibration, whereas gases in Devonian strata have mixed molecular and isotope signatures. However, the amount of data density and variability in this occasion does not strongly support either conclusion. Interpreting carbon isotope data from one particular well is not a straightforward process, and comparison with additional data from nearby wells and wider ranges of thermal maturity is required. Other elements from the structural geology and basin history will also help understand the probabilities of hydrocarbon migration and mixing.
The take-home message of this study, and the real implication of “unconventional gas geochemistry” is that the possibility of chemical and isotope equilibrium needs to be taken into account particularly when analyzing gases from low-permeability reservoirs. This is especially relevant in basins producing hydrocarbons in the wet gas window, which coincides with postulated quasi-equilibrium conditions (approaching 1.5%Ro). Additionally, we know that the tendency towards quasi-equilibrium is not unique of unconventional accumulations, but gases in tight rocks are thought to have a higher probability of undergoing “equilibration” because of the longer residence time of in-situ hydrocarbons and their shorter migration/mixing distances.
The main pitfall of considering the above is that, as shown in this example, we can find all scenarios in one single well. It might also seem tedious having to take more variables into account. However, correlations (fluid-fluid or fluid-source) will be more accurate, and information about the openness of the system could also be obtained. For instance, for a reservoir section with the same maturity, we should be able to distinguish in-situ generated gas from migrated gas. The in-situ generated gas would have formed in a semi-open system over long residence times, more likely tending towards equilibrium. Instead, migrated gas would have formed in an open system (some distance away) even if its reservoir today is tight, and will more likely be non-equilibrated.
5. Conclusions
Although gas generation mechanisms are the same, low-permeability reservoirs provide the environment for particular features to be noted in unconventional gas, for instance, carbon isotope reversals and even isotopic distribution. These characteristics are probably unnoticed in conventional gas due to its lower residence time in the source rock (or where generated) and hydrocarbon mixing/migration. Geochemical parameters such as the δ13C values of ethane and the C2/C3 ratio are helpful to characterize self-sourced reservoirs such as the Barnett and Lorraine Shales. Key changes in these parameters are associated with variations in the chemical transformations during thermal history. For instance, they increase from baseline values during kerogen cracking towards intermediate values that might be equivalent to an equilibrium-disequilibrium crossover ending at 1.5%Ro. After this, C2/C3 ratio rapidly increases as the δ13C values of ethane become more negative (ending in methane–ethane isotope reversal) during prominent hydrocarbon cracking. Unconventional and conventional gases cannot continue to be studied under the same isotope geochemistry principles.
6. Future Work
The ideal scenario will be to estimate a C2/C3 ratio versus δ13C of ethane curve for every low-permeability reservoir, such as the one obtained for the Barnett Shale in Figure 1a. This curve would be used as a baseline for the interpretation of different geochemical processes taking place in that particular reservoir, considering that the parent material (either kerogen or migrated bitumen) is relatively homogeneous (not the case in most instances). A way to attempt this goal may be new isotope calculations using quantum chemistry for the estimation of the hypothetical curves. However, for these calculations, the different chemical transformations at all stages of gas generation and thermal evolution need to be pre-stablished, and some additional work is required to reach a consensus on this matter. The role played by the reversibility or carbon flows [40] as well as the influence from the structure of gas precursors and their intramolecular isotope distribution [41,42] are areas with paths ahead, too.
Having the ethane curve of a particular reservoir could also help us predict the δ13C value of methane at 1.5%Ro, which would be 6‰ more negative than the δ13C of ethane. This is important for identifying methane migration, not only between hydrocarbon producing intervals but also towards shallow intervals with potential environmental implications (e.g., groundwater and surface vents).
Supplementary Materials
The following supporting information can be downloaded at: https://0-www-mdpi-com.brum.beds.ac.uk/article/10.3390/min12101188/s1, Table S1: molecular and stable isotope data of produced gases from the low-permeability reservoirs and conventional reservoirs included in this study; Table S2: molecular and stable isotope data of mud-gas from the Lorraine Shale; Table S3: molecular and stable isotope data of mud-gas from the Well SCL HZ KAYBOB 4-16-64-20.
Funding
This research was funded by Natural Resources Canada (NRCan) and its Geoscience for New Energy Supply (GNES) program, grant number 331403.
Data Availability Statement
The data interpreted in this study can be found as supplementary material.
Acknowledgments
The author acknowledges the editor and reviewers for their constructive feedback to improve the quality of this publication.
Conflicts of Interest
The author declares no conflict of interest.
References
- Steward, B.W.; Capo, R.C.; Kirby, C.S. Geochemistry of unconventional shale gas from formation to extraction: Petrogenesis, hydraulic fracturing, and environmental impacts. Appl. Geochem. 2015, 60, 1–2. [Google Scholar] [CrossRef]
- Wang, X. Lacustrine Shale Gas: Case Study from the Ordos Basin; Elsevier Inc.: Oxford, UK, 2017; p. 358. [Google Scholar]
- Euzen, T.; Watson, N.; Chatellier, J.-Y.; Mort, A.; Mangenot, X. Petroleum System Analysis Using Unconventional Gas Geochemistry: Examples from the Montney Play of Western Canada. URTeC 2019, 649, 15. [Google Scholar]
- Burrus, R.C.; Laughrey, C.D. Carbon and hydrogen isotopic reversals in deep basin gas: Evidence for limits to the stability of hydrocarbons. Org. Geochem. 2010, 41, 1285–1296. [Google Scholar] [CrossRef]
- Zumberge, J.; Ferworn, K.; Brown, S. Isotopic reversal (‘rollover’) in shale gases produced from the Mississippian Barnett and Fayetteville formations. Mar. Petrol. Geol. 2012, 31, 43–52. [Google Scholar] [CrossRef]
- Xia, X.; Gao, Y. Depletion of 13C in residual ethane and propane during thermal decomposition in sedimentary basins. Org. Geochem. 2018, 125, 121–128. [Google Scholar] [CrossRef]
- Milkov, A.V.; Faiz, M.; Etiope, G. Geochemistry of shale gases from around the world: Composition, origins, isotope reversals and rollovers, and implications for the exploration of shale plays. Org. Geochem. 2020, 143, 103997. [Google Scholar] [CrossRef]
- Cheng, B.; Xu, J.; Deng, Q.; Liao, Z.; Wang, Y.; Faboya, O.L.; Li, S.; Liu, J.; Peng, P. Methane cracking within shale rocks: A new explanation for carbon isotope reversal of shale gas. Mar. Petrol. Geol. 2020, 121, 104591. [Google Scholar] [CrossRef]
- Fuex, A.N. The use of stable carbon isotopes in hydrocarbon exploration. J. Geochem. Explor. 1977, 7, 155–188. [Google Scholar] [CrossRef]
- Cramer, B.; Faber, E.; Gerling, P.; Krooss, B.M. Reaction kinetics of stable carbon isotopes in natural gas—insights from dry, open system pyrolysis experiments. Energy Fuels 2001, 15, 517–532. [Google Scholar] [CrossRef]
- Gaschnitz, R.; Krooss, B.M.; Gerling, P.; Faber, E.; Littke, R. On-line pyrolysis-GC-IRMS: Isotope fractionation of thermally generated gases from coals. Fuel 2001, 80, 2139–2153. [Google Scholar] [CrossRef]
- Cesar, J.; Nightingale, M.; Becker, V.; Mayer, B. Stable carbon isotope systematics of methane, ethane and propane from low-permeability hydrocarbon reservoirs. Chem. Geol. 2020, 558, 119907. [Google Scholar] [CrossRef]
- Thiagarajan, N.; Xie, H.; Ponton, C.; Kitchen, N.; Peterson, B.; Lawson, M.; Formolo, M.; Xiao, Y.; Eiler, J. Isotopic evidence for quasi-equilibrium chemistry in thermally mature natural gases. Proc. Natl. Acad. Sci. USA 2020, 117, 3989–3995. [Google Scholar] [CrossRef] [PubMed]
- Xie, H.; Dong, G.; Formolo, M.; Lawson, M.; Liu, J.; Cong, F.; Mangenot, X.; Shuai, Y.; Ponton, C.; Eiler, J. The evolution of intra- and inter-molecular isotope equilibria in natural gases with thermal maturation. Geochim. Cosmochim. Acta 2021, 307, 22–41. [Google Scholar] [CrossRef]
- Li, X.; Horita, J. Kinetic and equilibrium reactions on natural and laboratory generation of thermogenic gases from Type II marine shale. Geochim. Cosmochim. Acta 2022, in press. [CrossRef]
- Mango, F.D.; Jarvie, D.M.; Herriman, E. Natural gas at thermodynamic equilibrium implications for the origin of natural gas. Geochem. Trans. 2009, 10, 6. [Google Scholar] [CrossRef] [PubMed]
- Cesar, J.; Mayer, B.; Deblonde, C.; Mort, A.; Ardakani, O.H. Alternative indicators to assess the distribution characteristics of methane, ethane, and propane derived from petroleum in the Montney Formation, Western Canada. Fuel 2021, 294, 120524. [Google Scholar] [CrossRef]
- Heroux, Y.; Bertrand, R. Maturation thermique de la matière organique dans un bassin du Paléozoïque inférieur, basses-terres du Saint Laurent, Québec, Canada. Can. J. Earth Sci. 1991, 28, 1019–1030. [Google Scholar] [CrossRef]
- Chatellier, J.-Y.; Ferworn, K.; Lazreg Larsen, N.; Ko, S.; Flek, P.; Molgat, M.; Anderson, I. Overpressure in shale gas: When geochemistry and reservoir engineering data meet and agree. In Critical Assessment of Shale Resource Plays; Chatellier, J.-Y., Jarvie, D., Eds.; American Association of Petroleum Geologists: Tulsa, OK, USA, 2013; Volume 103, pp. 45–69. [Google Scholar]
- Jenden, P.D.; Newell, K.D.; Kaplan, I.R.; Watney, W.L. Composition and stable isotope geochemistry of natural gases from Kansas, Midcontinent, USA. Chem. Geol. 1988, 71, 117–147. [Google Scholar] [CrossRef]
- Hill, T. Potential source rocks in the Western Kansas Petroleum Province. Master’s thesis, Kansas State University, Manhattan, KS, USA, 2011. [Google Scholar]
- Drake, R.M.; Hatch, J.R. Geologic Assessment of Undiscovered Oil and Gas Resources in the Cherokee Platform Province Area of Kansas, Oklahoma, and Missouri. National and Global Petroleum Resources Assessment Project. US Geol. Surv. Sci. Investig. Rep. 2021, 2020–5110, 39. [Google Scholar]
- Prinzhofer, A.; Huc, A.Y. Genetic and post-genetic molecular and isotopic fractionations in natural gases. Chem. Geol. 1995, 126, 281–290. [Google Scholar] [CrossRef]
- Taylor, S.W.; Sherwood Lollar, B.; Wassenaar, L.I. Bacteriogenic ethane near surface aquifers: Implications for leaking hydrocarbon well bores. Environ. Sci. Technol. 2000, 34, 4727–4732. [Google Scholar] [CrossRef]
- Cesar, J.; Mayer, B.; Humez, P. A novel isotopic approach to distinguish primary microbial and thermogenic gases in shallow subsurface environments. Appl. Geochem. 2021, 105048. [Google Scholar] [CrossRef]
- Euzen, T.; Watson, N.; Fowler, M.; Mort, A.; Moslow, T.F. Petroleum distribution in the Montney hybrid play: Source, carrier bed and structural controls. Am. Assoc. Pet. Geol. Bull. 2021, 105, 1867–1892. [Google Scholar] [CrossRef]
- Speight, J. Shale Gas Production Processes; Elsevier Inc.: Amsterdam, The Netherlands, 2013; 170p. [Google Scholar]
- Ratchford, M.E.; Bridges, L.C.; Jordan, D.; Dow, W.G.; Colbert, A.; Jarvie, D.M. Organic geochemistry and thermal maturation analysis within the Fayetteville Shale study area—Eastern Arkoma Basin and Mississippi Embayment regions, Arkansas. Ark. Geol. Comm. Inf. Circ. 2006, 37, 12. [Google Scholar]
- Lavoie, D.; Ardakani, O.H.; Rivard, C. Synthesis of Organic Matter Composition and Maturation and Gas Data from Selected Deep Source Rock Units for Some Wells in the Fox Creek Area. Geological Survey of Canada Open File Report 8788, 96. Available online: https://geoscan.nrcan.gc.ca/starweb/geoscan/servlet.starweb?path=geoscan/fulle.web&search1=R=328238 (accessed on 16 August 2022).
- Clayton, C. Carbon isotope fractionation during natural gas generation from kerogen. Mar. Petrol. Geol. 1991, 8, 232–240. [Google Scholar] [CrossRef]
- Xia, X.; Chen, J.; Braun, R.; Tang, Y. Isotopic reversals with respect to maturity trends due to mixing of primary and secondary products in source rocks. Chem. Geol. 2012, 339, 205–212. [Google Scholar] [CrossRef]
- Liu, Q.; Wu, X.; Wang, X.; Jin, Z.; Zhu, D.; Meng, Q.; Huang, S.; Liu, J.; Fu, Q. Carbon and hydrogen isotopes of methane, ethane, and propane: A review of genetic identification of natural gas. Earth-Sci. Rev. 2019, 190, 246–272. [Google Scholar] [CrossRef]
- Xia, X.; Gao, Y. Kinetic clumped isotope fractionation during the thermal generation and hydrogen exchange of methane. Geochim. Cosmochim. Acta 2019, 248, 252–273. [Google Scholar] [CrossRef]
- Lorant, F.; Prinzhofer, A.; Behar, F.; Huc, A.-Y. Carbon isotopic and molecular constraints on the formation and the expulsion of thermogenic hydrocarbon gases. Chem. Geol. 1998, 147, 249–264. [Google Scholar] [CrossRef]
- James, A.T. Correlation of natural gas by use of carbon isotopic distribution between hydrocarbon components. Am. Assoc. Pet. Geol. Bull. 1983, 67, 1176–1191. [Google Scholar]
- Berner, U.; Faber, E. Maturity related mixing model for methane, ethane and propane, based on carbon isotopes. Adv. Org. Geochem. 1988, 13, 67–72. [Google Scholar] [CrossRef]
- Berner, U.; Faber, E. Empirical carbon isotope/maturity relationships for gases from algal kerogens and terrigenous organic matter, based on dry, open-system pyrolysis. Org. Geochem. 1996, 24, 947–955. [Google Scholar] [CrossRef]
- Schoell, M. Genetic characterization of natural gases. Am. Assoc. Pet. Geol. Bull. 1983, 67, 2225–2238. [Google Scholar]
- Abrams, M.A. Evaluation of near-surface gases in marine sediments to assess subsurface petroleum gas generation and entrapment. Geosciences 2017, 7, 35. [Google Scholar] [CrossRef]
- Hayes, J.M. Fractionation of the isotopes of carbon and hydrogen in biosynthetic processes. In Stable Isotope Geochemistry. Reviews in Mineralogy and Geochemistry; Valley, J.W., Cole, D.R., Eds.; Mineralogical Society of America: Washington, DC, USA, 2001; Volume 43, pp. 225–277. [Google Scholar]
- Hayes, J.M. Factors controlling 13C contents of sedimentary organic compounds: Principles and evidence. Mar. Geol. 1993, 113, 111–125. [Google Scholar] [CrossRef]
- Galimov, E.M. Isotope organic geochemistry. Org. Geochem. 2006, 37, 1200–1262. [Google Scholar] [CrossRef]
Figure 1.
The relationships between the C2/C3 ratio and (a) the δ13C of ethane, and (b) the Δ13CC1-C2 difference; for samples from the Barnett and Fayetteville shales.
Figure 1.
The relationships between the C2/C3 ratio and (a) the δ13C of ethane, and (b) the Δ13CC1-C2 difference; for samples from the Barnett and Fayetteville shales.

Figure 2.
The relationship between the C2/C3 ratio and (a,c) the δ13C of ethane, and (b,d) the Δ13CC1-C2 difference; for samples from the Fortierville (a,b; circle markers) and Leclercville (c,d; square markers) wells in the Lorraine Shale.
Figure 2.
The relationship between the C2/C3 ratio and (a,c) the δ13C of ethane, and (b,d) the Δ13CC1-C2 difference; for samples from the Fortierville (a,b; circle markers) and Leclercville (c,d; square markers) wells in the Lorraine Shale.

Figure 3.
The relationship between the C2/C3 ratio and (a,c) the δ13C of ethane, and (b,d) the Δ13CC1-C2 difference; for samples from the Nemaha/Kansas (a,b) and Sedgwick (c,d) fields, Kansas Midcontinent.
Figure 3.
The relationship between the C2/C3 ratio and (a,c) the δ13C of ethane, and (b,d) the Δ13CC1-C2 difference; for samples from the Nemaha/Kansas (a,b) and Sedgwick (c,d) fields, Kansas Midcontinent.

Figure 4.
The relationship between the C2/C3 ratio and (a) the δ13C of ethane, and (b) the Δ13CC1-C2 difference; for samples from the KAYBOB 4-16-64-20 well, western Alberta.
Figure 4.
The relationship between the C2/C3 ratio and (a) the δ13C of ethane, and (b) the Δ13CC1-C2 difference; for samples from the KAYBOB 4-16-64-20 well, western Alberta.

Figure 5.
Diagram representing the geochemical characteristics to take into account when considering an equilibrium approach. After Thiagarajan et al. (2020) [13], Cesar et al. (2020) [12], and this study. “Crossover” stands for the suggested crossover between equilibrium and non-equilibrium conditions. The exact %Ro for the equilibrium (if established) remains unknown. EID: even isotopic distribution [12].


Table 1.
Low-permeability reservoirs and conventional (*) reservoirs from which molecular and carbon isotope data of gas samples was included in this study.
Table 1.
Low-permeability reservoirs and conventional (*) reservoirs from which molecular and carbon isotope data of gas samples was included in this study.
| Reservoir (Age) | Hydrocarbon Source | Maturity | Reference | |
|---|---|---|---|---|
| Barnett Shale (Mississippian) | Self-sourced | 1–2%Ro | [5] | |
| Fayetteville Shale (Mississippian) | Self-sourced | 2–3%Ro | [5] | |
| Lorraine Shale (Ordovician) | Self-sourced | 0.6–2%Ro | [18,19] | |
| N | Nemaha/Kansas * (Carboniferous) | Woodford Shale | 1–1.4%Ro | [20,21,22] |
| Sedgwick Basin * (Carboniferous) | Woodford Shale, Chattanooga Shale | 0.7%Ro | [20,21,22] |
Publisher’s Note: MDPI stays neutral with regard to jurisdictional claims in published maps and institutional affiliations. |
© 2022 by the author. Licensee MDPI, Basel, Switzerland. This article is an open access article distributed under the terms and conditions of the Creative Commons Attribution (CC BY) license (https://creativecommons.org/licenses/by/4.0/).
Share and Cite
MDPI and ACS Style
Cesar, J. Unconventional Gas Geochemistry—An Emerging Concept after 20 Years of Shale Gas Development? Minerals 2022, 12, 1188. https://0-doi-org.brum.beds.ac.uk/10.3390/min12101188
AMA Style
Cesar J. Unconventional Gas Geochemistry—An Emerging Concept after 20 Years of Shale Gas Development? Minerals. 2022; 12(10):1188. https://0-doi-org.brum.beds.ac.uk/10.3390/min12101188
Chicago/Turabian StyleCesar, Jaime. 2022. "Unconventional Gas Geochemistry—An Emerging Concept after 20 Years of Shale Gas Development?" Minerals 12, no. 10: 1188. https://0-doi-org.brum.beds.ac.uk/10.3390/min12101188
Note that from the first issue of 2016, this journal uses article numbers instead of page numbers. See further details here.