1. Introduction
Shale gas, which is a self-generated and self-restored natural gas system [
1,
2], has been one of the most important petroleum resources in recent years. The Upper Ordovician Wufeng Formation–Lower Silurian Longmaxi Formation (abbreviated as Wufeng–Longmaxi Fm.) in Sichuan Basin is the key target for shale gas exploration in China [
3,
4,
5,
6,
7,
8]. Abundant research has significantly uncovered the tectonic, petrographical, geochemical and petrophysical characteristics of this gas shale interval [
9,
10,
11,
12,
13,
14,
15,
16]. Among numerous discoveries, a well-known fact is that the total organic carbon (TOC) has a positive relationship with shale gas content in shale gas systems [
17,
18,
19]. Wu et al. obtained a moderate positive relationship (R
2 = 0.667) between shale gas content and TOC content in the Fuling gas field of Sichuan Basin [
19]. In addition, the porosities of gas shales normally showed positive relationships with TOC content in shale gas systems, which were found in both the Wufeng–Longmaxi shale interval in China and gas shale intervals in America [
11,
17,
20]. These studies confirmed that organic matter provided an important pore reservoir type in shale gas systems [
12,
17,
20,
21,
22]. Thus, the characteristics of pore development in organic matter are fundamental for reservoir evaluation in shale gas systems.
Researchers worldwide have analyzed pore structures and characteristics in shale gas systems [
17,
20,
22,
23,
24]. Many studies focused on the development of pores in different organic matter types, with some researchers proposing several schemes for organic matter type classifications of Wufeng–Longmaxi gas shale [
22,
25,
26]. Jiao et al. classified the pores in shale gas systems as organic matter pores, intra-pores in minerals and inter-pores among mineral grains (mainly as dissolved pores) [
22]. When it was realized that organic matter pores were very important in shale gas systems, Chen et al. classified organic matter into two group types [
25]: (1) formed organic matter, which mainly includes graptolite; (2) amorphous organic matter, including bitumen and micrinite. Pores were mainly found in bitumen and graptolite. Zhang et al. (2020) classified organic matter into five groups [
26]: bitumen, graptolite, algal fragment, spherical kerogen and bacteria-like aggregate, with little pores found in graptolite. These studies normally provided some micro-photos under scanning electron microscope (SEM) to illustrate the characteristics of pore developments. Organic matter (OM) compositions in shales are complicated, not only on the bio-precursor of OM, but also on the relative quantitative composition of different OM types and their evolution processes. In fact, the semi-quantitative analysis of different types of organic matter under SEM are difficult international problems, let alone the pore developments within different organic matter types. The content of pores can be calculated by point counting within the SEM or FE-SEM images [
17,
27,
28], with the influences of maturity on pore developments studied through artificial maturation experiments. However, these results could be influenced by the resolution of the equipment and the images taken by the experimenter if the sample was without any heterogeneity.
In this study, we semi-quantitatively analyzed the different bio-precursor compositions of organic matter with polished thin sections of whole rock. Through comparisons of the pore characterizations among different bio-precursor derived organic matter, the study aimed to uncover the pore development and reveal contributions of different bio-precursor derived organic matter. This study could provide new clues and basic scientific information for shale gas formation in Wufeng–Longmaxi gas shale intervals from Sichuan Basin, in the southwest of China.
2. Geological Setting and Samples
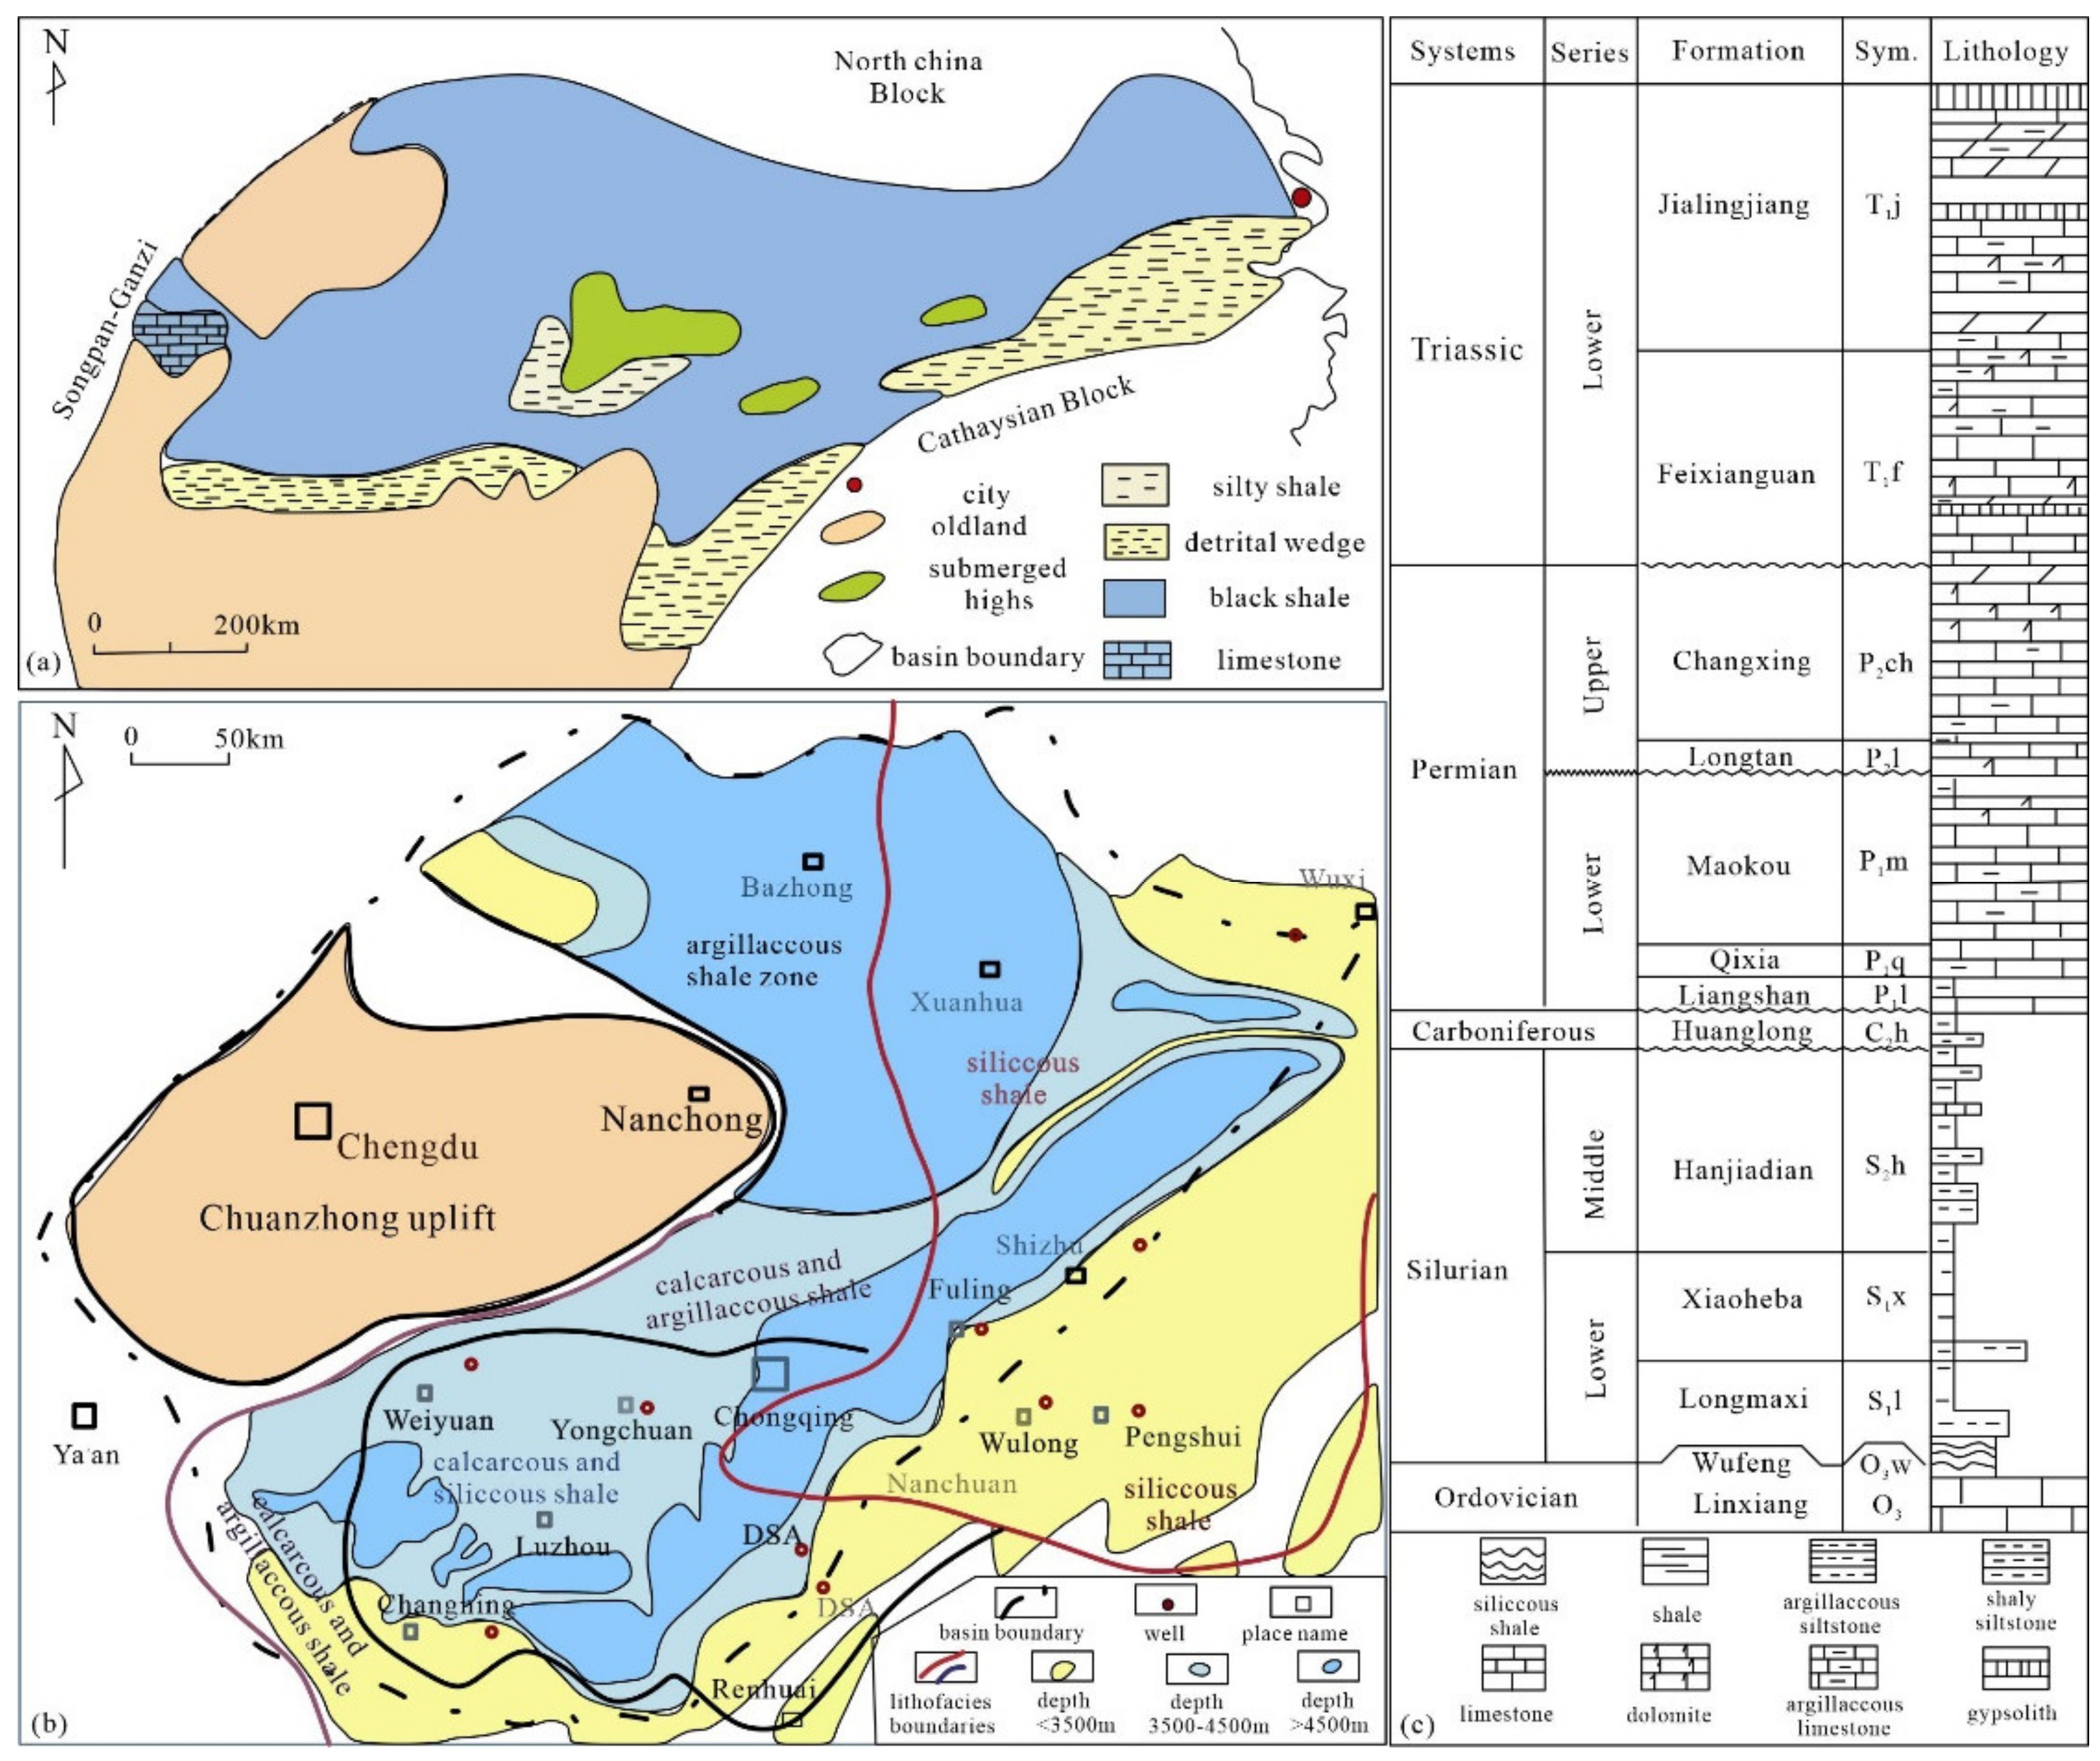
The Sichuan Basin (a superimposed basin) was developed on the Upper Yangtze Craton in the southwest of China (
Figure 1) [
6]. The basin is surrounded by the Micangshan–Dabashan fold belt (north), the Hunan–Guizhou–Hubei fold belt (east), Emenshan–Liangshan fold belt (south) and the Longmenshan fold belt (west). The Sichuan Basin was compressed by its periphery uplift tectonic activities during Wufeng–Longmaxi shale being deposited [
25,
29]. Wufeng–Longmaxi shale developed with an anoxic sedimentary environment and is distributed widely in the Sichuan Basin [
29,
30].
Shale gas in the Dingshan area, sited in the southwest of Sichuan Basin, was deeper than Fuling gas field. The depths of Wufeng–Longmaxi in studied Well A of the Dingshan area ranged from 3596.7–3731 m. Wufeng–Longmaxi gas shale is typically enriched in graptolite, with the shale interval divided into several layers according to detailed biostratigraphy studies by Chen et al. [
25]. From bottom to top, Wufeng Formation was divided into four layers (WF1–WF4), while Longmaxi Formation was divided into three sections (Long 1~Long 3), including nine layers. Long 1, Long 2 and Long 3 sections included ①–⑤ layers, ⑥–⑦ layers and ⑧–⑨ layers, respectively. Long 1 section was the lower gas shale reservoir, while Long 2–3 belonged to the upper gas shale reservoir. Shale gas was obtained mainly from Wufeng Formation and Long 1 section reservoir.
3. Analytical Methods
The 66 core samples from Well A in the Dingshan area for geochemical analysis were washed and then dried before powdering in an agate mortar. Polished conventional petrographic pellets and polished thin sections (perpendicular to bedding) were prepared for organic petrology; fresh fracture surfaces (perpendicular to bedding) were selected for SEM observation for organic matter; and samples polished by argon ion were checked by SEM for pore development analysis. All analyses were carried out in the Sinopec Wuxi Institute of Petroleum Geology, Wuxi, China.
All samples were collected for TOC and S analysis. Core samples (200 mg) were powdered into 200 mesh size, then prepared with 10% HCl at 60 °C to remove carbonate and washed with distilled water to a pH of 5. The washed samples were dried and analyzed using a Leco CS-200 carbon–sulfur analyzer produced by LECO Corporation, St. Joseph, MI, USA, with an accuracy of 0.5% according to the Chinese national standard GB/T 19145–2003.
Inorganic petrographical and inner structure of organic matter were analyzed on the polished thin sections for general bio-precursor identification under white reflected light, transmitted polarized light and orthogonal light. Semi-quantitative analysis of organic matter was measured with the organic petrology method. Petrographical organic compositions were observed under white reflected and transmitted light on the polished thin sections with a Leica DM4500P microscope manufactured by Leica company in Wetzlar, German. The petrographic composition was evaluated quantitatively by point counting (500 counts per pellet).
Maturities were evaluated by the solid bitumen and graptolite reflectance on conventional petrographic pellets. Standard samples with reflectances of 1.721 and 3.16% reflectance were used for measurement. The analysis was performed under a ×50 oil immersion objective of the Leica DM4500P microscope connected with a J&M micro-photometer. The mean random reflectance (%Rb) of solid bitumen was calculated as an average of more than 50 points per sample.
A small piece of rock sample with a fresh surface perpendicular to bedding and samples polished by argon ion were air dried first, then coated in a Polaron E5000 sputter coater (Quorum Technologies, East Sussex, UK) at 1.2 kV with platinum/palladium for 2 min. The prepared sample was observed in a FEI-Philips-ESEM-FEG Quanta 200F (Field Electron and Ion Company, Hillsboro, OR, USA) scanning electron microscope and the voltage was stabilized at 20 kV.
Mineral composition analysis was conducted with Cu radiation (40 kV, 100 mA) using a Bruker D8S Advance X-ray Diffractometer (XRD) instrument (Bruker Corporation, Billerica, MA, USA). Porosities were determined by WTC binder pyconometry with helium. Pore characterization was measured by N
2 adsorption using a QuadraSorb Station 3 apparatus (Anton Paar Company, Graz, Austria). The detailed procedure of N
2 adsorption followed Wang et al. [
14].
4. Results
4.1. TOC and S Contents and Mineral Compositions
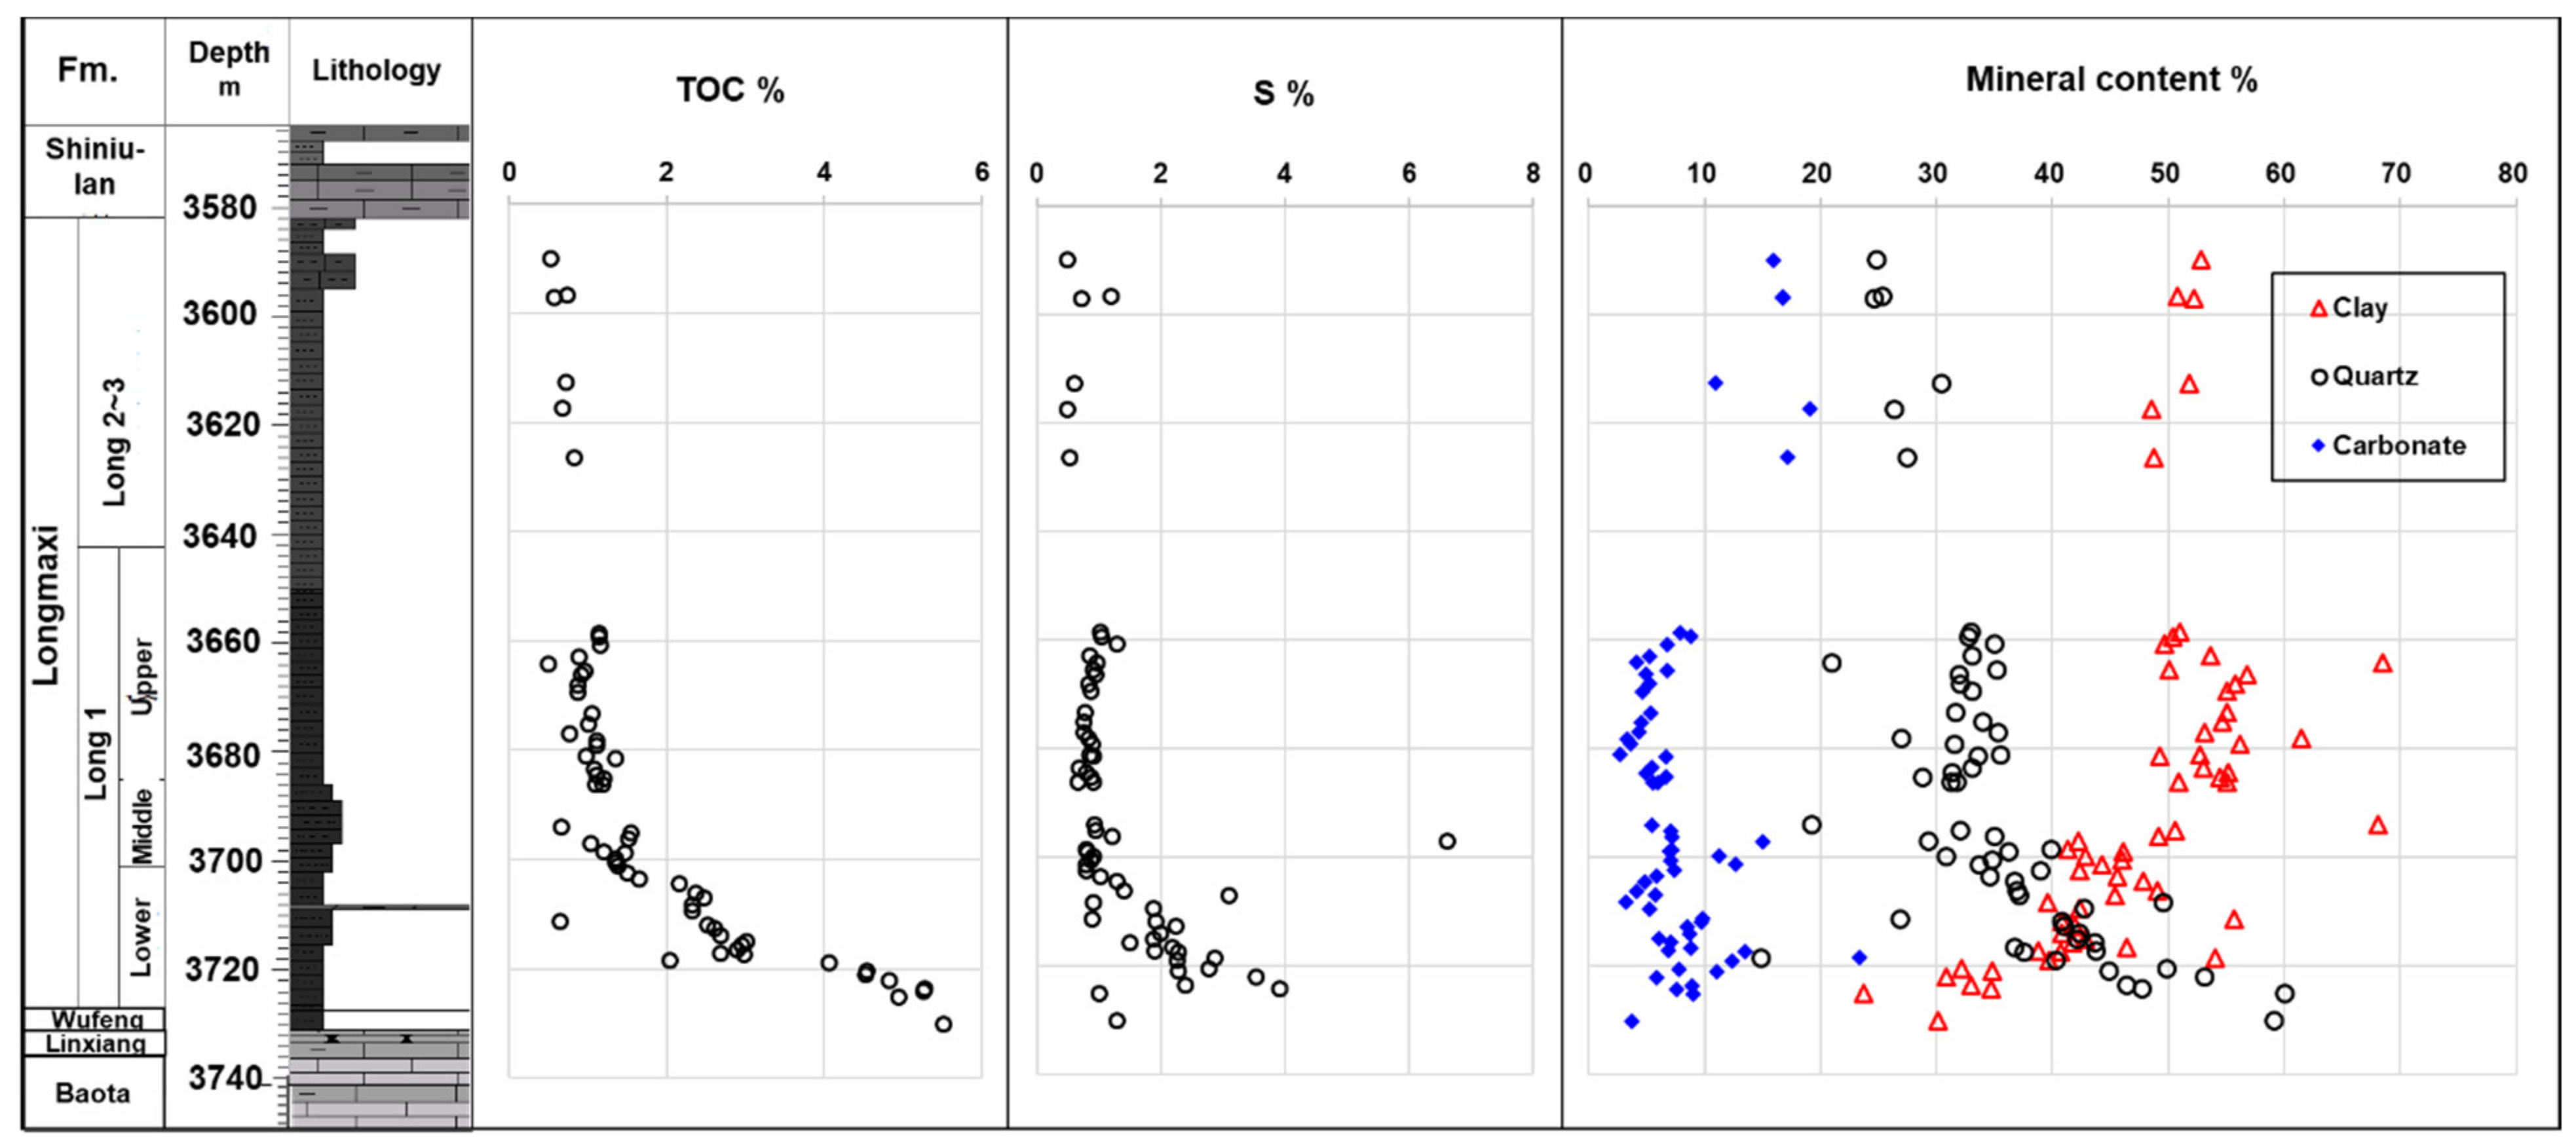
The TOC content of the 63 core samples from Wufeng–-Longmaxi Fm. ranged from 0.51% to 5.52%, with an average value of 1.90% (
Figure 2). The TOC content decreased from the bottom to the top in the Wufeng–Longmaxi Fm. The samples with TOC > 2% were mainly from Wufeng Fm. and the lower part of Long 1 layer, and the depth of TOC > 2% was 27 m, including 10 m for TOC > 4% at the bottom. The TOC of samples from the middle and upper parts of Long 1 layer were between 1% and 2%, while the TOC of samples from Long 2 and Long 3 layers were mainly lower than 1%. Sulfur content ranged from 0.64~6.62%, and showed a similar trend with TOC content along the depth, while the variations were not obvious compared to TOC content (
Figure 2).
The results from XRD analysis showed that mineral compositions were dominated by clay, quartz and carbonate, with the total of these minerals ranging from 85.1~94.1% (
Figure 2). Clay minerals ranged from 28.7~68.5%, averaging 47.4%, and showed an increasing trend from the bottom of Wufeng Fm. to Long 1 layer, and stabilized in Long 2 to 3 layers. Quartz contents were from 14.9% to 60.1%, with an average value of 35.6%, and showed an opposite trend along depths compared to clay mineral compositions. The carbonate contents were almost below 20% (2.7–23.4%), with the contents lower and higher than 10% from the bottom of Wufeng Fm. to Long 1 layer and Long 2–3 layers, respectively.
4.2. Petrographical Observations and Morphologies of Organic Matter
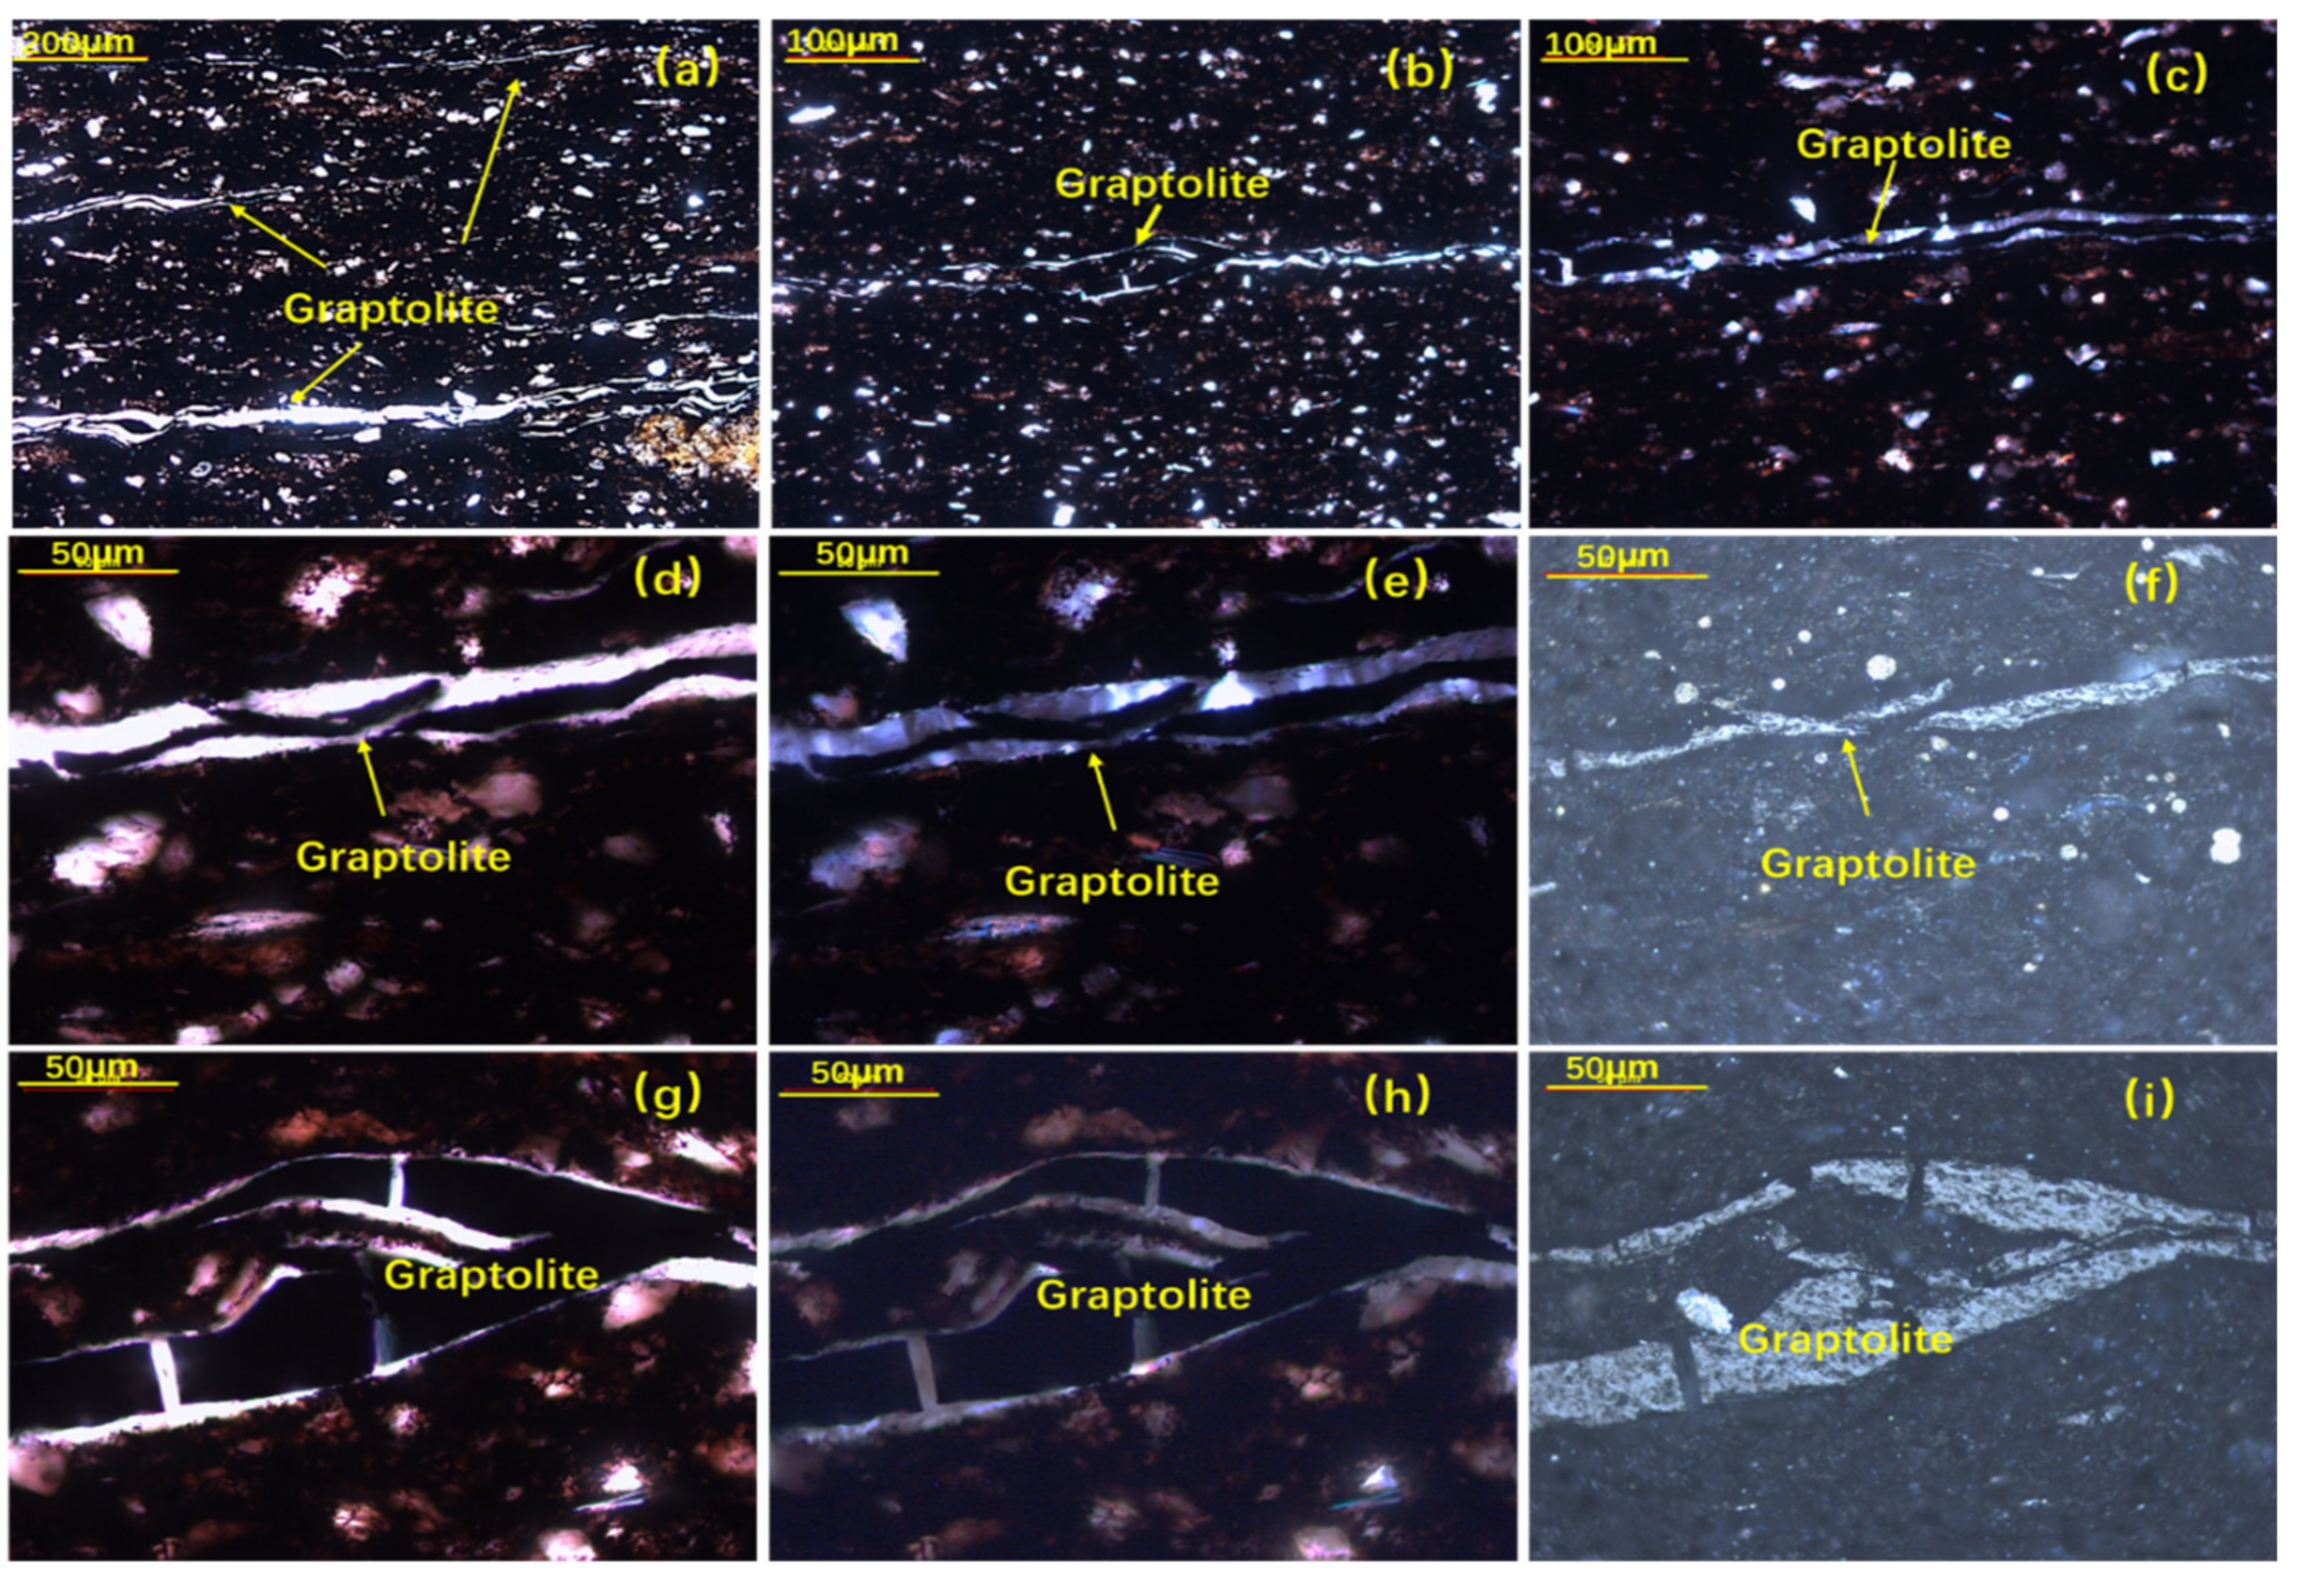
The organic matter compositions have been observed under microscope. The organic matter, except graptolite, has been degraded and most organisms were amorphous organic matter (AOM) in the Wufeng and Longmaxi shales. Graptolite, a type of zooplankton, widely distributes in the shale interval (
Figure 3). Graptolite normally developed along the bedding, with the outer layer of graptolite showing silicification chalcedony (
Figure 4e,h). The inside of the graptolite is pure carbon under reflect light (
Figure 4f,i).
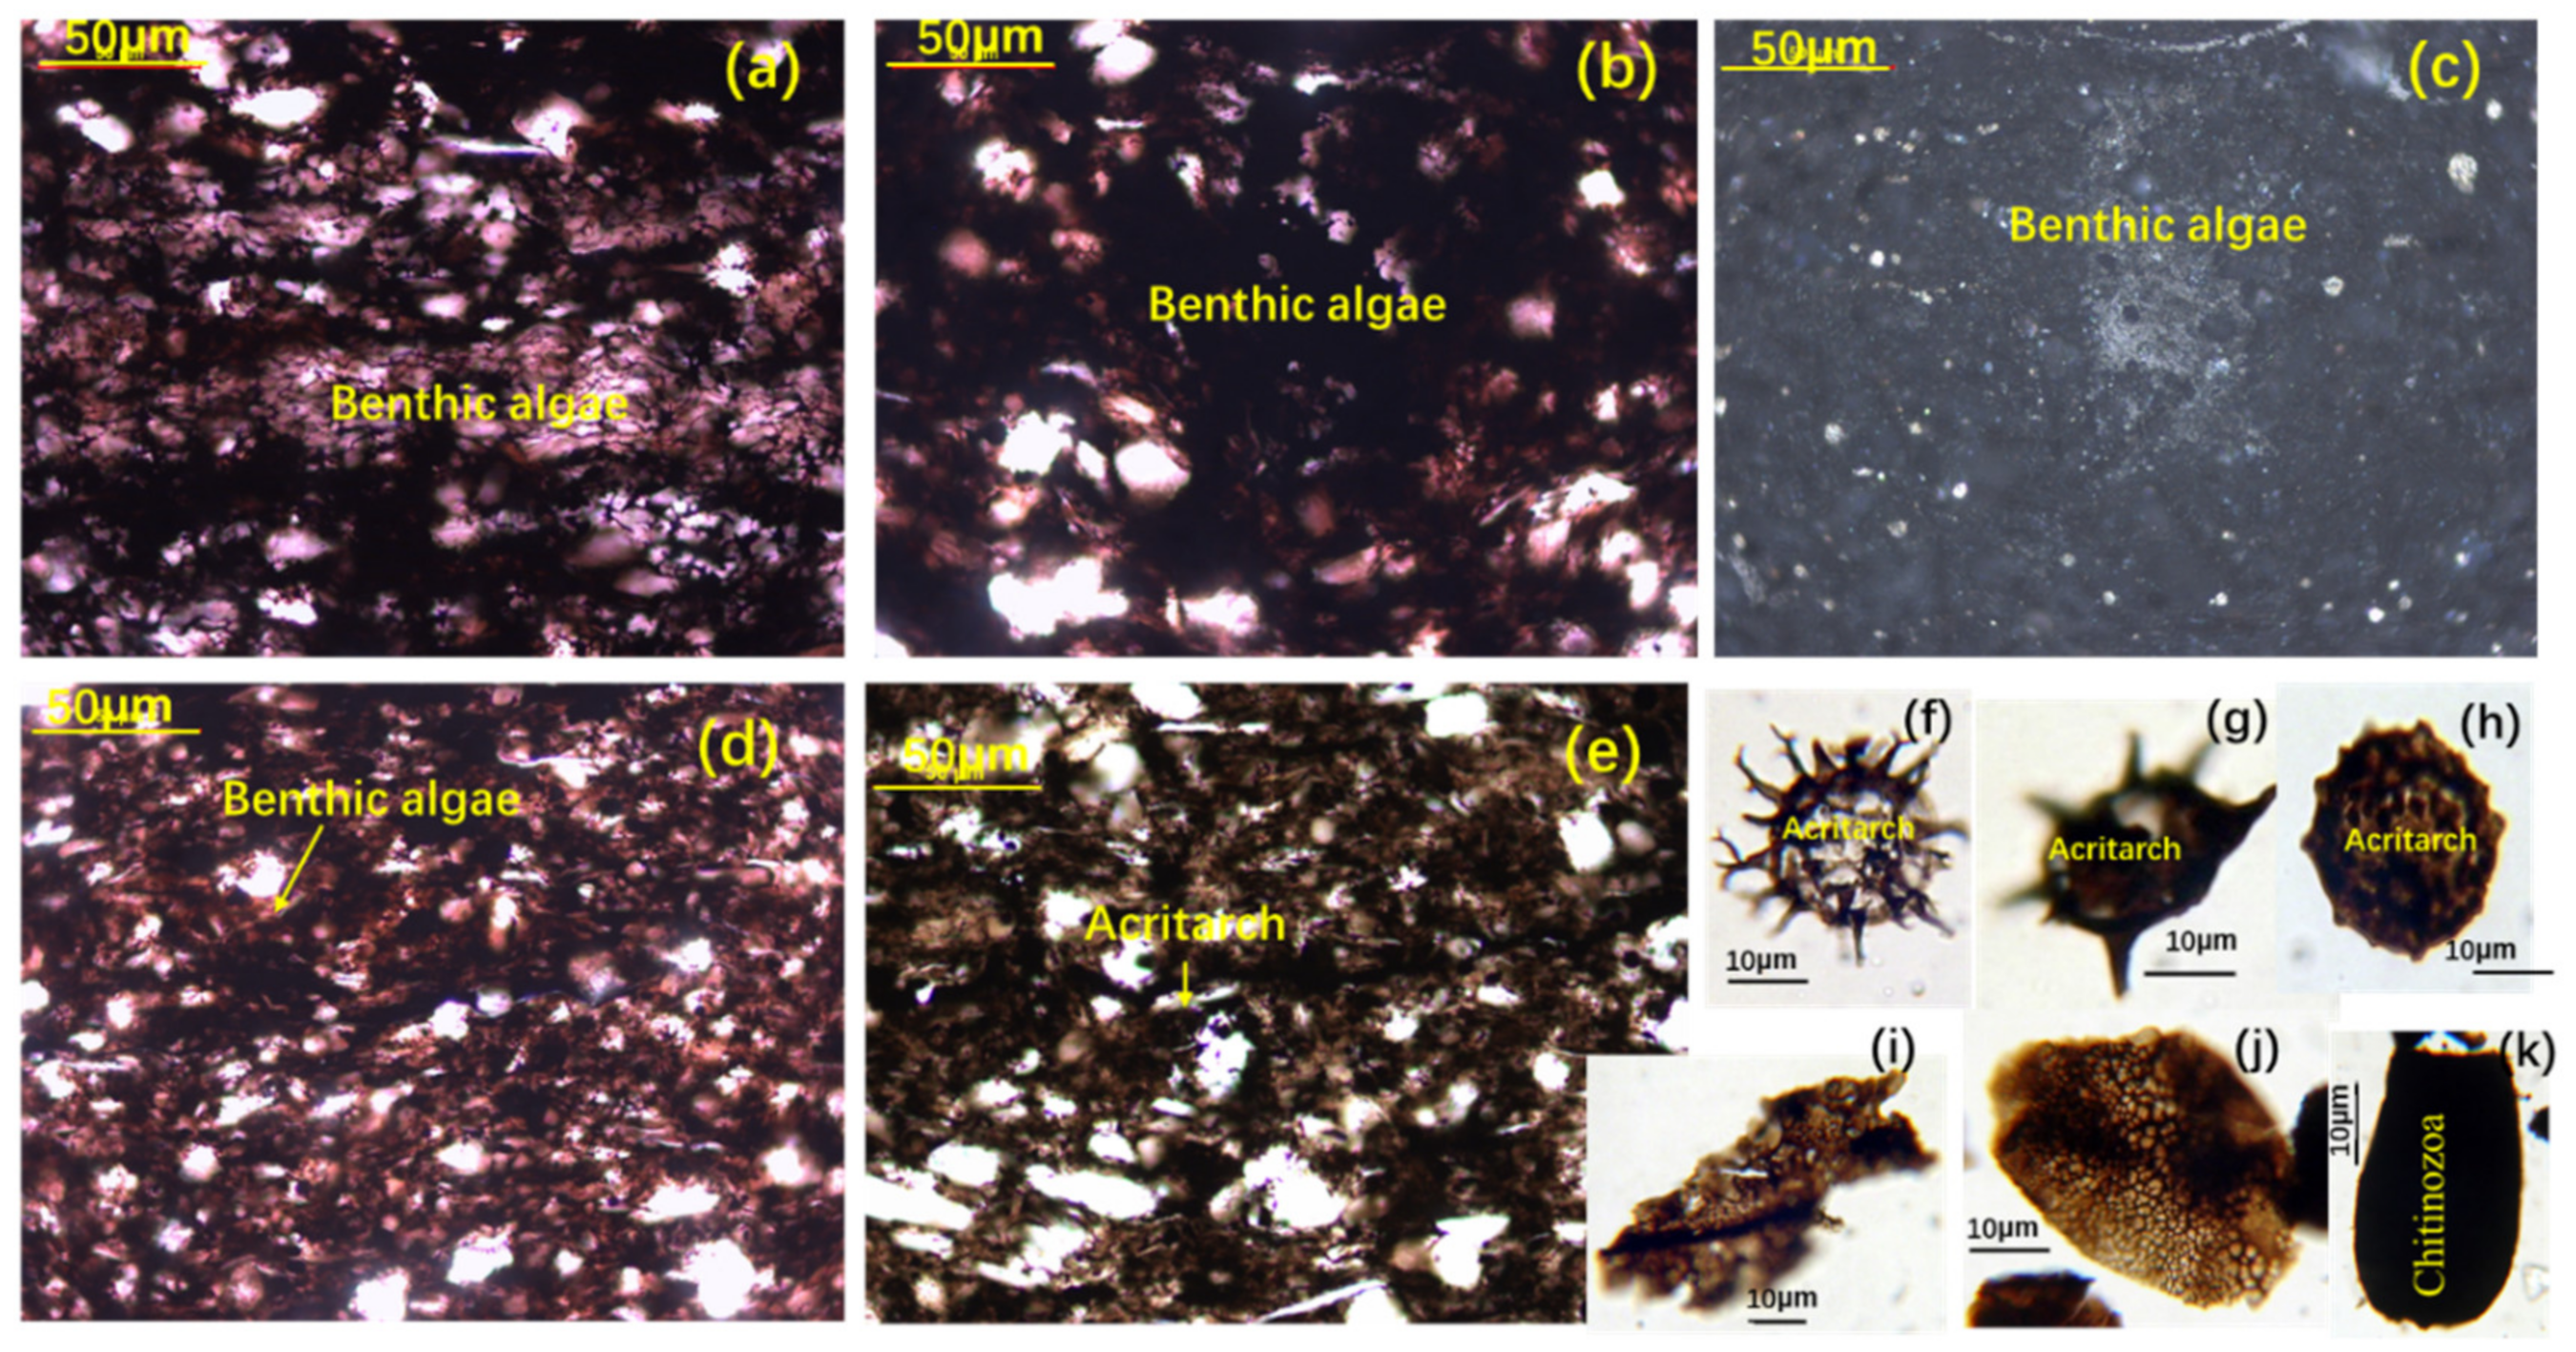
The algae structure which could be identified was the debris of benthic algae (
Figure 4a–d) and some acritarch in the rocks (
Figure 4e). More acritarchs (
Figure 4f–h), benthic algae (
Figure 4i,j) and some chitinozoa (
Figure 4k) were observed in the isolated kerogen. Benthic algae were identified according to the multicellular algal structure. They were difficult for classifying because of bad preserved structural algae, but were found with some debris (mainly thallus fragments).
Acritarchs were unicellular organisms with polyphyletic groups, mainly found in marine sedimentary systems [
17,
26]. The morphology of acritarchs showed strong resistant organic membranes, and the majority are likely the cysts of extinct eukaryote algae [
17,
31]. Therefore, the acritarchs were classified as the planktonic algae type in this study. Acritarchs, including species
Multiplicisphaeridium sp (f),
Goniosphaeridium sp (g) and
Buedingiisphaeridium sp (h), were found mainly in Wufeng Formation, while no acritarchs were detected in both rocks and isolated kerogen fractions.
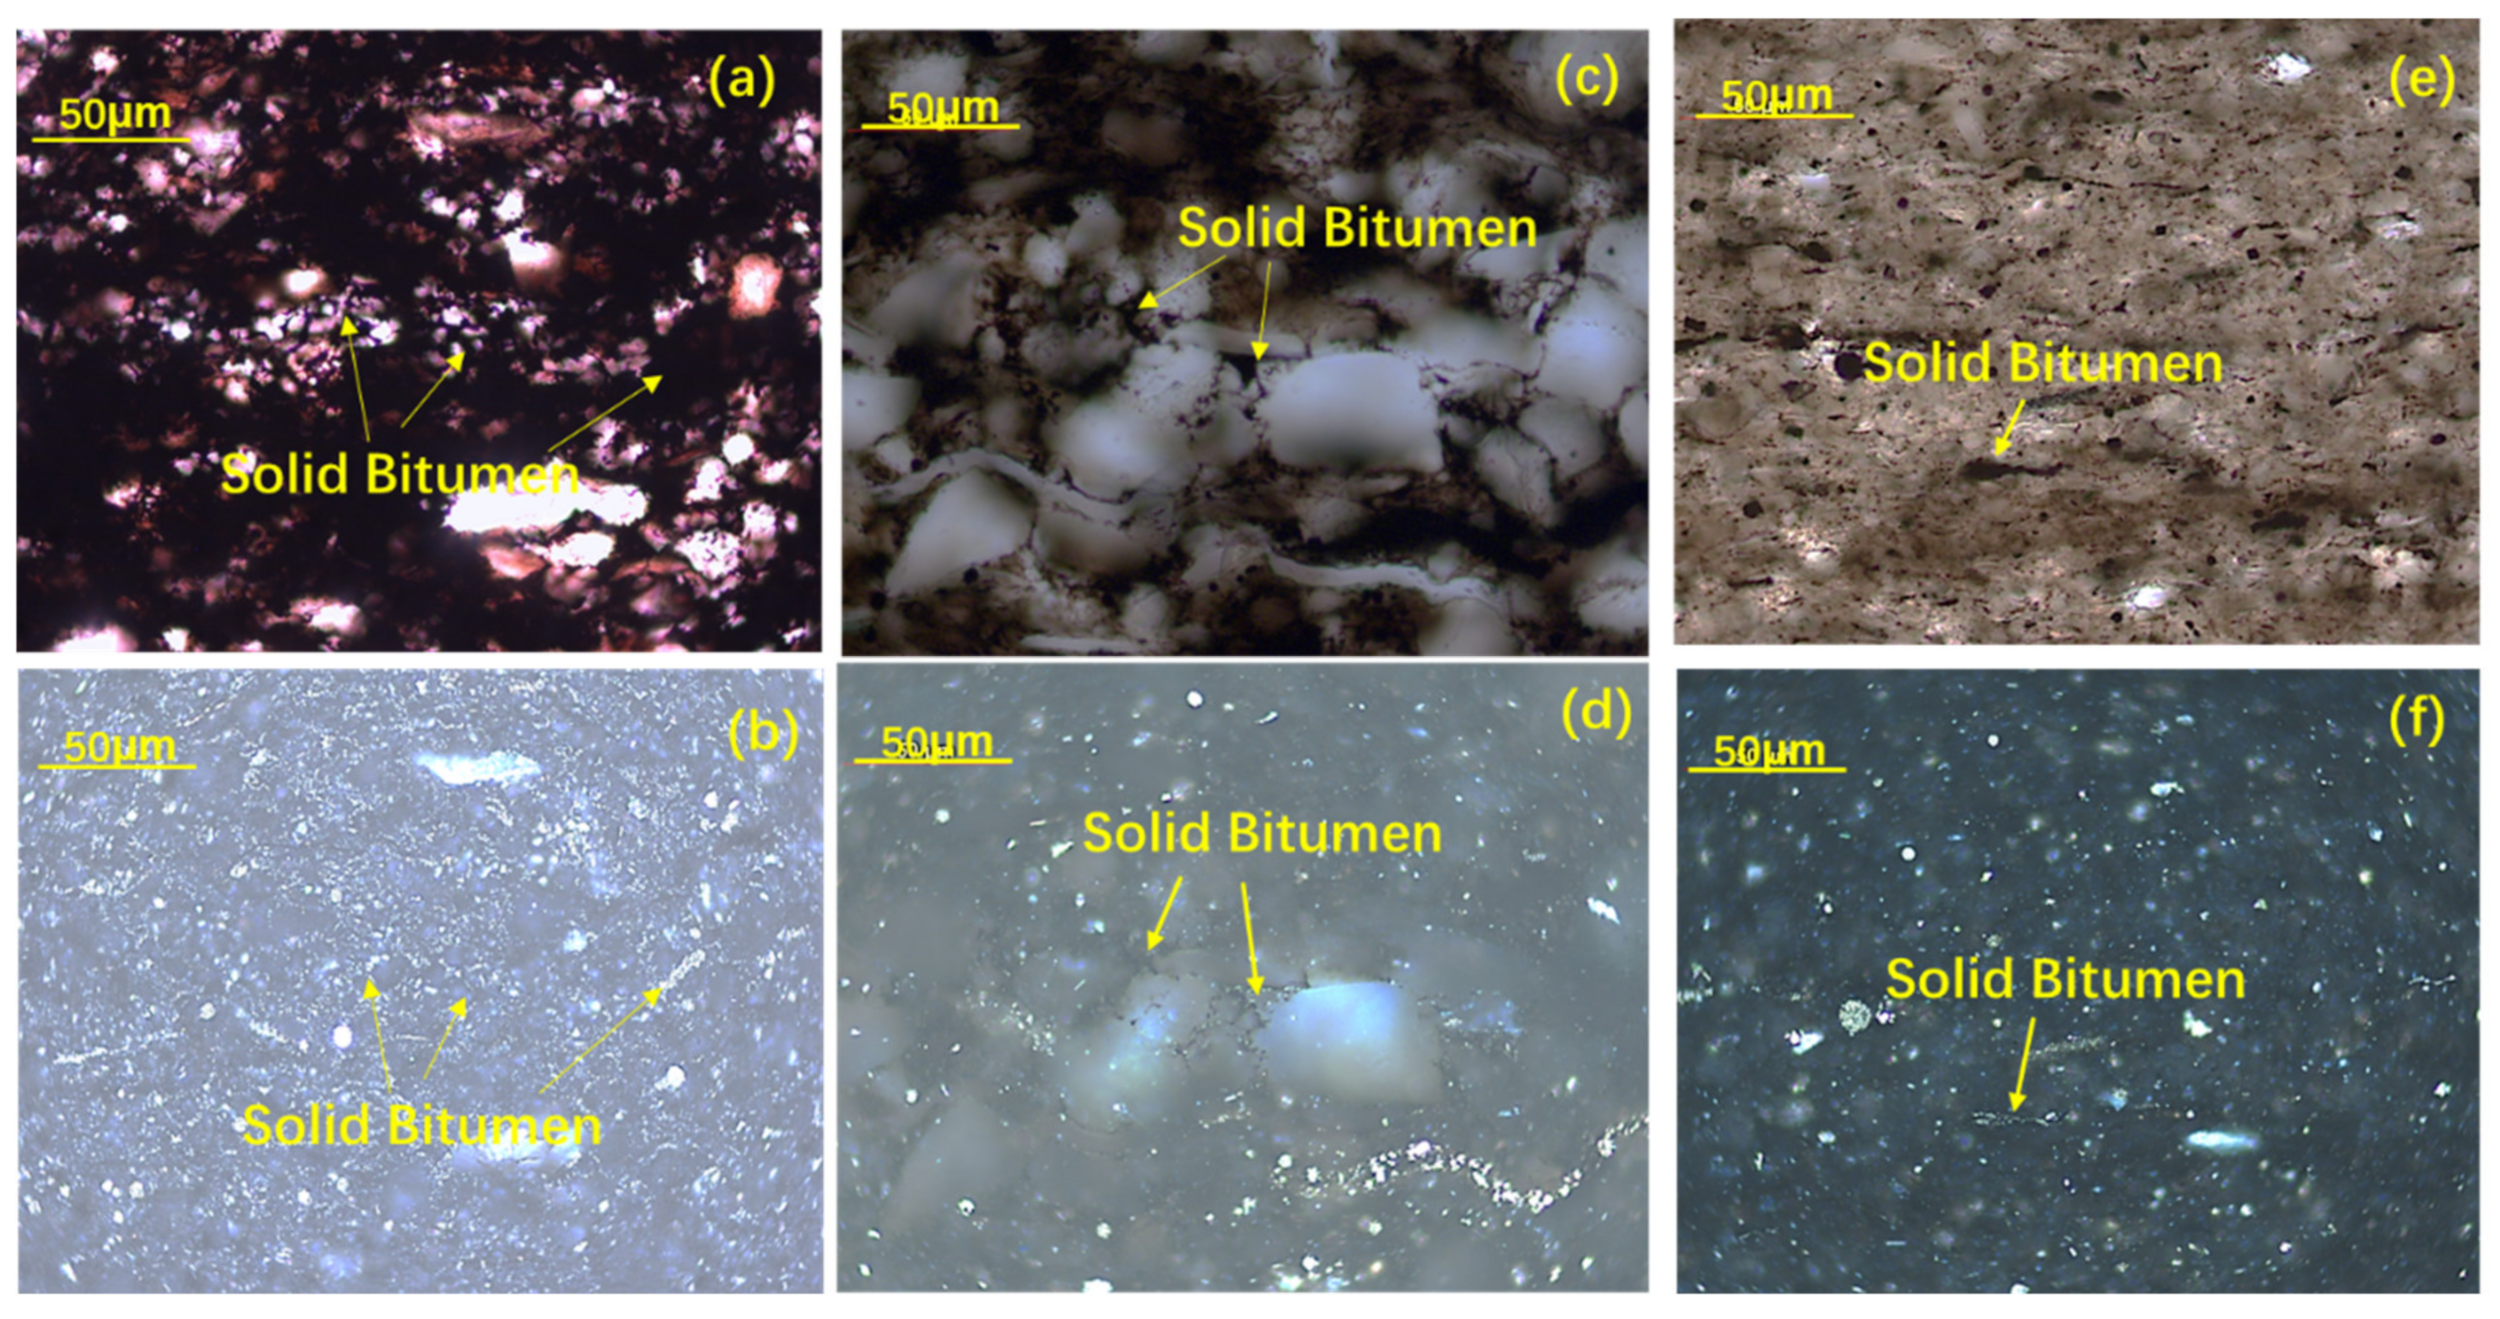
Solid bitumen, which was observed to fill in the pores (
Figure 5a–d) and micro-fractures (
Figure 5e,f), was widely developed in the shales, which suggested oil charges in the geological history.
4.3. Helium Porosity and Low Pressure N2 Adsorption
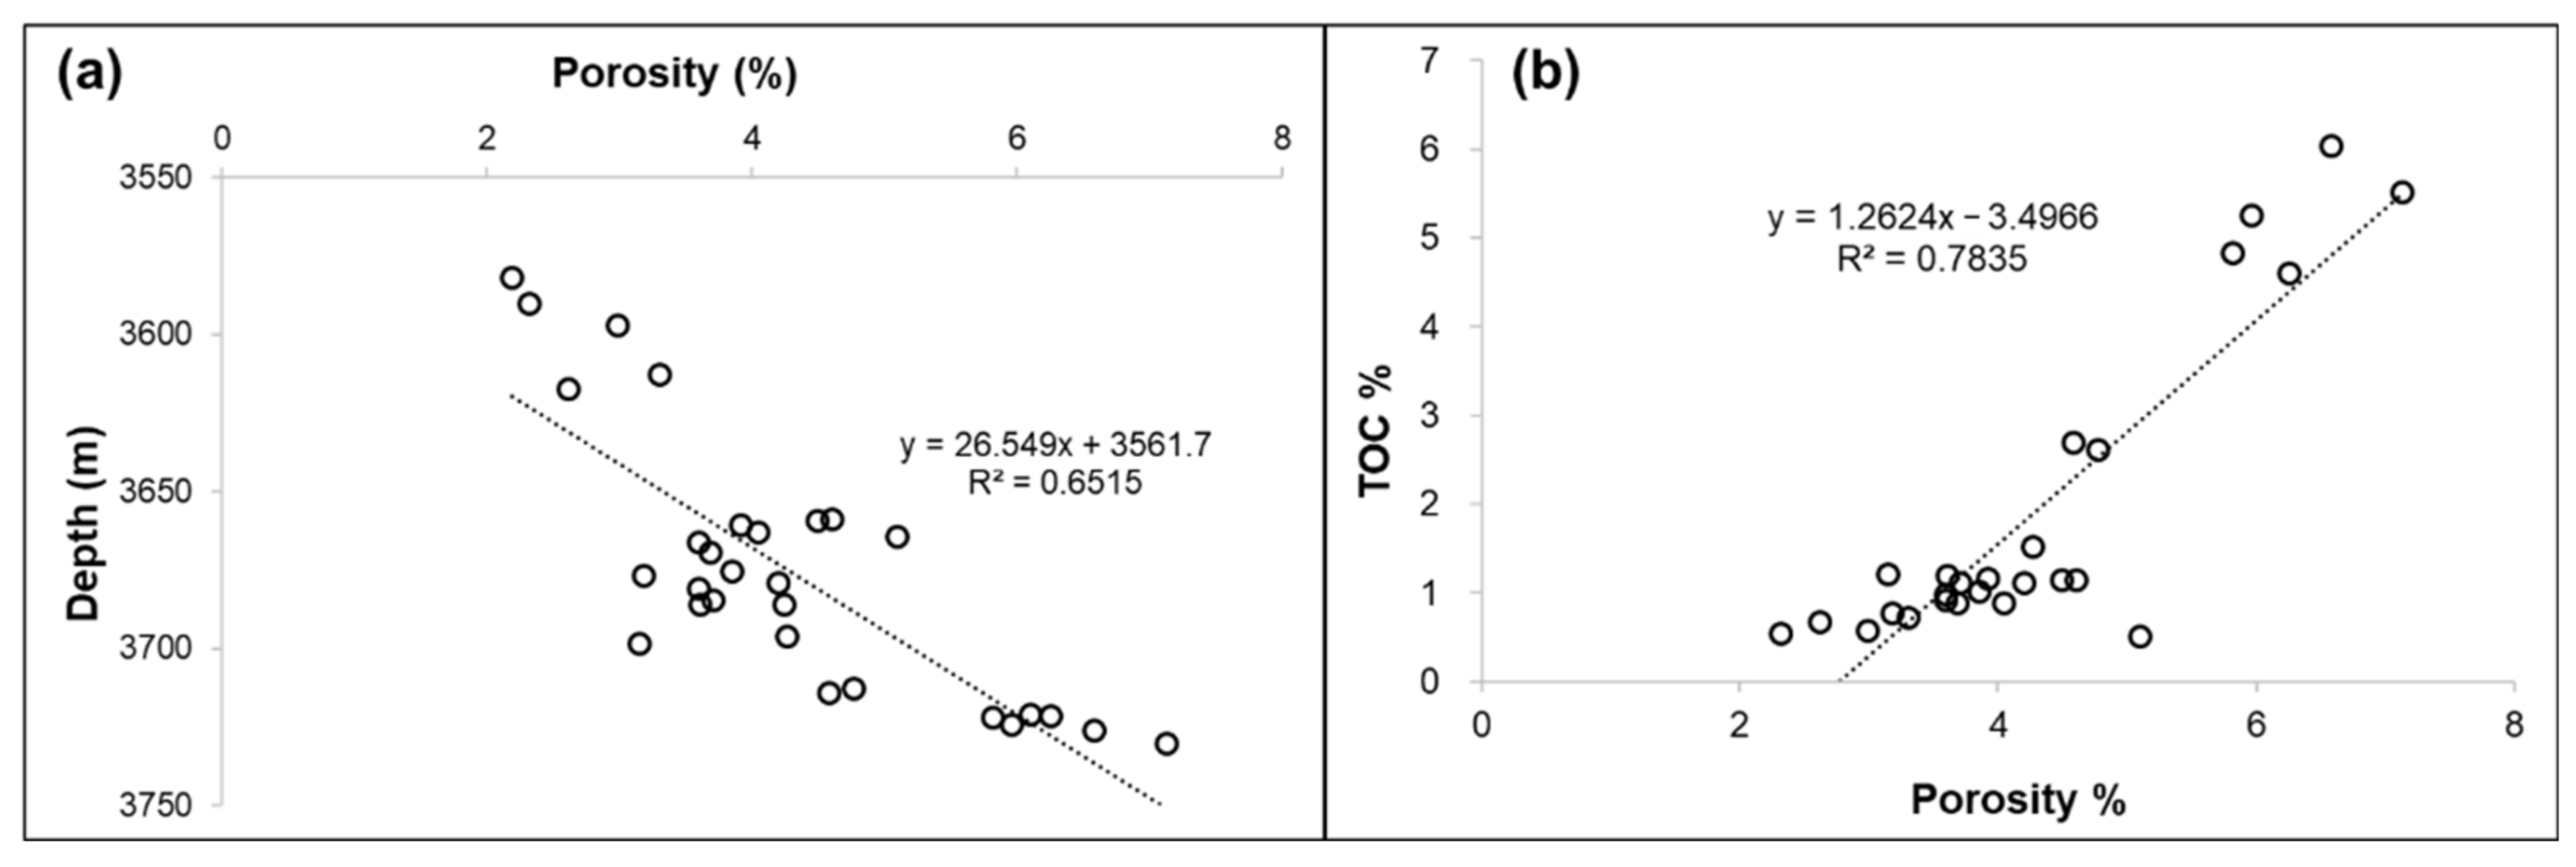
Pore development is one of the key factors for shale gas resources. The helium porosities of the Wufeng–Longmaxi shales were from 2.19% to 7.13% (average porosity 4.26%) increasing with depth (
Figure 6a). Pore developments in this shale gas system have been studied by many researchers [
3,
4,
29,
32,
33,
34,
35,
36]. The pores detected were OM-hosted pore, intergranular pore and intragranular pore, among which OM-hosted pores were predominant in this shale gas system [
35]. The porosities of samples from Well A showed a strong positive relationship with TOC content (R
2 = 0.78) (
Figure 6b), suggesting that organic pores were an important part of the gas shale reservoir in Well A.
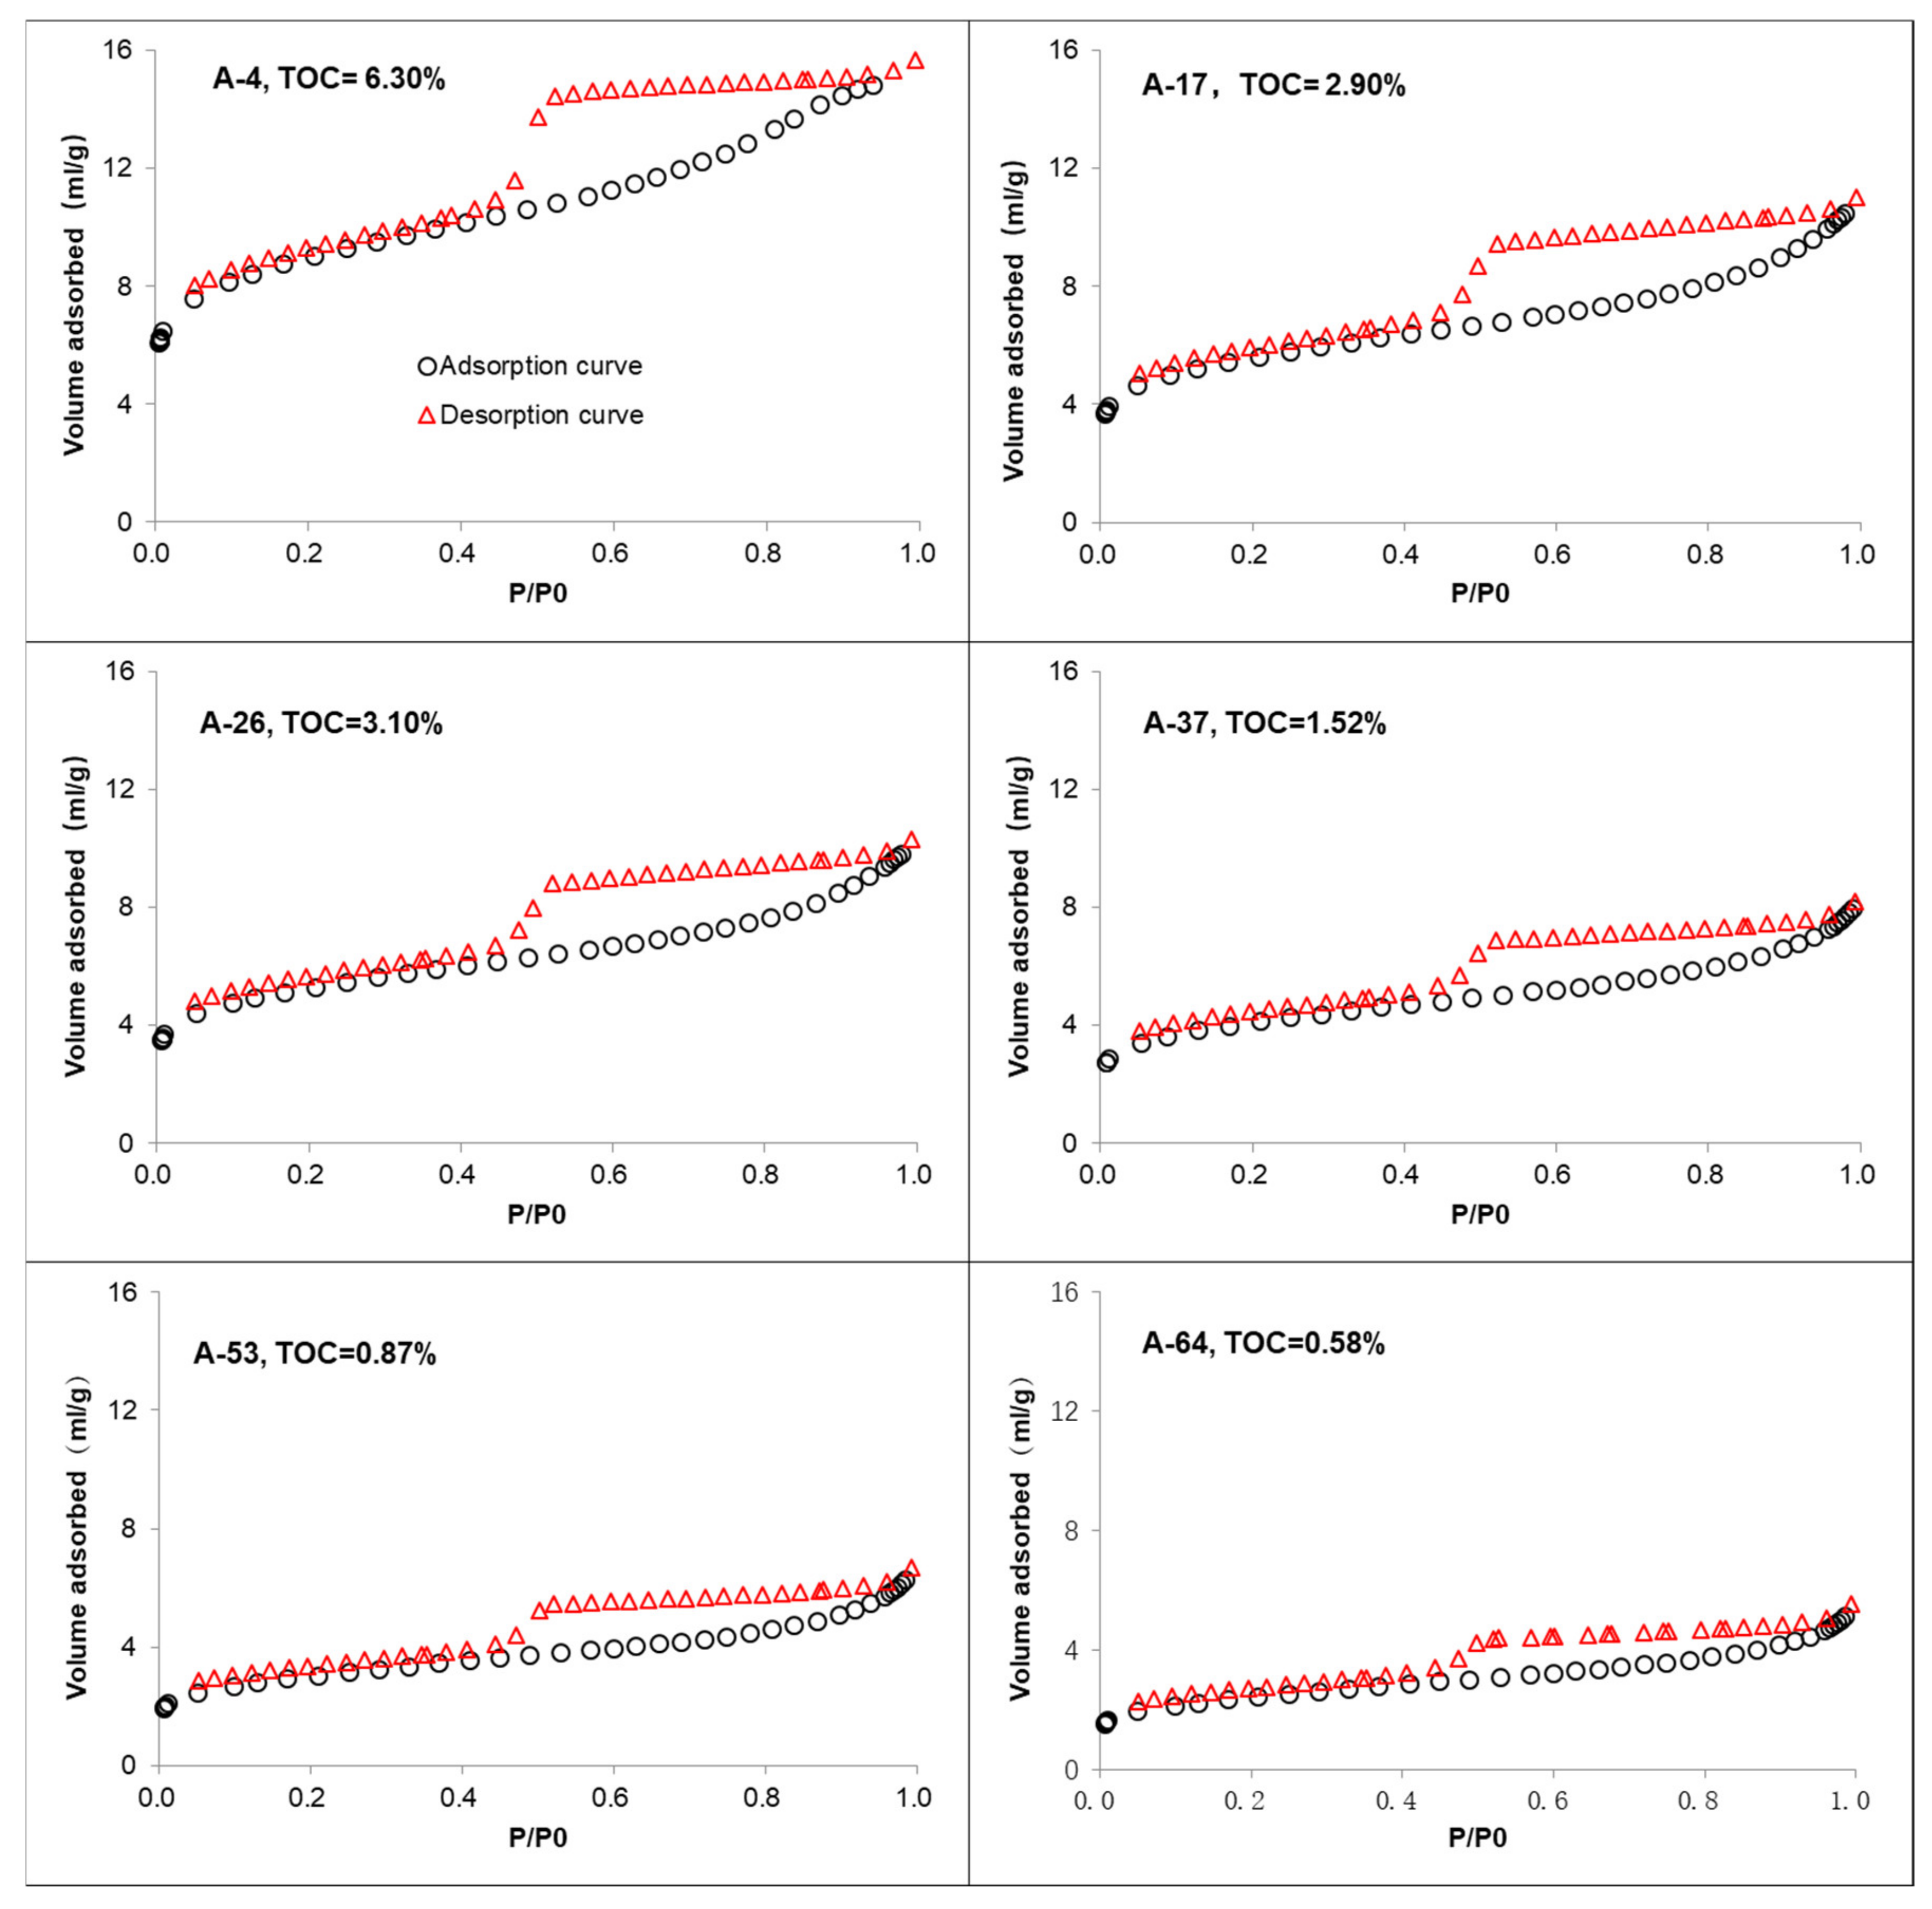
The results from low-pressure N
2 adsorption–desorption isotherms illustrated similar type in all studied samples, and adsorbed volume decreased with TOC content (
Figure 7). Compared to the results from Wufeng–Longmaxi intervals from Well YY1 in Guizhou province [
3], the quantity adsorbed volumes were much less in the study samples than those in Well YY1. The specific surface area ranged from 8.20 to 30.16 m
2/g, with an average value of 14.75 m
2/g. The total pore volumes (including micropores < 2 nm, mesopores 2~50 nm and macropores > 50 nm) were 0.010~0.033 mL/g, averaging 0.017 mL/g. The relative amounts of these pores showed that mesopores were predominant (50.3–62.2%), followed by micropores with a percentage of 31.2–44.2%.
5. Discussion
5.1. The Quantitative Organic Matter Compositions
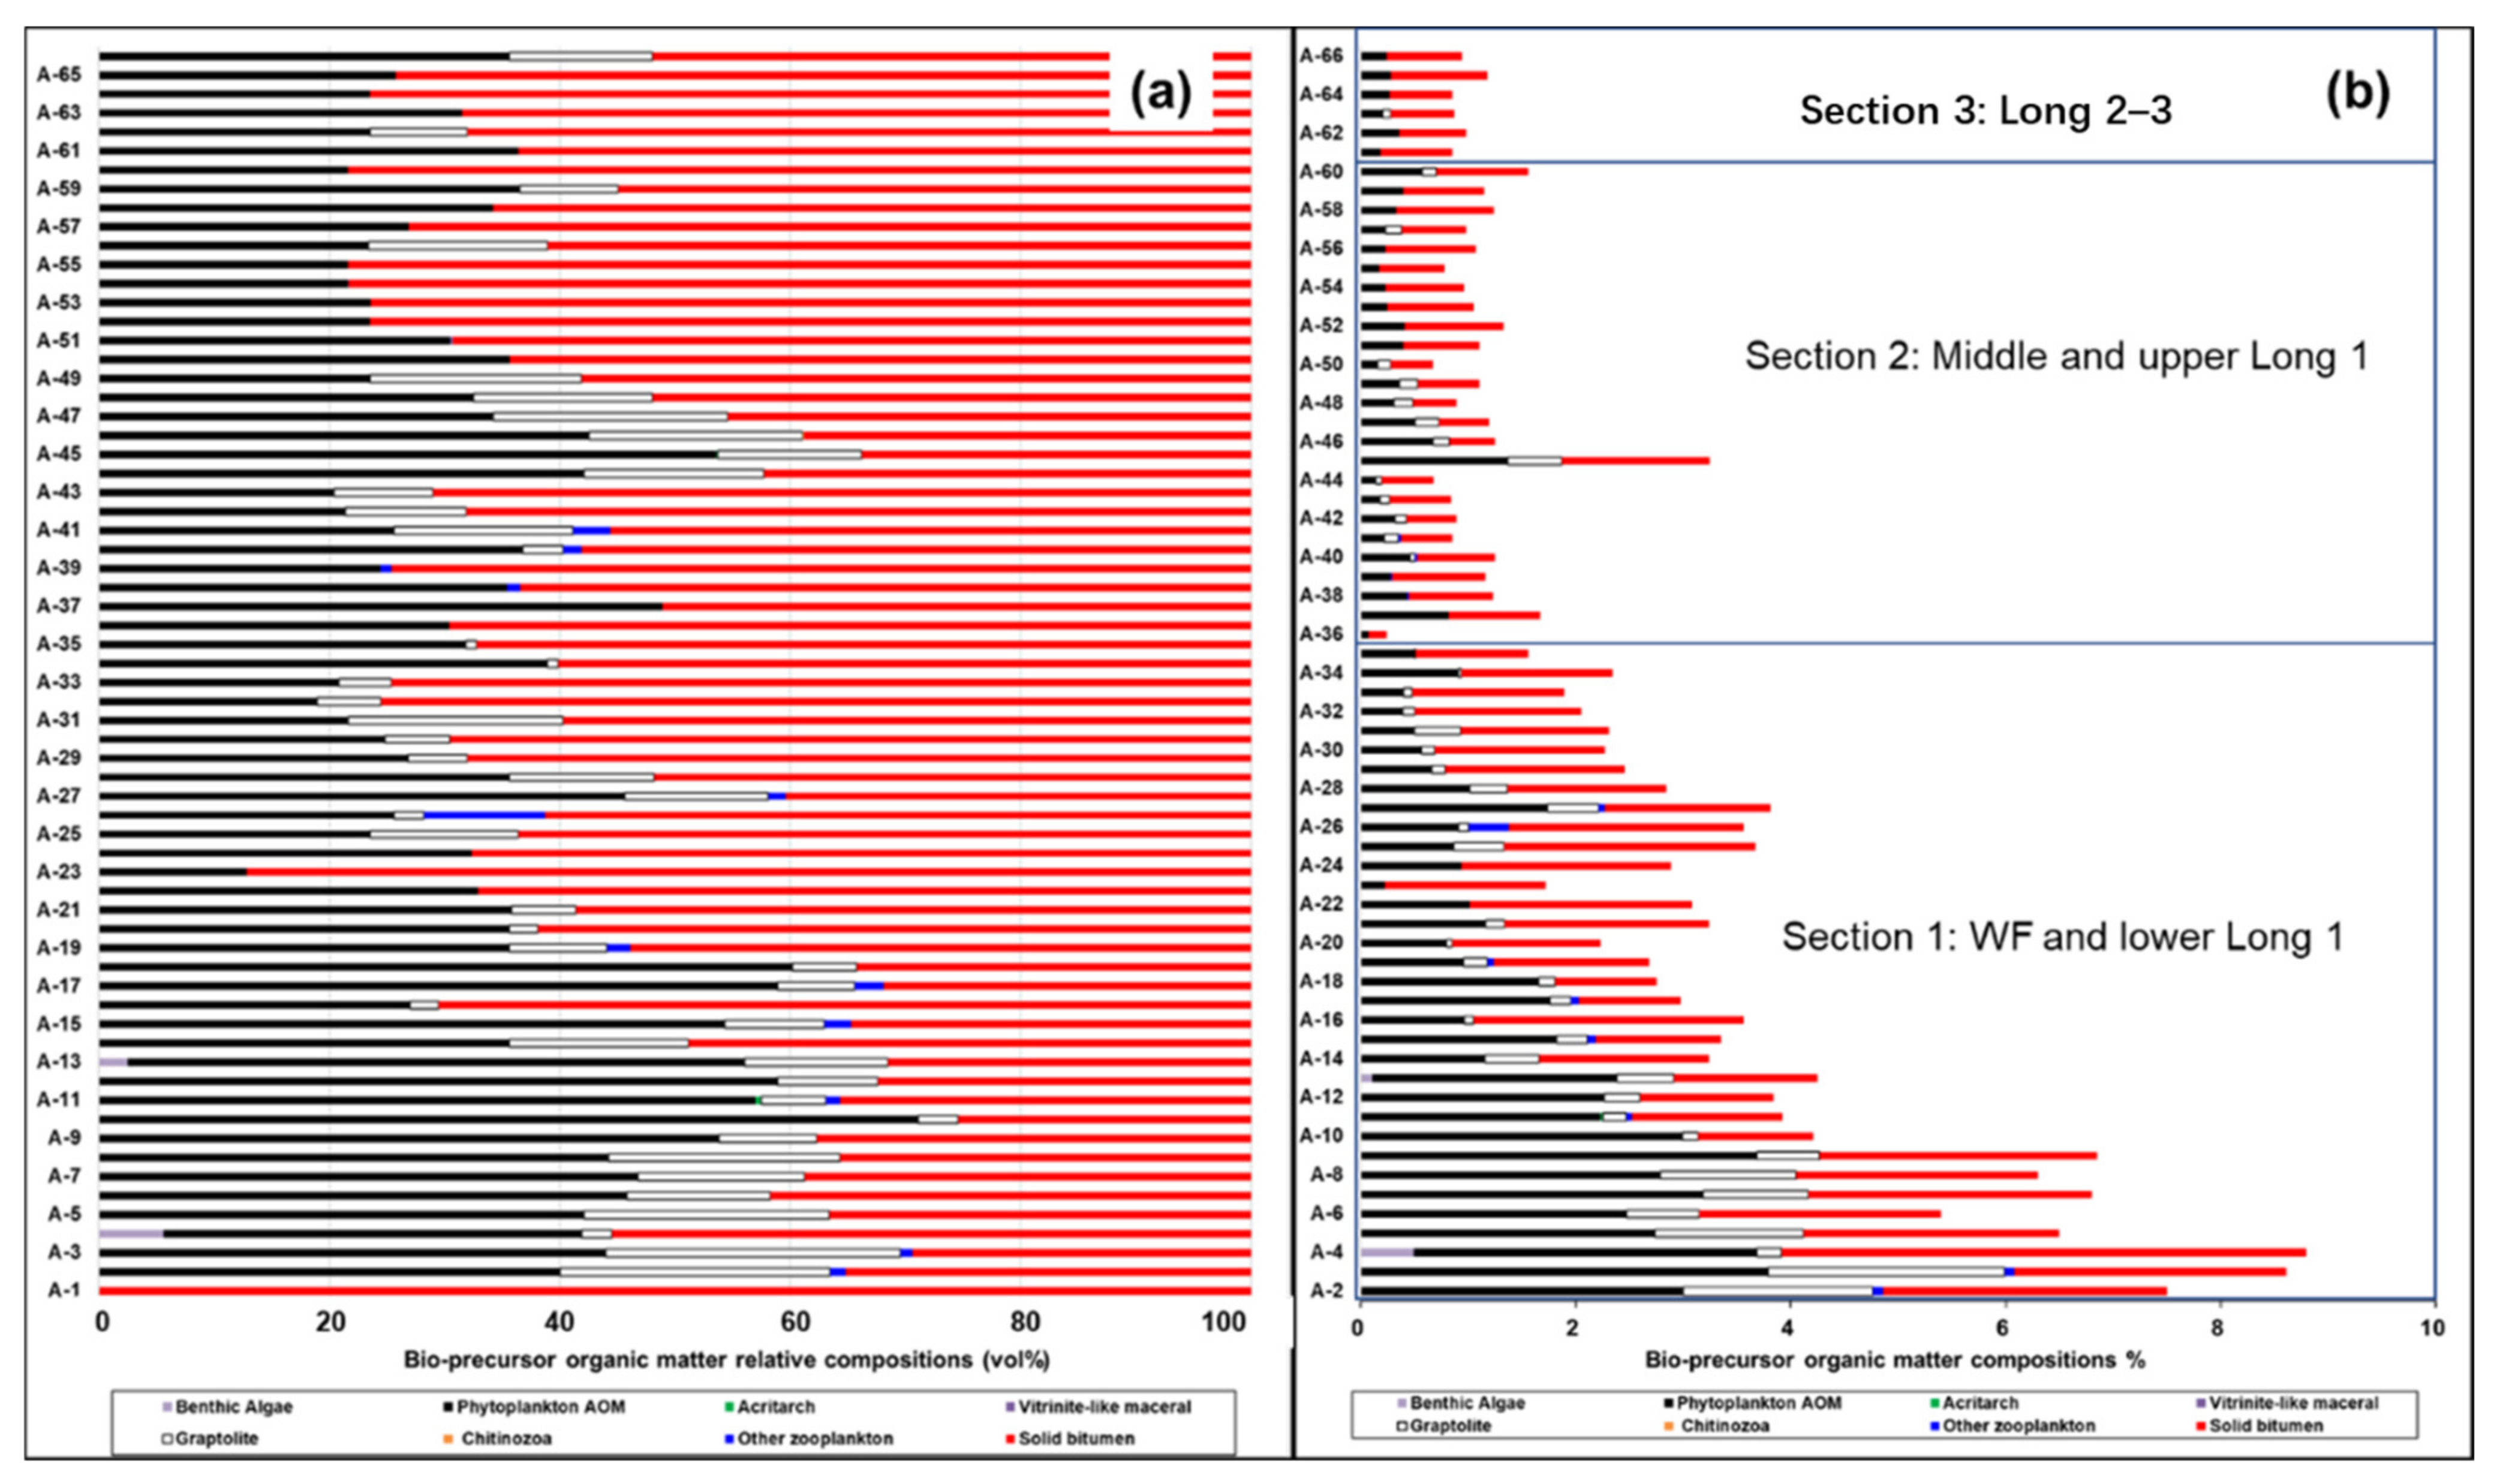
The statistic evaluation of organic matter composition by the organic petrology method provided the semi-quantitative values. According to the statistical analysis results of bio-precursor organic matter, the organic matter in the Wufeng–Longmaxi shales was predominantly amorphous organic matter (AOM), graptolite and solid bitumen. The relative contents of these organic matters comprised more than 90% (
Figure 8a). AOM mainly derived from the degradation products of cyanobacteria, unicellular planktonic algae and other microbes [
37,
38,
39].
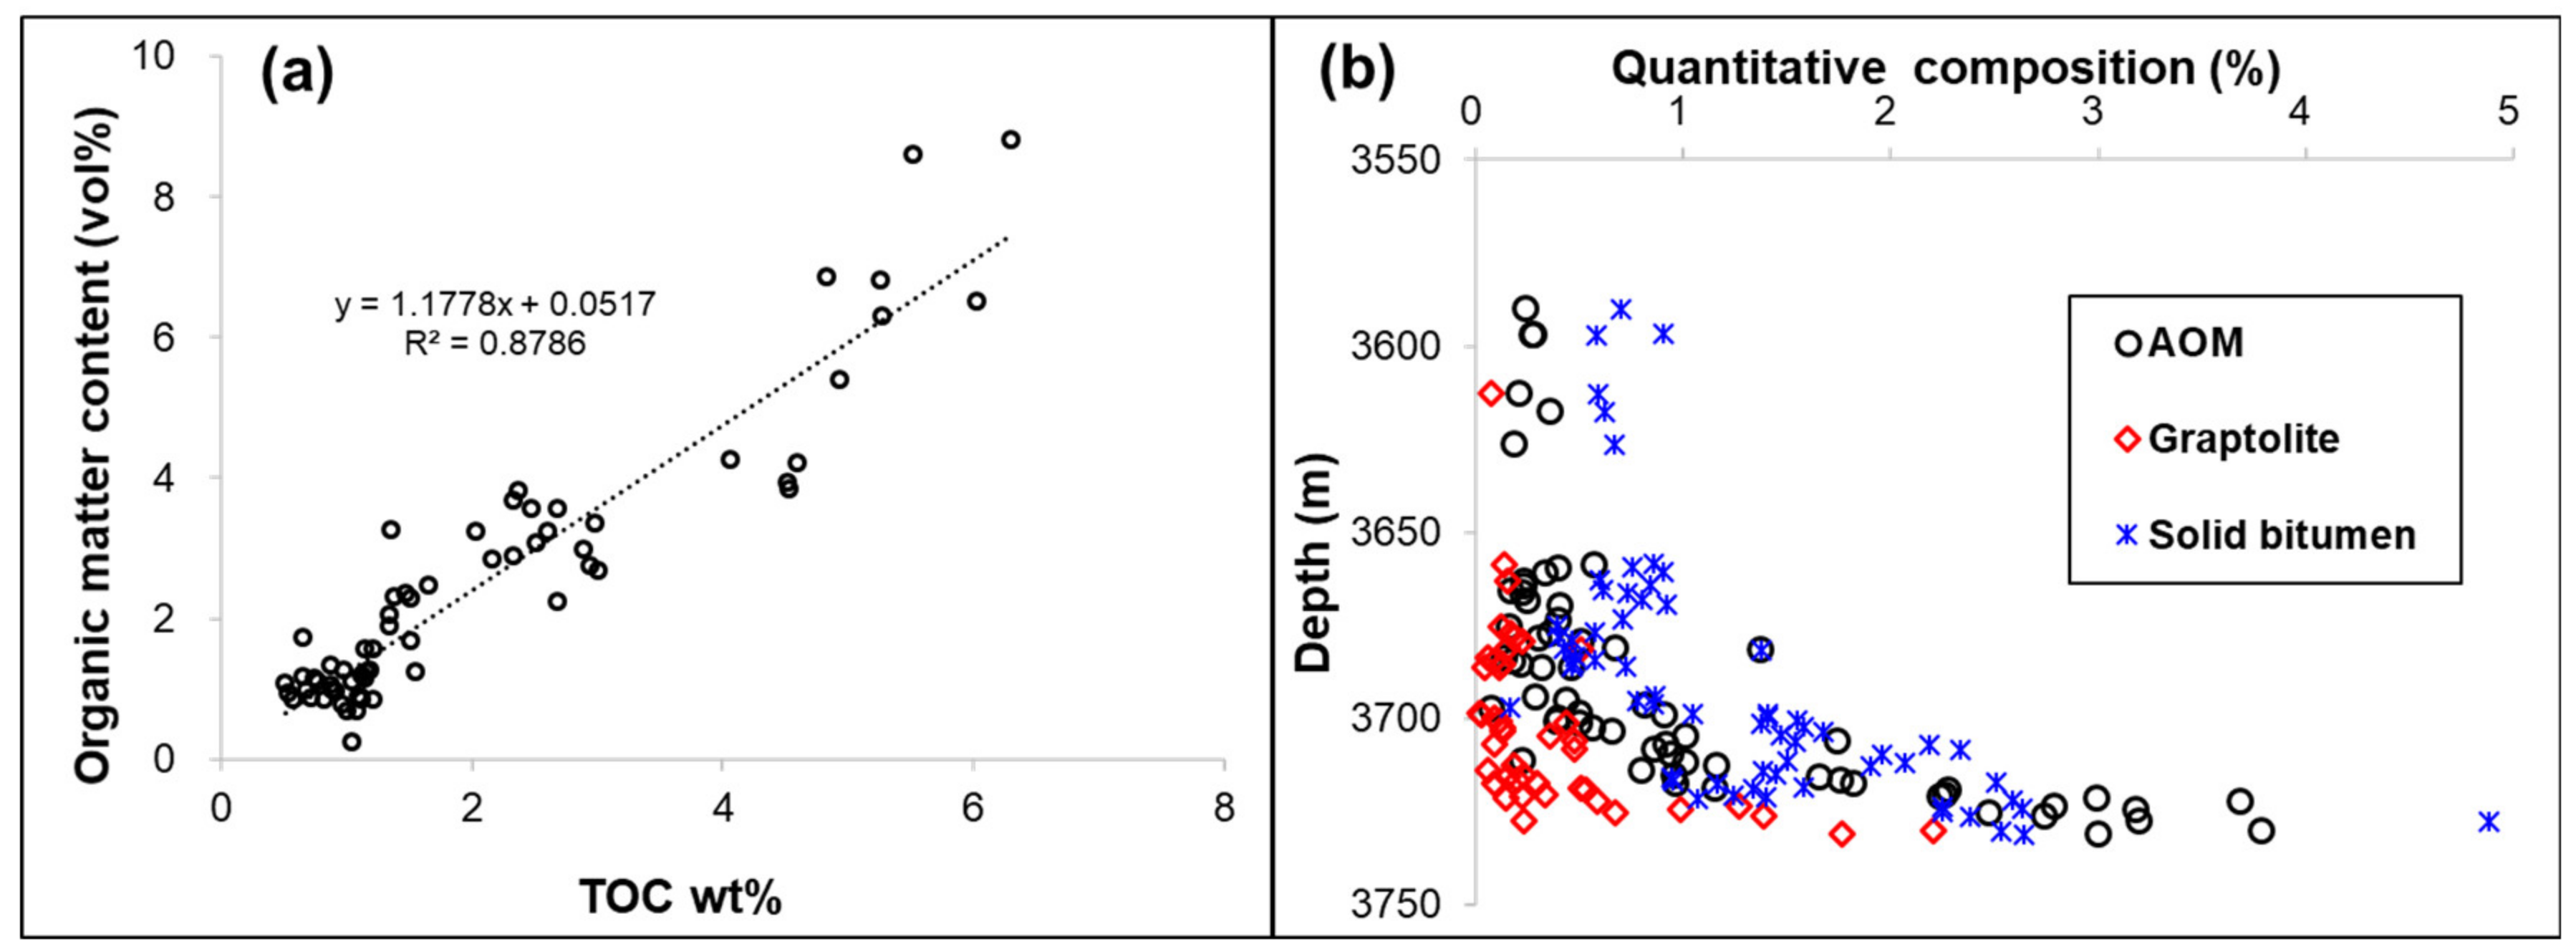
The plots of TOC and organic matter content (OMC) measured under microscope showed a strong positive relationship (R
2 = 0.8786,
Figure 9a), suggesting that the statistical analysis of organic matter content was effective. Based on the results of organic matter content, quantitative organic matter composition (QC) can be calculated by the relative composition percentage multiplied by the OMC values. The calculated QC results are shown in
Figure 8b. The quantitative AOM, graptolite and solid bitumen were enriched in the Wufeng Fm. and Long 1 of Longmaxi Fm, with the quantitative content decreasing upwards gradually. The results were not inconsistent with the study by Zhang et al. (2020) [
24], and it was because they focused on the well-preserved organic matter, while we analyzed all organic matter compositions. In addition, they obtained the organic matter composition by statistical analysis from isolated kerogen, with the solid bitumen being hard to identify from other organic matter. The three sections can be divided according to quantitative organic matter composition (
Figure 8b): (1)
Section 1 included Wufeng Fm. (3725–3731 m) and lower Long 1 part (3700–3725 m). The organic matter content was highest compared to the other two sections, and the quantitative AOM and graptolite decreased upwards, while the solid bitumen content remained stable in this section. (2)
Section 2 included middle and upper Long 1 part (3640–3700 m). The organic matter content fell in between that in
Section 1 and
Section 3, while the graptolite content in this section was much lower than in
Section 1. The quantitative AOM and solid bitumen showed no obvious variation, with the content of solid bitumen higher than the AOM content. (3)
Section 3 included Long 2 to Long 3 layers. The organic matter contents were lowest among these three sections, with graptolite low in this section. The AOM content was marginally higher than the solid bitumen or graptolite content at the bottom of
Section 1, and the content of solid bitumen was predominant in other sections (
Figure 9b), suggesting that the shale gas was mainly from oil cracking.
5.2. The Evidence and Amounts of Migrated Solid Bitumen at the Bottom of Wufeng Fm
Solid bitumen was widely developed in Wufeng–Longmaxi Fm. [
10,
14,
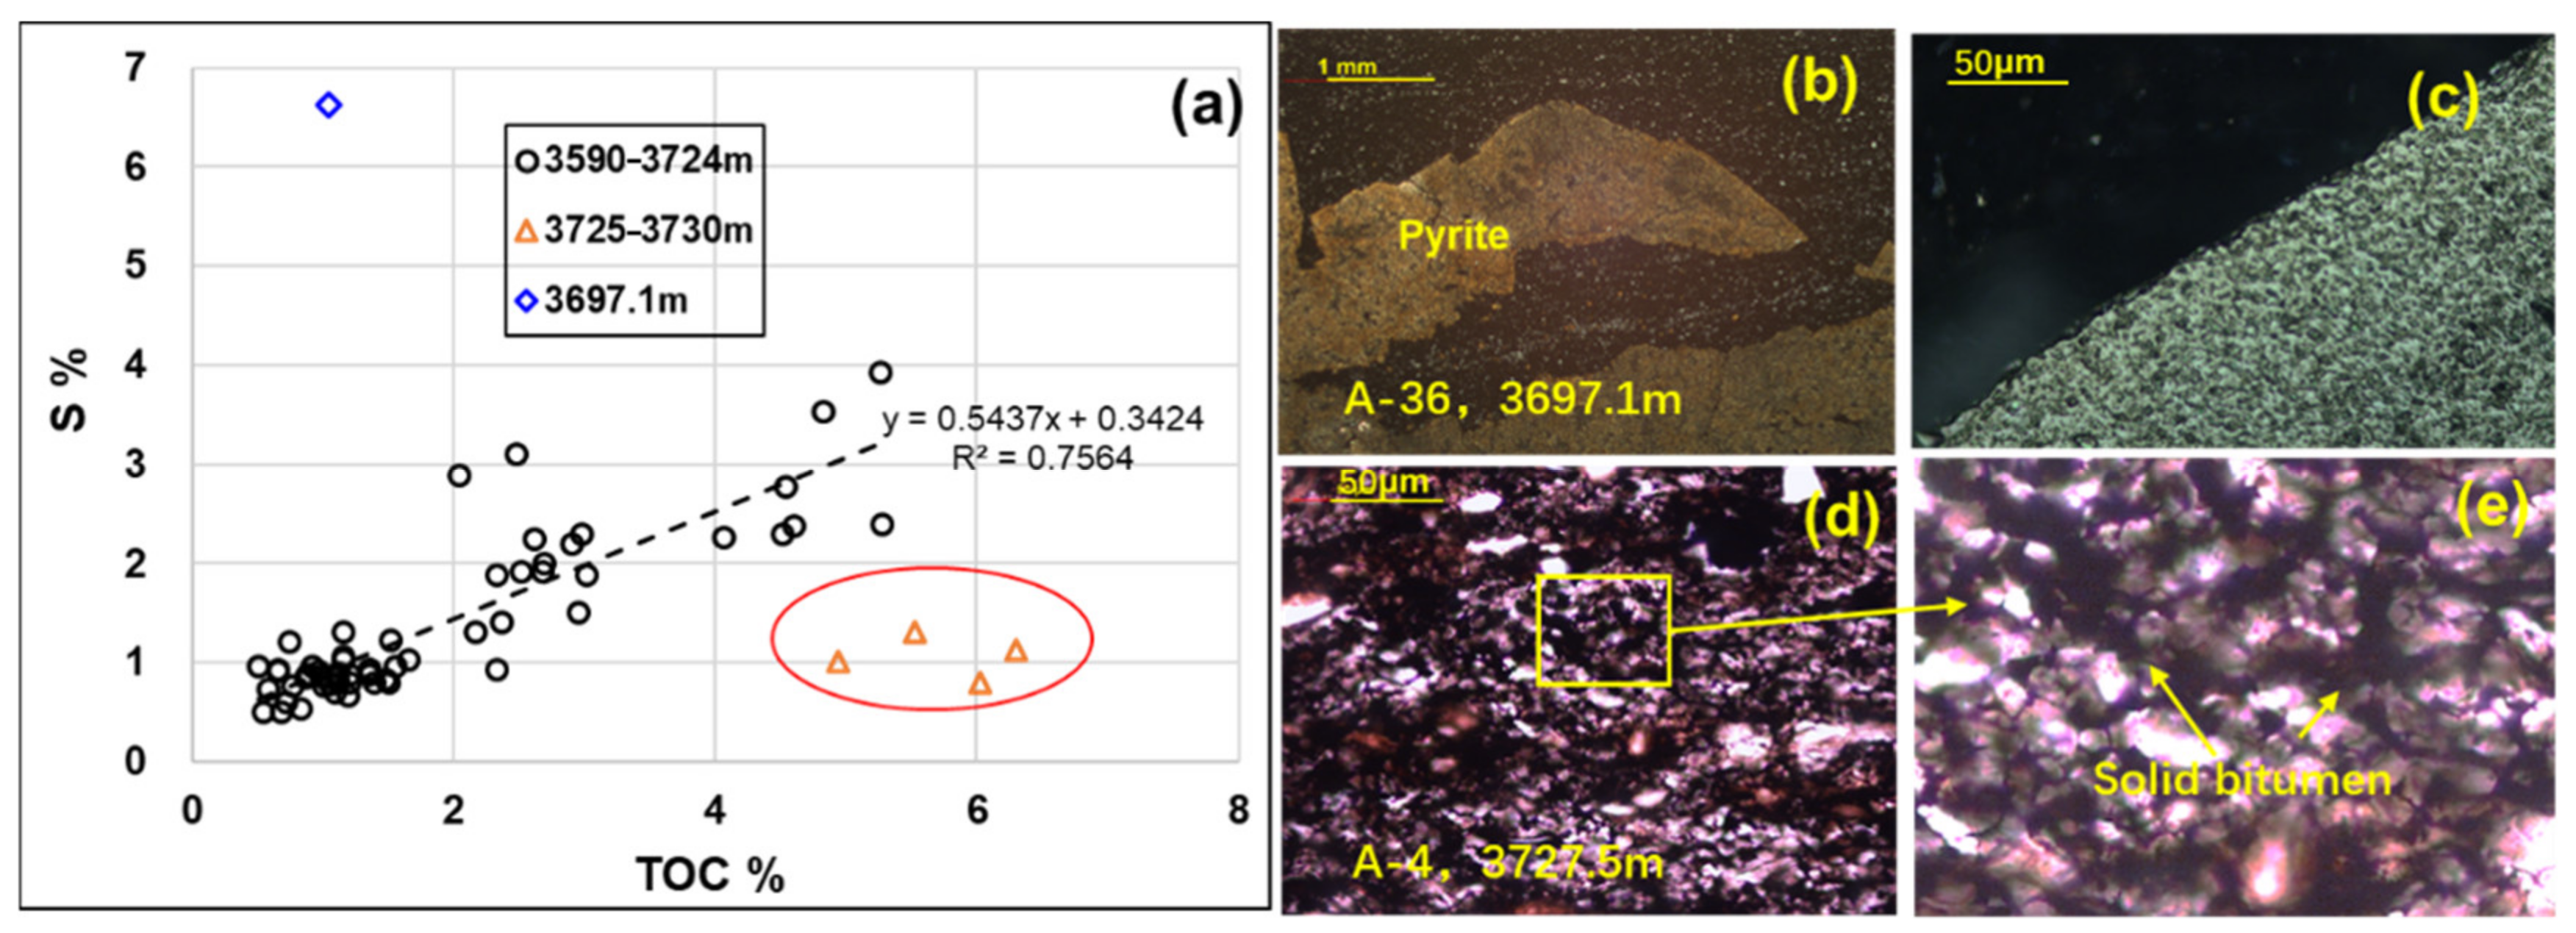
25], though it was difficult to identify whether the solid bitumen was in-situ bitumen or migrated solid bitumen from other sources. According to the plots of TOC and S contents, the S content of most samples in this study showed a positive relationship with TOC content (R
2 = 0.7564,
Figure 8a). However, there was one sample (A-36, 3697.1 m) with a high S content and low TOC content, because of pyrite aggregate enrichment in this sample (
Figure 10b,c). Four samples at the bottom of Wufeng Fm. showed abnormally low S content and high TOC content, with abundant solid bitumen observed under microscope (
Figure 10d,e). If the sedimentary system was stable, the relationship of TOC–S could well be positive, and the native TOC (TOC
0) content can be obtained from the positive relationship formula:
Through the assumption that the densities of solid bitumen (ρ
sd) and rock (ρ
rock) were 1.2 and ρrock = 2.6 gcm
−3, respectively, the percentage volume of migrated solid bitumen can be calculated as:
(Vsb and Vrock represent the volume of migrated solid bitumen and volume of rock in a 1 g rock sample, respectively; PVsb represents the volume percentage of migrated solid bitumen in 1g rock sample.)
The calculated results shown in
Table 1 suggest that 8.04–11.24% volumes of migrated solid bitumen in shales had been preserved at the bottom layers of Wufeng Fm. Such high amounts of migrated solid bitumen, which were obviously found at the lower part of the Wufeng–Longmaxi formation, could be formed from much higher amounts of oil. This could be one important reason for shale gas being enriched in the lower part of this shale interval.
5.3. Pore Development in Different Organic Matter and Minerals
As the strong positive relationship between porosities and TOC content (R
2 = 0.78) in Well A (
Figure 6b) suggests, organic pores were one key reservoir pore space for the shale gas system [
11,
18,
31,
35,
36,
40,
41,
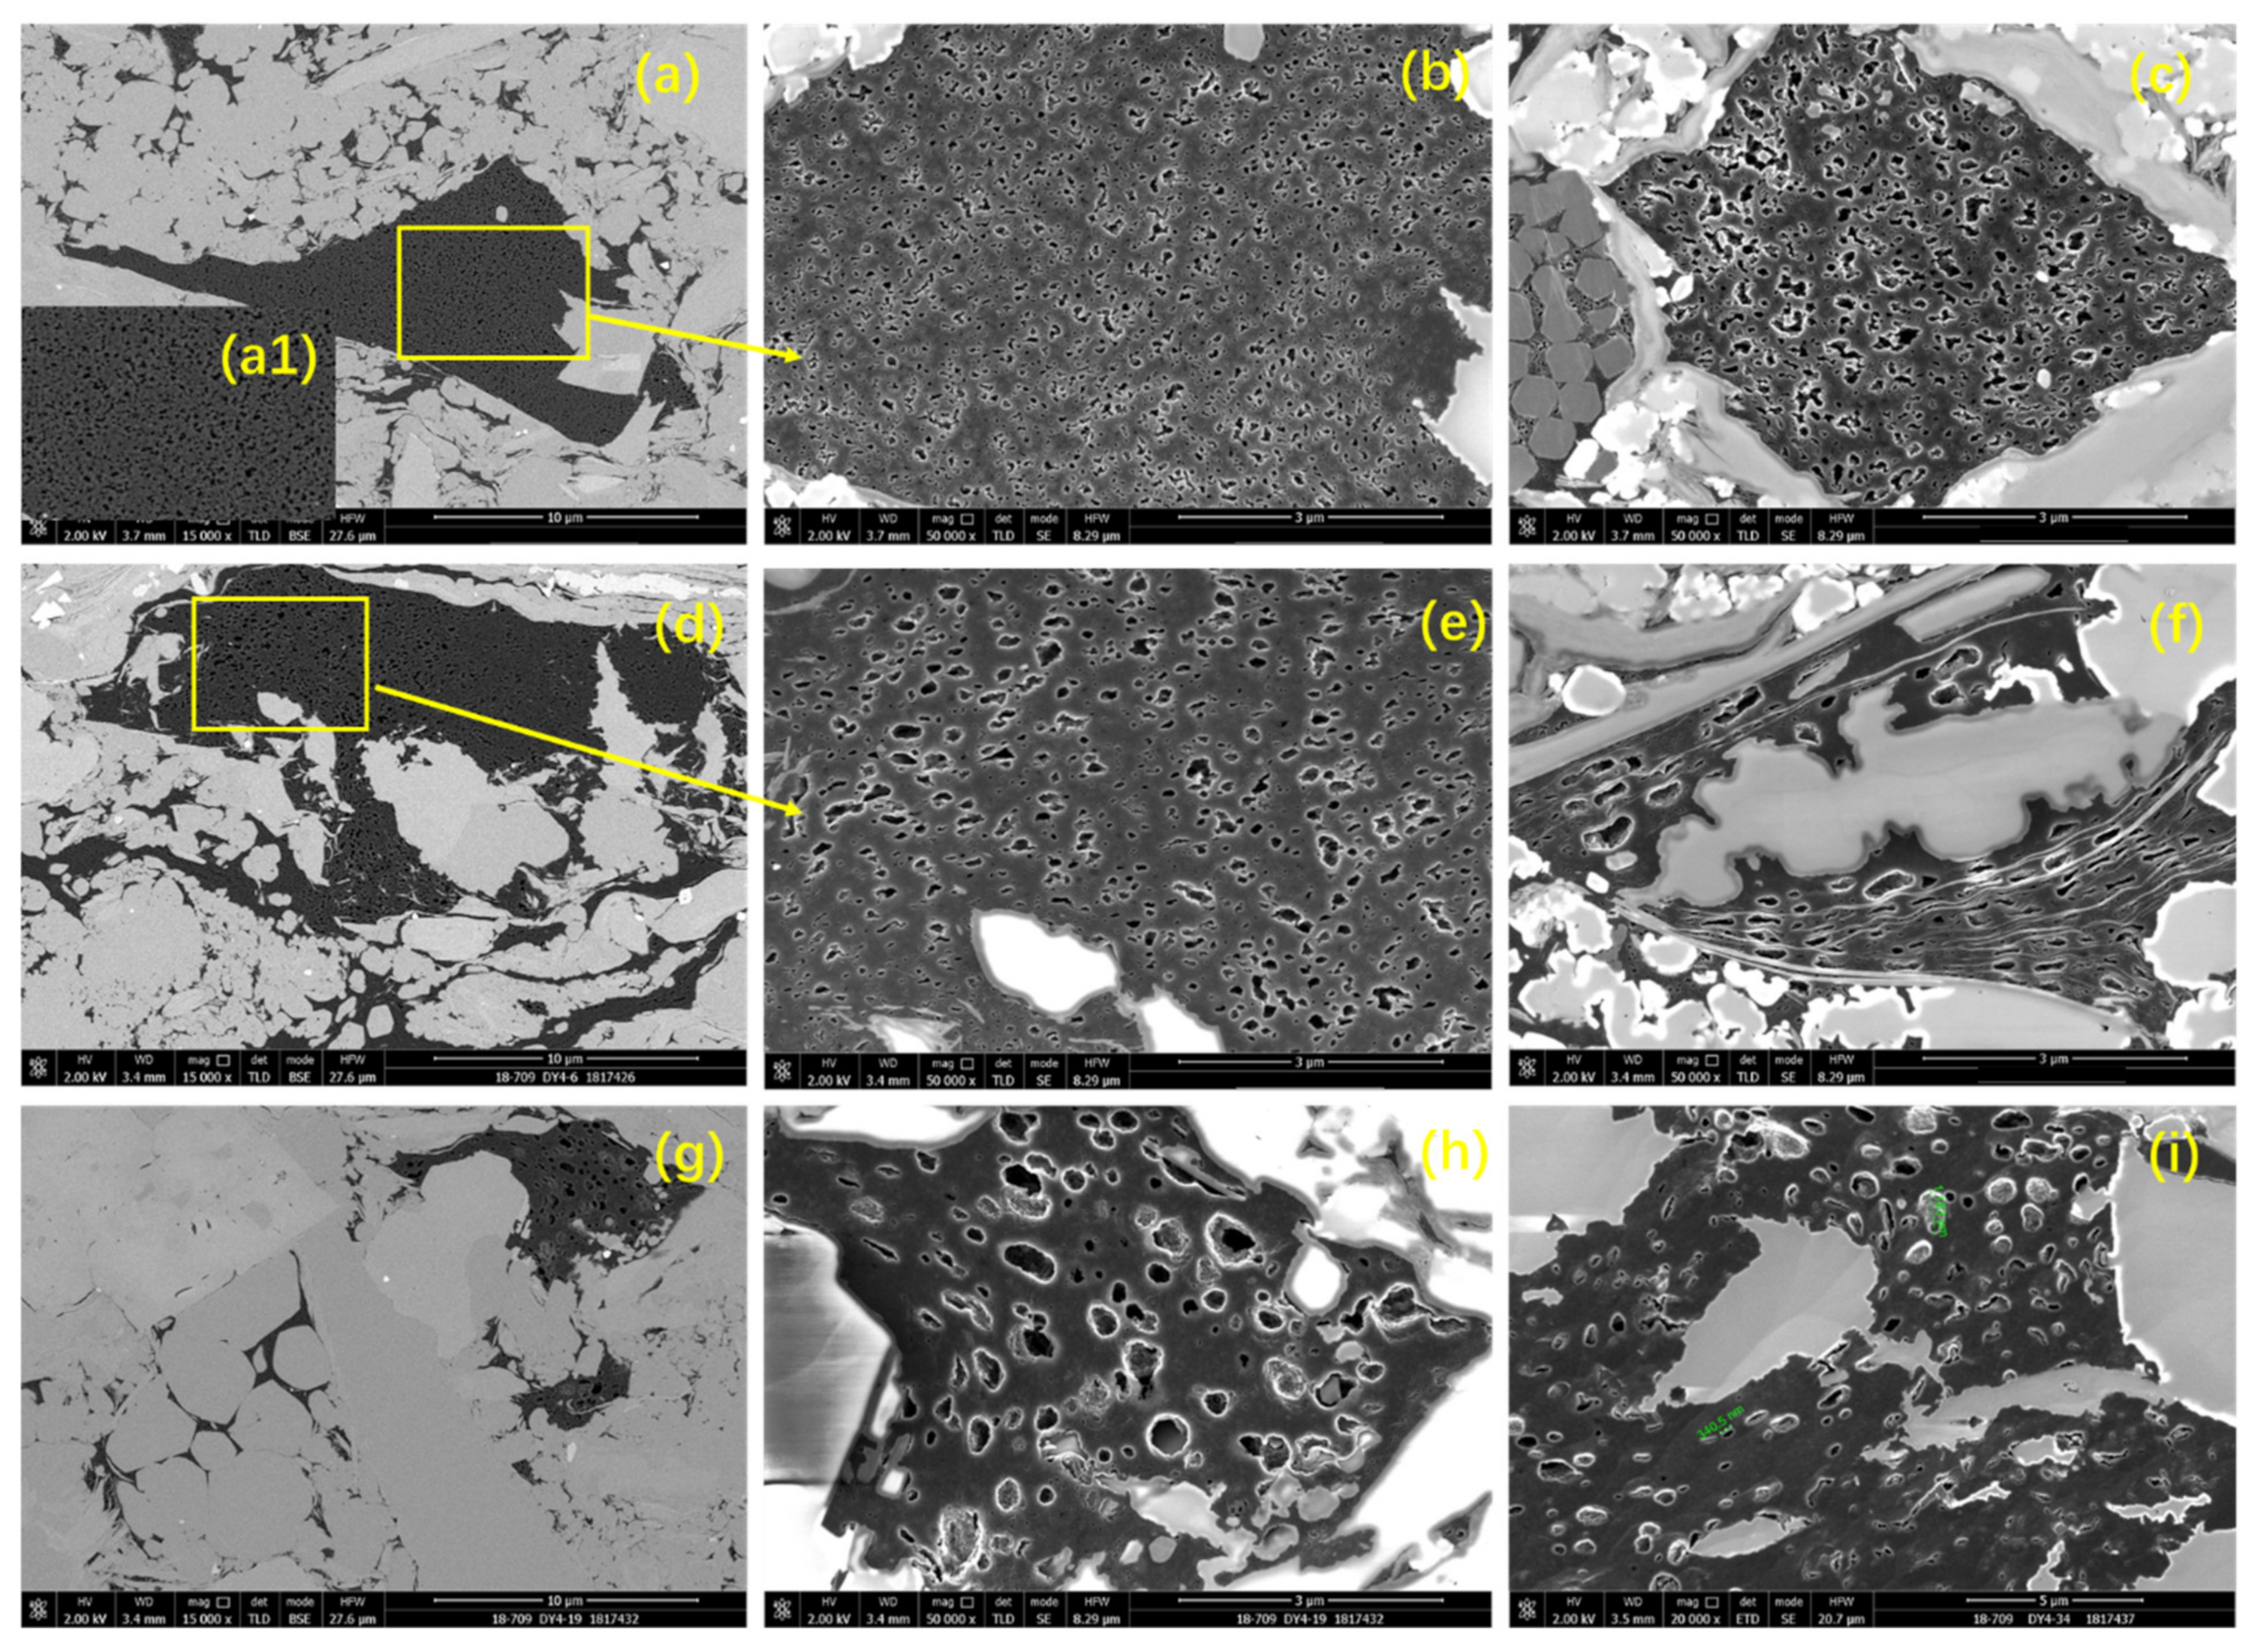
42]. Abundant nanometer to several micrometer OM-hosted pores were observed in the study (
Figure 11). Pores in shales can be divided into three types: micropores with diameters lower than 2 nm, mesopores with diameters from 2 nm to 50 nm, and macropores with diameters higher than 50 nm [
27]. Some OM-hosted pores (A type) were irregular and small (
Figure 11a–e), while some OM-hosted pores (B type) were elliptical and near circular under SEM (
Figure 11f–i), suggesting different organic matter types [
17,
27]. Type A were original kerogen organic matter residues, with a clearly reticular cell structure of algae (
Figure 11a,a1). Many original AOM kerogen can be difficult to confirm because of no obvious structures inside in AOM. The B type were mainly found in the migrated solid bitumen which filled in the holes among mineral particles, micro-fractures along bedding or interlayer fractures in clay minerals (e.g., illite,
Figure 11f).
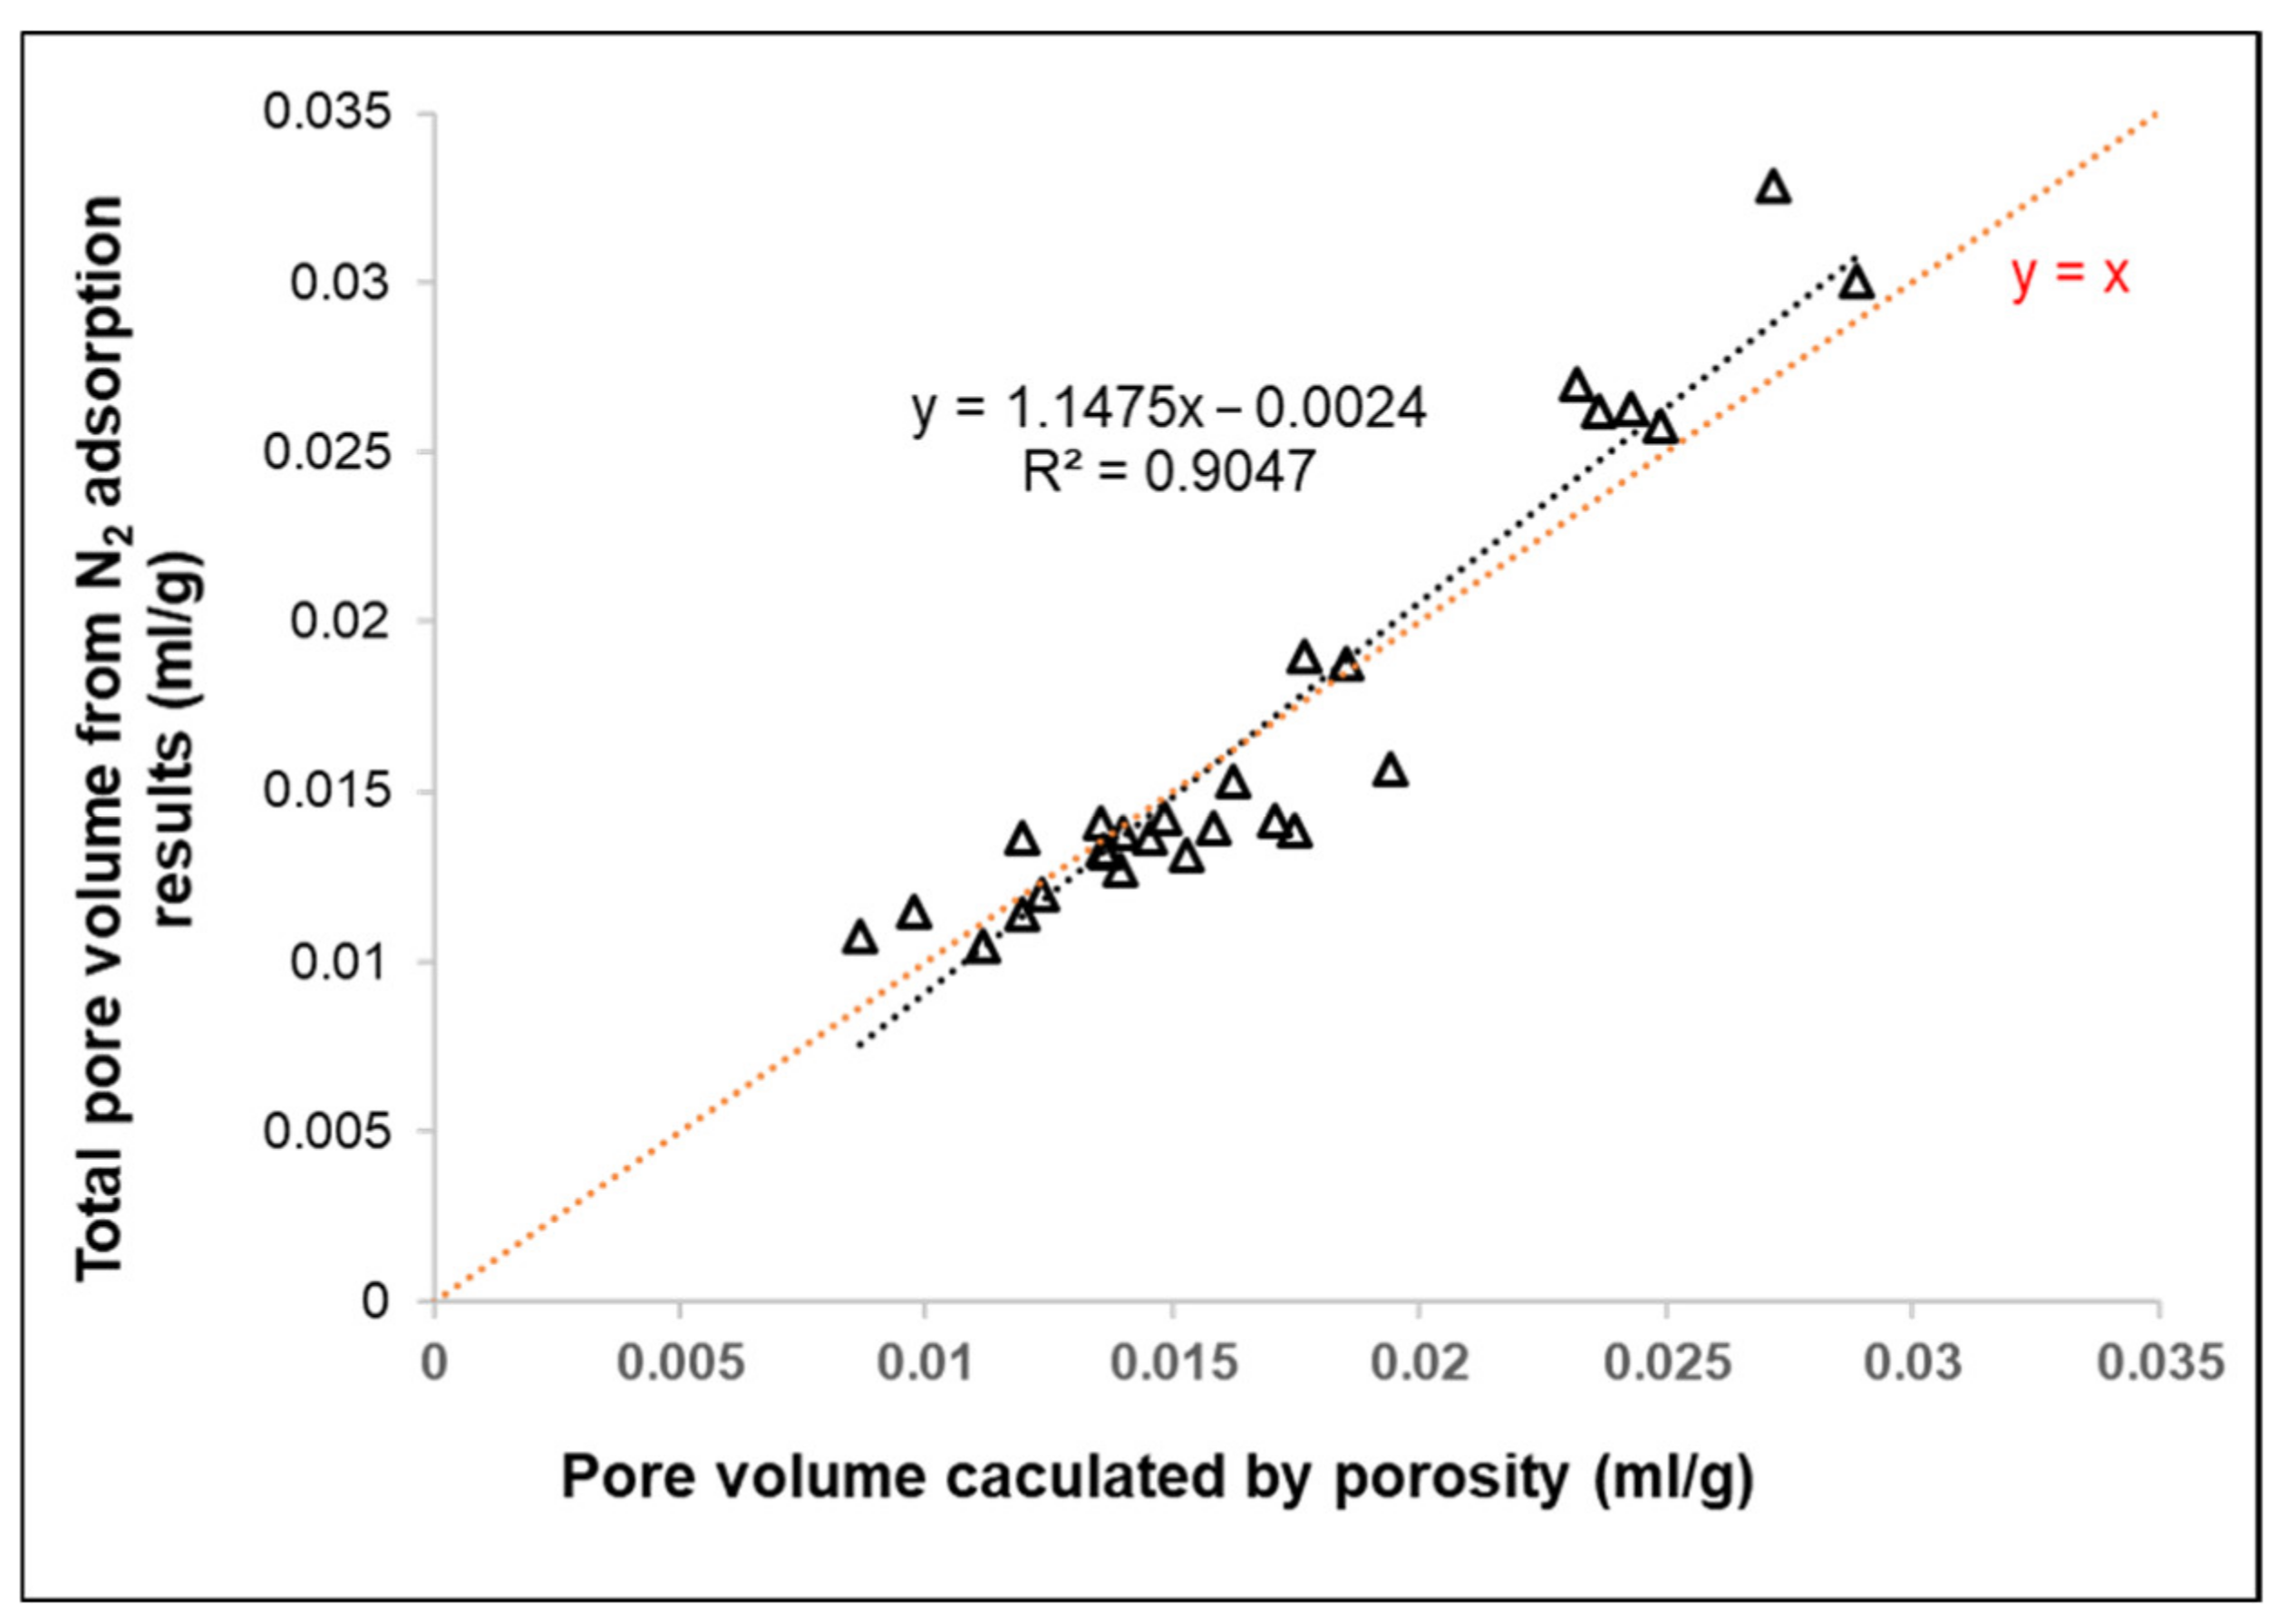
Quantitative pore characterizations, including the compositions of micropores, mesopores and macropores, can be measured by low pressure gas adsorption [
14,
32,
33,
34]. The results from total pore volume measured by N
2 adsorption were very close to the pore volume calculated by porosity (
Figure 12), suggesting the pore volume measured by N
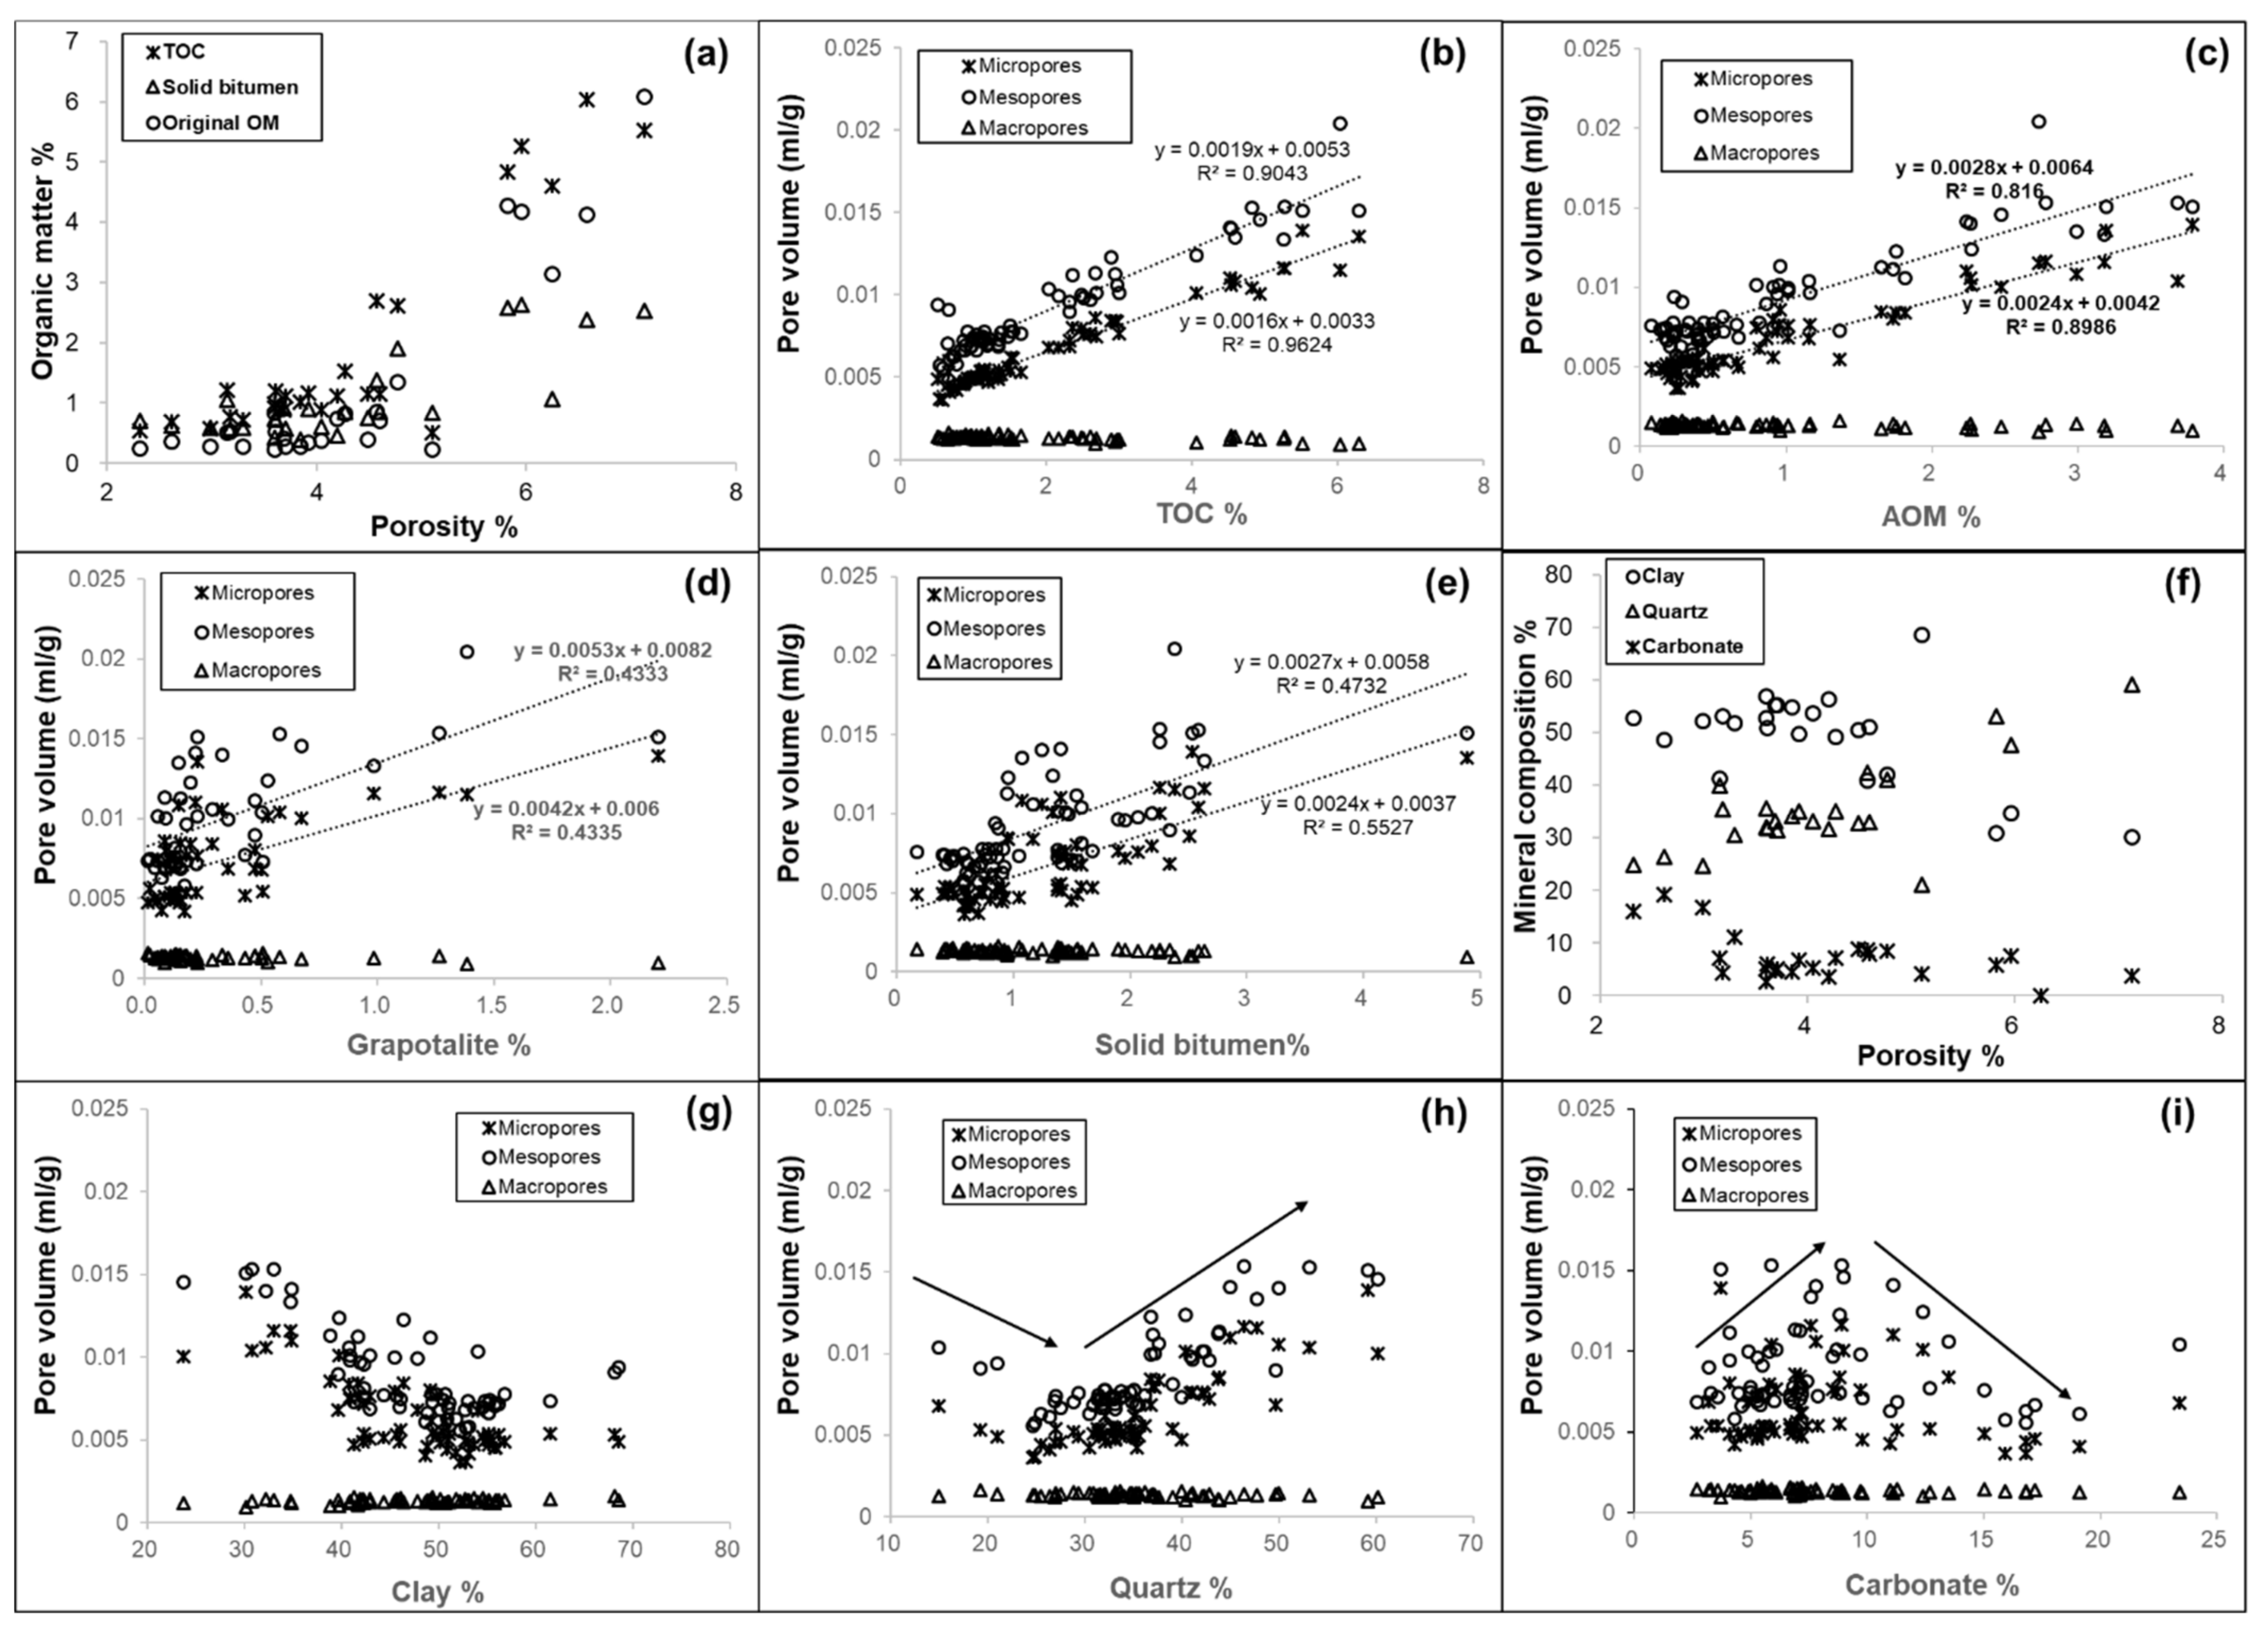
2 adsorption could represent the whole pore volume in the rocks. The porosity showed a positive relationship both with original organic matter (OM) and solid bitumen (
Figure 13a), illustrating that both solid bitumen and original kerogen OM contributed to the shale reservoir. The volumes of mesopores and micropores were predominant in the shales, showing a positive relationship with TOC (
Figure 13b). However, the volumes of macropores were very low and showed no variations with organic matter and minerals (
Figure 13). Mesopores were predominant in AOM (
Figure 13c), graptolite (
Figure 13d) and solid bitumen (
Figure 13e), which is consistent with the results from Wang et al. that “Mesopores contribute 58% of the total pore volume” [
14]. The pore volumes showed different trends with mineral compositions (
Figure 13f). They showed a negative relationship with clay content (
Figure 13g), while they exhibited complicated relationships with quartz (decreased below 30% and increased afterwards,
Figure 13h) and carbonate content (increased above 10% and decreased afterwards,
Figure 13i). Compared to the relationships between organic matter and minerals with characteristics of pore volumes, organic matter illustrated high positive relationships with pore volumes, especially AOM content. To this extent, AOM could be the main gas shale reservoir in the Wufeng–Longmaxi shale gas system.
6. Conclusions
The semi-quantitative composition of different bio-precursor derived organic matter was analyzed in the Wufeng–Longmaxi shales, and the results showed that organic matter was predominantly composed of amorphous organic matter (AOM), graptolite and solid bitumen. The characteristics of pore development is one of the key factors for shale gas formation. The results from total pore volume measured by N2 adsorption were very similar to the pore volume calculated by porosity, suggesting the pore volume measured by N2 adsorption could represent the whole pore volume in the rocks. The volumes of mesopores and micropores were dominant in the shales, and both were dominant in AOM, graptolite and solid bitumen. The pore volumes showed a strong positive relationship with organic matter, especially AOM content, suggesting AOM kerogen provided an important gas generation clue for Wufeng–Longmaxi formation in China. Based on the positive relationship of TOC and S content (S = 0.5437× TOC0 + 0.3424, R2 =0.7564), there could be 8.04–11.24% volume of migrated solid bitumen in shales that had been preserved. Shale gas has been mainly explored at the bottom of the interval, suggesting the migrated solid bitumen could be a fundamental factor for shale gas enrichment in the Wufeng– Longmaxi Formation from Sichuan Basin in the southwest of China.
Author Contributions
Conceptualization, Z.W. (Zhihong Wang) and X.X; methodology, X.X; writing—original draft preparation, Z.W. (Zhihong Wang) and X.X.; writing—review and editing, Z.W. (Zhigang Wen) and Y.X.; visualization, Y.L.; funding acquisition, Z.W. (Zhihong Wang). All authors have read and agreed to the published version of the manuscript.
Funding
This research was funded by National Natural Science Foundation of China (grants No. 41972163 and 42173055), and major scientific and technological projects of PetroChina (No. 2021DJ0605).
Data Availability Statement
Not applicable.
Acknowledgments
Thank you to Tenger, Jianzhong Qin, Maowen Li, Lizeng Bian for their constructive suggestions and comments. We are particularly grateful to the anonymous referees and the editors for their many helpful comments.
Conflicts of Interest
The authors declare no conflict of interest.
References
- Jarvie, D.M.; Hill, R.J.; Ruble, T.E.; Pollastro, R.M. Unconventional shale-gas systems: The Mississippian Barnett Shale of north-central Texas as one model for thermogenic shale-gas assessment. AAPG Bull. 2007, 91, 475–499. [Google Scholar] [CrossRef]
- Loucks, R.G.; Ruppel, S.C. Mississippian Barnett shale: Lithofacies and depositional setting of a deep-water shale-gas succession in the Fort Worth basin, Texas. AAPG Bull. 2007, 91, 579–601. [Google Scholar] [CrossRef]
- Guo, X.S.; Hu, D.F.; Li, Y.P.; Liu, R.B.; Wang, Q.B. Geological features and reservoiring mode of shale gas reservoirs in Longmaxi Formation of the Jiaoshiba area. Acta Geol. Sin. Engl. Ed. 2014, 88, 1811–1821. [Google Scholar] [CrossRef]
- Jin, Z.J.; Hu, Z.Q.; Gao, B.; Zhao, J.H. Controlling factors on the enrichment and high productivity of shale gas in the Wufeng-Longmaxi Formation, southeastern Sichuan Basin. Earth Sci. Front. 2016, 23, 1–10. [Google Scholar]
- Liu, H.L.; Wang, H.Y.; Fang, C.H. The formation mechanism of over-pressure reservoir and target screening index of the marine shale in the South China. Earth Sci. Front. 2016, 23, 48–54. [Google Scholar]
- Nie, H.K.; Li, D.H.; Liu, G.X.; Lu, Z.Y.; Wang, H.; Wang, R.Y.; Zhang, G.R. An overview of the geology and production of the Fuling shale gas field, Sichuan Basin, China. Energy Geosci. 2020, 1, 147–164. [Google Scholar] [CrossRef]
- Tan, J.; Horsfield, B.; Fink, R. Shale gas potential of the major marine shale formations in the upper Yangtze platform, south China, Part III: Mineralogical, Lithofacial, petrophysical, and rock mechanical properties. Energy Fuels 2014, 28, 2322–2342. [Google Scholar] [CrossRef]
- Zhang, K.; Song, Y.; Jiang, S.; Jiang, Z.; Jia, C.; Huang, Y.; Wen, M.; Liu, W.; Xie, X.; Liu, T. Mechanism analysis of organic matter enrichment in different sedimentary backgrounds: A case study of the Lower Cambrian and the Upper Ordovician-Lower Silurian, in Yangtze region. Mar. Pet. Geol. 2018, 99, 488–497. [Google Scholar] [CrossRef]
- Cao, T.T.; Song, Z.G.; Wang, S.B.; Cao, X.X.; Li, Y.; Xia, J. Characterizing the pore structure in the silurian and permian shales of the Sichuan Basin, China. Mar. Pet. Geol. 2015, 61, 140–150. [Google Scholar] [CrossRef]
- Cao, T.T.; Xu, H.; Liu, G.X.; Meng, M.; Cao, Q.G.; Yu, Y. Factors influencing microstructure and porosity in shales of the Wufeng-Longmaxi formations in northwestern Guizhou, China. J. Pet. Sci. Eng. 2020, 181, 107181. [Google Scholar] [CrossRef]
- Nie, H.; Zhang, J.; Jiang, S. Types and characteristics of the lower silurian shale gas reservoirs in and around the Sichuan basin. Acta Geol. Sin. Engl. Ed. 2017, 89, 1973–1985. [Google Scholar]
- Tian, H.; Pan, L.; Xiao, X.; Wilkins, R.; Meng, Z.; Huang, B. A preliminary study on the pore characterization of Lower Silurian black shales in the Chuandong Thrust Fold Belt, southwestern China using low pressure N2 adsorption and FE-SEM methods. Mar. Pet. Geol. 2013, 48, 8–19. [Google Scholar] [CrossRef]
- Wang, C.; Zhang, B.; Lu, Y.; Shu, Z.; Lu, Y.; Bao, H.; Meng, Z.; Chen, L. Lithofacies distribution characteristics and its controlling factors of shale in Wufeng Formation-Member 1 of Longmaxi Formation in the Jiaoshiba Area. Pet. Res. 2018, 3, 306–319. [Google Scholar] [CrossRef]
- Wang, Y.; Liu, L.; Zheng, S.; Luo, Z.; Sheng, Y.; Wang, X. Full-scale pore structure and its controlling factors of the Wufeng-Longmaxi shale, southern Sichuan Basin, China: Implications for pore evolution of highly overmature marine shale. J. Nat. Gas Sci. Eng. 2019, 67, 134–146. [Google Scholar] [CrossRef]
- Xu, Z.; Shi, W.; Zhai, G. A rock physics model for characterizing the total porosity and velocity of shale: A case study in Fuling area, China. Mar. Pet. Geol. 2019, 99, 208–226. [Google Scholar] [CrossRef]
- Yang, F.; Ning, Z.F.; Wang, Q.; Zhang, R.; Krooss, B.M. Pore structure characteristics of lower Silurian shales in the southern Sichuan Basin, China: Insights to pore development and gas storage mechanism. Int. J. Coal Geol. 2016, 156, 12–24. [Google Scholar] [CrossRef]
- Milliken, K.L.; Rudnicki, M.; Awwiller, D.N.; Zhang, T. Organic matter-hosted pore system, Marcellus formation (Devonian), Pennsylvania. AAPG (Am. Assoc. Pet. Geol.) Bull. 2013, 97, 177–200. [Google Scholar] [CrossRef]
- Peng, N.; He, S.; Hu, Q.H.; Zhang, B.Q.; He, X.P.; Zhai, G.Y.; He, C.C.; Yang, R. Organic nanopore structure and fractal characteristics of Wufeng and lower member of Longmaxi shales in southeastern Sichuan, China. Mar. Pet. Geol. 2019, 103, 456–472. [Google Scholar] [CrossRef]
- Wu, L.Y.; Hu, D.F.; Lu, Y.C.; Liu, R.B.; Liu, X.F. Advantageous shale lithofacies of Wufeng Formation-Longmaxi Formation in Fuling gas field of Sichuan Basin, SW China. Pet. Explor. Dev. 2016, 43, 189–198, (In Chinese with English Abstract). [Google Scholar] [CrossRef]
- Loucks, R.G.; Reed, R.M.; Ruppel, S.C.; Hammes, U. Spectrum of pore types and networks in mudrocks and a descriptive classification for matrix-related mudrock pores. AAPG (Am. Assoc. Pet. Geol.) Bull. 2012, 96, 1071–1098. [Google Scholar] [CrossRef]
- Curtis, M.E.; Cardott, B.J.; Sondergeld, C.H.; Rai, C.S. Development of organic porosity in the Woodford Shale with increasing thermal maturity. Int. J. Coal Geol. 2012, 103, 26–31. [Google Scholar] [CrossRef]
- Jiao, K.; Yao, S.; Liu, C.; Gao, Y.; Wu, H.; Li, M.; Tang, Z. The characterization and quantitative analysis of nanopores in unconventional gas reservoirs utilizing FESEM–FIB and image processing: An example from the lower Silurian Longmaxi Shale, upper Yangtze region, China. Int. J. Coal Geol. 2014, 128–129, 1–11. [Google Scholar] [CrossRef]
- Ardakani, O.H.; Sanei, H.; Ghanizadeh, A.; Lavoie, D.; Chen, Z.H.; Clarkson, C.R. Do all fractions of organic matter contribute equally in shale porosity? A case study from Upper Ordovician Utica Shale, southern Quebec, Canada. Mar. Pet. Geol. 2018, 92, 794–808. [Google Scholar] [CrossRef]
- Zhang, W.T.; Hu, W.X.; Borjigin, T.; Zhu, F. Pore characteristics of different organic matter in black shale: A case study of the Wufeng-Longmaxi Formation in the southeast Sichuan Basin, China. Mar. Pet. Geol. 2020, 111, 33–43. [Google Scholar] [CrossRef]
- Chen, Z.Y.; Song, Y.; Jiang, Z.X.; Liu, S.B.; Li, Z.; Shi, D.F.; Yang, W.; Yang, Y.D.; Song, J.N.; Gao, F.L.; et al. Identification of organic matter components and organic pore characteristics of marine shale: A case study of Wufeng-Longmaxi shale in southern Sichuan Basin, China. Mar. Pet. Geol. 2019, 109, 56–69. [Google Scholar] [CrossRef]
- Zhang, Y.Y.; He, Z.L.; Lu, S.F.; Jiang, S.; Xiao, D.S.; Long, S.X.; Gao, B.; Du, W.; Zhao, J.H.; Chen, G.H.; et al. Characteristics of microorganisms and origin of organic matter in Wufeng Formation and Longmaxi Formation in Sichuan Basin, South China. Mar. Pet. Geol. 2020, 111, 363–374. [Google Scholar] [CrossRef]
- Hu, H.Y.; Hao, F.; Liu, J.F.; Lu, Y.C.; Ma, Y.Q.; Li, Q. Organic matter-hosted pore system in the Wufeng-Longmaxi (O3w-S11) shale, Jiaoshiba area, Eastern Sichuan Basin, China. Int. J. Coal Geol. 2017, 173, 40–50. [Google Scholar] [CrossRef]
- Loucks, R.G.; Reed, R.M.; Ruppel, S.C.; Jarvie, D.M. Morphology, genesis, and distribution of nanometer-scale pores in siliceous mudstones of the Mississippian Barnett shale. J. Sediment. Res. 2009, 79, 848–861. [Google Scholar] [CrossRef]
- Mou, C.; Zhou, K.; Liang, W.; Ge, X. Early paleozoic sedimentary environment of hydrocarbon source rocks in the middle-upper Yangtze region and petroleum and gas exploration. Acta Geol. Sin. 2011, 85, 526–532, (In Chinese with English Abstract). [Google Scholar]
- Tengger Shen, B.; Yu, L.; Yang, Y.; Zhang, W.; Tao, C.; Xi, B.; Zhang, Q.; Bao, F.; Qin, J. Mechanisms of shale gas generation and accumulation in the Ordovician Wufeng-Longmaxi Formation, Sichuan Basin, SW China. Pet. Explor. Dev. 2017, 44, 69–78. [Google Scholar]
- Tang, X.; Jiang, Z.; Jiang, S.; Li, Z. Heterogeneous nanoporosity of the Silurian Longmaxi Formation shale gas reservoir in the Sichuan Basin using the QEMSCAN, FIB-SEM, and nano-CT methods. Mar. Pet. Geol. 2016, 78, 99–109. [Google Scholar] [CrossRef]
- Jiang, Z.X.; Tang, X.L.; Li, Z.; Huang, H.X.; Yang, P.P.; Yang, X.; Li, W.B.; Hao, J. The whole-aperture pore structure characteristics and its effect on gas content of the Longmaxi Formation shale in the southeastern Sichuan Basin. Earth Sci. Front. 2016, 23, 126–134. [Google Scholar]
- Mastalerz, M.; Schimmelmann, A.; Drobniak, A.; Chen, Y.Y. Porosity of Devonian and Mississippian New Albany Shale across a maturation gradient: Insights from organic petrology, gas adsorption, and mercury intrusion. AAPG (Am. Assoc. Pet. Geol.) Bull. 2013, 97, 1621–1643. [Google Scholar] [CrossRef]
- Zhang, L.; Xiong, Y.Q.; Li, Y.; Wei, M.M.; Jiang, W.M.; Lei, R.; Wu, Z.Y. DFT modeling of CO2 and Ar low-pressure adsorption for accurate nanopore structure characterization in organic-rich shales. Fuel 2017, 204, 1–11. [Google Scholar] [CrossRef]
- Qin, J.; Shen, B.; Tao, G. Hydrocarbon-forming organisms and dynamic evaluation of hydrocarbon generation capacity in excellent source rocks. Pet. Geol. Exp. 2014, 36, 465–472. [Google Scholar]
- Wang, X.; Liu, L.; Wang, Y.; Sheng, Y.; Zheng, S.; Wu, W.; Luo, Z. Comparison of the pore structures of Lower Silurian Longmaxi Formation shales with different lithofacies in the southern Sichuan Basin, China. J. Nat. Gas Sci. Eng. 2020, 81, 103419. [Google Scholar] [CrossRef]
- Cook, A.C.; Sherwood, N.R. Classification of oil shales, coals and other organic-rich rocks. Org. Geochem. 1991, 17, 211–222. [Google Scholar] [CrossRef]
- Meng, Q.T.; Liu, Z.J.; Liu, R.; Sun, P.C.; Hu, F.; Zhang, J. Comparison on the characteristics of biomarkers of oil shale between Huadian Formation in Huadian Basin and Green River Formation in Uinta Basin of western United States. J. Jilin Univ. (Earth Sci. Ed.) 2011, 41, 391–399, (In Chinese with English Abstract). [Google Scholar]
- Pacton, M.; Gorin, G.E.; Vasconcelos, C. Amorphous organic matter-Experimental data on formation and the role of microbes. Rev. Palaeobot. Palynol. 2011, 166, 253–257. [Google Scholar] [CrossRef]
- Sing, K.S.W. Reporting physisorption data for gas/solid systems-with special reference to the determination of surface area and porosity. Pure Appl. Chem. 1985, 57, 603–619. [Google Scholar] [CrossRef]
- Wang, P.; Jiang, Z.; Ji, W.; Zhang, C.; Yuan, Y.; Chen, L.; Yin, L. Heterogeneity of intergranular, intraparticle and organic pores in Longmaxi shale in Sichuan Basin, South China: Evidence from SEM digital images and fractal and multifractal geometries. Mar. Pet. Geol. 2016, 72, 122–138. [Google Scholar] [CrossRef]
- Wang, Y.; Cheng, H.F.; Hu, Q.H.; Liu, L.F.; Hao, L.W. Diagenesis and pore evolution for various lithofacies of the Wufeng-Longmaxi shale, southern Sichuan Basin, China. Mar. Pet. Geol. 2021, 133, 105251. [Google Scholar] [CrossRef]
Figure 1.
The location of Sichuan Basin (
a), the Dingshan area (DSA) (
b), and the geological column of Sichuan Basin (
c) (modified from Wang et al. [
14]).
Figure 1.
The location of Sichuan Basin (
a), the Dingshan area (DSA) (
b), and the geological column of Sichuan Basin (
c) (modified from Wang et al. [
14]).
Figure 2.
The geological column, TOC and sulfur contents, and main mineral compositions of samples from Well A in the Dingshan area, Sichuan Basin.
Figure 2.
The geological column, TOC and sulfur contents, and main mineral compositions of samples from Well A in the Dingshan area, Sichuan Basin.
Figure 3.
The micro-photos of graptolite. (a) Graptolite along the bedding (arrows), transmitted polarized light, ×50. (b,c) Graptolite along the bedding (arrows), showing the silica content surrounding the graptolite under transmitted polarized light (b) and orthogonal light (c), ×100. (d–i) Graptolite showing the silica content surrounding the graptolite under transmitted polarized light (d,g), orthogonal light (e,h) and reflect light (f,i), oil immersion, ×500.
Figure 4.
Micro-photos of bio-precursor organic matter. (a–d) Debris of multicellular benthic algae, showing multicellular structure of algae. (e–h) Acritarch, with (e) showing the acritarch in the rocks, while (f–h) were acritarchs in the isolated kerogen, including species Multiplicisphaeridium sp (f), Goniosphaeridium sp (g) and Buedingiisphaeridium sp (h). (i,j) Multicellular benthic algae debris in the isolated kerogen. (k) Chitinozoa in the isolated kerogen. Transmitted polarized light, ×500. Scale bar= 50 µm (a–e), =10 µm (f–k).
Figure 5.
Micro-photos of solid bitumen (arrows). (a–d) Solid bitumen filled in the intergranular pore. (e,f) Solid bitumen filled in the micro-fractures along the bedding. (a,c,e) were micro-photos under transmitted polarized light; (b,d,f) were micro-photos under reflected light. Oil immersion, ×500. Scale bar = 50 µm.
Figure 6.
The plots of porosity vs. depth (a) and porosity vs. TOC (b) of core samples from Well A in Sichuan Basin, with both showing positive relationships.
Figure 6.
The plots of porosity vs. depth (a) and porosity vs. TOC (b) of core samples from Well A in Sichuan Basin, with both showing positive relationships.
Figure 7.
Nitrogen adsorption-desorption isotherms for samples from Well A in the Dingshan area of Sichuan Basin, showing similar type and the volume adsorbed decreased with TOC content.
Figure 7.
Nitrogen adsorption-desorption isotherms for samples from Well A in the Dingshan area of Sichuan Basin, showing similar type and the volume adsorbed decreased with TOC content.
Figure 8.
The relative (a) and quantitative (b) bio-precursor organic matter composition.
Figure 8.
The relative (a) and quantitative (b) bio-precursor organic matter composition.
Figure 9.
(a) The plots of TOC and organic matter content measured under microscope. (b) Quantitative organic matter composition varied with depth. Note: Quantitative composition = organic matter content × relative percentage of organic matter.
Figure 9.
(a) The plots of TOC and organic matter content measured under microscope. (b) Quantitative organic matter composition varied with depth. Note: Quantitative composition = organic matter content × relative percentage of organic matter.
Figure 10.
(
a) The plots of TOC and S contents. (
b,
c) The micro-photos of A-36 (3697.1 m), showing pyrite agglomerate developed in this sample, reflect light. (
d,
e) The micro-photos of A-4 (3727.5), showing much solid bitumen filled (red oval in
Figure 10a, and arrows) in the micropore surrounding the mineral particles.
Figure 11.
Microphotos under scanning electron microscope (SEM), showing abundant pores with nanometers to micrometers developed in organic matter. (
a–
e): Pores in original kerogen organic matter residues (A type), (
a1) showing that pores were irregular and small. (
f–
i): Pores (B type, elliptical and near circular) in the migrated solid bitumen which filled in the holes among mineral particles, micro-fractures along bedding or interlayer fractures in clay minerals (e.g., illite,
Figure 11f).
Figure 12.
The plots of total pore volume from N2 adsorption and pore volume calculated by porosity. Total pore volume = Micropores + Mesopores + Macropores; Calculated pore volume = (1/ρrock) × Porosity.
Figure 12.
The plots of total pore volume from N2 adsorption and pore volume calculated by porosity. Total pore volume = Micropores + Mesopores + Macropores; Calculated pore volume = (1/ρrock) × Porosity.
Figure 13.
The plots of pores characterizations and minerals. (a) Porosity vs. Organic matter composition; (b) Pore volume vs. TOC; (c) Pore volume vs. AOM; (d) Pore volume vs. Graptolite; (e) Pore volume vs. Solid bitumen; (f) Mineral composition vs. Porosity; (g) Pore volume vs. Clay; (h) Pore volume vs. Quartz; (i) Pore volume vs. Carbonate.
Table 1.
The calculation of filled solid bitumen at the bottom of Wufeng Fm.
Table 1.
The calculation of filled solid bitumen at the bottom of Wufeng Fm.
| No. | Depth (m) | TOC
% | S% | TOC0 (%) | ΔTOC | Vsb (cm3) | Vrock (cm3) | PVsb % |
|---|
| A-3 | 3730.1 | 5.52 | 1.3 | 1.76 | 3.76 | 0.03 | 0.38 | 8.14 |
| A-4 | 3727.5 | 6.3 | 1.12 | 1.43 | 4.87 | 0.04 | 0.38 | 10.55 |
| A-5 | 3726.3 | 6.03 | 0.80 | 0.84 | 5.19 | 0.04 | 0.38 | 11.24 |
| A-6 | 3725.1 | 4.94 | 1.01 | 1.23 | 3.71 | 0.03 | 0.38 | 8.04 |
| Publisher’s Note: MDPI stays neutral with regard to jurisdictional claims in published maps and institutional affiliations. |
© 2022 by the authors. Licensee MDPI, Basel, Switzerland. This article is an open access article distributed under the terms and conditions of the Creative Commons Attribution (CC BY) license (https://creativecommons.org/licenses/by/4.0/).


