Article

Investigation on Oil Physical States of Hybrid Shale Oil System: A Case Study on Cretaceous Second White Speckled Shale Formation from Highwood River Outcrop, Southern Alberta

1
School of Geosciences, Yangtze University, Wuhan 430100, China
2
School of Energy Resource, China University of Geosciences (Beijing), Beijing 100083, China
3
Key Laboratory of Marine Reservoir Evolution and Hydrocarbon Enrichment Mechanism, Ministry of Education, Beijing 100083, China
4
Department of Geoscience, University of Calgary, Calgary, AB T2N 1N4, Canada
*
Author to whom correspondence should be addressed.
Submission received: 27 April 2022 / Revised: 8 June 2022 / Accepted: 21 June 2022 / Published: 24 June 2022
(This article belongs to the Special Issue Shale and Tight Reservoir Characterization and Resource Assessment)

Abstract

:
Nine samples collected from the Upper Cretaceous Second White Speckled Shale Formation at the Highwood River outcrop in southern Alberta were geochemically characterized for their oil contents, physical states, and chemical compositions. Cold extraction was performed on 8–10 mm and 2–5 mm chips sequentially to obtain the first and second extractable organic matter (EOM-1 and EOM-2), while Soxhlet extraction was performed on powder from previously extracted chips to obtain the third extract (EOM-3). EOM-1 can be roughly regarded as free oil and EOM-2 is weakly adsorbed on mineral surfaces, while EOM-3 may represent the oil strongly adsorbed on kerogen. While both extraction yields and Rock-Eval pyrolysates differed from their original values due to the evaporative loss during outcropping, there was a generally positive correlation between the total EOM and total oil derived from Rock-Eval pyrolysis. EOM-1 was linearly correlated with Rock-Eval S1, while the extractable S2 content was well correlated with the loss of TOC, suggesting that TOC content was the main constraint for adsorbed oils. A bulk composition analysis illustrated that EOM-1 contained more saturated hydrocarbons, while EOM-3 was enriched in resins and asphaltenes. More detailed fractionation between the free and adsorbed oils was demonstrated by molecular compositions of each extract using quantitative GC-MS analysis. Lower-molecular-weight n-alkanes and smaller-ring-number aromatic compounds were preferentially concentrated in EOM-1 as compared to their higher-molecular or greater-ring-number counterparts and vice versa for EOM-3. Fractionation between isoprenoids and adjacent eluted n-alkanes, isomers of steranes, hopanes, alkylnaphthalenes, alkylphenanthrenes and alkyldibenzothiophenes was insignificant, suggesting no allogenic charge from deep strata. Strong chemical fractionation between saturated and aromatic hydrocarbon fractions was observed with EOM-1 apparently enriched in n-alkanes, while EOM-3 retained more aromatic hydrocarbons. However, the difference between free and adsorbed state oils was less dramatic than the variation from shales and siltstones. Lithological heterogeneities controlled both the amount and composition of retained fluids. Oil that resided in shales (source rock) behaved more similar to the EOM-3, with diffusive expulsion leading to the release of discrete molecules from a more adsorbed or occluded phase to a more free phase in siltstones with more connected pores and/or fractures (reservoir). Under current technical conditions, only the free oil can flow and will be the recoverable resource. Therefore, the highest potential can be expected from intervals adjacent to organic-rich beds. The compositional variations due to expulsion and primary migration from source rocks to reservoirs illustrated in the present study will contribute to a better understanding of the distribution of hydrocarbons generated and stored within the shale plays.

1. Introduction

Shale oil plays are generally defined as self-sourced petroleum systems in which the source rock and reservoir are the same [1,2], whereas Boak and Kleinberg [3] termed those produced from fine-grained, organic-rich sedimentary rocks, or closely associated with such type of rocks, as tight oil. A broad definition proposed by Jarvie [4] that shale oil includes not only the organic-rich mudstone or shale itself, but also the juxtaposed, interlayered, organic-lean rocks, such as siltstones and carbonates in the shale depositional sequence, is widely accepted by many researchers (Curiale and Curtis, 2016 [5]; Wu et al., 2021 [6]). While the boundary between tight oil and shale oil remains unclear and the controversy will continue in the literature, it is clear that both types of oil are difficult and costly to produce, and they benefit greatly from horizontal drilling, massive multistage hydraulic fracturing, and microseismic monitoring.
The oil storage behavior is one of the most important controlling factors for shale oil production (Zhang et al., 2019 [7]). While the bulk of the oil storage in source rocks is in kerogen, some oils are retained in the adsorbed state on organic matter, while others exist in a free state in the pores and fractures (Larter et al., 2012 [8]; Raji et al., 2015 [9]; Zink et al., 2016 [10]). However, to determine the proportion of adsorbed and free oil in shales remains difficult (Abrams et al., 2017 [11]). Sequential extraction, a classic method to gain insight into the petroleum generation and primary migration mechanisms (Price and Clayton, 1992 [12]) that is widely used to investigate oil charge history (Wilhelms et al., 1996 [13]; Schwark et al., 1997 [14]; Leythaeuser et al., 2007 [15]), is one of the practical methods to study the oil storage behavior in shales. Mohnhoff et al. [16] applied the sequential flow-through extraction of shales to elucidate fluid flow and fluid/rock interactions in the subsurface. Qian et al. [17] used different solvent combinations to achieve the quantitative characterization of extractable organic matter (EOM) in different shale oil reservoir states, while Zhang et al. [18] proposed a combination of cold, sonication, and Soxhlet extraction on three particle sizes to determine the free oil, adsorbed oil, and residual oil in shales. Rock-Eval pyrolysis is likely the most widely used technique to assess the quality and quantity of the source rocks (Behar et al., 2001 [19]), and has been adapted to determine the physical state of oil in shales by modifying heating programs. Jiang et al. [20] divided pyrolysates into four peaks instead of the traditional S1 and S2 peaks. The first peak detected in the 100–200 °C range was named S1–1, and is considered light, movable oil. The second peak detected in the 200–350 °C range was termed S1–2, and is regarded as heavy, movable oil. The sum of S1–1 and S1–2 represents the free oil. The third peak detected in the 350–450 °C range was called S2–1, and is considered adsorbed oil. The fourth peak detected in the 450−600 °C range was called S2–2, and is classified as residual oil potential cracked from kerogen. Romero-Sarmiento et al. [21] developed a shale play method by using a new Rock-Eval pyrolysis program to evaluate shale resource plays. The modified temperature program started at 100 °C and was then ramped to 200 °C to obtain the Sh0 peak, which corresponded to the free lightest hydrocarbons. A second peak of Sh1 was obtained between 200 °C and 350 °C that represented heavier adsorbed hydrocarbons. The third peak of Sh2 was detected in the temperature range of 350−650 °C, which corresponded to hydrocarbons released from thermal cracking of kerogen and bitumen. The hydrocarbon content was revised as Sh0 + Sh1, and the hydrocarbon quality was defined as Sh0/(Sh0 + Sh1). Abrams et al. [11] proposed a multi-step thermal extraction protocol by using different combinations of heating rates and holding times coupled to a flame ionization detector to provide more compositional details of the retained bitumen. The total oil was calculated from the sum of P200 °C, P250 °C, P300 °C, and P350 °C, while the ratio of P200 °C/(P300 °C + P350 °C) could be used to identify high oil saturation and producible zones.
In order to plan optimal economic oil extraction, measurement of the oil-in-place volumes has been an important and powerful starting point. Oil-in-place can be measured quantitatively using measurements of the distillable oil in an oil shale, specifically from the S1 measurements of a standard Rock-Eval analysis (Peters, 1986 [22]). However, a much higher oil content revealed by multistage pyrolysis than that from standard pyrolysis and a large difference between solvent extracted and unextracted pyrolysate yields indicated that a significant amount of solvent extractable hydrocarbons was not captured in the S1 and rolled over into the S2 peak (Jarvie, 2012 [4]; Han et al., 2015 [23]; Raji et al., 2015 [9]). Collins and Lapierre [24] noted that 20%–65% of the S2 peak was soluble in common organic solvents. Zink et al. [10] found that the total oil included the extractable S2 component was 2.2 to 3.6 times higher than that determined from S1 only. This phenomenon not only overestimates the remaining hydrocarbon generation potential (S2) but also substantially underestimates the amount of original-oil-in-place in sedimentary basins (Abrams et al., 2017 [11]; Han et al., 2017 [25]). Han et al. [23] illustrated for Barnett Shale sequences that the amount of oil-in-place would increase by around 54% when the extractable S2 components were considered. The difference between thermal and solvent extraction yields seemed to be maturity-dependent, and the gap decreased with increasing maturity (Zhang et al., 2020 [18]). However, the proportion of the “total oil” that could be producible remains difficult to determine and requires further investigation.
Another interesting topic in shale oil plays is the compositional difference between free and adsorbed oils. The comparison between oil produced from the reservoir and extract from the source rock can be used as an analogue. Some molecules are preferentially retained in source rock, while others more easily migrate to the reservoir. Generally, the expulsion sequence of petroleum components is governed by the size and polarity with saturated hydrocarbons over aromatic hydrocarbons and over resin and asphaltenes (Leythaeuser et al., 1982 [26], 1988 [27], 1988 [28]; Lafargue et al., 1990 [29]; Sandvik et al., 1992 [30]; Ritter, 2003 [31]; Kelemen et al., 2006 [32]; Eseme et al., 2007 [33]). While molecular fractionation has been observed from intraformational migration over the centimeter scale (Han et al., 2015 [23]), a comparison between the residual oil (bitumen composition after expulsion) and the composition of the expelled oil is still rare in hybrid shale petroleum systems. Here, we report on bulk and molecular compositions of a thermally mature outcrop of the Second White Speckled Shale Formation (2WS) from the Highwood River area in southern Alberta, where organic-rich and organic-lean intervals are interleaved. This formation is one of the emerging hybrid shale oil plays in North America. This study focused on the oil content and composition of those samples regarding physical status and compositional differences. The objective of this study was to provide the opportunity for an in-depth analysis of a source-reservoir system in a typical shale succession. The compositional variations due to expulsion and primary migration from source rocks illustrated in the present study will contribute to a better understanding of the distribution of hydrocarbons generated and stored within the hybrid shale plays.

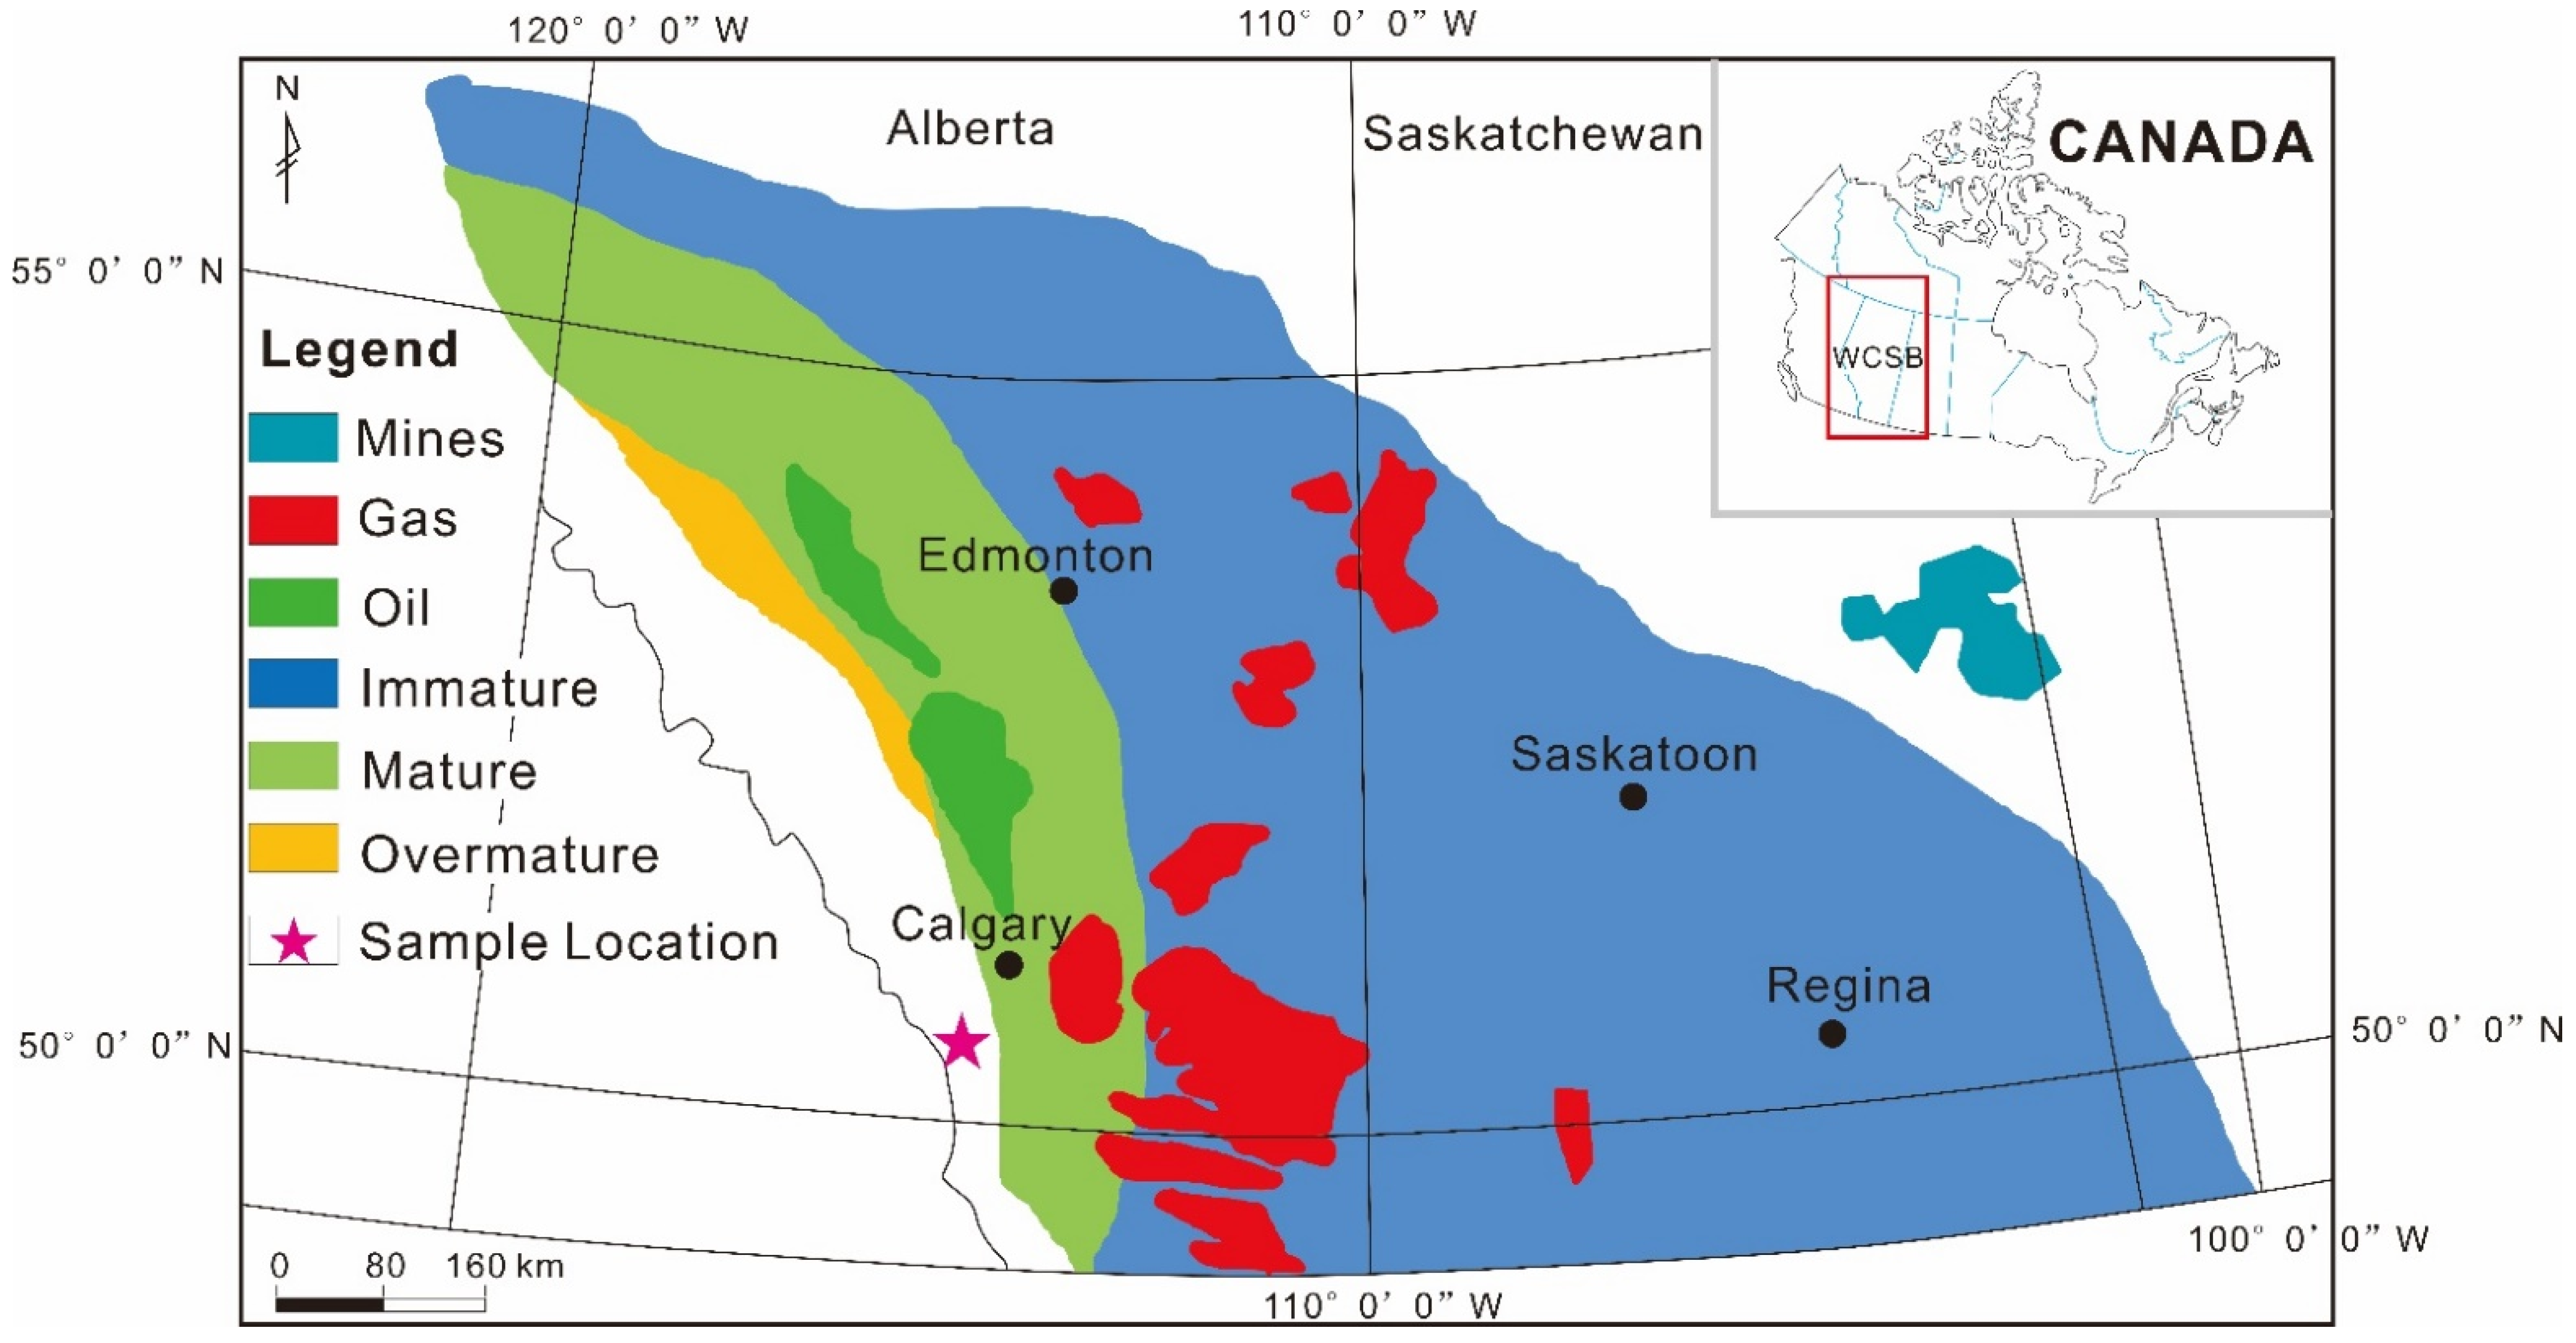
2. Geological Background

The Upper Cretaceous Second White Speckled Shale Formation (2WS) is widely distributed in the Western Canada Sedimentary Basin. It recorded sedimentation during a period of sea level transgression in the Western Interior Seaway (WIS) during the late Cenomanian to Early Turonian (93–91 Ma) (Bloch et al., 1999 [34]). The 2WS depocenter lies in the forebulge region, which developed in the Rocky Mountains southeast of British Columbia and southwest of Alberta during the Late Cenomanian. Warm Tethyan waters of normal salinity entered the northern parts of the basin and induced planktic foraminifera to migrate north. Dynamic marine conditions led to sea-level change and variable mixing of Boreal and Tethyan water in the WIS, which resulted in variability of foraminiferal and nannofossil assemblages. Dinoflagellate assemblages also became more diverse near the Cenomanian/Turonian boundary (Block et al., 1999 [34]). There is no evidence of significant wave activity or influence on sedimentary structures, indicating deposition in relatively deep water, primarily below storm wave bases. This formation has been described as laminated, non-bioturbated limestones to marlstones in Saskatchewan, calcareous shale to siltstone in eastern and southern Alberta, and calcareous siltstone in northwestern Alberta. Abundant millimeter-sized fecal pellets composed mainly of calcareous coccolithic debris gives the dark shales a white speckled character, the origin of the formation name. A basinwide sea-level drop occurs above the 2WS Formation, as evidenced by the change in organic matter type (to Type III), the disappearance of planktic foraminifera and coccoliths, and the deposition of clastic sandstones and conglomerates northwestern of Alberta (Schröder-Adams et al., 1996 [35]; Bloch et al., 1999 [34]).
The abundance of pelagic organisms, coupled with highly reducing preservation conditions, resulted in high total organic carbon (TOC) values across the entire basin, which provide good to excellent source rocks for oil and gas exploration (Bloch et al., 1999 [34]; Furmann et al., 2015 [36]; Synnott et al., 2017 [37]; Huang et al., 2022 [38]). Thermal maturity of the 2WS increases from immature in the east to overmature in the west toward the thrust front of the Rocky Mountains. The immature oil shale near the Manitoba Escarpment has been mined to recover the retortable oil. Giant biogenic gas production has occurred in southeastern Alberta and western Saskatchewan, while normal and light oils sourced from the 2WS were recovered in western Alberta, mainly from the overlying Cardium Fm. (Mossop and Shetsen, 1994 [39]; Bloch et al., 1999 [34]) (Figure 1). It contains more than 450 billion barrels of original oil-in-place, as estimated by the Geological Survey of Canada (Chen and Osadetz, 2013 [40]). The combination of an organic-rich, thermally mature hydrocarbon source rock with intervals of brittle lithology and naturally developed fracture make the 2WS an excellent unconventional oil and gas reservoir (Clarkson and Pedersen, 2011 [2]; Synnott et al., 2017 [37]; Aviles et al., 2019 [41]; Creaney and Allan, 1990 [42]).

3. Samples and Methods
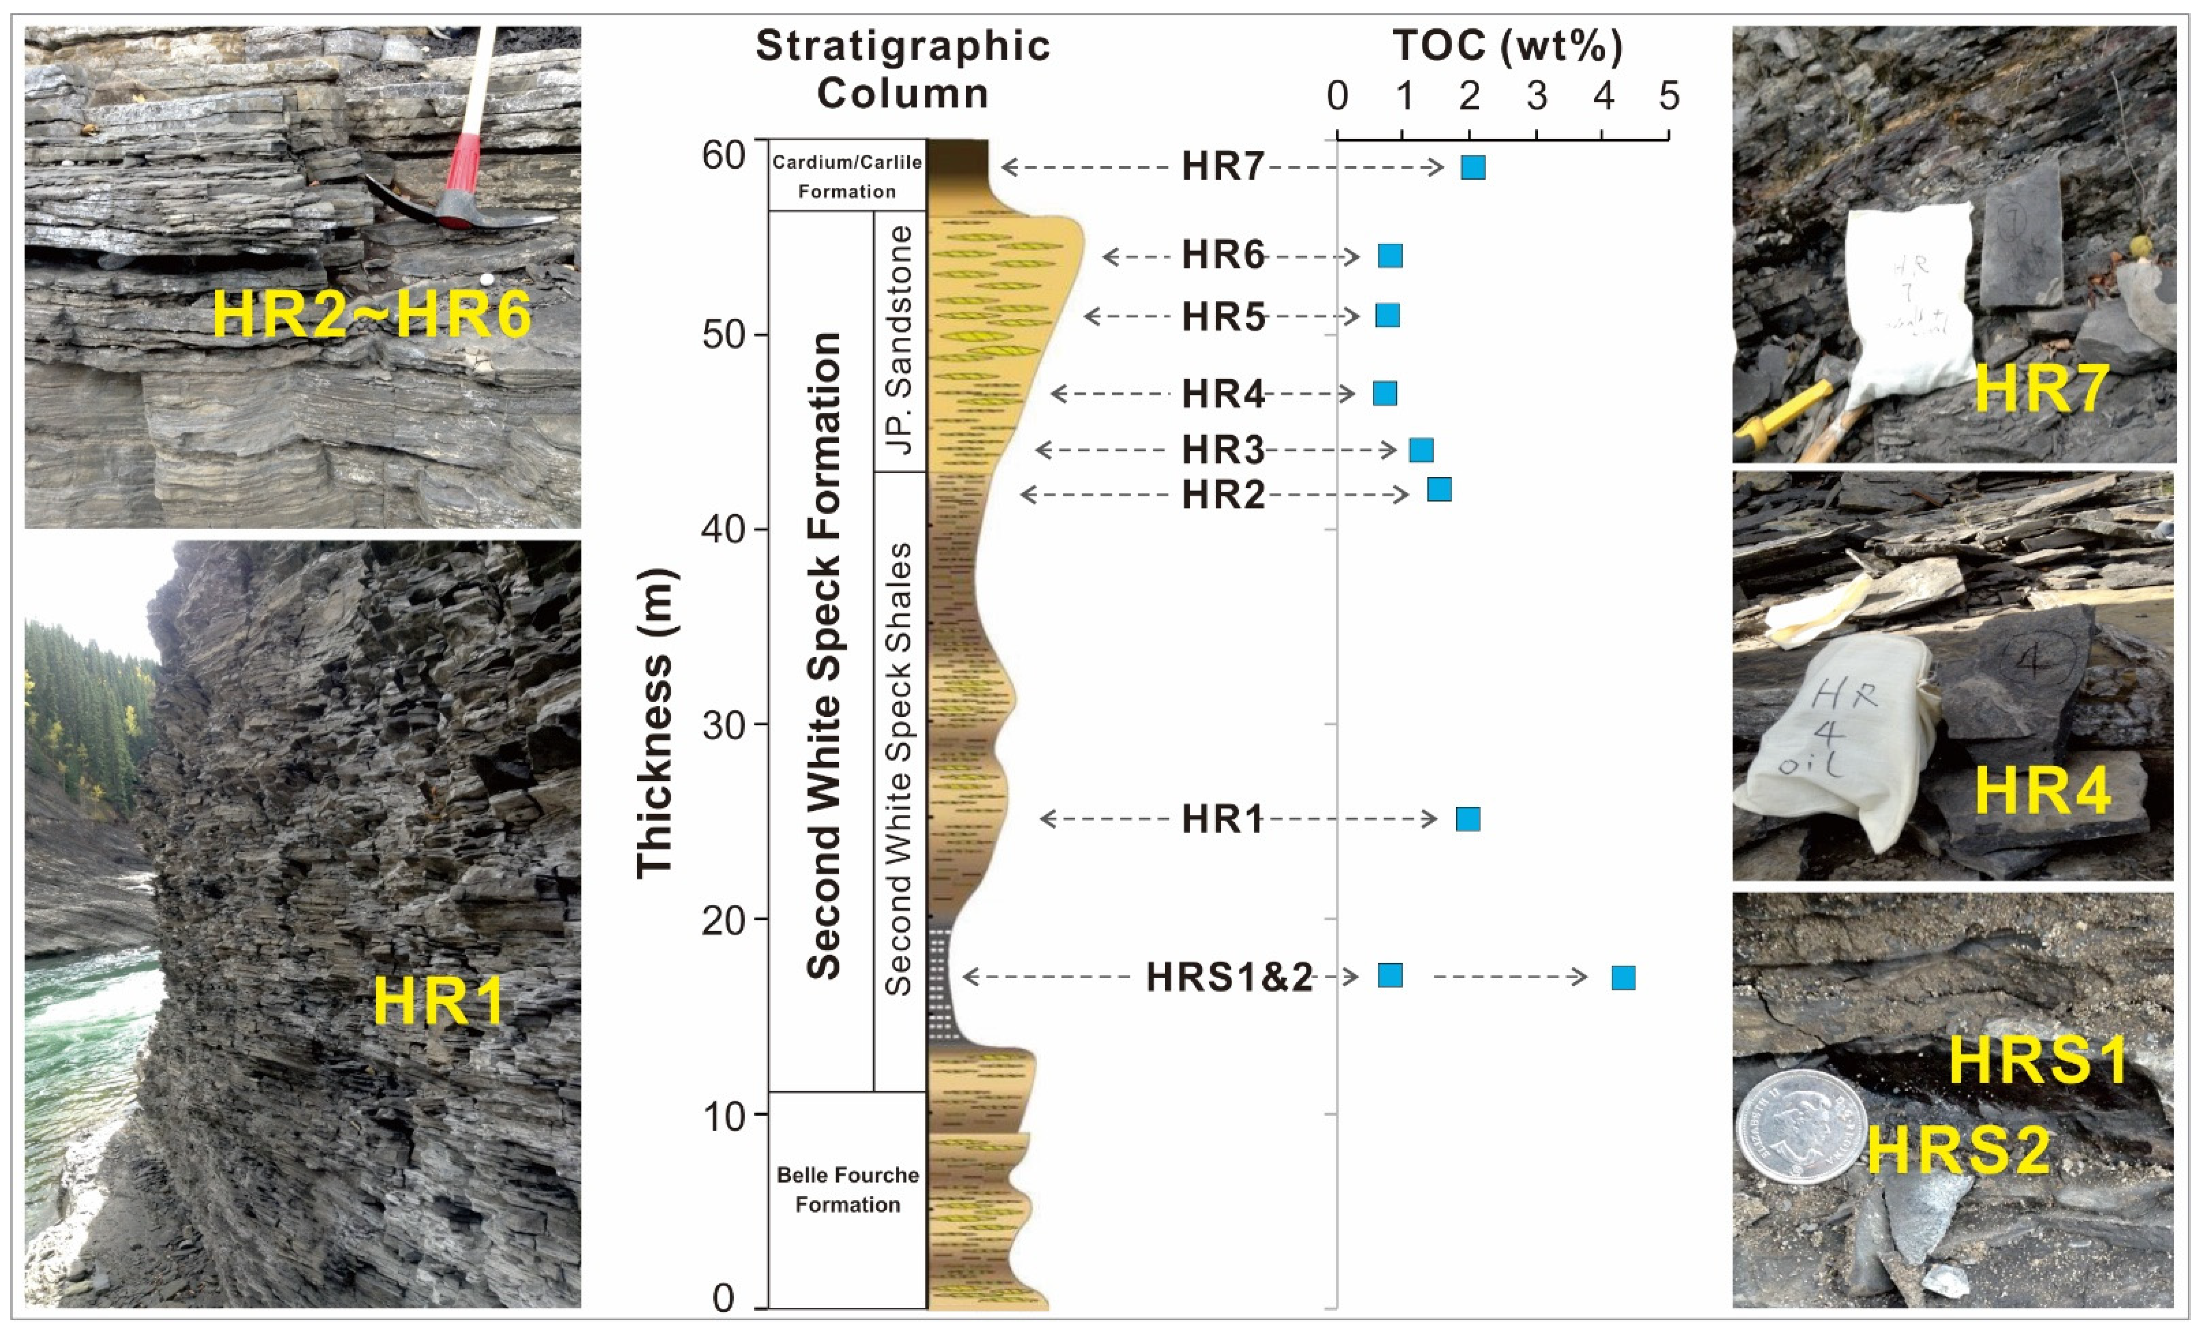
3.1. Samples

The studied samples were collected from a Highwood River outcrop located within the Canadian Rocky Mountain Foothills in southwestern Alberta (Figure 1). The section examined is 60 m thick. The bottom part of the exposed section belongs the Belle Fourche Fm., which is characterized by the presence of a thin bioclastic debris bed. The lower part of the 2WS consists of massive organic-rich shales (2WS shale), which is conformably overlying the Belle Fourche Fm. The Jumping Pound sandstone interval overlying the 2WS shale represents a regressive deposition in shallow water, succeeded in turn by another organic-rich black shale, deposited in deep water (Carlile Fm.). Nine samples were selected for the present study, including a pair of adjacent shale and fine-grained siltstone (HRS1 and 2), two shales (HR1 and 7), and 5 silty shales to siltstones (HR2-6). The photographs of the outcrop illustrate the changes in lithology across the exposed section (Figure 2).

3.2. Analytical Methods

3.2.1. Rock-Eval Pyrolysis

Rock-Eval pyrolysis is widely used for the assessment of the quality and maturity of potential source rocks. It was performed using a Vinci Technologies Rock-Eval 6 Turbo device following the basic method as described by Behar et al. [19]. A flame ionization detector was equipped for monitoring the amounts of hydrocarbons, while an infrared detector was used for monitoring the amounts of CO and CO2. Aliquots of each homogenized powder sample (approximately 50 mg) before and after extraction were used in a single Rock-Eval analysis. A standard program of isothermal at 300 °C for 3 min, then heating to 650 °C with a heating rate of 25 °C/min was applied for hydrocarbon analysis. The residual carbon and inorganic carbon content were determined through oxidation in air and further heating up to 850 °C. The temperature at the maximum of S2 peak (TpS2) was converted to Tmax (°C). Parameters included S1 (mg HC/g rock), S2 (mg HC/g rock), S3 (mg CO2/g rock), TOC (wt %), HI (mg HC/g TOC), OI (mg CO2/g TOC), production index (PI= S1/[S1 + S2]) and MinC (mineral carbon, wt %). Refer to Behar et al. [19] for details.

3.2.2. Sequential Extraction

A sequential extraction technique was applied to rock samples of three particle-size splits using a dichloromethane/methanol (DCM:MeOH, 93:7, v/v) solution to evaluate the oil physical status in the studied samples. The first extraction step was carried out on 8–10 mm diameter shale chips. The samples were weighed and soaked in a clean beaker at room temperature for 48 h, and the solution was agitated by ultrasonication (15 min) for 3 times/day. After the extracted solution was decanted, the chip samples were washed with deionized water three times and then air-dried at room temperature. After the solvent was evaporated, the extract was quantified as the first extractable organic matter (EOM-1), which was considered as free oil. Then, the extracted samples were air-dried, further crushed, and sieved to a particle size of 2–5 mm. The weighed aliquot was re-extracted at room temperature for another 48 h following the same procedure as step 1. The obtained extract was termed EOM-2, which was regarded as adsorbed oil. Finally, the residual samples were dried and ground to a fine powder (~100 mesh) and Soxhlet-extracted for 72 h to obtain the third extract (EOM-3), which was considered to be residual oil.

3.2.3. Gross Composition Separation (SARA)

SARA refers to 4 groups of compounds in oil or bitumen (saturated hydrocarbons, aromatic hydrocarbons, resins, and asphaltenes). The asphaltene fraction was separated by a precipitation process with excess cold hexane, filtered, and weighed. The deasphalted fraction (maltenes) was further separated on a silica gel/alumina column using hexane to elute the saturated hydrocarbon fraction, petroleum ether:DCM (9:1, v/v) to elute the aromatic hydrocarbon fraction, and chloroform to elute the resin fraction, respectively. Only two samples were subjected to SARA separation.

3.2.4. Gas Chromatography–Mass Spectrometry (GC-MS)

About 50 mg of EOM was transferred to a vial, and a suite of internal standards (cholestane-d4, adamantane-d16, phenyldodacane-d30, naphthalene-d8, phenanthrene-d10, and 1,1-binaphthalene) was spiked. Afterwards, polar Florisil solid phase extraction (SPE) cartridges were used to remove asphaltene, and the maltene fraction was transferred to a C18 SPE column to extract the hydrocarbon fraction. The hydrocarbon fraction was further separated into the aromatic and saturated hydrocarbon fractions using silica gel liquid chromatography. A blank control and two standard oils were processed in the identical way as the rock extract to assure quality control.
The total hydrocarbon fraction, as well as saturated and aromatic hydrocarbon fractions, were analyzed using GC‒MS in a selected ion-monitoring mode on an Agilent 7890B gas chromatograph linked to an Agilent 5977A MSD system. The GC column used for separation was a DB‒1MS (60 m × 0.32 mm i.d. × 0.25 μm film thickness), and the GC oven was programmed from 50 °C (1 min) to 120 °C at 20 °C/min, then increased to 310 °C at 3 °C/min with a final hold for 25 min. Helium was used as the carrier gas with a constant flow rate of 1 mL/min. The injector and interface temperature was set at 300 °C, and the ion source was operated in the electron ionization (EI) mode at 70 eV. Concentrations were calculated based on peak area without response factor calibration.

4. Results

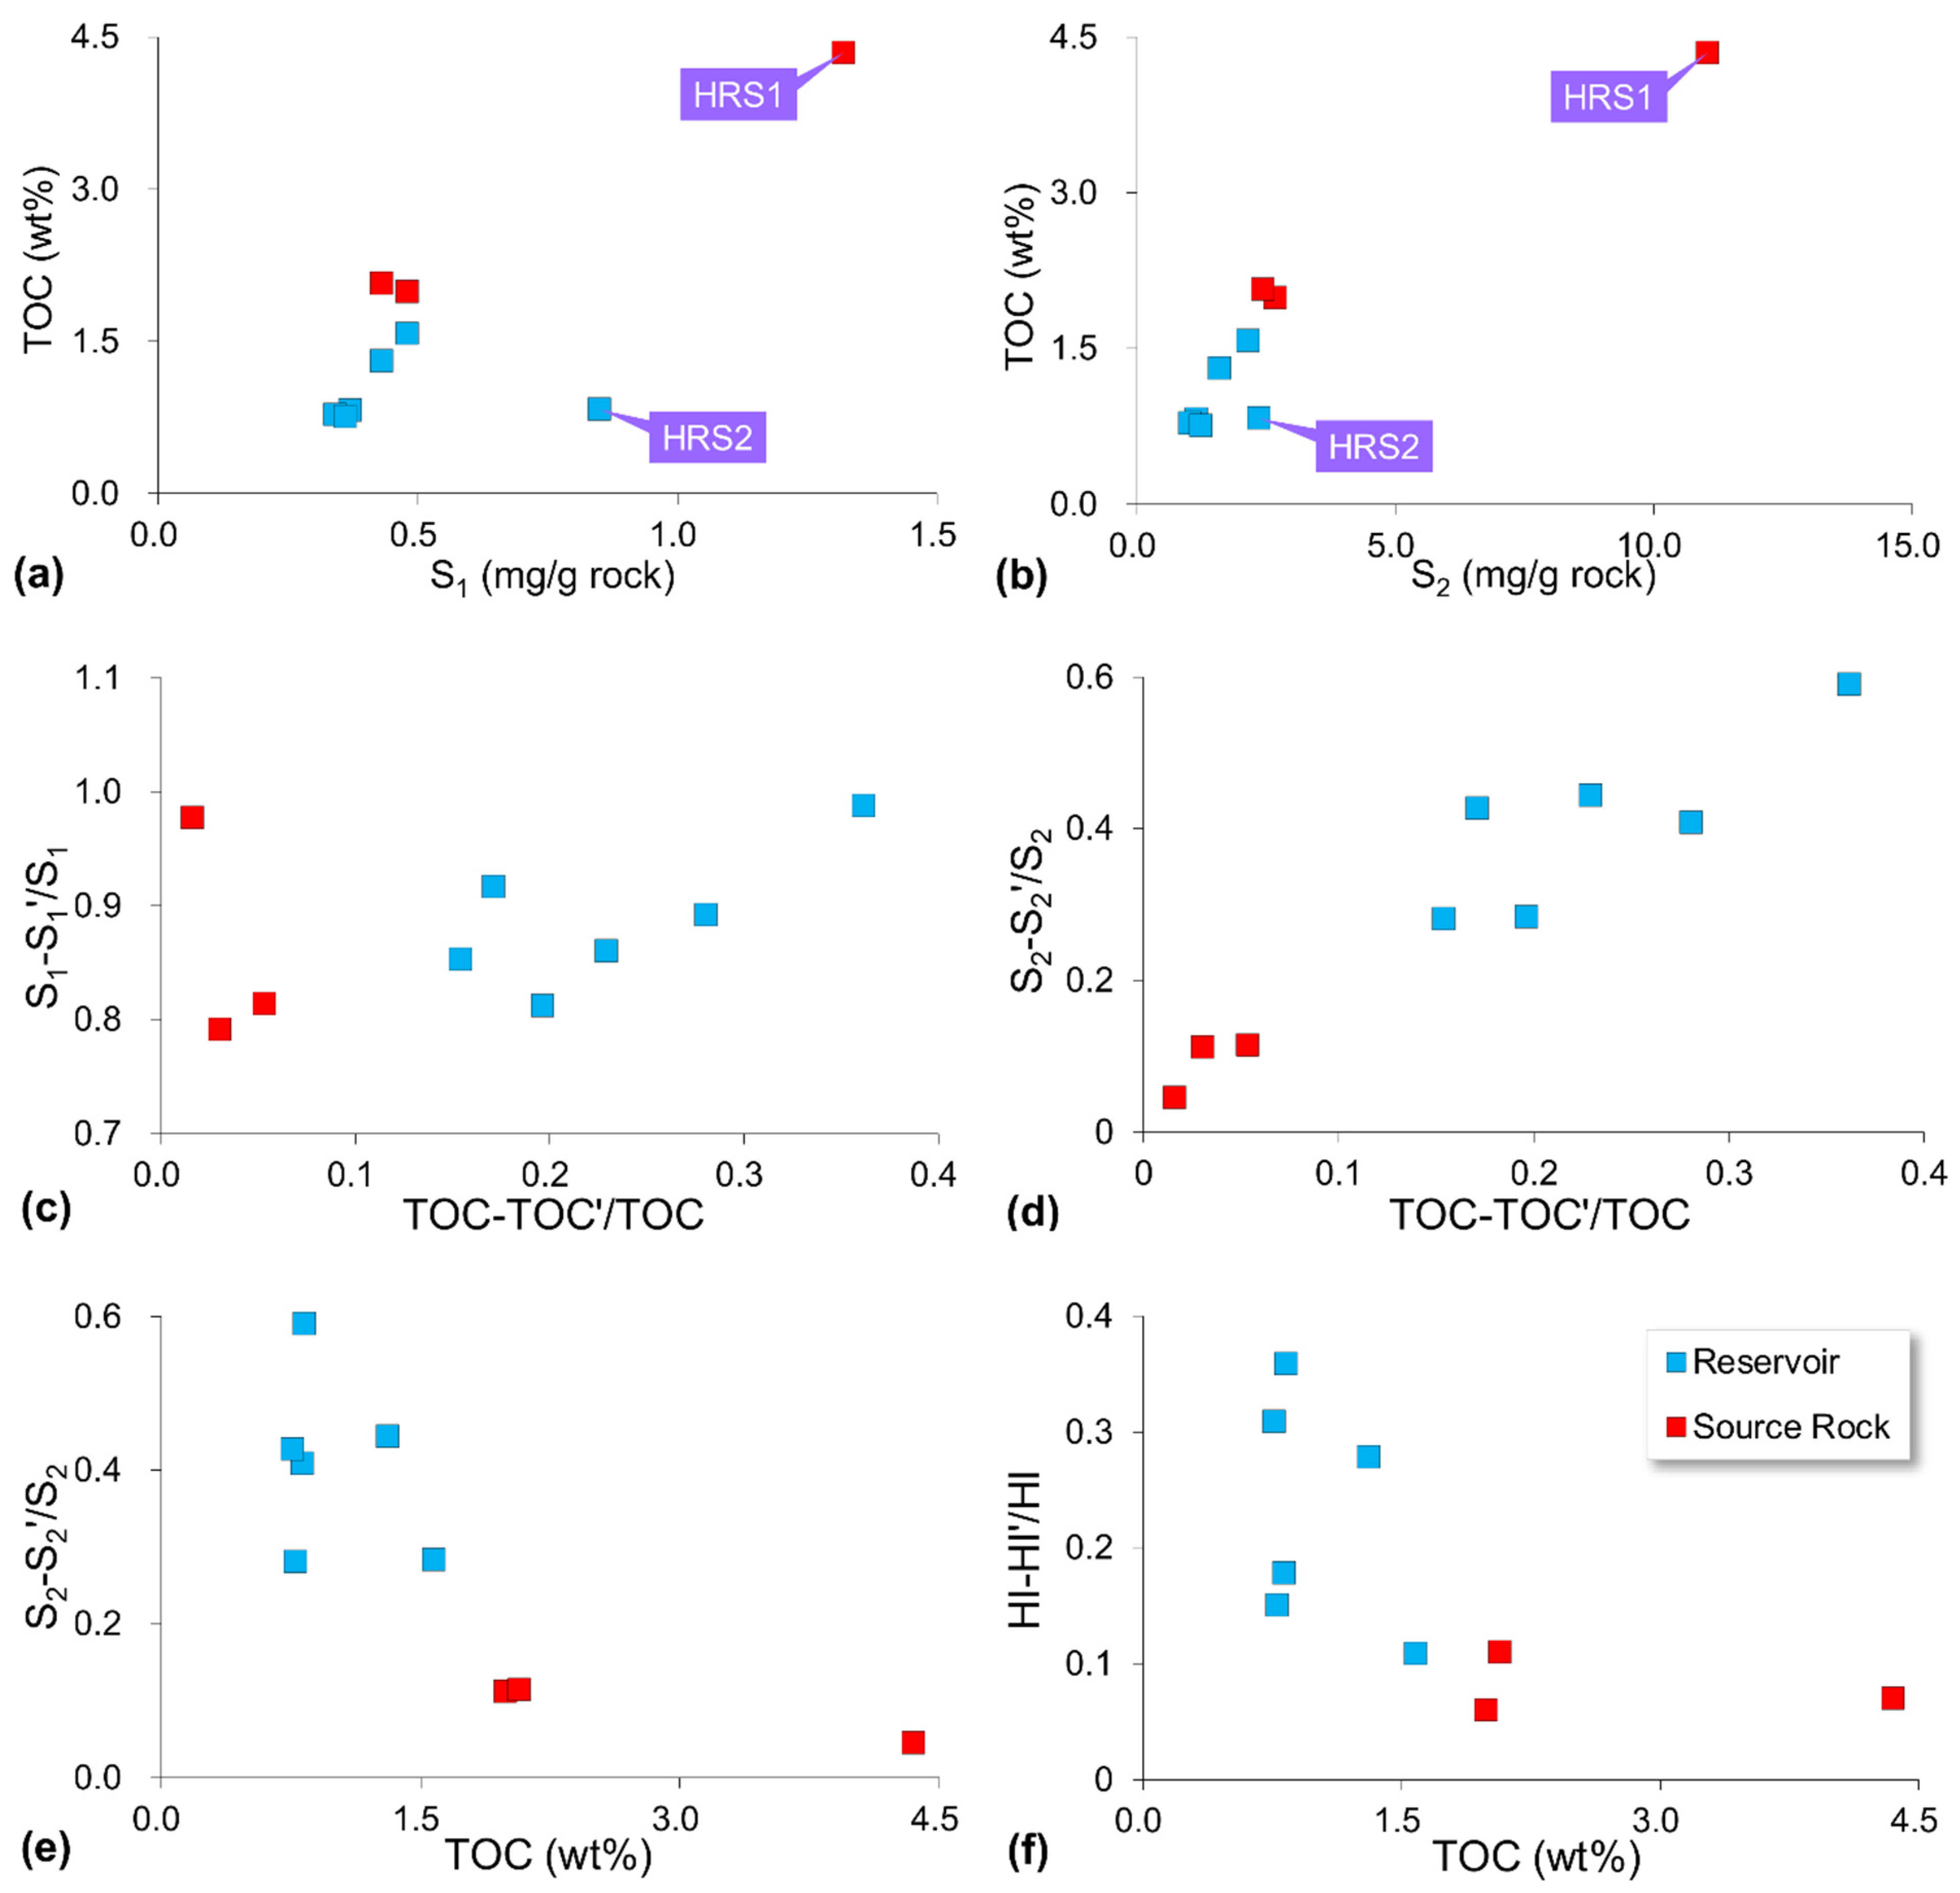
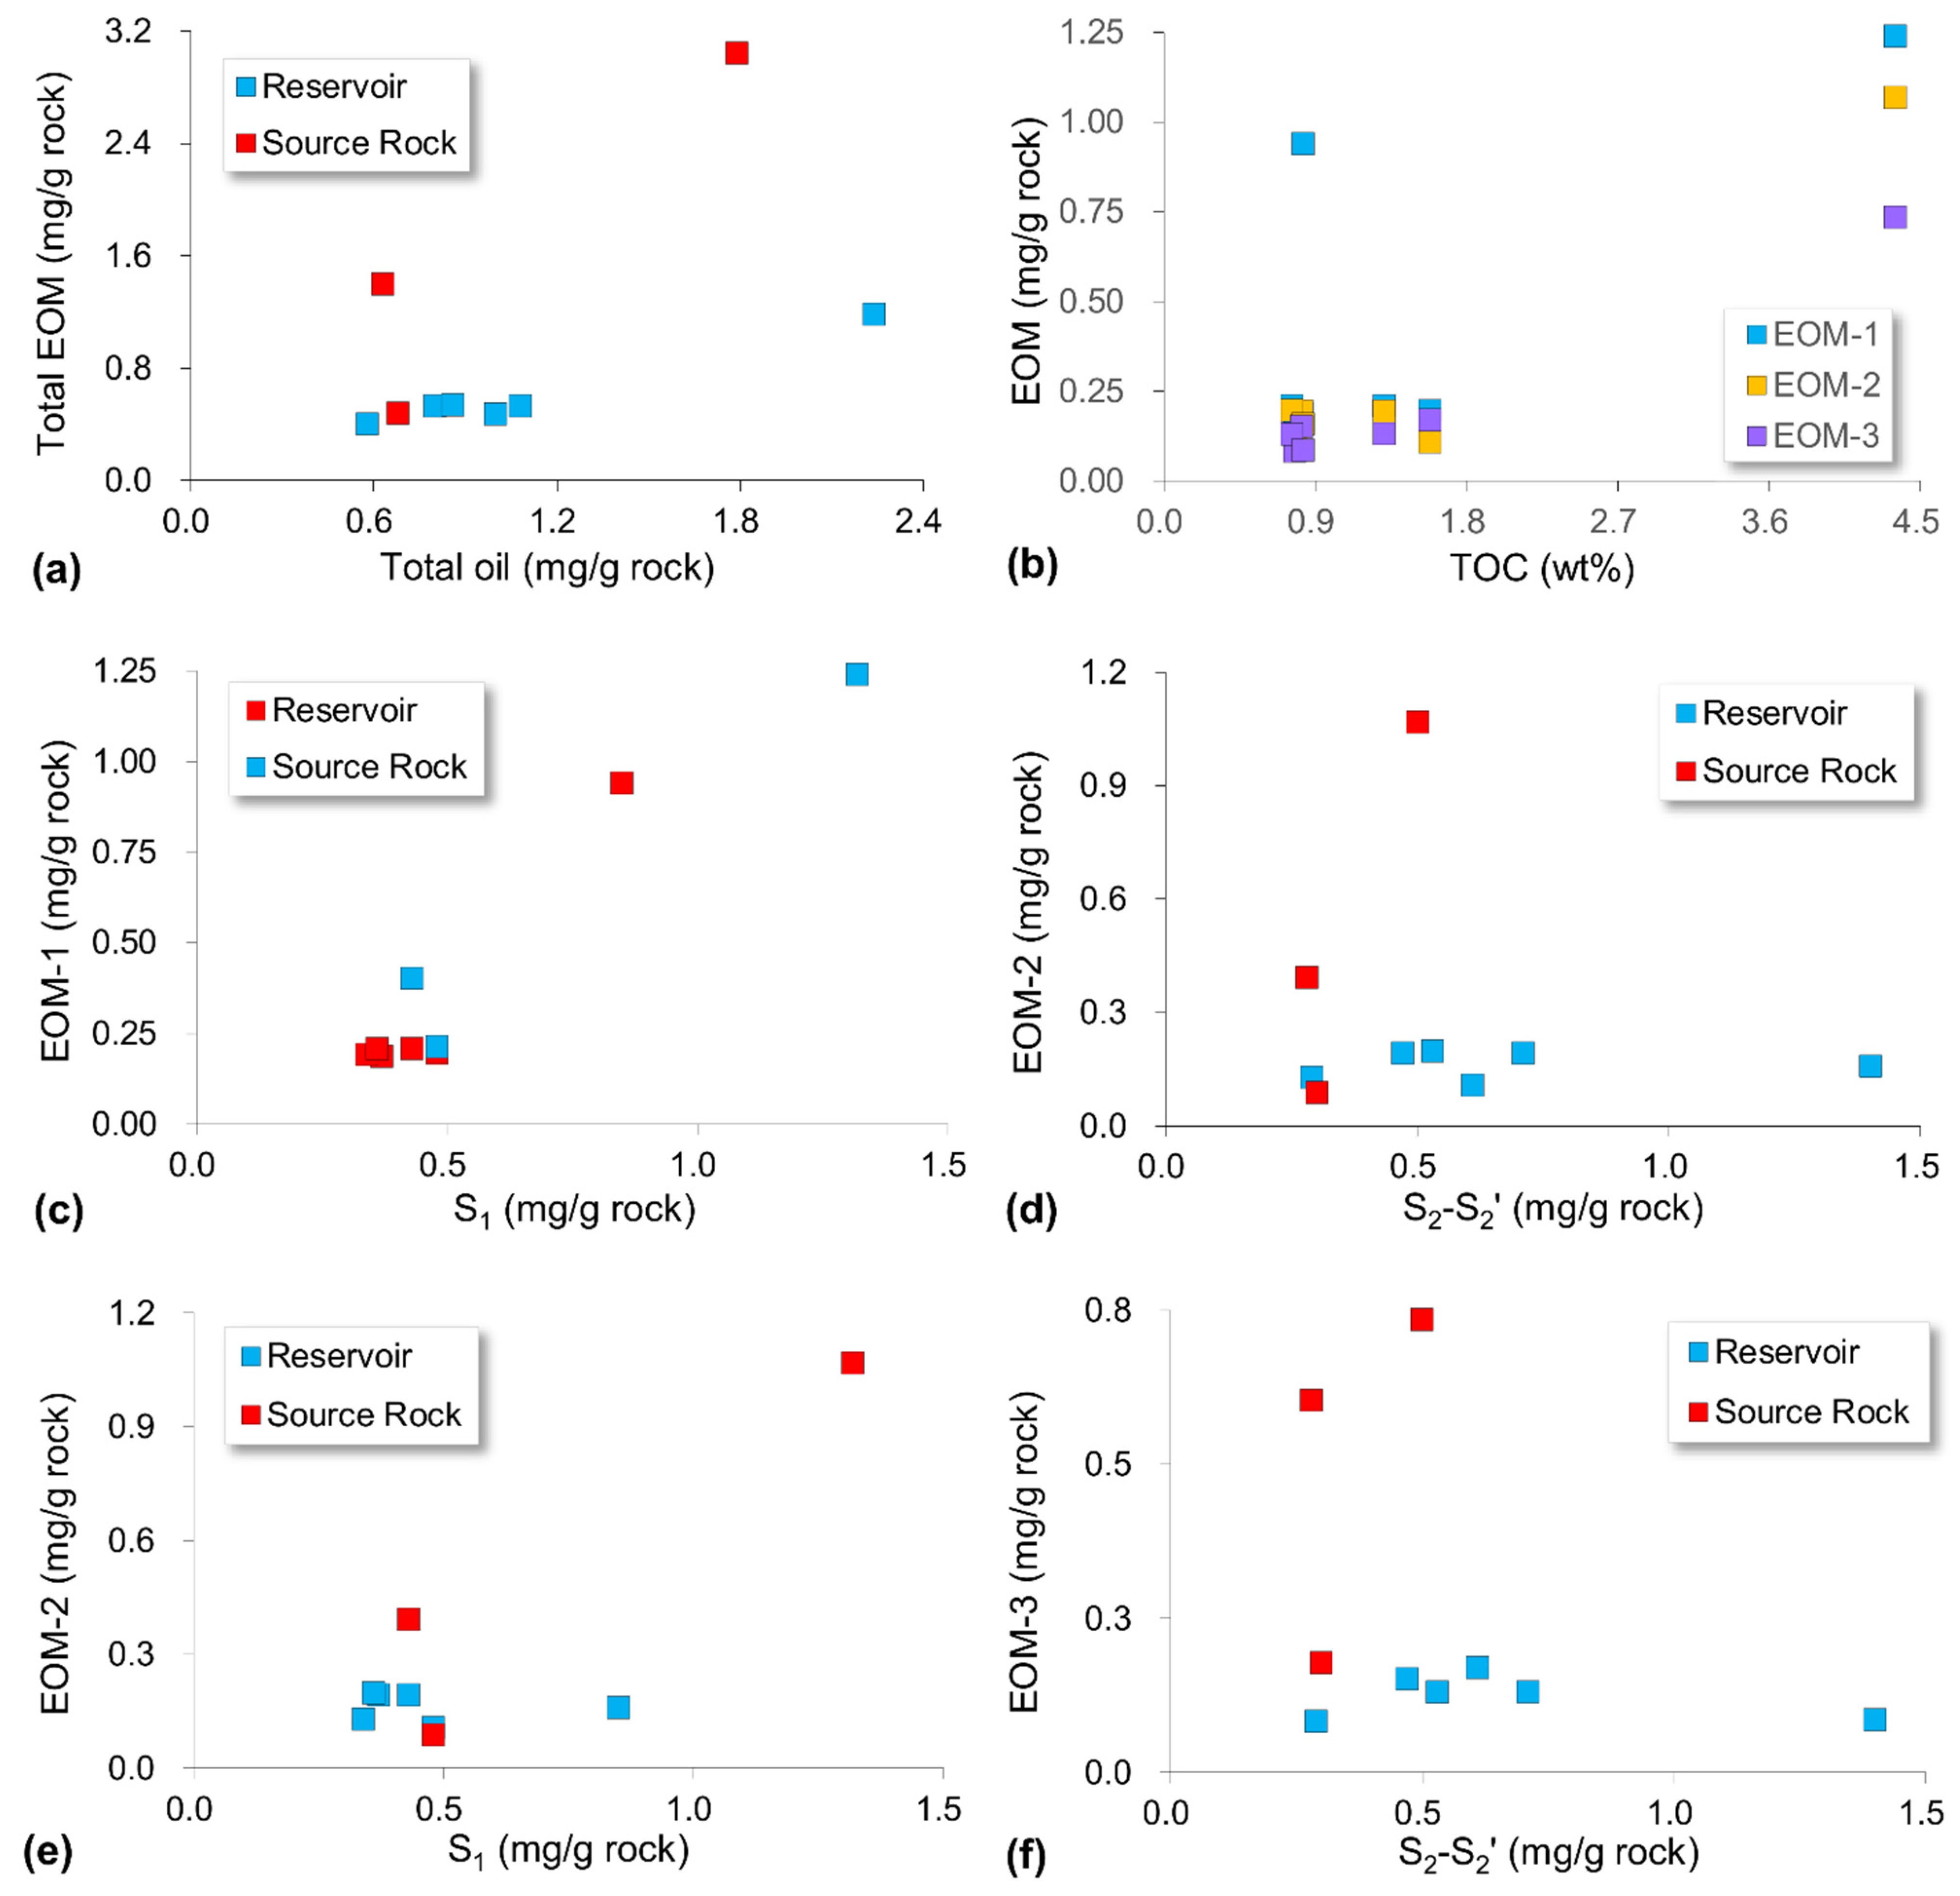
4.1. Rock-Eval Pyrolysis

Rock-Eval pyrolysis results of duplicates of both unextracted and extracted samples are listed in Table 1. A comparison of the Rock-Eval data from the unextracted and extracted sample series demonstrated that differences were most pronounced for S1 values, but large differences existed for the S2 as well. The free volatile hydrocarbon content (S1) ranged from 0.34 mg/g rock to 1.32 mg/g rock, with an average of 0.56 mg/g rock in unextracted samples. The total organic carbon (TOC) content fell in the range of 0.76 to 4.35 wt %, with one sample bearing excellent generative potential and the others bearing fair to good generative potential. Based on lithology and TOC content, three samples (HRS1, HR1, and HR7) were arbitrarily classified as source rocks, while the other six samples (HRS2 and HR2-HR6) were classified as reservoirs in the present study. Plotting the S1 yield against the TOC showed a positive correlation, with a much higher S1 of per 1% TOC in relatively fresh samples (HRS1 and 2) (Figure 3a). The oil saturation index (OSI = S1/TOC) varied between 21 and 102 mg HC/g TOC. The source rock samples were characterized by much lower OSI than the reservoirs; however, an overall low OSI in the studied section was associated with the sample nature from the outcrop.
The residual petroleum generation potential (S2) varied from 1.03 mg/g rock to 11.04 mg/g rock with a mean S2 value of 2.86 mg HC/g rock, indicating a fair quality of the source rocks. The S2 yield was almost linearly correlated with the TOC, although differences between more weathered and relatively fresh samples were noticeable (Figure 3b). The hydrogen index (HI = S2 × 100/TOC) varied from 118 to 286 mg HC/g TOC. Most samples had an HI below 200 mg HC/g TOC because the samples were thermally mature.
The S1 peak was strongly diminished as expected in the extracted samples, with residual thermally extractable bitumen < 0.1 mg/g rock (Table 1). Solvent extraction fraction removed 81%–99% of S1. There were consistent reductions in the TOC and S2 after solvent extraction in comparison with the unextracted samples. The S2 peak in the extracted samples varied in the range of 0.57−10.54 mg/g rock (Table 1), suggesting that the extractable S2 content (S2–S2′, herein) varied from 4.5% to 59.1% of the unextracted S2, with an average value of 30.1%. The TOC contents ranged from 0.63 wt % to 4.28 wt % in the extracted samples (Table 1), while the loss of TOC varied from 1.6% to 36.1%, with an average value of 16.6% after extraction. There was some authigenic organic matter in those silty shale reservoir samples. The HI values were in the range of 88−246 mg HC/g TOC (Table 1), which dropped 3.0%–35.9%, with an average value of 17.4%. While a small proportion of S1 was non-extractable by the selected solvent, its content was poorly correlated with the loss in TOC (Figure 3c). On the contrary, the proportion of extractable S2 was well correlated to the loss in TOC, with a linear correlation coefficient of 0.9 (Figure 3d). The “S2 oil” proportion, and similarly the % HI loss upon extraction, decreased with increasing TOC (Figure 3e,f). A rather constant proportion of compounds was solvent-extractable from the organic and mineral matrices.
Jarvie [4] proposed a method for estimating the so-called “total oil content” of rocks using Rock-Eval pyrolysis data (S1, S2) combined with solvent extraction, a similar approach to those described elsewhere (Delvaux et al., 1990 [44]; Han et al., 2015 [23]; Zink et al., 2016 [10]). The extractable S2 fraction was termed “S2 oil” by Jarvie [4], while the unextractable S1 was subtracted from the S1 in the total oil calculation. Therefore, the total oil can be defined as (S1 − S1′) + (S2 − S2′), which varied from 0.58 mg/g rock to 2.24 mg/g rock in the studied samples (Table 1). This “S2 oil” increased the total oil amount compared to the conventional free oil (S1) by factors ranging between 1.4 and 2.6, with an average factor of 2.0.
The maximum temperature at the S2 peak (Tmax) in the unextracted samples ranged from 439 °C to 452 °C, indicating the source rocks were thermally mature. The Tmax values for the extracted samples were, as expected, overall similar to the unextracted ones. However, an increase in Tmax was observed for the relatively fresh samples (HRS1 and 2) when large proportions of soluble bitumen were removed, whereas more weathered samples (HR1-7) clearly showed a shift to lower Tmax values after extraction (Table 1). Theoretically, the removal of the extractable organic matter after Soxhlet extraction will result in a shift to higher Tmax values due to the bitumen impregnation effect (Delvaux et al., 1990 [44]; Han et al., 2015 [23]; Zink et al., 2016 [10]). A lower Tmax after extraction in some samples suggested that a large proportion of free hydrocarbons (S1 peak) had already been lost due to outcrop weathering.
The production index (PI = S1/(S1 + S2)) values were used to assess the degree of thermal maturity of the investigated source rocks. Generally, low PI values (<0.3) indicated immature or postmature organic matter. However, the low PI values in the studied samples, coupled with their poor correlation with the Tmax values, suggested other alteration processes, especially the loss of hydrocarbons during outcropping and weathering, were involved.

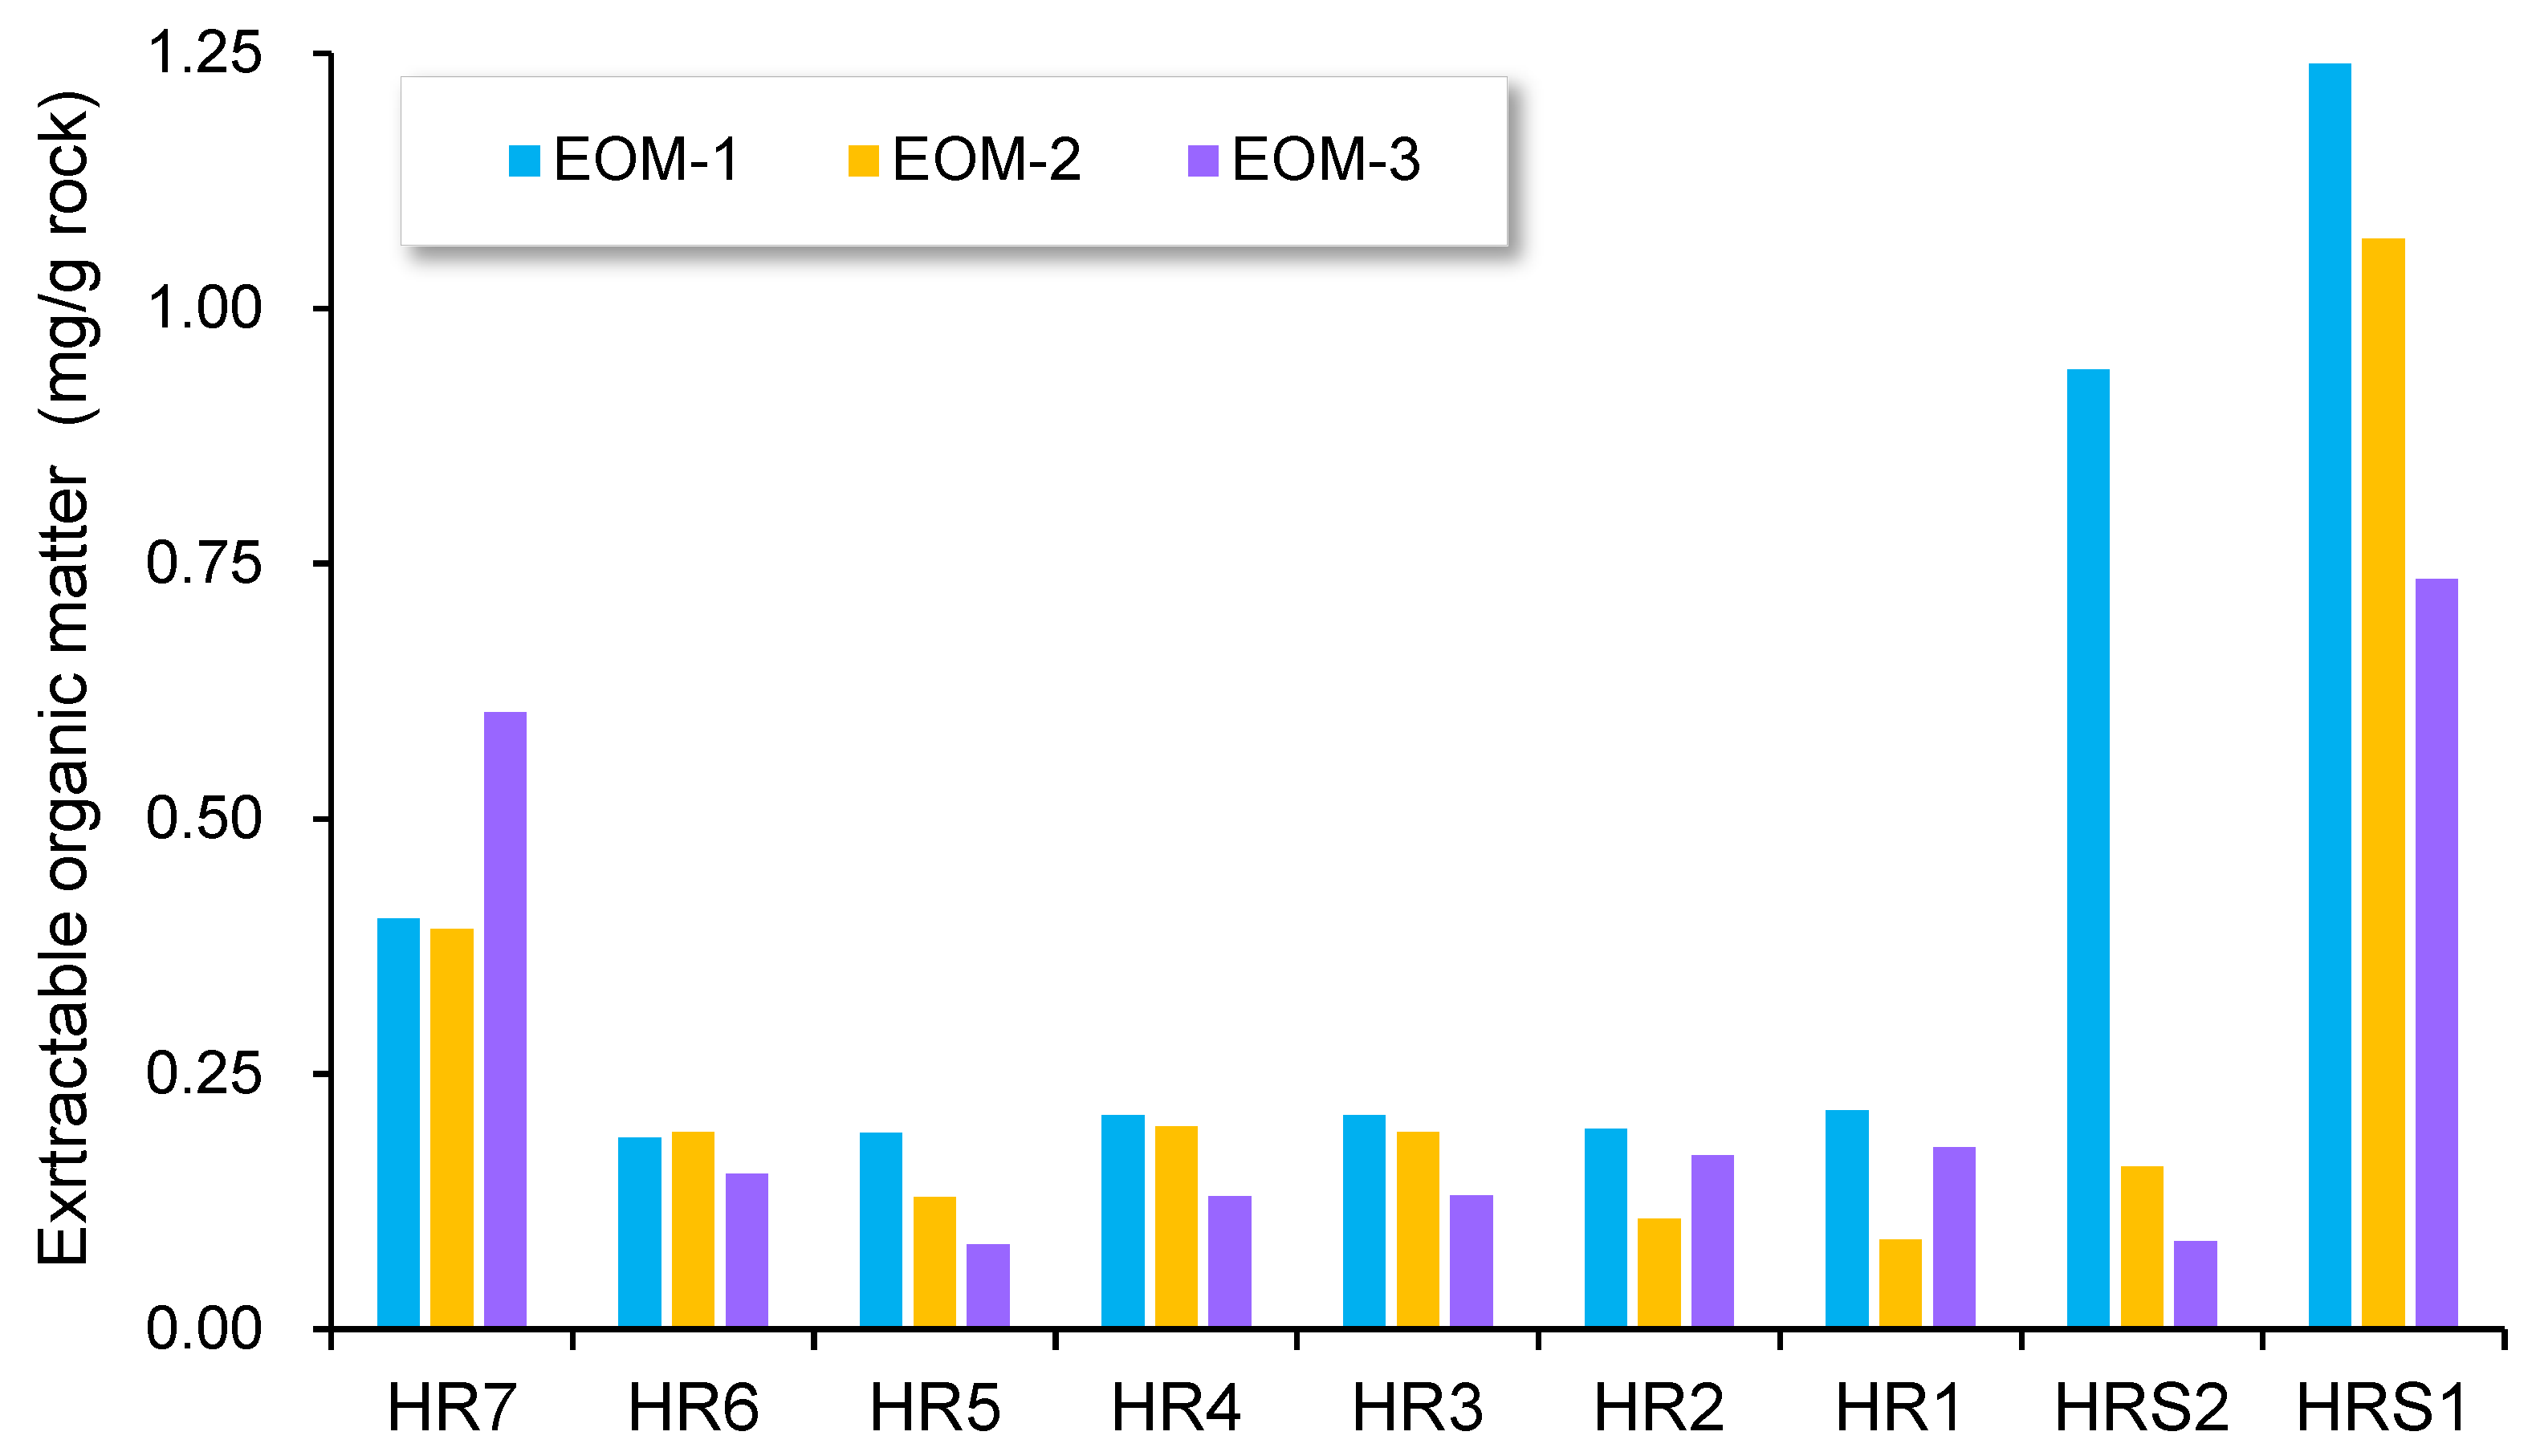
4.2. Sequential Extraction

The sequential extraction results for the studied samples are shown in Figure 4. The total EOM content was in the range of 0.4–3.04 mg/g rock, with an average of 0.95 mg/g rock. The EOM-1 yield was in the range of 0.19–1.24 mg/g rock, and accounted for 44.1% of the total EOM content. The EOM-2 and EOM-3 yields varied in the ranges of 0.09–1.07 mg/g rock and 0.08–0.74 mg/g rock, and accounted for 29.4% and 26.4%, respectively. Two relatively fresh samples (HRS1 and 2) had much higher extractable organic matter than other samples, and the difference between each step was also much sharper. The source rock (HRS1) showed a gradual decrease of EOM yield from each step, corresponding to 40.7%, 35.1%, and 24.2% of total EOM, respectively, while the reservoir (HRS2) showed a strikingly different EOM yield from each step, corresponding to 79.3%, 13.4%, and 7.3% of total EOM, respectively. Other samples had much lower EOM yields, and displayed irregular patterns with extraction steps (Figure 4).
There was a generally positive correlation between the total EOM and total oil derived from the Rock-Eval pyrolysis. However, reservoirs contained more total oil than the total EOM, while source rocks displayed the opposite trend, where the total EOM was higher than the thermally desorbed oil (Figure 5a). The correlation between TOC and EOM is shown in Figure 5b. A positive correlation between each EOM and TOC can be observed, especially those between EOM-2, EOM-3, and TOC, suggesting that TOC content was the main constraint for adsorbed and residual oils. A linear correlation between EOM-1 and Rock-Eval S1 can be observed for the studied samples regardless of the lithology variation (Figure 5c). While EOM-2 can be considered as the adsorbed oil, and should be closely related to “S2 oil”, the overall correlation between them was weak. The reservoirs seemed to behave differently from the source rocks. A good correlation between EOM-2 and “S2 oil” can be observed for the source rock samples, but not for the reservoirs (Figure 5d). A similar relationship can be noted between EOM-2 and S1 (Figure 5e), but the correlation between EOM-3 and “S2 oil” was poor for both source rocks and reservoirs (Figure 5f).

4.3. SARA Compositions

SARA separation was performed on two representative samples (HR1 and HR3) by using the extracts from the large chips (EOM-1) and powder (EOM-3). Since both samples were weathered outcrop, the bulk fraction could hardly represent their original compositions. The saturated hydrocarbon content in HR1 was much higher than that in HR3, likely reflecting different preservation conditions. HR3 had suffered more extensive hydrocarbon loss than HR1. Overall low saturated hydrocarbons, together with a high content of asphaltenes in the large chip extracts, were governed by the nature of the outcrop samples, which differed significantly from the fresh core, but the trend remained meaningful. Both samples showed similar changes in EOM-1 and EOM-3. The decrease in the relative abundances of saturated and aromatic hydrocarbons accompanied by substantial increase of the relative abundances of asphaltenes indicated the removal of adsorbed hydrocarbon phases. However, the proportion of resins showed the opposite trend: it increased slightly in HR1 but decreased in HR3 (Table 2).

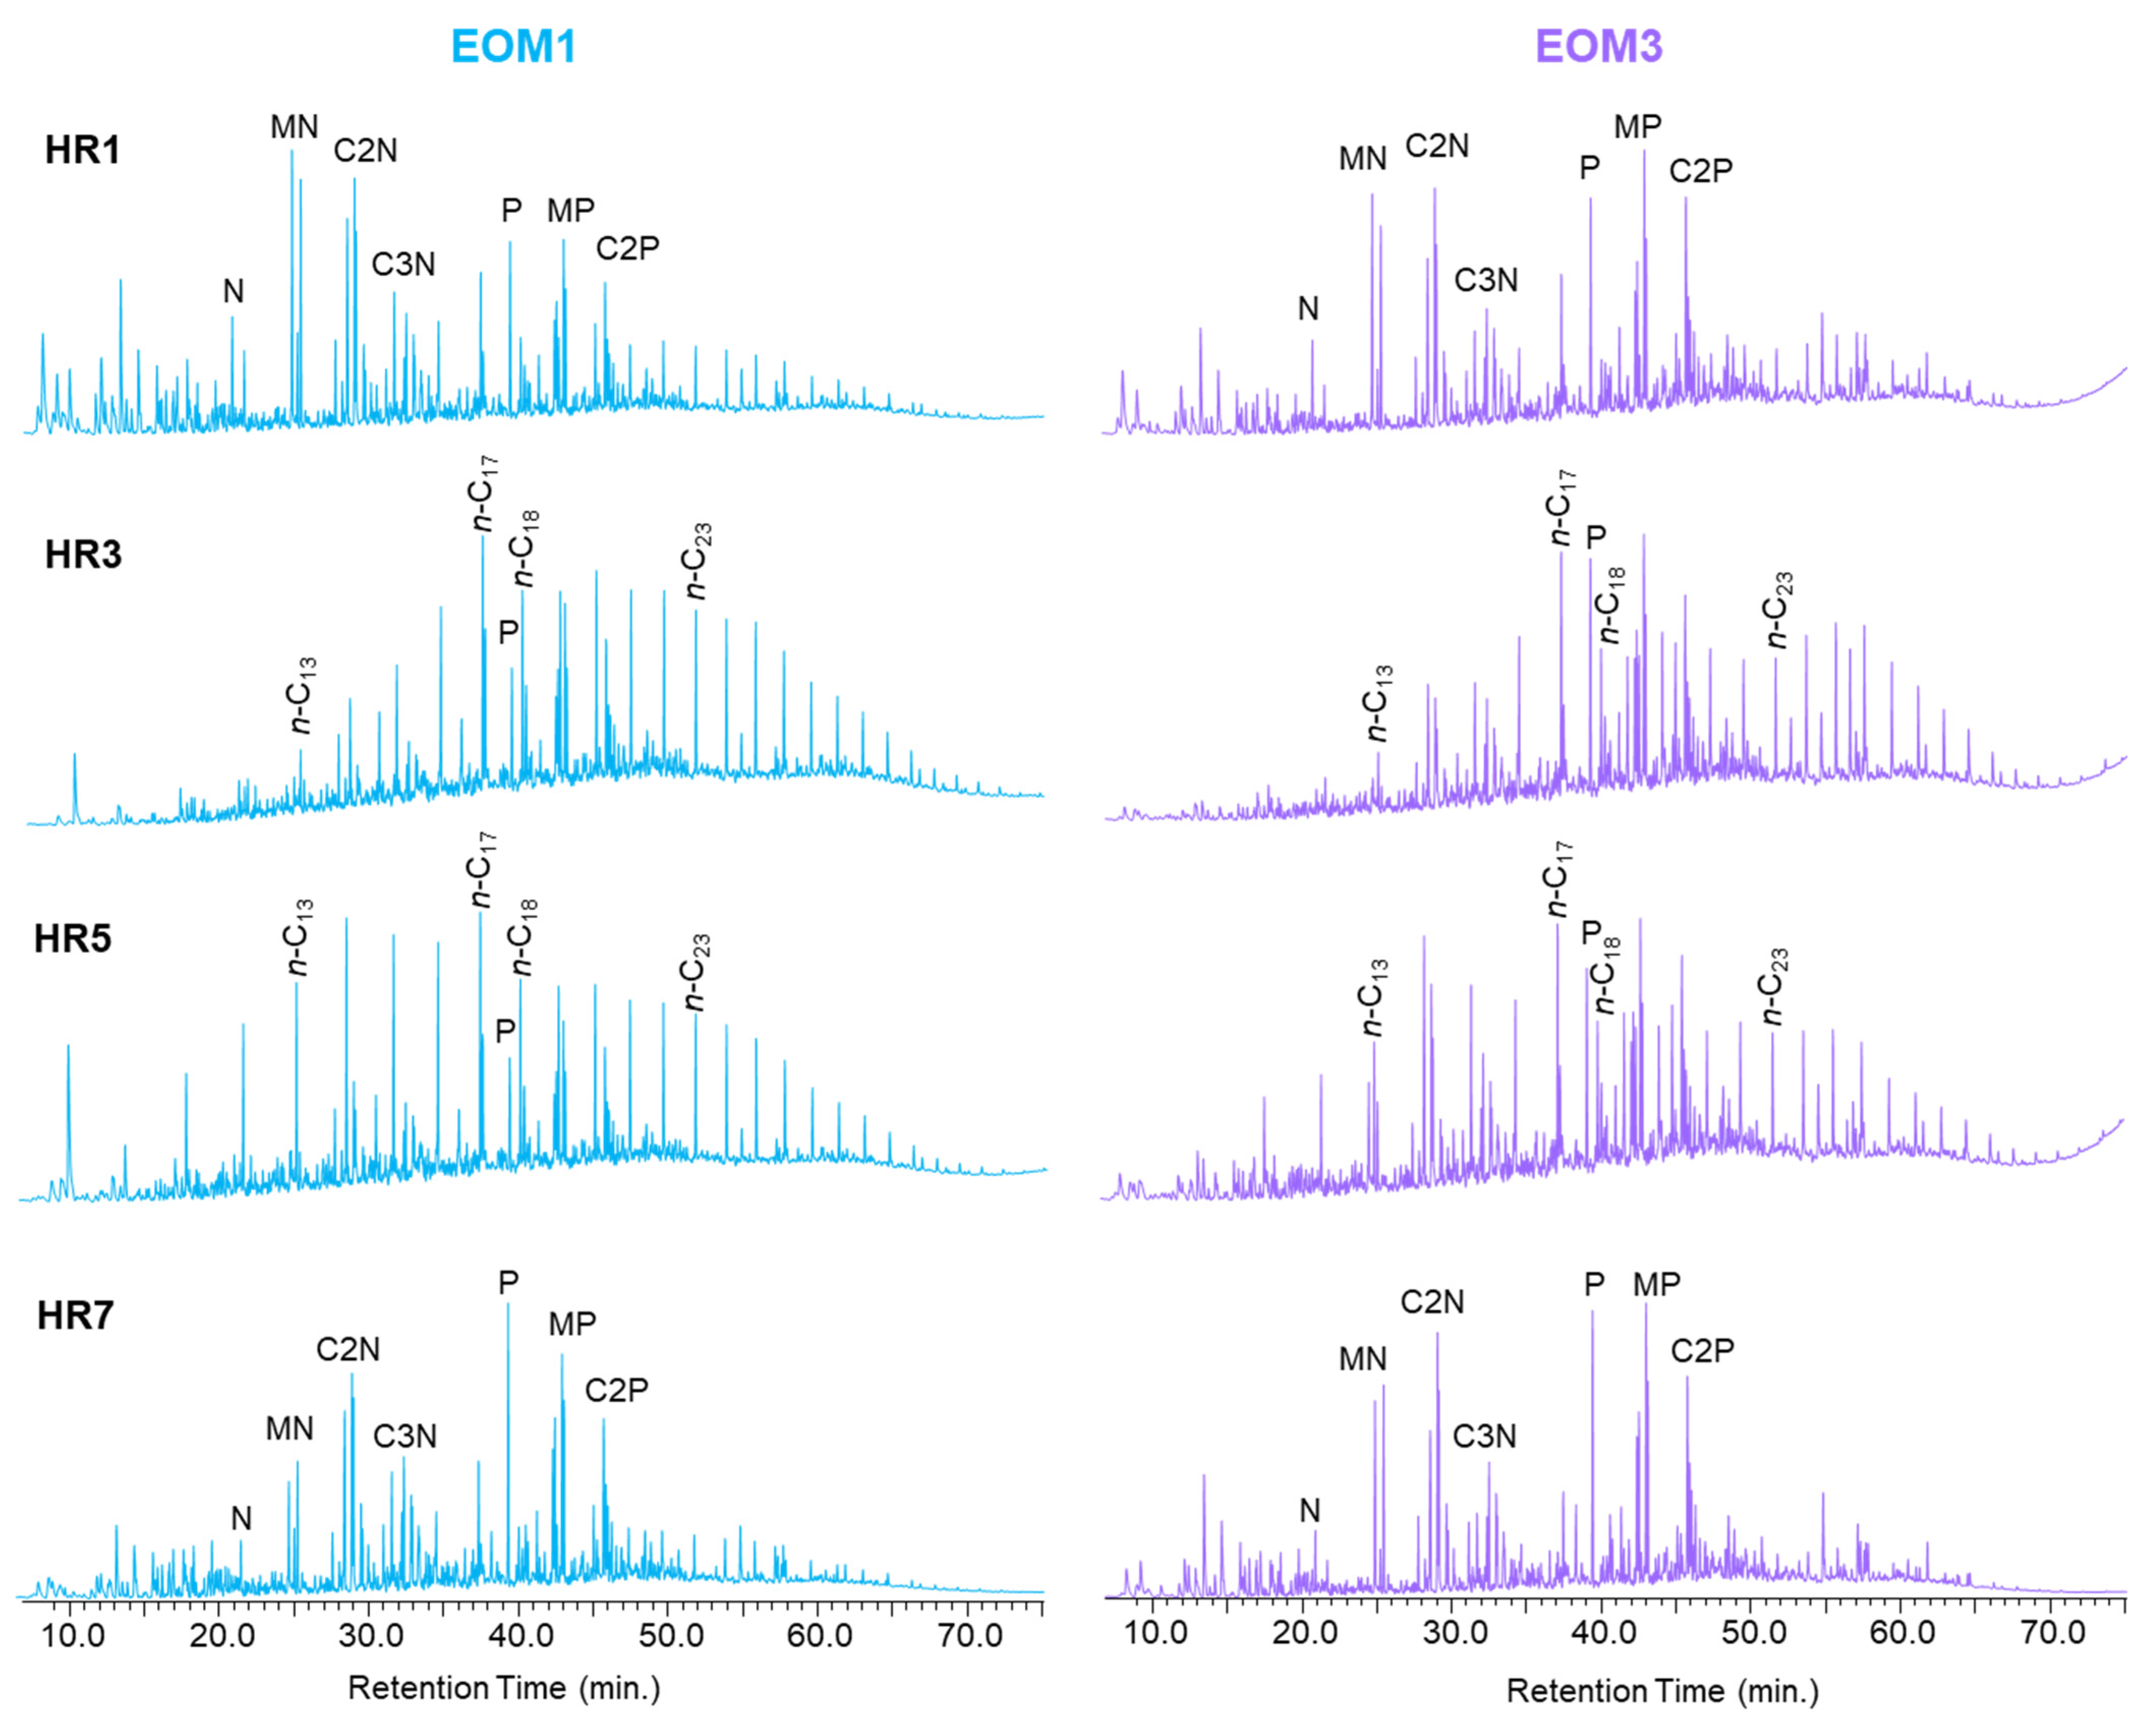
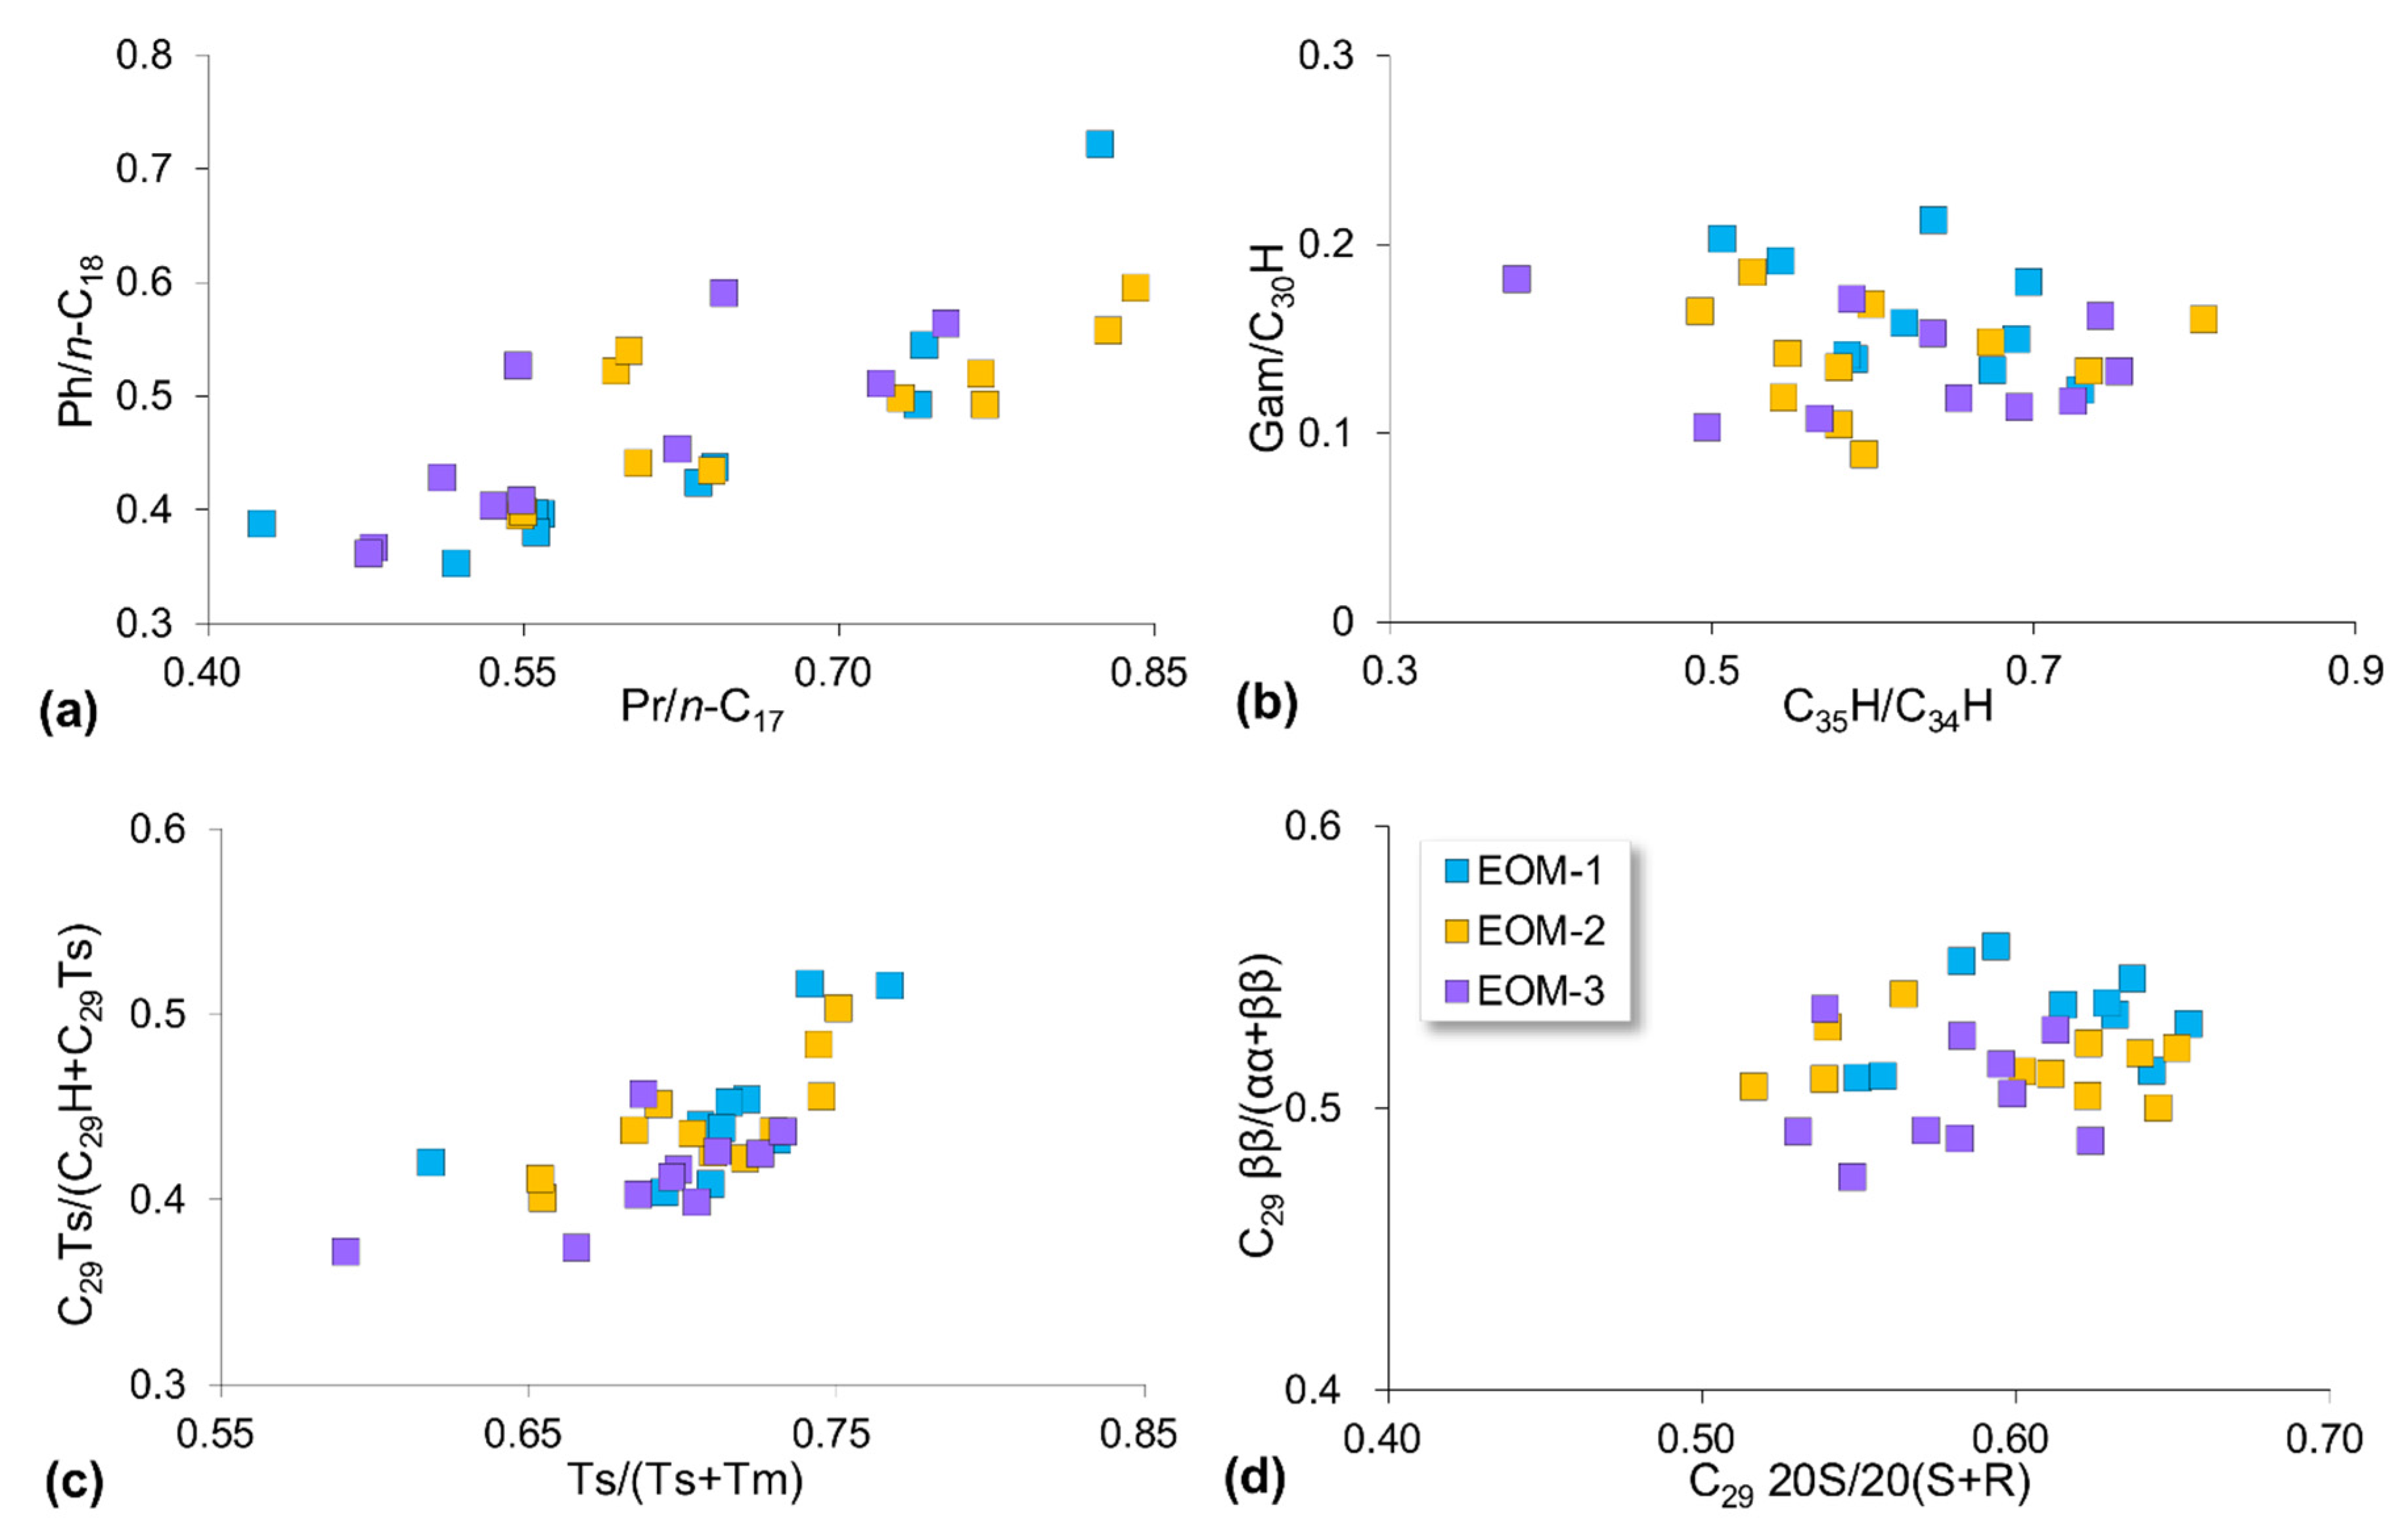
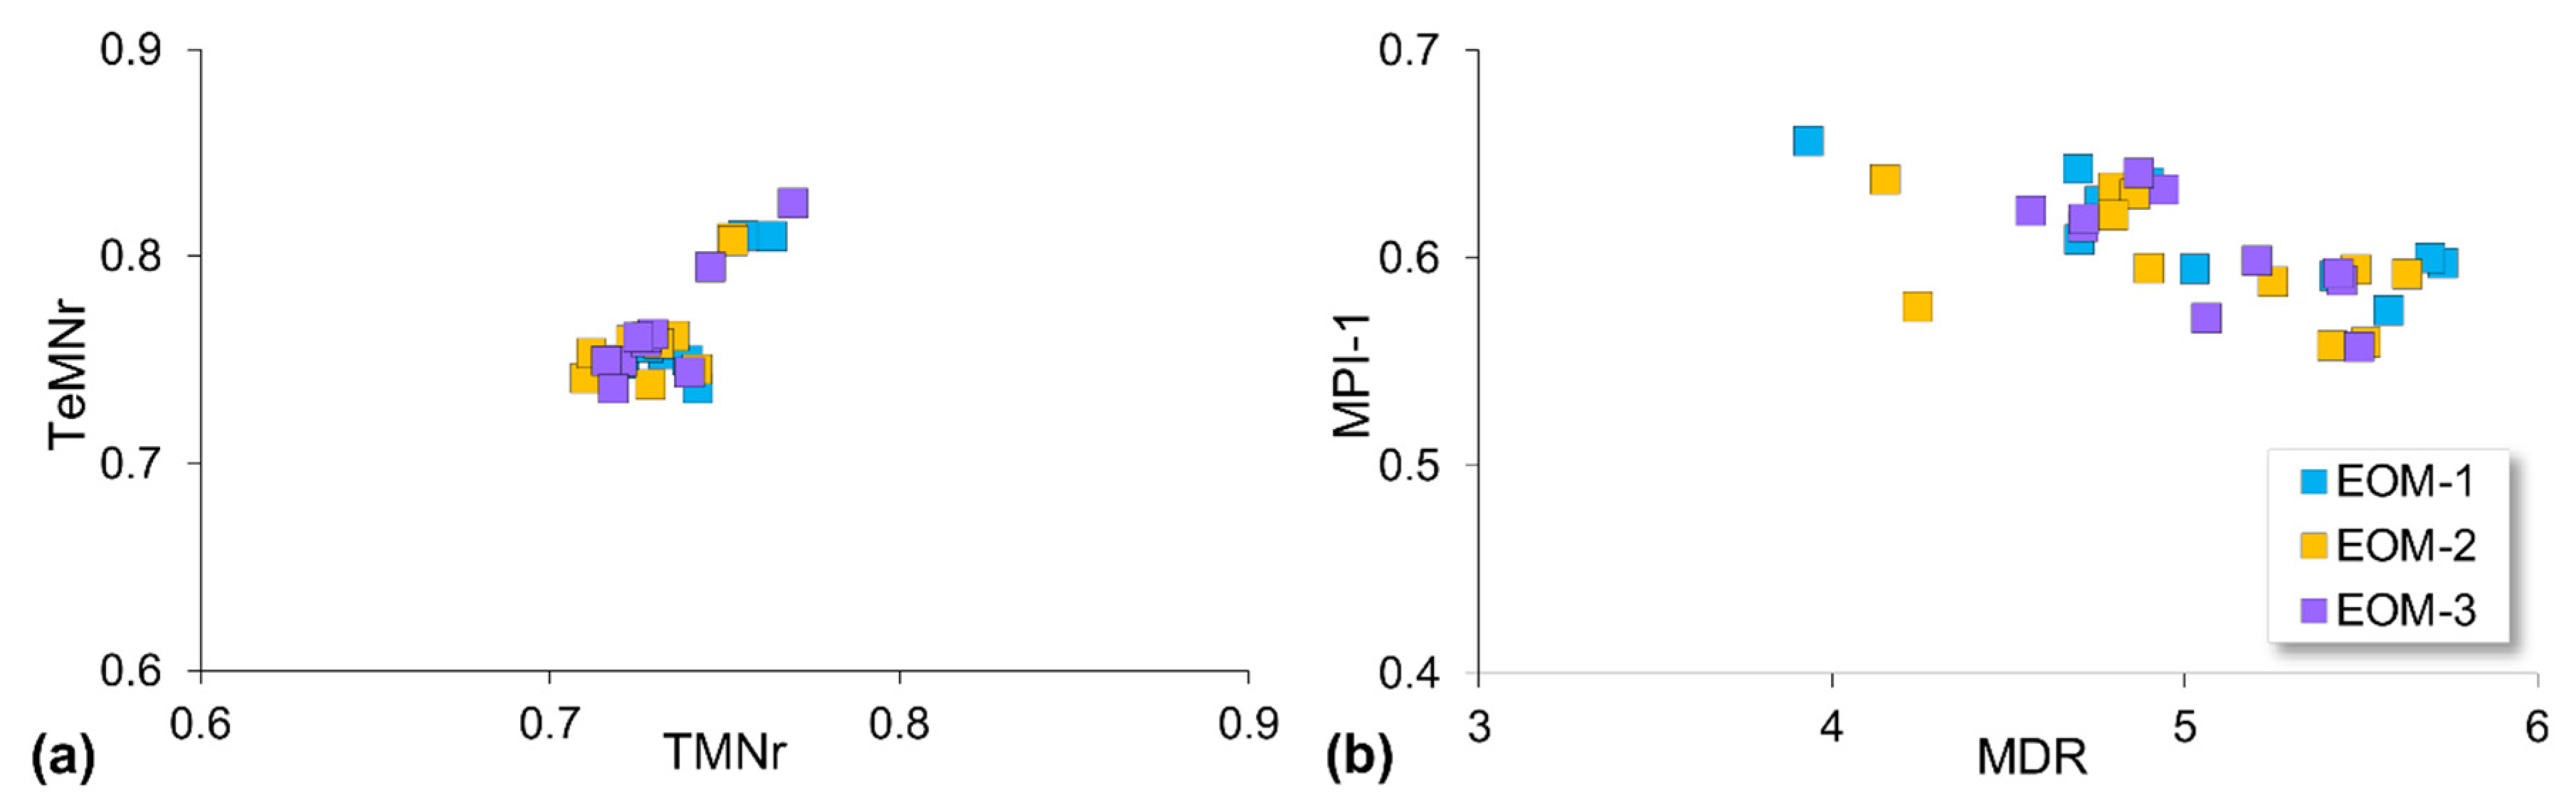
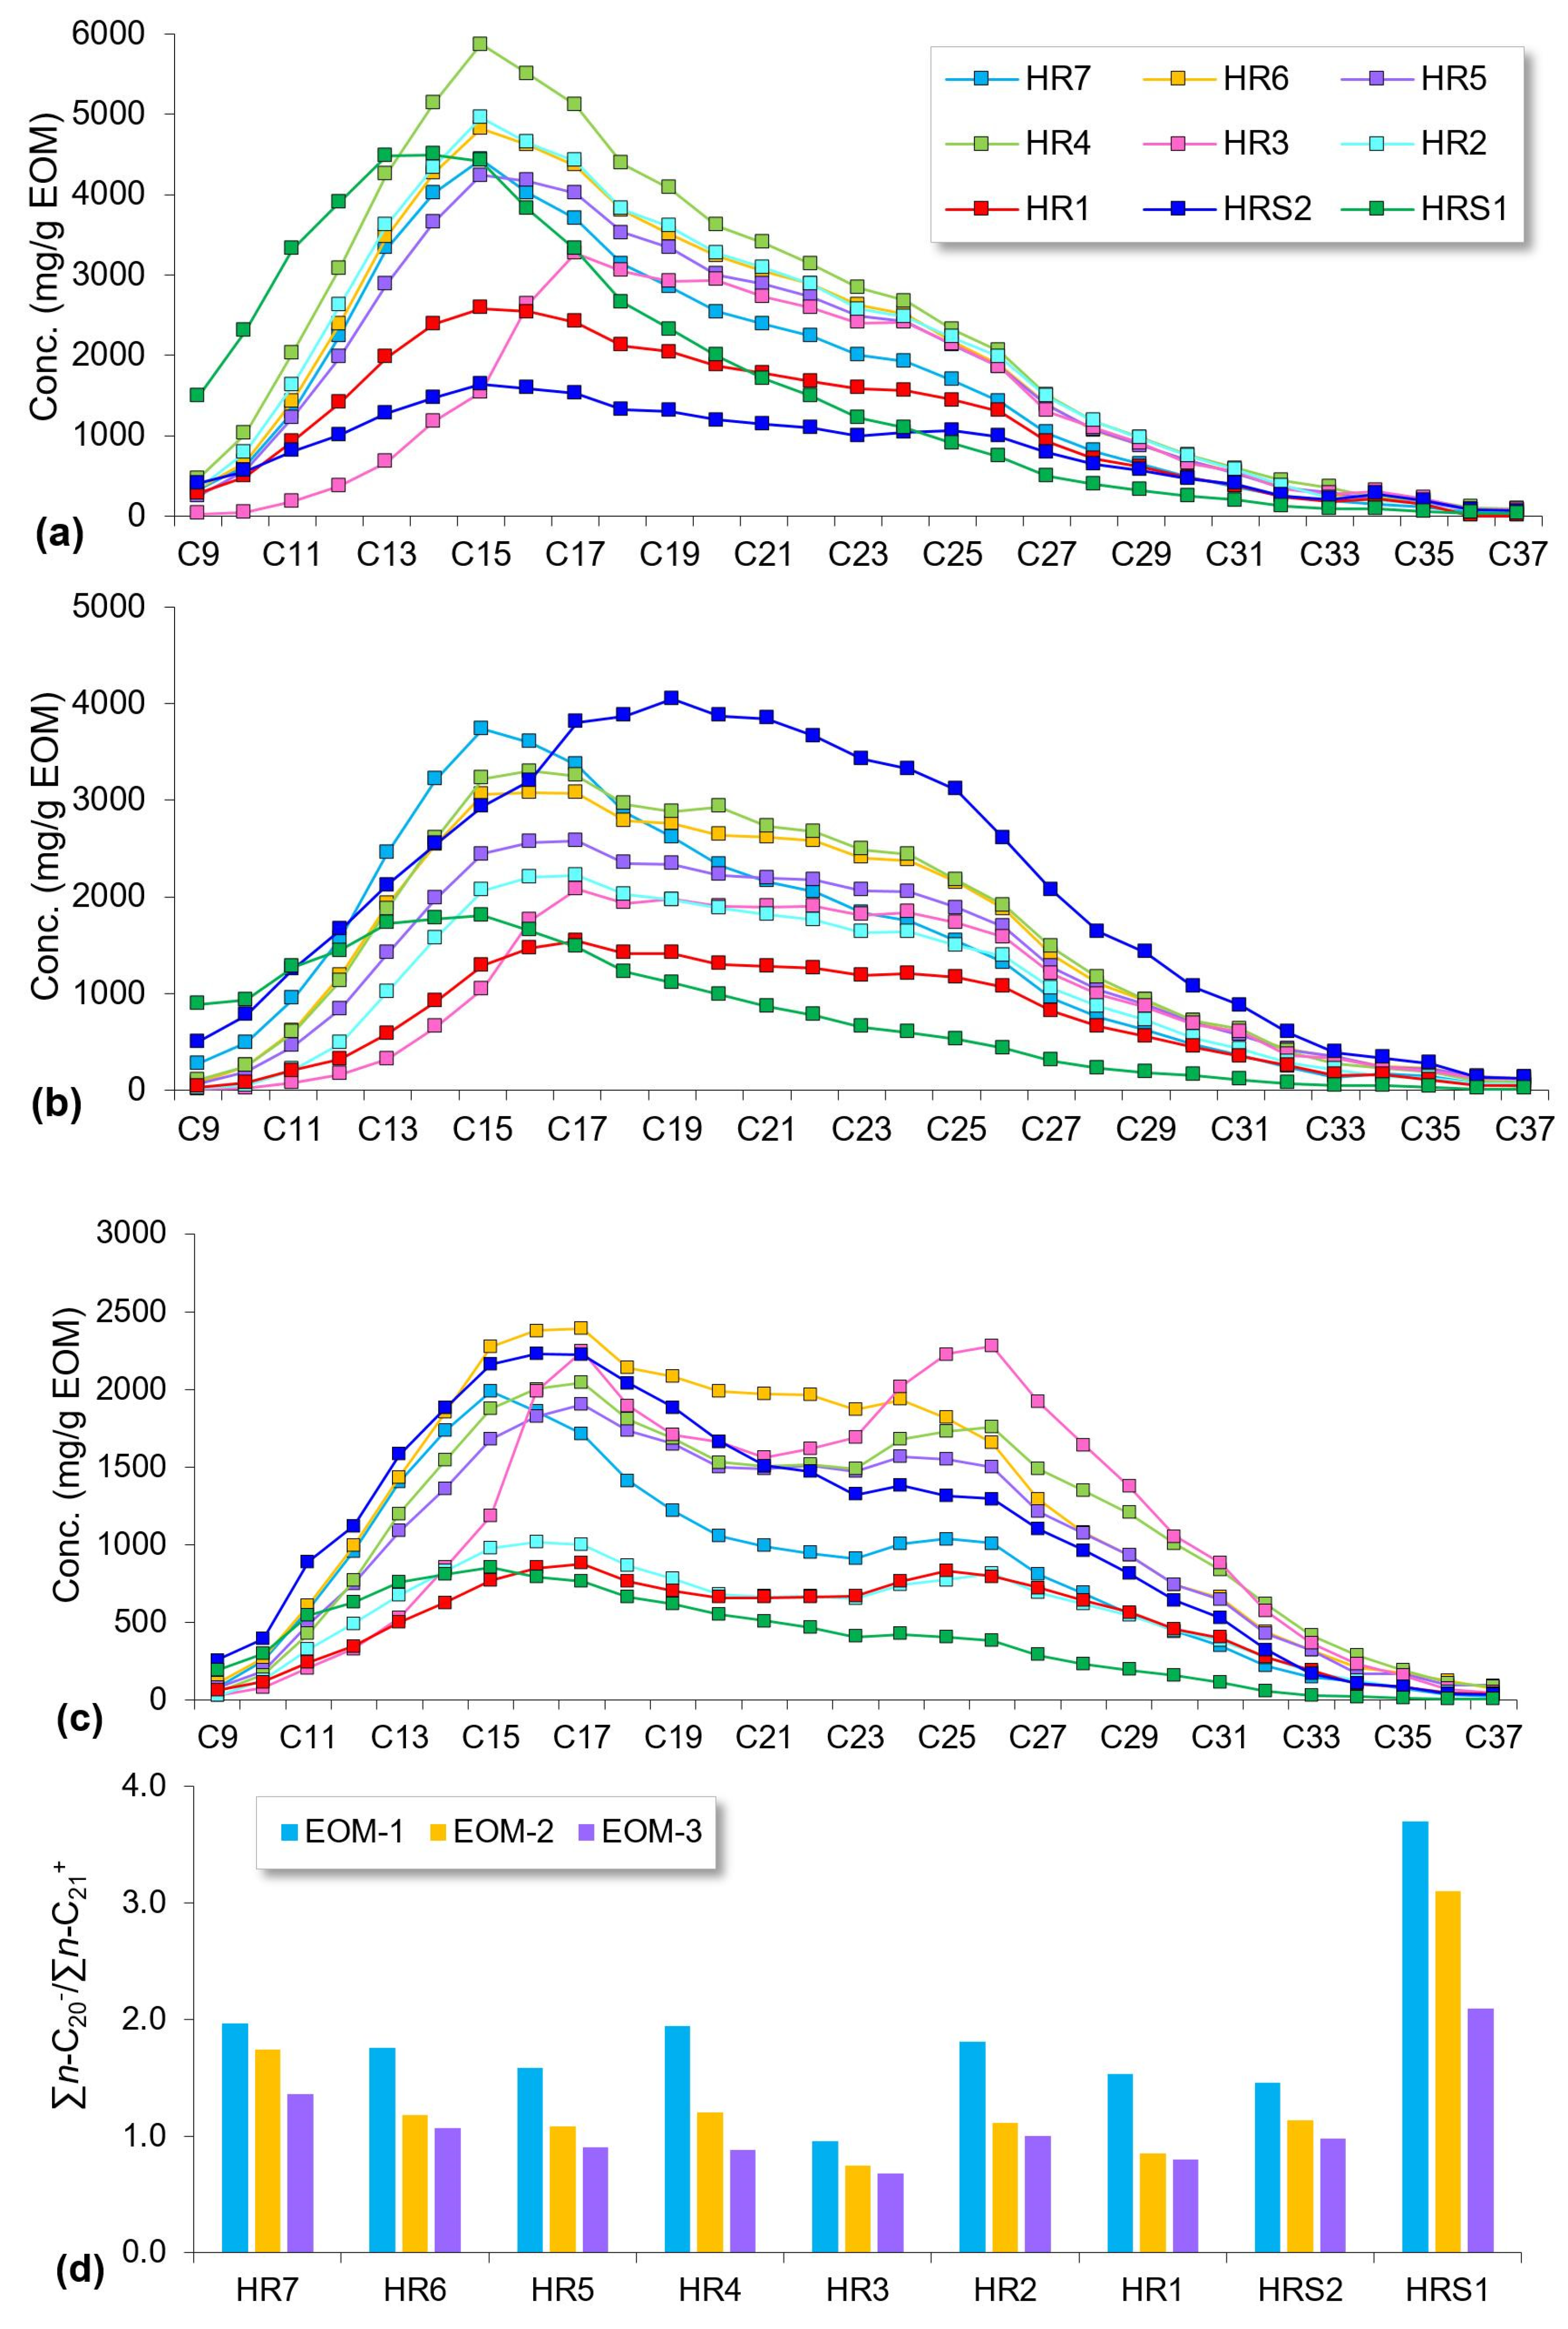
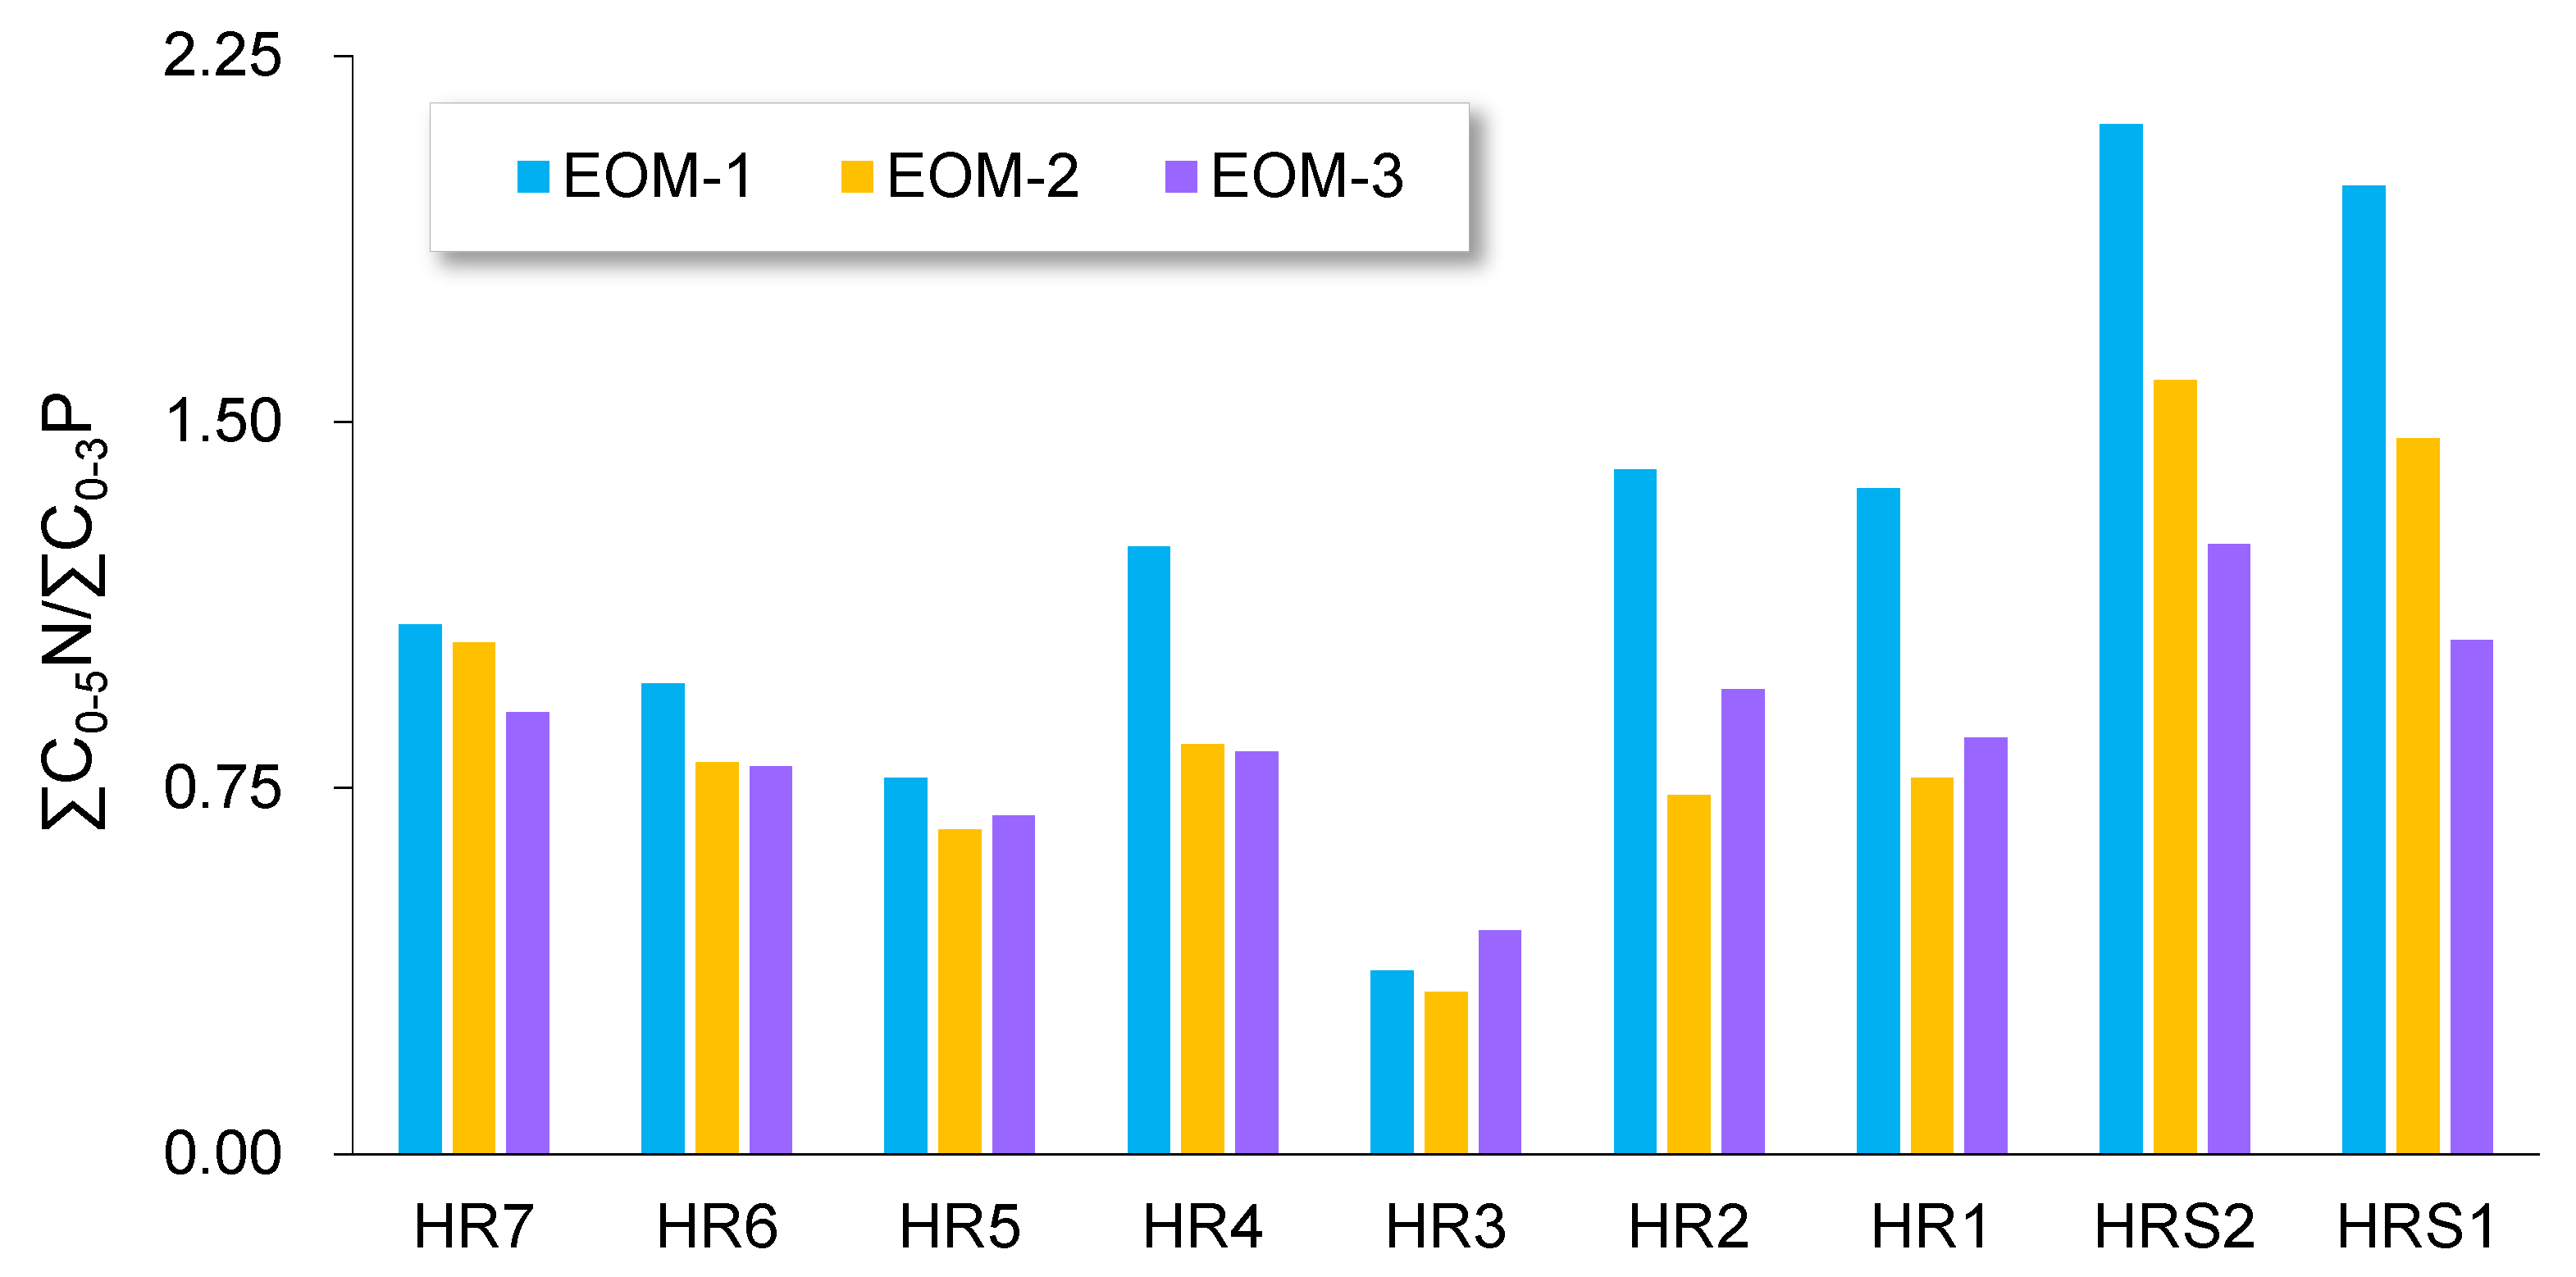
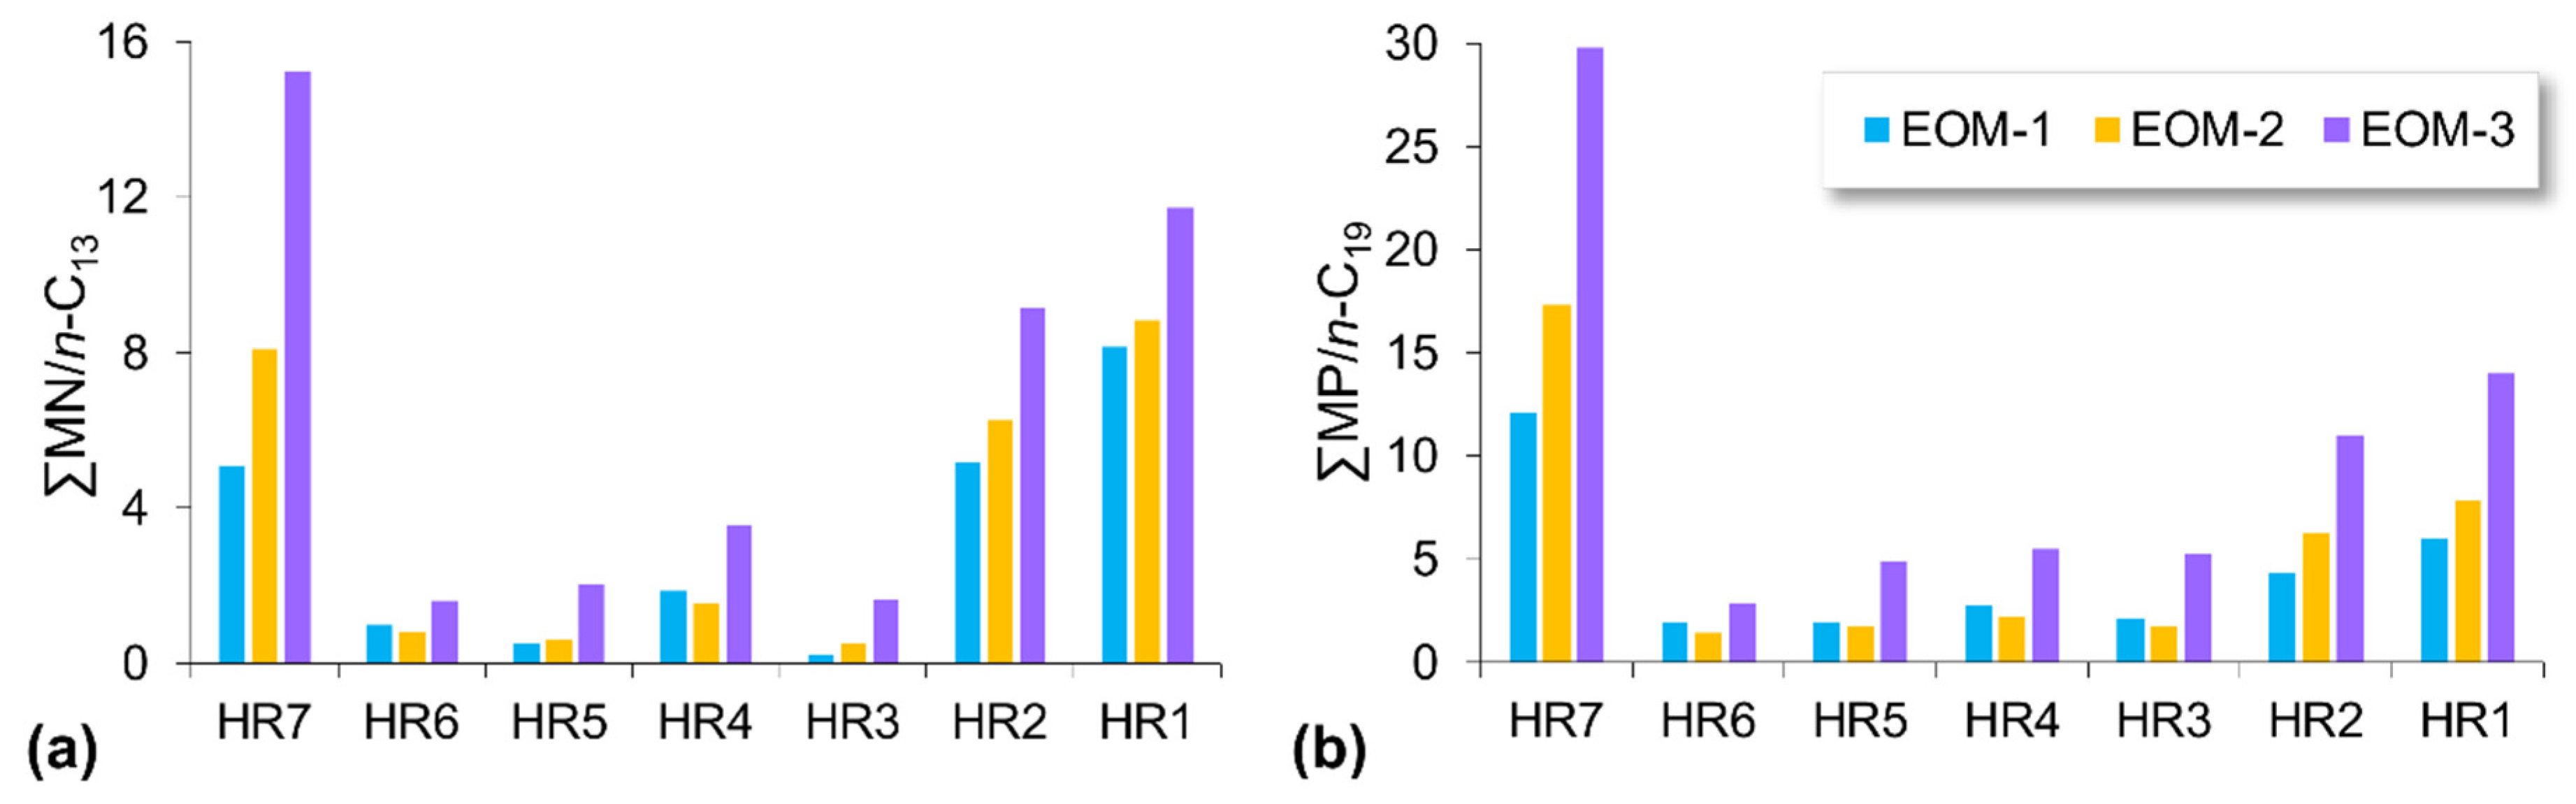
4.4. Molecular Compositions

The GC–MS analyses of total the hydrocarbon fraction from free oil, adsorbed oil, and residual oil were performed on seven samples (HR1-7), while GC–MS analyses of saturated and aromatic hydrocarbon fractions were performed for all extracts. The total ion chromatograms (TIC) of the total hydrocarbon fraction illustrated conspicuous molecular composition differences between the source rock (represented by HR1 and HR7) and reservoir (represented by HR3 and HR5). Molecular compositions in the source rock extracts were characterized by the dominance of alkylnaphthalenes and alkylphenanthrenes, while n-alkanes and branched alkanes were largely masked. However, the molecular compositions in reservoir extracts were dominated by n-alkanes in the range of C13–C30, while alkylnaphthalenes and alkylphenanthrenes were less important constituents. The difference between free oil and residual was less dramatic than the variation from lithology, but was still perceptible. The relative abundance of GC amenable aromatic compounds was more concentrated in the EOM-3, and high molecular components were relatively enriched (Figure 6).
Numerous molecular parameters are available in literature that can be applied for organic source input, maturity, biodegradation, and migration diagnosis. The present study had no intention to explore all details of the molecular parameters, but adopted a few classical parameters to illustrate the variation during sequential extraction. The pristane/phytane (Pr/Ph) ratio is one of most widely used parameters to indicate depositional conditions of source rocks. The Pr/Ph ratios for EOM-1, EOM-2, and EOM-3 fell in the relatively narrow ranges of 1.3−1.7, 1.4−1.6, and 1.1−1.6, respectively. This observation was similar to the results of Lafargue et al. [45], who detected no fractionation effects on the Pr/Ph ratio during expulsion experiments performed on shale source rocks. For isoprenoid/n-alkane, ratios (i.e., Pr/n-C17 and Ph/n-C18) in EOM-1 ranged from 0.4 to 0.8 and 0.4 to 0.7, respectively. Similar ratio ranges were obtained for EOM-2 and EOM-3 (Figure 7a). No preferential extraction of n-alkanes relative to acyclic isoprenoids was discerned during sequential extraction.
Gammacerane is an irregular C30 pentacyclic triterpane, and its most likely biological precursor is tetrahymanol. A high abundance of gammacerane in source rock extracts and oil samples normally indicates highly reducing, hypersaline depositional environments, or water-column stratification (Sinninghe Damsté et al., 1995 [46]; Huang, 2017 [47]). The gammacerane index (=gammacerane/C30 hopane) and C35/C34 homohopane ratio are sensitive to redox conditions at the time of sediment deposition (Peters and Moldowan, 1991 [48]). Sequential extraction indicated little variability in these ratios related to depositional environment due to their narrow range and lack of discrimination between extraction steps (Figure 7b).
The C27 pentacyclic triterpane ratio, 18α(H)-22,29,30-trisnorneohopane (Ts) vs. 17α(H)-22,29,30-trisnorhopane (Tm), has been used extensively as an indicator of maturity in samples containing similar source materials. Tm is believed to represent the biologically produced structure, while Ts is formed during thermal maturation processes and exhibits a greater thermal stability than Tm (Peters et al., 2005 [49]). C29Ts (18α(H)-30-norneohopane) is characterized by a high thermal stability, and it has virtually the same geochemical behavior as Ts. With increasing thermal maturity, C29Ts shows a marked increase in apparent concentration relative to the C29 norhopane (C29H) (Peters et al., 2005 [49]). A clear positive correlation between Ts/(Ts + Tm) and C29Ts/(C29H + C29Ts) ratios was illustrated in the studied samples. While the difference was subtle, slightly lower ratios could be observed from the EOM-3 (Figure 7c).
The isomerization of C29 steranes can derive two commonly used maturity indicators; i.e., 20S/(20S + 20R) and ββ/(ββ + αα). The proposed equilibrium range for 20S/(20S + 20R) was 0.52–0.55 and for ββ/(ββ + αα) was 0.55–0.60, corresponding to peak oil generation in sediments (Peters et al., 2005 [49]). Both ratios approached the equilibrium end-point in the studied samples. Likewise, both ratios in the EOM-3 were slightly lower than those in the EOM-1 and 2 (Figure 7d).
The distributions of alkylated aromatic hydrocarbons and aromatic sulfur compounds can also be used for maturity assessment. In the present case, a few parameters derived from alkylnaphthalenes, alkylphenanthrenes, and alkyldibenzothiophene were illustrated. Based on thermodynamic considerations, the most thermally stable trimethylnaphthalene (TMN) isomer was 2,3,6-TMN, and one of the least stable isomers was 1,2,5-TMN, which is often abundant in low-maturity oil samples. Among the tetramethylnaphthalenes, 1,3,6,7-TeMN was the most thermally stable isomer, whereas 1,2,5,6-TeMN was the least thermally stable, and usually the most abundant isomer in samples of low maturity. Under the chromatographic conditions used here, 1,2,5,6-TeMN co-eluted with 1,2,3,5-TeMN; these were isomers with very similar stabilities. Therefore, throughout this paper, the abundances of 1,2,5,6- and 1,2,3,5-TeMN were measured as one sum referred to as 1,2,5,6-TeMN + 1,2,3,5-TeMN. In another study, van Aarssen et al. [50] defined the trimethylnaphthalene ratio (TMNr) as 1,3,7-TMN/(1,3,7- + 1,2,5-TMN) and the tetramethylnaphthalene ratio (TeMNr) as 1,3,6,7-TeMN/(1,3,6,7- + 1,2,5,6 + 1,2,3,5)-TeMN. Both ratios behaved quite similarly, and clustered together with slightly higher values in the two relatively fresh samples (Figure 8a). No fractionation between alkylnaphthalene isomers could be observed during sequential extraction.
The methylphenanthrene index [MPI-1 =1.5 × (2-MP + 3-MP)/(P + 1-MP + 9-MP)] proposed by Radke et al. [51] is probably one of the most widely used aromatic maturity parameters to estimate the level of thermal maturity of sediment extracts and oils. The MPI-1 values fell in a narrow range of 0.55−0.65 without obvious fractionation during sequential extraction. The methyldibenzothiophene (MDBT)-derived maturity ratios relied on the same chemical basis as methylphenanthrenes; i.e., a shift in predominance from relatively thermally unstable isomers toward more stable isomers with increasing maturation (Radke et al., 1986 [52]). The methyldibenzothiophene ratio (MDR = 4-MDBT/1-MDBT) showed a relatively wide range of variation, but the difference among extraction steps was insignificant (Figure 8b).
The n-alkanes are the most abundant components in oil, and their distributions reflect organic input and maturity level. The concentrations of individual n-alkane present in the sequential extraction samples are illustrated in Figure 9. A wide range of n-C9 to n-C37 alkanes without any odd-over-even carbon number predominance could be detected from all studied samples. The n-alkanes in EOM-1 were dominated by C13–C20 with a unimodal distribution and maximal peak at C15, except the HR3, which had the maximal peak at C17 (Figure 9a). The unimodal n-alkane distributions, generally peaking at C15 and C17, were indicative of a uniform source, where marine algae and bacterial lipids could be the major contributors of n-alkanes. The chromatograms of the EOM-2 samples also displayed a unimodal distribution pattern, but the relative proportion and heavy end increased perceptibly. The maximal peak in some samples was shifted to a slightly higher carbon number. For instance, the main carbon number in HRS2 was n-C19 (Figure 9b). Samples of EOM-3 were enriched in long-chain n-alkanes. A typical bimodal n-alkane distribution with a second maximum at n-C25 to n-C26 could be observed from HR1 and HR3 (Figure 9c). The n-alkanes’ pronounced fractionation effects according to molecular chain lengths could also be illustrated by the ∑C20/∑C21+ ratio. Generally, low ∑C20/∑C21+ ratios of outcrop samples may be caused by evaporative loss of light components during long weathering exposure. Systematic changes could be observed from the sequential extraction with the ∑C20/∑C21+ ratios in EOM-1 > EOM-2 > EOM-3. The early extracts tended to have higher relative abundances of C9 to C20 n-alkanes (Figure 9d).
In the aromatic hydrocarbon fraction, the difference between the number of substituents, such as the ratio of dimethylnaphthalene and tetramethylnaphthalene (∑C2N/∑C4N), was subtle and sometimes inconsistent (data not shown), while the relative content of compounds with different ring numbers changed systematically. Alkylnaphthalenes were relatively concentrated in the first extract, while alkylphenanthrenes were more enriched in the third extract, and the ratio of ∑C0–5-alkylnaphthalenes/∑C0–3-alkylphenanthrenes showed a general decreasing trend with the proceedings of sequential extraction (Figure 10).
There is a general consensus that saturated hydrocarbons are more easily expelled from kerogen than aromatic hydrocarbons; however, the difference during sequential extraction has not been observed. The total hydrocarbon chromatograms indicated that extracts from source rocks were enriched in aromatic hydrocarbons, while those from reservoirs were enriched in saturated hydrocarbons. Here, peak areas of representative compounds in the total hydrocarbon fraction were used to elucidate such changes during sequential extraction. The n-C13 had a retention time similar to methylnaphthalenes, and the n-C19 had a retention time similar to methylphenanthrenes. The ratios of ∑MN/n-C13 and ∑MP/n-C19 showed sharp differences between source rocks and reservoirs, with much higher values in the former. During sequential extraction, a dramatic difference was apparent in both ratios. For instance, the ∑MN/n-C13 ratio in EOM-1 of HR7 was 5.1, while that in EOM-3 was 15.2. Similarly, the ∑MP/n-C19 ratio EOM-1 of HR7 was 12.1, while that in EOM-3 was 29.8. However, these ratios in typical reservoirs (HR3-HR6) were much lower (Figure 11).

5. Discussion

5.1. Oil Physical Status Illustrated by Sequential Extraction

Oils in shale systems are dominantly free and adsorbed, but oil dissolved in gas and/or water cannot be excluded. However, to determine the proportion of free oil and adsorbed oil in a specific sample remains a challenge due to the lack of a standardized procedure. The EOM content can evaluate total residual hydrocarbons in a shale series, but has difficulty distinguishing free and adsorbed states. For such purposes, multiple isothermal stages of pyrolysis might hold some merit (Romero-Sarmiento et al., 2015 [21]; Jiang et al., 2016 [20]; Abrams et al., 2017 [11]; Zhang et al., 2020 [18]), but variable heating rates, temperatures, and holding time do not seem to reflect the same nature of pyrolysates. Sequential extraction of shale by using a combination of different solvents, extraction methods, and particle sizes can theoretically separate free oil from residual oils adsorbed on mineral or organic matter surfaces (Qian et al., 2017 [17]; Zhang et al., 2019 [7]; Li et al., 2021 [53]), because the particle size can limit the ability of organic solvents to efficiently extract soluble organic matter from the interior of dense shale particles (Sajgo and Maxwell, 1983 [54]; Price and Clayton, 1992 [12]). Sajgo and Maxwell [54] used crushed chips (1–2 cm) and Soxhlet extraction to obtain a “coarse extract”, which represented oil in “open” pores, and the powder to obtain a “fine extract”, which represented bitumen from the “closed” matrix.
Three steps of extraction were performed in this study. The first extract (EOM-1) can be roughly regarded as free oil based on the following consideration. The pioneer work performed by Sajgo and Maxwell [54] used a similar particle size to obtain the extractable material in the open pores, which represented a fraction that was able to migrate. The EOM-1 in the present study was easily accessible to the solvents and ready for expulsion from the rocks, which shared the same nature as the first extract in open pores as defined by Sajgo and Maxwell [54]. The EOM-1 also would be expected to be affected by migration of material within or out of the strata, as evidenced by molecular compositional fractionation (see below). Additional evidence that EOM-1 can be regarded as free oil can be derived from the Rock-Eval S1, which is often regarded as free oil even though the S1 does not account for all free hydrocarbons. The linear correlation between EOM-1 and the S1 indicated intrinsic linkage between the two parameters, while the correlation between the total EOM and total oil was not straightforward (Figure 5). Due to the nature of outcrop in the present study, the yields from the Rock-Eval analysis and solvent extraction experienced variable evaporative loss, especially for the free oil, while the adsorbed oil may have been less affected. Therefore, the values of both EOM-1 and S1 may have differed from the fresh core samples, but conventional programmed pyrolysis S1 was still a valid parameter to estimate the mobility of shale oil (Jarvie, 2012 [4]).
The nature of EOM-2 is somewhat cryptic. Zhang et al. [7,18] regarded this fraction as adsorbed oil, which normally refers to liquid hydrocarbons released from kerogen (Sandvik et al., 1992 [30]; Pepper and Corvi, 1995 [55]; Larter et al., 2012 [8]). As the particle size was artificially selected and the release of free oil through solvent extraction in the first step could not be complete, the EOM-2 likely contained some free oil, but mostly weakly adsorbed oil on mineral surfaces through the interaction of the van der Waals force. The additional adsorbed oil was more efficiently recovered by Soxhlet extraction of the powder, as a significant proportion of the products of petroleum generation by kerogen breakdown would be expected to be found initially in the closed pores, which are thought to be closed to major solvent penetration during the previous cold extraction steps. The crushed shale with a smaller particle size reduces the path length of solvent penetration and improves the oil/bitumen extraction efficiency because the particles offer a larger surface area and can be easily accessed by the solvent. By gradually removing asphaltene coatings that are clogging narrow pores, the solvent gradually comes into contact with finer and finer pores. Therefore, the third extract (EOM-3) may have represented the oil residing in the finest pores that either had sufficiently small throats and volumes, or were not interconnected to other more open pores. They were strongly adsorbed by kerogens, and represented the non-migrated residue. The pore structure of fine-grained rocks facilitated the presumed necessary adsorption–desorption processes to a greater extent. Therefore, the EOM-3 represented oil adsorbed on kerogen. This interpretation is consistent with classical oil-expulsion mechanisms in which most oil is diffusively released through kerogen to higher-permeability regions of the reservoir at slow rates (Larter, 1988 [56]; Stainforth and Reinders, 1990 [57]; Pepper and Corvi, 1995 [55]; Kelemen et al., 2006 [32]). The sequential extraction allowed comprehensive quantitative evaluation of movable hydrocarbons close to an actual production situation, and provides a reference for related research (Wu et al., 2021 [6]).

5.2. Compositional Fractionation during Sequential Extraction

The compositional fractionation is well documented during primary oil migration based on both observations in natural systems and experimental data. A general expulsion sequence is: saturated hydrocarbons > aromatic hydrocarbons > resins > asphaltenes (Leythaeuser et al., 1988 [27,28]; Lafargue et al., 1990 [29]; Sandvik et al., 1992 [30]; Pepper and Corvi, 1995 [55]; Ritter, 2003 [31]; Eseme et al., 2007 [33]; Han et al., 2015 [23], Han et al., 2017 [25]). Several fractionation mechanisms have been proposed in the past to explain the observed compositional differences between source bitumens and crude oils, which include: (i) the interaction of petroleum with minerals; (ii) the partitioning of petroleum compounds between oil, gas, and water; (iii) kerogen absorption and adsorption; and (iv) diffusion of petroleum compounds through organic material (Sandvik et al., 1992 [30]). The present study illustrated that sequential extraction can provide new insights into the mechanisms of compositional fractionation. When sequential extraction is performed, every step of partial extraction of oil from source rocks naturally induces compositional fractionation between extracted and residual fractions. Limited bulk fraction (SARA) results showed that the free oil (EOM-1) was highly enriched in saturated hydrocarbons, while the polar species were more retained and were recovered in EOM-3. Oil expulsion and compositional fractionation can be more conspicuously illustrated by molecular compositions. n-Alkane expulsion showed pronounced compositional fractionation with a greater expulsion of lower-molecular-weight n-alkanes, as evidenced by systematically higher ∑n-C20/∑n-C21+ ratios in EOM-1 than in EOM-2 and EOM-3 (Figure 9). This was consistent with the early observations of Leythaeuser et al. [27] on a shale–sandstone succession, for which they calculated that the expulsion efficiencies for n-C15 was ~80%, while that for n-C25+ was close to zero. The lower-molecular-weight and less polar material was able to be expelled more easily than the higher-molecular-weight and more polar material, which can also be illustrated by the C0-5N/C0-3P ratio. Systematically higher ratios in EOM-1 than in EOM-3 suggested a preferential expulsion of aromatic hydrocarbons with a lower ring number (Figure 10).
The expulsion preference between n-alkanes and isoprenoids is commonly demonstrated by the pristane and phytane, and their adjacently eluted n-C17 and n-C18. Some studies revealed that the expulsion efficiencies for pristane and phytane were lower than for n-C17 and n-C18 (Mackenzie et al., 1983 [58]; Leythaeuser et al. 1988 [27]), while other studies suggested that fractionation of pristane and phytane with respect to n-C17 and n-C18 was insignificant (Price and Clayton, 1992 [12]; Lafargue et al., 1994 [45]). Data in the present study showed that pristane and phytane were expelled as readily as n-C17 and n-C18 because the ratios of Pr/n-C17 and Ph/n-C18 in sequential extracts showed no obvious difference (Figure 7a).
The fractionation of biomarker parameters derived from steranes and hopanes during sequential extraction behaved slightly differently. Most organofacies and maturity related parameters such as Gam/C30H, C35H/C34H and C29 20S/(20S + 20R), and ββ/(αα + ββ) ratios showed no systematic change (Figure 7b,d), while the ratios of Ts/(Ts + Tm) and C29Ts/(C29Ts + C29H) did show a slightly lower value in EOM-3 than in EOM-1 and EOM-2 (Figure 7c). However, such maturity discrimination did not occur in parameters derived from alkylnaphthalenes, alkylphenanthrenes, and alkyldibenzothiophenes (Figure 8). To explain those differences remains a challenge. The overall uniform maturity of aromatic hydrocarbons suggested that invasion of higher maturity oil from elsewhere could be excluded because aromatic hydrocarbons were sensitive to high-maturity end-product contamination, while biomarkers were sensitive to low-maturity end-product contamination (Huang et al., 2022 [38]). The C29 20S/(20S + 20R) and ββ/(αα + ββ) ratios did not appear to have been fractionated because their isomerization reactions approached an equilibrium point. The ratios of Ts/(Ts + Tm) and C29Ts/(C29Ts + C29H) had a wider valid maturity range than parameters from sterane isomerization (Peters et al., 2005 [49]), and slightly lower ratio values likely indicated partial release of bound biomarkers mainly occluded by asphaltenes or kerogens (Li et al., 2020 [59]).
Strong chemical fractionation between saturated and aromatic hydrocarbon fractions was observed through sequential extraction, although the difference between bulk fractions was less obvious. The ratios of MN/n-C13 and MP/n-C19 increased drastically from EOM-1 to EOM-3. Alkylnaphthalenes and alkylphenanthrenes, due to their greater polarizability, apparently were more strongly retained in the adsorbed oil when compared to n-alkanes with a similar retention time (Figure 11). The data illustrated here were consistent with a case study reported by Leythaeuser et al. [28] in which the concentration of aromatic compounds systematically decreased toward the edges of the thick source-rock units. Their calculated relative expulsion efficiencies for di- and trimethylnaphthalenes were 30–40%, and for C15 to C30 n-alkanes were 80–95%.
The marked compositional differences between extracts from initially connected and easily accessible pore spaces and those that were only accessed after the sample had been crushed (EOM-1 vs. EOM-3) could have been caused by fractional adsorption effects. The actual process would be diffusion of discrete molecules from a more adsorbed or occluded phase to a more free phase in connected pores and/or fractures. Diffusive expulsion can lead to enrichment of the more mobile and less polar hydrocarbons in the open pores, while the polar species, especially resins and asphaltenes, increase in relative concentration in the closed pores. Molecular diffusion could be the initial and rate-determining step in expulsion, which in turn governs the primary migration from the source rock, predominantly in the open pores. The movement of material from the adsorbed to the free states could help accumulate oils in the open pores to form a continuous phase, which would eventually migrate further along bedding planes and fractures to the carrier bed and/or form the tight oil play. Within the geological time scale, they may be sufficient to explain the intrasource migration process as observed in the Barnett Shale (Han et al., 2015 [23]).

5.3. Lithological Constraint on Oil Physical State and Exploration Potential

Since adsorption plays a significant role in shale oil plays, kerogen in source rocks complicates the chemistry of hydrocarbon storage and transport in source rocks compared to sandstone reservoirs, which are devoid of kerogen. However, in hybrid shale oil plays, kerogens are inevitably involved in the entire interval; therefore, the differences in the compositions between source rocks and reservoirs are less clear than conventional petroleum system. Nevertheless, reservoirs in hybrid shale oil systems are considered to be units that contain migrated oils, and the oil-saturated horizon contains a great quantity of free oil, while source rocks in the organic-rich shales contain the part that has not been expelled after hydrocarbon generation. Both free and adsorbed oils are mainly stored within organic (kerogen) porosity and have not migrated. Expulsion can yield dramatically different compositional profiles between source rocks and reservoirs.
In reservoirs represented by HRS2, the EOM-1 was about an order of magnitude greater than the EOM-3, while in source rocks represented by HRS1, the first extract was only slightly higher than the third one. About 80% of EOM could be recovered from the reservoir during the first extraction, while only about 40% of EOM was recovered from the source rock. Sharp differences within the adjacent sample pairs could also be characterized by very different hydrocarbon content in the TOC. The EOM-1/TOC in HRS2 was 4 times higher than that in HRS1 (Figure 4, Table 1). The current data demonstrated that the total oil from the Rock-Eval and EOM were in a similar range; however, the source rock tended to have more EOM, while the reservoir had more total oil (Figure 5a). That solvent extraction liberated more oil from the source rocks, suggesting that additional oil occupied pores only accessible by the presence of solvents, whereas the Rock-Eval showing more oil from reservoirs indicated that the “S2 oil” played a more important role in the migrated oils. The “S2 oil” to S1 ratio in the reservoir (HR2-HR6) ranged from 0.85 to 1.65 with an average of 1.36, which was much higher than that in the source rock (HR1 and HR7) average of 0.55 (Table 1).
The compositional differences between reservoirs and source rocks echo the differences between free and adsorbed oils demonstrated by sequential extraction. Generally, the reservoir was more close to the EOM-1, while the source rock tended to show characteristics more similar to a residual extract exhibited by the EOM-3. The reservoir was expected to be influenced by migration of material between strata or across strata, while the source rock was expected to be only affected by chemical fractionation associated with the movement of material toward open pores. The source-rock samples showed a larger extent of fractionation than the reservoir samples, as evidenced by the n-alkane concentration profiles (Figure 9a–c) and various other parameters. The qualitative comparison revealed that those n-alkanes were removed by expulsion with lower-molecular-weight n-alkanes preferentially expelled from source rocks (Figure 9d and Figure 11). However, the source rock represented by HRS1 contained more short-chain n-alkanes than did the corresponding reservoir represented by HRS2 (Figure 9d), which was in contrast to the result of the expulsion fractionation. This pattern might be interpreted as either further migration fractionation from the reservoirs or evaporative loss during outcropping.
While the adsorption of oil by solid organic matter and/or mineral surfaces is important in both source rocks and reservoirs in a hybrid shale oil system, lithological heterogeneities control the composition and amount of retained oils. Under current technical conditions, only the free oil can flow and will be the recoverable resource. Oil expelled into organic-lean lithofacies (reservoir) does not exhibit the high adsorption affinities found in organic-rich shales (source rock), thereby allowing better production potential, whereas adsorbed oil is difficult to be produced during the pressure drawdown if natural fracture systems are not well developed. Therefore, juxtaposed organic-lean lithofacies such as carbonates, sands, or silts in a shale petroleum system are very important to higher productivity due to short distances of primary migration and low sorption affinities.

6. Conclusions

The Second White Speckled Shale Formation at the Highwood River outcrop is thermally mature in terms of oil generation. The interbedded organic-rich shale and organic-lean siltstone intervals represent a significant natural laboratory for hybrid shale oil evaluation.
Sequential extraction of various particle sizes and cold and Soxhlet extraction methods separated two oil phases with free-moving oil in the first extract (EOM-1), oil weakly adsorbed on mineral surfaces in the second extract (EOM-2), and strongly adsorbed oil in the third extract (EOM-3).
About one-third of the Rock-Eval S2 was solvent-extractable, and the amount of “S2 oil” was linearly correlated with the loss in TOC after extraction, suggesting TOC was the main control for oil retention. While the thermolysis and solvent extraction yields may have been significantly lower than their original values, depending on the degree of weathering and evaporative loss from the outcrop, linear correlation between the Rock-Eval S1 and EOM-1 suggested that both parameters were indicative of a free oil state in the hybrid shale reservoirs.
Chemical fractionation associated with the movement of material from the adsorbed to the free states during expulsion can be observed in both gross and molecular compositions. Lower-molecular-weight and fewer aromatic-ring-number compounds were preferentially expelled and enriched in EOM-1, while heavier and more polar compounds were more retained and thus recovered in EOM-3. The molecular ratios illustrated a strong fractionation between saturated and aromatic hydrocarbons, while the fractionation between isoprenoids and adjacent eluting n-alkanes and among steranes, hopanes, alkylnaphthalene, alkylphenanthrene, and alkyldibenzothiophene isomers was insignificant. The uniform maturity suggested that the invasion of higher-maturity oil from elsewhere could be excluded.
While the adsorption by kerogen and/or mineral surfaces is important in both shales and siltstones, lithological heterogeneities control the composition and amount of retained oils. The differences between source rocks and reservoirs echo the differences between adsorbed and free oils demonstrated by sequential extraction. Free oil mainly resides in connected and easily accessible pore space and may contain migrated fractions, while the adsorbed oil is expected to be only affected by chemical fractionation associated with the movement of material toward open pores, and can be accessed after sample crushing and heating.
The markedly different compositions of source rock and reservoir within the Second White Speckled Shale Formation is controlled by their position in the sequence in which they are located. Adsorbed oil dominantly in shale is less mobile during the pressure drawdown and has low productivity, whereas oil expelled into organic-lean, tight reservoir is more mobile, thereby allowing better production potential.

Author Contributions

Conceptualization, H.Z. and H.H.; methodology, H.Z. and M.Y.; validation, H.Z., H.H. and M.Y.; formal analysis, H.Z and M.Y.; investigation, H.Z.; resources, H.H.; writing—original draft preparation, H.Z.; writing—review and editing, H.Z. and H.H.; visualization, H.Z.; supervision, H.H.; project administration, H.H.; funding acquisition, H.H. and H.Z. All authors have read and agreed to the published version of the manuscript.

Funding

This research was jointly supported by the National Natural Science Foundation of China (grant number: 41873049) and the China Postdoctoral Science Foundation (2021M700538).

Acknowledgments

Priyanthi Weerawardhena from University of Calgary is acknowledged for the assistance with experiments. Lloyd Snowdon and Steve Larter of the University of Calgary, and three anonymous reviewers are acknowledged for their useful discussions and constructive comments.

Conflicts of Interest

The authors declare no conflict of interest.

References

  1. Sonnenberg, S.A.; Pramudito, A. Petroleum geology of the giant Elm Coulee field, Williston Basin. Am. Assoc. Pet. Geol. Bull. 2009, 93, 1127–1153. [Google Scholar] [CrossRef]
  2. Clarkson, C.R.; Pedersen, P.K. Production Analysis of Western Canadian Unconventional Light Oil Plays. In Proceedings of the SPE Canadian Unconventional Resources Conference, Calgary, AB, Canada, 15–17 November 2011; p. 149005. [Google Scholar]
  3. Boak, J.; Kleinberg, R. Shale gas, tight oil, shale oil and hydraulic fracturing. In Future Energy; Elsevier: Amsterdam, The Netherlands, 2020; pp. 67–95. [Google Scholar]
  4. Jarvie, D.M. Shale resource systems for oil and gas: Part 2—shale−oil resource systems. In Shale Reservoirs—Giant Resources for 21st Century; Beyer, J.A., Ed.; The American Association of Petroleum Geologists: Tulsa, OK, USA, 2012; Volume 97, pp. 89–119. [Google Scholar]
  5. Curiale, J.A.; Curtis, J.B. Organic geochemical applications to the exploration for source−rock reservoirs—A review. J. Unconv. Oil Gas Resour. 2016, 13, 1–31. [Google Scholar] [CrossRef]
  6. Wu, T.; Pan, Z.; Liu, B.; Connell, L.D.; Sander, R.; Fu, X. Laboratory characterization of shale oil storage behavior: A comprehensive review. Energy Fuels 2021, 35, 7305–7318. [Google Scholar] [CrossRef]
  7. Zhang, H.; Huang, H.; Li, Z.; Liu, M. Oil physical status in lacustrine shale reservoirs–A case study on Eocene Shahejie Formation shales, Dongying Depression, East China. Fuel 2019, 257, 116027. [Google Scholar] [CrossRef]
  8. Larter, S.; Huang, H.; Bennett, B.; Snowdon, L. What Don’t We Know about Self Sourced Oil Reservoirs: Challenges and Potential Solutions? In Proceedings of the SPE Canadian Unconventional Resources Conference, Calgary, AB, Canada, 30 October–1 November 2012; p. 162777. [Google Scholar]
  9. Raji, M.; Gröcke, D.R.; Greenwell, C.; Cornford, C. Pyrolysis, Porosity and Productivity in Unconventional Mudstone Reservoirs: ‘Free’ and ‘Adsorbed’ Oil. In Proceedings of the SPE/AAPG/SEG Unconventional Resources Technology Conference, San Antonio, TX, USA, 20–22 July 2015; p. 2172996. [Google Scholar]
  10. Zink, K.G.; Scheeder, G.; Stueck, H.L.; Biermann, S.; Blumenberg, M. Total shale oil inventory from an extended Rock-Eval approach on unextracted and extracted source rocks from Germany. Int. J. Coal Geol. 2016, 163, 186–194. [Google Scholar] [CrossRef]
  11. Abrams, M.A.; Gong, C.; Garnier, C.; Sephton, M.A. A new thermal extraction protocol to evaluate liquid rich unconventional oil in place and in−situ fluid chemistry. Mar. Pet. Geol. 2017, 88, 659–675. [Google Scholar] [CrossRef]
  12. Price, L.C.; Clayton, J.L. Extraction of whole versus ground source rocks-fundamental petroleum geochemical implications including oil−source rock correlation. Geochim. Cosmochim. Acta 1992, 56, 1213–1222. [Google Scholar] [CrossRef]
  13. Wilhelms, A.; Horstad, I.; Karlsen, D. Sequential extraction—A useful tool for reservoir geochemistry? Org. Geochem. 1996, 24, 1157–1172. [Google Scholar] [CrossRef]
  14. Schwark, L.; Stoddart, D.; Keuser, C.; Spitthoff, B.; Leythaeuser, D. A novel sequential extraction system for whole core plug extraction in a solvent flow through cell-application to extraction of residual petroleum from an intact pore−system in secondary migration studies. Org. Geochem. 1997, 26, 19–31. [Google Scholar] [CrossRef]
  15. Leythaeuser, D.; Keuser, C.; Schwark, L. Molecular memory effects recording the accumulation history of petroleum reservoirs: A case study of the Heidrun Field, offshore Norway. Mar. Pet. Geol. 2007, 24, 199–220. [Google Scholar] [CrossRef]
  16. Mohnhoff, D.; Littke, R.; Krooss, B.M.; Weniger, P. Flow−through extraction of oil and gas shales under controlled stress using organic solvents: Implications for organic matter−related porosity and permeability changes with thermal maturity. Int. J. Coal Geol. 2016, 157, 84–99. [Google Scholar] [CrossRef]
  17. Qian, M.; Jiang, Q.; Li, M.; Li, Z.; Liu, P.; Ma, Y.; Cao, T. Quantitative characterization of extractable organic matter in lacustrine shale with different occurrences. Pet. Geol. Exp. 2017, 39, 278–286, (In Chinese with an English Abstract). [Google Scholar]
  18. Zhang, H.; Huang, H.; Li, Z.; Liu, M. Comparative study between sequential solvent−extraction and multiple isothermal stages pyrolysis: A case study on Eocene Shahejie Formation shales, Dongying Depression, East China. Fuel 2020, 263, 116591. [Google Scholar] [CrossRef]
  19. Behar, F.; Beaumont, V.; Penteado, H.D.B. Rock-Eval 6 technology: Performances and developments. Oil Gas Sci. Technol. 2001, 56, 111–134. [Google Scholar] [CrossRef]
  20. Jiang, Q.; Li, M.; Qian, M.; Li, Z.; Li, Z.; Huang, Z.; Zhang, C.M.; Ma, Y. Quantitative characterization of shale oil in different occurrence states and its application. Pet. Geol. Experiment 2016, 38, 842–849, (In Chinese with an English Abstract). [Google Scholar]
  21. Romero−Sarmiento, M.F.; Pillot, D.; Letort, G.; Lamoureux−Var, V.; Beaumont, V.; Huc, A.Y.; Garcia, B. New Rock-Eval method for characterization of unconventional shale resource systems. Oil Gas Sci. Technol. 2016, 71, 1–9. [Google Scholar] [CrossRef]
  22. Peters, K.E. Guidelines for evaluating petroleum source rock using programmed pyrolysis. Am. Assoc. Pet. Geol. Bull. 1986, 70, 318–329. [Google Scholar]
  23. Han, Y.; Mahlstedt, N.; Horsfield, B. The Barnett Shale: Compositional fractionation associated with intraformational petroleum migration, retention, and expulsion. Am. Assoc. Pet. Geol. Bull. 2015, 99, 2173–2202. [Google Scholar] [CrossRef] [Green Version]
  24. Collins, D.; Lapierre, S. Integrating Solvent Extraction with Standard Pyrolysis to Better Quantify Thermal Maturity and Hydrocarbon Content in the Oil Window. In Proceedings of the SPE/AAPG/SEG Unconventional Resources Technology Conference, Denver, CO, USA, 25–27 August 2014; p. 1922397. [Google Scholar]
  25. Han, Y.; Horsfield, B.; Curry, D.J. Control of facies, maturation and primary migration on biomarkers in the Barnett Shale sequence in the Marathon 1 Mesquite well, Texas. Mar. Pet. Geol. 2017, 85, 106–116. [Google Scholar] [CrossRef] [Green Version]
  26. Leythaeuser, D.; Schaefer, R.G.; Yukler, A. Role of diffusion in primary migration of hydrocarbons. Am. Assoc. Pet. Geol. Bull. 1982, 66, 408–429. [Google Scholar]
  27. Leythaeuser, D.; Schaefer, R.G.; Radke, M. Geochemical effects of primary migration of petroleum in Kimmeridge source rocks from Brae field area, North Sea. I: Gross composition and C15+−soluble organic matter and molecular composition of C15+−saturated hydrocarbons. Geochim. Cosmochim. Acta 1988, 52, 701–713. [Google Scholar] [CrossRef]
  28. Leythaeuser, D.; Radke, M.; Willsch, H. Geochemical effects of primary migration of petroleum in Kimmeridge source rocks from Brae field area, North Sea. II: Molecular composition of alkylated naphthalenes, phenanthrenes, benzo− and dibenzothiophenes. Geochim. Cosmochim. Acta 1988, 52, 2879–2891. [Google Scholar] [CrossRef]
  29. Lafargue, E.; Espitalié, J.; Jacobsen, T.; Eggen, S. Experimental simulation of hydrocarbon expulsion. Org. Geochem. 1990, 16, 121–131. [Google Scholar] [CrossRef]
  30. Sandvik, E.I.; Young, W.A.; Curry, D.J. Expulsion from hydrocarbon sources: The role of organic absorption. Org. Geochem. 1992, 19, 77–87. [Google Scholar] [CrossRef]
  31. Ritter, U. Fractionation of petroleum during expulsion from kerogen. J. Geochem. Explor. 2003, 78-79, 417–429. [Google Scholar] [CrossRef]
  32. Kelemen, S.R.; Walters, C.C.; Ertas, D.; Freund, H.; Curry, D.J. Petroleum Expulsion. Part 3. A model of chemically driven fractionation during expulsion of petroleum from kerogen. Energy Fuels 2006, 20, 309–319. [Google Scholar] [CrossRef]
  33. Eseme, E.; Littke, R.; Krooss, B.M.; Schwaubauer, J. Experimental investigation of the compositional variation of petroleum during primary migration. Org. Geochem. 2007, 38, 1373–1397. [Google Scholar] [CrossRef]
  34. Bloch, J.D.; Schroder−Adams, C.J.; Leckie, D.A.; Craig, J.; McIntyre, D.J. Sedimentology, Micropaleontology, Geochemistry and Hydrocarbon Potential of Shale from the Cretaceous Lower Colorado Group in Western Canada; Geological Survey of Canada Offices: Ottawa, ON, Canada, 1999. [Google Scholar]
  35. Schröder−Adams, C.J.; Leckie, D.A.; Bloch, J.; Craig, J.; McIntyre, D.J.; Adams, P.J. Paleoenvironmental changes in the Cretaceous (Albian to Turonian) Colorado Group of western Canada: Microfossil, sedimentological and geochemical evidence. Cretac. Res. 1996, 17, 311–365. [Google Scholar] [CrossRef]
  36. Furmann, A.; Mastalerz, M.; Brassell, S.C.; Pedersen, P.K.; Zajac, N.A.; Schimmelmann, A. Organic matter geochemistry and petrography of Late Cretaceous (Cenomanian−Turonian) organic−rich shales from the Belle Fourche and Second White Specks formations, west−central Alberta, Canada. Org. Geochem. 2015, 85, 102–120. [Google Scholar] [CrossRef] [Green Version]
  37. Synnott, D.P.; Dewing, K.; Sanei, H.; Pedersen, P.K.; Ardakani, O.H. Influence of refractory organic matter on source rock hydrocarbon potential: A case study from the Second White Specks and Belle Fourche formations, Alberta, Canada. Mar. Pet. Geol. 2017, 85, 220–232. [Google Scholar] [CrossRef]
  38. Huang, H.; di Primio, R.; Pedersen, J.H.; Silva, R.; Algeer, R.; Ma, J.; Larter, S. On the determination of oil charge history and the practical application of molecular maturity markers. Mar. Pet. Geol. 2022, 139, 105586. [Google Scholar] [CrossRef]
  39. Mossop, G.; Shetsen, I. (co−compilers); Geological Atlas of the Western Canada Sedimentary Basin; Alberta Geological Survey: Edmonton, AB, Canada, 1994. [Google Scholar]
  40. Chen, Z.; Osadetz, K.G. An assessment of tight oil resource potential in Upper Cretaceous Cardium formation, Western Canada sedimentary basin. Pet. Explor. Dev. 2013, 40, 344–353. [Google Scholar] [CrossRef]
  41. Aviles, M.A.; Ardakani, O.H.; Cheadle, B.A.; Sanei, H. Organic petrography and geochemical characterization of the Upper Cretaceous Second White Specks and Upper Belle Fourche alloformations, west−central Alberta: Analysis of local maturity anomalies. Int. J. Coal Geol. 2019, 203, 60–73. [Google Scholar] [CrossRef]
  42. Creaney, S.; Allan, J. Hydrocarbon generation and migration in the Western Canada sedimentary basin. Geol. Soc. Lond. Spec. Publ. 1990, 50, 189–202. [Google Scholar] [CrossRef]
  43. Komaromi, B.A.; Pedersen, P.K. Comparative Fracture Analysis and Characterization of the Upper Cretaceous Jumping Pound Sandstone and Second White Specks Formation, Southwestern Alberta. In Proceedings of the GeoConvention, Calgary, AB, Canada, 12–16 May 2014. [Google Scholar]
  44. Delvaux, D.; Martin, H.; Leplat, P.; Paulet, J. Comparative Rock-Eval pyrolysis as an improved tool for sedimentary organic matter analysis. Org. Geochem. 1990, 16, 1221–1229. [Google Scholar] [CrossRef]
  45. Lafargue, W.; Espitalié, J.; Broks, T.M.; Nyland, B. Experimental simulation of primary migration. Org. Geochem. 1994, 22, 575–586. [Google Scholar] [CrossRef]
  46. Sinninghe Damsté, J.S.; Kenig, F.; Koopmans, M.P.; Koster, J.; Schouten, S.; Hayes, J.M.; de Leeuw, J.W. Evidence for gammacerane as an indicator of water column stratification. Geochim. Cosmochim. Acta 1995, 59, 1895–1900. [Google Scholar] [CrossRef] [Green Version]
  47. Huang, H. The effect of biodegradation on gammacerane in crude oils. Biodegradation 2017, 28, 313–326. [Google Scholar] [CrossRef]
  48. Peters, K.E.; Moldowan, J.M. Effects of source, thermal maturity and biodegradation on the distribution and isomerization of homohopanes in petroleum. Org. Geochem. 1991, 17, 47–61. [Google Scholar] [CrossRef]
  49. Peters, K.E.; Walters, C.C.; Moldowan, J.M. The Biomarker Guide; Cambridge University Press: Cambridge, UK, 2005. [Google Scholar]
  50. Van Aarssen, B.G.; Bastow, T.P.; Alexander, R.; Kagi, R.I. Distributions of methylated naphthalenes in crude oils: Indicators of maturity, biodegradation and mixing. Org. Geochem. 1999, 30, 1213–1227. [Google Scholar] [CrossRef]
  51. Radke, M.; Willsch, H.; Leythaeuser, D.; Teichmüller, M. Aromatic components of coal: Relation of distribution pattern to rank. Geochim. Cosmochim. Acta 1982, 46, 1831–1848. [Google Scholar] [CrossRef]
  52. Radke, M.; Welte, D.H.; Willsch, H. Maturity parameters based on aromatic hydrocarbons: Influence of the organic matter type. Org. Geochem. 1986, 10, 51–63. [Google Scholar] [CrossRef]
  53. Li, S.; Li, S.; Guo, R.; Zhou, X.; Wang, Y.; Chen, J.; Zhang, J.; Hao, L.; Ma, X.; Qiu, J. Occurrence state of soluble organic matter in shale oil reservoirs from the Upper Triassic Yanchang Formation in the Ordos Basin, China: Insights from multipolarity sequential extraction. Nat. Resour. Res. 2021, 30, 4379–4402. [Google Scholar] [CrossRef]
  54. Sajgo, C.; Maxwell, J.R. Evaluation of fractionation effects during the early stages of primary migration. Org. Geochem. 1983, 5, 65–73. [Google Scholar] [CrossRef]
  55. Pepper, A.S.; Corvi, P.J. Simple kinetic models of petroleum formation. Part I: Oil and gas generation from kerogen. Mar. Pet. Geol. 1995, 12, 291–319. [Google Scholar] [CrossRef]
  56. Larter, S. Some pragmatic perspectives in source rock geochemistry. Mar. Pet. Geol. 1988, 5, 194–204. [Google Scholar] [CrossRef]
  57. Stainforth, J.G.; Reinders, J.E.A. Primary migration of hydrocarbons by diffusion through organic matter networks, and its effect on oil and gas generation. Org. Geochem. 1990, 16, 61–74. [Google Scholar] [CrossRef]
  58. Mackenzie, A.S.; Disko, U.; Rullkötter, J. Determination of hydrocarbon distributions in oils and sediment extracts by gas chromatography—high resolution mass spectrometry. Org. Geochem. 1983, 5, 57–63. [Google Scholar] [CrossRef]
  59. Li, Z.; Huang, H.; Zhang, S. The effect of biodegradation on bound biomarkers released from intermediate−temperature gold−tube pyrolysis of severely biodegraded Athabasca bitumen. Fuel 2020, 263, 116669. [Google Scholar] [CrossRef]
Figure 1. Thermal maturity of the 2WS and its related petroleum distribution in the Western Canada Sedimentary Basin (adapted with permission from Huang et al., 2022 [38]).
Minerals 12 00802 g001
Figure 2. Stratigraphic column of the 2WS along Highwood River outcrop at southwestern Alberta (modified from Komaromi and Pedersen, 2014 [43]), sample location and photograph, together with measured total organic carbon content.
Minerals 12 00802 g002
Figure 3. Correlation between S1 (a) and S2 (b) peak values with TOC contents. Change in S1, S2, HI and TOC contents in samples before and after solvent extraction. (c) Correlation between (S1–S1′)/S1 vs. (TOC–TOC’)/TOC; and (d) correlation between (S2–S2′)/S2 vs. (TOC–TOC’)/TOC. Correlation between (S2–S2′)/S2 vs. TOC contents (e) and HI-HI’/HI vs. TOC contents (f).
Minerals 12 00802 g003
Figure 4. The amounts of extractable organic matter from sequential extraction.
Minerals 12 00802 g004
Figure 5. Correlation between solvent extraction yield and parameters derived from Rock-Eval pyrolysis: (a) total EOM vs. total oil yield; (b) sequential extraction yields vs. TOC content; (c) EOM-1 vs. S1; (d) EOM-2 vs. S2–S2′; (e) EOM-2 vs. S1; (f) EOM-3 vs. S2–S2′.
Minerals 12 00802 g005
Figure 6. Total ion chromatograms (TIC) of the total hydrocarbon fraction from the EOM-1 and EOM-3 in representative samples. 13–23: carbon number of n-alkanes; N: naphthalene; MN: methylnaphthalenes; C2N: ethylnaphthalenes + dimethylnaphthalenes; C3N: trimethylnaphthalenes; P: phenanthrene; MP: methylphenanthrenes; C2P: ethylphenanthrenes + dimethylphenanthrenes.
Minerals 12 00802 g006
Figure 7. Correlations of molecular parameters derived from saturated hydrocarbon fraction in sequential extracts of the studied samples: (a) Pr/n-C17 vs. Ph/n-C18 ratios; (b) Gam/C30H vs. C35H/C34 H; (c) Ts/(Ts + Tm) vs. C29Ts/(C29H + C29Ts); (d) C29 steranes 20S/(20S + 20R) vs. ββ/(ββ + αα).
Minerals 12 00802 g007
Figure 8. Correlations of maturity parameters derived from aromatic hydrocarbon fraction in sequential extracts of the studied samples: (a) TMNr vs. TeMNr; (b) MDR vs. MPI-1.
Minerals 12 00802 g008
Figure 9. Concentration distributions and ratios of n-alkanes in sequential extracts of the studied samples: (a) EOM-1; (b) EOM-2; (c) EOM-3; (d) ∑C20/∑C21+ ratio.
Minerals 12 00802 g009
Figure 10. The ratio of ∑C0–5–alkylnaphthalenes/∑C0–3–alkylphenanthrenes (∑C0–5N/∑C0–3P) in sequential extracts of the studied samples.
Minerals 12 00802 g010
Figure 11. The ratios of representative aromatic hydrocarbons to saturated hydrocarbons in sequential extracts of samples HR1-HR7: (a) ∑MN/n-C13; (b) ∑MP/n-C19.
Minerals 12 00802 g011
Table 1. Rock-Eval pyrolysis analysis results of the unextracted and extracted samples from Highwood River section.
SampleHeightS1S2PCTOCTmaxPIHIOSI
(m)(mg/g Rock)(mg/g Rock)(%)(%)(°C)(mg/g TOC)(mg/g TOC)
HR758.50.432.440.242.074500.1511820.77
HR6540.371.150.130.824480.2414045.12
HR5510.341.030.110.784470.2513243.59
HR4470.361.240.130.764450.2316347.37
HR3440.431.60.171.314520.2112232.82
HR2420.482.150.221.584520.1813630.38
HR125.10.482.680.261.994520.1513524.12
HRS217.050.852.370.270.834390.27286102.41
HRS1171.3211.041.034.354430.1125430.34
HR7’ *58.50.082.160.191.964480.041104.08
HR6’540.040.680.060.594470.061156.78
HR5’510.050.740.070.664460.061127.58
HR4’470.030.710.060.634470.041134.76
HR3’440.060.890.081.014520.06885.94
HR2’420.091.540.141.274470.061217.09
HR1’25.10.12.380.211.934480.041235.18
HRS2’17.050.010.570.050.534480.021081.89
HRS1’170.0311.140.934.2845002600.7
* After extraction.
Table 2. SARA compositions of representative samples from sequential extraction.
SampleFraction%Sat%Aro%Resin%Asph
HR1EOM-147.725.65.820.9
EOM-342.919.46.331.4
HR3EOM-129.123.614.532.7
EOM-327.220.511.540.8
Publisher’s Note: MDPI stays neutral with regard to jurisdictional claims in published maps and institutional affiliations.

